anders sweetland - apps.dtic.mil
TRANSCRIPT
■■I" ■ ^..^■"■"l mmmm ''" ll1"'«"1 in <•**"><**" n« wm"'«mß< ■
111 -
COMPARING RANDOM WITH NON-RANDOM SAMPLING METHODS
* Anders Sweetland
The Rand Corporation, Saigon, Vietnam
SUMMARY
11though most people doing survey work would prefer to use random
methods when drawing their samples, It Is rarely practical. Instead
they use a method Involving every nth member of the population. This
study compares the two methods. It was found that as long as the
attribute being sampled Is randomly distributed among the population
the two methods give essentially the same results.
However, If the attribute Is not randomly distributed among the
population the two methods give, radically different results. In some
Instances the every nth method gives much better Inferences about the
population than do the random methods. In other Instances It gives
much worse Inferences. The reasons are discussed.
i
Any view expressed In this paper are those of the author. They should not be Interpreted as reflecting the views of The Rand Corporation or the official opinion or policy of any of Its governmental or private research sponsors. Papers are reproduced by The Rand Corporation as a courtesy to members of Its staff.
^ i n^M—MiMI <"

■P^ 7"»"'i "i ir1 ' ■•"^IHMII ii •^"• " •"■"'i' » VI «u •^■«nnip— ■*( WWIJ i
// - V -
ACKNOWLEDGMENTS
I am indebted Co Major Clay R. Smith, Jr., USA, who wrote the
computer progrflais used In the first part of this study. I am also
Indebted to Mr. Phan Phi Long w»;o wrote the computer programs used
in the second part of the study and also did all the statistical
computations.
■ ■ ■ -■ .. -r-.. ....... .-^.-^ ■-iiiimatiim-—^---'■■ ^"-^«Muj—iMrfKi.^-^.. "V ■ .,..,1,»»*»—MMt»M»^«fc—» •HBBaL
vr*m** — P !••'• m ' ' PTfi PM««<f>«.«> ^•■- . .f^w —Pun-
COMPARING RANDOM WITH NON-RANDOM SAMPLING METHODS
It is generally agreed that the ) referred method of sampling
is the random method. The reason is that the behavior of the samples
taken randomly is known (i.e. follows central limit theorem predic-
tions) .
Few people doing survey work, however, use the random method
because of prohibitive costs. The first step in random selection
requires numbering each member of the population. We once estimated
that to number the adult population of Saigon (which is often usod in
JUSPAO surveys) would take 40 man-weeks. Even the Americans would be
unwilling to foot the tab for labor.
Because of these practical considerations most people making
surveys use a sampling method that involves taking every nth member.
The purists cringe at this pointing out that each member has an equal
chance of being selected only once: at the time of the selection of
the starting point of n. How this affects the results is not known.
The essen«.•> of the argument for random sampling can be stated:
"We know what happens when you use the random method, but we don't know
what happens when you use non-randjm methods." The purpose of this
study is to find out what happens when non-random sampling methods are
used.
I SAMPLING RANDOMLY DISTRIBUTED POPULATIONS
To compare the several methods we created a Vietnamese hamlet
:,,. - -. mmm -■— ' ' ■■ ■"
— - - ■■-- ■ ■ ■ ■ ■ —
mm 'mmmm •w^-^—ww-n-i^p-fw^TW^Trwp.
consisting of 72 households strung along a river bank. (We find
this more interesting than creating a vector consisting of 72 colls.)
The hamlet consisted of 50% Catholics and 50% Buddhists assigned
randomly. In one series of tests the 36 Catholics were assigned one
per household (called the "without replacement hamlets"). The
question here is the proportion of Catholic households in the hamlet.
In another test the Catholics were assigned without the constraint of
one per household (called vhe "with replacement hamlets"). The
question here is the proportion of Catholics in the hamlet.
Constructing the hamlets in these two forms provides an analogue
to the most common types of survey data. The without replacement
hamlets represent the case where a single member of a household is
queried about his opinions or when binary choice response! are being
recorded: "Do you have children of school age?" The with replacement
hamlets is designed to represent the multiple response case: "How
many of your children arc- going to school?"
Our task was to estimate the proportions of Catholics using
several common sampling methods to determine which method was best.
In this study "best" has the specific meaning of having the greatest
accuracy when inferring the population mean. Note, carefully, that
"best" is not defined as agreeing most closely with central limit
theorem predictions. As used here "best" implies that the distribution
of the sample means has the smallest variance. The perfect sampling
BiMMMH ,,,,. i-,..„ ^ „.->„,-■, . .,-. .-J^^, ^■J,... gj| tmrnt—mimtm •~>*>~ u_... ..- - . ltlll H ai „1
I^^^^mm ^m^nwm^v mimmmmm,. —... WWW^'lltW lifl|l!.»lf--^~.--T-.w-«tiiii.li IUI»^.
- 3 -
method would be one in which every sample mean was identical to the
population mean (perfect representation with zero variance).
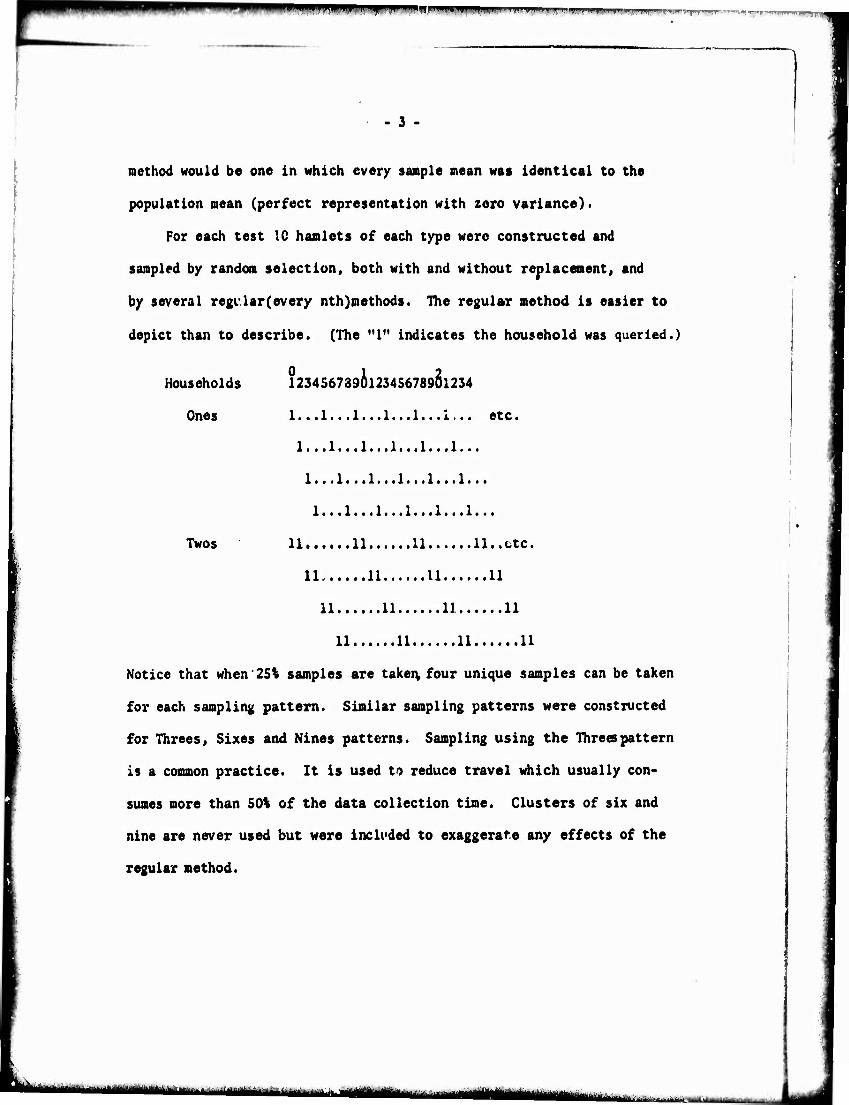
For each test 1C hamlets of each type were constructed and
sampled by random selection, both with and without replacement, and
by several regular (every nth)inethods. The regular method is easier to
depict than to describe. (The "1" indicates the household was queried.)
Households 123456739il23456789Sl234
Ones 1...1...1...1...1...1... etc.
1...1...1...1...1...1...
1...1...1...1...1...1...
1...1...1...1...1...1...
Twos 11 11 11 11.. etc.
XX.' •• • • «Xl««***tlX«**a«tXX
XX«* • ••«XX«<*»**Xi»«*••«XX
XX« •••••XX« •» «««XX««««« «XX
Notice that when 25% samples are taken four unique samples can be taken
for each sampling pattern. Similar sampling patterns were constructed
for Threes, Sixes and Nines patterns. Sampling using the Threes pattern
is a common practice. It is used to reduce travel which usually con-
sumes more than 50% of the data collection time. Clusters of six and
nine are never used but were included to exaggerate any effects of the
regular method.
i«iili«ttn MM ,—,...-^-.1.^ -.. ,.
*IIJPWI| I I in .„.UM i .inawuii -^
- 4 -
For comparison with the four regular patterns, four 25X random
samplings wore also taken. These were made both with and without
replacement.
The method of sampling allowed each hamlet to be sampled four
different times within each pattern: there arc four different Ones
patterns, four different Twos patterns, etc. These were compared
with four random samples taken with replacement and also four random
samples taken without replacement.
We called the variation among these four the "within patterns
effect." This variation allowed observing the effects of the starting
point. It was used as a base to compare the effects of several sampling
methods. Comparison between methods (i.e. ones vs twos vs random etc.)
was called the "between methods effect."
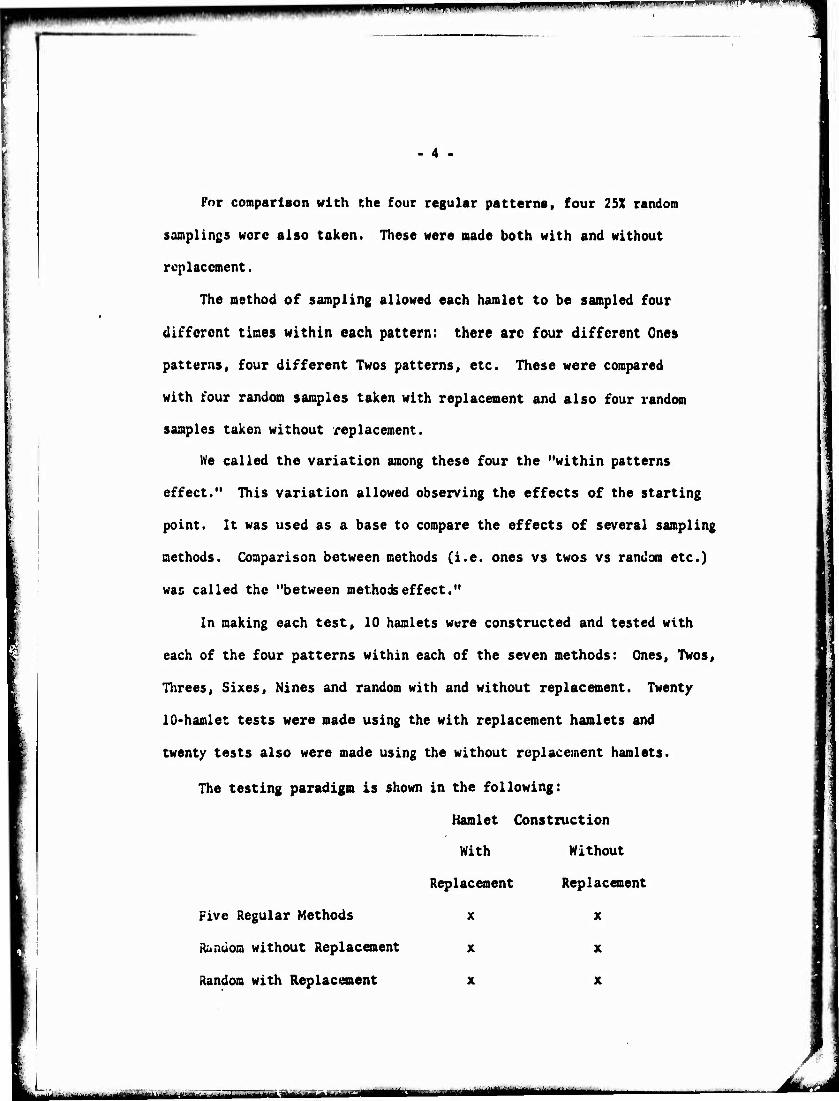
In making each test, 10 hamlets were constructed and tested with
each of the four patterns within each of the seven methods: Ones, Twos,
Threes, Sixes, Nines and random with and without replacement. Twenty
10-hamlet tests were made using the with replacement hamlets and
twenty tests also were made using the without replacement hamlets.
The testing paradigm is shown in the following:
Hamlet Construction
With Without
Replacement Replacement
Five Regular Methods x x
Random without Replacement x x
Random with Replacement x x
LL I —■^—- - i ^aiilhw ■- - gmiauiduutmtmimmmm
IC^"';.! ^'T"' WW* «
Of greatest interest was the distribution of the means of the
10 sanples in each test. As mentioned, a good method (i.e. one that
gives an accurate representation of the population mean) would show
a small spread: the sample mean by clustering closely around the
population mean. A poor method would be one showing large dispersion.
A large number of tests were made. The essence of these were:
(a) There were no within patterns differences.
(b) There were no differences between sampling by the
regular methods and the random without replacement method.
(c) Sampling with replacement had a slight, inconsistent
effect (discussed later).
(d) Hamlet construction (i.e. with and without replacement)
had a definite effect on the kurtoses of the distributions of the
sample means.
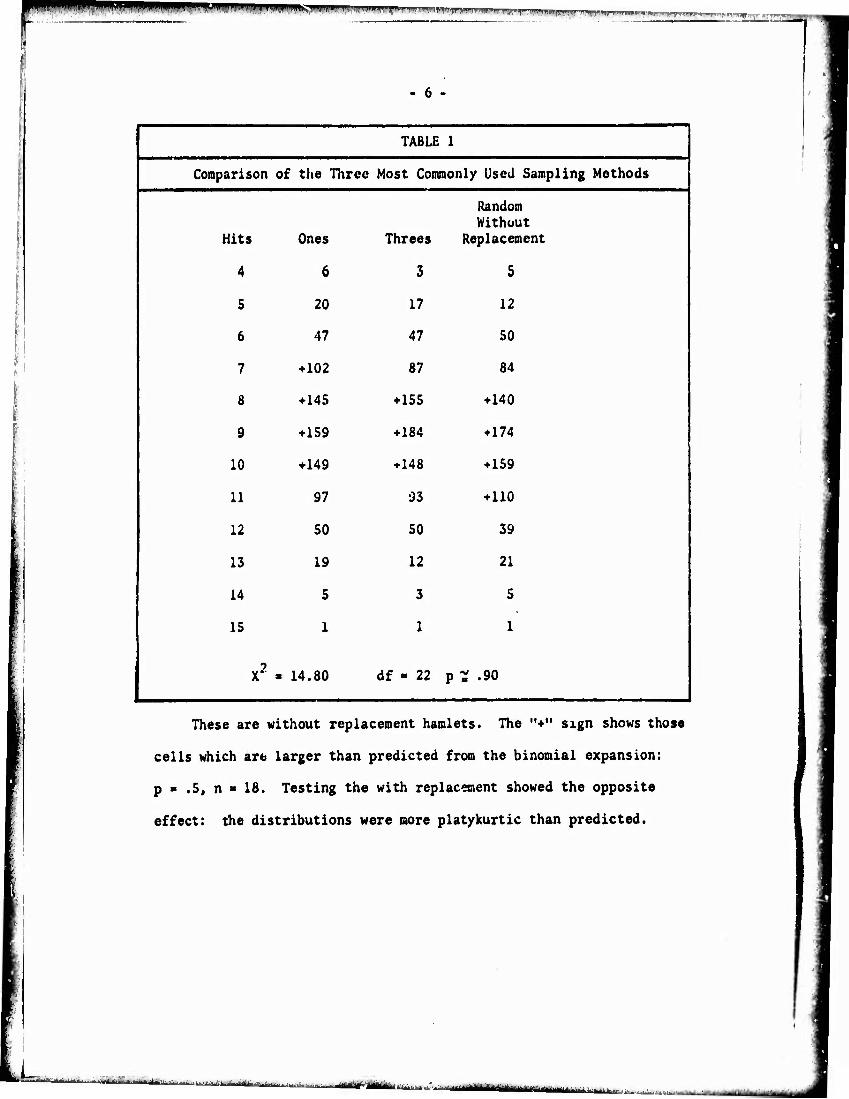
The results of one of these tests (typical of all the tests)
are shown in Table 1.
For simplicity, the concept of "hits" is used in the following
discussion. A hit is recorded every time the sampling pattern locates
a Catholic. The use of .tits is possible since the sample size was
constant; n ■ 18. Dividing the number of hits by 18 converts the
data to conventional proportions. In a later section, the method of
sampling produced a variable sample size. In this case it was
necessary to convert :o proportions to make the desired comparisons.
--.. .....■■, ,
'' "<' "^*l'i.'»*K mm*} M lßmn>,:tl i ^i "«■^-iwfwryr. 11, m , ^ , v-wmwrn, ■*<**** "''''"'"^nüi' —^
TABLE 1 |
Comparison of the Throe Most Commonly Used Sampling Methods
Random Without
Hits Ones Threes Replacement
4 6 3 5
1 5 20 17 12
i 6 47 47 50
7 ♦ 102 87 84
8 ♦145 ♦ 155 ♦140
9 ♦ 159 ♦184 ♦ 174
10 ♦149 ♦ 148 ♦ 159
\ 11 97 93 ♦ 110
12 50 50 39
13 19 12 21
| 14 5 3 5
15 1 1 1
X2 - 14.80 df - 22 p ^ .90
These are without replacement hamlets. The "♦" sign shows those
cells which are larger than predicted from the binomial expansion:
p B .5, n ■ 18. Testing the with replacement showed the opposite
effect: the distributions were more platykurtic than predicted.
L ....mi. tii,rft i , -, — ■- -'r-iuMMai Hin ii -—-^-
Hpili» ■ »mm\mn ,.^,■.1..,.. ■ iiiiTii ntmt'mwmr .^f ■ nyTtummpi» ivn*
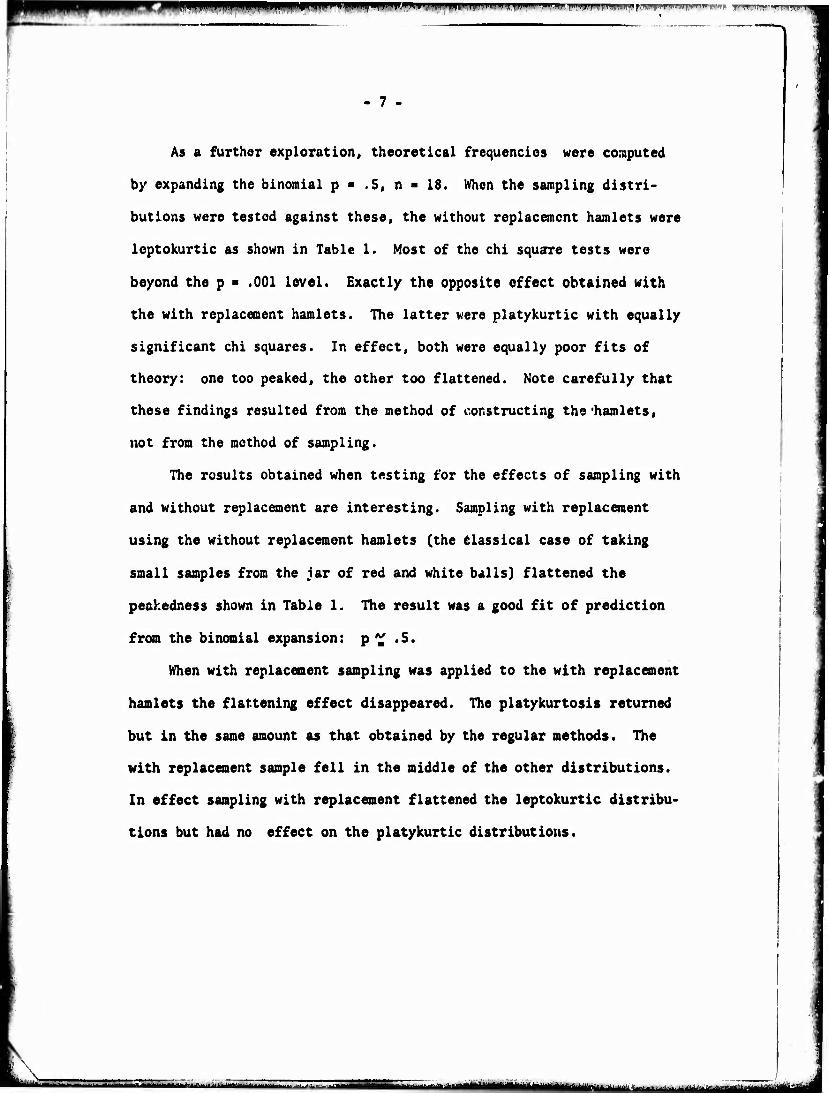
As a further exploration, theoretical frequencies were computed
by expanding the binomial p ■ .5, n ■ 18. When the sampling distri-
butions were tested against these, the without replacement hamlets were
leptokurtic as shown in Table 1. Most of the chi square tests were
beyond the p ■ .001 level. Exactly the opposite effect obtained with
the with replacement hamlets. The latter were platykurtic with equally
significant chi squares. In effect, both were equally poor fits of
theory: one too peaked, the other too flattened. Note carefully that
these findings resulted from the method of constructing the'hamlets,
not from the method of sampling.
The rosults obtained when testing for the effects of sampling with
and without replacement are interesting. Sampling with replacement
using the without replacement hamlets (the Classical case of taking
small samples from the iar of red and white balls) flattened the
peahedness shown in Table 1. The result was a good fit of prediction
from the binomial expansion: p " «5.
When with replacement sampling was applied to the with replacement
hamlets the flattening effect disappeared. The platykurtosis returned
but in the same amount as that obtained by the regular methods. The
with replacement sample fell in the middle of the other distributions.
In effect sampling with replacement flattened the leptokurtic distribu-
tions but had no effect on the platykurtic distributions.
Jk. ss u^..^^^^^,,^^ .._.,.■, .^^^^U
I
- 8
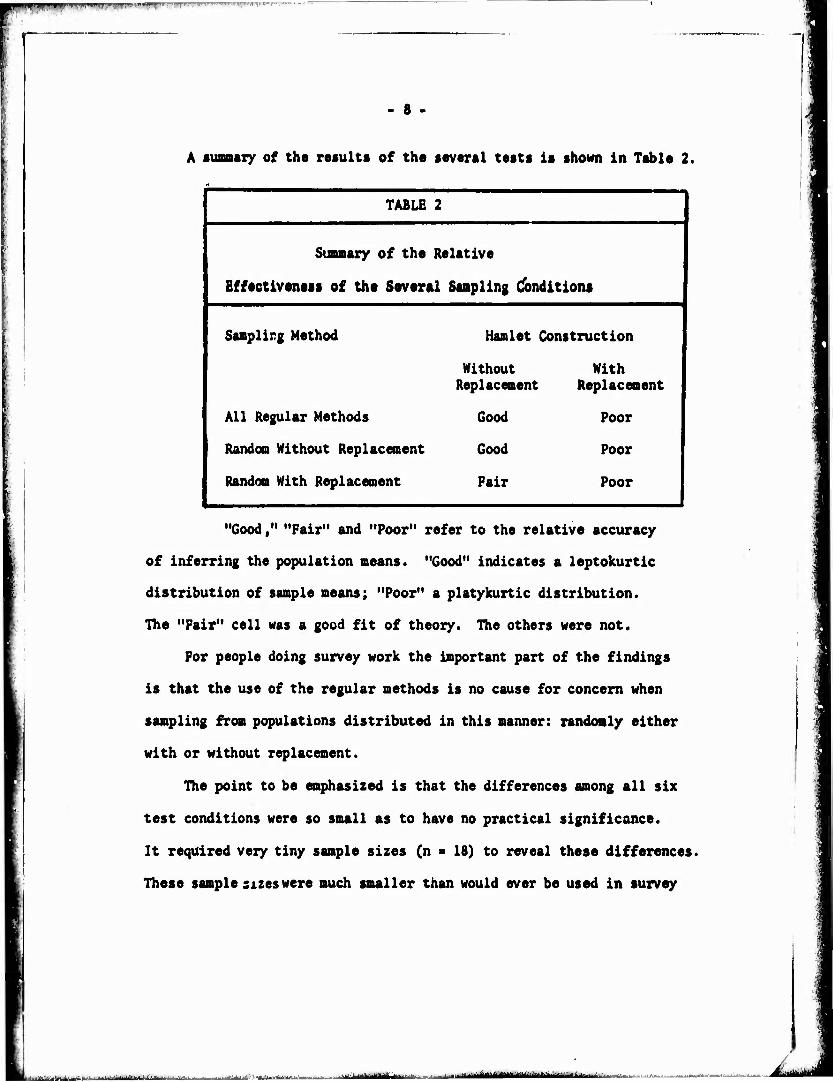
A suamaxy of the results of the several tests is shown in Table 2.
1 TABLE 2
Summary of the Relative
Effectiveness of the Several Sampling Conditions
Samplirg Method Hamlet Construction
Without Replacement
With Replacement
All Regular Methods Good Poor
Random Without Replacement Good Poor
Random With Replacement Pair Poor
"Good," "Fair" and "Poor" refer to the relative accuracy
of inferring the population means. "Good" indicates a leptokurtic
distribution of sample means; "Poor" a platykurtic distribution.
The "Fair" cell was a good fit of theory. The others were not.
For people doing survey work the important part of the findings
is that the use of the regular methods is no cause for concern when
sampling from populations distributed in this manner: randomly either
with or without replacement.
The point to be emphasized is that the differences among all six
test conditions were so small as to have no practical significance.
It required very tiny sample sizes (n ■ 18) to reveal these differences.
These sample sxzes were much smaller than would ever be used in survey
.. .-^ .. . ,^.-!.~.ilrt -.-.—>.'■ immralmi'iiii i i - ' »■■■««inlai ■ I - ■-"-■'— -- -■
work. When these samples were combined to give samples of 200 or
greater (i.e. typical sample sizes used in survey work) all methods
had excellent accuracy. As an example: in one case 24 means were
computed (each n ■ 200). All of these means fell within the range
8.81 - 9.30. This is a range of error of approximately plus and minus
1%. There are few situations where one cannot live with this small
error estimation. The obvious conclusion is the person doing survey
work should use that method which is most convenient.
II SAMPLING NrN-RANDOMLY DISTRIBUTED POPULATIONS
In the previous section the Catnolics were randomly distributed
among the households in the hamlets. In real life random distribution
like this seldom happens. The poor live in the ghettos, the rich in
the suburbs. Blacks live with blacks and Italians with Italians.
Likes attract likes. Muhammad Ali (Cassius Clay) says it best:
"Bluebirds like to be together. Eagles hang out with eagles, sparrows
stick with sparrows, buzzards go with buzzards..."
In this case the blassic jar of red and white balls is constructed'
differently: "First put in a handful of red balls, then two handfuls
of white balls, etc."
To approximate this "togetherness of likes" our hamlet of 72
households was reconstructed so all the Catholics were located in a
string of adjacent households:
CCCCCCCC
^uitLM ■■■--•-"■■-" Jt-;j-'' :.^.A. ■..—-i--iJi. *..J.tÄjL*,..^jL.^j.j-. ,- . —-"illiUfrM,- ..■ ^.... .■-..^n ii1- r ii I in' 'ijj-iiriitfiaiüi
"''""«w! <*>, »^n, T.^P K/M^ni^M^p^wiri«"!!* PI «it
- 10 -
The string of Catholics was called a sample string. Its length
was varied fron snail (n • 2, p - .03) to large (n ■ 36, p ■ .5).
The starting points of the sample strings were determined randomly.
The same sampling patterns were used.
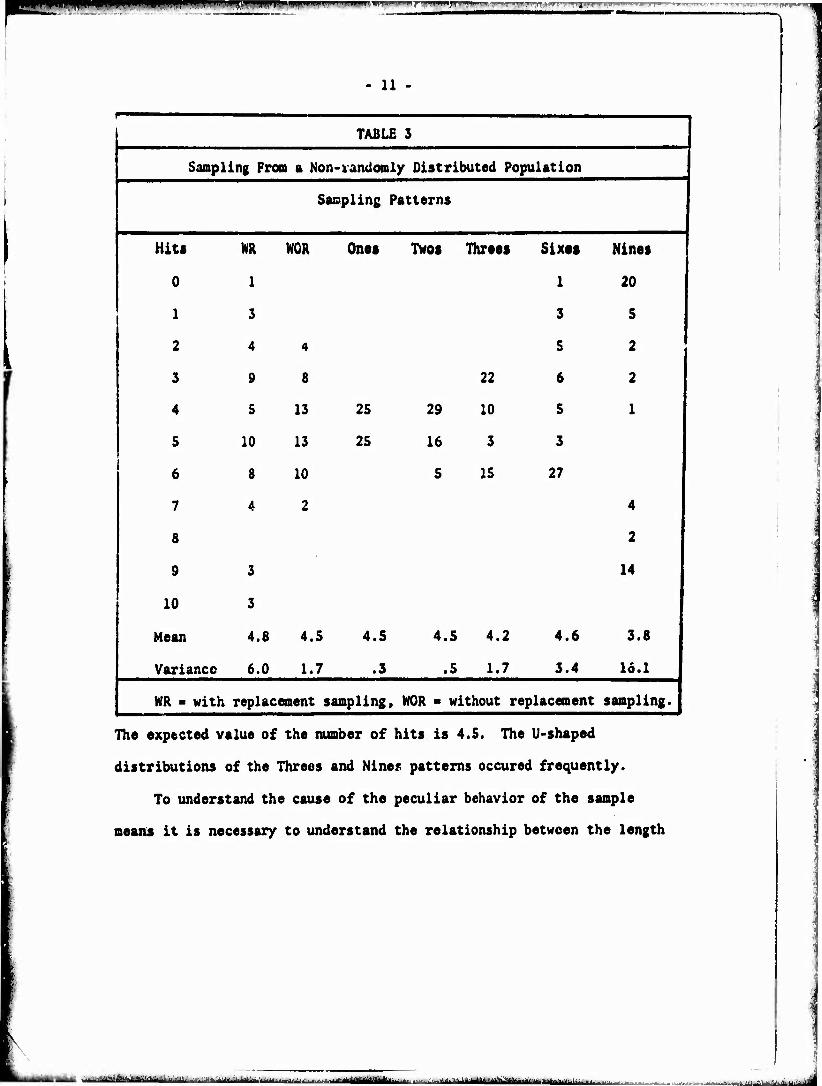
Under these conditions some very peculiar things resulted. The
results obtained using a sample string of 18 (p ■ .25) are shown In
Table 3. This particular test is shown because it contains most of
the different types of distributions that resulted. Some of the other
tests showed even more erratic behavior.
taOMaiMifoimm |.,t ^ .>^i...-u ...„-■..„■ .f,.,.-..i-...,/. nmnfium n,.:.'^.'-,, /
. -.-^.L-U:- ■ . ..i. /u*.,*. jt,^^^
!«"•« ""■"■■'"■""'■' ,y^r^-^. J T
11
| TABLE 3 1
i Sampling Fron a Non- randomly Distributed Population
1 Sampling Patterns 1
1 Hit> NR WOR Ones Twos Threes Sixts Nines 1
1 0 1 20
1 1 3 5 i
1 2 4 S 2
1 3 8 22 6 2
4 13 25 29 10 5 1
5 10 13 25 16 3 3
| 6 10 5 IS 27
j 7 2 4 |
| 8 2
9 14
| io
Mean 4.8 4.5 4.5 4.5 4.2 4.6 3.8
I Variance 6.0 1.7 .3 .5 1.7 3.4 16.1 |
1 NR ' with replacement sampling. NOR • without replacement sampling. |
The expected value of the number of hits is 4.5. The U-shaped
distributions of the Threes and Nine.« patterns occured frequently.
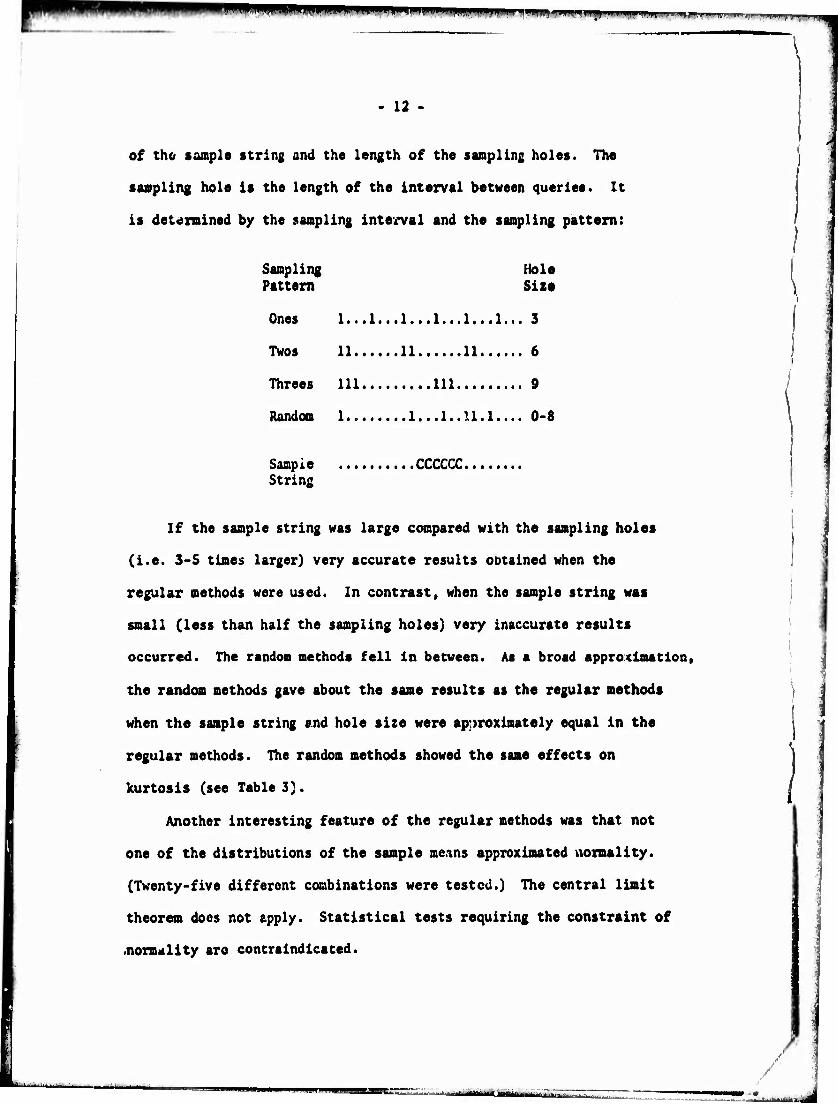
To understand the cause of the peculiar behavior of the sample
means it is necessary to understand the relationship between the length
^■-..Vi^^.^. *- - ■ --i i H niMiaiai—I - ■ -■ ■ _ * —■'- "—^ i -•J
HU- .___ ■ -_.,«—r—™,^, .„^ „,^1,^ —-- _ •
- 12 -
of the »ample string and the length of the sampling holes. The
sampling hole is the length of the interval between queries. It
is determined by the sampling interval and the sampling pattern:
Sampling Hole Pattern Size
Ones 1...1...1...1...1...1... 3
Twos 11 11 11...... 6
Threes 111 Ill 9
Random 1.. 1.. .1..U.1.... 0-8
Sample CCCCCC String
If the sample string was large compared with the sampling holes
(i.e. 3-5 times larger) very accurate results obtained when the
regular methods were used. In contrast, when the sample string was
small (less than half the sampling holes) very inaccurate results
occurred. The random methods fell In between. As a broad approximation,
the random methods gave about the same results as the regular methods
when the sample string and hole size were approximately equal In the
regular methods. The random methods showed the same effects on
kurtosis (see Table 3).
Another interesting feature of the regular methods was that not
one of the distributions of the sample means approximated normality.
(Twenty-five different combinations were tested.) The central limit
theorem does not apply. Statistical tests requiring the constraint of
.norsulity are contralndlcated.
Wßm*' »M«l|l IKI I in ■•! ■!■ um ...-|.jW.l».,p...|«WM..ll..- ..i-i.^f. „„mWmw,„i
- 13 -
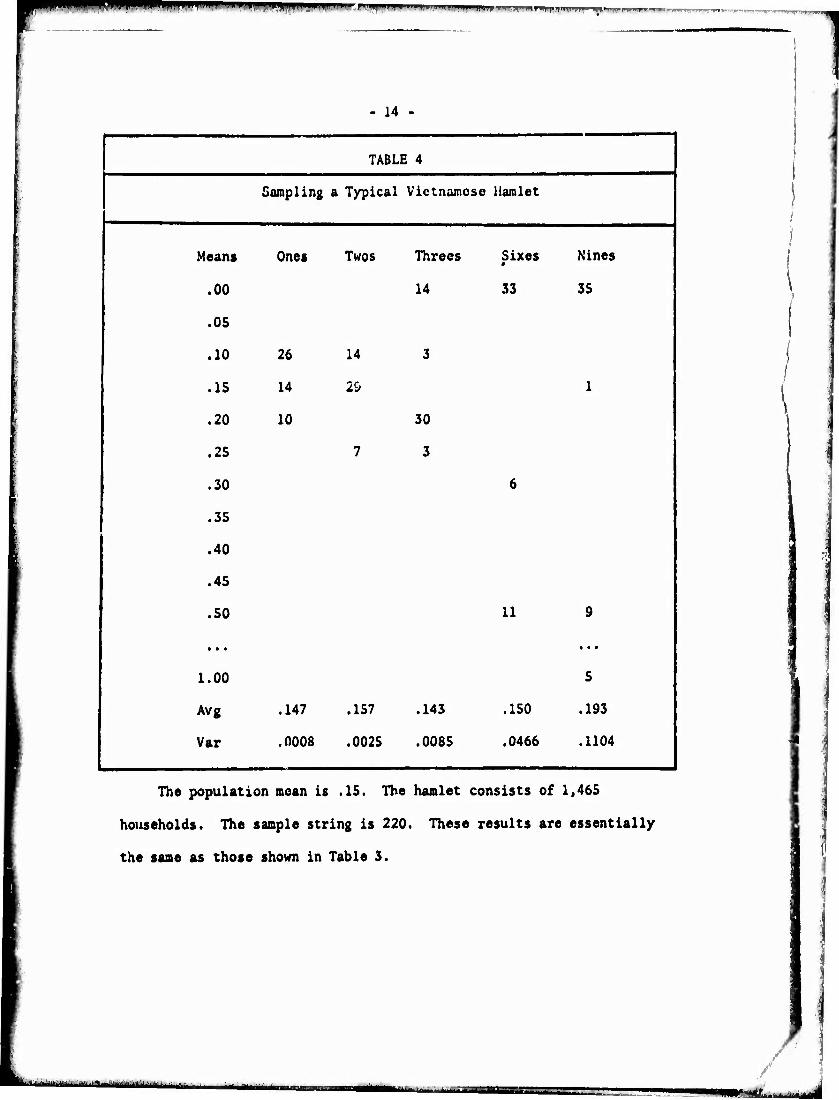
The fim 1 series of tests was essentially the same except ve
tried to create more realistic saaples. The illustration has a hanlet
size of n ■ 1,465 which is typical in Viet Nan. (This is also a reason-
able approximation of the number of households in a Vietnamese village.)
Every 100th asmber was queried. The string size was varied with the
constraint that it was never an exact multiple of hamlet size or sampling
interval. When exact multiples are used the results are often unrealisti-
cally perfect (i.e. tero variance of the sample means).
...■^^.^^ ^. ...-...„_ ^.. ....... .
*m wmv mm ■I'm) Wmm "'Vinm.t ,«i miavp^inn mi _ Hpmigipnagnfaam
14
1 TABLE 4
Sampling a Typical Vietnamese Hamlet
Means Ones Twos Threes Sixes Nines
\ .00 14 33 35 \
.OS
! 'io 26 14 3
.15 14 2& 1 |
.20 10 30
I •25 7 3
.30 6
.35
1 .40
.45
.50 11 9 |
1 • • • • • • f
I 1.00 5 |
Avg .147 .157 .143 .150 .193
Var .0008 .0025 .0085 .0466 .1104
The population mean is .15. The hamlet consists of 1,465
households. The sample string is 220. These results are essentially
the same as those shown in Table 3.
•'■--■■ '■■- ■■ «-•^--
»^ --^■^
IIPWU.. I - |nm|.ui.l I »,I]I1IJ II II U I I- 111 II.«mi lnllll"l!IMllp>""l-'PHMW Jl,':» '»'IW»!!»'*-»!1" --" impwi»«
- 15
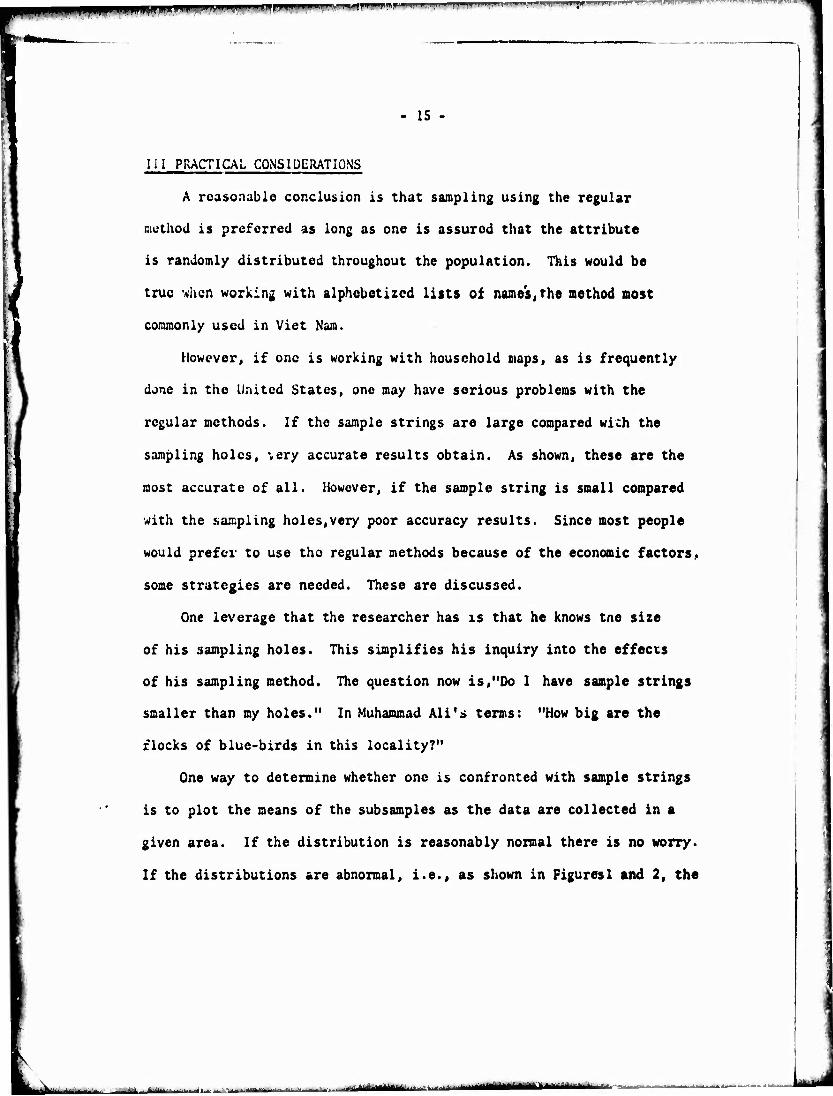
III PRACTICAL CONSIDERATIONS
A reasonable conclusion is that sampling using the regular
method is preferred as long as one is assured that the attribute
is randomly distributed throughout the population. This would be
true when working with alphebetized lists of name's, the method most
commonly used in Viet Nam.
However, if one is working with household maps, as is frequently
done in the United States, one may have serious problems with the
regular methods. If the sample strings are large compared with the
sampling holes, very accurate results obtain. As shown, these are the
most accurate of all. However, if the sample string is small compared
with the sampling holes,very poor accuracy results. Since most people
would prefer to use the regular methods because of the economic factors,
some strategies are needed. These are discussed.
One leverage that the researcher has is that he knows tne size
of his sampling holes. This simplifies his inquiry into the effects
of his sampling method. The question now is,"Do I have sample strings
smaller than my holes." In Muhammad All's terms: "How big are the
flocks of blue-birds in this locality?"
One way to determine whether one is confronted with sample strings
is to plot the means of the subsamples as the data are collected in a
given area. If the distribution is reasonably normal there is no worry.
If the distributions are abnormal, i.e., as shown in Figuresl and 2, the
a.ttalä*-*- i itm - mtmmm**<\u M-«».-^.
■ : :, ■- ■." '" ■' ■■■Uli» ^
- 16 -
researcher is alerted to the fact that he is dealing with sample
strings and can make the necessary steps to correct the prob lens these
introduce. The researcher must either increase the size of his n for
this limited set of variables or. more likely, interpret these data
with caution.
The previous suggestion was made on the basis of no a priori
information. Sometimes a limited amount of information is available.
Using the previous Catholic and Buddhist example: the hamlet chief
will often be able to give an estimate of the number of Catholics which
can be converted to a percentage such an 5-15%. The question to be
answered is, "Are they clustered?*' The easiest way to answer this
question is to wait until the first Catholic is discovered. When
this happen» ask about the religion of the other households in the
neighborhood. If they are pieaofiinantly Catholic you can be fairly
sure that you are dealing with a sample string.
In Viet Nam two sources are most frequently used to establish
samples; (a) lists of names which are usually census list* and (b) maps
showing the locations of the households in the hamlets. If the
census lists are alphebetized (usually the case) the variable is
randomly distributed for all practical purposes. In this case select-
ing every nth name is simplest and cheapest.
— ■■in ii im,*****-, . ... ^w H(r ii im i ■ i nftnn^- I

piww^^i« mjf lflWP»"W> li Iliaii.WW! f]l Hiinmimnni.i umuiu.Tii urn, „m.i I.HII,!-,,^.
- 17 -
If maps arc used the odds are that there will be sample strings:
S'.nall business will be clustered in the center of the hamlet (especially
at the crossroads), farmers will be located next to their fields and
the ocniprescnt refugees will be clustered together in'clots around the
periphery.
If the researcher is very concerned about the accuracy of his
estimates of the population parameters he can make estimates of the
lower and upper bounds of the length of his strings and test in the
manner shown. Appendix B details the method. The only requirement
is a table of random numbers-
Finally, the cannon practice of estimating the sample size
required to get the maximum tolerable error and then auding half-
again to that sample size is good practice. Better yet: double the
sample size, if possible.
» \
\ '"■-'- ^ ii In
HW^lp^p^i^^P»^»w^».iMiii i im^im^FifiiJiu »ui i m»'.'.^nnipiii III.IH.IHIPI ..t...|..i.. ■■»,.■■
- 18 -
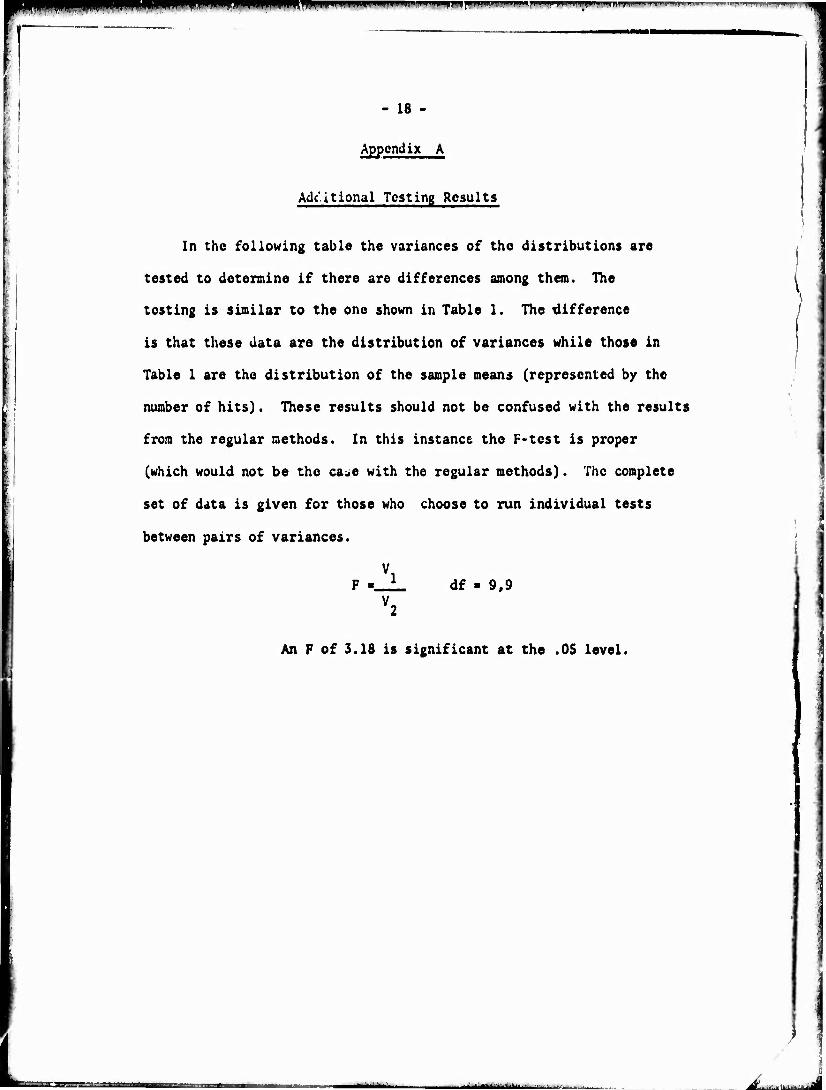
Appendix A
Adcitional Testing Results
In the following table the variances of the distributions are
tested to determine if there are differences among them. The
testing is similar to the one shown in Table 1. The difference
is that these data are the distribution of variances while those In
Table 1 are the distribution of the sample means (represented by the
number of hits). These results should not be confused with the results
from the regular methods. In this instance the F-tcst is proper
(which would not be the ca^e with the regular methods). The complete
set of data is given for those who choose to run individual tests
between pairs of variances.
V. i_ df - 9,9
An P of 3.18 is significant at the .05 level.
' ' ''' >'
1
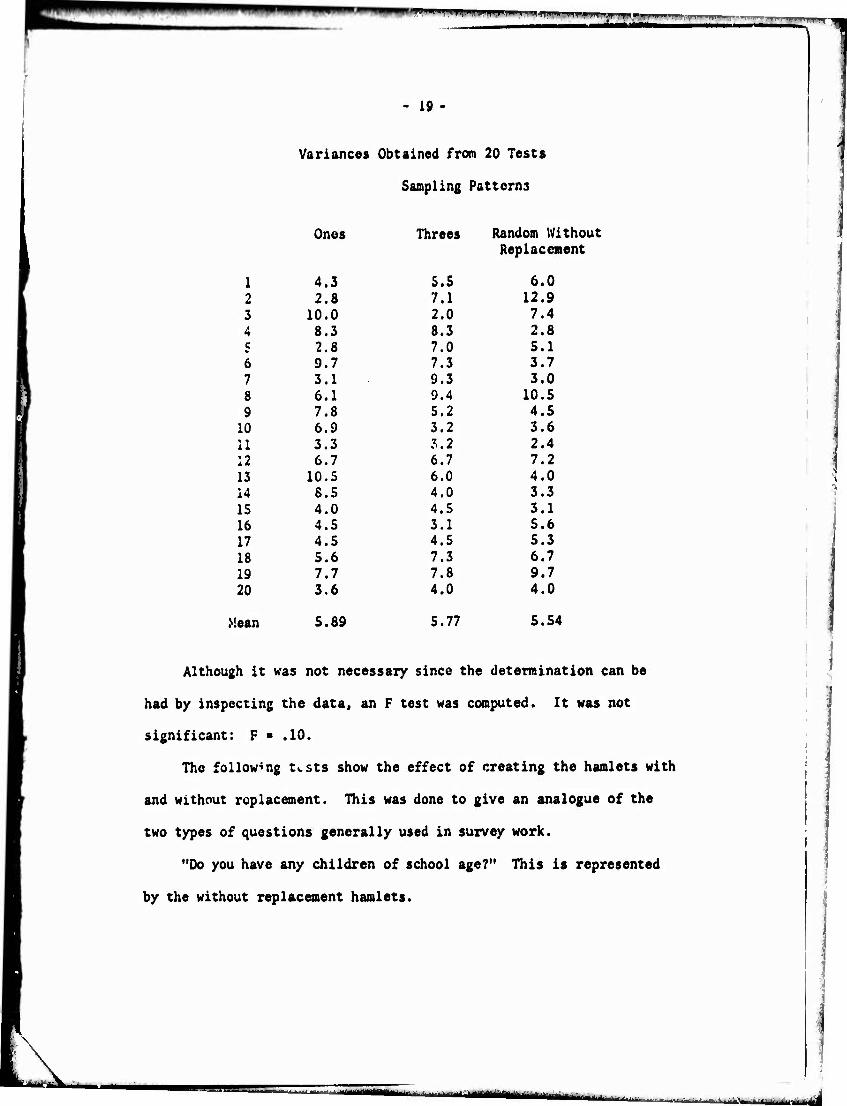
- 19 -
Variances Obtained from 20 Tests
Sampling Patterns J
Ones Threes Random Without Replacement
1 4.3 5.5 6.0 2 2.8 7.1 12.9 3 10.0 2.0 7.4 4 8.3 8.3 2.8 5 2.8 7.0 5.1 6 9.7 7.3 3.7 7 3.1 9.3 3.0 8 6.1 9.4 10.5
9 7.8 5.2 4.5 10 6.9 3.2 3.6 11 3.3 3.2 2.4 12 6.7 6.7 7.2 13 10.5 6.0 4.0 14 8.5 4.0 3.3 15 4.0 4.5 3.1 16 4.5 3.1 5.6 17 4.5 4.5 5.3 18 5.6 7.3 6.7 19 7.7 7.8 9.7 20 3.6 4.0 4.0
Mean 5.89 5.77 S.54
Although it was not necessary since the determination can be
had by inspecting the data, an F test was computed. It was not
significant: F * .10.
The following tests show the effect of creating the hamlets with
and without replacement. This was done to give an analogue of the
two types of questions generally used in survey work.
"Do you have any children of school age?" This is represented
by the without replacement hamlets.
- ■ ■ Mil I I i fc ■ninj^üMB
mm wi* l.M.nil.^yii^WTIl.i. ■"■'» ■" i ■■■»M^pir1—^„^■P.w .^ m.i ,1,11,11
1 ' —. , _.— ., ,.. ■iiBiMiii»>fniim
- 20 -
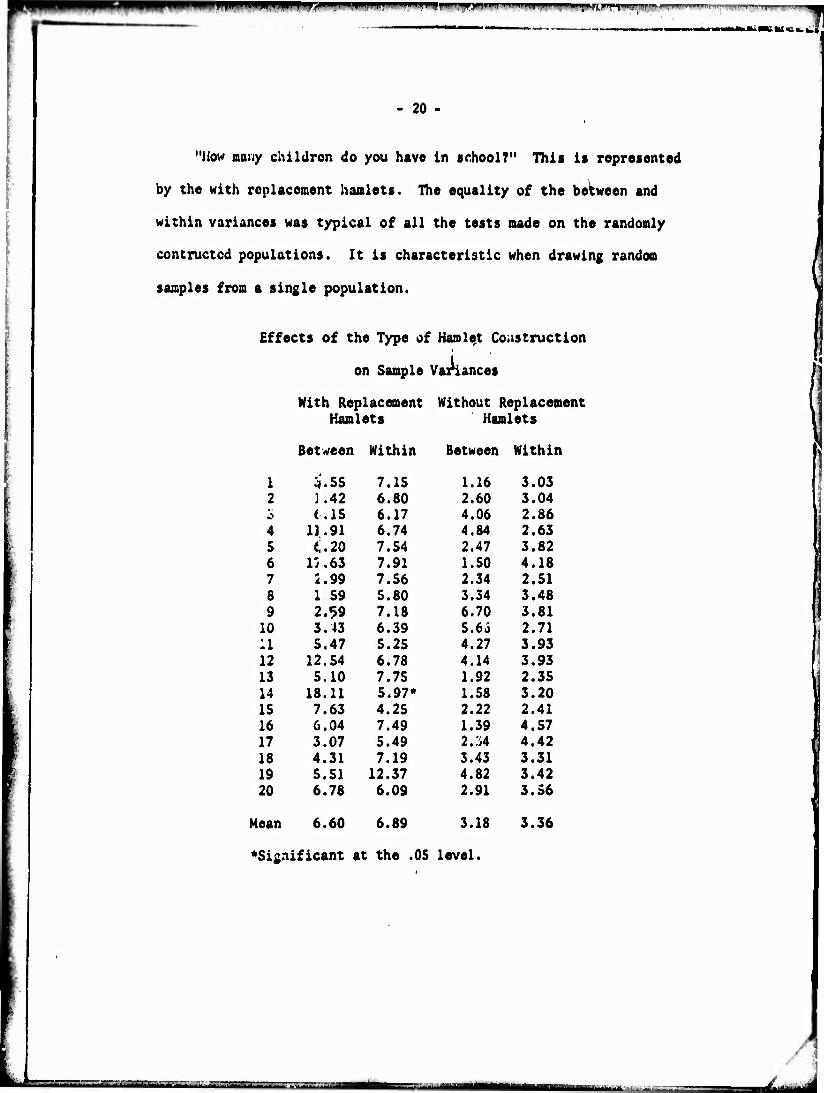
"liow many children do you have in «rhool?" This is represented
by the with replacement hamlets. The equality of the between and
within variances was typical of all the tests made on the randomly
concructcd populations. It is characteristic when drawing random
samples from a single population.
Effects of the Type of Hamlet Coastruction
on Sample Variances
With Replacement Without Replacement Hamlets Hamlets
Between Within Between Within
1 3.55 7.15 1.16 3.03 2 :.42 6.80 2.60 3.04 i (.15 6.17 4.06 2.86 4 11.91 6.74 4.84 2.63 5 i.20 7.54 2.47 3.82 6 17.63 7.91 1.50 4.18 7 2.99 7.56 2.34 2.51 8 1 59 5.80 3.34 3.48 9 2.«>9 7.18 6.70 3.81 10 3.43 6.39 5.6i 2.71 11 5.47 5.25 4.27 3.93 12 12.54 6.78 4.14 3.93 13 5.10 7.75 1.92 2.35 14 18.11 5.97* 1.58 3.20 15 7.63 4.25 2.22 2.41 16 6.04 7.49 1.39 4.57 17 3.07 5.49 2.^4 4.42 18 4.31 7.19 3.43 3.31 19 5.51 12.37 4.82 3.42 20 6.78 6.09 2.91 3.56
Mean 6.60 6.89 3.18
^Significant at the .05 level.
3.36
4s MM
'~ ■"■ L ■ ' ' , ,
- 21 -
Appendix B
Tcclmiduos for Testing the Effects of Sampling Methods
The techniques for sampling by the several methods are simple.
They make excellent student projects. The method of testing the
case of sample strings is given first.
First determine the population size, the string length and the
sampling method. For the example the population was set at 1,000
determined by the numbers 000-999. The string length was set at 50
(true proportion ■ .05). The Threes pattern is used.
Next determine the fraction of th*> population to be sampled.
In this case the decision was 1%. this decision results in sampling
every 100th member. If we used the Ones method we would query one
member in each segment of 100. I* we used the Twos method we would
select two adjacent menbors in each segr.ent of 200. We have selected
the Threes pattern, therefore we will sample three consecutive
members in each segment of 300.
We must select the starting points of the queries and the strings
so both fall within the bounds of 00C-999. Both of these starting
points are randomly determined. The starting point of the queries
cannot be l;;*ger than 297 since we are sampling segments of 300. We
can use the sampling triplet 297,298 and 299 since this is within the
bounds of the first segment 000-299. Notice that the second segment
is 300-599, :he third 600-899 and the last 900-999.
Similarly the hi^est starting point of the sample string of 50
is 849: 849 ♦ Su ■ 955 which is the upper oounU of the population.
MHlAMäMiMMlMHMaBMifiaiMMiieiKM«ZlMSBBBMMä*aMSBHHrHä iiirrti™'""**»-" -*"■ •
- 22 -
Tho tabulations aro shown on tho following page. Wo first
located the sample r.tring by drawing a random number between 000-849
(inclusive). Tiic first number was 189. Adding 50 we get 239. The
sample string is now defined: 189-239.
Wo next Jotormine the location of the tripletf. By drawing a .
random number between 000-297 (inclusive). The number is 004. We
will sample locations 004-006, 304-306, 604-606 and 904-906. This
is four sets of three numbers: n ■ 12. Since none of these fall
inside the sample string of 189-239 we record 0 hits. The process
is iterated.
,. ......,. *...*.. .'.-...„.i. _..... ...^,,,„„,„1,^-^ ^.M,...^^.>---Il ^jmoKjUgggjIfr, Jliu lt i^imnnnimrt! ug^jm^p^
\
- 23 -
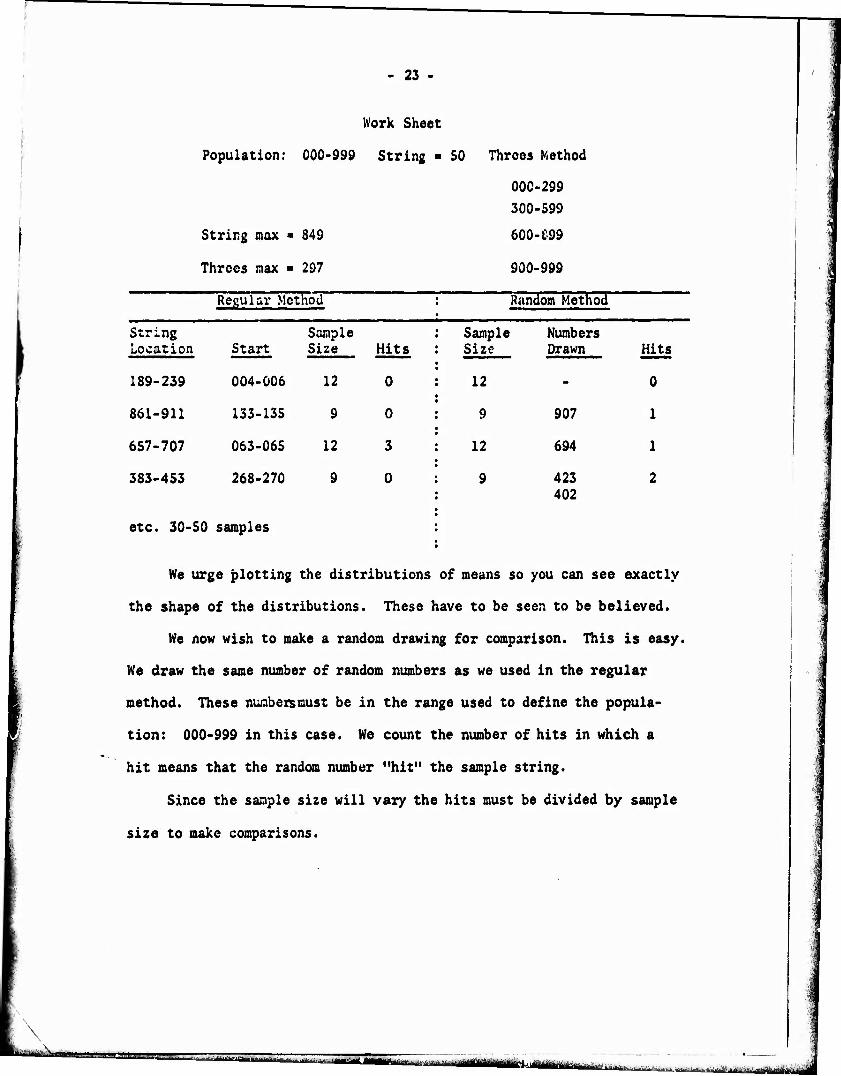
Work Sheet
Population: 000-999 String > 50 Throes Method
000-299
300-599
600-699 String max ■ 849
Threes max ■ 297 900-999
Regular Method Random Method
String Location Start
Sample Size Hits
Sampl« Size
3 Numbers Drawn Hits
189-239 004-006 12 0 12 ■• 0
861-911 133-135 9 0 9 907 1
657-707 063-065 12 3 12 694 1
383-453 268-270 9 0 9 423 402
2
etc. 30-50 samples
We urge plotting the distributions of means so you can see exactly
the shape of the distributions. These have to be seen to be believed.
We now wish to make a random drawing for comparison. This is easy.
We draw the same number of random numbers as we used in the regular
method. These numbezsmust be in the range used to define the popula-
tion: 000-999 in this case. We count the number of hits in which a
hit means that the random number "hit" the sample string.
Since the sample size will vary the hits must be divided by sample
size to make comparisons.
— ■■■ «lr---if-ili i 1 ■■-.'(.i m JMBMMlUiMÜi •-itt.-niii«!. \,iU'>-'~''-'~:*i iMäiUitMIktiäiMiäiM
»"I1 ,,. IWI.^**«"1^»!! IM|I|^W"W|IIIPPI iriiyWMI'«FH^<lHi ■ ".'•»-rT—IT^TM"!!^
- 24 -
The easiest, way to design populations of randomly distributed
variables is to use IM cards. The bottom edge has the columns
numbered 1-80 equally spaced. Columns of single spaced typed numbers
can also bo used. To create the hamlets as used in this study first
determine the proportion of Catholics. Assume this to be 25*. Using
a table of random numbers and a felt pen select and mark 20 of the
80 columns.
The sampling patterns are created in the same way. If you are
sampling with replacement record "1," "2," "3," etc, to sho.w how
many tiroes the same random number was drawn. The regular methods
are constructed as shown in the illustration.
We also used a computer to generate the hamlets and the sample
decks punching out the "9" holes. The pairs of cards (1 hamlet and 1
sample) are held up to the light to count the number cf hits. These
are used for student projects: it eases their problem of getting the
data.