andrea ciani, francesca bartoli - uni- · pdf fileexport quality upgrading under credit...
TRANSCRIPT
No 191
Export Quality Upgrading Under Credit Constraints Andrea Ciani, Francesca Bartoli
July 2015

IMPRINT DICE DISCUSSION PAPER Published by düsseldorf university press (dup) on behalf of Heinrich‐Heine‐Universität Düsseldorf, Faculty of Economics, Düsseldorf Institute for Competition Economics (DICE), Universitätsstraße 1, 40225 Düsseldorf, Germany www.dice.hhu.de
Editor: Prof. Dr. Hans‐Theo Normann Düsseldorf Institute for Competition Economics (DICE) Phone: +49(0) 211‐81‐15125, e‐mail: [email protected] DICE DISCUSSION PAPER All rights reserved. Düsseldorf, Germany, 2015 ISSN 2190‐9938 (online) – ISBN 978‐3‐86304‐190‐8 The working papers published in the Series constitute work in progress circulated to stimulate discussion and critical comments. Views expressed represent exclusively the authors’ own opinions and do not necessarily reflect those of the editor.
Export Quality Upgrading Under Credit Constraints
Andrea Ciani� Francesca Bartoliy
July 2015
Abstract
This paper studies whether credit constraints a¤ect the decision of small and medium size enterprises
(SMEs) to upgrade the quality of their exported output with respect to the one sold domestically. We
use a detailed �rm-level data-set on Italian SMEs reporting information on output characteristics,
credit rationing and international activities. Employing �rm credit scores used by banks for their
lending decisions, we assess how credit constraints a¤ect export quality upgrading. First, we �nd
that exporting �rms are less likely to upgrade output quality, when their credit score worsens. A one
standard deviation worsening in the credit score lowers the probability of quality upgrading by more
than 35 percent. Second, �rms exporting to distant markets cut quality upgrading more sharply when
their score worsens. The negative impact of credit constraints is con�rmed when taking into account
�rm heterogeneity in size and other relevant �rm attributes. The main result is robust to endogeneity
considerations of the credit score. Overall, our �ndings suggest that, by impacting export quality
upgrading, credit constraints may a¤ect the intensive margin of trade.
JEL codes: F10, F14, L15, G20, G32.
Keywords: Credit Constraints, Product Quality, Distance, International Trade.
�Department of Economics, Università L. Bocconi, Via G. Roentgen 1, 20136, Milano, Italy.Email: [email protected]
yEmail: [email protected]. Research presented in this paper was carried out while Bartoli was part of the UniCreditResearch Unit in Bologna, Italy. We thank Carlo Altomonte, Italo Colantone, Paolo Epifani, Nicola Gennaioli, Amit Khan-delwal, Florian Mayneris, Julien Martin, Tommaso Nannicini, Gianmarco Ottaviano, Nicolas Serrano-Velarde and seminarparticipants at Università Bocconi, Universitat Autònoma de Barcelona, Beijing Normal University, DICE Universität Düs-seldorf, ISET, ETSG-2013, ITSG-2013, GTDW, RIEF-2014, SAEe Simposio 2014, RES PhD Meetings 2015 for their helpfulcomments. Ciani gratefully acknowledges Cariplo Foundation and Università L. Bocconi for funding. All errors are ours.The other, usual, disclaimers apply.
1
1 Introduction
The negative impact of credit constraints on export has been assessed both theoretically and empirically
(Chaney, 2005; Amiti and Weinstein, 2009; Minetti and Zhu, 2011; Manova, 2013; Muûls, 2015). In
fact, exporting �rms require external �nance to face additional up-front costs associated with setting a
distribution network in the destination market, product customization and advertising (Sutton, 2001;
2007). The literature reports, as well, that exporters produce higher quality goods and sell at higher
prices than non-exporters (Hallak and Sivadasan, 2011).
The investment associated with quality upgrading (Verhoogen, 2008; Amiti and Khandelwal, 2013;
Fieler et al., 2014) and technology upgrading (Bustos, 2011) is then a critical component of export up-front
costs. By upgrading output quality, producers can increase revenues from exporting and reach distant
markets (Hummels and Skiba, 2004; Martin, 2012; Mayneris and Martin, 2013).1 Therefore, �nancial
constraints may strongly a¤ect international trade by hampering quality upgrading at the �rm level. Yet,
to date, there is limited empirical evidence on the impact of credit constraints on output quality (Fan
et al., 2015; Crinò and Ogliari, 2015). Our aim is to study the impact of credit constraints on product
quality upgrading by Small and Medium Enterprises (SMEs).
In 2014, SMEs represented the 80% of European exporting �rms.2 Given their characteristics, SMEs
have bank credit as a main source of external �nance, therefore, when the credit market is less liquid,
SMEs may be severely a¤ected. Evidence con�rms that credit sources tend to dry up more rapidly for
small �rms than for large companies during economic downturns (ECB; 2013). As a consequence, the
support to small and medium-sized enterprises (SMEs) is currently considered a main target for policies
aimed to improving the performance of EU manufacturing �rms.3
This paper seeks to assess the impact of �nancing constraints on output quality upgrading using a
�rm-level, time-varying, measure of credit constraints and studying how this a¤ects a �rm�s decision to
upgrade the quality of its exported output as opposed to the one sold domestically. Being output quality a
determinant of the unit value at which a product is sold, our study sheds light on how �nancing constraints
a¤ect this component of the intensive margin of trade. Moreover, we take into account how distance to
the export market and credit rationing jointly a¤ect quality upgrading. Our results show that exporting
�rms are less likely to upgrade output quality when credit rationed. The impact of credit constraints is
stronger on �rms exporting to distant markets.
In order to guide our empirical investigation, we lay out a theoretical framework based on Feenstra
and Romalis (2014). In this partial equilibrium model �rms endogenously choose the ratio between
exported and domestic output quality taking into consideration distance to the foreign market. We
extend this framework by introducing credit availability, represented by the share of revenues the �rm
receives as credit to �nance the total amount of the sunk cost for producing output with a determined
quality content, similarly to Sutton (2001, 2007) and Fan et al. (2015). The optimal output-quality ratio
depends on distance as well as credit availability. The model yields two predictions: (1) the lower the
1The determinants of output quality have been investigated using cross-country (Schott, 2004; Hummels and Klenow,2005, Hallak, 2006) and �rm-level data (Kugler and Verhoogen, 2012).
2 In fact, while few exporters account for the majority of EU export revenues (Mayer and Ottaviano; 2007) the majorityof EU exporting �rms are actually SMEs and account for a small fraction of export revenues, see Cernat et al. (2014).
3See Canton et al. (2013).
2

credit availability, the more constrained the �rm is, and the less likely it is to increase the ratio of exported
to domestic output quality; (2) the more distant the export destination, the higher is the output-quality
ratio and, hence, the larger is the impact of credit constraints on quality upgrading.
Model�s predictions are tested on �rm-level data. We use the VIIIth UniCredit Survey on Italian
SMEs, ran in June-September 2011, to obtain information on �rms�international activities, output char-
acteristics, R&D practices, credit rationing, percentage of skilled labour, location and age.4 Our main
dependent variable is a dummy for �rms declaring to produce output of higher quality for the foreign
market with respect to the one sold at home, as of 2010. We merge balance sheet data for the period
2002-2010 to this data-set. Our proxy for credit rationing is a creditworthiness score assigned to the �rm
by an external rating agency. This score, varying from 1 to 9, higher for �rms more likely to default, is
an independent, annually updated, measure available to each institution operating in the Italian credit
market. Banks check this score when deciding on whether to open or increase a �rm�s line of credit.5
By determining �nancial constraints with a discrete variable rather than a dichotomous one we are able
to measure the impact of a worsening in credit rationing for the �rm. This proxy is linked the variable
used in the theoretical framework: as credit availability shrinks, the cost of additional funds increases
proportionally to the external score. We validate this measure by �nding that it is a good predictor of
�rms that in survey declare to be strongly rationed.6 Moreover, the credit score is highly correlated with
indicators of a �rm�s economic and �nancial performance, such as labour productivity, liquidity ratio, cash
�ow and leverage ratio. We next turn to estimating the impact of credit constraints on export quality
upgrading controlling for �rm�s balance sheet data, �rm�s location and proxies for economic development
and credit supply in the province where the �rm has the headquarter.
We �nd that credit constrained �rms are less likely to upgrade export quality with respect to the
quality of domestically sold output. A one standard-deviation worsening in the credit score reduces the
probability of quality upgrading by more than 35 percent. We then test the prediction that �rms exporting
to distant markets have higher incentives to upgrade output quality and therefore are the most harmed
by credit rationing. Results show that the impact of credit constraints on quality upgrading is stronger
on �rms selling their products outside Europe and particularly on those exporting to North America.
The impact of an increase in the external score is 28 percentage points larger on manufacturing �rms
exporting outside Europe.
Endogeneity of the credit score might bias our estimates. First of all, even if a �rm�s score is determined
by an external agency after analyzing its economic performance in the previous years, this measure might
be in�uenced by the impact of the recent economic crisis. Credit supply and credit demand factors may
jointly a¤ect the external score, leading to a simultaneity bias. Furthermore, we do not have explicit
information on how the external rating agency determines a �rm�s score, as it is computed using a
proprietary algorithm. If the rating agency gives better (i.e. lower) scores to those �rms that are capable
of increasing the quality of exported output with respect to the one sold domestically, we face a classical
reverse causality problem. Lastly, even if we control for a number of factors correlated with our main
4The survey was designed to be representative under di¤erent dimensions: type of industry, �rm�s location and size. Wefocus only on manufacturing �rms.
5Panetta et al. (2009), �nd that this score is positively correlated with the median interest rates charged by banks to�rms. Rodano et al. (2014) use it as an indicator for the likelihood of default.
6Minetti and Zhu (2011) use this dummy for �rms declaring to be strongly rationed as their proxy for credit rationing.
3
explicative variable, unobservables such as managerial ability and �rm�s connections with bank managers
might bias our estimates.
Our �rst strategy to tackle endogeneity treats the recent economic crisis as an exogenous shock to
credit rationing. We use the variation in the score that is explained by the crisis as a proxy for credit
rationing, after controlling for �rm-level indicators of economic and �nancial performance. Results show
that among two equally productive �rms, the one whose score was negatively a¤ected by the crisis is less
likely to upgrade output quality. The second strategy employs an instrumental variable approach that
uses the average score in the years before the crisis and the number of banks lending funds to each �rm
as instrumental variables. We �nd a lower bound for the coe¢ cient of interest: the marginal e¤ect of an
increase in the score remains negative but larger in magnitude.
We extend our analysis by studying how �rm size interacts with credit constraints in determining
quality upgrading. Results show that small �rms, de�ned as those having less than 50 employees, are
signi�cantly hit by credit constraints while large �rms are less harmed: the impact of an increase in the
score doubles for small �rms. Our �ndings are robust to controlling for revenues in the foreign market,
for di¤erent proxies of a �rm�s output position in the product quality-ladder and considering alternative
indicators of credit rationing, such as industry �nance dependence.
This work lies at the intersection of two strands of the literature. The �rst studies the relation between
output quality and importing market attributes such as distance and income. Results show that export
output quality is proportional to distance and to the average income of the importing country (Hummels
and Skiba, 2004; Hallak, 2006; Crinò and Epifani, 2012; Martin, 2012).
The second strand focuses on the impact of credit constraints on the probability that a �rm becomes
an exporter and on its output quality choice. Manova (2013) introduces credit market frictions in a
heterogeneous-�rms trade model. In this framework, �rms di¤er in their credit needs because of the
di¤erent technologies employed in the industries in which they operate. The impact of a reduction in
credit availability reinforces the selection mechanism already at work in the heterogenous-�rms trade
model: small and less productive exporting �rms su¤er heavily from credit rationing since they tend to
rely more on external funds.7 Minetti and Zhu (2011), on a sample of Italian manufacturing �rms, con�rm
that credit constraints negatively a¤ect �rms�export participation and foreign sales.8
In order to investigate the impact of credit constraints on output quality, Fan et al. (2015) propose a
theoretical framework in which heterogenous �rms produce goods of a determined quality, conditional on
their productivity draw. When credit constraints are binding, output quality and prices decrease since
�rms start buying inputs of lower cost/quality. Using Chinese data, they �nd that credit rationing, proxied
by industry �nance dependence, leads �rms to reduce output quality.9 Crinò and Ogliari (2015) con�rm
the negative impact of �nancing constraints on average output quality at the product/country level.10
Their study shows that heterogeneity in product quality is a¤ected by the interplay of cross-industry
7On the impact of �nancial shocks on exporting �rms see also Amiti and Weinstein (2011).8Muûls (2012) proposes a �rm level analysis on data from Belgium to study the interaction between credit constraints
and trading behavior. Using the Coface score as a proxy for credit constraints during the period 1999-2007, Muûls (2012)�nds that credit constrained �rms export and import less than non-constrained ones.
9Bernini et al. (2013) �nd a similar result using �rm-level data from France on a limited number of products and employing�rm�s leverage as a proxy for credit rationing.10Crino and Ogliari (2015) use �nance dependence at the industry level as a proxy for credit constraints and estimate
average product quality at the country level following Khandelwal (2010).
4
di¤erences in �nancial vulnerability and cross-country di¤erences in �nancial frictions.
Our study contributes to this literature by using a �rm-level measure of credit rationing to determine
how credit constraints a¤ect the decision of small and medium size enterprises (SMEs) to upgrade the
quality of their exported output with respect to the one sold domestically. This study is the �rst one,
to the best of our knowledge, focusing on the interaction between distance to the destination market,
output quality upgrading and credit constraints. We �nd that the impact of credit constraints is stronger
on �rms exporting to distant markets, the ones having higher incentives to upgrade output quality. To
address endogeneity of our explicative variable we treat the recent economic crisis as an exogenous shock
to �rm�s credit rationing and employ an instrumental variable approach. Our results lead us to assess and
quantify the negative impact of credit constraints on output quality upgrading for the foreign market.
This paper is organized as follows. In section 2 we illustrate the theoretical framework guiding our
empirical analysis. In section 3 the data-set at our disposal is described. Section 4 discusses results, while
section 5 addresses the endogeneity of our explicative variable. In section 6 we test the robustness of our
results. Section 7 concludes the paper.
2 Model
In this section we extend the static framework proposed by Feenstra and Romalis (2014) in order to
account for the role of credit constraints. We study how a �rm, j, exporting from country i to country
k decides upon the ratio of output quality for the two markets, domestic and foreign, when it is credit
constrained.
2.1 The Consumer
Each consumer in country k consumes i=1,...,N varieties of a di¤erentiated product in a single sector.
Output is produced in di¤erent countries, i indicates the exporting country, while j refers to the single
�rm. The price and quality of a good exported from i to k are pki and zki : Demand in k is determined by
the expenditure function Ek = E(pk1=z1; :::; pkN=zN ; U
k): Quality is a shift parameter in the expenditure
function.11 Taking the derivative of the expenditure function with respect to the price of variety i, we
obtain the Hicksian demand for variety i in country k :
qki =@Ek
@pki: (1)
Quality-adjusted demand is Qki = zki qki , while the quality-adjusted price is P
ki=
pkizki; so to have Qki =
@Ek
@Pki:
2.2 The Firm
A �rm j, in country i, makes its optimal choice on the quality, zk
ij ; of the good to be sold in the foreign
market, k. Feenstra and Romalis (2014) introduce both speci�c and iceberg trade costs: T ki is the speci�c
per-unit trade cost which is increasing in distance between country i and country k. The iceberg trade
cost, �ki ; applies instead to the total value of traded products, including the speci�c trade cost.12 If we
11For the sake of simplicity we do not consider non-homothetic preferences and the role of ad-valorem tari¤s, denoted bytarki in Feenstra and Romalis (2014).12The iceberg cost is equal to one plus the ad-valorem cost.
5
denote by p�ki the f.o.b price in the exporting country, i, the c.i.f price in the importing country, k, is
equal to pki � �ki (p�ki +T ki ): Following the original model, output is produced employing a composite inputin quantity xkij . To produce one unit of a product with quality z
kij ; a �rm transforms a quantity xkij of
variable input in the following Cobb-Douglas technology:
z kij =�xkij'ij
� : (2)
With 'ij de�ning �rm�s productivity and 0 < < 1 indicating diminishing returns to quality. Assuming
that the unitary cost of the variable input xkij is wi; the marginal cost of producing a good with quality
z kij is:
cij(zkij ; wi) = wi(z
kij)1= ='ij : (3)
Recalling that qkij represents demanded quantity in country k, the total cost of producing for country k,
TC ij is the sum of the variable cost cij(zkij ; wi)qkij and of the sunk cost to start producing an output with
quality z kij for market k : Fkij=f
kwi(zkij)1= : In quality adjusted terms,
Fkijzkij= fk
wi(zkij)zkij
1=
, where fk is a
constant.13 Notice that the e¤ectiveness of the sunk cost depends on output quality and equals the one
of the variable cost. This cost is sunk by �rms exporting to k for expenditures in R&D, marketing, and
innovation as in Sutton (2001, 2007). Higher the quality of the output, larger the cost that the �rm must
sunk,
TC ij = cij(zkij ; wi)q
kij + F
kij : (4)
We can then write a �rm�s pro�t in market k :
�kij = [p�kij � cij(zkij ; wi)]�ki qkij � F kij : (5)
Rewriting it in quality-adjusted terms, using the de�nition of the sunk cost in quality-adjusted terms,Fkijzkij= fk
wi(zkij)zkij
1=
; and of the quality-adjusted c.i.f price, Pkij � �ki (p�kij + T ki )=zij ; we obtain:
�kij =
24Pkij � �ki�cij(z
kij ; wi) + T
ki
�zkij
35Qki � fkwi�zkij
� 1
zkij: (6)
2.3 Credit Constraints
We introduce credit constraints in the �rm�s pro�t maximization problem assuming that the �rm obtains
a fraction ��[0; 1]; of its revenues in market k, as credit to �nance the sunk cost of producing a good with
quality zkij . The �rm �nances the full amount of the sunk cost.14 Therefore when � decreases, the �rm
13The �rm has to invest xkij units of input in its technology in order to start producing an output with quality zkij for
market k. This investment is equal for all �rms exporting to k and does not depend on �rm�s productivity but only on thee¤ectiveness of technology, 1
:
14 It is possible to solve the model considering the possibility that the �rm �nances a fraction d�[0; 1] of the sunk cost, asin Fan et al. (2015), obtaining results in line with those presented here. Derivations for this extension are available uponrequest. Here we assume d=1 to simplify our exposition.
6
has less credit available and it is more likely to be constrained. The budget constraint takes the following
form,
�
8<:24Pkij � �ki
�cij(z
kij ; wi) + T
ki
�zkij
35Qki9=; � f k
wi
�zkij
� 1
zkij: (7)
The pro�t maximization problem reads now as follows:
maxPkij ;z
kij
8><>:24Pkij � �ki
�cij(z
kij ; wi) + T
ki
�zkij
35Qki � f kwi�zkij
� 1
zkij
9>=>; (8)
subject to
�
8<:24Pkij � �ki
�cij(z
kij ; wi) + T
ki
�zkij
35Qki9=; � f k
wi
�zkij
� 1
zkij: (9)
Using the de�nition for the marginal cost of production, cij(zkij ; wi); and introducing � to represent the
Lagrange multiplier, the FOC with respect to zk
ij leads us to �nd,15
(z�kij )1= =
�ki Tki Q
ki�
1 � 1
�wi
��ki
1'ijQki +
1+�1+�� f
k� : (10)
The optimal quality supplied to market k is increasing in the speci�c per-unit trade cost, T ki , in �rm�s
productivity, 'ij ; and decreasing in the term�1+�1+��
�, representing the distortion in output quality due to
credit constraints. The FOC with respect to P kij ; the quality-adjusted c.i.f price, con�rms that the �rm
charges a price equal to a mark-up over the marginal cost,
Pij =
��
� � 1
��ki
�cij(z
kij ; wi) + T
ki
�zkij
: (11)
There exist a cuto¤ level of credit access, �, such that the budget constraint (9) is binding for �*<�.
Using � as a proxy for a �rm�s credit constraint and imposing that the budget constraint is binding, it is
possible to solve for the distortion in output quality due to credit constraints: Substituting the solution
for 1+�1+�� in (10), we obtain optimal output-quality supplied to market k when the budget constraint is
binding:
zkij =
24 �ki Tki Q
kih
1� fkwi �
�1��1
��ki
i35 : (12)
Given (12), ifh1� fkwi �
�1��1
��ki
i> 0; it is possible to conclude that
@z�k
ij
@� > 0: Less rationed the �rm is,
the higher the output-quality supplied to the foreign market. Moreover, the impact of � on zkij is increasing
15Refer to the appendix for all derivations.
7
in T ki ; the destination speci�c per-unit cost,@zkij@�@Tki
> 0, provided thath1� fkwi �
�1��1
��ki
i< 1
(1� ) :
Suppose now that the exporting �rm produces also for the domestic market. Our aim is to �nd an
optimal solution for output quality in the domestic market assuming that the �rm maximizes its pro�t
in the two markets, i and j, independently. We solve the pro�t maximization problem for �rm j in the
domestic market i, assuming that it has to sunk a cost, f iwi(ziij)
1
zij, proportional to output quality. When
producing for the domestic market the �rm does not pay any ad-valorem trade costs: �ki is equal to one.
Moreover, we assume that the speci�c unitary trade cost, T ki ; is equal to one.16 Our �rm �nances the
total amount of the sunk cost obtaining a fraction, ��[0; 1]; of its revenues in the domestic market i as
credit. When � decreases, the �rm has less credit available and it is more likely to be credit rationed.
Firm�s pro�t in the domestic market is maximized as follows:
maxp�ij ;z
iij
8><>:24p�ij �
�cij(z
iij ; wi) + 1
�ziij
35Q ii � f iwi�ziij
� 1
ziij
9>=>; (13)
subject to
�
8<:24p�ij �
�cij(z
iij ; wi) + 1
�ziij
35Q ii9=; � f i
wi
�ziij
� 1
ziij: (14)
Using the same solution method adopted to obtain optimal quality in the foreign market we can derive
optimal output-quality supplied to the domestic market when the budget constraint is binding: ziij =�Qii
[ 1� f iwi�(1
��1)]
� : It is now possible to compute the ratio between output-quality supplied to the foreign,
zkij ; and to the domestic market, ziij :
zkijziij
! 1
=QkiQ ii
�ki Tki
hf iwi�
�1 ��
1��1
�ihf kwi�
�1 ��
1��1
��ki
i : (15)
Proposition 1 When �, the fraction of revenues that a �rm obtains as credit in order to �nance the sunkcost, decreases, the ratio between output quality supplied to the foreign and the domestic market decreases,
if fk < �ki fi:
Proof. Refer to the appendix
This �rst proposition states that as the amount of credit available is reduced, a �rm is less likely
to increase the quality content of exported products with respect to the quality of products sold in the
domestic market. This result holds if the constant component of the sunk cost associated to export, fk;
is smaller than the product between the iceberg trade cost, �ki ; and the constant component of the sunk
cost one needs to pay to start producing for the domestic market, f i
Proposition 2 As T ki , the speci�c unitary cost to ship a product to the foreign market k, increases, theratio between output quality supplied to the foreign and the domestic market augments when � increases.16This assumption is consistent with Feenstra-Romalis (2014) and it eases our computation.
8

Since T ki is increasing in distance between the domestic and the foreign market, credit constraints impact
more on output quality upgrading by �rms exporting to distant markets.
Proof. Refer to the appendix
Given that �rms exporting to more distant markets are more likely to export an upgraded version of
their product, a reduction of credit availability should a¤ect more this subgroup of exporting �rms.
3 Data
The econometric analysis carried out in this paper is based on data from the VIIIth UniCredit Survey
on Italian SMEs ran in the summer of 2011. The sample was designed according to a strati�ed selection
procedure so that �ndings are representative at the �rm, industry and geographical-location level. The
sample size of the survey consists of 7436 non-�nancial �rms, among these 1057 are manufacturing.
The main strength of this database is the very detailed information it collects on individual �rms. In
particular, the 2011 wave features information regarding �rms�s: (a) characteristics;17 (b) innovation; (c)
�nancial structure and bank-�rm relationship; (d) credit availability; (e) production characteristics; (f)
collaboration and cooperation agreements; (g) internationalization. We also have access to the annual
balance sheets for all �rms involved in the survey for the period 2002-2010.18 Along with information on
�rms�balance sheets, �rms�credit scores from both UniCredit and CEBI are at our disposal. Given our
research question, we focus only on data from manufacturing �rms.
3.1 Main Variables
High Quality Out. Our main dependent variable is a dummy equal to one if the �rm answers "higher"
to the following question: "How would you de�ne the quality of your exported output compared to the
one you sell in the domestic market ?" Firms are asked to compare the quality of exported output with
the one sold in the domestic market without clearly stating a de�nition of output quality. We are however
con�dent that who answers this question in the interview is capable of disentangling quality di¤erences
between exported and domestic output, referring to the cost of inputs employed for producing the two
products (Verhoogen, 2008). Moreover, this question is placed in the "internationalization section" of
the survey, where �rms are asked to describe their stance in international markets: it is unlikely that
who answers other questions regarding a �rm�s export activity is not aware of di¤erences in product
characteristics that make exported output quality di¤erent from the one sold in the domestic market.
Moreover, preliminary evidence on our data con�rms that the probability of a �rm declaring to increase
output quality for the foreign market is positively correlated with �rm-level variables, such as labour
productivity and �rm size, usually found in the literature to be correlated with standard measures of
output quality. When answering this question �rms can also declare to export products of lower quality
with respect to the one produced for the domestic market: we will use this information in some of the
following speci�cations.
Measures of Credit Rationing. We need to �nd a proxy for credit constraints at the �rm level, an
observable variable representing the term � used in our theoretical framework. As previously said, when �
17Date of foundation, number of employees, revenues in 2010, type of industry.18We obain this information from CEBI, "Centale Bilanci", the main independent source of information on �rms�credit-
whortiness available to �nancial and credit institutions operating in Italy.
9
decreases the �rm has less external funds available to �nance its sunk cost of production; when this term
decreases, accessing external funds becomes more costly to the �rm that might decide not to increase the
quality content of its output. Our aim is then to �nd a �rm-level measure for credit rationing. Ideally,
this measure should be a discrete variable since our objective is to measure how a worsening in the credit
constraints a¤ects the decision of the �rm on output quality.
In the survey, �rms are asked to de�ne their credit availability, speci�cally they are asked to answer
the following questions: (a) "In 2010 would the �rm have liked to obtain more credit at the market interest
rate?" and (b) "In 2010 did the �rm demand more credit than it actually obtained?". In case of positive
answer to both questions, a �rm is de�ned as "strongly rationed", while in case of positive answer only
to the �rst question, a �rm is labelled as "weakly rationed".19
Referring to balance sheets data, it is possible to extract other valuable information on a �rm�s
economic and �nancial status. For those �rms in the sample that in 2011 were customers of UniCredit
Group, we also can compute the ratio of credit used over total credit available from banking institutions
reporting this information to CEBI.20
External Score. From the same source, we obtain a �rm�s external score, spanning from one, for
�rms in good �nancial/economic health, to nine, for �rms with a high probability of default.21 In our
main speci�cations we will use this variable as a proxy for credit constraints under the assumption that
when a �rm reports a worse score it is more di¢ cult and more costly to obtain credit at the market�s
interest rate. In the following section we will support this assumption relying on several econometric
speci�cation. The idea of using a �rm�s credit score as a measure for credit constraint is common in the
Corporate Finance literature. In fact, Panetta et al. (2009), �nd that the score is positively correlated
with the median interest rates charged by banks to Italian �rms. The lowest external score, is on average
associated with a loan interest rate of 4%, whereas the worst category pays an average loan interest rate
of around 5%. The same authors also �nd that the external score is an accurate predictor of actual
default-incidence among Italian �rms.
Balance Sheet Data. We consider a number of variables that are correlated with a �rm�s decisionto upgrade the quality of exported output and with its credit availability. From balance sheet data, we
obtain our proxy for �rm�s size, the number of employees: large �rms often produce for the foreign market
and, since revenues are correlated with size, have large funds to invest in quality di¤erentiation.22 We
also introduce a variable that is found in the empirical trade literature to be positively correlated with
output quality: productivity.23 We compute labour productivity as the ratio between total value-added
and the number of employees in each year. Moreover, we construct variables representing the amount of
�nancial resources generated internally and the use of external �nance by the �rm. In particular we have
information on (i) �rm�s leverage ratio, de�ned by �rm�s total liabilities over equity; (ii) liquidity ratio,
obtained dividing current assets less current liabilities by total assets; (iii) cash �ow, equal to net revenues
19See Guiso et al. (2004) and Minetti and Zhu (2011).20We obtain two di¤erent measure: one reporting information on long-term credit use, total credit used over total credit
available in the three years preceding the survey, and another on the amount of credit used over credit available in 2010.21This is the score classi�cation 1 = High Safety, 2 = Safety, 3 = High Solvency, 4 = Solvency 5= Vulnerability, 6= High
Vulnerability, 7=Risk, 8=High Risk, 9=Very High Risk.22See Bernard et al. (2004), Minetti and Zhu (2011).23See Verhoogen (2008), Baldwin and Harrigan (2011), Crinò and Epifani (2012).
10
over total equity; (iv) capital intensity, the ratio between total �xed assets and the number of employees.
It is important to recall here that variables from (i) to (iii) have often been used in the literature as
proxies for credit rationing.24 In our study these measures are used as controls since we expect our main
explicative variable, the �rm�s external score, to be highly representative for a �rm�s credit rationing. In
fact, a �rm�s leverage ratio would give information on the amount of credit received by the �rm with
respect to the resources generated internally; the amount of external funds obtained by a �rm is however
a result of production technologies, investment decisions and business cycles, as such it gives only a partial
information on how di¢ cult and costly accessing external �nance might be . The external score is instead
an information that is known by all banking institutions across Italy. It is probably the �rst information
checked by a Bank�s local-branch manager when asked to increase the upper limit or to open a new line
of credit for a �rm and it is going to drive his/her decision on whether to �nance a SME.
Other Survey Data. We consider a number of variables that are correlated with a �rm�s decisionto upgrade the quality of its exported output. In the survey, �rms are asked to state the percentage of
University graduates in their labour force, when the �rm was founded, whether it is part of a business
group, a corporation or a consortium and if it is located in the Center, the South or the North of Italy.
Firms employing a skilled labour force and those producing for a long time are often found to be more
productive and to supply high-quality products.25 Being part of a corporation or of a business group
might give incentives to invest in innovation and in quality upgrading practices and decrease the need of
external �nance for the �rm. Moreover, given the peculiar characteristics of the Italian economy and the
fragmentation of its credit-market, it is crucial to consider the geographical location of the �rm, since this
is likely to a¤ect its revenues, the composition of its labour force and its access to credit.26
Province Level Variables. We merge information on the economic activity at the province levelto this rich database. We consider data on provincial value-added from 1998 to 2008, both in levels and
growth rates, as obtained from ISTAT. In order to have a proxy for credit supply at the local level we
employ data on the average number of bank-branches per 1000 inhabitants in each Italian province during
the period 1991-1998, available from the Bank of Italy.
Table 1 reports summary statistics on these variables for the group of exporting manufacturing �rms
in the year to which the survey refers, 2010.27
[Table 1 here]
It is interesting to notice that almost 12% of �rms declare to export products of higher quality
with respect to ones sold in the domestic market. The mean size of �rms in our sample is equal to 76
employees, but observing that the median is lower, 49, we can claim that the majority of �rms in the
sample is signi�cantly smaller. On average, exporting manufacturing �rms are operating since 32 years
and are mainly located in the North of Italy.28 The percentage of the labour force holding a University
degree is slightly higher than 10%. The mean and the median external credit score are relatively low
24See Greenaway et al. (2007) and Bernini et al. (2013).25See Bernard et al. (2004) and Minetti and Zhu (2011).26See Guiso et al. (2004).27Balance sheets data are from the end of 2010.28The 74.2% is located in the North, the 15.5% in the Center and the 10.1% in the South.
11
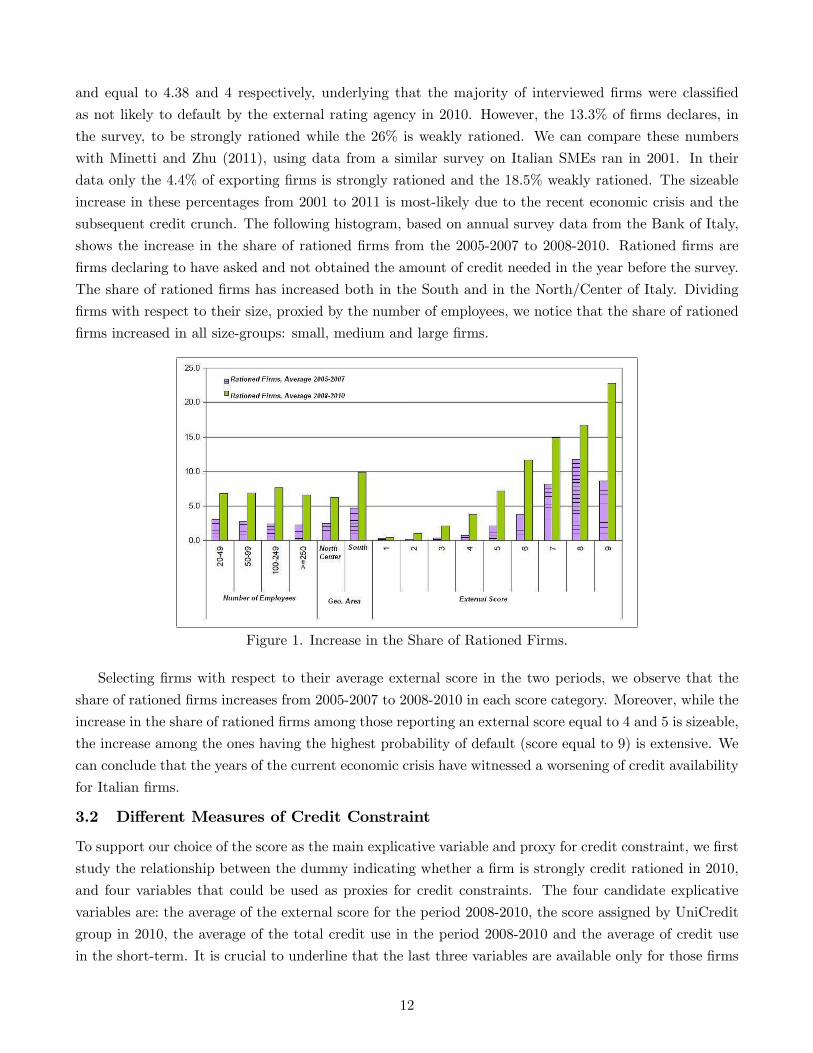
and equal to 4.38 and 4 respectively, underlying that the majority of interviewed �rms were classi�ed
as not likely to default by the external rating agency in 2010. However, the 13.3% of �rms declares, in
the survey, to be strongly rationed while the 26% is weakly rationed. We can compare these numbers
with Minetti and Zhu (2011), using data from a similar survey on Italian SMEs ran in 2001. In their
data only the 4.4% of exporting �rms is strongly rationed and the 18.5% weakly rationed. The sizeable
increase in these percentages from 2001 to 2011 is most-likely due to the recent economic crisis and the
subsequent credit crunch. The following histogram, based on annual survey data from the Bank of Italy,
shows the increase in the share of rationed �rms from the 2005-2007 to 2008-2010. Rationed �rms are
�rms declaring to have asked and not obtained the amount of credit needed in the year before the survey.
The share of rationed �rms has increased both in the South and in the North/Center of Italy. Dividing
�rms with respect to their size, proxied by the number of employees, we notice that the share of rationed
�rms increased in all size-groups: small, medium and large �rms.
Figure 1. Increase in the Share of Rationed Firms.
Selecting �rms with respect to their average external score in the two periods, we observe that the
share of rationed �rms increases from 2005-2007 to 2008-2010 in each score category. Moreover, while the
increase in the share of rationed �rms among those reporting an external score equal to 4 and 5 is sizeable,
the increase among the ones having the highest probability of default (score equal to 9) is extensive. We
can conclude that the years of the current economic crisis have witnessed a worsening of credit availability
for Italian �rms.
3.2 Di¤erent Measures of Credit Constraint
To support our choice of the score as the main explicative variable and proxy for credit constraint, we �rst
study the relationship between the dummy indicating whether a �rm is strongly credit rationed in 2010,
and four variables that could be used as proxies for credit constraints. The four candidate explicative
variables are: the average of the external score for the period 2008-2010, the score assigned by UniCredit
group in 2010, the average of the total credit use in the period 2008-2010 and the average of credit use
in the short-term. It is crucial to underline that the last three variables are available only for those �rms
12
that were customers of UniCredit in 2010, therefore, all the evidence described in the following paragraph
refers to customers of UniCredit.
As previously said, our ideal measure for credit constraint would be a �rm level measure that is
correlated with what declared by the �rm in the survey but also measures how intensively the reduction
of credit impacts on exported output quality upgrading. Two �rms both declaring in the survey to be
credit rationed might be di¤erently a¤ected. We believe it is possible to catch this cross-�rm variation
using the average of external credit score in the three years preceding the survey. We assess the validity
of our choice reporting the following speci�cations, where the "Strong Rationing" dummy is regressed
on our four candidate explicative variables as well as on �rm and province level control variables. In
these speci�cations, we consider other covariates, obtained from the survey, that might impact on the
probability that a �rm declares to be strongly rationed: the number of creditors, the percentage of credit
obtained from the principal bank over total credit, the percentage of credit over total assets and a dummy
equal to one if the �rm has changed principal bank in the period 2010-2011.
[Table 2 here]
Results show that the external score is positively and signi�cantly correlated with a �rm declaring
to be strongly rationed in 2010. The marginal e¤ect at the means of an increase in the external score is
equal to 0.067 and it is signi�cant at the 5%. The coe¢ cient for this variable remains signi�cant when
we run a speci�cation including the other candidates: we now obtain an average marginal e¤ect equal to
0.061, signi�cant at the 5%. Firms with a high level of credit over assets, highly leveraged and with a low
cash �ow are also more likely to be strongly credit rationed. Interestingly, �rms based in a province that
has experienced a positive growth in value-added over the decade 1998-2008 are less likely to be strongly
credit rationed. This last result con�rms that �rms face less problems in accessing external �nance when
they are based in a province that has experienced positive economic growth in the recent years.
In order to further assess the validity of our quantitative measure of credit constraint, we propose a
table reporting correlations between indicators of a �rm�s economic and �nancial performance and our
candidate explicative variable. Table 3 reports OLS estimates obtained using the external score as a
dependent variable. In speci�cation (1) to (4) we exploit within-time and �rm variation using �rm and
time �xed-e¤ects, while in speci�cation (5) we use data from 2010 and introduce industry �xed-e¤ects.
Results show that, among �rms of the same size, a higher labour productivity is associated with a lower
(i.e. better) external score: more productive �rms are better rated and, given results reported in Table
2, have an easier access to credit.
[Table 3 here]
A higher liquidity ratio and a higher cash-�ow are also associated with a lower external score, while
results on the leverage ratio are not uniform across speci�cations. Following this evidence, we conclude
that the score assigned by CEBI to Italian �rms is a good predictor for credit availability and, being
strongly correlated with indicators of a �rm�s economic and �nancial status, is also a valid proxy for a
�rm�s creditworthiness.
We showed that our proxy for credit constraints is a good prediction for a �rm declaring to be
strongly rationed and that it is correlated with measures for the economic and �nancial performance of
13
the �rm. It is however still unclear if this variable actually di¤erentiates �rms with respect to their main
characteristics. In the following table we split our sample of manufacturing �rms in two di¤erent groups,
non-vulnerable (N. V.) �rms are those reporting an average external score lower than or equal to 4 while
vulnerable exporting �rms are those reporting an external score from 5 to 9.
[Table 4 here]
Table 4 shows group means, standard deviations and T-tests for di¤erence in means for our variables
of interest in the two groups. Vulnerable �rms are signi�cantly less likely to upgrade output quality
for the foreign market. Moreover, among the group of vulnerable �rms the 42.5% and the 27.5% are
weakly and strongly rationed, respectively. These percentages are signi�cantly smaller for non-vulnerable
�rms: almost the 4% and the 15% of non-vulnerable �rms declare to be strongly and weakly rationed,
respectively. Vulnerable �rms are also less productive, have less cash �ow, are more leveraged and less
liquid. On the contrary, non-vulnerable �rms are signi�cantly older, less capital intensive and tend to be
located in the North of Italy. Vulnerable exporters are then di¤erent from non-vulnerable exporters in
terms of their economic performance and, most importantly, in the ability to upgrade output quality for
the foreign market.
4 Results: Upgrading Quality for the Foreign Market
In this section we empirically test predictions obtained in the framework presented in section 2. We set
Qj = 1 for �rms exporting an output of higher quality with respect to the one sold domestically and
use Cj ; to represent credit rationing at the �rm-level, proposition 1 predicts that quality upgrading is
decreasing in credit rationing: @ Pr(Qj=1)@Cj< 0:
We employ this econometric model:
Pr(Qj = 1) = prob(�+ & ind + �Cj + Xj + �Tp + "j > 0): (4.1)
The probability that �rm j upgrades the quality of exported output, Qj = 1; depends on our main
explicative variable, Cj ; credit rationing at the �rm-level, proxied by the average of the external score
for the period 2008-2010. Higher the external score, more rationed the �rm is, the less likely it is to
increase output quality for the foreign market. We control for �rm-level variables correlated with �rm�s
credit availability and with the possibility of a �rm to upgrade the quality of exported output, Xj . This
vector of variables includes: �rm�s size, labour productivity, cash �ow, liquidity ratio, capital intensity,
labour skill and �rm�s age. We also consider variables representing the level of economic development in
the province where the �rm has the headquarter, such as provincial value-added growth, the average of
provincial valued-added, and for the number of bank branches per 1000 inhabitants in each province; these
variables are included in vector Tp. In these speci�cations we introduce an intercept and use industry
dummies, & ind; in order to account for other sources of comparative advantage and for the pattern of
world demand for goods.29 If we assume that �j is i.i.d, normally distributed with mean 0 and variance
1, we have:
29Using the ateco two-digit classi�cation our �rms belong to 25 di¤erent industries.
14
Pr(Qj = 1) = �(�+ & ind + �1Cj + 1Xj + �1Tp): (4.2)
where � indicates a normal distribution function. Table 5 reports our �rst set of results.
[Table 5 here]
We start by using our main explicative variable, the average external score in 2008-2010, and insert
control variables group by group in the following regressions. The average of the external score reports in
speci�cation (1) a negative coe¢ cient equal to -0.025 and signi�cant at the 1%. In speci�cation (2), when
we introduce industry level dummies, the estimated coe¢ cient of our main variable does not change in
magnitude and signi�cance. We then insert �rm-level controls obtained from balance sheets data starting
from speci�cation (3). Results con�rm that large �rms are more likely to upgrade exported output quality:
the sign of this coe¢ cient is positive and signi�cant in all of our speci�cations. In speci�cation (4) we insert
cash �ow, liquidity ratio, leverage ratio and capital intensity. These variables all report non-signi�cant
coe¢ cients, but, being correlated with the external score, a¤ect the magnitude of this coe¢ cient. We then
consider the percentage of skilled labour force in the �rm and for a dummy equal to one for �rms declaring
to have innovated their products in the last year before the survey, from speci�cation (6) onwards. These
two variables report small and non-signi�cant coe¢ cients. In speci�cation (6) we also control for �rm�s
age, and for dummies representing the organizational structure of the �rm. Firms belonging to a business
group are less likely to upgrade output quality, while other variables report non-signi�cant coe¢ cients.
Speci�cation (7) introduces our full set of controls, including provincial value-added growth and the
number of bank branches at the province level. Firms located in provinces that experienced a positive
growth in value-added from 1998 to 2008 are less likely to upgrade output quality. This is in line with
the intuition that �rms located in more developed provinces have lower incentives to vary the quality of
exported output given that their domestic demand, and the supposedly high-level of market competition,
selects those �rms producing an output quality closer to the one requested in the export market. In
speci�cation (8) we consider the level of provincial value-added, results do not change and the coe¢ cient
of this variable is not signi�cant.30
Our �rst set of estimations shows that the marginal e¤ect of our proxy for credit constraint always
enters with a negative and signi�cant coe¢ cient. Interestingly, the magnitude of the marginal e¤ect for this
variable remains quite stable across speci�cations.31 Relying on the coe¢ cient obtained in speci�cation
(7), we observe that a one-standard deviation increase in the average external score reduces the probability
of quality upgrading by more than 35 percentage points.32 Referring to Table 6, the reader can compare
results obtained in speci�cation (7) of Table 5 with those obtained estimating a linear probability model
on the same speci�cation, in (1) and (2) respectively. The average marginal e¤ects are very similar. Credit
constrained �rms are less likely to upgrade the quality of exported output, while larger �rms are more
likely to pursue this strategy.30Both the level and the growth rate of provincial value added might a¤ect output quality in�uencing the demand for
goods produced by the �rm and for goods of higher/lower quality.31 It varies from -0.019 to -0.030.32We obtain this number multiplying the average marginal e¤ect of this variable, as obtained in speci�cation (8) 0.029, by
its standard deviation in the estimation sample, 1.82. We then divide the result by the share of �rms that upgrade exportoutput quality in the estimation sample: 15%.
15
[Table 6 here]
In speci�cation (3) we change our dependent variable to "Quality". This variable takes three di¤erent
values: it is equal to 0 if a �rm declares to export output of lower quality with respect to the one supplied
in the domestic market, equal to 1 if the �rm states that output quality in the two markets does not
di¤er, and equal to 2 if the �rm declares to produce output of higher quality for the export market. We
run an ordered probit model using our main explicative variable and the usual set of controls. Results
for this last speci�cation are in line with the ones previously described. The average marginal e¤ect of
the external score on the probability of quality upgrading is equal to -0.026 and signi�cant at the 10%.
Table 7 reports cross-correlations for the variables employed in these speci�cations.
[Table 7 here]
4.1 Export destination and credit constraints
Following the intuition of Alchian and Allen (1964), several studies investigated the relation between
distance to export destination and quality of exported output.33 These studies, mostly employing product
unit values as proxies for output quality, �nd that �rms sell high quality products in more distant markets.
Our theoretical framework suggests that �rms exporting to more distant markets should su¤er more from
a worsening in credit constraints when deciding on export quality upgrading:@
zkij
ziij
! 1
@�@Tki> 0:
In the survey, �rms are asked to declare to which markets they export. These markets are identi�ed
in terms of geographic macro-areas: North-America, Latin-America, Africa, Mediterranean Countries,34
Asia,35 China-India, Oceania, European main markets for Italian exporters,36 European secondary mar-
kets37 and Est-European countries.38 Given this information, we di¤erentiate �rms using a dummy equal
to 1 for those exporting outside the European area (EU).39 As found in the theoretical framework, �rms
exporting outside the European area should face higher per-unit transportation costs with respect to
�rms exporting only in Europe. We study the impact of credit constraints on these �rms by interacting
this dummy variable with our main explicative variable: the average external score obtained by the �rm
during the period 2008-2010. Equation (4.3) reports the econometric model estimated in Table 8.
Pr(Qj = 1) = prob(�+ & ind + �Cj + �OutEuj + �OutEuj � Cj + Xj ++�Tp + "j > 0) (4.3)
[Table 8 here]
33See Hummels and Skiba (2004) and Martin (2012) among others.34North Africa and the Middle East.35 Including countries in the Arabic peninsula.36Germany, France, UK and Spain.37Switzerland, Sweden, Belgium, the Netherlands.38New EU members, Balcanic Countries and Russia.39We identify as exporters to the European area �rms declaring to export in European main markets, European secondary
markets and Est-European countries. We refer to EU as a geographical area and not as a political-economic entity in thiscase. Moreover, we do not consider observations from �rms whose most distant export market is in the Medieterranean.
16
We test the following prediction: the probability of quality upgrading should be decreasing in the term
interacting the proxy for credit rationing and export destination, @ Pr(Qj=1)@(Cj�OutEuj) < 0: Table 8, reporting
coe¢ cients and not average marginal e¤ects, shows two interesting results. First, �rms exporting outside
the European area are more likely to upgrade exported output quality. Moreover, these �rms are the ones
whose probability of quality upgrading is more a¤ected by credit constraints. In fact, a standard deviation
worsening of the credit score is 28% larger on �rms exporting outside Europe.40 This �nding, which has
not been documented so far in the literature, might be explained in two ways. First, �rms exporting
inside Europe are less likely to upgrade quality since these markets are more similar to the domestic one,
therefore they are less a¤ected by credit rationing when deciding on output quality. A second explanation
might be related to the Alchian-Allen e¤ect: in order to export their products to non-European markets,
�rms need to upgrade the quality of their output so to reduce the incidence of per-unit trade costs on
the �nal price of their products in the export market. Coe¢ cients reported in Table 8 also con�rm that
more productive and large �rms are capable to upgrade the quality of exported output. Using the last
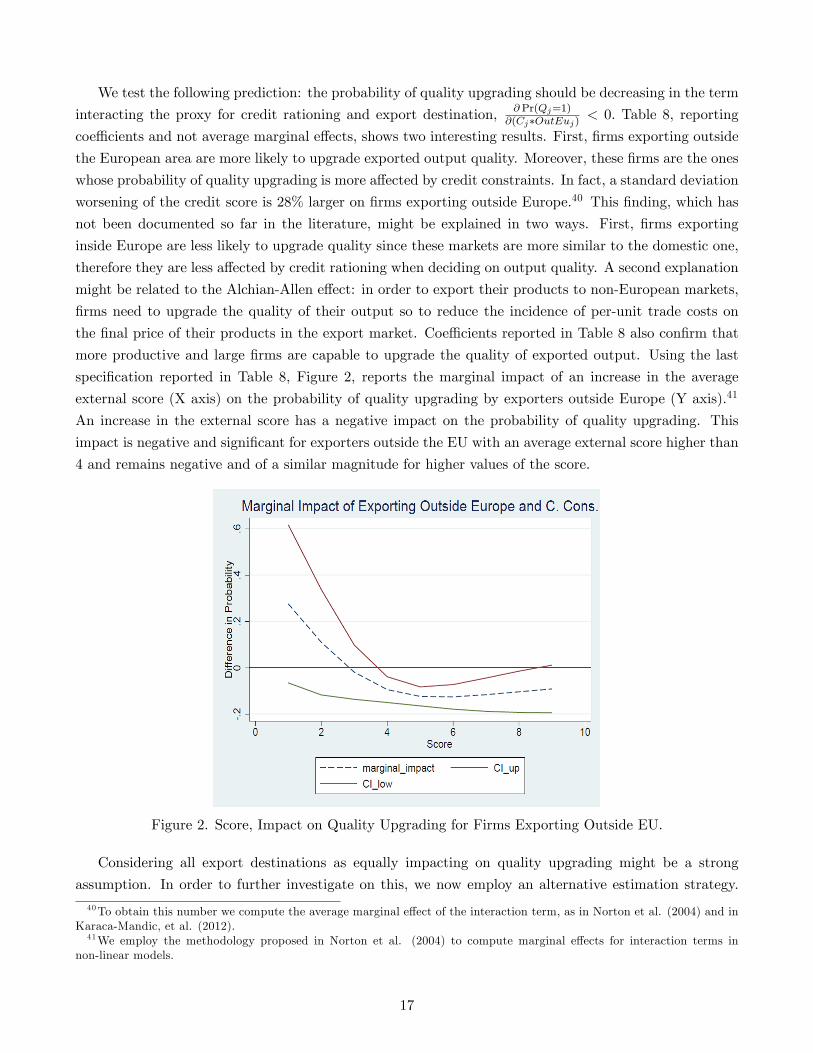
speci�cation reported in Table 8, Figure 2, reports the marginal impact of an increase in the average
external score (X axis) on the probability of quality upgrading by exporters outside Europe (Y axis).41
An increase in the external score has a negative impact on the probability of quality upgrading. This
impact is negative and signi�cant for exporters outside the EU with an average external score higher than
4 and remains negative and of a similar magnitude for higher values of the score.
Figure 2. Score, Impact on Quality Upgrading for Firms Exporting Outside EU.
Considering all export destinations as equally impacting on quality upgrading might be a strong
assumption. In order to further investigate on this, we now employ an alternative estimation strategy.
40To obtain this number we compute the average marginal e¤ect of the interaction term, as in Norton et al. (2004) and inKaraca-Mandic, et al. (2012).41We employ the methodology proposed in Norton et al. (2004) to compute marginal e¤ects for interaction terms in
non-linear models.
17
We focus on the sub-sample of �rms exporting to the main European destination markets for Italian
exporters: France, Germany, UK and Spain. Within these �rms, we select the ones exporting also to
North America. The United States are, by far, the largest market for Italian manufacturing �rms outside
the EU: many Italian �rms export to this market on top of exporting to one or more EU destinations. A
dummy equal to one for �rms exporting to North America is then interacted with our proxy for credit
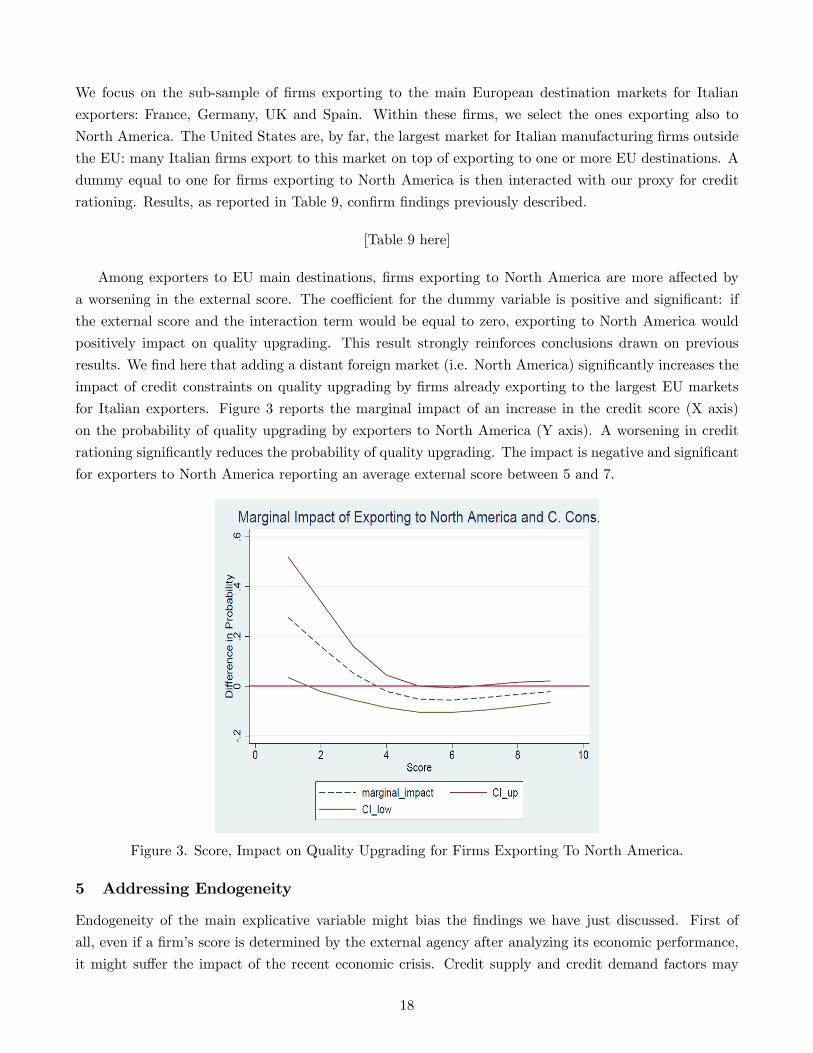
rationing. Results, as reported in Table 9, con�rm �ndings previously described.
[Table 9 here]
Among exporters to EU main destinations, �rms exporting to North America are more a¤ected by
a worsening in the external score. The coe¢ cient for the dummy variable is positive and signi�cant: if
the external score and the interaction term would be equal to zero, exporting to North America would
positively impact on quality upgrading. This result strongly reinforces conclusions drawn on previous
results. We �nd here that adding a distant foreign market (i.e. North America) signi�cantly increases the
impact of credit constraints on quality upgrading by �rms already exporting to the largest EU markets
for Italian exporters. Figure 3 reports the marginal impact of an increase in the credit score (X axis)
on the probability of quality upgrading by exporters to North America (Y axis). A worsening in credit
rationing signi�cantly reduces the probability of quality upgrading. The impact is negative and signi�cant
for exporters to North America reporting an average external score between 5 and 7.
Figure 3. Score, Impact on Quality Upgrading for Firms Exporting To North America.
5 Addressing Endogeneity
Endogeneity of the main explicative variable might bias the �ndings we have just discussed. First of
all, even if a �rm�s score is determined by the external agency after analyzing its economic performance,
it might su¤er the impact of the recent economic crisis. Credit supply and credit demand factors may
18
jointly a¤ect the external score, giving rise to a simultaneity bias. Evidence con�rms that during the
crisis, Italian credit institutions decreased the amount of loans and strongly reduced the number of loans
to risky creditors.42 This factor might have in�uenced the external rating agency when determining �rms�
external scores during the crisis. If �rms receive worse scores because of the credit-supply e¤ect of the
crisis, our results are biased.
We tackle this issue assessing the supply-side impact of the recent economic-downturn on Italian �rms.
We retrieve the amount of variation in the external score explained by the crisis once controlling for �rm-
level economic and �nancial variables. We then employ this exogenous variation in our main speci�cation
to study the impact of the economic crisis on exported output quality upgrading.
Furthermore, we do not have information on how the external rating agency de�nes a �rm�s external
score: it is computed using a proprietary algorithm. If the rating agency gives better (i. e. lower)
scores to those �rms that are capable to di¤erentiate the quality of exported output with respect to the
output sold domestically, we face a classical reverse causality problem. Since quality upgrading �rms
might be more likely to obtain a better (i.e. lower) external score, we suppose that our estimates could
be downward biased. Based on this reasoning, if we would �nd a proper instrument for our explicative
variable we should �nd a less negative or even a positive coe¢ cient when instrumenting. Lastly, even
if we are controlling for a good number of factors correlated with our main explicative variable, there
might be unobservables, such as managers�connections with the banking sector, that might be negatively
correlated with a �rm�s external score43 and with exported-output quality upgrading, leading us to �nd
upward biased estimates.44 The marginal e¤ect at the mean commented in the previous section would
then be an upper bound of the unbiased marginal e¤ect.
5.1 The Impact of the Great Recession
We study the impact of the recent economic crisis on credit constraints at the �rm level. Our idea is to
consider the great recession as an external shock to credit access for Italian �rms. The recession started at
the end of 2007 with a �nancial crisis in the US and then spread across the globe45 through a signi�cant
fall in the demand for durable goods.46 This shock impacted on the economic and �nancial performance
of Italian �rms both reducing revenues and worsening credit availability. In the following graph we report
the average of within-industry variation of the external score. We divide �rms in two groups, quality
upgraders and �rms that did not upgrade quality, as of 2010. The graph clearly shows that the score�s
variation signi�cantly increased during the crisis for both groups of �rms.
42See Albareto and Finaldi Russo (2012).43Entrepreneurs that are more connected with the banking sector might be able to obtain better (i.e. lower) scores.44Firms producing high quality products both for the domestic and the foreign market might have strong connections with
credit institutions.45According the NBER the US recession began in December 2007 and ended in June 2009. Italy was in a recession from
Q2-2008 until Q2-2009.46We refer to the debate on the Great Trade Collapse, as in Baldwin (2009).
19
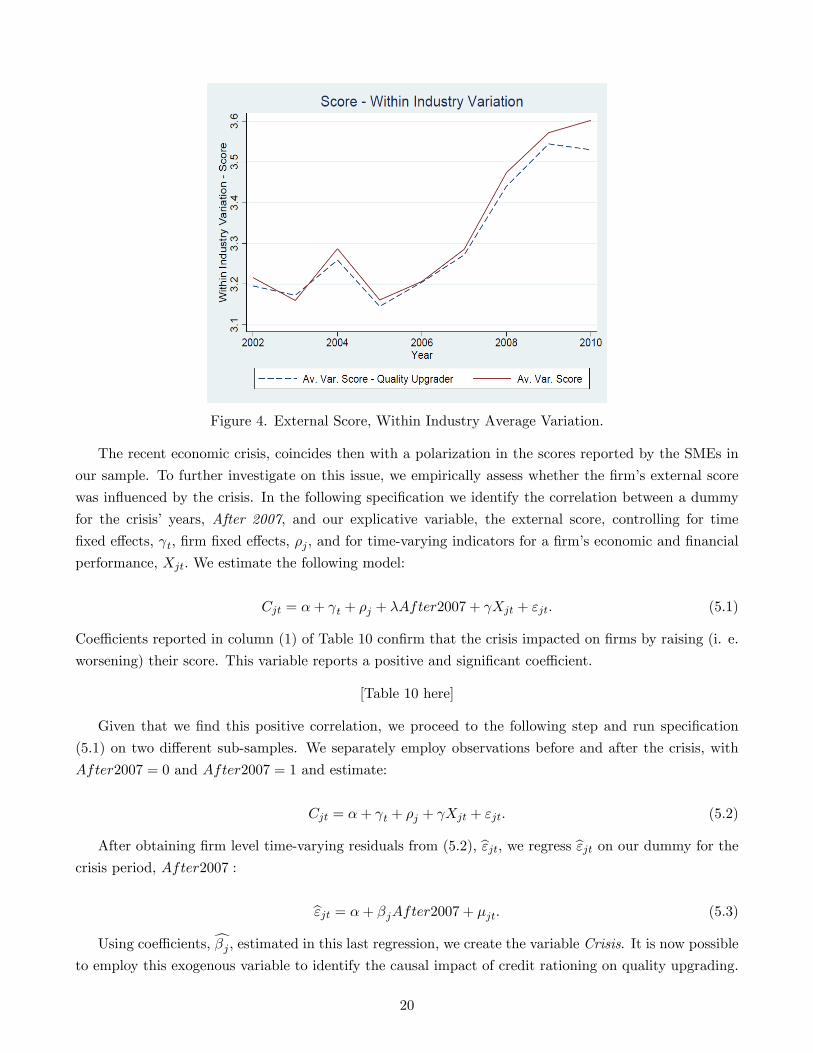
Figure 4. External Score, Within Industry Average Variation.
The recent economic crisis, coincides then with a polarization in the scores reported by the SMEs in
our sample. To further investigate on this issue, we empirically assess whether the �rm�s external score
was in�uenced by the crisis. In the following speci�cation we identify the correlation between a dummy
for the crisis� years, After 2007, and our explicative variable, the external score, controlling for time
�xed e¤ects, t; �rm �xed e¤ects, �j ; and for time-varying indicators for a �rm�s economic and �nancial
performance, Xjt: We estimate the following model:
Cjt = �+ t + �j + �After2007 + Xjt + "jt: (5.1)
Coe¢ cients reported in column (1) of Table 10 con�rm that the crisis impacted on �rms by raising (i. e.
worsening) their score. This variable reports a positive and signi�cant coe¢ cient.
[Table 10 here]
Given that we �nd this positive correlation, we proceed to the following step and run speci�cation
(5.1) on two di¤erent sub-samples. We separately employ observations before and after the crisis, with
After2007 = 0 and After2007 = 1 and estimate:
Cjt = �+ t + �j + Xjt + "jt: (5.2)
After obtaining �rm level time-varying residuals from (5.2), b"jt; we regress b"jt on our dummy for thecrisis period, After2007 :
b"jt = �+ �jAfter2007 + �jt: (5.3)
Using coe¢ cients,c�j ; estimated in this last regression, we create the variable Crisis. It is now possibleto employ this exogenous variable to identify the causal impact of credit rationing on quality upgrading.
20
Our identi�cation strategy relies on assuming that, after controlling for �rm speci�c and time varying
components, we are able to capture the exogenous impact of the economic crisis on �rm�s credit access
through the exogenous variation in the external score. We run the following speci�cation to compare, at
a given level of labour productivity, �rms reporting di¤erent variations in the external score due to the
recent economic crisis conditioning on the set of controls previously employed:
Pr(Qj = 1) = prob(�+ & ind + �Crisisj + �LabPj + �LabPjCrisisj + Xj ++�Tp + "j > 0): (5.4)
The variable representing the impact of the crisis on a �rm�s external score, Crisisj ; is interacted
with labour productivity, LabPj : We employ this quasi-DID strategy in order to study whether �rms,
conditional on their economic performance, were a¤ected by credit rationing due to the exogenous impact
of the crisis when deciding to upgrade the quality of their products. Employing coe¢ cients obtained
in speci�cation (6) of Table 10, we report the marginal e¤ects of Crisisj at di¤erent levels of labour
productivity in Table 11.47 Results show that more productive �rms are negatively impacted by credit
rationing More productive �rms, the ones more likely to pursue quality upgrading, are more a¤ected by
the worsening in the credit score due to the recent economic crisis. Results are con�rmed when controlling
for the time-trend of economic and �nancial variables in our "�rst stage", presented in (5.2)
[Table 11 here]
Considering the crisis as an exogenous shock for the credit score, we �nd that �rms whose score
increased (i.e. worsened) during the recent economic crisis and that, consequently, experienced a reduction
in credit availability are less-likely to upgrade the quality of exported output with respect to the one sold
domestically. Credit rationing reduces the probability of quality upgrading for the foreign market.
5.2 Instrumental Variable Approach
We continue our analysis implementing an instrumental variable approach. We suppose that our main
model,
Pr(Qj = 1) = prob(�+ & ind + �Cj + Xj + �Tp + "j > 0) (5.5)
is valid, while the proxy for a �rm�s credit rationing, Cj , is endogenous and instrumented by covariates
used in the main speci�cation and by a vector of instrumental variables, Zj :
Cj = �+ & ind + �Zj + Xj + �Tp + �j : (5.6)
We can rely on other researches that have dealt with endogeneity of the main explicative variable while
working on data-sets and research questions similar to ours. Minetti and Zhu (2011) employ province-level
variables representing credit supply at the local level as instruments for strong rationing.48 Secchi et al.
(2012) use the lagged value of the �rm�s external score as an instrument in order to assess the impact of
credit constraints on �rm�s exporting performance and on unit values of traded products.47See Karaca-Mandic et al. (2012).48They follow Guiso et al. (2004).
21
In the following speci�cations we use the average external score obtained by �rms in the period 2002-
2006 as an instrument for our main explicative variable, the average score in the period 2008-2010. We
employ this variable assuming that external scores four to eight years before the survey, are not in�uenced
by the fact that a �rm declares to produce an upgraded version of its output for the foreign market in
2010. Moreover, we expect our instrument to be related to our dependent variable only through the
instrumented one: the lagged external score a¤ects quality upgrading only through its impact on the
average external score in the period 2008-2010 once controlling for our complete vector of covariates. In
Table 12, we report results obtained using our instrumental variable approach.
[Table 12 here]
This table reports the �rst and the second stage coe¢ cients of our speci�cations. We �nd that our
instrument is not weak given that it reports a high and signi�cant correlation with the endogenous variable.
Results con�rm that more constrained �rms are less likely to upgrade the quality of exported output while
larger ones have an advantage in pursuing this strategy. Firms with a high cash-�ow are more likely to
upgrade output quality, as well. Table 12 reports coe¢ cients and not marginal e¤ects at the means, we
then have to rely on Table 13 to assess how the magnitude of marginal e¤ects changes when addressing
endogeneity with IV.
[Table 13 here]
Results in speci�cation (1) show that the omitted variable bias was a¤ecting previous results. In
fact, the marginal e¤ect for the instrumented variable is now greater in magnitude and equal to -0.048,
a value that almost doubles the one obtained without instrumenting. The signi�cance of the estimated
regressor is however lower: 10%. In the second speci�cation we report coe¢ cients obtained running a two
stage least squares model on the same econometric model . We use this speci�cation to obtain a series
of important statistical tests on our estimations. First of all, our F-test of excluded instruments reports
a high F-statistic, showing us that excluded instruments are irrelevant. The Cragg-Donald Wald test F-
statistic is well above the Stock-Yogo weak-ID critical value and the endogeneity test con�rms that results
obtained when instrumenting are statistically di¤erent to the ones obtained without instrumenting. We
complete our investigation introducing another instrument for the average external score in the period
2008-2010. From our survey we have data on the number of banks from which the �rm obtains external
�nance in year 2010. Obtaining funds from a large number of banks in a crisis period might be a signal
of a reduction in credit availability from the principal �nancier, and this is particularly true for SMEs
that normally rely on a very limited number of creditors. Therefore, a higher number of creditors could
be a proxy for credit rationing. We expect that a higher number of creditors should be associated with
higher average external score in 2008-2010. In Table 14 we propose results obtained when using both the
number of banks and the average of the external score during 2002-2007 as instruments.
[Table 14 here]
In speci�cations (1) to (3) we report second stage coe¢ cients obtained when introducing our set of
controls by groups. Speci�cation (4) reports average marginal e¤ects estimated when using a two stage
22
least squares model. The coe¢ cient for our variable of interest is still negative but larger in magnitude
with respect to the one obtained in the previous table, the marginal e¤ect at the mean is now equal to:
-0.059. Tests report results comparable to the ones obtained for speci�cation reported in Table 13. For
this last estimation, we also report the Hansen-J statistic of the over-identi�cation test. Since we reject
its null-hypothesis, we can conclude that our instruments are valid.
Results reported in this section con�rm that credit constraints reduce the probability of quality up-
grading at the �rm level. We �rst �nd that, conditional on having the same labour-productivity, the �rm
whose credit availability was exogenously negatively a¤ected by the crisis is less likely to upgrade output
quality for the foreign market. Moreover, using IV, we estimate that the e¤ect of a worsening in credit
rationing is still negative but larger than the one reported in our main �ndings. Based on these results,
a standard deviation increase in the external score lowers the probability of quality upgrading by more
than 50 percent.49
6 Robustness Checks
Export Revenues. As reported in equation (15) of our theoretical framework, the ratio between thequality of exported output and the quality of output sold domestically depends, among other variables,
on Qki
Qii; the ratio between quality-adjusted demand in the destination, k and in the domestic market, i.
A higher demand in the export market raises incentives for a �rm to increase the quality of its exported
output with respect to the one sold domestically. In our data, it is possible to recover information on the
total turnover in the foreign market, and on revenues both in the foreign and in the domestic market, as of
2010. We use the �rst measure to generate a dummy variable for �rms declaring to obtain more than 75%
of their turnover abroad and the other two variables to compute a ratio between revenues in the export
market and total revenues. Following implications discussed above, we expect to �nd a positive impact of
these variables on the probability of producing an output of higher quality for the export market. Table
15 con�rms that this is indeed the case.
[Table 15 here]
In speci�cation (1) and (2) we observe that �rms obtaining more than 75% of their turnover in the
export market are more likely to increase the quality of their output. The marginal e¤ect at the means
of reporting a high turnover in the foreign market is positive and equal to 0.067, signi�cant at the 10%.
This result is con�rmed when introducing the external score, which reports a marginal e¤ect at the means
equal to -0.044, signi�cant at the 5%. Controlling for the share between revenues obtained in the export
market and revenues obtained in the domestic one, in (3) and (4), does not a¤ect our results. Firms
reporting higher revenues in the export market with respect to the ones obtained domestically are more
likely to export an output of higher quality, the marginal e¤ect is equal to 0.106 and it is signi�cant at
the 10%.
Firm Size. To further investigate on our main result, we now focus on how �rm-size, when interactedwith our proxy for credit constraint, impacts on export quality upgrading. Firm size is clearly a crucial
issue when a bank decides on whether to lend funds: large �rms might be perceived as safer debtors49To obtain this number, we multiply the average marginal e¤ect of the External Score, obtained in speci�cation (1) of
Table 14, by the ratio between its standard deviation and share of quality upgrading �rms in the estimation sample.
23

since they hold more collateralizable assets. Large �rms might also have stronger connections with credit
institutions simply because they require their services more often and in larger amounts than small �rms,
consequently the former might have an easier and cheaper access to external �nance. The following �gure,
reports on how �rm-size, proxied by the number of employees, a¤ects the probability of quality upgrading
for di¤erent credit scores.50 We estimate a probit model in which our dependent variable is regressed on
the usual set of controls and on a term interacting �rm size with the external score. This speci�cation
enables us to plot the marginal impact of an increase in �rm size for di¤erent values of the external score.
Figure 5 reports the marginal e¤ect of size on the probability of quality upgrading, conditioning on other
variables being at their means. Doing so, we are able to determine how size a¤ects quality upgrading.
The graph shows that the predicted probability of quality upgrading increases as the �rm becomes larger.
Figure 5. Firm Size, External Score and Probability of Quality Upgrading.
In the following table we report results obtained when interacting our proxy for credit constraints, the
external average score, with four �rm-size dummies. We divide �rms in four groups: (a) �rms with less
than 50 employees; (b) �rms with 50 to 99 employees; (c) �rms with 100 to 249 employees; and (d) �rms
with 250 to 499 employees.51 Results, as reported in Table 16, show that our interaction term reports a
negative signi�cant coe¢ cient for �rms having less than 50, 50-99 and 100-249 employees.
[Table 16 here]
To easily grasp results, we propose the following graphs reporting the change in the probability of
quality upgrading for �rms in the di¤erent size-groups.52 On the X axis we report the external score and
on the Y axis the di¤erence in probability. Marginal e¤ects are computed using average marginal impacts
at the means estimated in speci�cation 6 of Table 16. It is possible to observe that as the external score
worsens (i.e. increases), �rms having less than 50, 50 to 99 and 100 to 249 employees are less likely to
50Estimates not reported, available upon request.51The residual category is the group of �rms having 500 to 1387 employees, representing the 2% of �rms in our sample.52See Norton et al. (2004) and Karaca-Mandic et al (2012).
24

upgrade exported output quality. However, since the upper con�dence bound lies above the zero line,
results for �rms having more than 50 and less than 249 employees become less reliable for high values
of the external score. The graph for �rms having 250 to 499 employees shows that we cannot properly
draw conclusions on the relation between quality upgrading and our interaction term for this group of
�rms since the con�dence bounds lie above and below the zero line. Comparing the marginal e¤ects at
the means, we observe that the impact of a standard deviation increase in the external score on quality
upgrading is twice as large for �rms having less than 50 employees with respect to larger �rms.
Figure 6. External Score and Probability of Quality Upgrading, Di¤erent Firm Size.
Strongly Rationed Exporters. As shown in the previous section, our main explicative variable isa good predictor for a �rm declaring to be strongly rationed in the survey. However, the dummy variable
for strongly rationed �rms is a reliable measure of credit constraint since it is an information provided
directly by the �rm on its impossibility to obtain the desired amount of credit in the year preceding
the survey. This variable directly identi�es those �rms that demanded credit and did not obtain it in
year 2010. We introduce this variable in speci�cation (1a) of Table 17 as an alternative proxy for credit
constraint.
[Table 17 here]
As expected, this dummy variable enters our speci�cation with a negative signi�cant marginal e¤ect.53
We continue by introducing, in speci�cation (2a), our main explicative variable, average external score,
together with this dummy variable. Interestingly, when we consider both variables, only the average ex-
ternal score remains signi�cant and negatively correlated with the dependent variable. The external score
con�rms to be highly correlated with the "Strongly Rationed" dummy when predicting the probability
53At the 10%.
25
of quality upgrading. In speci�cation (3a) we introduce a variable representing the interaction between
the dummy variable and the external score in order to study the joint impact of these two variables. This
interaction is an important test for our empirical analysis since it uses the external measure of credit
rationing jointly with a proxy for credit rationing assessed at the �rm level and accounting for the mis-
match between credit demand and credit supply in 2010. We expect �rms declaring in the survey to be
strongly rationed and obtaining a higher score to be a¤ected. Results con�rm that strongly rationed �rms
reporting a high external score are less likely to upgrade quality.
External Finance Dependence. Manova (2013) followed by Fan et al. (2015) use an indicator ofdependence on external �nance at the industry level, based on US data, as a proxy for credit constraints.54
The rationale behind this choice being that a �rm operating in a speci�c industry needs on average a
certain amount of external funds given by the inherent characteristics of the production technology usually
employed in that industry. The ranking of �nance dependence across industries tends to be quite similar
across countries and, being based on US data, should not be in�uenced by �nancial markets�imperfections.
We introduce this variable to assess if the e¤ect of credit rationing on quality upgrading is mainly due to
industry level determinants of �nance dependence.
Speci�cations in part (b) of Table 18 show that industry �nance dependence reports non-signi�cant
marginal e¤ects when clustering standard errors at the province level. The positive sign, in our view,
might be a consequence of the fact that �rms operating in industries requiring large �nancial resources
are more likely to upgrade the quality of their products because of the peculiar characteristics of those
industries. For example, �rms producing electrical equipment, an industry highly dependent on external
�nancing, might need and be able to quality di¤erentiate across markets more often than producers of
tobacco. This measure, however, is unlikely to give any information on how costly or di¢ cult obtaining
external funds might be for a single �rm. In fact, when we introduce our explicative variable, average
external score, it reports the usual negative and signi�cant marginal e¤ect. In speci�cation (3b) we
introduce the interaction between external �nance dependence and the external score to study the joint
e¤ect of these two variables. The interaction term reports a negative non-signi�cant marginal impact
while our main explicative variable still enters with the usual negative and signi�cant coe¢ cient.
Quality within the �rm. In our main speci�cations we control for two variables usually consideredby the literature to be predictors of output quality: labour productivity and �rm size.55 In various
estimations we also control for the percentage of university graduates in the �rm�s labour force, supposing
that higher the human capital employed in the �rm, higher is the probability of quality upgrading. The
coe¢ cient for this variable is, yet, never signi�cant. From survey data we can recover information on
R&D practices pursued by the �rm in the three years before 2011. In speci�cation (1) of Table 18 we
insert a dummy for �rms declaring to invest a part of their revenues in R&D.
[Table 18 here]
The coe¢ cient for this variable enters this speci�cation with a negative non-signi�cant coe¢ cient,
while the coe¢ cient for our variable of interest does not change magnitude, sign and signi�cance. We
54This industry level indicator of �nance dependence has been proposed by Rajan and Zingales (1998).55See Veerhogen (2008), Minetti and Zhu (2011), Manova (2013).
26
continue our investigation introducing other proxies for �rm�s output quality. In speci�cation (2) we
control for R&D expenditure as a share of revenues, as declared by the �rm in the survey. This variable
enters with a negative signi�cant coe¢ cient: �rms that invest more in R&D produce a high-quality
output and are less likely to upgrade quality for the foreign market. In speci�cation (3) we insert two
dummies equal to one when a �rm has adopted, in the last-three years, an innovation that was new to the
�rm�s main destination market or that was new only for the �rm itself. We expect �rms that introduced
innovations for the export market to be more likely to upgrade output quality. In fact, the coe¢ cient for
this variable enters our speci�cation with a positive and signi�cant magnitude. The marginal e¤ect at the
means for innovation for the main market is equal to 0.114 and it is signi�cant at the 10%. In speci�cation
(4), following researches claiming that �rms producing output of higher quality are also capable to have
better economic performances compared to other �rms operating in the same sector, we control for a
�rm�s value-added in 2010.56 Results show that �rms reporting a high value-added are more likely to
pursue quality upgrading.
Our main explicative variable enters each of these speci�cations with the usual negative and signi�cant
coe¢ cient. The estimated marginal e¤ect varies form -0.029 to -0.045 and it is signi�cant at the 5% in
these speci�cations. Therefore, controlling for proxies of a �rm�s output position in the product quality-
ladder does not impact on the negative relation between our proxy for credit constraints and quality
upgrading: when the external score worsens a �rm is less likely to upgrade output quality.
7 Conclusion
We investigated the linkages between the choice to upgrade output quality for the foreign market and credit
rationing using survey data on a representative sample of Italian manufacturing SMEs. Ameliorating the
quality of exported output is an activity that requires signi�cant external resources, yet crucial in order
to guarantee constant revenues to a �rm. Our �ndings con�rm that the more binding credit constraints
are, the less likely a �rm is to increase the quality of its exported output. As predicted by our theoretical
framework, we �nd that the impact of credit rationing on quality upgrading is stronger on those �rms
that have higher incentives to pursue it, i.e. the ones exporting to distant markets.
Results are con�rmed when accounting for �rm size: small �rms are the ones more a¤ected by credit
constraints when taking the decision to upgrade output quality. We employ two di¤erent strategies in
order to address the endogeneity of our explicative variable, estimates con�rm our �ndings.
From a policy perspective, our study suggests that exporting �rms willing to upgrade output quality
are likely to su¤er the impact of credit rationing. Interestingly, these are the �rms that by obtaining
revenues from abroad would sustain domestic demand during economic downturns. Targeting exporting
SMEs with policies aimed at easing their access to external �nance and reducing costs associated with
exporting is therefore crucial.
56See Crinò and Epifani (2012) and Flach (2014).
27
References
[1] Albareto G. and Finaldi Russo P, 2012, "Fragilità �nanziaria e prospettive di crescita: il razionamento
del credito alle imprese durante la crisi," Questioni di Economia e Finanza, Banca d�Italia.
[2] Alchian, A. A. and Allen W. R., 1964, "University Economics," Wadsworth Publishing Company.
[3] Amiti, M., and Weinstein D. E., 2011, "Exports and Financial Shocks," Quarterly Journal of Eco-
nomics, Oxford University Press, vol. 126(4), pp. 1841-1877.
[4] Amiti, M. and Khandelwal, A. K., 2013, "Import Competition And Quality Upgrading," The Review
of Economics and Statistics, 95(2), pp. 476-90.
[5] Baldwin R., 2009, "The Great Trade Collapse: Causes, Consequences and Prospects, " VoxEU
Report, CEPR.
[6] Bernard A. B., Jensen J. B., Redding S. J. and Schott P.K., 2007, "Firms in International Trade,"
Journal of Economic Perspectives. 21(3), pp. 105-30.
[7] Bernini M., Bellone, F. and Guillou, S., 2013, "Firms�Leverage and Export Quality: Evidence from
France," GREDEG Working Paper N. 2013-29.
[8] Bustos, P., 2011, "Trade Liberalization, Exports, and Technology Upgrading: Evidence on the Impact
of MERCOSUR on Argentinian Firms," American Economic Review, 101(1), pp. 304-40.
[9] Canton, A., Grilob I., Monteagudo J. and Van der Zwan, P., 2013, "Perceived credit constraints in
the European Union," Small Business Economics, 41(3), pp. 701-715.
[10] Chaney T., 2005, "Liquidity Constrained Exporters," NBER Working Paper No. 19170.
[11] Cernat L., Norman-Lopez A. and T-Figueras A. D., 2014, "SMEs are more important than you think!
Challenges and Opportunities for EU exporting SMEs," Chief Economist Note no. 3, DG TRADE,
Brussels.
[12] Crinò R., and Epifani P., 2012, "Productivity, Quality and Export Behaviour," The Economic Jour-
nal, 22, pp. 1206-1243.
[13] Crinò R., and Ogliari L., 2015, "Financial Frictions, Product Quality, and International Trade,"
CEPR Discussion Paper 10555.
[14] ECB, 2013, �Box 6 �Small and Medium-Sized Enterprises in the Euro Area: Economic Importance
and Financing Conditions�, European Central Bank Monthly Bulletin, July.
[15] Fan H., Lai E. L. C and Li Y. A., 2015,"Credit constraints, quality, and export prices: Theory and
evidence from China," Journal of Comparative Economics, Elsevier, vol. 43(2), pages 390-416.
[16] Feenstra, R. and Romalis J., 2014, "International Prices and Endogenous Quality," Quarterly Journal
of Economics, Oxford University Press.
[17] Fieler, A. C., Eslava, M., and Xu, D., "Trade, Skills, and Quality Upgrading: A Theory with Evidence
from Colombia," NBER Working Paper No. 19992.
[18] Flach, L., 2014, "Quality Upgrading and Price Heterogeneity: Evidence from Brazilian Exporters,"
Working Paper, Department of Economics, University of Munich.
[19] Greenaway D., Guariglia A. and Kneller R., 2007, "Financial factors and exporting decisions," Jour-
nal of International Economics, 73(2), pp. 377-395.
[20] Guiso, L., Sapienza P. and Zingales L., 2004, "Does local �nancial development matter ?," Quarterly
Journal of Economics, Oxford University Press, 119, pp. 929-969.
28
[21] Hallak, J. C., 2006, "Product quality and the direction of trade," Journal of International Economics,
68 (1), pp. 238-265.
[22] Hallak, J. C. and Sivadasan, J., 2011, "Firms� Exporting Behavior under Quality Constraints,"
Working Paper 628, Research Seminar in International Economics, University of Michigan.
[23] Hummels, D. and Klenow, P. J. 2005, "The variety and quality of a nation�s exports," American
Economic Review, 95(3), pp. 704-723.
[24] Hummels, D. and Skiba, A., 2004, "Shipping the Good Apples Out? An Empirical Con�rmation of
the Alchian-Allen conjecture," Journal of Political Economy 112 (6), pp. 1384-1402.
[25] Khandelwal, A., 2010, "The Long and Short (of) Quality Ladders," Review of Economic Studies, 77
(4), pp. 1450-1476.
[26] Karaca-Mandic, P., Norton, E., Dowd, B., 2012, "Interaction terms in nonlinear models," Health
Services Research, 47, pp. 255-274.
[27] Kugler, M., and Verhoogen E., 2012, "Prices, Plant Size and Product Quality," Review of Economic
Studies, (79)1, pp. 307-339.
[28] Manova, K., 2013, "Credit Constraints, Heterogenous Firms and International Trade," Review of
Economic Studies, 80 pp.711-744.
[29] Martin, J., 2012, "Markups, Quality, and Transport Costs," European Economic Review, (56), pp.
777-79.
[30] Martin, J., and I. Mejean, 2014, �Low-Wage Country Competition and the Quality Content of
High-Wage Country Exports,�Journal of International Economics, Vol. 93-1: 140-15.
[31] Mayneris, F. and Martin, J, 2013, "High-End Variety Exporters Defying Distance: Micro Facts and
Macroeconomic Implications," IRES Discussion Paper 2013-27.
[32] Minetti, R., and Zhu, S. C., 2011, "Credit Constraints and �rm export: Microeconomic evidence
from Italy," Journal of International Economics, 83, pp. 109-125.
[33] Muûls, M., 2015, "Exporters, Importers and Credit Constraints," Journal of International Eco-
nomics, 95(2), pp. 333�343.
[34] Norton, E., Wang H. and Ai C., 2004, "Computing interactions e¤ects and standard errors in logit
and probit models," The Stata Journal, 4 Number 2, pp. 154-167.
[35] Panetta, F., Schivardi F., and Shum M., 2009, "Do Mergers Improve Information? Evidence from
the Loan Market," Journal of Money, Credit and Banking, 41(4), pp. 673-709.
[36] Rajan, R. G. and Zingales L., 1998, "Financial dependence and Growth," The American Economic
Review Vol. 88, No. 3, pp. 559-586.
[37] Rodano, G., Serrano-Velarde N. and Tarantino, E., 2012, "Bankruptcy law and the cost of banking
�nance," Journal of Financial Economics, forthcoming. WP12/18, Oxford University Centre for
Business Taxation.
[38] Schott, P. K., 2004, "Across-product Versus Within-product Specialization in International Trade,"
The Quarterly Journal of Economics, MIT Press, vol. 119(2), pp. 646-677.
[39] Secchi, A., Tamagni F. and Tomasi C., 2012, "Export activities under �nancial constraints: margins,
quantities and prices," Development Working Papers 338, Centro Studi Luca d�Agliano, University
of Milano.
29

[40] Sutton, J., 2001, "Technology and Market Structure: Theory and History, " The MIT Press.
[41] Sutton, J., 2007, "Sunk Costs and Market Structure: Price Competition, Advertising, and the Evo-
lution of Concentration, " The MIT Press.
[42] Verhoogen, E. A., 2008, "Trade, Quality Upgrading and Wage Inequality in the Mexican Manufac-
turing Sector," Quarterly Journal of Economics, MIT Press, vol. 123(2), pp. 489-530.
30
8 Appendix: Solving the Pro�t Maximization Problem in the Feenstra-Romalis(2014) Model
The pro�t maximization problem for a �rm producing in country i and exporting to country k reads as
follows:
maxzkij
24Pkij � �ki�cij(z
kij ; wi) + T
ki
�zkij
35Qki � f kwi�zkij
� 1
zkij
subject to,
�
8<:24Pkij � �ki
�cij(z
kij ; wi) + T
ki
�zkij
35Qki9=; � f k
wi
�zkij
� 1
zkij:
We can write the following Lagrangian:
MaxPij;zkij
L=
8><>:24Pkij � �ki
�cij(z
kij ; wi) + T
ki
�zkij
35Qki � f kwi�zkij
� 1
zkij
9>=>;+ (1a)
+�
8><>:�24Pkij � �ki
�cij(z
kij ; wi) + T
ki
�zkij
35Qki � f kwi�zkij
� 1
zkij
9>=>; :The FOC with respect to zkij reads as follows:
(1 + ��)�ki
"@cij(z
kij ; wi)
@zkij
�zkij
��1��zkij
��2(cij(z
kij ; wi) + T
ki )
#Qki (2a)
=�(1 + �)z�1ij fkijwi
�zkij
� 1 �1�1
� 1
�;
dividing both sides by�zkij
��1
(1 + ��)�ki
"@cij(z
kij ; wi)
@zkij��zkij
��1(cij(z
kij ; wi) + T
ki )
#Qki
=�(1 + �)z�1ij fkijwi
�zkij
� 1 �1�1
� 1
�:
Since cij(zkij ; wi) =wi(z
kij)
1=
'ijand
@cij(zkij ;wi)
@zkij=
wi(zkij)
1= �1
'ij;
31
(1 + ��)�ki
"wi(z
kij)1= �1
'ij��zkij
��1 wi(zkij)1= 'ij
+ T ki
!#Qki (3a)
=�(1 + �)�zkij
��1f kijwi
�zkij
� 1 �1�1
� 1�:
Diving both sides by�zkij
��1, after some algebraic manipulations we can solve for optimal output quality
in the foreign market,
(zkij)1= =
�ki Tki Q
ki�
1 � 1
�wi
h�ki
1'ijQki +
(1+�)(1+��) f
ki : (4a)
Now, suppose as in Feestra-Romalis (2014) an expenditure function of the CES form:
Ek = Uk�Zi
�pki =z
kij
�1��di
� 11��
: (5a)
That, given the de�nition for the quality-adjusted price, Pki =pkizkijbecomes,
Ek = Uk�Zi
�Pki
�1��di
� 11��
; (6a)
so that Qki (Pij) = Eki (P
k1 ; :::P
kN ; U
k). Rewriting our Lagrangian accordingly:
MaxPij;zkij
L=
8><>:24Pkij � �ki
�cij(z
kij ; wi) + T
ki
�zkij
35Qki (Pij)� f kwi�zkij
� 1
zkij
9>=>;+ (7a)
+�
8><>:�8<:24Pkij � �ki
�cij(z
kij ; wi) + T
ki
�zkij
35Qki (Pij)9=;� f kwi
�zkij
� 1
zkij
9>=>; :The FOC with respect to Pij reads as follows,24Qki (Pij) + @Qki (Pij)@Pij
Pij � �ki
�cij(z
kij ; wi) + T
ki
�zkij
@Qki (Pij)
@Pij
35 (1 + ��) = 0; (8a)
dividing by (1 + ��) and rearranging, we obtain,24Qki (Pij) + @Qki (Pij)@PijPij = �
ki
�cij(z
kij ; wi) + T
ki
�zkij
@Qki (Pij)
@Pij
35 (9a)
divide now by Qki (Pij) and use�@Qk
i (Pij)@Pij
PijQki
= �; to �nd:
32
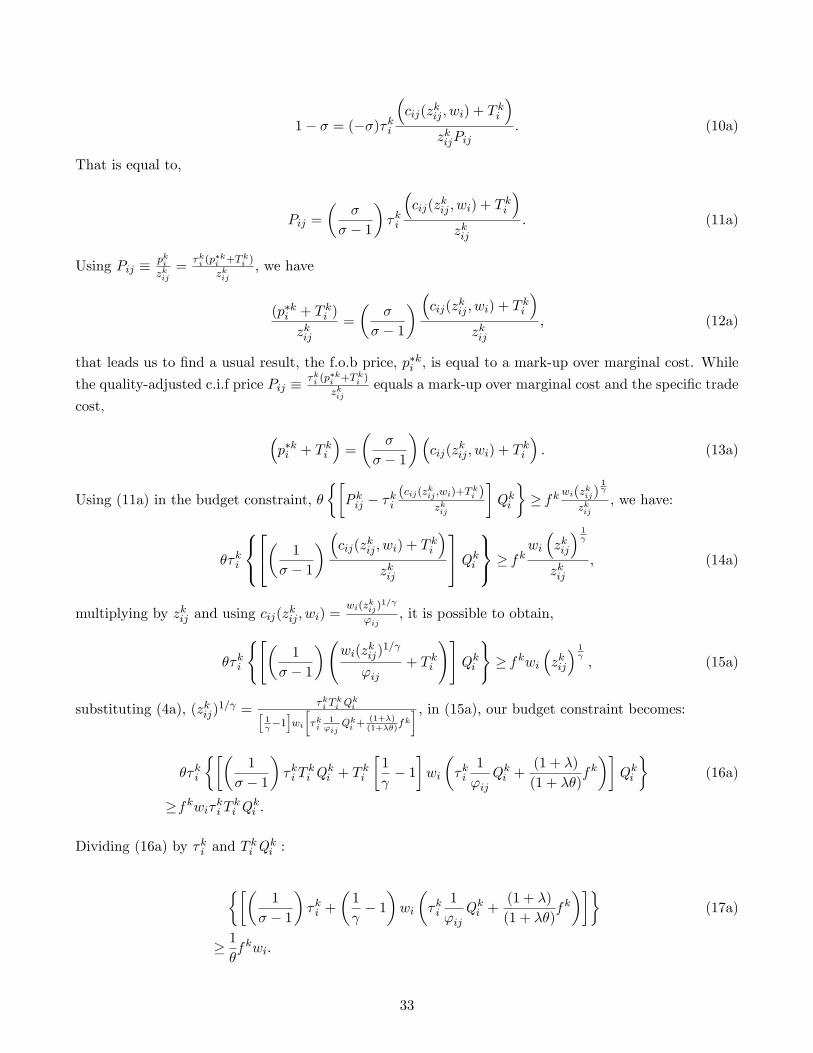
1� � = (��)�ki
�cij(z
kij ; wi) + T
ki
�zkijPij
: (10a)
That is equal to,
Pij =
��
� � 1
��ki
�cij(z
kij ; wi) + T
ki
�zkij
: (11a)
Using Pij � pkizkij=
�ki (p�ki +T
ki )
zkij; we have
(p�ki + T ki )
zkij=
��
� � 1
� �cij(zkij ; wi) + T ki �zkij
; (12a)
that leads us to �nd a usual result, the f.o.b price, p�ki ; is equal to a mark-up over marginal cost. While
the quality-adjusted c.i.f price Pij � �ki (p�ki +T
ki )
zkijequals a mark-up over marginal cost and the speci�c trade
cost,
�p�ki + T ki
�=
��
� � 1
��cij(z
kij ; wi) + T
ki
�: (13a)
Using (11a) in the budget constraint, ���Pkij � �ki
(cij(zkij ;wi)+Tki )zkij
�Qki
�� f k wi(z
kij)
1
zkij; we have:
��ki
8<:24� 1
� � 1
� �cij(zkij ; wi) + T ki �zkij
35Qki9=; � f k
wi
�zkij
� 1
zkij; (14a)
multiplying by zkij and using cij(zkij ; wi) =
wi(zkij)
1=
'ij; it is possible to obtain,
��ki
("�1
� � 1
� wi(z
kij)1=
'ij+ T ki
!#Qki
)� f kwi
�zkij
� 1 ; (15a)
substituting (4a), (zkij)1= =
�ki Tki Q
kih
1 �1iwi
��ki
1'ij
Qki +
(1+�)(1+��)
f k� ; in (15a), our budget constraint becomes:
��ki
���1
� � 1
��ki T
ki Q
ki + T
ki
�1
� 1�wi
��ki
1
'ijQki +
(1 + �)
(1 + ��)f k��Qki
�(16a)
� f kwi�ki T ki Qki :
Dividing (16a) by �ki and Tki Q
ki :
���1
� � 1
��ki +
�1
� 1�wi
��ki
1
'ijQki +
(1 + �)
(1 + ��)f k���
(17a)
� 1�f kwi:
33
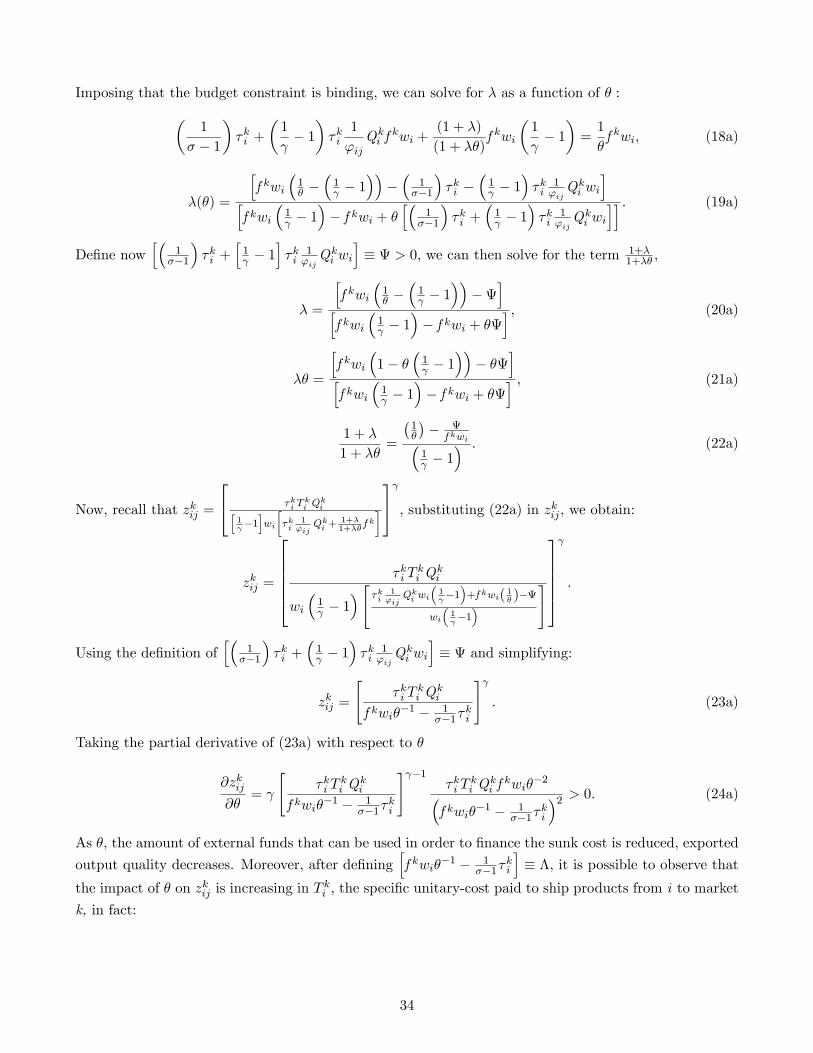
Imposing that the budget constraint is binding, we can solve for � as a function of � :�1
� � 1
��ki +
�1
� 1��ki
1
'ijQki f
kwi +(1 + �)
(1 + ��)f kwi
�1
� 1�=1
�f kwi; (18a)
�(�) =
hf kwi
�1� �
�1 � 1
����
1��1
��ki �
�1 � 1
��ki
1'ijQki wi
ihf kwi
�1 � 1
�� f kwi + �
h�1��1
��ki +
�1 � 1
��ki
1'ijQki wi
ii : (19a)
De�ne nowh�
1��1
��ki +
h1 � 1
i�ki
1'ijQki wi
i� > 0; we can then solve for the term 1+�
1+�� ,
� =
hf kwi
�1� �
�1 � 1
���
ihf kwi
�1 � 1
�� f kwi + �
i ; (20a)
�� =
hf kwi
�1� �
�1 � 1
��� �
ihf kwi
�1 � 1
�� f kwi + �
i ; (21a)
1 + �
1 + ��=
�1�
��
f kwi�1 � 1
� : (22a)
Now, recall that zkij =
24 �ki Tki Q
kih
1 �1iwi
��ki
1'ij
Qki +
1+�1+��
f k�35 , substituting (22a) in zkij ; we obtain:
zkij =
266664 �ki Tki Q
ki
wi
�1 � 1
�" �ki 1'ij
Qki wi
�1 �1�+f kwi( 1� )�
wi
�1 �1�
#377775
:
Using the de�nition ofh�
1��1
��ki +
�1 � 1
��ki
1'ijQki wi
i� and simplifying:
zkij =
"�ki T
ki Q
ki
f kwi��1 � 1
��1�ki
# : (23a)
Taking the partial derivative of (23a) with respect to �
@zkij@�
=
"�ki T
ki Q
ki
f kwi��1 � 1
��1�ki
# �1�ki T
ki Q
ki fkwi�
�2�f kwi�
�1 � 1��1�
ki
�2 > 0: (24a)
As �, the amount of external funds that can be used in order to �nance the sunk cost is reduced, exported
output quality decreases. Moreover, after de�ninghf kwi�
�1 � 1��1�
ki
i� �; it is possible to observe that
the impact of � on zkij is increasing in Tki ; the speci�c unitary-cost paid to ship products from i to market
k, in fact:
34
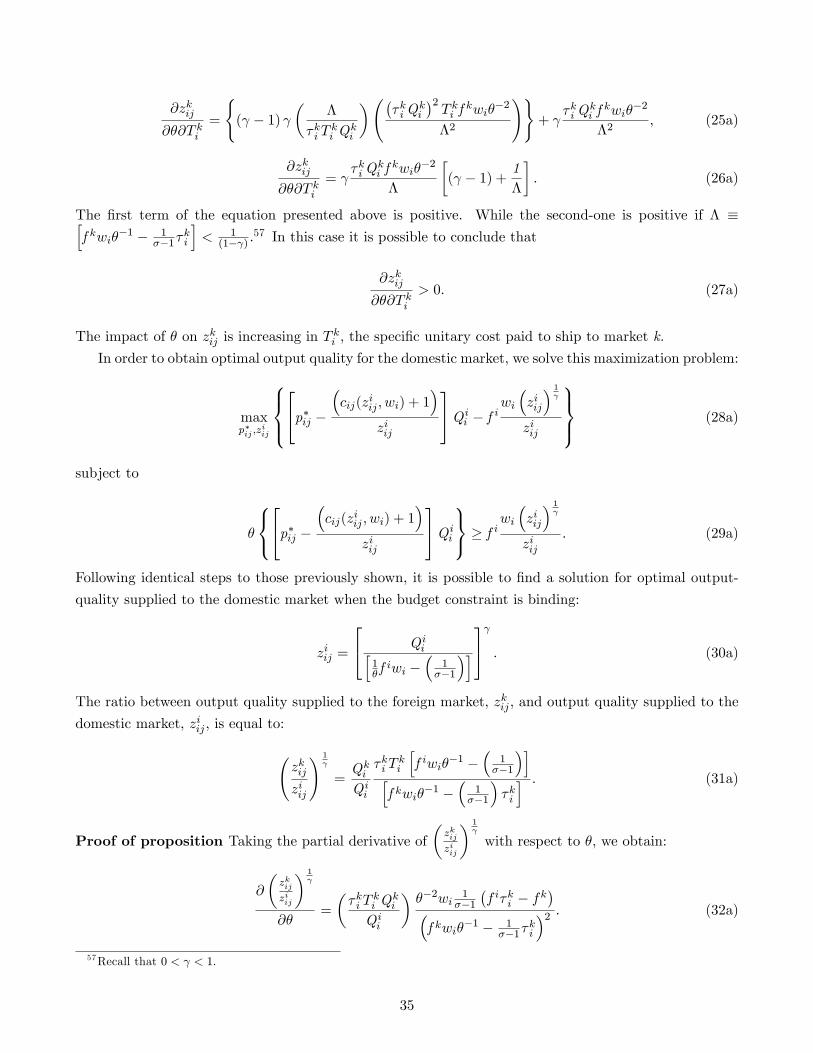
@zkij
@�@T ki=
(( � 1)
��
�ki Tki Q
ki
� ��kiQ
ki
�2T ki f
kwi��2
�2
!)+
�kiQki fkwi�
�2
�2; (25a)
@zkij
@�@T ki=
�kiQki fkwi�
�2
�
�( � 1) + 1
�
�: (26a)
The �rst term of the equation presented above is positive. While the second-one is positive if � �hf kwi�
�1 � 1��1�
ki
i< 1
(1� ) .57 In this case it is possible to conclude that
@zkij
@�@T ki> 0: (27a)
The impact of � on zkij is increasing in Tki ; the speci�c unitary cost paid to ship to market k.
In order to obtain optimal output quality for the domestic market, we solve this maximization problem:
maxp�ij ;z
iij
8><>:24p�ij �
�cij(z
iij ; wi) + 1
�ziij
35Q ii � f iwi�ziij
� 1
ziij
9>=>; (28a)
subject to
�
8<:24p�ij �
�cij(z
iij ; wi) + 1
�ziij
35Q ii9=; � f i
wi
�ziij
� 1
ziij: (29a)
Following identical steps to those previously shown, it is possible to �nd a solution for optimal output-
quality supplied to the domestic market when the budget constraint is binding:
ziij =
24 Q iih1� fiwi �
�1��1
�i35 : (30a)
The ratio between output quality supplied to the foreign market, zkij ; and output quality supplied to the
domestic market, ziij , is equal to: zkijziij
! 1
=QkiQ ii
�ki Tki
hf iwi�
�1 ��
1��1
�ihf kwi�
�1 ��
1��1
��ki
i : (31a)
Proof of proposition Taking the partial derivative of�zkijziij
� 1
with respect to �; we obtain:
@
�zkijziij
� 1
@�=
��ki T
ki Q
ki
Q ii
���2wi
1��1
�f i�ki � fk
��f kwi�
�1 � 1��1�
ki
�2 : (32a)
57Recall that 0 < < 1:
35

This term is positive when fk < �ki fi: An increase in � leads to an increase in the ratio between
output quality supplied to the foreign market and output quality supplied to the domestic market.
Proof of proposition 2. Taking the partial derivative of (32a) with respect to T ki , we obtain:
@
�zkijziij
� 1
@�@T ki=
��kiQ
ki
Q ii
���2wi
1��1
�f i�ki � fk
��f kwi�
�1 � 1��1�
ki
�2 : (33a)
This term is positive provided that fk < �ki fi: The impact of an increase in � on the output-quality
ratio is increasing in T ki ; the term proportional to distance to the foreign market. Greater the distance,
higher the impact of credit availability, �, on the output-quality ratio.
36
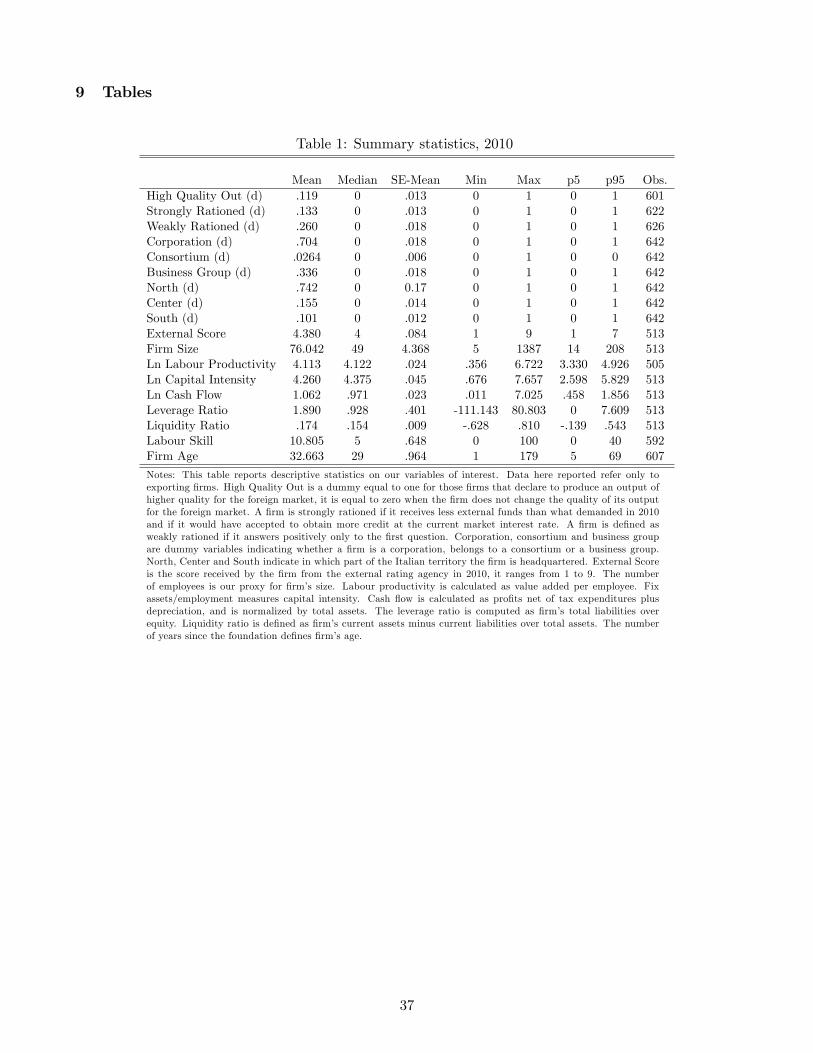
9 Tables
Table 1: Summary statistics, 2010
Mean Median SE-Mean Min Max p5 p95 Obs.High Quality Out (d) .119 0 .013 0 1 0 1 601Strongly Rationed (d) .133 0 .013 0 1 0 1 622Weakly Rationed (d) .260 0 .018 0 1 0 1 626Corporation (d) .704 0 .018 0 1 0 1 642Consortium (d) .0264 0 .006 0 1 0 0 642Business Group (d) .336 0 .018 0 1 0 1 642North (d) .742 0 0.17 0 1 0 1 642Center (d) .155 0 .014 0 1 0 1 642South (d) .101 0 .012 0 1 0 1 642External Score 4.380 4 .084 1 9 1 7 513Firm Size 76.042 49 4.368 5 1387 14 208 513Ln Labour Productivity 4.113 4.122 .024 .356 6.722 3.330 4.926 505Ln Capital Intensity 4.260 4.375 .045 .676 7.657 2.598 5.829 513Ln Cash Flow 1.062 .971 .023 .011 7.025 .458 1.856 513Leverage Ratio 1.890 .928 .401 -111.143 80.803 0 7.609 513Liquidity Ratio .174 .154 .009 -.628 .810 -.139 .543 513Labour Skill 10.805 5 .648 0 100 0 40 592Firm Age 32.663 29 .964 1 179 5 69 607
Notes: This table reports descriptive statistics on our variables of interest. Data here reported refer only toexporting �rms. High Quality Out is a dummy equal to one for those �rms that declare to produce an output ofhigher quality for the foreign market, it is equal to zero when the �rm does not change the quality of its outputfor the foreign market. A �rm is strongly rationed if it receives less external funds than what demanded in 2010and if it would have accepted to obtain more credit at the current market interest rate. A �rm is de�ned asweakly rationed if it answers positively only to the �rst question. Corporation, consortium and business groupare dummy variables indicating whether a �rm is a corporation, belongs to a consortium or a business group.North, Center and South indicate in which part of the Italian territory the �rm is headquartered. External Scoreis the score received by the �rm from the external rating agency in 2010, it ranges from 1 to 9. The numberof employees is our proxy for �rm�s size. Labour productivity is calculated as value added per employee. Fixassets/employment measures capital intensity. Cash �ow is calculated as pro�ts net of tax expenditures plusdepreciation, and is normalized by total assets. The leverage ratio is computed as �rm�s total liabilities overequity. Liquidity ratio is de�ned as �rm�s current assets minus current liabilities over total assets. The numberof years since the foundation de�nes �rm�s age.
37
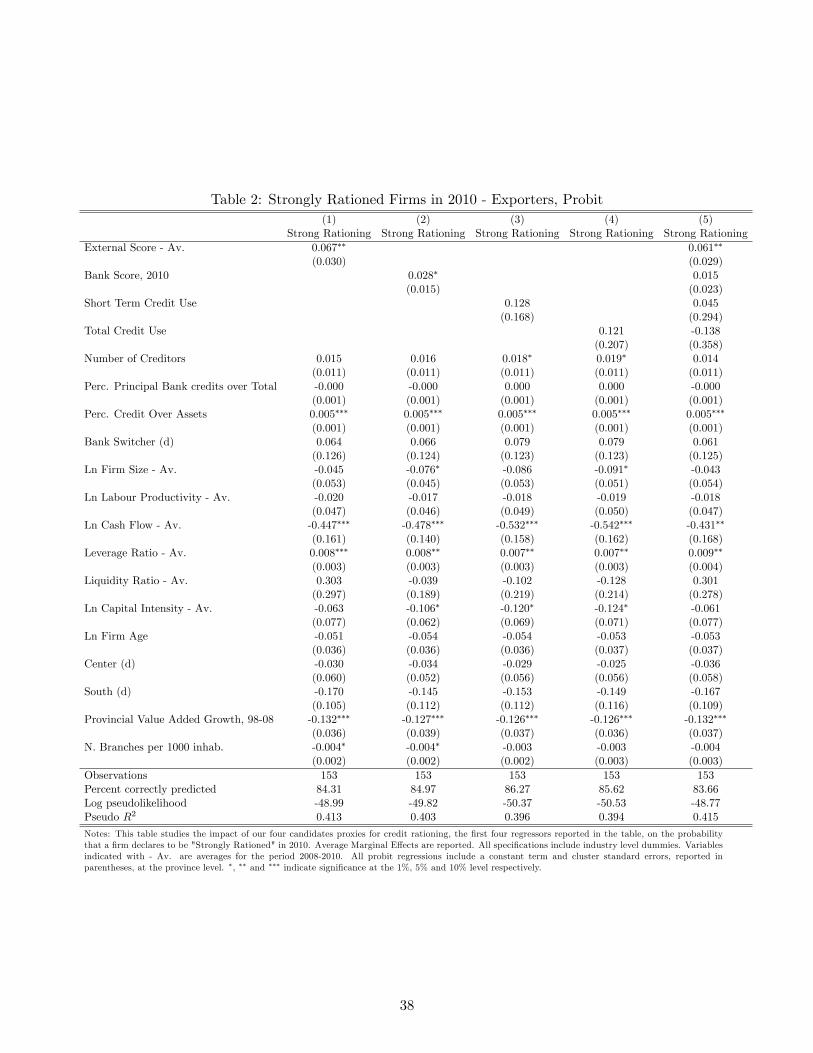
Table 2: Strongly Rationed Firms in 2010 - Exporters, Probit(1) (2) (3) (4) (5)
Strong Rationing Strong Rationing Strong Rationing Strong Rationing Strong RationingExternal Score - Av. 0.067�� 0.061��
(0.030) (0.029)Bank Score, 2010 0.028� 0.015
(0.015) (0.023)Short Term Credit Use 0.128 0.045
(0.168) (0.294)Total Credit Use 0.121 -0.138
(0.207) (0.358)Number of Creditors 0.015 0.016 0.018� 0.019� 0.014
(0.011) (0.011) (0.011) (0.011) (0.011)Perc. Principal Bank credits over Total -0.000 -0.000 0.000 0.000 -0.000
(0.001) (0.001) (0.001) (0.001) (0.001)Perc. Credit Over Assets 0.005��� 0.005��� 0.005��� 0.005��� 0.005���
(0.001) (0.001) (0.001) (0.001) (0.001)Bank Switcher (d) 0.064 0.066 0.079 0.079 0.061
(0.126) (0.124) (0.123) (0.123) (0.125)Ln Firm Size - Av. -0.045 -0.076� -0.086 -0.091� -0.043
(0.053) (0.045) (0.053) (0.051) (0.054)Ln Labour Productivity - Av. -0.020 -0.017 -0.018 -0.019 -0.018
(0.047) (0.046) (0.049) (0.050) (0.047)Ln Cash Flow - Av. -0.447��� -0.478��� -0.532��� -0.542��� -0.431��
(0.161) (0.140) (0.158) (0.162) (0.168)Leverage Ratio - Av. 0.008��� 0.008�� 0.007�� 0.007�� 0.009��
(0.003) (0.003) (0.003) (0.003) (0.004)Liquidity Ratio - Av. 0.303 -0.039 -0.102 -0.128 0.301
(0.297) (0.189) (0.219) (0.214) (0.278)Ln Capital Intensity - Av. -0.063 -0.106� -0.120� -0.124� -0.061
(0.077) (0.062) (0.069) (0.071) (0.077)Ln Firm Age -0.051 -0.054 -0.054 -0.053 -0.053
(0.036) (0.036) (0.036) (0.037) (0.037)Center (d) -0.030 -0.034 -0.029 -0.025 -0.036
(0.060) (0.052) (0.056) (0.056) (0.058)South (d) -0.170 -0.145 -0.153 -0.149 -0.167
(0.105) (0.112) (0.112) (0.116) (0.109)Provincial Value Added Growth, 98-08 -0.132��� -0.127��� -0.126��� -0.126��� -0.132���
(0.036) (0.039) (0.037) (0.036) (0.037)N. Branches per 1000 inhab. -0.004� -0.004� -0.003 -0.003 -0.004
(0.002) (0.002) (0.002) (0.003) (0.003)Observations 153 153 153 153 153Percent correctly predicted 84.31 84.97 86.27 85.62 83.66Log pseudolikelihood -48.99 -49.82 -50.37 -50.53 -48.77Pseudo R2 0.413 0.403 0.396 0.394 0.415
Notes: This table studies the impact of our four candidates proxies for credit rationing, the �rst four regressors reported in the table, on the probabilitythat a �rm declares to be "Strongly Rationed" in 2010. Average Marginal E¤ects are reported. All speci�cations include industry level dummies. Variablesindicated with - Av. are averages for the period 2008-2010. All probit regressions include a constant term and cluster standard errors, reported inparentheses, at the province level. �, �� and ��� indicate signi�cance at the 1%, 5% and 10% level respectively.
38
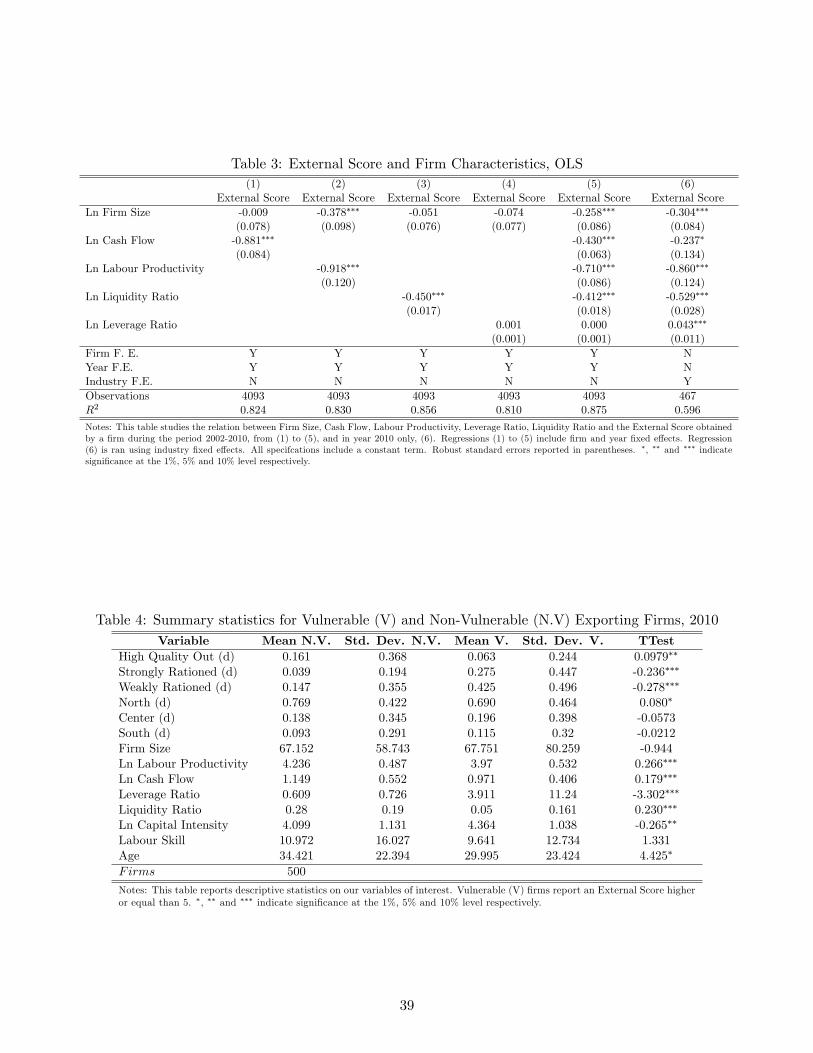
Table 3: External Score and Firm Characteristics, OLS(1) (2) (3) (4) (5) (6)
External Score External Score External Score External Score External Score External ScoreLn Firm Size -0.009 -0.378��� -0.051 -0.074 -0.258��� -0.304���
(0.078) (0.098) (0.076) (0.077) (0.086) (0.084)Ln Cash Flow -0.881��� -0.430��� -0.237�
(0.084) (0.063) (0.134)Ln Labour Productivity -0.918��� -0.710��� -0.860���
(0.120) (0.086) (0.124)Ln Liquidity Ratio -0.450��� -0.412��� -0.529���
(0.017) (0.018) (0.028)Ln Leverage Ratio 0.001 0.000 0.043���
(0.001) (0.001) (0.011)Firm F. E. Y Y Y Y Y NYear F.E. Y Y Y Y Y NIndustry F.E. N N N N N YObservations 4093 4093 4093 4093 4093 467R2 0.824 0.830 0.856 0.810 0.875 0.596
Notes: This table studies the relation between Firm Size, Cash Flow, Labour Productivity, Leverage Ratio, Liquidity Ratio and the External Score obtainedby a �rm during the period 2002-2010, from (1) to (5), and in year 2010 only, (6). Regressions (1) to (5) include �rm and year �xed e¤ects. Regression(6) is ran using industry �xed e¤ects. All specifcations include a constant term. Robust standard errors reported in parentheses. �, �� and ��� indicatesigni�cance at the 1%, 5% and 10% level respectively.
Table 4: Summary statistics for Vulnerable (V) and Non-Vulnerable (N.V) Exporting Firms, 2010Variable Mean N.V. Std. Dev. N.V. Mean V. Std. Dev. V. TTest
High Quality Out (d) 0.161 0.368 0.063 0.244 0.0979��
Strongly Rationed (d) 0.039 0.194 0.275 0.447 -0.236���
Weakly Rationed (d) 0.147 0.355 0.425 0.496 -0.278���
North (d) 0.769 0.422 0.690 0.464 0.080�
Center (d) 0.138 0.345 0.196 0.398 -0.0573South (d) 0.093 0.291 0.115 0.32 -0.0212Firm Size 67.152 58.743 67.751 80.259 -0.944Ln Labour Productivity 4.236 0.487 3.97 0.532 0.266���
Ln Cash Flow 1.149 0.552 0.971 0.406 0.179���
Leverage Ratio 0.609 0.726 3.911 11.24 -3.302���
Liquidity Ratio 0.28 0.19 0.05 0.161 0.230���
Ln Capital Intensity 4.099 1.131 4.364 1.038 -0.265��
Labour Skill 10.972 16.027 9.641 12.734 1.331Age 34.421 22.394 29.995 23.424 4.425�
Firms 500
Notes: This table reports descriptive statistics on our variables of interest. Vulnerable (V) �rms report an External Score higheror equal than 5. �, �� and ��� indicate signi�cance at the 1%, 5% and 10% level respectively.
39
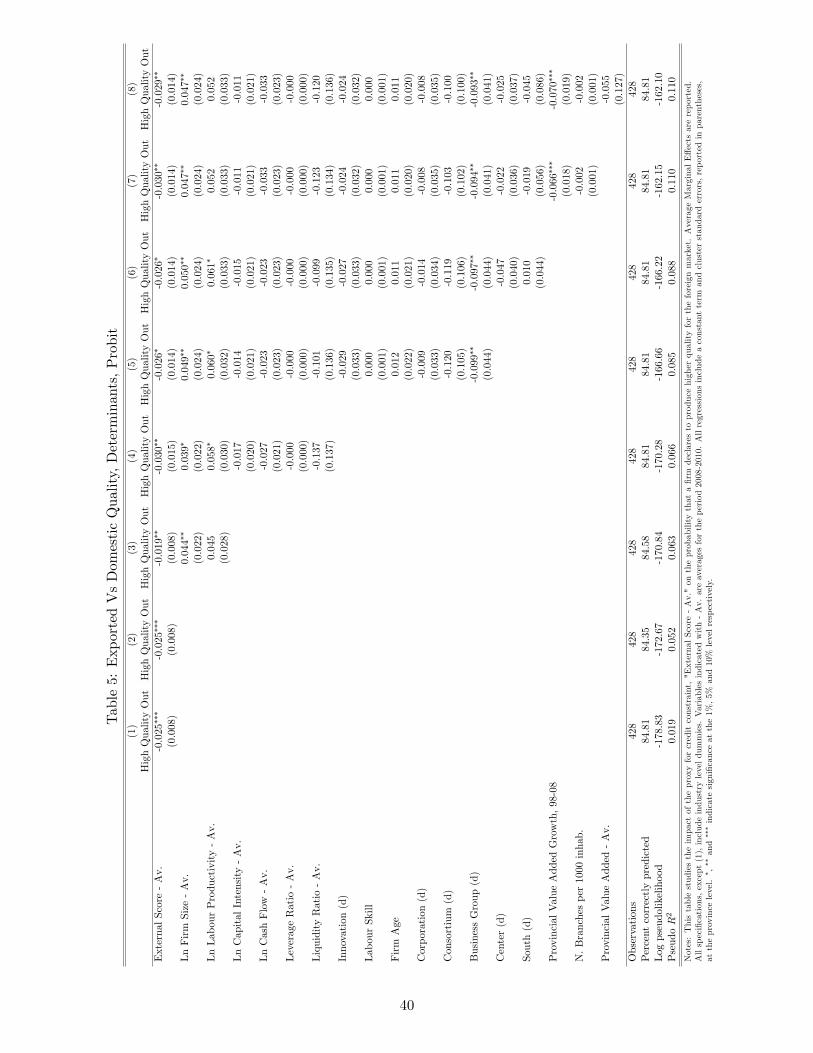
Table5:ExportedVsDomesticQuality,Determinants,Probit
(1)
(2)
(3)
(4)
(5)
(6)
(7)
(8)
HighQualityOut
HighQualityOut
HighQualityOut
HighQualityOut
HighQualityOut
HighQualityOut
HighQualityOut
HighQualityOut
ExternalScore-Av.
-0.025���
-0.025���
-0.019��
-0.030��
-0.026�
-0.026�
-0.030��
-0.029��
(0.008)
(0.008)
(0.008)
(0.015)
(0.014)
(0.014)
(0.014)
(0.014)
LnFirmSize-Av.
0.044��
0.039�
0.049��
0.050��
0.047��
0.047��
(0.022)
(0.022)
(0.024)
(0.024)
(0.024)
(0.024)
LnLabourProductivity-Av.
0.045
0.058�
0.060�
0.061�
0.052
0.052
(0.028)
(0.030)
(0.032)
(0.033)
(0.033)
(0.033)
LnCapitalIntensity-Av.
-0.017
-0.014
-0.015
-0.011
-0.011
(0.020)
(0.021)
(0.021)
(0.021)
(0.021)
LnCashFlow-Av.
-0.027
-0.023
-0.023
-0.033
-0.033
(0.021)
(0.023)
(0.023)
(0.023)
(0.023)
LeverageRatio-Av.
-0.000
-0.000
-0.000
-0.000
-0.000
(0.000)
(0.000)
(0.000)
(0.000)
(0.000)
LiquidityRatio-Av.
-0.137
-0.101
-0.099
-0.123
-0.120
(0.137)
(0.136)
(0.135)
(0.134)
(0.136)
Innovation(d)
-0.029
-0.027
-0.024
-0.024
(0.033)
(0.033)
(0.032)
(0.032)
LabourSkill
0.000
0.000
0.000
0.000
(0.001)
(0.001)
(0.001)
(0.001)
FirmAge
0.012
0.011
0.011
0.011
(0.022)
(0.021)
(0.020)
(0.020)
Corporation(d)
-0.009
-0.014
-0.008
-0.008
(0.033)
(0.034)
(0.035)
(0.035)
Consortium(d)
-0.120
-0.119
-0.103
-0.100
(0.105)
(0.106)
(0.102)
(0.100)
BusinessGroup(d)
-0.099��
-0.097��
-0.094��
-0.093��
(0.044)
(0.044)
(0.041)
(0.041)
Center(d)
-0.047
-0.022
-0.025
(0.040)
(0.036)
(0.037)
South(d)
0.010
-0.019
-0.045
(0.044)
(0.056)
(0.086)
ProvincialValueAddedGrowth,98-08
-0.066���
-0.070���
(0.018)
(0.019)
N.Branchesper1000inhab.
-0.002
-0.002
(0.001)
(0.001)
ProvincialValueAdded-Av.
-0.055
(0.127)
Observations
428
428
428
428
428
428
428
428
Percentcorrectlypredicted
84.81
84.35
84.58
84.81
84.81
84.81
84.81
84.81
Logpseudolikelihood
-178.83
-172.67
-170.84
-170.28
-166.66
-166.22
-162.15
-162.10
PseudoR2
0.019
0.052
0.063
0.066
0.085
0.088
0.110
0.110
Notes:Thistablestudiestheimpactoftheproxyforcreditconstraint,"ExternalScore-Av."ontheprobabilitythata�rmdeclarestoproducehigherqualityfortheforeignmarket.AverageMarginalE¤ectsarereported.
Allspeci�cations,except(1),includeindustryleveldummies.Variablesindicatedwith-Av.areaveragesfortheperiod2008-2010.Allregressionsincludeaconstantterm
andclusterstandarderrors,reportedinparentheses,
attheprovincelevel.
�,��and���indicatesigni�canceatthe1%,5%
and10%levelrespectively.
40
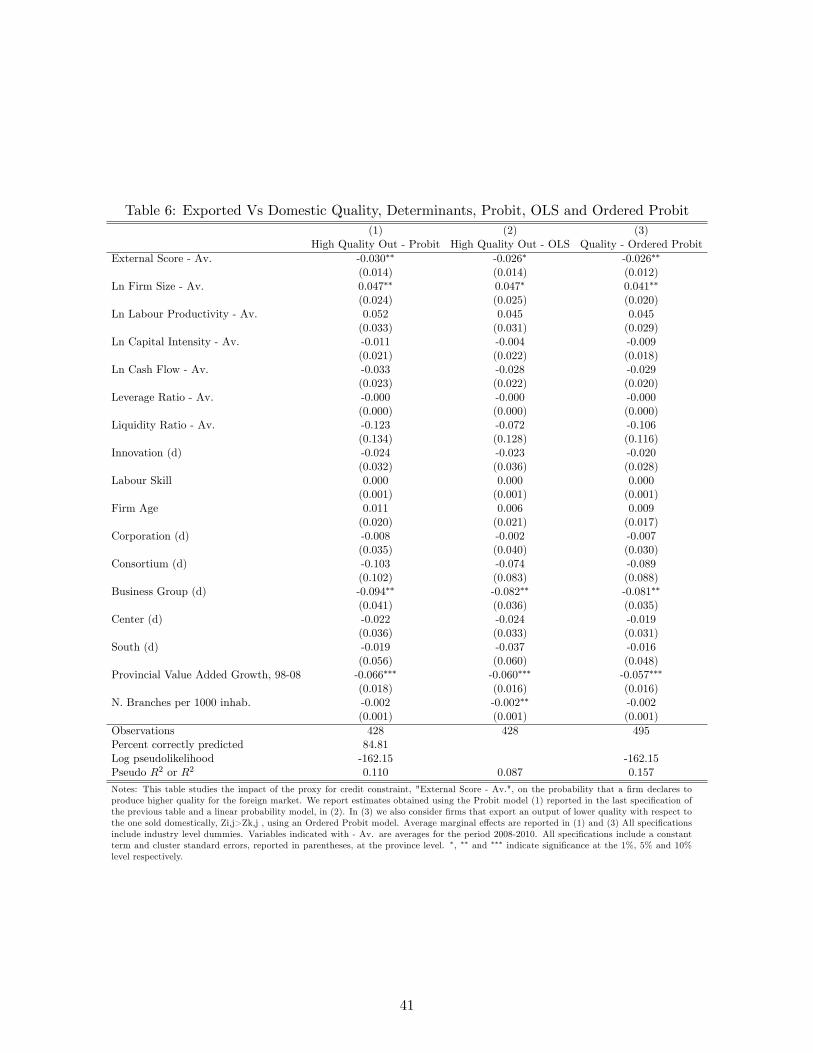
Table 6: Exported Vs Domestic Quality, Determinants, Probit, OLS and Ordered Probit(1) (2) (3)
High Quality Out - Probit High Quality Out - OLS Quality - Ordered ProbitExternal Score - Av. -0.030�� -0.026� -0.026��
(0.014) (0.014) (0.012)Ln Firm Size - Av. 0.047�� 0.047� 0.041��
(0.024) (0.025) (0.020)Ln Labour Productivity - Av. 0.052 0.045 0.045
(0.033) (0.031) (0.029)Ln Capital Intensity - Av. -0.011 -0.004 -0.009
(0.021) (0.022) (0.018)Ln Cash Flow - Av. -0.033 -0.028 -0.029
(0.023) (0.022) (0.020)Leverage Ratio - Av. -0.000 -0.000 -0.000
(0.000) (0.000) (0.000)Liquidity Ratio - Av. -0.123 -0.072 -0.106
(0.134) (0.128) (0.116)Innovation (d) -0.024 -0.023 -0.020
(0.032) (0.036) (0.028)Labour Skill 0.000 0.000 0.000
(0.001) (0.001) (0.001)Firm Age 0.011 0.006 0.009
(0.020) (0.021) (0.017)Corporation (d) -0.008 -0.002 -0.007
(0.035) (0.040) (0.030)Consortium (d) -0.103 -0.074 -0.089
(0.102) (0.083) (0.088)Business Group (d) -0.094�� -0.082�� -0.081��
(0.041) (0.036) (0.035)Center (d) -0.022 -0.024 -0.019
(0.036) (0.033) (0.031)South (d) -0.019 -0.037 -0.016
(0.056) (0.060) (0.048)Provincial Value Added Growth, 98-08 -0.066��� -0.060��� -0.057���
(0.018) (0.016) (0.016)N. Branches per 1000 inhab. -0.002 -0.002�� -0.002
(0.001) (0.001) (0.001)Observations 428 428 495Percent correctly predicted 84.81Log pseudolikelihood -162.15 -162.15Pseudo R2 or R2 0.110 0.087 0.157
Notes: This table studies the impact of the proxy for credit constraint, "External Score - Av.", on the probability that a �rm declares toproduce higher quality for the foreign market. We report estimates obtained using the Probit model (1) reported in the last speci�cation ofthe previous table and a linear probability model, in (2). In (3) we also consider �rms that export an output of lower quality with respect tothe one sold domestically, Zi,j>Zk,j , using an Ordered Probit model. Average marginal e¤ects are reported in (1) and (3) All speci�cationsinclude industry level dummies. Variables indicated with - Av. are averages for the period 2008-2010. All speci�cations include a constantterm and cluster standard errors, reported in parentheses, at the province level. �, �� and ��� indicate signi�cance at the 1%, 5% and 10%level respectively.
41
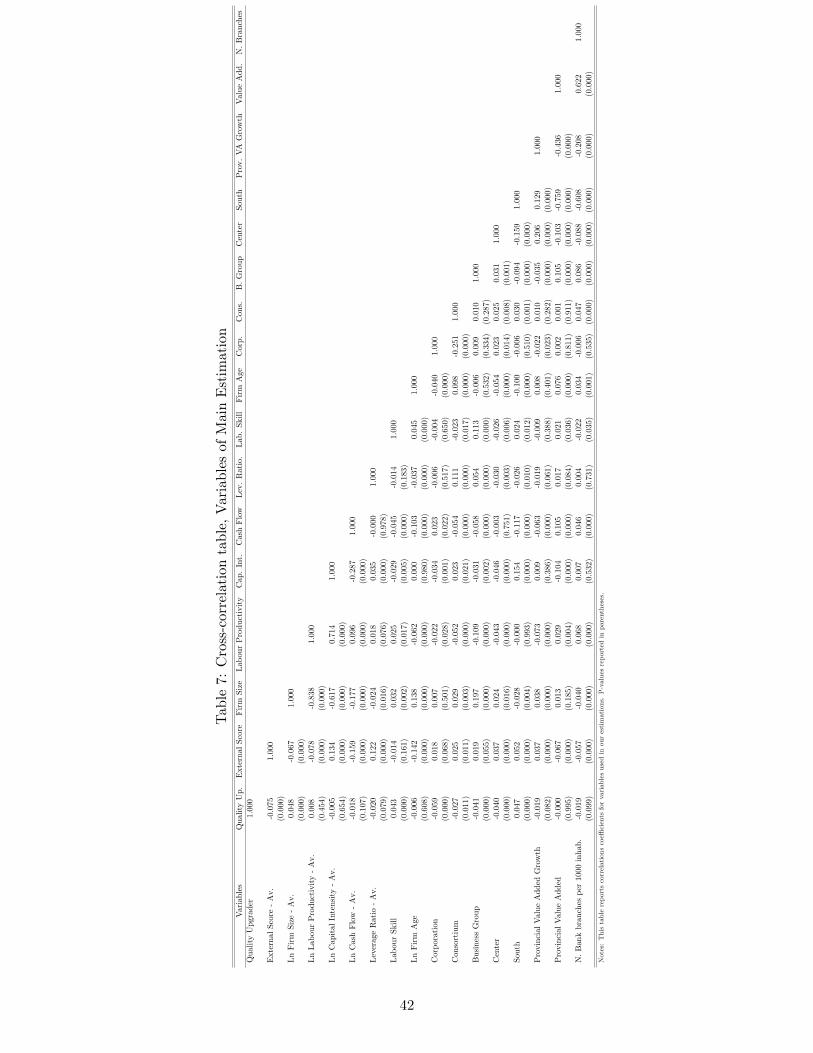
Table7:Cross-correlationtable,VariablesofMainEstimation
Variables
QualityUp.
ExternalScore
FirmSize
LabourProductivity
Cap.Int.
CashFlow
Lev.Ratio.Lab.Skill
FirmAge
Corp.
Cons.
B.Group
Center
South
Prov.VAGrowth
ValueAdd.N.Branches
QualityUpgrader
1.000
ExternalScore-Av.
-0.075
1.000
(0.000)
LnFirmSize-Av.
0.048
-0.067
1.000
(0.000)
(0.000)
LnLabourProductivity-Av.
0.008
-0.078
-0.838
1.000
(0.454)
(0.000)
(0.000)
LnCapitalIntensity-Av.
-0.005
0.134
-0.617
0.714
1.000
(0.654)
(0.000)
(0.000)
(0.000)
LnCashFlow-Av.
-0.018
-0.159
-0.177
0.096
-0.287
1.000
(0.107)
(0.000)
(0.000)
(0.000)
(0.000)
LeverageRatio-Av.
-0.020
0.122
-0.024
0.018
0.035
-0.000
1.000
(0.079)
(0.000)
(0.016)
(0.076)
(0.000)
(0.978)
LabourSkill
0.043
-0.014
0.032
0.025
-0.029
-0.045
-0.014
1.000
(0.000)
(0.161)
(0.002)
(0.017)
(0.005)
(0.000)
(0.183)
LnFirmAge
-0.006
-0.142
0.138
-0.062
0.000
-0.103
-0.037
0.045
1.000
(0.608)
(0.000)
(0.000)
(0.000)
(0.980)
(0.000)
(0.000)
(0.000)
Corporation
-0.059
0.018
0.007
-0.022
-0.034
0.023
-0.006
-0.004
-0.040
1.000
(0.000)
(0.068)
(0.501)
(0.028)
(0.001)
(0.022)
(0.517)
(0.650)
(0.000)
Consortium
-0.027
0.025
0.029
-0.052
0.023
-0.054
0.111
-0.023
0.098
-0.251
1.000
(0.011)
(0.011)
(0.003)
(0.000)
(0.021)
(0.000)
(0.000)
(0.017)
(0.000)
(0.000)
BusinessGroup
-0.041
0.019
0.197
-0.109
-0.031
-0.058
0.054
0.113
-0.006
0.009
0.010
1.000
(0.000)
(0.055)
(0.000)
(0.000)
(0.002)
(0.000)
(0.000)
(0.000)
(0.532)
(0.334)(0.287)
Center
-0.040
0.037
0.024
-0.043
-0.046
-0.003
-0.030
-0.026
-0.054
0.023
0.025
0.031
1.000
(0.000)
(0.000)
(0.016)
(0.000)
(0.000)
(0.751)
(0.003)
(0.006)
(0.000)
(0.014)(0.008)
(0.001)
South
0.047
0.052
-0.028
-0.000
0.154
-0.117
-0.026
0.024
-0.100
-0.006
0.030
-0.094
-0.159
1.000
(0.000)
(0.000)
(0.004)
(0.993)
(0.000)
(0.000)
(0.010)
(0.012)
(0.000)
(0.510)(0.001)
(0.000)
(0.000)
ProvincialValueAddedGrowth
-0.019
0.037
0.038
-0.073
0.009
-0.063
-0.019
-0.009
0.008
-0.022
0.010
-0.035
0.206
0.129
1.000
(0.082)
(0.000)
(0.000)
(0.000)
(0.386)
(0.000)
(0.061)
(0.388)
(0.401)
(0.023)(0.282)
(0.000)
(0.000)(0.000)
ProvincialValueAdded
-0.000
-0.067
0.013
0.029
-0.104
0.105
0.017
0.021
0.076
0.002
0.001
0.105
-0.103
-0.759
-0.436
1.000
(0.995)
(0.000)
(0.185)
(0.004)
(0.000)
(0.000)
(0.084)
(0.036)
(0.000)
(0.811)(0.911)
(0.000)
(0.000)(0.000)
(0.000)
N.Bankbranchesper1000inhab.
-0.019
-0.057
-0.040
0.068
0.007
0.046
0.004
-0.022
0.034
-0.006
0.047
0.086
-0.088
-0.608
-0.208
0.622
1.000
(0.099)
(0.000)
(0.000)
(0.000)
(0.532)
(0.000)
(0.731)
(0.035)
(0.001)
(0.535)(0.000)
(0.000)
(0.000)(0.000)
(0.000)
(0.000)
Notes:Thistablereportscorrelationscoe¢cientsforvariablesusedinourestimations.P-valuesreportedinparentheses.
42

Table 8: Exported Vs Domestic Quality and Exporting Outside EU, Determinants, Coe¢ cients(1) (2) (3) (4) (5) (6) (7)
High Q. Out High Q. Out High Q.Out High Q.Out High Q. Out High Q. Out High Q. OutExternal Score - Av. -0.045 -0.048 -0.030 -0.074 -0.062 -0.062 -0.081
(0.042) (0.040) (0.043) (0.074) (0.073) (0.072) (0.077)Outside EU (d) 1.425�� 1.422�� 1.355�� 1.357�� 1.267�� 1.226�� 1.289��
(0.585) (0.642) (0.630) (0.616) (0.622) (0.622) (0.642)Outside EU (d) X External Score - Av. -0.487��� -0.503��� -0.476��� -0.476��� -0.458��� -0.446��� -0.457���
(0.136) (0.149) (0.143) (0.138) (0.140) (0.140) (0.145)Ln Firm Size - Av. 0.173� 0.150 0.192� 0.199� 0.194�
(0.104) (0.104) (0.114) (0.114) (0.115)Ln Labour Productivity - Av. 0.180 0.237� 0.242 0.258 0.223
(0.127) (0.139) (0.151) (0.157) (0.164)Firm Level Financial Controls N N N Y Y Y YOther Firm Level Controls N N N N Y Y YLocation Dummies N N N N N Y YProvince Level Controls N N N N N N YObservations 428 428 428 428 428 428 428Percent correctly predicted 84.35 83.88 84.58 84.81 84.11 84.11 84.11Log pseudolikelihood -171.77 -165.99 -164.68 -164.21 -161.04 -160.88 -156.63Pseudo R2 0.058 0.090 0.097 0.099 0.116 0.117 0.141
Notes: This table studies the impact of the proxy for credit constraint, "External Score - Av." interacted with the dummy variable "Outside EU" on the probabilitythat a �rm declares to produce higher quality for the foreign market. All speci�cations, except (1), include industry level dummies. Variables indicated with - Av. areaverages for the period 2008-2010. All regressions include a constant term and cluster standard errors, reported in parentheses, at the province level, (d) indicates adummy variable. Coe¢ cients are reported. �, �� and ��� indicate signi�cance at the 1%, 5% and 10% level respectively.
Table 9: Exported Vs Domestic Quality and Exporting to North America, Determinants, Coe¢ cients(1) (2) (3) (4)
High Quality Out High Quality Out High Quality Out High Quality OutExternal Score - Av. -0.196�� -0.201� -0.190� -0.215��
(0.092) (0.103) (0.098) (0.097)North America (d) 1.211��� 1.179�� 1.142�� 1.164��
(0.460) (0.479) (0.473) (0.483)North America (d) X External Score - Av -0.326��� -0.310��� -0.297��� -0.294���
(0.110) (0.113) (0.112) (0.110)Ln Firm Size - Av. 0.017 0.079 0.093 0.087
(0.122) (0.131) (0.129) (0.133)Ln Labour Productivity - Av. 0.138 0.126 0.155 0.124
(0.253) (0.254) (0.249) (0.247)Firm Level Financial Controls Y Y Y YOther Firm Level Controls N Y Y YLocation Dummies N N Y YProvince Level Controls N N N YObservations 291 291 291 291Pseudo R2 0.140 0.160 0.169 0.188Percent Correctly Predicted 84.15 85.33 85.19 84.62Log pseudolikelihood -163.71 -62.16 -152.40 -161.93Pseudo R2 0.140 0.160 0.169 0.188
Notes: This table studies the impact of the proxy for credit constraint, "External Score - Av." interacted with the dummy variable "North- America" on the probability that a �rm declares to produce higher quality for the foreign market. All speci�cations, except (1), includeindustry level dummies. Variables indicated with - Av. are averages for the period 2008-2010. All regressions include a constant term andcluster standard errors, reported in parentheses, at the province level, (d) indicates a dummy variable. Coe¢ cients are reported. �, �� and��� indicate signi�cance at the 1%, 5% and 10% level respectively.
43
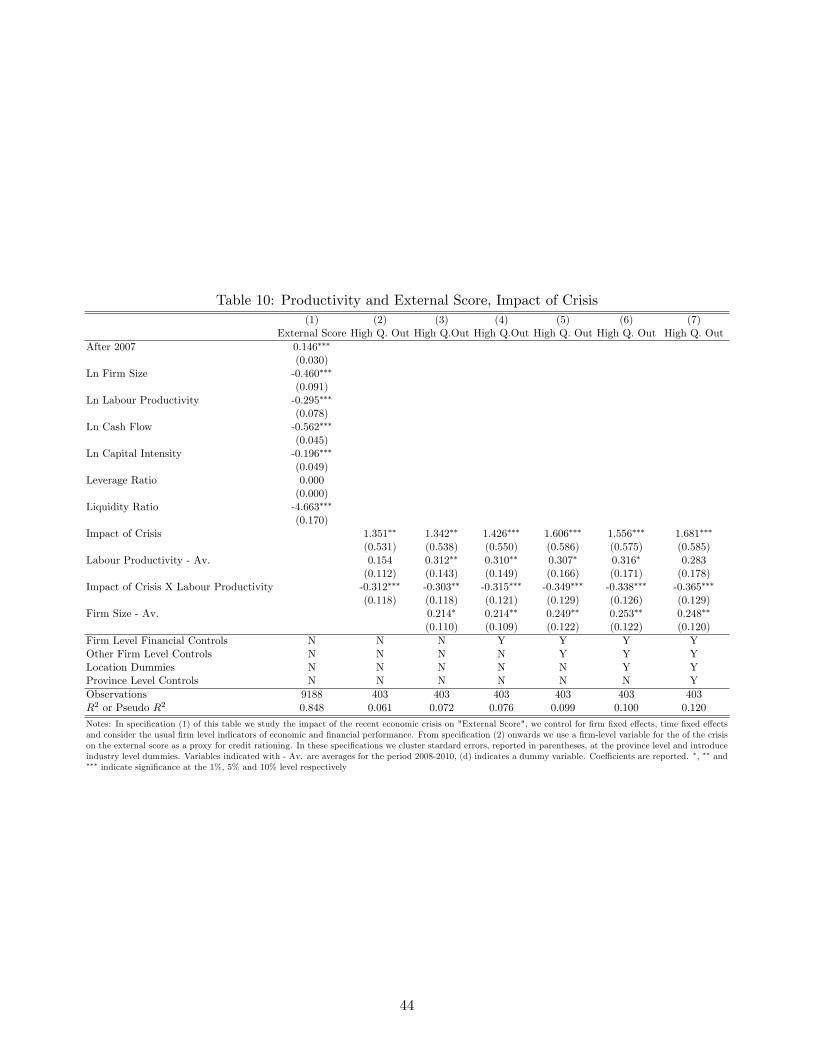
Table 10: Productivity and External Score, Impact of Crisis(1) (2) (3) (4) (5) (6) (7)
External Score High Q. Out High Q.Out High Q.Out High Q. Out High Q. Out High Q. OutAfter 2007 0.146���
(0.030)Ln Firm Size -0.460���
(0.091)Ln Labour Productivity -0.295���
(0.078)Ln Cash Flow -0.562���
(0.045)Ln Capital Intensity -0.196���
(0.049)Leverage Ratio 0.000
(0.000)Liquidity Ratio -4.663���
(0.170)Impact of Crisis 1.351�� 1.342�� 1.426��� 1.606��� 1.556��� 1.681���
(0.531) (0.538) (0.550) (0.586) (0.575) (0.585)Labour Productivity - Av. 0.154 0.312�� 0.310�� 0.307� 0.316� 0.283
(0.112) (0.143) (0.149) (0.166) (0.171) (0.178)Impact of Crisis X Labour Productivity -0.312��� -0.303�� -0.315��� -0.349��� -0.338��� -0.365���
(0.118) (0.118) (0.121) (0.129) (0.126) (0.129)Firm Size - Av. 0.214� 0.214�� 0.249�� 0.253�� 0.248��
(0.110) (0.109) (0.122) (0.122) (0.120)Firm Level Financial Controls N N N Y Y Y YOther Firm Level Controls N N N N Y Y YLocation Dummies N N N N N Y YProvince Level Controls N N N N N N YObservations 9188 403 403 403 403 403 403R2 or Pseudo R2 0.848 0.061 0.072 0.076 0.099 0.100 0.120
Notes: In speci�cation (1) of this table we study the impact of the recent economic crisis on "External Score", we control for �rm �xed e¤ects, time �xed e¤ectsand consider the usual �rm level indicators of economic and �nancial performance. From speci�cation (2) onwards we use a �rm-level variable for the of the crisison the external score as a proxy for credit rationing. In these speci�cations we cluster stardard errors, reported in parentheses, at the province level and introduceindustry level dummies. Variables indicated with - Av. are averages for the period 2008-2010, (d) indicates a dummy variable. Coe¢ cients are reported. �, �� and��� indicate signi�cance at the 1%, 5% and 10% level respectively
44
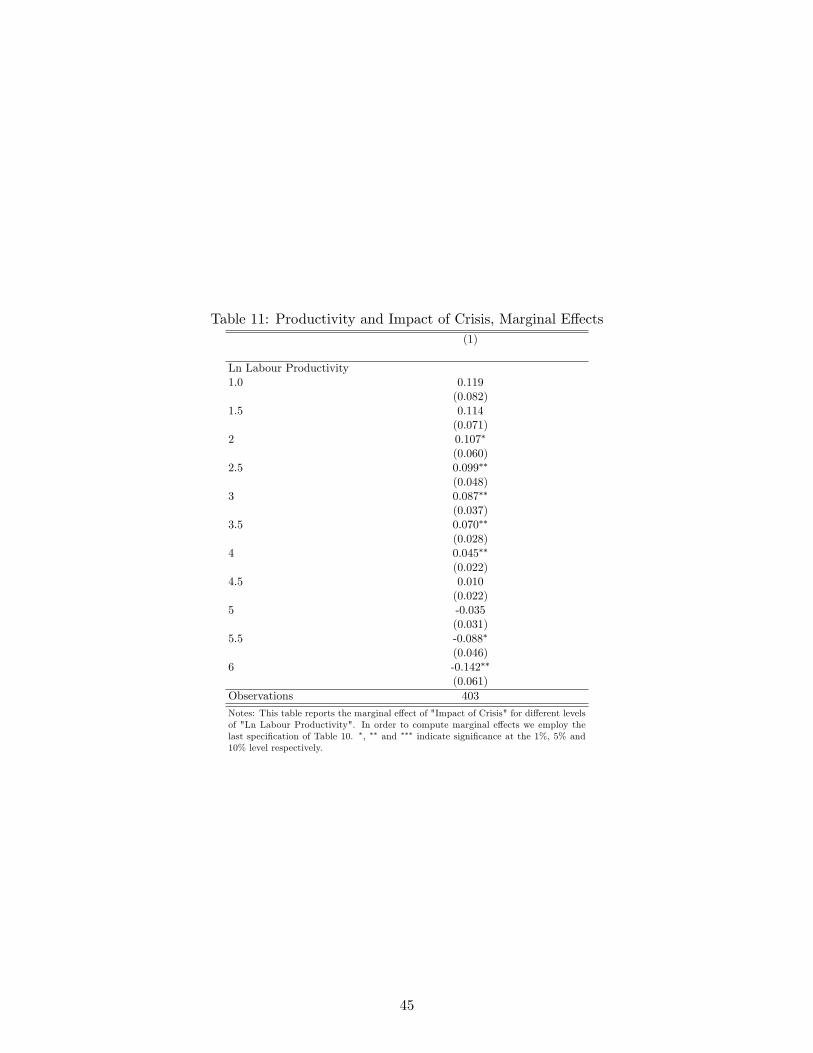
Table 11: Productivity and Impact of Crisis, Marginal E¤ects(1)
Ln Labour Productivity1.0 0.119
(0.082)1.5 0.114
(0.071)2 0.107�
(0.060)2.5 0.099��
(0.048)3 0.087��
(0.037)3.5 0.070��
(0.028)4 0.045��
(0.022)4.5 0.010
(0.022)5 -0.035
(0.031)5.5 -0.088�
(0.046)6 -0.142��
(0.061)Observations 403
Notes: This table reports the marginal e¤ect of "Impact of Crisis" for di¤erent levelsof "Ln Labour Productivity". In order to compute marginal e¤ects we employ thelast speci�cation of Table 10. �, �� and ��� indicate signi�cance at the 1%, 5% and10% level respectively.
45
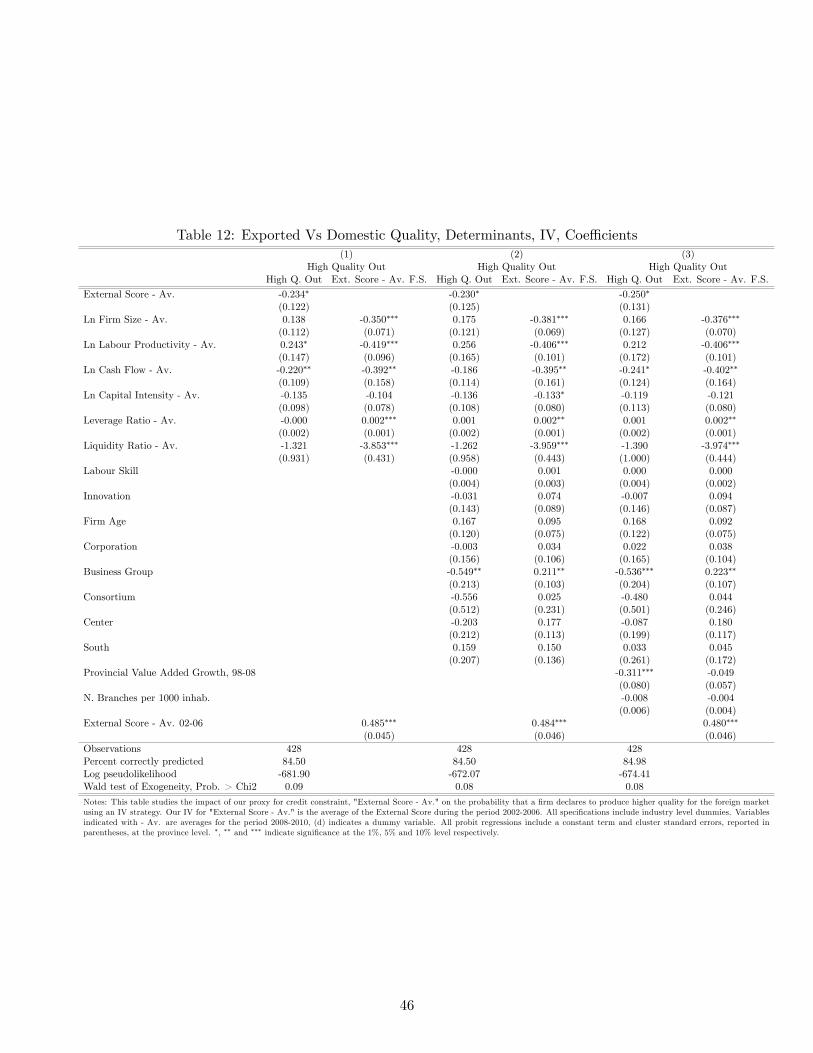
Table 12: Exported Vs Domestic Quality, Determinants, IV, Coe¢ cients(1) (2) (3)
High Quality Out High Quality Out High Quality OutHigh Q. Out Ext. Score - Av. F.S. High Q. Out Ext. Score - Av. F.S. High Q. Out Ext. Score - Av. F.S.
External Score - Av. -0.234� -0.230� -0.250�
(0.122) (0.125) (0.131)Ln Firm Size - Av. 0.138 -0.350��� 0.175 -0.381��� 0.166 -0.376���
(0.112) (0.071) (0.121) (0.069) (0.127) (0.070)Ln Labour Productivity - Av. 0.243� -0.419��� 0.256 -0.406��� 0.212 -0.406���
(0.147) (0.096) (0.165) (0.101) (0.172) (0.101)Ln Cash Flow - Av. -0.220�� -0.392�� -0.186 -0.395�� -0.241� -0.402��
(0.109) (0.158) (0.114) (0.161) (0.124) (0.164)Ln Capital Intensity - Av. -0.135 -0.104 -0.136 -0.133� -0.119 -0.121
(0.098) (0.078) (0.108) (0.080) (0.113) (0.080)Leverage Ratio - Av. -0.000 0.002��� 0.001 0.002�� 0.001 0.002��
(0.002) (0.001) (0.002) (0.001) (0.002) (0.001)Liquidity Ratio - Av. -1.321 -3.853��� -1.262 -3.959��� -1.390 -3.974���
(0.931) (0.431) (0.958) (0.443) (1.000) (0.444)Labour Skill -0.000 0.001 0.000 0.000
(0.004) (0.003) (0.004) (0.002)Innovation -0.031 0.074 -0.007 0.094
(0.143) (0.089) (0.146) (0.087)Firm Age 0.167 0.095 0.168 0.092
(0.120) (0.075) (0.122) (0.075)Corporation -0.003 0.034 0.022 0.038
(0.156) (0.106) (0.165) (0.104)Business Group -0.549�� 0.211�� -0.536��� 0.223��
(0.213) (0.103) (0.204) (0.107)Consortium -0.556 0.025 -0.480 0.044
(0.512) (0.231) (0.501) (0.246)Center -0.203 0.177 -0.087 0.180
(0.212) (0.113) (0.199) (0.117)South 0.159 0.150 0.033 0.045
(0.207) (0.136) (0.261) (0.172)Provincial Value Added Growth, 98-08 -0.311��� -0.049
(0.080) (0.057)N. Branches per 1000 inhab. -0.008 -0.004
(0.006) (0.004)External Score - Av. 02-06 0.485��� 0.484��� 0.480���
(0.045) (0.046) (0.046)Observations 428 428 428Percent correctly predicted 84.50 84.50 84.98Log pseudolikelihood -681.90 -672.07 -674.41Wald test of Exogeneity, Prob. > Chi2 0.09 0.08 0.08
Notes: This table studies the impact of our proxy for credit constraint, "External Score - Av." on the probability that a �rm declares to produce higher quality for the foreign marketusing an IV strategy. Our IV for "External Score - Av." is the average of the External Score during the period 2002-2006. All speci�cations include industry level dummies. Variablesindicated with - Av. are averages for the period 2008-2010, (d) indicates a dummy variable. All probit regressions include a constant term and cluster standard errors, reported inparentheses, at the province level. �, �� and ��� indicate signi�cance at the 1%, 5% and 10% level respectively.
46
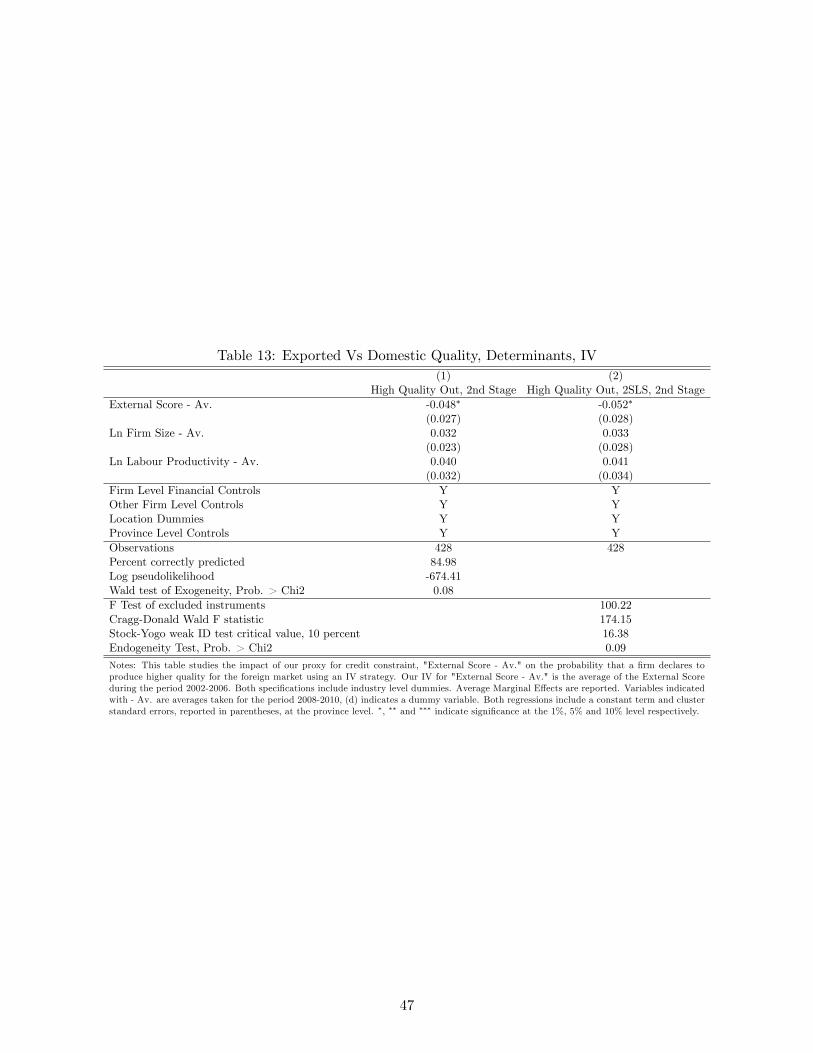
Table 13: Exported Vs Domestic Quality, Determinants, IV(1) (2)
High Quality Out, 2nd Stage High Quality Out, 2SLS, 2nd StageExternal Score - Av. -0.048� -0.052�
(0.027) (0.028)Ln Firm Size - Av. 0.032 0.033
(0.023) (0.028)Ln Labour Productivity - Av. 0.040 0.041
(0.032) (0.034)Firm Level Financial Controls Y YOther Firm Level Controls Y YLocation Dummies Y YProvince Level Controls Y YObservations 428 428Percent correctly predicted 84.98Log pseudolikelihood -674.41Wald test of Exogeneity, Prob. > Chi2 0.08F Test of excluded instruments 100.22Cragg-Donald Wald F statistic 174.15Stock-Yogo weak ID test critical value, 10 percent 16.38Endogeneity Test, Prob. > Chi2 0.09
Notes: This table studies the impact of our proxy for credit constraint, "External Score - Av." on the probability that a �rm declares toproduce higher quality for the foreign market using an IV strategy. Our IV for "External Score - Av." is the average of the External Scoreduring the period 2002-2006. Both speci�cations include industry level dummies. Average Marginal E¤ects are reported. Variables indicatedwith - Av. are averages taken for the period 2008-2010, (d) indicates a dummy variable. Both regressions include a constant term and clusterstandard errors, reported in parentheses, at the province level. �, �� and ��� indicate signi�cance at the 1%, 5% and 10% level respectively.
47
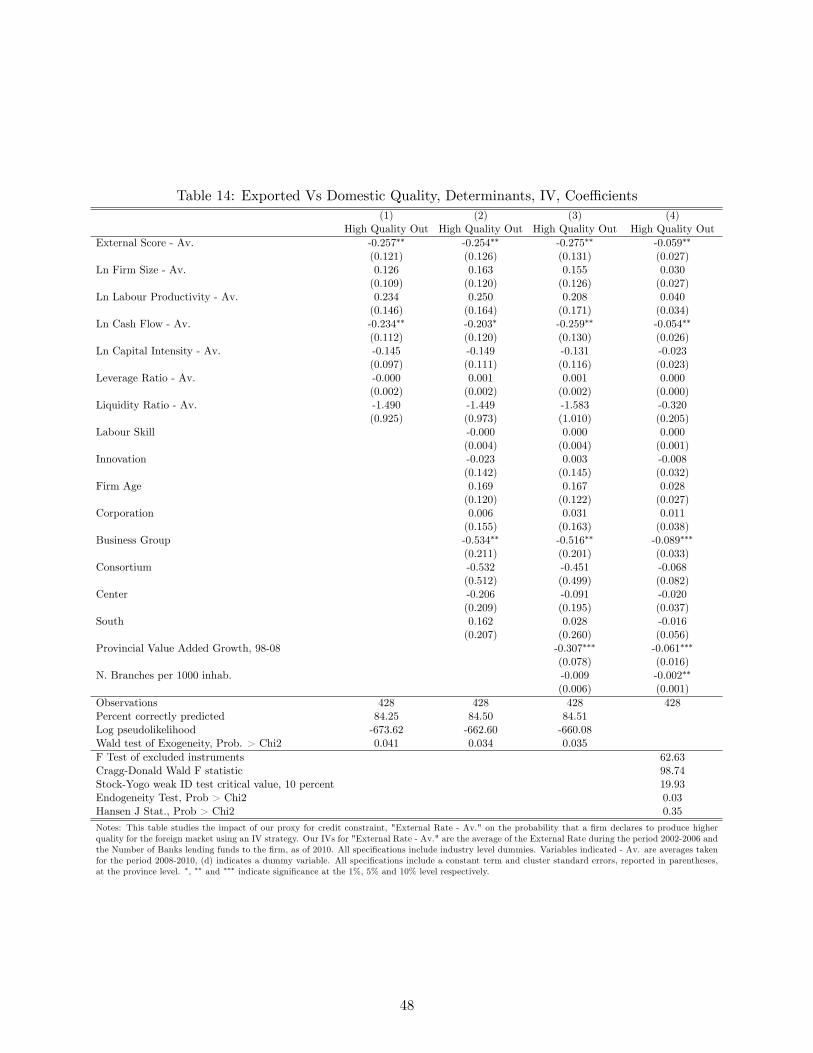
Table 14: Exported Vs Domestic Quality, Determinants, IV, Coe¢ cients(1) (2) (3) (4)
High Quality Out High Quality Out High Quality Out High Quality OutExternal Score - Av. -0.257�� -0.254�� -0.275�� -0.059��
(0.121) (0.126) (0.131) (0.027)Ln Firm Size - Av. 0.126 0.163 0.155 0.030
(0.109) (0.120) (0.126) (0.027)Ln Labour Productivity - Av. 0.234 0.250 0.208 0.040
(0.146) (0.164) (0.171) (0.034)Ln Cash Flow - Av. -0.234�� -0.203� -0.259�� -0.054��
(0.112) (0.120) (0.130) (0.026)Ln Capital Intensity - Av. -0.145 -0.149 -0.131 -0.023
(0.097) (0.111) (0.116) (0.023)Leverage Ratio - Av. -0.000 0.001 0.001 0.000
(0.002) (0.002) (0.002) (0.000)Liquidity Ratio - Av. -1.490 -1.449 -1.583 -0.320
(0.925) (0.973) (1.010) (0.205)Labour Skill -0.000 0.000 0.000
(0.004) (0.004) (0.001)Innovation -0.023 0.003 -0.008
(0.142) (0.145) (0.032)Firm Age 0.169 0.167 0.028
(0.120) (0.122) (0.027)Corporation 0.006 0.031 0.011
(0.155) (0.163) (0.038)Business Group -0.534�� -0.516�� -0.089���
(0.211) (0.201) (0.033)Consortium -0.532 -0.451 -0.068
(0.512) (0.499) (0.082)Center -0.206 -0.091 -0.020
(0.209) (0.195) (0.037)South 0.162 0.028 -0.016
(0.207) (0.260) (0.056)Provincial Value Added Growth, 98-08 -0.307��� -0.061���
(0.078) (0.016)N. Branches per 1000 inhab. -0.009 -0.002��
(0.006) (0.001)Observations 428 428 428 428Percent correctly predicted 84.25 84.50 84.51Log pseudolikelihood -673.62 -662.60 -660.08Wald test of Exogeneity, Prob. > Chi2 0.041 0.034 0.035F Test of excluded instruments 62.63Cragg-Donald Wald F statistic 98.74Stock-Yogo weak ID test critical value, 10 percent 19.93Endogeneity Test, Prob > Chi2 0.03Hansen J Stat., Prob > Chi2 0.35
Notes: This table studies the impact of our proxy for credit constraint, "External Rate - Av." on the probability that a �rm declares to produce higherquality for the foreign market using an IV strategy. Our IVs for "External Rate - Av." are the average of the External Rate during the period 2002-2006 andthe Number of Banks lending funds to the �rm, as of 2010. All speci�cations include industry level dummies. Variables indicated - Av. are averages takenfor the period 2008-2010, (d) indicates a dummy variable. All speci�cations include a constant term and cluster standard errors, reported in parentheses,at the province level. �, �� and ��� indicate signi�cance at the 1%, 5% and 10% level respectively.
48
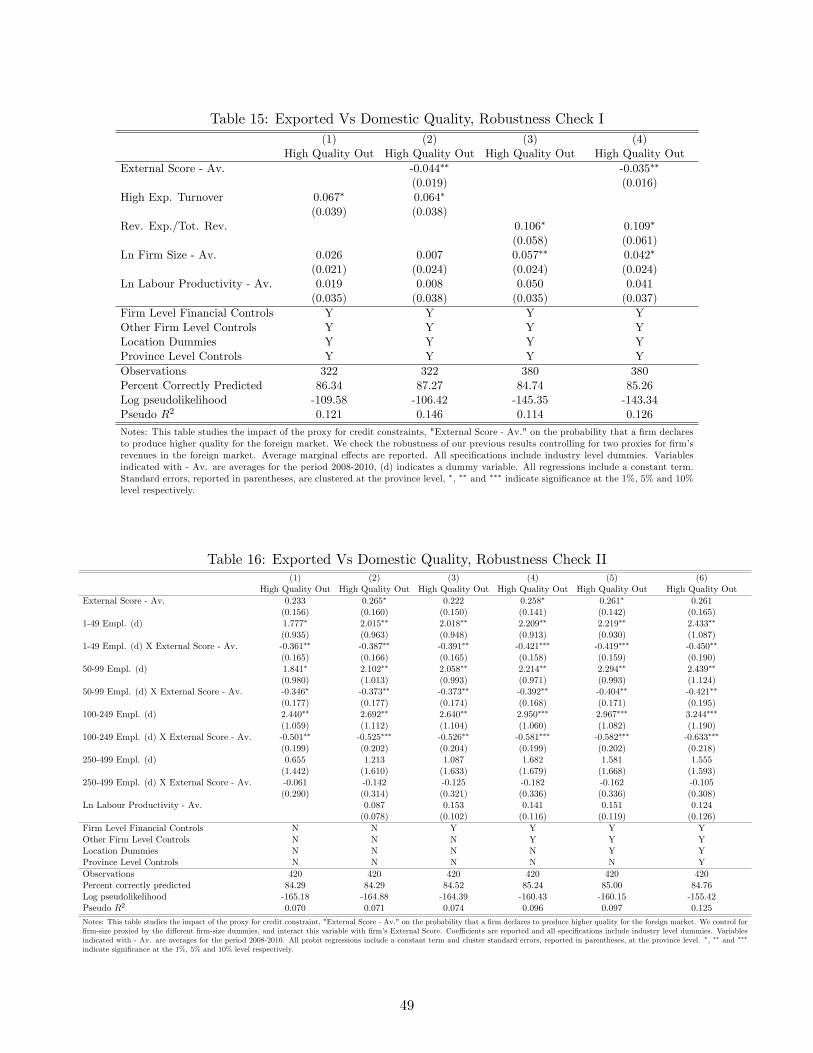
Table 15: Exported Vs Domestic Quality, Robustness Check I(1) (2) (3) (4)
High Quality Out High Quality Out High Quality Out High Quality OutExternal Score - Av. -0.044�� -0.035��
(0.019) (0.016)High Exp. Turnover 0.067� 0.064�
(0.039) (0.038)Rev. Exp./Tot. Rev. 0.106� 0.109�
(0.058) (0.061)Ln Firm Size - Av. 0.026 0.007 0.057�� 0.042�
(0.021) (0.024) (0.024) (0.024)Ln Labour Productivity - Av. 0.019 0.008 0.050 0.041
(0.035) (0.038) (0.035) (0.037)Firm Level Financial Controls Y Y Y YOther Firm Level Controls Y Y Y YLocation Dummies Y Y Y YProvince Level Controls Y Y Y YObservations 322 322 380 380Percent Correctly Predicted 86.34 87.27 84.74 85.26Log pseudolikelihood -109.58 -106.42 -145.35 -143.34Pseudo R2 0.121 0.146 0.114 0.126
Notes: This table studies the impact of the proxy for credit constraints, "External Score - Av." on the probability that a �rm declaresto produce higher quality for the foreign market. We check the robustness of our previous results controlling for two proxies for �rm�srevenues in the foreign market. Average marginal e¤ects are reported. All speci�cations include industry level dummies. Variablesindicated with - Av. are averages for the period 2008-2010, (d) indicates a dummy variable. All regressions include a constant term.Standard errors, reported in parentheses, are clustered at the province level, �, �� and ��� indicate signi�cance at the 1%, 5% and 10%level respectively.
Table 16: Exported Vs Domestic Quality, Robustness Check II(1) (2) (3) (4) (5) (6)
High Quality Out High Quality Out High Quality Out High Quality Out High Quality Out High Quality OutExternal Score - Av. 0.233 0.265� 0.222 0.258� 0.261� 0.261
(0.156) (0.160) (0.150) (0.141) (0.142) (0.165)1-49 Empl. (d) 1.777� 2.015�� 2.018�� 2.209�� 2.219�� 2.433��
(0.935) (0.963) (0.948) (0.913) (0.930) (1.087)1-49 Empl. (d) X External Score - Av. -0.361�� -0.387�� -0.391�� -0.421��� -0.419��� -0.450��
(0.165) (0.166) (0.165) (0.158) (0.159) (0.190)50-99 Empl. (d) 1.841� 2.102�� 2.058�� 2.214�� 2.294�� 2.439��
(0.980) (1.013) (0.993) (0.971) (0.993) (1.124)50-99 Empl. (d) X External Score - Av. -0.346� -0.373�� -0.373�� -0.392�� -0.404�� -0.421��
(0.177) (0.177) (0.174) (0.168) (0.171) (0.195)100-249 Empl. (d) 2.440�� 2.692�� 2.640�� 2.950��� 2.967��� 3.244���
(1.059) (1.112) (1.104) (1.060) (1.082) (1.190)100-249 Empl. (d) X External Score - Av. -0.501�� -0.525��� -0.526�� -0.581��� -0.582��� -0.633���
(0.199) (0.202) (0.204) (0.199) (0.202) (0.218)250-499 Empl. (d) 0.655 1.213 1.087 1.682 1.581 1.555
(1.442) (1.610) (1.633) (1.679) (1.668) (1.593)250-499 Empl. (d) X External Score - Av. -0.061 -0.142 -0.125 -0.182 -0.162 -0.105
(0.290) (0.314) (0.321) (0.336) (0.336) (0.308)Ln Labour Productivity - Av. 0.087 0.153 0.141 0.151 0.124
(0.078) (0.102) (0.116) (0.119) (0.126)Firm Level Financial Controls N N Y Y Y YOther Firm Level Controls N N N Y Y YLocation Dummies N N N N Y YProvince Level Controls N N N N N YObservations 420 420 420 420 420 420Percent correctly predicted 84.29 84.29 84.52 85.24 85.00 84.76Log pseudolikelihood -165.18 -164.88 -164.39 -160.43 -160.15 -155.42Pseudo R2 0.070 0.071 0.074 0.096 0.097 0.125
Notes: This table studies the impact of the proxy for credit constraint, "External Score - Av." on the probability that a �rm declares to produce higher quality for the foreign market. We control for�rm-size proxied by the di¤erent �rm-size dummies, and interact this variable with �rm�s External Score. Coe¢ cients are reported and all speci�cations include industry level dummies. Variablesindicated with - Av. are averages for the period 2008-2010. All probit regressions include a constant term and cluster standard errors, reported in parentheses, at the province level. �, �� and ���
indicate signi�cance at the 1%, 5% and 10% level respectively.
49
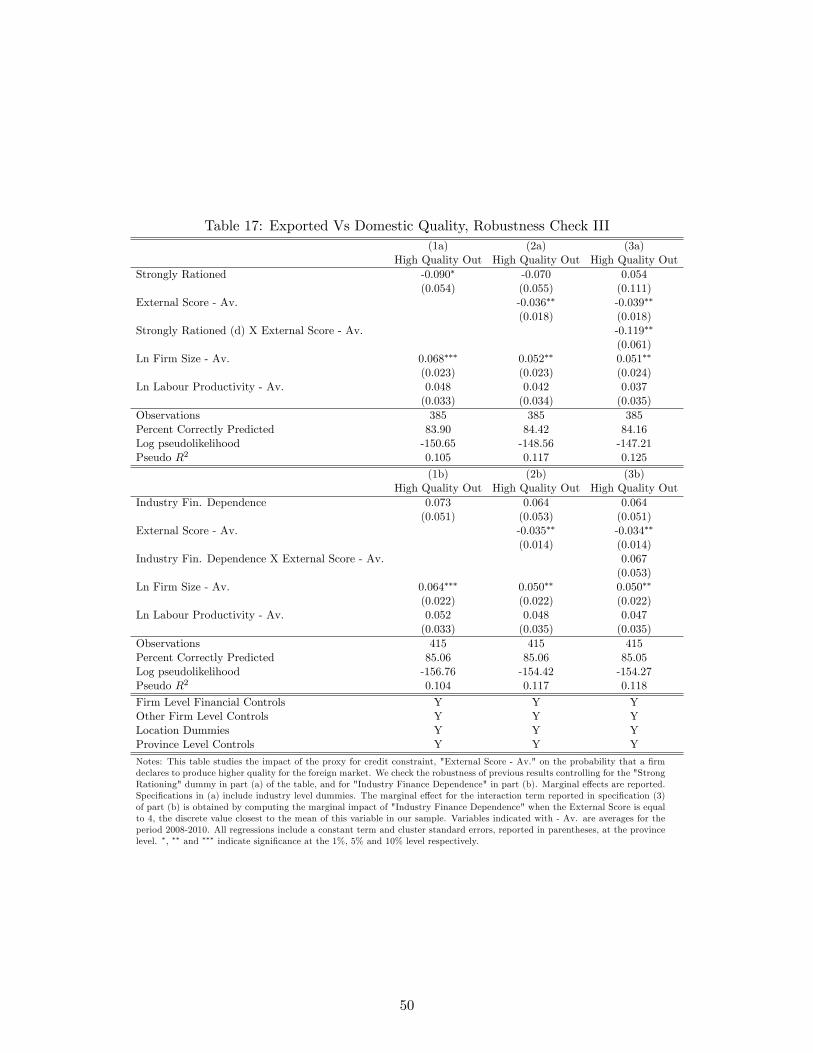
Table 17: Exported Vs Domestic Quality, Robustness Check III(1a) (2a) (3a)
High Quality Out High Quality Out High Quality OutStrongly Rationed -0.090� -0.070 0.054
(0.054) (0.055) (0.111)External Score - Av. -0.036�� -0.039��
(0.018) (0.018)Strongly Rationed (d) X External Score - Av. -0.119��
(0.061)Ln Firm Size - Av. 0.068��� 0.052�� 0.051��
(0.023) (0.023) (0.024)Ln Labour Productivity - Av. 0.048 0.042 0.037
(0.033) (0.034) (0.035)Observations 385 385 385Percent Correctly Predicted 83.90 84.42 84.16Log pseudolikelihood -150.65 -148.56 -147.21Pseudo R2 0.105 0.117 0.125
(1b) (2b) (3b)High Quality Out High Quality Out High Quality Out
Industry Fin. Dependence 0.073 0.064 0.064(0.051) (0.053) (0.051)
External Score - Av. -0.035�� -0.034��
(0.014) (0.014)Industry Fin. Dependence X External Score - Av. 0.067
(0.053)Ln Firm Size - Av. 0.064��� 0.050�� 0.050��
(0.022) (0.022) (0.022)Ln Labour Productivity - Av. 0.052 0.048 0.047
(0.033) (0.035) (0.035)Observations 415 415 415Percent Correctly Predicted 85.06 85.06 85.05Log pseudolikelihood -156.76 -154.42 -154.27Pseudo R2 0.104 0.117 0.118
Firm Level Financial Controls Y Y YOther Firm Level Controls Y Y YLocation Dummies Y Y YProvince Level Controls Y Y Y
Notes: This table studies the impact of the proxy for credit constraint, "External Score - Av." on the probability that a �rmdeclares to produce higher quality for the foreign market. We check the robustness of previous results controlling for the "StrongRationing" dummy in part (a) of the table, and for "Industry Finance Dependence" in part (b). Marginal e¤ects are reported.Speci�cations in (a) include industry level dummies. The marginal e¤ect for the interaction term reported in speci�cation (3)of part (b) is obtained by computing the marginal impact of "Industry Finance Dependence" when the External Score is equalto 4, the discrete value closest to the mean of this variable in our sample. Variables indicated with - Av. are averages for theperiod 2008-2010. All regressions include a constant term and cluster standard errors, reported in parentheses, at the provincelevel. �, �� and ��� indicate signi�cance at the 1%, 5% and 10% level respectively.
50
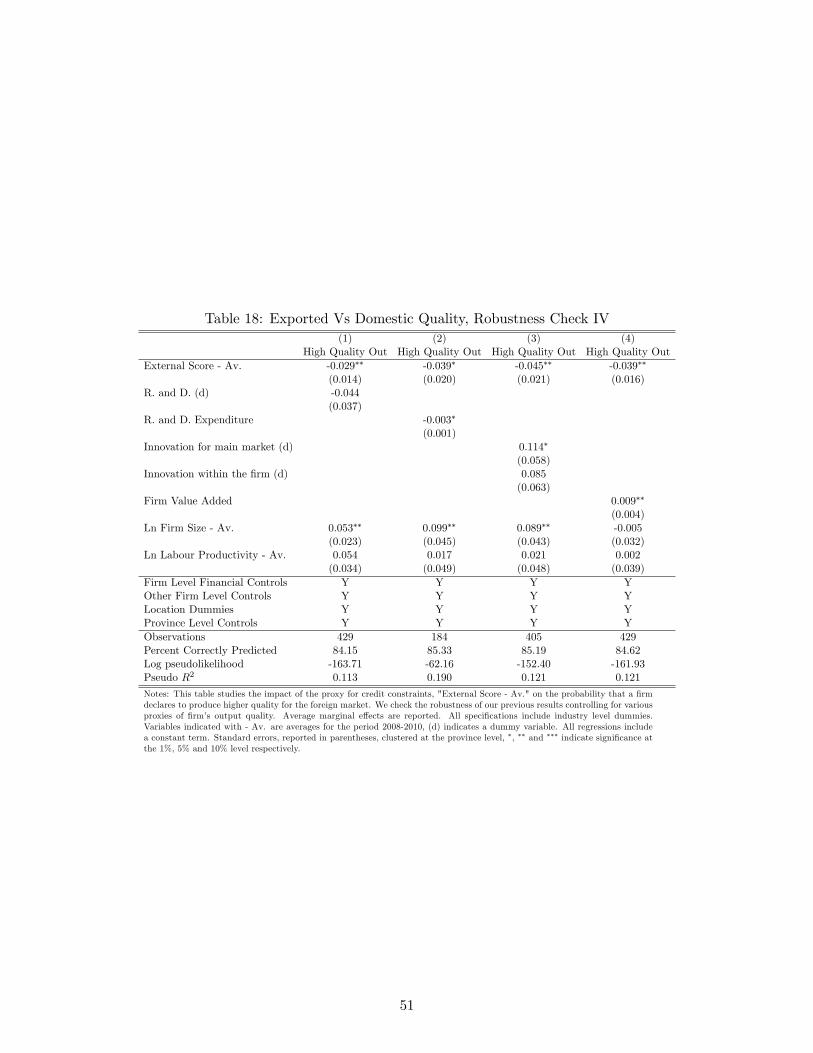
Table 18: Exported Vs Domestic Quality, Robustness Check IV(1) (2) (3) (4)
High Quality Out High Quality Out High Quality Out High Quality OutExternal Score - Av. -0.029�� -0.039� -0.045�� -0.039��
(0.014) (0.020) (0.021) (0.016)R. and D. (d) -0.044
(0.037)R. and D. Expenditure -0.003�
(0.001)Innovation for main market (d) 0.114�
(0.058)Innovation within the �rm (d) 0.085
(0.063)Firm Value Added 0.009��
(0.004)Ln Firm Size - Av. 0.053�� 0.099�� 0.089�� -0.005
(0.023) (0.045) (0.043) (0.032)Ln Labour Productivity - Av. 0.054 0.017 0.021 0.002
(0.034) (0.049) (0.048) (0.039)Firm Level Financial Controls Y Y Y YOther Firm Level Controls Y Y Y YLocation Dummies Y Y Y YProvince Level Controls Y Y Y YObservations 429 184 405 429Percent Correctly Predicted 84.15 85.33 85.19 84.62Log pseudolikelihood -163.71 -62.16 -152.40 -161.93Pseudo R2 0.113 0.190 0.121 0.121
Notes: This table studies the impact of the proxy for credit constraints, "External Score - Av." on the probability that a �rmdeclares to produce higher quality for the foreign market. We check the robustness of our previous results controlling for variousproxies of �rm�s output quality. Average marginal e¤ects are reported. All speci�cations include industry level dummies.Variables indicated with - Av. are averages for the period 2008-2010, (d) indicates a dummy variable. All regressions includea constant term. Standard errors, reported in parentheses, clustered at the province level, �, �� and ��� indicate signi�cance atthe 1%, 5% and 10% level respectively.
51
PREVIOUS DISCUSSION PAPERS
191 Ciani, Andrea and Bartoli, Francesca, Export Quality Upgrading Under Credit Constraints, July 2015.
190 Hasnas, Irina and Wey, Christian, Full Versus Partial Collusion Among Brands and Private Label Producers, July 2015.
189 Dertwinkel-Kalt, Markus and Köster, Mats, Violations of First-Order Stochastic Dominance as Salience Effects, June 2015.
188 Kholodilin, Konstantin, Kolmer, Christian, Thomas, Tobias and Ulbricht, Dirk, Asymmetric Perceptions of the Economy: Media, Firms, Consumers, and Experts, June 2015.
187 Dertwinkel-Kalt, Markus and Wey, Christian, Merger Remedies in Oligopoly Under a Consumer Welfare Standard, June 2015. Forthcoming in: Journal of Law, Economics, & Organization.
186 Dertwinkel-Kalt, Markus, Salience and Health Campaigns, May 2015. Forthcoming in: Forum for Health Economics & Policy.
185 Wrona, Jens, Border Effects without Borders: What Divides Japan’s Internal Trade?, May 2015.
184 Amess, Kevin, Stiebale, Joel and Wright, Mike, The Impact of Private Equity on Firms’ Innovation Activity, April 2015.
183 Ibañez, Marcela, Rai, Ashok and Riener, Gerhard, Sorting Through Affirmative Action: Three Field Experiments in Colombia, April 2015.
182 Baumann, Florian, Friehe, Tim and Rasch, Alexander, The Influence of Product Liability on Vertical Product Differentiation, April 2015.
181 Baumann, Florian and Friehe, Tim, Proof Beyond a Reasonable Doubt: Laboratory Evidence, March 2015.
180 Rasch, Alexander and Waibel, Christian, What Drives Fraud in a Credence Goods Market? – Evidence From a Field Study, March 2015.
179 Jeitschko, Thomas D., Incongruities of Real and Intellectual Property: Economic Concerns in Patent Policy and Practice, February 2015. Forthcoming in: Michigan State Law Review.
178 Buchwald, Achim and Hottenrott, Hanna, Women on the Board and Executive Duration – Evidence for European Listed Firms, February 2015.
177 Heblich, Stephan, Lameli, Alfred and Riener, Gerhard, Regional Accents on Individual Economic Behavior: A Lab Experiment on Linguistic Performance, Cognitive Ratings and Economic Decisions, February 2015. Published in: PLoS ONE, 10 (2015), e0113475.
176 Herr, Annika, Nguyen, Thu-Van and Schmitz, Hendrik, Does Quality Disclosure Improve Quality? Responses to the Introduction of Nursing Home Report Cards in Germany, February 2015.
175 Herr, Annika and Normann, Hans-Theo, Organ Donation in the Lab: Preferences and Votes on the Priority Rule, February 2015.

174 Buchwald, Achim, Competition, Outside Directors and Executive Turnover: Implications for Corporate Governance in the EU, February 2015.
173 Buchwald, Achim and Thorwarth, Susanne, Outside Directors on the Board, Competition and Innovation, February 2015.
172 Dewenter, Ralf and Giessing, Leonie, The Effects of Elite Sports Participation on Later Job Success, February 2015.
171 Haucap, Justus, Heimeshoff, Ulrich and Siekmann, Manuel, Price Dispersion and Station Heterogeneity on German Retail Gasoline Markets, January 2015.
170 Schweinberger, Albert G. and Suedekum, Jens, De-Industrialisation and Entrepreneurship under Monopolistic Competition, January 2015. Forthcoming in: Oxford Economic Papers.
169 Nowak, Verena, Organizational Decisions in Multistage Production Processes, December 2014.
168 Benndorf, Volker, Kübler, Dorothea and Normann, Hans-Theo, Privacy Concerns, Voluntary Disclosure of Information, and Unraveling: An Experiment, November 2014. Published in: European Economic Review, 75 (2015), pp. 43-59.
167 Rasch, Alexander and Wenzel, Tobias, The Impact of Piracy on Prominent and Non-prominent Software Developers, November 2014. Forthcoming in: Telecommunications Policy.
166 Jeitschko, Thomas D. and Tremblay, Mark J., Homogeneous Platform Competition with Endogenous Homing, November 2014.
165 Gu, Yiquan, Rasch, Alexander and Wenzel, Tobias, Price-sensitive Demand and Market Entry, November 2014. Forthcoming in: Papers in Regional Science.
164 Caprice, Stéphane, von Schlippenbach, Vanessa and Wey, Christian, Supplier Fixed Costs and Retail Market Monopolization, October 2014.
163 Klein, Gordon J. and Wendel, Julia, The Impact of Local Loop and Retail Unbundling Revisited, October 2014.
162 Dertwinkel-Kalt, Markus, Haucap, Justus and Wey, Christian, Raising Rivals’ Costs Through Buyer Power, October 2014. Published in: Economics Letters, 126 (2015), pp.181-184.
161 Dertwinkel-Kalt, Markus and Köhler, Katrin, Exchange Asymmetries for Bads? Experimental Evidence, October 2014.
160 Behrens, Kristian, Mion, Giordano, Murata, Yasusada and Suedekum, Jens, Spatial Frictions, September 2014.
159 Fonseca, Miguel A. and Normann, Hans-Theo, Endogenous Cartel Formation: Experimental Evidence, August 2014. Published in: Economics Letters, 125 (2014), pp. 223-225.
158 Stiebale, Joel, Cross-Border M&As and Innovative Activity of Acquiring and Target Firms, August 2014.
157 Haucap, Justus and Heimeshoff, Ulrich, The Happiness of Economists: Estimating the Causal Effect of Studying Economics on Subjective Well-Being, August 2014. Published in: International Review of Economics Education, 17 (2014), pp. 85-97.
156 Haucap, Justus, Heimeshoff, Ulrich and Lange, Mirjam R. J., The Impact of Tariff Diversity on Broadband Diffusion – An Empirical Analysis, August 2014.
155 Baumann, Florian and Friehe, Tim, On Discovery, Restricting Lawyers, and the Settlement Rate, August 2014.
154 Hottenrott, Hanna and Lopes-Bento, Cindy, R&D Partnerships and Innovation Performance: Can There be too Much of a Good Thing?, July 2014.
153 Hottenrott, Hanna and Lawson, Cornelia, Flying the Nest: How the Home Department Shapes Researchers’ Career Paths, July 2014.
152 Hottenrott, Hanna, Lopes-Bento, Cindy and Veugelers, Reinhilde, Direct and Cross-Scheme Effects in a Research and Development Subsidy Program, July 2014.
151 Dewenter, Ralf and Heimeshoff, Ulrich, Do Expert Reviews Really Drive Demand? Evidence from a German Car Magazine, July 2014. Forthcoming in: Applied Economics Letters.
150 Bataille, Marc, Steinmetz, Alexander and Thorwarth, Susanne, Screening Instruments for Monitoring Market Power in Wholesale Electricity Markets – Lessons from Applications in Germany, July 2014.
149 Kholodilin, Konstantin A., Thomas, Tobias and Ulbricht, Dirk, Do Media Data Help to Predict German Industrial Production?, July 2014.
148 Hogrefe, Jan and Wrona, Jens, Trade, Tasks, and Trading: The Effect of Offshoring on Individual Skill Upgrading, June 2014. Forthcoming in: Canadian Journal of Economics.
147 Gaudin, Germain and White, Alexander, On the Antitrust Economics of the Electronic Books Industry, September 2014 (Previous Version May 2014).
146 Alipranti, Maria, Milliou, Chrysovalantou and Petrakis, Emmanuel, Price vs. Quantity Competition in a Vertically Related Market, May 2014. Published in: Economics Letters, 124 (2014), pp. 122-126.
145 Blanco, Mariana, Engelmann, Dirk, Koch, Alexander K. and Normann, Hans-Theo, Preferences and Beliefs in a Sequential Social Dilemma: A Within-Subjects Analysis, May 2014. Published in: Games and Economic Behavior, 87 (2014), pp. 122-135.
144 Jeitschko, Thomas D., Jung, Yeonjei and Kim, Jaesoo, Bundling and Joint Marketing by Rival Firms, May 2014.
143 Benndorf, Volker and Normann, Hans-Theo, The Willingness to Sell Personal Data, April 2014.
142 Dauth, Wolfgang and Suedekum, Jens, Globalization and Local Profiles of Economic Growth and Industrial Change, April 2014.
141 Nowak, Verena, Schwarz, Christian and Suedekum, Jens, Asymmetric Spiders: Supplier Heterogeneity and the Organization of Firms, April 2014.
140 Hasnas, Irina, A Note on Consumer Flexibility, Data Quality and Collusion, April 2014.
139 Baye, Irina and Hasnas, Irina, Consumer Flexibility, Data Quality and Location Choice, April 2014.
138 Aghadadashli, Hamid and Wey, Christian, Multi-Union Bargaining: Tariff Plurality and Tariff Competition, April 2014. A revised version of the paper is forthcoming in: Journal of Institutional and Theoretical Economics.
137 Duso, Tomaso, Herr, Annika and Suppliet, Moritz, The Welfare Impact of Parallel Imports: A Structural Approach Applied to the German Market for Oral Anti-diabetics, April 2014. Published in: Health Economics, 23 (2014), pp. 1036-1057.
136 Haucap, Justus and Müller, Andrea, Why are Economists so Different? Nature, Nurture and Gender Effects in a Simple Trust Game, March 2014.
135 Normann, Hans-Theo and Rau, Holger A., Simultaneous and Sequential Contributions to Step-Level Public Goods: One vs. Two Provision Levels, March 2014. Forthcoming in: Journal of Conflict Resolution.
134 Bucher, Monika, Hauck, Achim and Neyer, Ulrike, Frictions in the Interbank Market and Uncertain Liquidity Needs: Implications for Monetary Policy Implementation, July 2014 (First Version March 2014).
133 Czarnitzki, Dirk, Hall, Bronwyn, H. and Hottenrott, Hanna, Patents as Quality Signals? The Implications for Financing Constraints on R&D?, February 2014.
132 Dewenter, Ralf and Heimeshoff, Ulrich, Media Bias and Advertising: Evidence from a German Car Magazine, February 2014. Published in: Review of Economics, 65 (2014), pp. 77-94.
131 Baye, Irina and Sapi, Geza, Targeted Pricing, Consumer Myopia and Investment in Customer-Tracking Technology, February 2014.
130 Clemens, Georg and Rau, Holger A., Do Leniency Policies Facilitate Collusion? Experimental Evidence, January 2014.
129 Hottenrott, Hanna and Lawson, Cornelia, Fishing for Complementarities: Competitive Research Funding and Research Productivity, December 2013.
128 Hottenrott, Hanna and Rexhäuser, Sascha, Policy-Induced Environmental Technology and Inventive Efforts: Is There a Crowding Out?, December 2013. Forthcoming in: Industry and Innovation.
127 Dauth, Wolfgang, Findeisen, Sebastian and Suedekum, Jens, The Rise of the East and the Far East: German Labor Markets and Trade Integration, December 2013. Published in: Journal of the European Economic Association, 12 (2014), pp. 1643-1675.
126 Wenzel, Tobias, Consumer Myopia, Competition and the Incentives to Unshroud Add-on Information, December 2013. Published in: Journal of Economic Behavior and Organization, 98 (2014), pp. 89-96.
125 Schwarz, Christian and Suedekum, Jens, Global Sourcing of Complex Production Processes, December 2013. Published in: Journal of International Economics, 93 (2014), pp. 123-139.
124 Defever, Fabrice and Suedekum, Jens, Financial Liberalization and the Relationship-Specificity of Exports, December 2013. Published in: Economics Letters, 122 (2014), pp. 375-379.
123 Bauernschuster, Stefan, Falck, Oliver, Heblich, Stephan and Suedekum, Jens, Why Are Educated and Risk-Loving Persons More Mobile Across Regions?, December 2013. Published in: Journal of Economic Behavior and Organization, 98 (2014), pp. 56-69.
122 Hottenrott, Hanna and Lopes-Bento, Cindy, Quantity or Quality? Knowledge Alliances and their Effects on Patenting, December 2013. Forthcoming in: Industrial and Corporate Change.
121 Hottenrott, Hanna and Lopes-Bento, Cindy, (International) R&D Collaboration and SMEs: The Effectiveness of Targeted Public R&D Support Schemes, December 2013. Published in: Research Policy, 43 (2014), pp.1055-1066.
120 Giesen, Kristian and Suedekum, Jens, City Age and City Size, November 2013. Published in: European Economic Review, 71 (2014), pp. 193-208.
119 Trax, Michaela, Brunow, Stephan and Suedekum, Jens, Cultural Diversity and Plant-Level Productivity, November 2013.
118 Manasakis, Constantine and Vlassis, Minas, Downstream Mode of Competition with Upstream Market Power, November 2013. Published in: Research in Economics, 68 (2014), pp. 84-93.
117 Sapi, Geza and Suleymanova, Irina, Consumer Flexibility, Data Quality and Targeted Pricing, November 2013.
116 Hinloopen, Jeroen, Müller, Wieland and Normann, Hans-Theo, Output Commitment Through Product Bundling: Experimental Evidence, November 2013. Published in: European Economic Review, 65 (2014), pp. 164-180.
115 Baumann, Florian, Denter, Philipp and Friehe Tim, Hide or Show? Endogenous Observability of Private Precautions Against Crime When Property Value is Private Information, November 2013.
114 Fan, Ying, Kühn, Kai-Uwe and Lafontaine, Francine, Financial Constraints and Moral Hazard: The Case of Franchising, November 2013.
113 Aguzzoni, Luca, Argentesi, Elena, Buccirossi, Paolo, Ciari, Lorenzo, Duso, Tomaso, Tognoni, Massimo and Vitale, Cristiana, They Played the Merger Game: A Retrospective Analysis in the UK Videogames Market, October 2013. Published in: Journal of Competition Law and Economics under the title: “A Retrospective Merger Analysis in the UK Videogame Market”, (10) (2014), pp. 933-958.
112 Myrseth, Kristian Ove R., Riener, Gerhard and Wollbrant, Conny, Tangible Temptation in the Social Dilemma: Cash, Cooperation, and Self-Control, October 2013.
111 Hasnas, Irina, Lambertini, Luca and Palestini, Arsen, Open Innovation in a Dynamic Cournot Duopoly, October 2013. Published in: Economic Modelling, 36 (2014), pp. 79-87.
110 Baumann, Florian and Friehe, Tim, Competitive Pressure and Corporate Crime, September 2013.
109 Böckers, Veit, Haucap, Justus and Heimeshoff, Ulrich, Benefits of an Integrated European Electricity Market, September 2013.
108 Normann, Hans-Theo and Tan, Elaine S., Effects of Different Cartel Policies: Evidence from the German Power-Cable Industry, September 2013. Published in: Industrial and Corporate Change, 23 (2014), pp. 1037-1057.
107 Haucap, Justus, Heimeshoff, Ulrich, Klein, Gordon J., Rickert, Dennis and Wey, Christian, Bargaining Power in Manufacturer-Retailer Relationships, September 2013.
106 Baumann, Florian and Friehe, Tim, Design Standards and Technology Adoption: Welfare Effects of Increasing Environmental Fines when the Number of Firms is Endogenous, September 2013.
105 Jeitschko, Thomas D., NYSE Changing Hands: Antitrust and Attempted Acquisitions of an Erstwhile Monopoly, August 2013. Published in: Journal of Stock and Forex Trading, 2 (2) (2013), pp. 1-6.
104 Böckers, Veit, Giessing, Leonie and Rösch, Jürgen, The Green Game Changer: An Empirical Assessment of the Effects of Wind and Solar Power on the Merit Order, August 2013.
103 Haucap, Justus and Muck, Johannes, What Drives the Relevance and Reputation of Economics Journals? An Update from a Survey among Economists, August 2013. Published in: Scientometrics, 103 (2015), pp. 849-877.
102 Jovanovic, Dragan and Wey, Christian, Passive Partial Ownership, Sneaky Takeovers, and Merger Control, August 2013. Published in: Economics Letters, 125 (2014), pp. 32-35.
101 Haucap, Justus, Heimeshoff, Ulrich, Klein, Gordon J., Rickert, Dennis and Wey, Christian, Inter-Format Competition Among Retailers – The Role of Private Label Products in Market Delineation, August 2013.
100 Normann, Hans-Theo, Requate, Till and Waichman, Israel, Do Short-Term Laboratory Experiments Provide Valid Descriptions of Long-Term Economic Interactions? A Study of Cournot Markets, July 2013. Published in: Experimental Economics, 17 (2014), pp. 371-390.
99 Dertwinkel-Kalt, Markus, Haucap, Justus and Wey, Christian, Input Price Discrimination (Bans), Entry and Welfare, June 2013.
98 Aguzzoni, Luca, Argentesi, Elena, Ciari, Lorenzo, Duso, Tomaso and Tognoni, Massimo, Ex-post Merger Evaluation in the UK Retail Market for Books, June 2013. Forthcoming in: Journal of Industrial Economics.
97 Caprice, Stéphane and von Schlippenbach, Vanessa, One-Stop Shopping as a Cause of Slotting Fees: A Rent-Shifting Mechanism, May 2012. Published in: Journal of Economics and Management Strategy, 22 (2013), pp. 468-487.
96 Wenzel, Tobias, Independent Service Operators in ATM Markets, June 2013. Published in: Scottish Journal of Political Economy, 61 (2014), pp. 26-47.
95 Coublucq, Daniel, Econometric Analysis of Productivity with Measurement Error: Empirical Application to the US Railroad Industry, June 2013.
94 Coublucq, Daniel, Demand Estimation with Selection Bias: A Dynamic Game Approach with an Application to the US Railroad Industry, June 2013.
93 Baumann, Florian and Friehe, Tim, Status Concerns as a Motive for Crime?, April 2013. A revised version of the paper is forthcoming in: International Review of Law and Economics.
92 Jeitschko, Thomas D. and Zhang, Nanyun, Adverse Effects of Patent Pooling on Product Development and Commercialization, April 2013. Published in: The B. E. Journal of Theoretical Economics, 14 (1) (2014), Art. No. 2013-0038.
91 Baumann, Florian and Friehe, Tim, Private Protection Against Crime when Property Value is Private Information, April 2013. Published in: International Review of Law and Economics, 35 (2013), pp. 73-79.
90 Baumann, Florian and Friehe, Tim, Cheap Talk About the Detection Probability, April 2013. Published in: International Game Theory Review, 15 (2013), Art. No. 1350003.
89 Pagel, Beatrice and Wey, Christian, How to Counter Union Power? Equilibrium Mergers in International Oligopoly, April 2013.
88 Jovanovic, Dragan, Mergers, Managerial Incentives, and Efficiencies, April 2014 (First Version April 2013).
87 Heimeshoff, Ulrich and Klein Gordon J., Bargaining Power and Local Heroes, March 2013.
86 Bertschek, Irene, Cerquera, Daniel and Klein, Gordon J., More Bits – More Bucks? Measuring the Impact of Broadband Internet on Firm Performance, February 2013. Published in: Information Economics and Policy, 25 (2013), pp. 190-203.
85 Rasch, Alexander and Wenzel, Tobias, Piracy in a Two-Sided Software Market, February 2013. Published in: Journal of Economic Behavior & Organization, 88 (2013), pp. 78-89.
84 Bataille, Marc and Steinmetz, Alexander, Intermodal Competition on Some Routes in Transportation Networks: The Case of Inter Urban Buses and Railways, January 2013.
83 Haucap, Justus and Heimeshoff, Ulrich, Google, Facebook, Amazon, eBay: Is the Internet Driving Competition or Market Monopolization?, January 2013. Published in: International Economics and Economic Policy, 11 (2014), pp. 49-61.
Older discussion papers can be found online at: http://ideas.repec.org/s/zbw/dicedp.html

ISSN 2190-9938 (online) ISBN 978-3-86304-190-8