annual report 2013 - carlsberg group · editor carlsberg group corporate affairs design and...
TRANSCRIPT
Annual Report 2013
Managementreview
Financial statements
DISCLAIMERThis Annual Report contains forward-looking statements, including statements about the Group’s sales, revenues, earnings, spending, margins, cash flow, inventory, products, actions, plans, strategies, objectives and guidance with respect to the Group’s future operating results. Forward-looking statements include, without limitation, any statement that may predict, forecast, indicate or imply future results, performance or achievements, and
may contain the words “believe, anticipate, expect, estimate, intend, plan, project, will be, will continue, will result, could, may, might”, or any variations of such words or other words with similar meanings. Any such statements are subject to risks and uncertainties that could cause the Group’s actual results to differ materially from the results discussed in such forward-looking statements. Prospect-ive information is based on management’s
then current expectations or forecasts. Such information is subject to the risk that such expectations or forecasts, or the assumptions underlying such expectations or forecasts, may change. The Group assumes no obligation to update any such forward-looking statements to reflect actual results, changes in assump-tions or changes in other factors affecting such forward-looking statements. Some important risk factors that could cause the Group’s
actual results to differ materially from those expressed in its forward-looking statements include, but are not limited to: economic and political uncertainty (including interest rates and exchange rates), financial and regulatory developments, demand for the Group’s prod-ucts, increasing industry consolidation, com-petition from other breweries, the availability and pricing of raw materials and packaging materials, cost of energy, production- and
distribution-related issues, information tech-nology failures, breach or unexpected termina-tion of contracts, price reductions resulting from market-driven price reductions, market acceptance of new products, changes in con-sumer preferences, launches of rival products, stipulation of market value in the opening balance sheet of acquired entities, litigation, environmental issues and other unforeseen factors. New risk factors can arise, and it may
not be possible for management to predict all such risk factors, nor to assess the impact of all such risk factors on the Group’s business or the extent to which any individual risk factor, or combination of factors, may cause results to differ materially from those contained in any forward-looking statement. Accordingly, forward-looking statements should not be relied on as a prediction of actual results.
Editor Carlsberg Group Corporate Affairs Design and production Kontrapunkt Photos Nana Reimers Proofreading Borella projects
3 The Carlsberg Group at a glance 8 Letter from the Chairman 9 Statement from the CEO 12 In the spotlight: Supply chain 13 Our regions 19 In the spotlight: China 20 Our business model and Strategy Wheel 21 KPIs 22 Strategy 28 CSR in the value chain 29 CSR targets 30 In the spotlight: Self-regulation 31 Risk management 35 In the spotlight: Sponsorships 36 Corporate governance 43 Remuneration report 49 Executive Committee 50 Shareholder information 52 Financial review162 Supervisory Board
54 Consolidated financial statements140 Parent Company160 Management statement161 Auditors’ report
Carlsberg Group Annual Report 2013 2Management review CONTENTS
31%75% 500
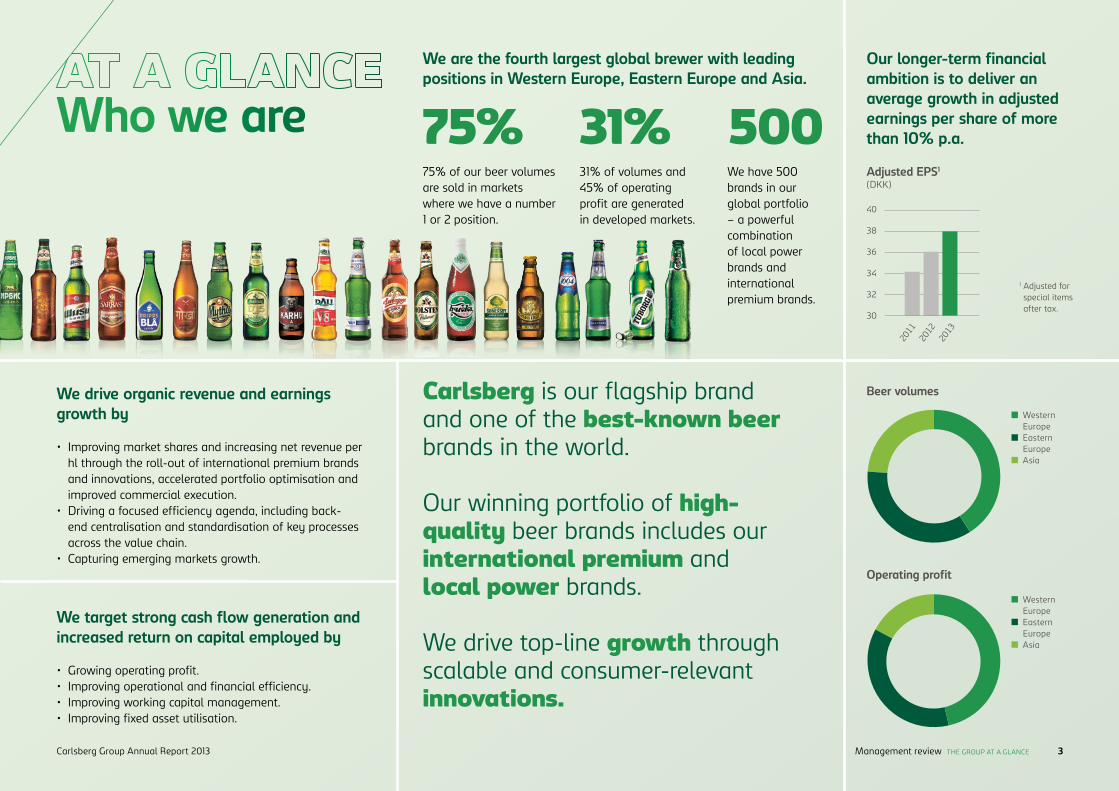
We are the fourth largest global brewer with leading positions in Western Europe, Eastern Europe and Asia.
Western Europe
Eastern Europe
Asia
Western Europe
Eastern Europe
Asia
Operating profit
Our longer-term financial ambition is to deliver an average growth in adjusted earnings per share of more than 10% p.a.
Beer volumes
40
38
36
34
32
30
2013
2012
2011
Adjusted EPS1
(DKK)31% of volumes and 45% of operating profit are generated in developed markets.
We have 500 brands in our global port folio – a powerful combina tion of local power brands and international premium brands.
75% of our beer volumes are sold in markets where we have a number 1 or 2 position.
We drive organic revenue and earnings growth by
• Improving market shares and increasing net revenue per hl through the roll-out of international premium brands and innovations, accelerated portfolio optimisation and improved commercial execution.
• Driving a focused efficiency agenda, including back-end centralisation and standardisation of key processes across the value chain.
• Capturing emerging markets growth.
Carlsberg is our flagship brand and one of the best-known beer brands in the world. Our winning portfolio of high- quality beer brands includes our international premium and local power brands. We drive top-line growth through scalable and consumer-relevant innovations.
We target strong cash flow generation and increased return on capital employed by
• Growing operating profit.• Improving operational and financial efficiency.• Improving working capital management.• Improving fixed asset utilisation.
1 Adjusted for special items after tax.
Who we are
Carlsberg Group Annual Report 2013 3Management review THE GROUP AT A GLANCE
Operational highlights
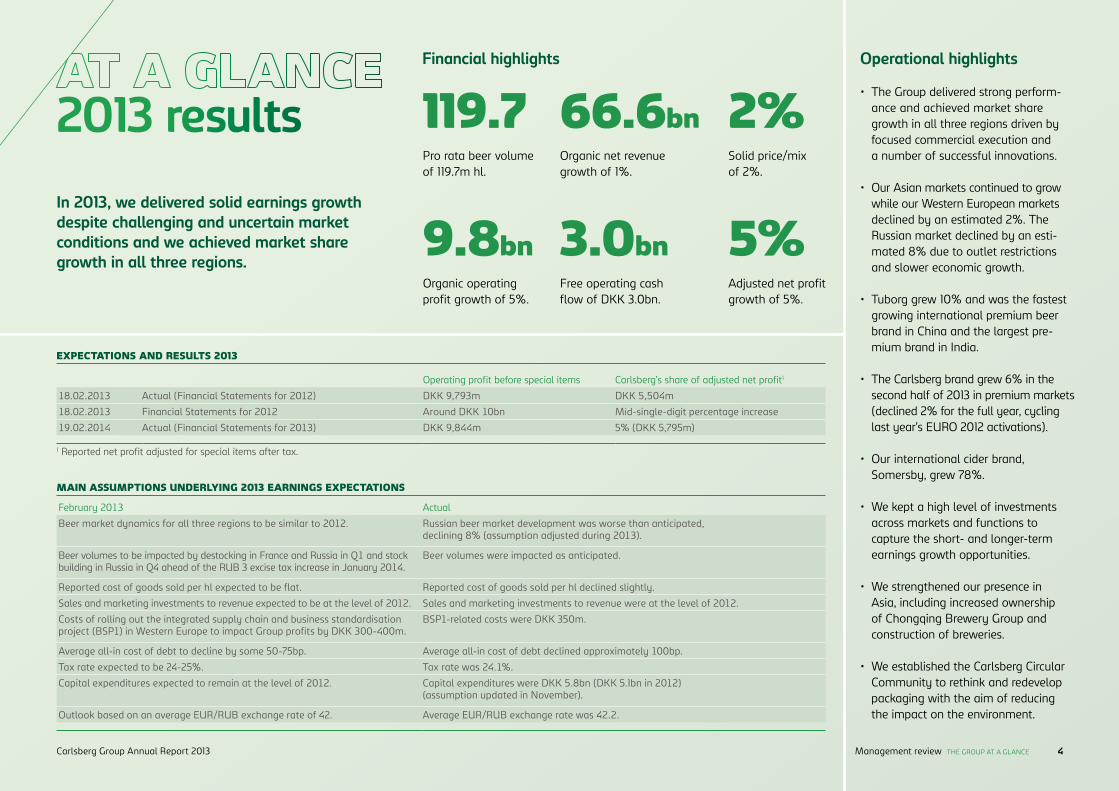
• The Group delivered strong perform-ance and achieved market share growth in all three regions driven by focused commercial execution and a number of successful innovations.
• Our Asian markets continued to grow while our Western European markets declined by an estimated 2%. The Russian market declined by an esti-mated 8% due to outlet restrictions and slower economic growth.
• Tuborg grew 10% and was the fastest growing international premium beer brand in China and the largest pre-mium brand in India.
• The Carlsberg brand grew 6% in the second half of 2013 in premium markets (declined 2% for the full year, cycling last year’s EURO 2012 activations).
• Our international cider brand, Somersby, grew 78%.
• We kept a high level of investments across markets and functions to capture the short- and longer-term earnings growth opportunities.
• We strengthened our presence in Asia, including increased ownership of Chongqing Brewery Group and construction of breweries.
• We established the Carlsberg Circular Community to rethink and redevelop packaging with the aim of reducing the impact on the environment.
In 2013, we delivered solid earnings growth despite challenging and uncertain market conditions and we achieved market share growth in all three regions.
119.7
9.8bn
66.6bn 2%
5%3.0bn
Financial highlights
Pro rata beer volume of 119.7m hl.
Organic net revenue growth of 1%.
Free operating cash flow of DKK 3.0bn.
Solid price/mix of 2%.
Adjusted net profit growth of 5%.
Organic operating profit growth of 5%.
Operating profit before special items Carlsberg’s share of adjusted net profit1
18.02.2013 Actual (Financial Statements for 2012) DKK 9,793m DKK 5,504m
18.02.2013 Financial Statements for 2012 Around DKK 10bn Mid-single-digit percentage increase
19.02.2014 Actual (Financial Statements for 2013) DKK 9,844m 5% (DKK 5,795m)
1 Reported net profit adjusted for special items after tax.
February 2013 Actual
Beer market dynamics for all three regions to be similar to 2012. Russian beer market development was worse than anticipated, declining 8% (assumption adjusted during 2013).
Beer volumes to be impacted by destocking in France and Russia in Q1 and stock building in Russia in Q4 ahead of the RUB 3 excise tax increase in January 2014.
Beer volumes were impacted as anticipated.
Reported cost of goods sold per hl expected to be flat. Reported cost of goods sold per hl declined slightly.
Sales and marketing investments to revenue expected to be at the level of 2012. Sales and marketing investments to revenue were at the level of 2012.
Costs of rolling out the integrated supply chain and business standardisation project (BSP1) in Western Europe to impact Group profits by DKK 300-400m.
BSP1-related costs were DKK 350m.
Average all-in cost of debt to decline by some 50-75bp. Average all-in cost of debt declined approximately 100bp.
Tax rate expected to be 24-25%. Tax rate was 24.1%.
Capital expenditures expected to remain at the level of 2012. Capital expenditures were DKK 5.8bn (DKK 5.1bn in 2012) (assumption updated in November).
Outlook based on an average EUR/RUB exchange rate of 42. Average EUR/RUB exchange rate was 42.2.
2013 results
MAIN ASSUMPTIONS UNDERLYING 2013 EARNINGS EXPECTATIONS
EXPECTATIONS AND RESULTS 2013
Carlsberg Group Annual Report 2013 4Management review THE GROUP AT A GLANCE
EASTERN EUROPE
WESTERN EUROPE
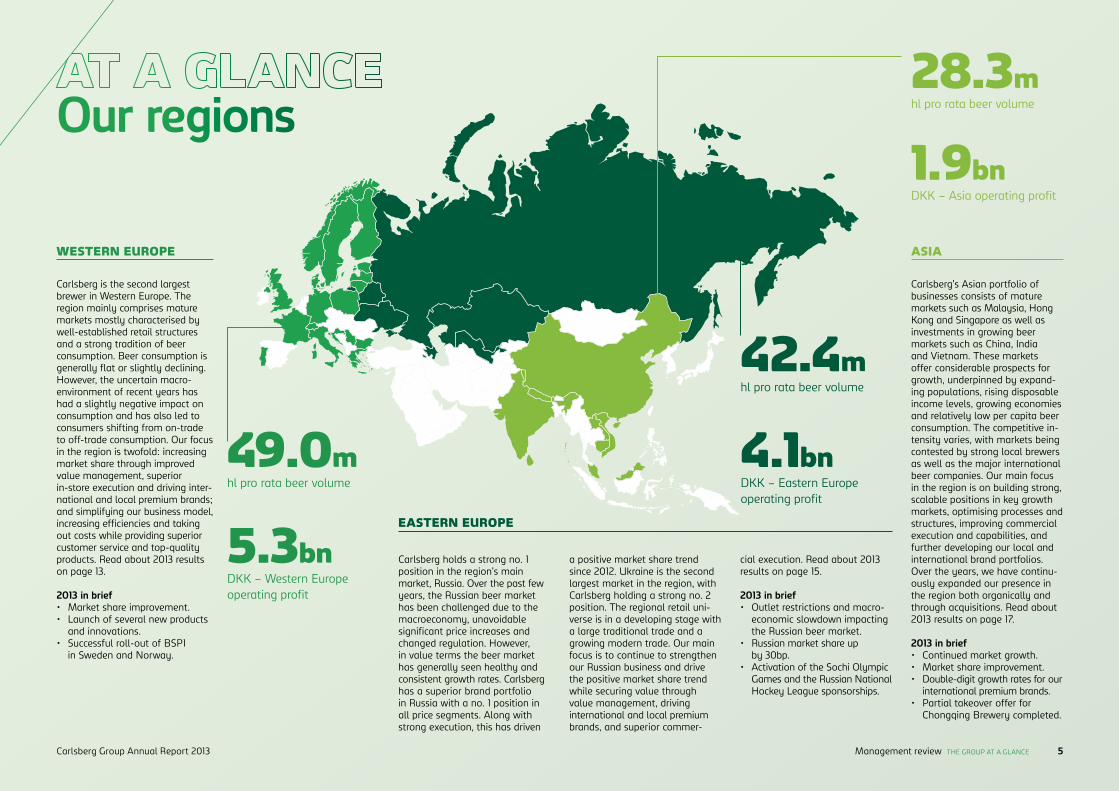
Carlsberg is the second largest brewer in Western Europe. The region mainly comprises mature markets mostly characterised by well-established retail structures and a strong tradition of beer consumption. Beer consumption is generally flat or slightly declining. However, the uncertain macro-environment of recent years has had a slightly negative impact on consumption and has also led to consumers shifting from on-trade to off-trade consumption. Our focus in the region is twofold: increasing market share through improved value management, superior in-store execution and driving inter-national and local premium brands; and simplifying our business model, increasing efficiencies and taking out costs while providing superior customer service and top-quality products. Read about 2013 results on page 13.
2013 in brief• Market share improvement.• Launch of several new products
and innovations. • Successful roll-out of BSP1
in Sweden and Norway.
Carlsberg holds a strong no. 1 position in the region’s main market, Russia. Over the past few years, the Russian beer market has been challenged due to the macroeconomy, unavoidable significant price increases and changed regulation. However, in value terms the beer market has generally seen healthy and consistent growth rates. Carlsberg has a superior brand portfolio in Russia with a no. 1 position in all price segments. Along with strong execution, this has driven
a positive market share trend since 2012. Ukraine is the second largest market in the region, with Carlsberg holding a strong no. 2 position. The regional retail uni-verse is in a developing stage with a large traditional trade and a growing modern trade. Our main focus is to continue to strengthen our Russian business and drive the positive market share trend while securing value through value management, driving international and local premium brands, and superior commer-
cial execution. Read about 2013 results on page 15.
2013 in brief• Outlet restrictions and macro-
economic slowdown impacting the Russian beer market.
• Russian market share up by 30bp.
• Activation of the Sochi Olympic Games and the Russian National Hockey League sponsorships.
Our regions
49.0m 4.1bn
42.4m
5.3bn
28.3m
1.9bn
hl pro rata beer volume DKK – Eastern Europe operating profit
hl pro rata beer volume
DKK – Western Europe operating profit
hl pro rata beer volume
DKK – Asia operating profit
ASIA
Carlsberg’s Asian portfolio of businesses consists of mature markets such as Malaysia, Hong Kong and Singapore as well as investments in growing beer markets such as China, India and Vietnam. These markets offer considerable prospects for growth, underpinned by expand-ing populations, rising disposable income levels, growing economies and relatively low per capita beer consumption. The competitive in-tensity varies, with markets being contested by strong local brewers as well as the major international beer companies. Our main focus in the region is on building strong, scalable positions in key growth markets, optimising processes and structures, improving commercial execution and capabilities, and further developing our local and international brand portfolios. Over the years, we have continu-ously expanded our presence in the region both organically and through acquisitions. Read about 2013 results on page 17.
2013 in brief• Continued market growth. • Market share improvement.• Double-digit growth rates for our
international premium brands. • Partial takeover offer for
Chongqing Brewery completed.
Carlsberg Group Annual Report 2013 5Management review THE GROUP AT A GLANCE
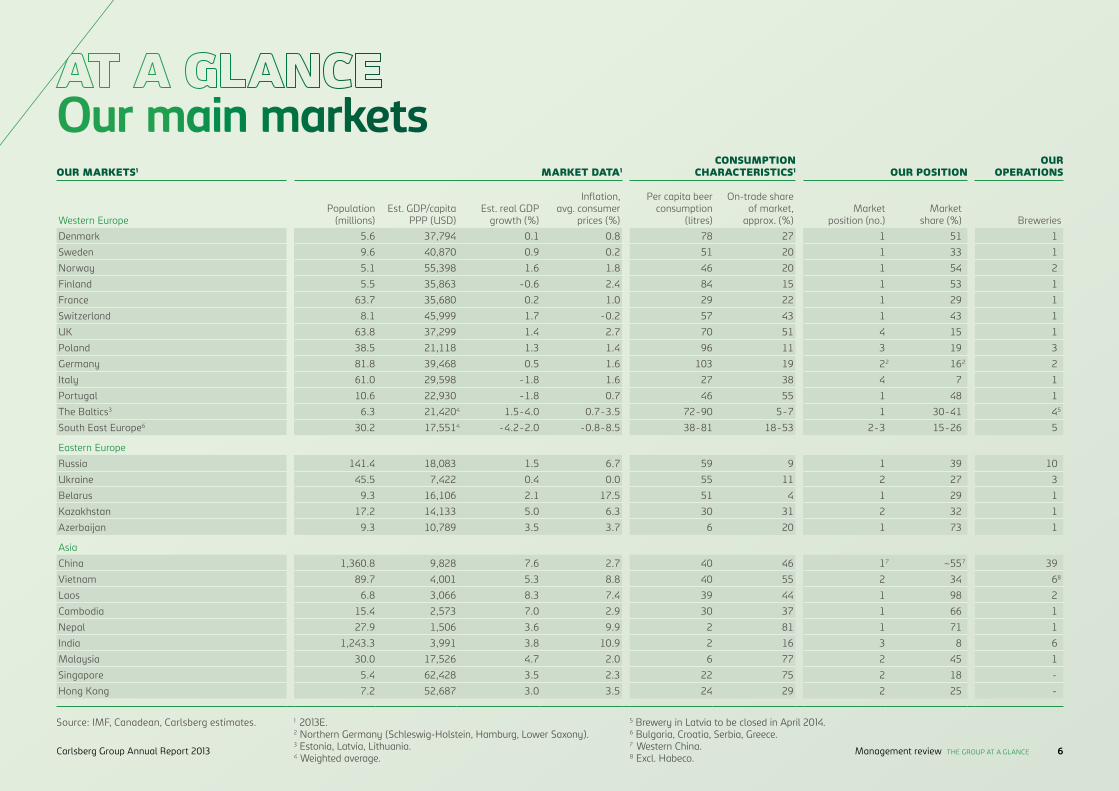
OUR MARKETS1
MARKET DATA1
CONSUMPTION CHARACTERISTICS1
OUR POSITION
OUR OPERATIONS
Western EuropePopulation
(millions)Est. GDP/capita
PPP (USD)Est. real GDP
growth (%)
Inflation, avg. consumer
prices (%)
Per capita beer consumption
(litres)
On-trade share of market,
approx. (%)Market
position (no.)Market
share (%) Breweries
Denmark 5.6 37,794 0.1 0.8 78 27 1 51 1
Sweden 9.6 40,870 0.9 0.2 51 20 1 33 1
Norway 5.1 55,398 1.6 1.8 46 20 1 54 2
Finland 5.5 35,863 -0.6 2.4 84 15 1 53 1
France 63.7 35,680 0.2 1.0 29 22 1 29 1
Switzerland 8.1 45,999 1.7 -0.2 57 43 1 43 1
UK 63.8 37,299 1.4 2.7 70 51 4 15 1
Poland 38.5 21,118 1.3 1.4 96 11 3 19 3
Germany 81.8 39,468 0.5 1.6 103 19 2 16 2
Italy 61.0 29,598 -1.8 1.6 27 38 4 7 1
Portugal 10.6 22,930 -1.8 0.7 46 55 1 48 1
The Baltics3 6.3 21,420 1.5-4.0 0.7-3.5 72-90 5-7 1 30-41 4
South East Europe6 30.2 17,551 -4.2-2.0 -0.8-8.5 38-81 18-53 2-3 15-26 5
Eastern Europe
Russia 141.4 18,083 1.5 6.7 59 9 1 39 10
Ukraine 45.5 7,422 0.4 0.0 55 11 2 27 3
Belarus 9.3 16,106 2.1 17.5 51 4 1 29 1
Kazakhstan 17.2 14,133 5.0 6.3 30 31 2 32 1
Azerbaijan 9.3 10,789 3.5 3.7 6 20 1 73 1
Asia
China 1,360.8 9,828 7.6 2.7 40 46 1 ~55 39
Vietnam 89.7 4,001 5.3 8.8 40 55 2 34 6
Laos 6.8 3,066 8.3 7.4 39 44 1 98 2
Cambodia 15.4 2,573 7.0 2.9 30 37 1 66 1
Nepal 27.9 1,506 3.6 9.9 2 81 1 71 1
India 1,243.3 3,991 3.8 10.9 2 16 3 8 6
Malaysia 30.0 17,526 4.7 2.0 6 77 2 45 1
Singapore 5.4 62,428 3.5 2.3 22 75 2 18 -
Hong Kong 7.2 52,687 3.0 3.5 24 29 2 25 -
Source: IMF, Canadean, Carlsberg estimates.
Our main markets
1 2013E.2 Northern Germany (Schleswig-Holstein, Hamburg, Lower Saxony).3 Estonia, Latvia, Lithuania.4 Weighted average.
5 Brewery in Latvia to be closed in April 2014.6 Bulgaria, Croatia, Serbia, Greece.7 Western China.8 Excl. Habeco.
4
2
7
2
7
4
5
8
Carlsberg Group Annual Report 2013 6Management review THE GROUP AT A GLANCE
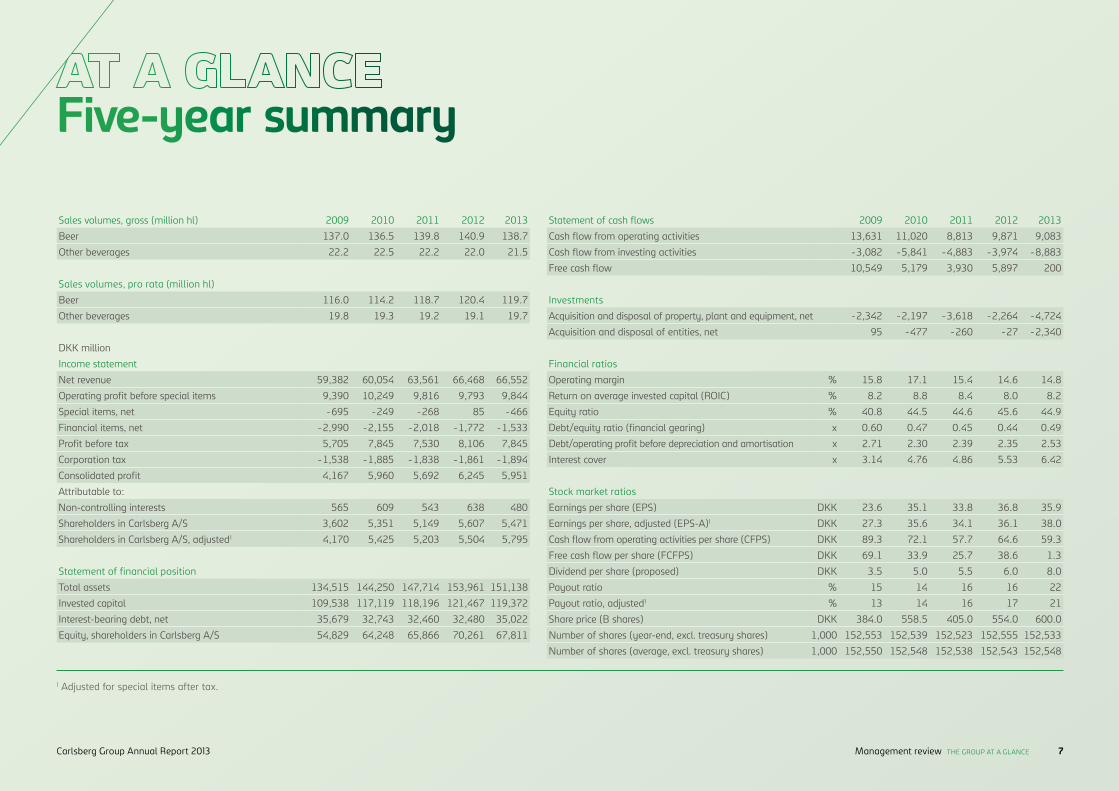
Statement of cash flows 2009 2010 2011 2012 2013
Cash flow from operating activities 13,631 11,020 8,813 9,871 9,083
Cash flow from investing activities -3,082 -5,841 -4,883 -3,974 -8,883
Free cash flow 10,549 5,179 3,930 5,897 200
Investments
Acquisition and disposal of property, plant and equipment, net -2,342 -2,197 -3,618 -2,264 -4,724
Acquisition and disposal of entities, net 95 -477 -260 -27 -2,340
Financial ratios
Operating margin % 15.8 17.1 15.4 14.6 14.8
Return on average invested capital (ROIC) % 8.2 8.8 8.4 8.0 8.2
Equity ratio % 40.8 44.5 44.6 45.6 44.9
Debt/equity ratio (financial gearing) x 0.60 0.47 0.45 0.44 0.49
Debt/operating profit before depreciation and amortisation x 2.71 2.30 2.39 2.35 2.53
Interest cover x 3.14 4.76 4.86 5.53 6.42
Stock market ratios
Earnings per share (EPS) DKK 23.6 35.1 33.8 36.8 35.9
Earnings per share, adjusted (EPS-A)1 DKK 27.3 35.6 34.1 36.1 38.0
Cash flow from operating activities per share (CFPS) DKK 89.3 72.1 57.7 64.6 59.3
Free cash flow per share (FCFPS) DKK 69.1 33.9 25.7 38.6 1.3
Dividend per share (proposed) DKK 3.5 5.0 5.5 6.0 8.0
Payout ratio % 15 14 16 16 22
Payout ratio, adjusted1 % 13 14 16 17 21
Share price (B shares) DKK 384.0 558.5 405.0 554.0 600.0
Number of shares (year-end, excl. treasury shares) 1,000 152,553 152,539 152,523 152,555 152,533
Number of shares (average, excl. treasury shares) 1,000 152,550 152,548 152,538 152,543 152,548
1 Adjusted for special items after tax.
Five-year summary
Sales volumes, gross (million hl) 2009 2010 2011 2012 2013
Beer 137.0 136.5 139.8 140.9 138.7
Other beverages 22.2 22.5 22.2 22.0 21.5
Sales volumes, pro rata (million hl)
Beer 116.0 114.2 118.7 120.4 119.7
Other beverages 19.8 19.3 19.2 19.1 19.7
DKK million
Income statement
Net revenue 59,382 60,054 63,561 66,468 66,552
Operating profit before special items 9,390 10,249 9,816 9,793 9,844
Special items, net -695 -249 -268 85 -466
Financial items, net -2,990 -2,155 -2,018 -1,772 -1,533
Profit before tax 5,705 7,845 7,530 8,106 7,845
Corporation tax -1,538 -1,885 -1,838 -1,861 -1,894
Consolidated profit 4,167 5,960 5,692 6,245 5,951
Attributable to:
Non-controlling interests 565 609 543 638 480
Shareholders in Carlsberg A/S 3,602 5,351 5,149 5,607 5,471
Shareholders in Carlsberg A/S, adjusted1 4,170 5,425 5,203 5,504 5,795
Statement of financial position
Total assets 134,515 144,250 147,714 153,961 151,138
Invested capital 109,538 117,119 118,196 121,467 119,372
Interest-bearing debt, net 35,679 32,743 32,460 32,480 35,022
Equity, shareholders in Carlsberg A/S 54,829 64,248 65,866 70,261 67,811
Carlsberg Group Annual Report 2013 7Management review THE GROUP AT A GLANCE
Our core business is beer and we are proud of our long history of making beer of su-perior quality. Research and innovation are part of our legacy and remain important to this day in enabling us to continuously brew and market high-quality consumer-relevant products. We have always maintained our commitment to research and development as we acknowledge the importance of bring-ing both improved and new products to our markets in order to deliver value growth.
Growth and efficiency remain key focus areas for Carlsberg and 2013 further emphasised the importance of our continued focus on deliver-ing superior commercial execution. We aspire to continuously grow and develop our busi-ness organically as well as to further stream-line our operations in order to create value for shareholders and all other stakeholders.
As a representative of the Carlsberg Foun-dation, the largest shareholder in Carlsberg A/S, I am pleased that in 2013 the Founda-tion obtained approval from the Danish Ministry of Justice to change its Charter.
Since 1888, when the Foundation became the owner of Carlsberg, the Foundation has carefully respected the legacy of our found-er, J.C. Jacobsen, ensuring that the principles of the Foundation continue to be adapted to remain relevant for the present day.
In March 2013, the Company paid a dividend for 2012 of DKK 6.00 per share. As the Carls-berg B share gained 8% in the year, the total shareholder return for 2013 for the Carlsberg B share was 9%.
The change in the Charter of the Carls-berg Foundation has increased the Group’s
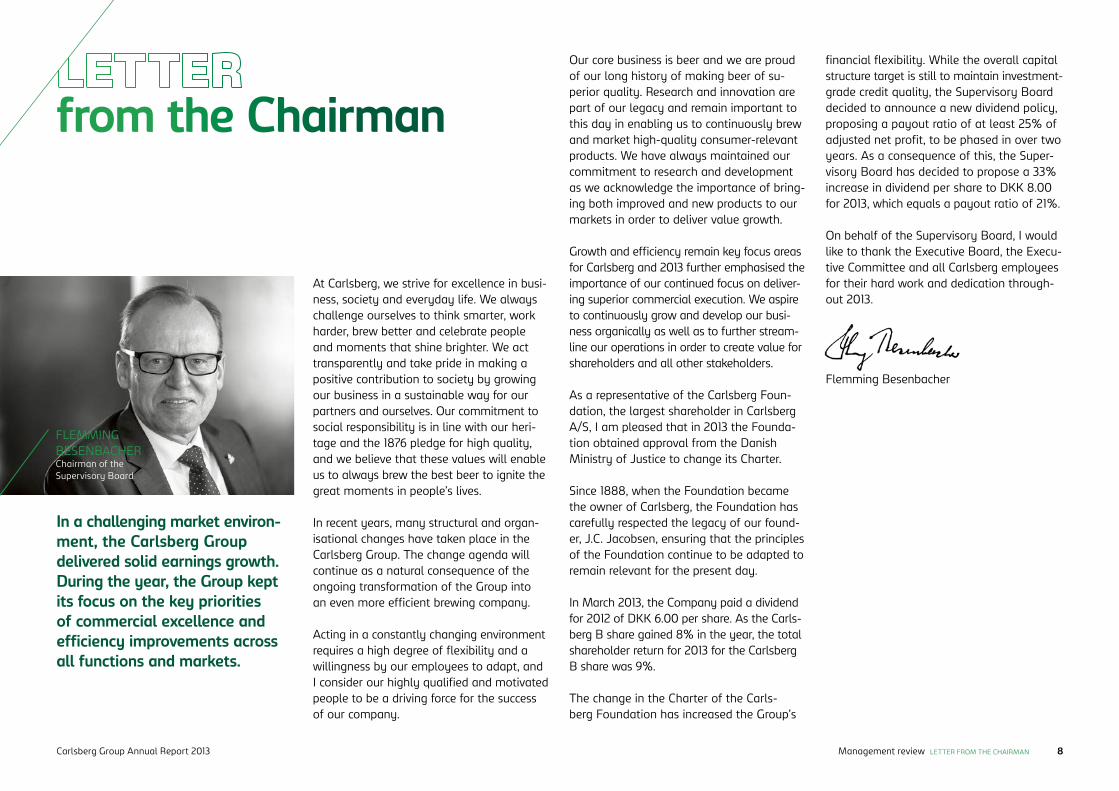
In a challenging market environ-ment, the Carlsberg Group delivered solid earnings growth. During the year, the Group kept its focus on the key priorities of commercial excellence and efficiency improvements across all functions and markets.
from the Chairmanfinan cial flexibility. While the overall capital structure target is still to maintain investment-grade credit quality, the Supervisory Board decided to announce a new dividend policy, proposing a payout ratio of at least 25% of adjusted net profit, to be phased in over two years. As a consequence of this, the Super-visory Board has decided to propose a 33% increase in dividend per share to DKK 8.00 for 2013, which equals a payout ratio of 21%.
On behalf of the Supervisory Board, I would like to thank the Executive Board, the Execu-tive Committee and all Carlsberg employees for their hard work and dedication through-out 2013.
Flemming Besenbacher
FLEMMING BESENBACHERChairman of the Supervisory Board
At Carlsberg, we strive for excellence in busi-ness, society and everyday life. We always challenge ourselves to think smarter, work harder, brew better and celebrate people and moments that shine brighter. We act transparently and take pride in making a positive contribution to society by growing our business in a sustainable way for our partners and ourselves. Our commitment to social responsibility is in line with our heri-tage and the 1876 pledge for high quality, and we believe that these values will enable us to always brew the best beer to ignite the great moments in people’s lives.
In recent years, many structural and organ-isational changes have taken place in the Carlsberg Group. The change agenda will continue as a natural consequence of the ongoing transformation of the Group into an even more efficient brewing company.
Acting in a constantly changing environment requires a high degree of flexibility and a willingness by our employees to adapt, and I consider our highly qualified and motivated people to be a driving force for the success of our company.
Carlsberg Group Annual Report 2013 8Management review LETTER FROM THE CHAIRMAN
Ensuring an appropriate balance between volume and value in all our markets is key to the Carlsberg Group and in 2013 we again im-proved both net revenue and gross profit per hl.
STRONG BRAND PORTFOLIO The Carlsberg Group has a very strong portfolio of brands addressing the relevant consumer needs and occasions. An import-ant part of our commercial strategy and an important means to continued improvement in our market share is to grow our strong lo-cal power brands as well as our international premium brands – Carlsberg, Tuborg, Kronen-bourg 1664, Grimbergen and Somersby.
The Carlsberg brand grew its volumes in the premium markets in the second half of the year but declined 2% for the full year as we were cycling last year’s EURO 2012 activations, when the brand grew 8%. In Asia, the brand showed particularly strong performance in China and India. During the year, we rolled out the innovative music en-gagement programme “Where’s the Party?” in 20 markets; started activation of our English Premier League sponsorship in 53 markets, including the launch of the innova-tive “Strikr” app, which is the first app to let fans have real-time football conversation on Twitter; and renewed our long-standing partnership with Liverpool FC. The activa-tion on digital media platforms continued successfully and the viral “Carlsberg puts friends to the test” achieved over 13m views on YouTube.
The Tuborg brand grew 10% for the year. The growth was mainly driven by very strong performance in Asia, not least in China and India. We continued the brand’s rejuvenation programme, supported by the launch of Tu-
borg Booster in India, the new Tuborg bottle in the UK and the launch of Skøll by Tuborg in France.
Kronenbourg 1664 continued its positive momentum with 6% growth (excluding France, which was impacted by destocking following a significant excise duty increase). We introduced the brand in new markets, and the successful roll-out of the wheat beer Kronenbourg Blanc contributed to the overall brand development, particularly in Asia.
Our cider brand, Somersby, continued its very strong progress and grew 78%. The key drivers behind the growth were the launch in the UK, continued positive performance in Poland and line extensions in established markets such as Wild Cactus by Somersby in Denmark and Double Press in Norway. The brand is now available in 40 markets around the world and I am proud of the fact that it continues to be the fastest growing interna-tional cider brand.
The Group’s Belgian abbey beer Grimbergen continued its successful expansion in 2013 and is now available in 33 markets globally. Dur-ing the year, Grimbergen was launched in nine new markets, including Denmark and Poland, and we took over the distribution in Russia.
CSRIn 2013, we delivered on our three-year targets for energy and CO2 and we almost succeeded in reaching our three-year target for water. We have subsequently set new three-year targets to maintain the leading position among our international peers.
A key priority in our CSR efforts is packaging. In order to reduce dependency on primary
In 2013, the Carlsberg Group delivered solid earnings growth driven by strong and focused execution in the front and back ends of the business. Operating profit increased organically by 5% and adjusted net profit increased by 5%.
from the CEO
We delivered our solid results in a year of challenging macroenvironment in West-ern and Eastern Europe. In Russia, the beer market was even further challenged by the outlet restrictions that came into force in January. Our results demonstrate our ability to constantly execute and innovate effect-ively while maintaining tight control of our costs.
BALANCING VOLUME AND VALUEI am pleased to report that this year the Group once again achieved volume and value market share growth in all our regions as a result of our strong international and local brand portfolio, a number of successful innovations, and our powerful commercial execution, including effective use of our best-in-class sales and marketing tools such as portfolio optimisation and value management.
Despite the positive development in our market share, Group beer volumes declined organically by 2%. The growing volumes in Asia were not enough to offset the volume decline in Eastern and Western Europe caused by declining markets.
JØRGEN BUHL RASMUSSENPresident & CEO
Carlsberg Group Annual Report 2013 9Management review STATEMENT FROM THE CEO
materials and become more resilient to poten-tial resource scarcity and increased costs in the future, we have joined forces with key global partners to rethink the design and produc-tion of packaging material. The cooperation was formalised in 2013 through the Carlsberg Circular Community (CCC), where Carlsberg, together with our partners, will develop the next generation of packaging solutions opti-mised for reuse or recycling. CCC was officially launched during the annual World Economic Forum meeting in Davos in January 2014.
THE SUPPLY CHAIN INTEGRATION AND BUSINESS STANDARDISATION PROJECT2013 marked the beginning of the roll-out of the supply chain integration and business standardisation project (BSP1) in Western Europe. The purpose of BSP1 is to improve capabilities, customer service and efficiency, and increase speed and asset utilisation.
The first markets to go live were Sweden in April, followed by Norway in November. The next market to go live will be the UK in 2014. The implementation process is running according to schedule and with no major disruption to our daily business.
We delivered strong operational performance and underlying earnings growth while investing in growth and efficiency opportunities.
JØRGEN BUHL RASMUSSENPresident & CEO
EARNINGS EXPECTATIONS
2014 is expected to be a year when the Carlsberg Group will continue to build on the strengths of our company to ensure that we capture both the short- and longer-term opportunities that are present in our markets. To do so, we will:• Further develop and invest in our Asian
business to ensure that we continuously position it to capture the growth oppor-tunities in the region.
• Drive the ongoing efficiency improve-ments in Western Europe and maintain a focused commercial agenda that will further strengthen our business and the region’s profitability.
• Utilise the strength of our Russian brand portfolio, route-to-market, innovation capabilities and execution skills to further strengthen our market position and improve profitability.
We will continue our tight cost agenda across all markets and functions to ensure that the Group delivers earnings growth. In 2014, the focus on strong execution, both internally and externally, will be even more important as we assume significant head-wind from currencies.
IMPLEMENTATION OF CHANGE IN ACCOUNTING POLICIESNew accounting standards coming into ef-fect as of 1 January 2014 mean that it will no longer be possible to proportionately consolidate jointly controlled entities such as Unicer in Portugal and Cambrew in Cam-bodia1. Proportionately consolidated entities will hereafter be recognised as associates.
Restated income statement and segment reporting by region (beverages) for 2013 are included in section 9.3 in the consolidated fi-nancial statements. Following the change in accounting policies, the restated net interest-bearing debt was DKK 34,634m (reported DKK 35,022m).
2014 EARNINGS EXPECTATIONSBased on restated figures for 20131, for 2014 the Group expects:• Operating profit to grow organically by
high-single-digit percentages (reported mid-single-digit percentage growth).
• Reported adjusted net profit2 to grow by mid-single-digit percentages.
The major assumptions behind the outlook are listed below.
The outlook, in reported terms, is based on an assumed 2014 average for our major currencies calculated on forward rates, including an average EUR/RUB exchange rate of around 49 (an EUR/RUB change of +/- 1 impacts Group operating profit by slightly less than +/- DKK 100m).
For 2014, the Group assumes the following market development in our major markets/regions:• The Western European beer markets will
decline slightly as consumers in many markets remain under pressure, in spite of the macroeconomic situation in some markets having improved slightly in the second half of 2013.
• The Russian market will decline low-single-digit in volume terms, while continuing healthy value growth. The Russian beer market will be impacted by the macroeconomic slowdown and weaker consumer sentiment. The outlook assumes that no new regulations will be implemented following the significant regulatory changes which have been introduced in recent years.
• The Asian markets will continue to grow in line with 2013.
Based on restated figures1, reported cost of goods sold per hl is expected to be lower than in 2013. In organic terms, cost of goods sold per hl is expected to be similar to last year.
Based on restated figures1, sales and market-ing investments to net revenue is expected to remain at a similar level to last year.
Costs related to the integrated supply chain and business standardisation project in West-ern Europe are expected to impact Group operating profit in 2014 by DKK 450-500m.
Average all-in cost of debt is assumed to be similar to 2013.
The tax rate is expected to be 24-25%.
Capital expenditures are expected to be at the level of 2013 with continued capacity investments in Asia. In 2014, the DKK 1.4bn acquisition of Chongqing Beer Group Assets Management is expected to be completed.
1 See section 9.3 in the consolidated financial statements. 2 Adjusted for special items after tax.Carlsberg Group Annual Report 2013 10Management review STATEMENT FROM THE CEO

STRUCTURAL CHANGES During the year, we took several steps in Asia to further strengthen the Carlsberg Group’s growth profile.
In China, we initiated the construction of a new brewery in the Yunnan province in October. The brewery is expected to be operational in 2015. During the year, we increased our share-holdings in the Qinghai and Lanzhou joint ventures to 50%. In December, we finalised the partial takeover offer for the shares in Chongqing Brewery Company and now own 60% of the company. Also in December, we announced the purchase of 100% of Chong-qing Beer Group Assets Management, further expanding our footprint in China. The approvals for that transaction are still pending.
In August, we started the construction of the first international brewery in Myanmar. The brewery is expected to be operational in the second half of 2014.
Finally, in Laos we increased our shareholding in Lao Brewery by 10% to 61% and in Tibet, we increased our shareholding in Lhasa Brewery to 50%.
LOOKING AHEADIn 2014 and beyond, we will continue to in-vest in growth and efficiency opportunities, and build on the strengths of the Carlsberg Group to ensure that we capture both the short- and longer-term opportunities that are present in our markets. To do so, we will further develop and invest in our Asian busi-ness to ensure that we continuously position it to capture the growth opportunities in the region. In Western Europe, we will change our business model and organisation, and drive the ongoing efficiency improvements
while maintaining a focused commercial agenda that will further strengthen our business and the region’s profitability. And in Russia, we will utilise the strength of our Russian brand portfolio, route-to-market, innovation capabilities and execution skills to further strengthen our market position and improve profitability.
We will continue our tight cost agenda across all markets and functions to ensure that the
the Group achieving its goals and ambitions. I would also like to thank our shareholders for their support, and our customers, partners and suppliers for their cooperation.
Jørgen Buhl Rasmussen
Group delivers earnings growth. In 2014, the focus on strong execution, both internally and externally, will be even more important as we assume significant headwind from currencies.
THANK YOUI would like to extend my appreciation to the Group’s employees around the world for their hard work and burning passion for our company. Our employees are instrumental in
The Ukrainian market declined by an estimated 7-8% in 2013. We launched a number of innovations such as line extensions of the Baltika and Lvivske brands and kept our market share flat.
Carlsberg Group Annual Report 2013 11Management review STATEMENT FROM THE CEO
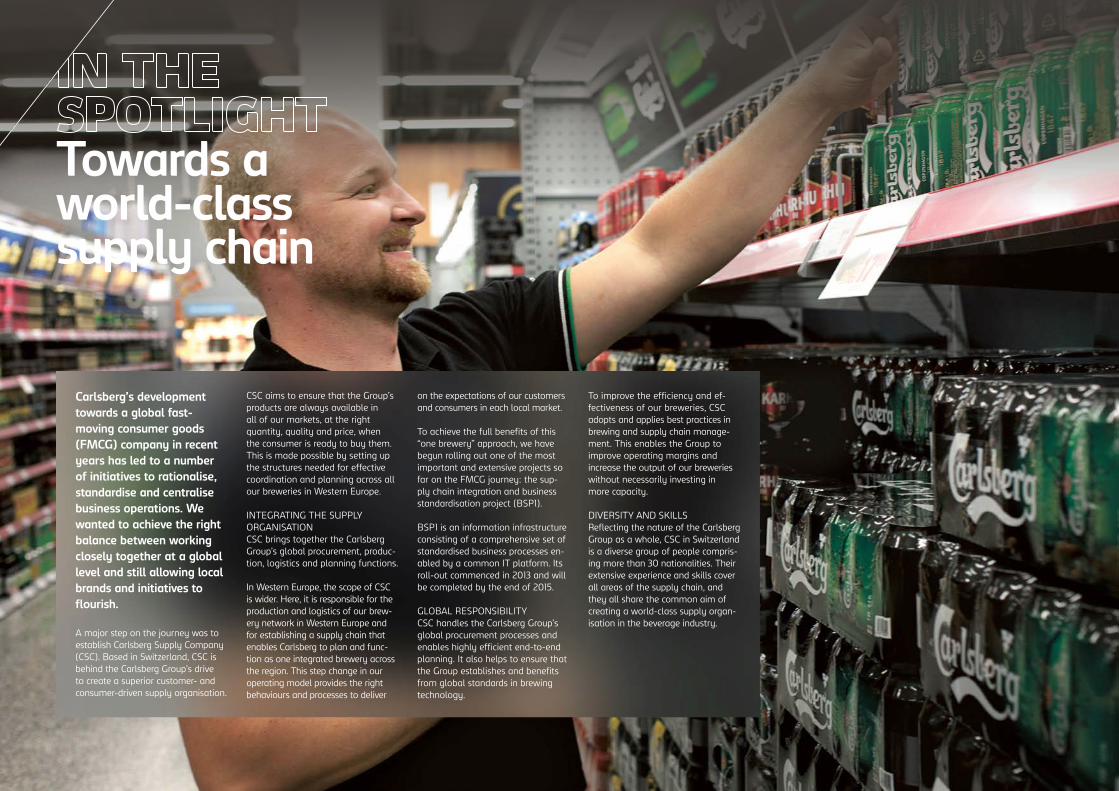
Towards a world-class supply chain
Carlsberg’s development towards a global fast-moving consumer goods (FMCG) company in recent years has led to a number of initiatives to rationalise, standardise and centralise business operations. We wanted to achieve the right balance between working closely together at a global level and still allowing local brands and initiatives to flourish.
A major step on the journey was to establish Carlsberg Supply Company (CSC). Based in Switzerland, CSC is behind the Carlsberg Group’s drive to create a superior customer- and consumer-driven supply organisation.
CSC aims to ensure that the Group’s products are always available in all of our markets, at the right quantity, quality and price, when the consumer is ready to buy them. This is made possible by setting up the structures needed for effective coordination and planning across all our breweries in Western Europe.
INTEGRATING THE SUPPLY ORGANISATION CSC brings together the Carlsberg Group’s global procurement, produc-tion, logistics and planning functions.
In Western Europe, the scope of CSC is wider. Here, it is responsible for the production and logistics of our brew-ery network in Western Europe and for establishing a supply chain that enables Carlsberg to plan and func-tion as one integrated brewery across the region. This step change in our operating model provides the right behaviours and processes to deliver
on the expectations of our customers and consumers in each local market.
To achieve the full benefits of this “one brewery” approach, we have begun rolling out one of the most important and extensive projects so far on the FMCG journey: the sup-ply chain integration and business standardisation project (BSP1).
BSP1 is an information infrastructure consisting of a comprehensive set of standardised business processes en-abled by a common IT platform. Its roll-out commenced in 2013 and will be completed by the end of 2015.
GLOBAL RESPONSIBILITYCSC handles the Carlsberg Group’s global procurement processes and enables highly efficient end-to-end planning. It also helps to ensure that the Group establishes and benefits from global standards in brewing technology.
To improve the efficiency and ef-fectiveness of our breweries, CSC adopts and applies best practices in brewing and supply chain manage-ment. This enables the Group to improve operating margins and increase the output of our breweries without necessarily investing in more capacity.
DIVERSITY AND SKILLS Reflecting the nature of the Carlsberg Group as a whole, CSC in Switzerland is a diverse group of people compris-ing more than 30 nationalities. Their extensive experience and skills cover all areas of the supply chain, and they all share the common aim of creating a world-class supply organ-isation in the beverage industry.
Net revenue grew organically by 1%. We achieved a strong price/mix of +3% due to our successful value management efforts, roll-out of premium brands and innovations, and price increases across the markets.
Operating profit grew organically by 4% despite the negative impact of the French destocking in Q1 and the BSP1-related costs. Adjusting for these, operating profit would have increased organically by low-teens percentages. The earnings improvement was driven by overall tight cost control in all markets and functions, the positive price/mix and supply chain savings. Reported operating margin was flat in spite of the BSP1-related costs and the French destocking.
POLAND, THE NORDICS AND THE BALTICS In Poland, the overall market declined due to tough EURO 2012 comparisons. We gained
market share and grew our volumes by 5%. Our value market share improved strongly underpinned by the strong performance of the Kasztelan, Okocim and Harnas brands. Somersby also delivered strong growth.
The Swedish beer market grew slightly (+1%) and we continued to strengthen our market share, driven by our strong portfolio and overall strong commercial execution. The Swedish business continued to strengthen financially and commercially; and in April, BSP1 was implemented.
In a slightly growing Danish beer market (+1%), our volumes declined, due to a temporary delisting at one off-trade customer. Excluding this customer, we increased our market share. The positive Danish business result was a result of efficiency improvements and our continued focus on value management initiatives.
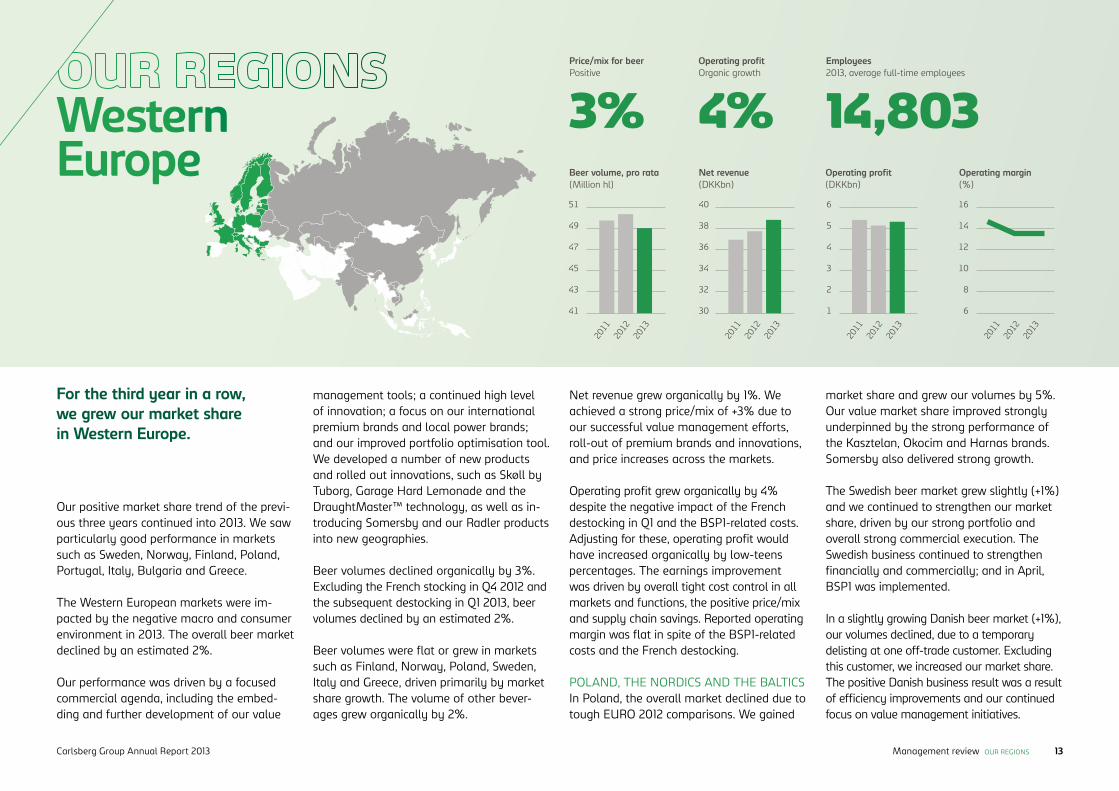
For the third year in a row, we grew our market share in Western Europe.
Western Europe
management tools; a continued high level of innovation; a focus on our international premium brands and local power brands; and our improved portfolio optimisation tool. We developed a number of new products and rolled out innovations, such as Skøll by Tuborg, Garage Hard Lemonade and the DraughtMaster™ technology, as well as in-troducing Somersby and our Radler products into new geographies.
Beer volumes declined organically by 3%. Excluding the French stocking in Q4 2012 and the subsequent destocking in Q1 2013, beer volumes declined by an estimated 2%.
Beer volumes were flat or grew in markets such as Finland, Norway, Poland, Sweden, Italy and Greece, driven primarily by market share growth. The volume of other bever-ages grew organically by 2%.
Our positive market share trend of the previ-ous three years continued into 2013. We saw particularly good performance in markets such as Sweden, Norway, Finland, Poland, Portugal, Italy, Bulgaria and Greece.
The Western European markets were im-pacted by the negative macro and consumer environment in 2013. The overall beer market declined by an estimated 2%.
Our performance was driven by a focused commercial agenda, including the embed-ding and further development of our value
3% 4% 14,803Price/mix for beer Positive
Operating profit Organic growth
Employees2013, average full-time employees
Net revenue(DKKbn)
40
38
36
34
32
30
2013
2012
2011
Operating profit(DKKbn)
6
5
4
3
2
1
2013
2012
2011
Operating margin(%)
16
14
12
10
8
6
2013
2012
2011
Beer volume, pro rata(Million hl)
51
49
47
45
43
41
2013
2012
2011
Carlsberg Group Annual Report 2013 13Management review OUR REGIONS
Change Change
Pro rata, million hl 2012 Organic Acq., net FX 2013 Reported
Beer 50.3 -3% 0% 49.0 -3%
Other beverages 14.5 2% 1% 14.9 3%
Total volume 64.8 -2% 1% 63.9 -1%
DKK million
Net revenue 37,727 1% 3% -1% 38,796 3%
Operating profit 5,121 4% 0% -1% 5,269 3%
Operating margin (%) 13.6 13.6 0bp
WESTERN EUROPE IN FIGURES
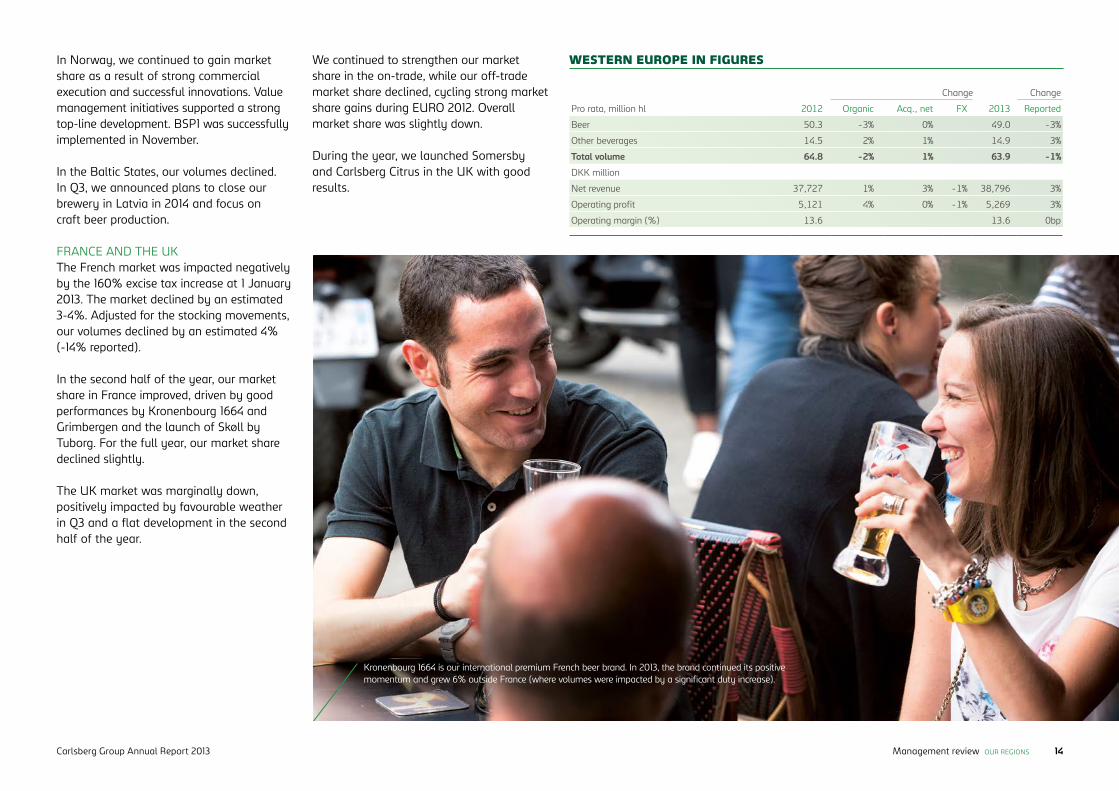
Kronenbourg 1664 is our international premium French beer brand. In 2013, the brand continued its positive momentum and grew 6% outside France (where volumes were impacted by a significant duty increase).
In Norway, we continued to gain market share as a result of strong commercial execution and successful innovations. Value management initiatives supported a strong top-line development. BSP1 was successfully implemented in November.
In the Baltic States, our volumes declined. In Q3, we announced plans to close our brewery in Latvia in 2014 and focus on craft beer production.
FRANCE AND THE UK The French market was impacted negatively by the 160% excise tax increase at 1 January 2013. The market declined by an estimated 3-4%. Adjusted for the stocking movements, our volumes declined by an estimated 4% (-14% reported).
In the second half of the year, our market share in France improved, driven by good performances by Kronenbourg 1664 and Grimbergen and the launch of Skøll by Tuborg. For the full year, our market share declined slightly.
The UK market was marginally down, positively impacted by favourable weather in Q3 and a flat development in the second half of the year.
We continued to strengthen our market share in the on-trade, while our off-trade market share declined, cycling strong market share gains during EURO 2012. Overall market share was slightly down.
During the year, we launched Somersby and Carlsberg Citrus in the UK with good results.
Carlsberg Group Annual Report 2013 14Management review OUR REGIONS
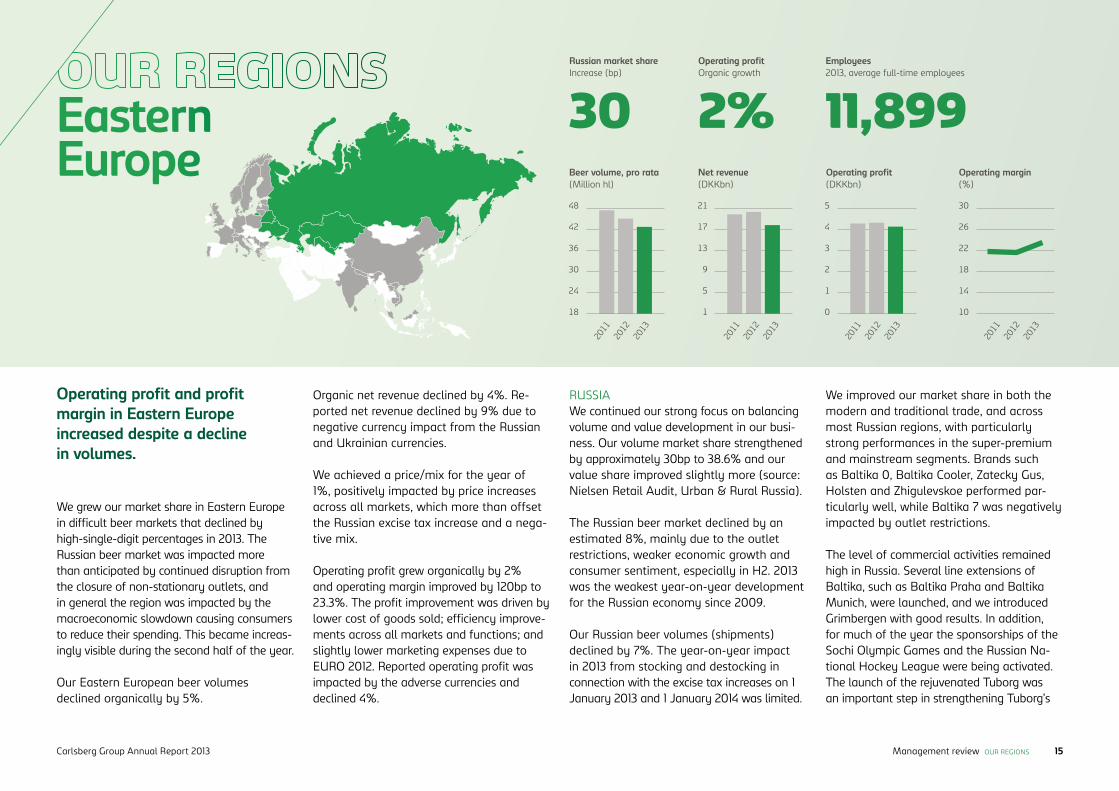
30 2% 11,899Russian market share Increase (bp)
Operating profit Organic growth
Employees2013, average full-time employees
RUSSIAWe continued our strong focus on balancing volume and value development in our busi-ness. Our volume market share strengthened by approximately 30bp to 38.6% and our value share improved slightly more (source: Nielsen Retail Audit, Urban & Rural Russia).
The Russian beer market declined by an estimated 8%, mainly due to the outlet restrictions, weaker economic growth and consumer sentiment, especially in H2. 2013 was the weakest year-on-year development for the Russian economy since 2009.
Our Russian beer volumes (shipments) declined by 7%. The year-on-year impact in 2013 from stocking and destocking in connection with the excise tax increases on 1 January 2013 and 1 January 2014 was limited.
We improved our market share in both the modern and traditional trade, and across most Russian regions, with particularly strong performances in the super-premium and mainstream segments. Brands such as Baltika 0, Baltika Cooler, Zatecky Gus, Holsten and Zhigulevskoe performed par-ticularly well, while Baltika 7 was negatively impacted by outlet restrictions.
The level of commercial activities remained high in Russia. Several line extensions of Baltika, such as Baltika Praha and Baltika Munich, were launched, and we introduced Grimbergen with good results. In addition, for much of the year the sponsorships of the Sochi Olympic Games and the Russian Na-tional Hockey League were being activated. The launch of the rejuvenated Tuborg was an important step in strengthening Tuborg’s
Operating profit and profit margin in Eastern Europe increased despite a decline in volumes.
We grew our market share in Eastern Europe in difficult beer markets that declined by high-single-digit percentages in 2013. The Russian beer market was impacted more than anticipated by continued disruption from the closure of non-stationary outlets, and in general the region was impacted by the macroeconomic slowdown causing consumers to reduce their spending. This became increas-ingly visible during the second half of the year.
Our Eastern European beer volumes declined organically by 5%.
Organic net revenue declined by 4%. Re-ported net revenue declined by 9% due to negative currency impact from the Russian and Ukrainian currencies.
We achieved a price/mix for the year of 1%, positively impacted by price increases across all markets, which more than offset the Russian excise tax increase and a nega-tive mix.
Operating profit grew organically by 2% and operating margin improved by 120bp to 23.3%. The profit improvement was driven by lower cost of goods sold; efficiency improve-ments across all markets and functions; and slightly lower marketing expenses due to EURO 2012. Reported operating profit was impacted by the adverse currencies and declined 4%.
Eastern Europe Net revenue
(DKKbn)
21
17
13
9
5
1
2013
2012
2011
Operating profit(DKKbn)
5
4
3
2
1
0
2013
2012
2011
Operating margin(%)
30
26
22
18
14
10
2013
2012
2011
Beer volume, pro rata(Million hl)
48
42
36
30
24
18
2013
2012
2011
Carlsberg Group Annual Report 2013 15Management review OUR REGIONS

From 2013, the sale of beer in Russia from non-permanent outlets is no longer legal. This change has led to modern trade increasing its share of the beer market, which now accounts for around 30%.
Change Change
Pro rata, million hl 2012 Organic Acq., net FX 2013 Reported
Beer 44.7 -5% 0% 42.4 -5%
Other beverages 1.8 -5% 0% 1.7 -5%
Total volume 46.5 -5% 0% 44.1 -5%
DKK million
Net revenue 19,502 -4% 0% -5% 17,711 -9%
Operating profit 4,302 2% 0% -6% 4,127 -4%
Operating margin (%) 22.1 23.3 120bp
EASTERN EUROPE IN FIGURESvery strong brand equity in the super- premium category.
We achieved price/mix of +1%, positively impacted by price increases in March, May, June and September but offset by the Rus-sian excise tax increase and a negative mix. Price/mix dynamics improved in the second half of 2013.
UKRAINEThe Ukrainian market declined by an esti-mated 7-8% due to the significant macro economic slowdown, unfavourable weather and tough comparables following a success-ful EURO 2012 campaign.
Our market share was flat. We brought a number of important innovations to the market, such as Lvivske in a restyled PET packaging, the rejuvenated Tuborg, line ex-tensions of the Baltika and Lvivske brands, and a retro platform for Zhygulevskoe.
Our Russian value market share increased more than our volume market share driven by our focus on bal-ancing volume and value.
Carlsberg Group Annual Report 2013
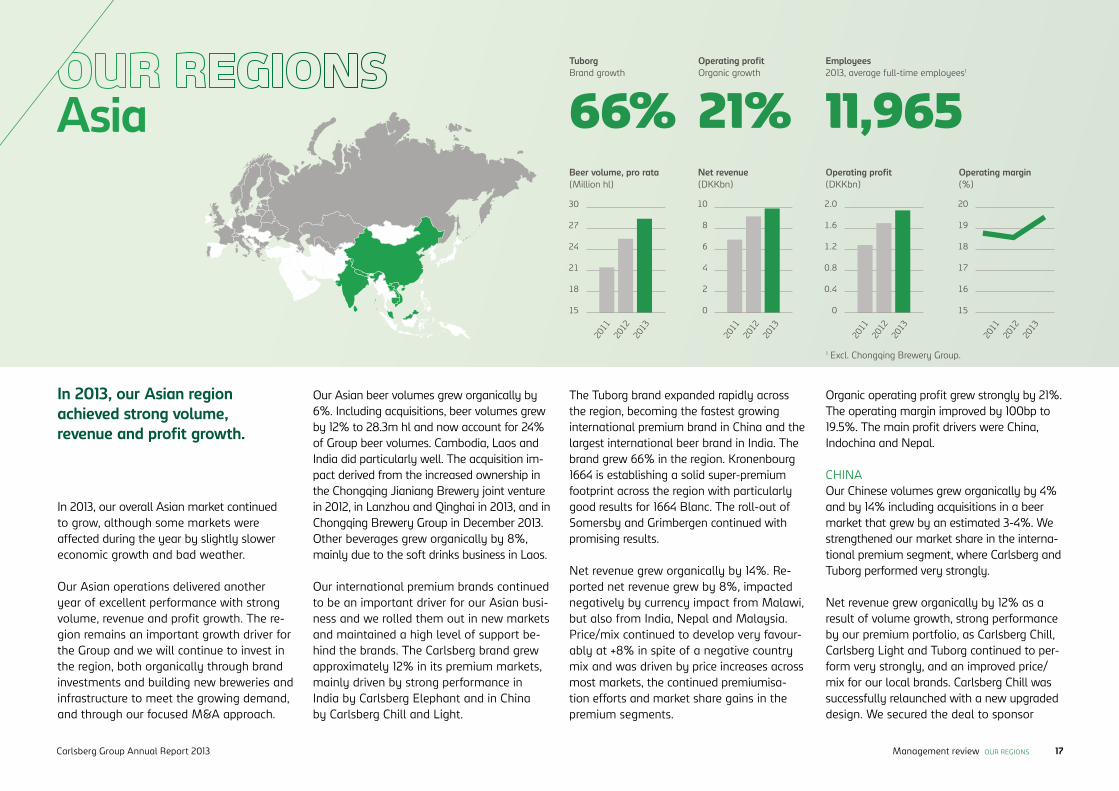
The Tuborg brand expanded rapidly across the region, becoming the fastest growing international premium brand in China and the largest international beer brand in India. The brand grew 66% in the region. Kronenbourg 1664 is establishing a solid super-premium footprint across the region with particularly good results for 1664 Blanc. The roll-out of Somersby and Grimbergen continued with promising results.
Net revenue grew organically by 14%. Re-ported net revenue grew by 8%, impacted negatively by currency impact from Malawi, but also from India, Nepal and Malaysia. Price/mix continued to develop very favour-ably at +8% in spite of a negative country mix and was driven by price increases across most markets, the continued premiumisa-tion efforts and market share gains in the premium segments.
Organic operating profit grew strongly by 21%. The operating margin improved by 100bp to 19.5%. The main profit drivers were China, Indo china and Nepal.
CHINAOur Chinese volumes grew organically by 4% and by 14% including acquisitions in a beer market that grew by an estimated 3-4%. We strengthened our market share in the interna-tional premium segment, where Carlsberg and Tuborg performed very strongly.
Net revenue grew organically by 12% as a result of volume growth, strong performance by our premium portfolio, as Carlsberg Chill, Carlsberg Light and Tuborg continued to per-form very strongly, and an improved price/mix for our local brands. Carlsberg Chill was successfully relaunched with a new upgraded design. We secured the deal to sponsor
In 2013, our Asian region achieved strong volume, revenue and profit growth.
66% 21% 11,965
Our Asian beer volumes grew organically by 6%. Including acquisitions, beer volumes grew by 12% to 28.3m hl and now account for 24% of Group beer volumes. Cambodia, Laos and India did particularly well. The acquisition im-pact derived from the increased ownership in the Chongqing Jianiang Brewery joint venture in 2012, in Lanzhou and Qinghai in 2013, and in Chongqing Brewery Group in December 2013. Other beverages grew organically by 8%, main ly due to the soft drinks business in Laos.
Our international premium brands continued to be an important driver for our Asian busi-ness and we rolled them out in new markets and maintained a high level of support be-hind the brands. The Carlsberg brand grew approximately 12% in its premium markets, mainly driven by strong performance in India by Carlsberg Elephant and in China by Carlsberg Chill and Light.
In 2013, our overall Asian market continued to grow, although some markets were affected during the year by slightly slower economic growth and bad weather.
Our Asian operations delivered another year of excellent performance with strong volume, revenue and profit growth. The re-gion remains an important growth driver for the Group and we will continue to invest in the region, both organically through brand investments and building new breweries and infrastructure to meet the growing demand, and through our focused M&A approach.
Tuborg Brand growth
Operating profit Organic growth
Employees2013, average full-time employees1
1 Excl. Chongqing Brewery Group.
AsiaBeer volume, pro rata(Million hl)
30
27
24
21
18
15
2013
2012
2011
Net revenue(DKKbn)
10
8
6
4
2
0
2013
2012
2011
Operating profit(DKKbn)
2.0
1.6
1.2
0.8
0.4
0
2013
2012
2011
Operating margin(%)
20
19
18
17
16
15
2013
2012
2011
Carlsberg Group Annual Report 2013 17Management review OUR REGIONS
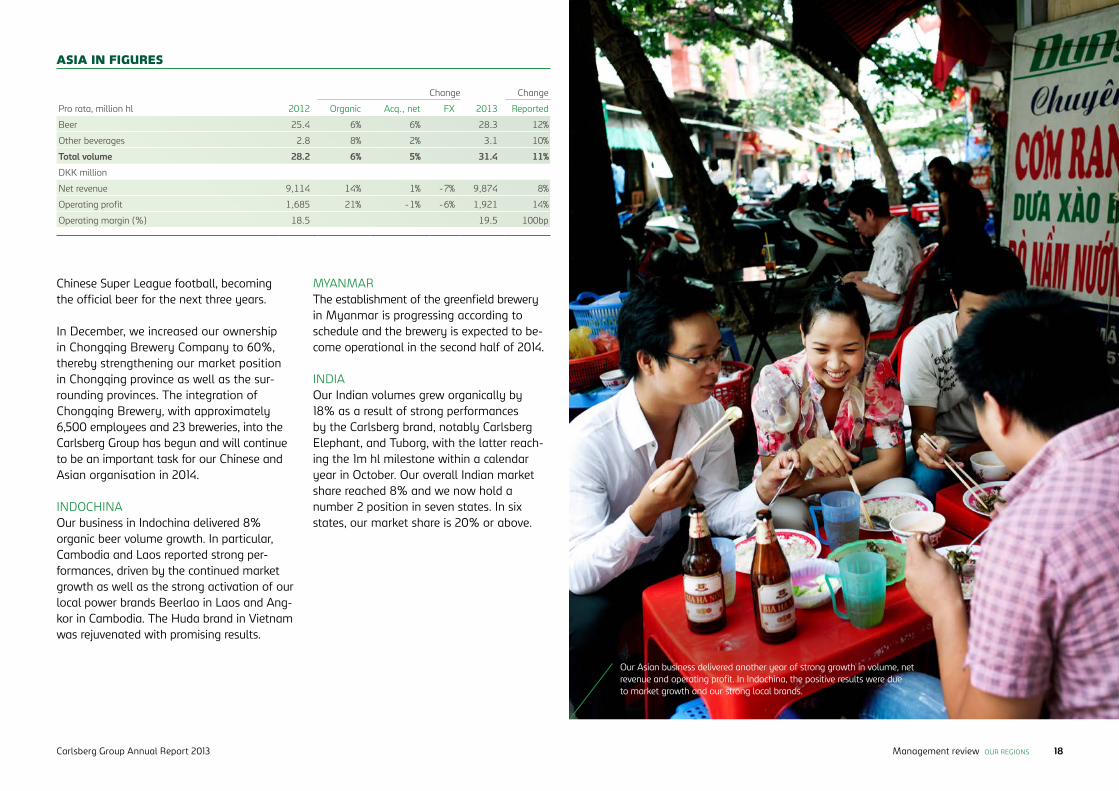
Chinese Super League football, becoming the official beer for the next three years.
In December, we increased our ownership in Chongqing Brewery Company to 60%, thereby strengthening our market position in Chongqing province as well as the sur-rounding provinces. The integration of Chongqing Brewery, with approximately 6,500 employees and 23 breweries, into the Carlsberg Group has begun and will continue to be an important task for our Chinese and Asian organisation in 2014.
INDOCHINAOur business in Indochina delivered 8% organic beer volume growth. In particular, Cambodia and Laos reported strong per-formances, driven by the continued market growth as well as the strong activation of our local power brands Beerlao in Laos and Ang-kor in Cambodia. The Huda brand in Vietnam was rejuvenated with promising results.
MYANMARThe establishment of the greenfield brewery in Myanmar is progressing according to schedule and the brewery is expected to be-come operational in the second half of 2014.
INDIAOur Indian volumes grew organically by 18% as a result of strong performances by the Carlsberg brand, notably Carlsberg Elephant, and Tuborg, with the latter reach-ing the 1m hl milestone within a calendar year in October. Our overall Indian market share reached 8% and we now hold a number 2 position in seven states. In six states, our market share is 20% or above.
Our Asian business delivered another year of strong growth in volume, net revenue and operating profit. In Indochina, the positive results were due to market growth and our strong local brands.
Change Change
Pro rata, million hl 2012 Organic Acq., net FX 2013 Reported
Beer 25.4 6% 6% 28.3 12%
Other beverages 2.8 8% 2% 3.1 10%
Total volume 28.2 6% 5% 31.4 11%
DKK million
Net revenue 9,114 14% 1% -7% 9,874 8%
Operating profit 1,685 21% -1% -6% 1,921 14%
Operating margin (%) 18.5 19.5 100bp
ASIA IN FIGURES
Carlsberg Group Annual Report 2013 18Management review OUR REGIONS
China: one country – many opportunities
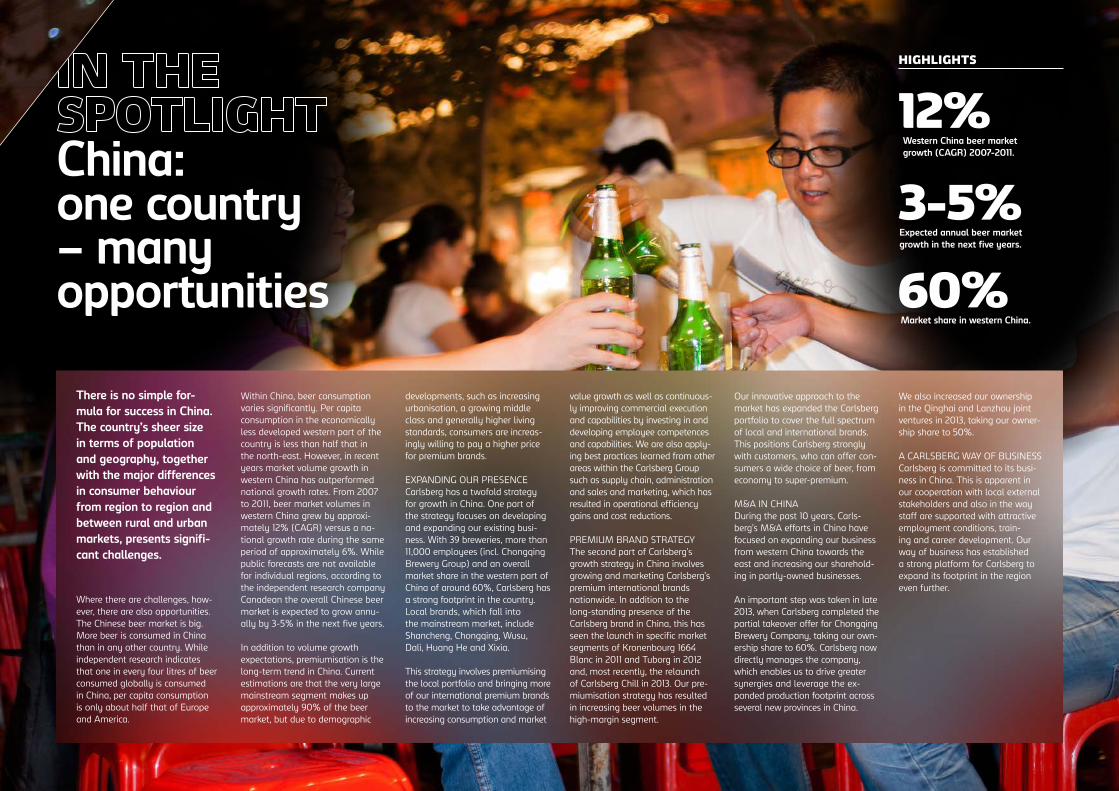
There is no simple for-mula for success in China. The country’s sheer size in terms of population and geography, together with the major differences in consumer behaviour from region to region and between rural and urban markets, presents signifi-cant challenges.
Where there are challenges, how-ever, there are also opportunities. The Chinese beer market is big. More beer is consumed in China than in any other country. While independent research indicates that one in every four litres of beer consumed globally is consumed in China, per capita consumption is only about half that of Europe and America.
Within China, beer consumption varies significantly. Per capita consumption in the economically less developed western part of the country is less than half that in the north-east. However, in recent years market volume growth in western China has outperformed national growth rates. From 2007 to 2011, beer market volumes in western China grew by approxi-mately 12% (CAGR) versus a na-tional growth rate during the same period of approximately 6%. While public forecasts are not available for individual regions, according to the independent research company Canadean the overall Chinese beer market is expected to grow annu-ally by 3-5% in the next five years.
In addition to volume growth expectations, premiumisation is the long-term trend in China. Current estimations are that the very large mainstream segment makes up approximately 90% of the beer market, but due to demographic
developments, such as increasing urbanisation, a growing middle class and generally higher living standards, consumers are increas-ingly willing to pay a higher price for premium brands.
EXPANDING OUR PRESENCE Carlsberg has a twofold strategy for growth in China. One part of the strategy focuses on developing and expanding our existing busi-ness. With 39 breweries, more than 11,000 employees (incl. Chongqing Brewery Group) and an overall market share in the western part of China of around 60%, Carlsberg has a strong footprint in the country. Local brands, which fall into the mainstream market, include Shancheng, Chongqing, Wusu, Dali, Huang He and Xixia.
This strategy involves premiumising the local portfolio and bringing more of our international premium brands to the market to take advantage of increasing consumption and market
value growth as well as continuous-ly improving commercial execution and capabilities by investing in and developing employee competences and capabilities. We are also apply-ing best practices learned from other areas within the Carlsberg Group such as supply chain, administration and sales and marketing, which has resulted in operational efficiency gains and cost reductions.
PREMIUM BRAND STRATEGYThe second part of Carlsberg’s growth strategy in China involves growing and marketing Carlsberg’s premium international brands nationwide. In addition to the long-standing presence of the Carlsberg brand in China, this has seen the launch in specific market segments of Kronenbourg 1664 Blanc in 2011 and Tuborg in 2012 and, most recently, the relaunch of Carlsberg Chill in 2013. Our pre-miumisation strategy has resulted in increasing beer volumes in the high-margin segment.
Our innovative approach to the market has expanded the Carlsberg portfolio to cover the full spectrum of local and international brands. This positions Carlsberg strongly with customers, who can offer con-sumers a wide choice of beer, from economy to super-premium.
M&A IN CHINADuring the past 10 years, Carls-berg’s M&A efforts in China have focused on expanding our business from western China towards the east and increasing our sharehold-ing in partly-owned businesses.
An important step was taken in late 2013, when Carlsberg completed the partial takeover offer for Chongqing Brewery Company, taking our own-ership share to 60%. Carlsberg now directly manages the company, which enables us to drive greater synergies and leverage the ex-panded production footprint across several new provinces in China.
We also increased our ownership in the Qinghai and Lanzhou joint ventures in 2013, taking our owner-ship share to 50%.
A CARLSBERG WAY OF BUSINESSCarlsberg is committed to its busi-ness in China. This is apparent in our cooperation with local external stakeholders and also in the way staff are supported with attractive employment conditions, train-ing and career development. Our way of business has established a strong platform for Carlsberg to expand its footprint in the region even further.
60%
HIGHLIGHTS
12%Western China beer market growth (CAGR) 2007-2011.
3-5%Expected annual beer market growth in the next five years.
Market share in western China.
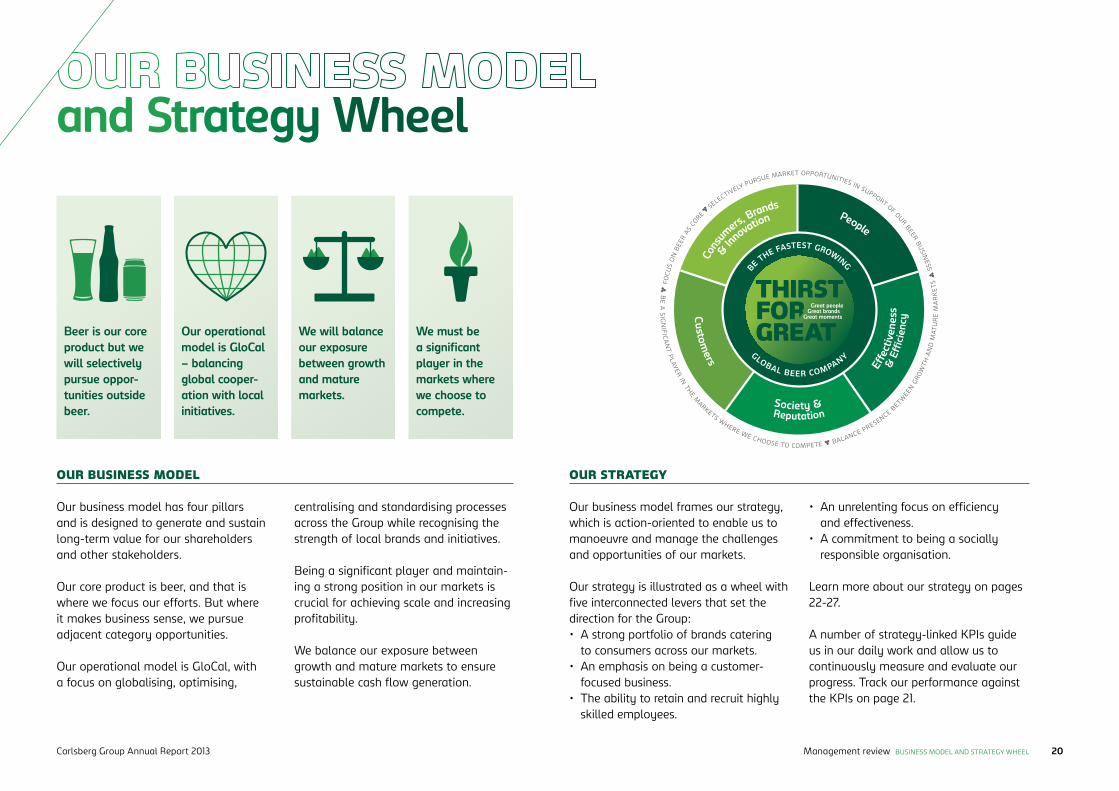
We must be a significant player in the markets where we choose to compete.
We will balance our exposure between growth and mature markets.
Our operational model is GloCal – balancing global cooper-ation with local initiatives.
Beer is our core product but we will selectively pursue oppor-tunities outside beer.
OUR STRATEGYOUR BUSINESS MODEL
and Strategy Wheel
WINNING BEHAVIOURS
We are engagedwith society
We are each empowered to make a difference
We want to win Our consumers and customers are the heart of every decision we make
Together weare stronger
THIRST FOR GREAT Great people. Great brands. Great moments Founded on the motto, Semper Ardens – Always Burning – we never settle, but always thirst for the better We are stronger together because we share best practices, ideas, and successes. We brand as many, but stand as one With the courage to dare, to try, to take risks, we constantly raise the bar. We don’t stop at brewing great beer. We brew a greater future – for our consumers and customers, our communities, and our people This passion will continue to burn and forever keep us thirsty.
PEOPLE• Embed a high performance culture• Develop, retain and attract best in class people• Empower and engage our people
EFFECTIVENESS & EFFICIENCY• Create an efficient, consumer- and customer-focused organisation• Focus and prioritise to maximise return on investments• Continuously develop and implement Carlsberg Group Ways of Working and Best Practices
SOCIETY AND REPUTATION• Enhance our reputation as a responsible global brewer• Integrate Corporate Social Responsibility throughout our value chain• Improve the image of the beer category
CONSUMERS, BRANDS AND INNOVATION • Iconize Carlsberg• Outperform with winning portfolio of international and local power brands• Accelerate scalable, consumer, relevant innovation
CUSTOMERS • Collaborate with customers to drive category growth• Create a winning route to market• Win with winning customers in on- and off-trade• Be the industry benchmark in Point-of-Purchase execution
Society &Reputation
Customers
People
Effe
ctiv
enes
s&
Ef�
cien
cy
GLOBAL BEER COMPANY
BE THE FASTEST GROWING
Cons
umers
, Brands
& Inno
vation
BE
A S IG
NIFIC
AN
T PLAYER
IN TH
E MARKETS WHERE WE CHOOSE TO COMPETE BALANCE PRESENCE B
ETWEE
N G
ROW
TH A
ND
MAT
UR
E M
AR
KE
TS FO
CUS
ON
BEE
R AS
CORE
SELECTIVELY PURSUE MARKET OPPORTUNITIES IN SUPPORT OF OUR BEER BU
SINESS
Our business model has four pillars and is designed to generate and sustain long-term value for our shareholders and other stakeholders.
Our core product is beer, and that is where we focus our efforts. But where it makes business sense, we pursue adjacent category opportunities.
Our operational model is GloCal, with a focus on globalising, optimising,
centralising and standardising processes across the Group while recognising the strength of local brands and initiatives.
Being a significant player and maintain-ing a strong position in our markets is crucial for achieving scale and increasing profitability.
We balance our exposure between growth and mature markets to ensure sustainable cash flow generation.
Our business model frames our strategy, which is action-oriented to enable us to manoeuvre and manage the challenges and opportunities of our markets.
Our strategy is illustrated as a wheel with five interconnected levers that set the direction for the Group:• A strong portfolio of brands catering
to consumers across our markets.• An emphasis on being a customer-
focused business.• The ability to retain and recruit highly
skilled employees.
• An unrelenting focus on efficiency and effectiveness.
• A commitment to being a socially responsible organisation.
Learn more about our strategy on pages 22-27.
A number of strategy-linked KPIs guide us in our daily work and allow us to continuously measure and evaluate our progress. Track our performance against the KPIs on page 21.
Carlsberg Group Annual Report 2013 20Management review BUSINESS MODEL AND STRATEGY WHEEL
Measuring our performance
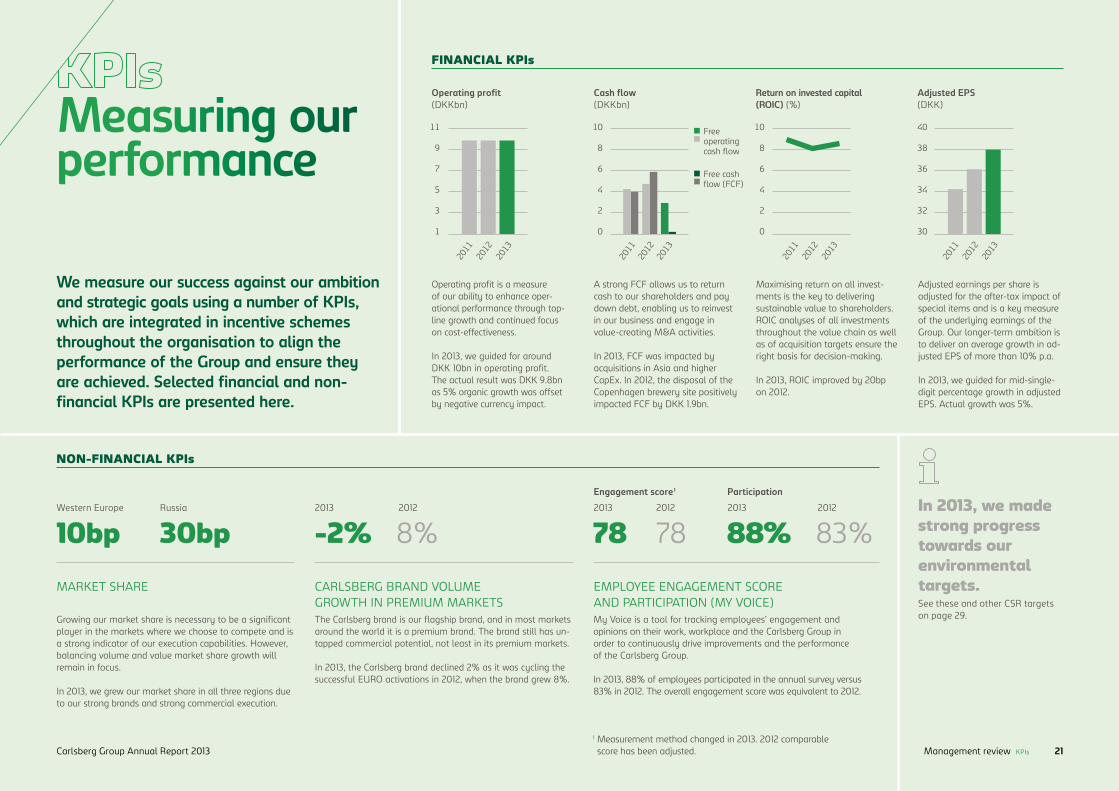
We measure our success against our ambition and strategic goals using a number of KPIs, which are integrated in incentive schemes throughout the organisation to align the performance of the Group and ensure they are achieved. Selected financial and non-financial KPIs are presented here.
Operating profit is a measure of our ability to enhance oper-ational performance through top-line growth and continued focus on cost-effectiveness.
In 2013, we guided for around DKK 10bn in operating profit. The actual result was DKK 9.8bn as 5% organic growth was offset by negative currency impact.
A strong FCF allows us to return cash to our shareholders and pay down debt, enabling us to reinvest in our business and engage in value-creating M&A activities.
In 2013, FCF was impacted by acquisitions in Asia and higher CapEx. In 2012, the disposal of the Copenhagen brewery site positively impacted FCF by DKK 1.9bn.
Maximising return on all invest-ments is the key to delivering sustainable value to shareholders. ROIC analyses of all investments throughout the value chain as well as of acquisition targets ensure the right basis for decision-making.
In 2013, ROIC improved by 20bp on 2012.
Adjusted earnings per share is adjusted for the after-tax impact of special items and is a key measure of the underlying earnings of the Group. Our longer-term ambition is to deliver an average growth in ad-justed EPS of more than 10% p.a.
In 2013, we guided for mid-single-digit percentage growth in adjusted EPS. Actual growth was 5%.
FINANCIAL KPIs
NON-FINANCIAL KPIs
MARKET SHARE
10bp 30bpWestern Europe Russia
CARLSBERG BRAND VOLUME GROWTH IN PREMIUM MARKETS
-2%2013
8%2012
EMPLOYEE ENGAGEMENT SCORE AND PARTICIPATION (MY VOICE)
78
Engagement score1 Participation
2013
782012
88%2013
83%2012
1 Measurement method changed in 2013. 2012 comparable score has been adjusted.
In 2013, we made strong progress towards our environmental targets.See these and other CSR targets on page 29.The Carlsberg brand is our flagship brand, and in most markets
around the world it is a premium brand. The brand still has un-tapped commercial potential, not least in its premium markets.
In 2013, the Carlsberg brand declined 2% as it was cycling the successful EURO activations in 2012, when the brand grew 8%.
Growing our market share is necessary to be a significant player in the markets where we choose to compete and is a strong indicator of our execution capabilities. However, balancing volume and value market share growth will remain in focus.
In 2013, we grew our market share in all three regions due to our strong brands and strong commercial execution.
My Voice is a tool for tracking employees’ engagement and opinions on their work, workplace and the Carlsberg Group in order to continuously drive improvements and the performance of the Carlsberg Group.
In 2013, 88% of employees participated in the annual survey versus 83% in 2012. The overall engagement score was equivalent to 2012.
40
38
36
34
32
30
Adjusted EPS(DKK)
Operating profit(DKKbn)
11
9
7
5
3
1
2013
2012
2011
2013
2012
2011
2013
2012
2011
10
8
6
4
2
0
Cash flow(DKKbn)
10
8
6
4
2
0
Return on invested capital (ROIC) (%)
2013
2012
2011
Free operating cash flow
Free cash flow (FCF)
Carlsberg Group Annual Report 2013 21Management review KPIs
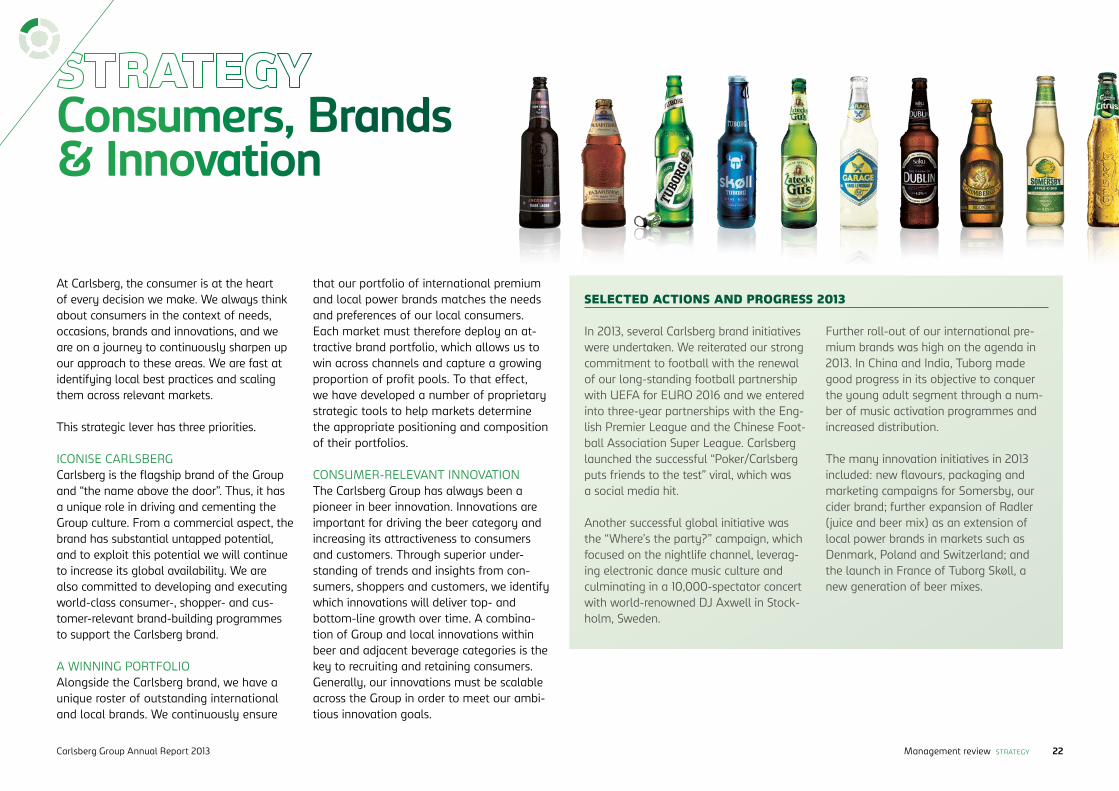
At Carlsberg, the consumer is at the heart of every decision we make. We always think about consumers in the context of needs, occasions, brands and innovations, and we are on a journey to continuously sharpen up our approach to these areas. We are fast at identifying local best practices and scaling them across relevant markets.
This strategic lever has three priorities.
ICONISE CARLSBERG Carlsberg is the flagship brand of the Group and “the name above the door”. Thus, it has a unique role in driving and cementing the Group culture. From a commercial aspect, the brand has substantial untapped potential, and to exploit this potential we will continue to increase its global availability. We are also committed to developing and executing world-class consumer-, shopper- and cus-tomer-relevant brand-building programmes to support the Carlsberg brand.
A WINNING PORTFOLIO Alongside the Carlsberg brand, we have a unique roster of outstanding international and local brands. We continuously ensure
that our portfolio of international premium and local power brands matches the needs and preferences of our local consumers. Each market must therefore deploy an at-tractive brand portfolio, which allows us to win across channels and capture a growing proportion of profit pools. To that effect, we have developed a number of proprietary strategic tools to help markets determine the appropriate positioning and composition of their portfolios.
CONSUMER-RELEVANT INNOVATIONThe Carlsberg Group has always been a pioneer in beer innovation. Innovations are important for driving the beer category and increasing its attractiveness to consumers and customers. Through superior under-standing of trends and insights from con-sumers, shoppers and customers, we identify which innovations will deliver top- and bottom-line growth over time. A combina-tion of Group and local innovations within beer and adjacent beverage categories is the key to recruiting and retaining consumers. Generally, our innovations must be scalable across the Group in order to meet our ambi-tious innovation goals.
Consumers, Brands & Innovation
SELECTED ACTIONS AND PROGRESS 2013
In 2013, several Carlsberg brand initiatives were undertaken. We reiterated our strong commitment to football with the renewal of our long-standing football partnership with UEFA for EURO 2016 and we entered into three-year partnerships with the Eng-lish Premier League and the Chinese Foot-ball Association Super League. Carlsberg launched the successful “Poker/Carlsberg puts friends to the test” viral, which was a social media hit.
Another successful global initiative was the “Where’s the party?” campaign, which focused on the nightlife channel, leverag-ing electronic dance music culture and culminating in a 10,000-spectator concert with world-renowned DJ Axwell in Stock-holm, Sweden.
Further roll-out of our international pre-mium brands was high on the agenda in 2013. In China and India, Tuborg made good progress in its objective to conquer the young adult segment through a num-ber of music activation programmes and increased distribution.
The many innovation initiatives in 2013 included: new flavours, packaging and marketing campaigns for Somersby, our cider brand; further expansion of Radler (juice and beer mix) as an extension of local power brands in markets such as Denmark, Poland and Switzerland; and the launch in France of Tuborg Skøll, a new generation of beer mixes.
Carlsberg Group Annual Report 2013 22Management review STRATEGY
SELECTED ACTIONS AND PROGRESS 2013
In 2013, we continued the further roll-out of our value management programme. Value management is a Group-wide initiative that aims to drive category growth and market share to achieve “win-win” outcomes with our customers. Value management leverages customer, consumer and shop-per insights to drive commercial strategy and initiatives as well as optimise sales processes and tools.
The key focus is on the value drivers of price management, assortment optimisation, promotional effectiveness and trade terms. Within this approach, we are also focused
on portfolio architecture by customer and channel. Our value management approach is being continuously developed and has been rolled out across regions, building on experiences from markets across the Group.
In addition to value management, we have developed a global contract management tool for the on-trade channel enabling local markets to manage their many on-trade contracts in a structured way and further drive category development, customer satis-faction and management, and profitability. Furthermore, we are continuously improv-ing our key account capabilities, ranging
from in-store execution programmes to joint business development initiatives.
We joined forces to improve on-shelf availability, the launch of big innovations and the activation of promotional themes such as football or category development projects. In 2013, all key account sales people across the Group participated in key account capability programmes to further grow and strengthen their sales skills and competences.
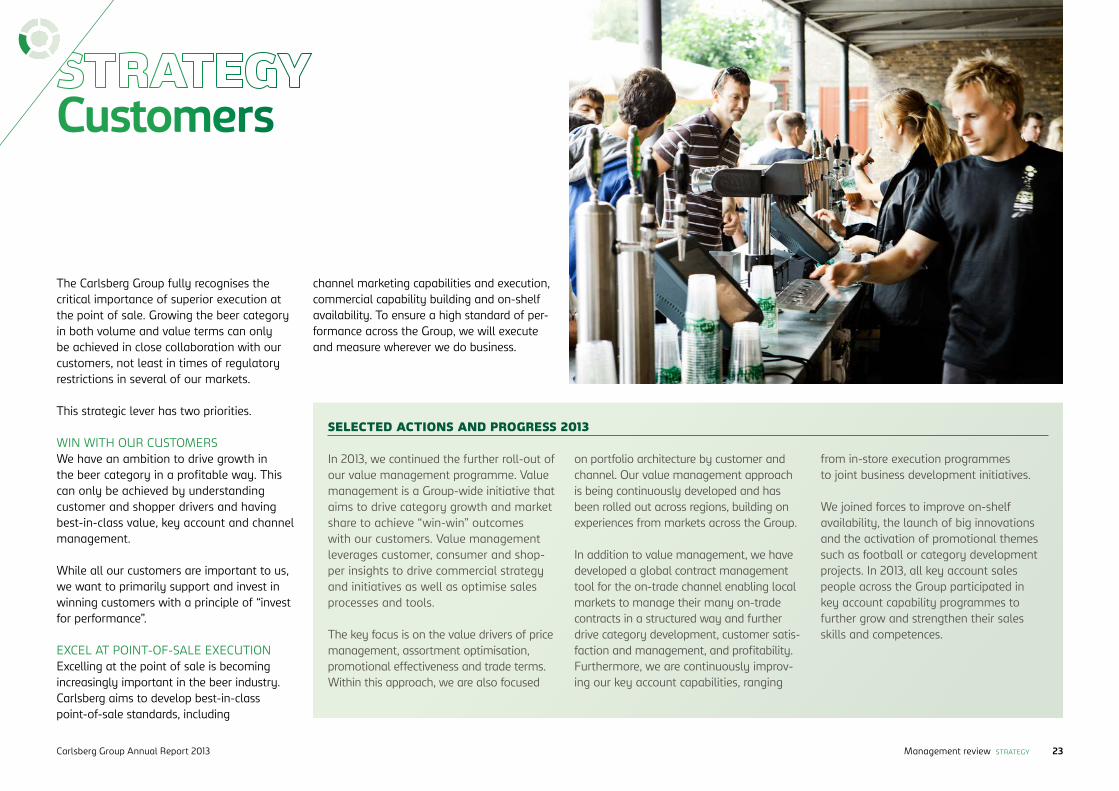
The Carlsberg Group fully recognises the critical importance of superior execution at the point of sale. Growing the beer category in both volume and value terms can only be achieved in close collaboration with our customers, not least in times of regulatory restrictions in several of our markets.
This strategic lever has two priorities.
WIN WITH OUR CUSTOMERSWe have an ambition to drive growth in the beer category in a profitable way. This can only be achieved by understanding customer and shopper drivers and having best-in-class value, key account and channel management.
While all our customers are important to us, we want to primarily support and invest in winning customers with a principle of “invest for performance”.
EXCEL AT POINT-OF-SALE EXECUTIONExcelling at the point of sale is becoming increasingly important in the beer industry. Carlsberg aims to develop best-in-class point-of-sale standards, including
channel marketing capabilities and execution, commercial capability building and on-shelf availability. To ensure a high standard of per-formance across the Group, we will execute and measure wherever we do business.
Customers
Carlsberg Group Annual Report 2013 23Management review STRATEGY
SELECTED ACTIONS AND PROGRESS 2013
To facilitate high performance and superior execution, the Carlsberg Group Leadership Competences were launched in 2013. The eight leadership competences are based on the Group’s winning behaviours and are a summary of the most important charac-teristics for leadership at Carlsberg. They reflect the way we want our leaders to act and behave to deliver on our strategy. The leadership competences will be the benchmark for appraising our leaders’ performance and potential. They will also become the framework for recruitment, learning and development across the Carlsberg Group.
In order to become a truly global company and reap the associated benefits, the Group has developed a Short Term Assignment (STA) programme. STAs typically last for one to six months and effectively utilise and exchange skills and knowledge, bringing together different competences across the
Group. They enable the Group to secure the right candidates with the necessary skills for short-term projects across functions and geographies. STAs have been used success-fully for various strategic Group projects such as value management, BSP1 and responding to dark market conditions, and 2013 saw hundreds of successful STAs.
An important aspect of the people agenda is to support the continued trans-formation agenda of the Carlsberg Group. To this end, the Group has developed and adopted a structured approach to change management. The purpose of our change management framework is to ensure that managers have a coherent and inte-grated approach combined with the right transformation capabilities to deal with employees’ motivation and performance during changes.
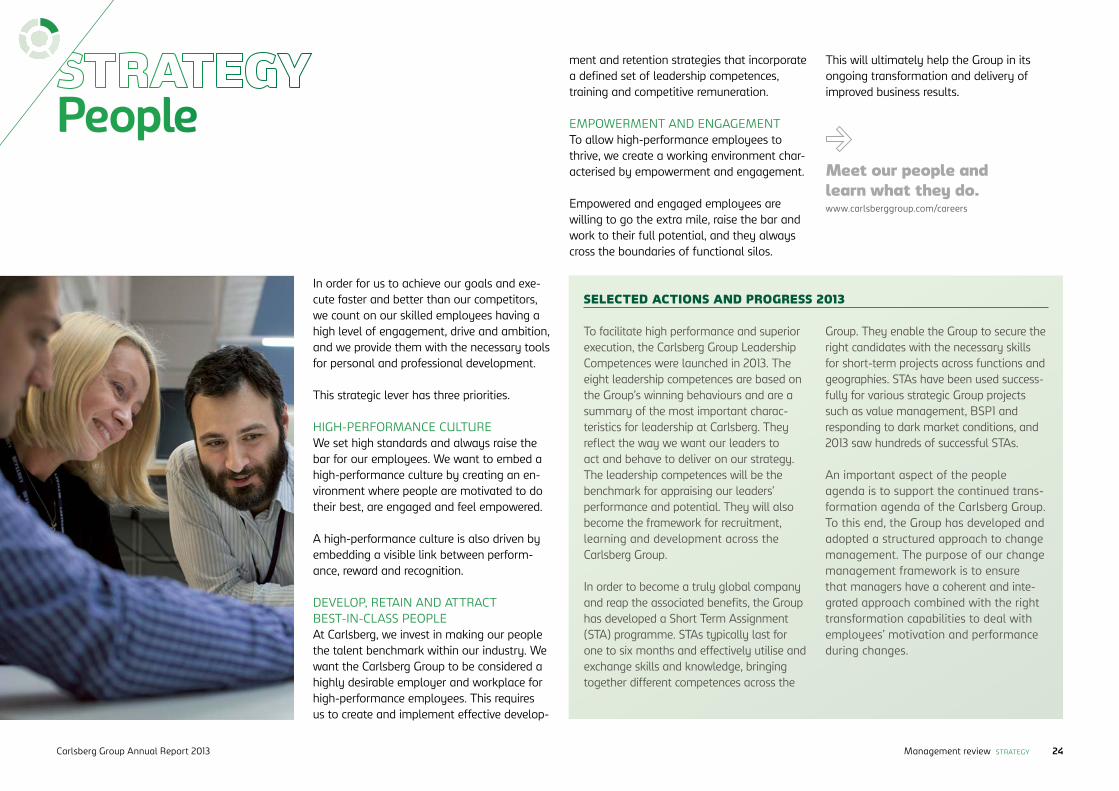
In order for us to achieve our goals and exe-cute faster and better than our competitors, we count on our skilled employees having a high level of engagement, drive and ambition, and we provide them with the necessary tools for personal and professional development.
This strategic lever has three priorities.
HIGH-PERFORMANCE CULTUREWe set high standards and always raise the bar for our employees. We want to embed a high-performance culture by creating an en-vironment where people are motivated to do their best, are engaged and feel empowered.
A high-performance culture is also driven by embedding a visible link between perform-ance, reward and recognition.
DEVELOP, RETAIN AND ATTRACT BEST-IN-CLASS PEOPLE At Carlsberg, we invest in making our people the talent benchmark within our industry. We want the Carlsberg Group to be considered a highly desirable employer and workplace for high-performance employees. This requires us to create and implement effective develop-
ment and retention strategies that incorporate a defined set of leadership competences, training and competitive remuneration.
EMPOWERMENT AND ENGAGEMENTTo allow high-performance employees to thrive, we create a working environment char-acterised by empowerment and engagement.
Empowered and engaged employees are willing to go the extra mile, raise the bar and work to their full potential, and they always cross the boundaries of functional silos.
PeopleThis will ultimately help the Group in its ongoing transformation and delivery of improved business results.
Meet our people and learn what they do.www.carlsberggroup.com/careers
Carlsberg Group Annual Report 2013 24Management review STRATEGY
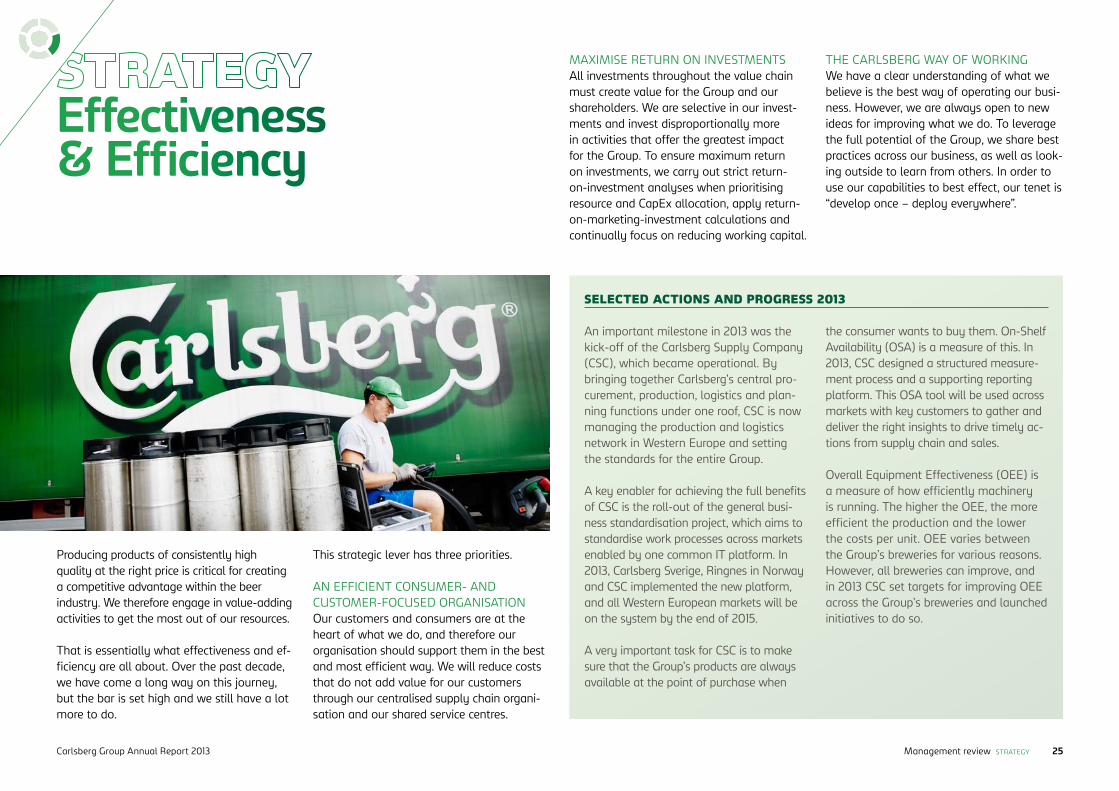
Producing products of consistently high quality at the right price is critical for creating a competitive advantage within the beer industry. We therefore engage in value-adding activities to get the most out of our resources.
That is essentially what effectiveness and ef-ficiency are all about. Over the past decade, we have come a long way on this journey, but the bar is set high and we still have a lot more to do.
This strategic lever has three priorities.
AN EFFICIENT CONSUMER- AND CUSTOMER-FOCUSED ORGANISATION Our customers and consumers are at the heart of what we do, and therefore our organisation should support them in the best and most efficient way. We will reduce costs that do not add value for our customers through our centralised supply chain organi-sation and our shared service centres.
Effectiveness & Efficiency
SELECTED ACTIONS AND PROGRESS 2013
An important milestone in 2013 was the kick-off of the Carlsberg Supply Company (CSC), which became operational. By bringing together Carlsberg’s central pro-curement, production, logistics and plan-ning functions under one roof, CSC is now managing the production and logistics network in Western Europe and setting the standards for the entire Group.
A key enabler for achieving the full benefits of CSC is the roll-out of the general busi-ness standardisation project, which aims to standardise work processes across markets enabled by one common IT platform. In 2013, Carlsberg Sverige, Ringnes in Norway and CSC implemented the new platform, and all Western European markets will be on the system by the end of 2015.
A very important task for CSC is to make sure that the Group’s products are always available at the point of purchase when
the consumer wants to buy them. On-Shelf Availability (OSA) is a measure of this. In 2013, CSC designed a structured measure-ment process and a supporting reporting platform. This OSA tool will be used across markets with key customers to gather and deliver the right insights to drive timely ac-tions from supply chain and sales.
Overall Equipment Effectiveness (OEE) is a measure of how efficiently machinery is running. The higher the OEE, the more efficient the production and the lower the costs per unit. OEE varies between the Group’s breweries for various reasons. However, all breweries can improve, and in 2013 CSC set targets for improving OEE across the Group’s breweries and launched initiatives to do so.
MAXIMISE RETURN ON INVESTMENTSAll investments throughout the value chain must create value for the Group and our shareholders. We are selective in our invest-ments and invest disproportionally more in activities that offer the greatest impact for the Group. To ensure maximum return on investments, we carry out strict return-on-investment analyses when prioritising resource and CapEx allocation, apply return-on-marketing-investment calculations and continually focus on reducing working capital.
THE CARLSBERG WAY OF WORKINGWe have a clear understanding of what we believe is the best way of operating our busi-ness. However, we are always open to new ideas for improving what we do. To leverage the full potential of the Group, we share best practices across our business, as well as look-ing outside to learn from others. In order to use our capabilities to best effect, our tenet is “develop once – deploy everywhere”.
Carlsberg Group Annual Report 2013 25Management review STRATEGY
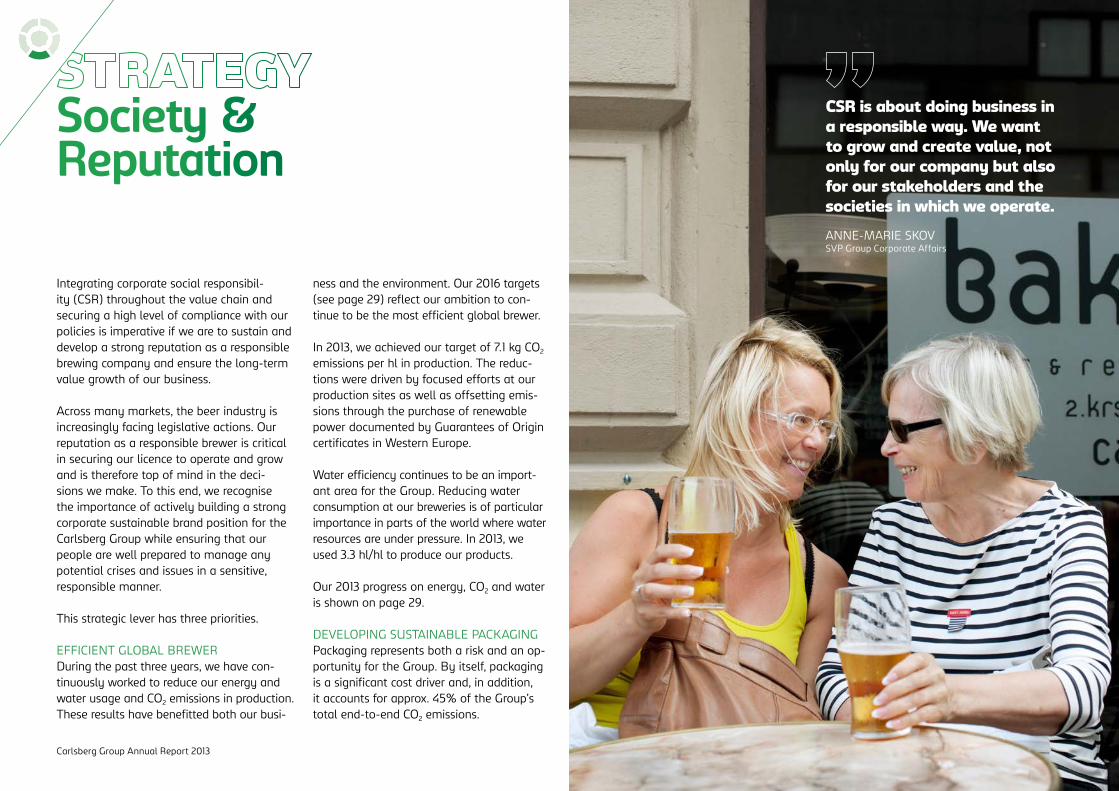
Society & Reputation
Integrating corporate social responsibil-ity (CSR) throughout the value chain and securing a high level of compliance with our policies is imperative if we are to sustain and develop a strong reputation as a responsible brewing company and ensure the long-term value growth of our business.
Across many markets, the beer industry is increasingly facing legislative actions. Our reputation as a responsible brewer is critical in securing our licence to operate and grow and is therefore top of mind in the deci-sions we make. To this end, we recognise the importance of actively building a strong corporate sustainable brand position for the Carlsberg Group while ensuring that our people are well prepared to manage any potential crises and issues in a sensitive, responsible manner.
This strategic lever has three priorities.
EFFICIENT GLOBAL BREWERDuring the past three years, we have con-tinuously worked to reduce our energy and water usage and CO2 emissions in production. These results have benefitted both our busi-
ness and the environment. Our 2016 targets (see page 29) reflect our ambition to con-tinue to be the most efficient global brewer.
In 2013, we achieved our target of 7.1 kg CO2 emissions per hl in production. The reduc-tions were driven by focused efforts at our production sites as well as offsetting emis-sions through the purchase of renewable power documented by Guarantees of Origin certificates in Western Europe.
Water efficiency continues to be an import-ant area for the Group. Reducing water consumption at our breweries is of particular importance in parts of the world where water resources are under pressure. In 2013, we used 3.3 hl/hl to produce our products.
Our 2013 progress on energy, CO2 and water is shown on page 29.
DEVELOPING SUSTAINABLE PACKAGINGPackaging represents both a risk and an op-portunity for the Group. By itself, packaging is a significant cost driver and, in addition, it accounts for approx. 45% of the Group’s total end-to-end CO2 emissions.
CSR is about doing business in a responsible way. We want to grow and create value, not only for our company but also for our stakeholders and the societies in which we operate.
ANNE-MARIE SKOVSVP Group Corporate Affairs
Carlsberg Group Annual Report 2013
SELECTED ACTIONS AND PROGRESS 2013
Improving the sustainability of our logistics operations is an important element in reducing our overall environmental impact. During 2013, CSC initiated a number of activities within four logistics focus areas: Fleet (improve the environmental perform-ance of our own fleet); Excellence (build an efficient logistics culture and improve environmental behaviour); Infrastructure (create environmental initiatives in our warehouses); and Collaboration (work with relevant stakeholders to create new oppor-tunities for a joint environmental agenda).
We continued our Responsible Sourcing Programme, inviting selected key suppli-ers to join the programme to gain insights into their operations and identify how they work with CSR-related risks. Suppliers were audited by an external assurer on environ-ment, business practices, health & safety and labour rights. The audits demonstrat-ed no critical non-compliances. A number of non-compliances and observations were identified and solved, while some are still being monitored and tracked closely.
Health & safety has been a focus area for the Group for many years and we have achieved significant progress in improv-ing safety in our production and logistics areas across the Group. In 2013, two of our Polish breweries were recognised by the Regional Labour Authorities in Poland for their safety improvements, ranking no. 1 in the occupational safety contest “Employer: Provider of Safe Work”.
Consequently, developing sustainable packaging solutions offers great potential for reducing our environmental impact and reducing long- and short-term risks. In 2013, we set ambitious targets and implemented a number of initiatives to reduce the environ-mental impact of our packaging.
We have entered into partnerships with global packaging suppliers of cans, glass bottles, coatings and shrink wrap. Our joint aim is to reduce the environmental impact and develop solutions that are optimised for reuse either as new packaging or as some-thing completely different, such as clothing, with the same or a higher level of quality than the original packaging.
PROMOTING RESPONSIBLE DRINKING While the vast majority of consumers enjoy beer in moderation as part of a healthy lifestyle, we recognise that a minority of consumers may have a harmful drinking pattern leading to unwanted health and social effects. As a responsible brewer, we are committed to reducing the harmful overconsumption of beer and to playing a positive role in taking global action on this important public health issue.
In 2013, we defined targets and developed a new policy and related guidelines for this area to enable commitment and compliance across the Group.
In 2012, we signed the Global Commitments to reduce harmful drinking and committed to reporting on our actions and progress within five areas as of 2013. Our reporting under the Global Commitments has been audited by an external assurer to increase trans-parency for our financial and non-financial
stakeholders. We believe that delivering on the Global Commitments is essential for our ambition to improve the image of beer and continue to drive category growth.
As another initiative, we have implemented strategic self-regulation schemes in cooper-ation with regulatory stakeholders in selected markets. This has enabled an open and constructive dialogue with key stakeholders, giving us the opportunity to prove our willingness to act on our ambition to reduce harmful drinking and grow responsibly.
Learn more about our view on self-regulation on page 30.
CSR TARGETS AND REPORTINGIn 2013, we delivered on our three-year targets within energy, CO2 and lost-time accidents in production. We developed new three-year
targets for our policies covering the following eight areas: environment, health & safety, community engagement, labour & human rights, responsible sourcing, business ethics, responsible drinking and marketing commu-nication. Selected targets and our progress towards achieving them are shown on page 29. We also reviewed and updated our policies and guidelines to ensure compliance with internal and external expectations.
We published an annual CSR report on our policies. The CSR report serves as our Communication on Progress to the United Nations Global Compact and further enables us to live up to our legal responsibility on CSR disclosure stated in section 99a of the Danish Financial Statements Act.
As in previous years, a selected set of indicators used to track our performance
Find out more about our responsible drinking initiatives.www.carlsberggroup.com/csr/reportingonprogress
with respect to environment and health & safety has been independently assured by the KPMG Climate Change & Sustainability team. Furthermore, an expanded set of stra-tegic indicators has been chosen for readiness assessment. Our aim is to have independent assurance across all CSR policies in 2016.
The full 2013 CSR report, including the KPMG assurance statement and GRI G3 table, is available online at www.carlsberggroup.com/csr/reports.
Carlsberg Group Annual Report 2013 27Management review STRATEGY
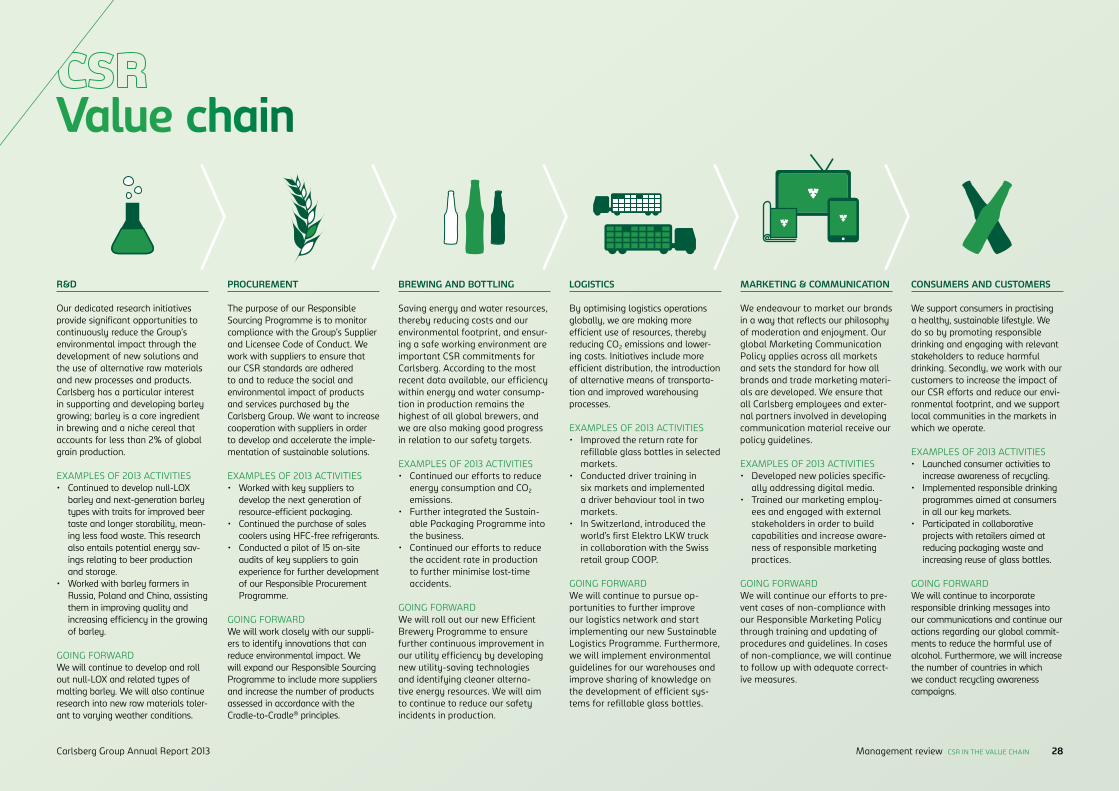
Value chain
R&D
Our dedicated research initiatives provide significant opportunities to continuously reduce the Group’s environmental impact through the development of new solutions and the use of alternative raw materials and new processes and products. Carlsberg has a particular interest in supporting and developing barley growing; barley is a core ingredient in brewing and a niche cereal that accounts for less than 2% of global grain production.
EXAMPLES OF 2013 ACTIVITIES• Continued to develop null-LOX
barley and next-generation barley types with traits for improved beer taste and longer storability, mean-ing less food waste. This research also entails potential energy sav-ings relating to beer production and storage.
• Worked with barley farmers in Russia, Poland and China, assisting them in improving quality and increasing efficiency in the growing of barley.
GOING FORWARD We will continue to develop and roll out null-LOX and related types of malting barley. We will also continue research into new raw materials toler-ant to varying weather conditions.
LOGISTICS
By optimising logistics operations globally, we are making more efficient use of resources, thereby reducing CO2 emissions and lower-ing costs. Initiatives include more efficient distribution, the introduction of alternative means of transporta-tion and improved warehousing processes.
EXAMPLES OF 2013 ACTIVITIES• Improved the return rate for
refillable glass bottles in selected markets.
• Conducted driver training in six markets and implemented a driver behaviour tool in two markets.
• In Switzerland, introduced the world’s first Elektro LKW truck in collaboration with the Swiss retail group COOP.
GOING FORWARDWe will continue to pursue op-portunities to further improve our logistics network and start implementing our new Sustainable Logistics Programme. Furthermore, we will implement environmental guidelines for our warehouses and improve sharing of knowledge on the development of efficient sys-tems for refillable glass bottles.
PROCUREMENT
The purpose of our Responsible Sourcing Programme is to monitor compliance with the Group’s Supplier and Licensee Code of Conduct. We work with suppliers to ensure that our CSR standards are adhered to and to reduce the social and environmental impact of products and services purchased by the Carlsberg Group. We want to increase cooperation with suppliers in order to develop and accelerate the imple-mentation of sustainable solutions.
EXAMPLES OF 2013 ACTIVITIES• Worked with key suppliers to
develop the next generation of resource-efficient packaging.
• Continued the purchase of sales coolers using HFC-free refrigerants.
• Conducted a pilot of 15 on-site audits of key suppliers to gain experience for further development of our Responsible Procurement Programme.
GOING FORWARDWe will work closely with our suppli-ers to identify innovations that can reduce environmental impact. We will expand our Responsible Sourcing Programme to include more suppliers and increase the number of products assessed in accordance with the Cradle-to-Cradle® principles.
MARKETING & COMMUNICATION
We endeavour to market our brands in a way that reflects our philosophy of moderation and enjoyment. Our global Marketing Communication Policy applies across all markets and sets the standard for how all brands and trade marketing materi-als are developed. We ensure that all Carlsberg employees and exter-nal partners involved in developing communication material receive our policy guidelines.
EXAMPLES OF 2013 ACTIVITIES• Developed new policies specific-
ally addressing digital media.• Trained our marketing employ-
ees and engaged with external stakeholders in order to build capabilities and increase aware-ness of responsible marketing practices.
GOING FORWARDWe will continue our efforts to pre-vent cases of non-compliance with our Responsible Marketing Policy through training and updating of procedures and guidelines. In cases of non-compliance, we will continue to follow up with adequate correct-ive measures.
BREWING AND BOTTLING
Saving energy and water resources, thereby reducing costs and our environmental footprint, and ensur-ing a safe working environment are important CSR commitments for Carlsberg. According to the most recent data available, our efficiency within energy and water consump-tion in production remains the highest of all global brewers, and we are also making good progress in relation to our safety targets.
EXAMPLES OF 2013 ACTIVITIES• Continued our efforts to reduce
energy consumption and CO2 emissions.
• Further integrated the Sustain-able Packaging Programme into the business.
• Continued our efforts to reduce the accident rate in production to further minimise lost-time accidents.
GOING FORWARDWe will roll out our new Efficient Brewery Programme to ensure further continuous improvement in our utility efficiency by developing new utility-saving technologies and identifying cleaner alterna-tive energy resources. We will aim to continue to reduce our safety incidents in production.
CONSUMERS AND CUSTOMERS
We support consumers in practising a healthy, sustainable lifestyle. We do so by promoting responsible drinking and engaging with relevant stakeholders to reduce harmful drinking. Secondly, we work with our customers to increase the impact of our CSR efforts and reduce our envi-ronmental footprint, and we support local communities in the markets in which we operate.
EXAMPLES OF 2013 ACTIVITIES• Launched consumer activities to
increase awareness of recycling.• Implemented responsible drinking
programmes aimed at consumers in all our key markets.
• Participated in collaborative projects with retailers aimed at reducing packaging waste and increasing reuse of glass bottles.
GOING FORWARDWe will continue to incorporate responsible drinking messages into our communications and continue our actions regarding our global commit-ments to reduce the harmful use of alcohol. Furthermore, we will increase the number of countries in which we conduct recycling awareness campaigns.
Carlsberg Group Annual Report 2013 28Management review CSR IN THE VALUE CHAIN
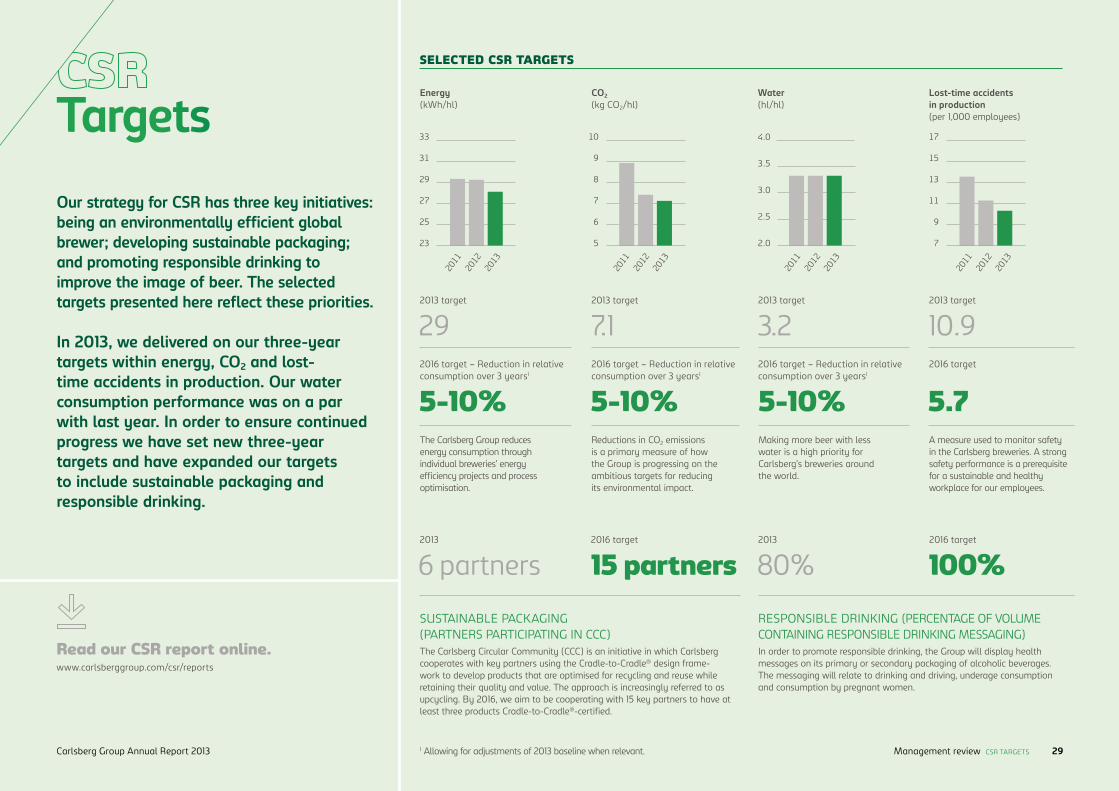
TargetsOur strategy for CSR has three key initiatives: being an environmentally efficient global brewer; developing sustainable packaging; and promoting responsible drinking to improve the image of beer. The selected targets presented here reflect these priorities.
In 2013, we delivered on our three-year targets within energy, CO2 and lost-time accidents in production. Our water consumption performance was on a par with last year. In order to ensure continued progress we have set new three-year targets and have expanded our targets to include sustainable packaging and responsible drinking.
Lost-time accidentsin production(per 1,000 employees)
Energy(kWh/hl)
SELECTED CSR TARGETS
33
31
29
27
25
23
2013
2013
2013
2013
2012
2012
2012
2012
2011
2011
2011
2011
17
15
13
11
9
7
CO2
(kg CO2/hl)
10
9
8
7
6
5
Water (hl/hl)
4.0
3.5
3.0
2.5
2.0
6 partners 15 partners 80%
SUSTAINABLE PACKAGING(PARTNERS PARTICIPATING IN CCC)
RESPONSIBLE DRINKING (PERCENTAGE OF VOLUME CONTAINING RESPONSIBLE DRINKING MESSAGING)
2013 2016 target 2013
100%2016 target
Read our CSR report online.www.carlsberggroup.com/csr/reports
292013 target
5-10%2016 target – Reduction in relative consumption over 3 years1
The Carlsberg Group reduces energy consumption through individual breweries’ energy efficiency projects and process optimisation.
7.12013 target
5-10%2016 target – Reduction in relative consumption over 3 years1
Reductions in CO2 emissions is a primary measure of how the Group is progressing on the ambitious targets for reducing its environmental impact.
3.22013 target
5-10%2016 target – Reduction in relative consumption over 3 years1
Making more beer with less water is a high priority for Carlsberg’s breweries around the world.
10.92013 target
5.72016 target
A measure used to monitor safety in the Carlsberg breweries. A strong safety performance is a prerequisite for a sustainable and healthy workplace for our employees.
The Carlsberg Circular Community (CCC) is an initiative in which Carlsberg cooperates with key partners using the Cradle-to-Cradle® design frame-work to develop products that are optimised for recycling and reuse while retaining their quality and value. The approach is increasingly referred to as upcycling. By 2016, we aim to be cooperating with 15 key partners to have at least three products Cradle-to-Cradle®-certified.
In order to promote responsible drinking, the Group will display health messages on its primary or secondary packaging of alcoholic beverages. The messaging will relate to drinking and driving, underage consumption and consumption by pregnant women.
1 Allowing for adjustments of 2013 baseline when relevant.Carlsberg Group Annual Report 2013 29Management review CSR TARGETS
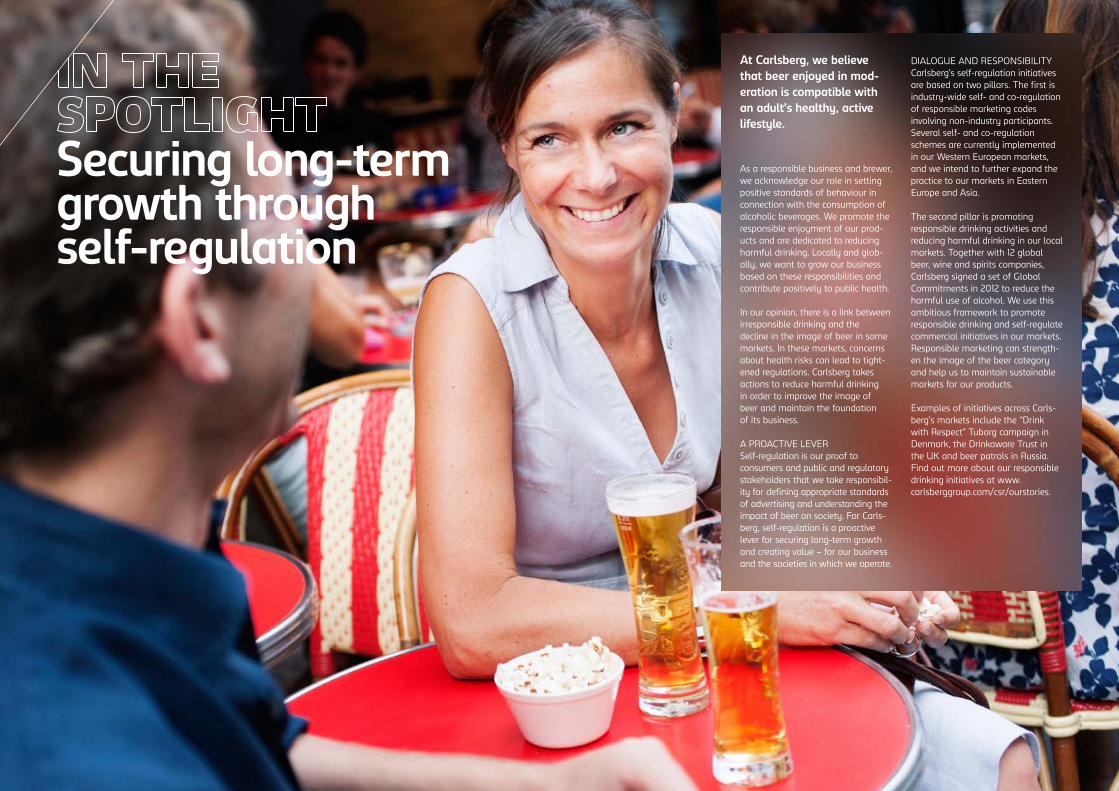
Securing long-term growth through self-regulation
At Carlsberg, we believe that beer enjoyed in mod-eration is compatible with an adult’s healthy, active lifestyle.
As a responsible business and brewer, we acknowledge our role in setting positive standards of behaviour in connection with the consumption of alcoholic beverages. We promote the responsible enjoyment of our prod-ucts and are dedicated to reducing harmful drinking. Locally and glob-ally, we want to grow our business based on these responsibilities and contribute positively to public health.
In our opinion, there is a link between irresponsible drinking and the decline in the image of beer in some markets. In these markets, concerns about health risks can lead to tight-ened regulations. Carlsberg takes actions to reduce harmful drinking in order to improve the image of beer and maintain the foundation of its business.
A PROACTIVE LEVERSelf-regulation is our proof to consumers and public and regulatory stakeholders that we take responsibil-ity for defining appropriate standards of advertising and understanding the impact of beer on society. For Carls-berg, self-regulation is a proactive lever for securing long-term growth and creating value – for our business and the societies in which we operate.
DIALOGUE AND RESPONSIBILITYCarlsberg’s self-regulation initiatives are based on two pillars. The first is industry-wide self- and co-regulation of responsible marketing codes involving non-industry participants. Several self- and co-regulation schemes are currently implemented in our Western European markets, and we intend to further expand the practice to our markets in Eastern Europe and Asia.
The second pillar is promoting responsible drinking activities and reducing harmful drinking in our local markets. Together with 12 global beer, wine and spirits companies, Carlsberg signed a set of Global Commitments in 2012 to reduce the harmful use of alcohol. We use this ambitious framework to promote responsible drinking and self-regulate commercial initiatives in our markets. Responsible marketing can strength-en the image of the beer category and help us to maintain sustainable markets for our products.
Examples of initiatives across Carls-berg’s markets include the “Drink with Respect” Tuborg campaign in Denmark, the Drinkaware Trust in the UK and beer patrols in Russia. Find out more about our responsible drinking initiatives at www. carlsberggroup.com/csr/ourstories.
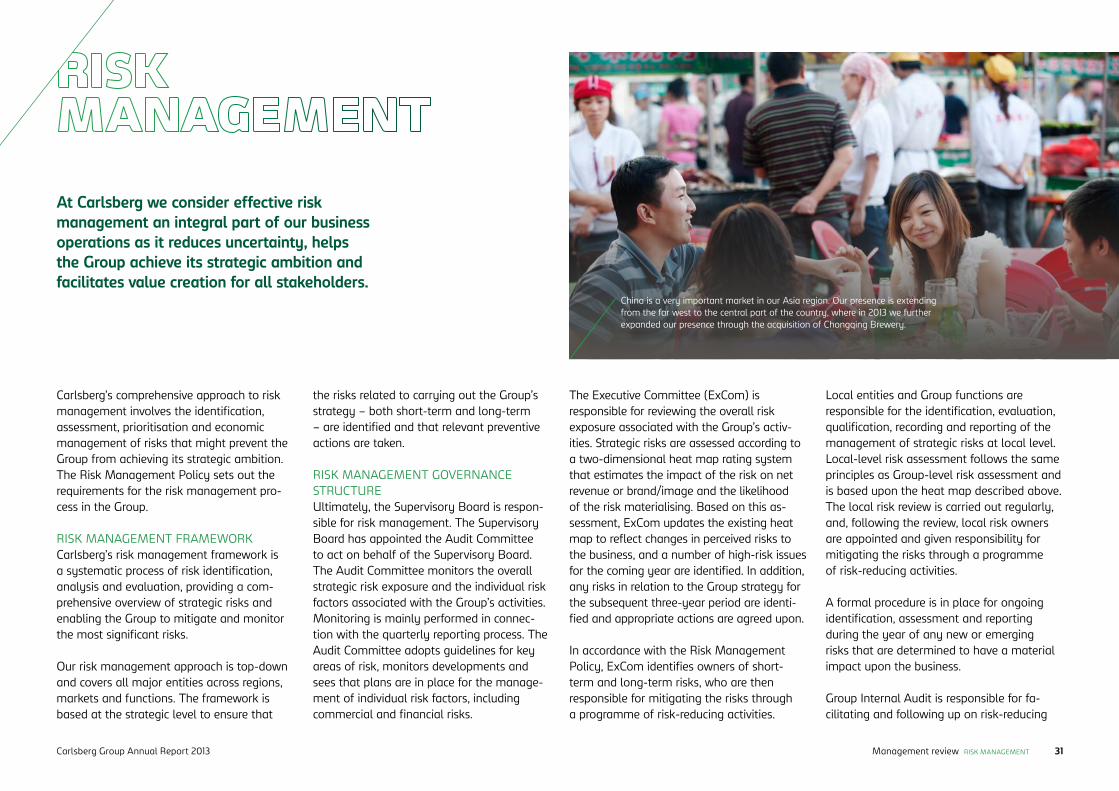
Carlsberg’s comprehensive approach to risk management involves the identification, assessment, prioritisation and economic management of risks that might prevent the Group from achieving its strategic ambition. The Risk Management Policy sets out the requirements for the risk management pro-cess in the Group.
RISK MANAGEMENT FRAMEWORKCarlsberg’s risk management framework is a systematic process of risk identification, analysis and evaluation, providing a com-prehensive overview of strategic risks and enabling the Group to mitigate and monitor the most significant risks.
Our risk management approach is top-down and covers all major entities across regions, markets and functions. The framework is based at the strategic level to ensure that
the risks related to carrying out the Group’s strategy – both short-term and long-term – are identified and that relevant preventive actions are taken.
RISK MANAGEMENT GOVERNANCE STRUCTUREUltimately, the Supervisory Board is respon-sible for risk management. The Supervisory Board has appointed the Audit Committee to act on behalf of the Supervisory Board. The Audit Committee monitors the overall strategic risk exposure and the individual risk factors associated with the Group’s activities. Monitoring is mainly performed in connec-tion with the quarterly reporting process. The Audit Committee adopts guidelines for key areas of risk, monitors developments and sees that plans are in place for the manage-ment of individual risk factors, including commercial and financial risks.
At Carlsberg we consider effective risk management an integral part of our business operations as it reduces uncertainty, helps the Group achieve its strategic ambition and facilitates value creation for all stakeholders.
The Executive Committee (ExCom) is responsible for reviewing the overall risk exposure associated with the Group’s activ-ities. Strategic risks are assessed according to a two-dimensional heat map rating system that estimates the impact of the risk on net revenue or brand/image and the likelihood of the risk materialising. Based on this as-sessment, ExCom updates the existing heat map to reflect changes in perceived risks to the business, and a number of high-risk issues for the coming year are identified. In addition, any risks in relation to the Group strategy for the subsequent three-year period are identi-fied and appropriate actions are agreed upon.
In accordance with the Risk Management Policy, ExCom identifies owners of short-term and long-term risks, who are then responsible for mitigating the risks through a programme of risk-reducing activities.
Local entities and Group functions are responsible for the identification, evaluation, qualification, recording and reporting of the management of strategic risks at local level. Local-level risk assessment follows the same principles as Group-level risk assessment and is based upon the heat map described above. The local risk review is carried out regularly, and, following the review, local risk owners are appointed and given responsibility for mitigating the risks through a programme of risk-reducing activities.
A formal procedure is in place for ongoing identification, assessment and reporting during the year of any new or emerging risks that are determined to have a material impact upon the business.
Group Internal Audit is responsible for fa-cilitating and following up on risk-reducing
China is a very important market in our Asia region. Our presence is extending from the far west to the central part of the country, where in 2013 we further expanded our presence through the acquisition of Chongqing Brewery.
Carlsberg Group Annual Report 2013 31Management review RISK MANAGEMENT
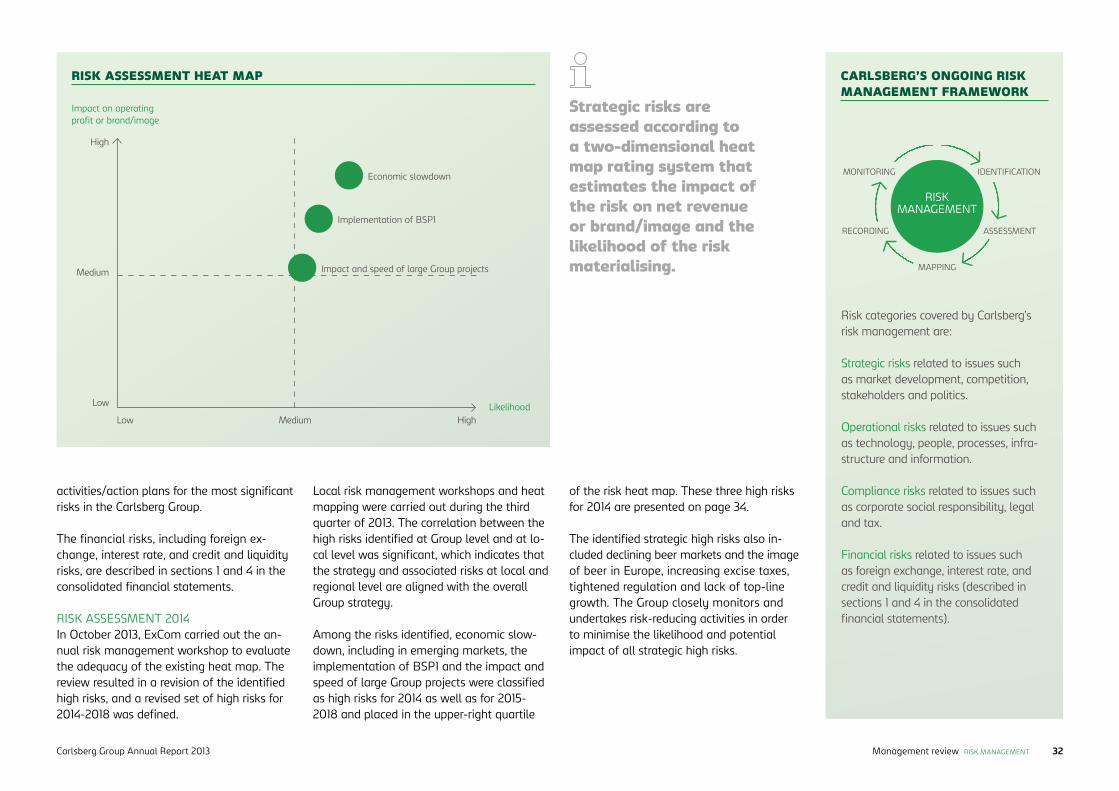
activities/action plans for the most significant risks in the Carlsberg Group.
The financial risks, including foreign ex-change, interest rate, and credit and liquidity risks, are described in sections 1 and 4 in the consolidated financial statements.
RISK ASSESSMENT 2014In October 2013, ExCom carried out the an-nual risk management workshop to evaluate the adequacy of the existing heat map. The review resulted in a revision of the identified high risks, and a revised set of high risks for 2014-2018 was defined.
Local risk management workshops and heat mapping were carried out during the third quarter of 2013. The correlation between the high risks identified at Group level and at lo-cal level was significant, which indicates that the strategy and associated risks at local and regional level are aligned with the overall Group strategy.
Among the risks identified, economic slow-down, including in emerging markets, the implementation of BSP1 and the impact and speed of large Group projects were classified as high risks for 2014 as well as for 2015-2018 and placed in the upper-right quartile
CARLSBERG’S ONGOING RISK MANAGEMENT FRAMEWORK
Risk categories covered by Carlsberg’s risk management are:
Strategic risks related to issues such as market development, competition, stakeholders and politics.
Operational risks related to issues such as technology, people, processes, infra-structure and information.
Compliance risks related to issues such as corporate social responsi bility, legal and tax.
Financial risks related to issues such as foreign exchange, interest rate, and credit and liquidity risks (described in sections 1 and 4 in the consolidated financial statements).
IDENTIFICATION
ASSESSMENT
MAPPING
RECORDING
MONITORING
RISKMANAGEMENT
of the risk heat map. These three high risks for 2014 are presented on page 34.
The identified strategic high risks also in-cluded declining beer markets and the image of beer in Europe, increasing excise taxes, tightened regulation and lack of top-line growth. The Group closely monitors and undertakes risk-reducing activities in order to minimise the likelihood and potential impact of all strategic high risks.
Strategic risks are assessed according to a two-dimensional heat map rating system that estimates the impact of the risk on net revenue or brand/image and the likelihood of the risk materialising.
RISK ASSESSMENT HEAT MAP
Economic slowdown
Impact on operating profit or brand/image
Likelihood
Implementation of BSP1
Impact and speed of large Group projects
High
Medium
Low
Low Medium High
Carlsberg Group Annual Report 2013 32Management review RISK MANAGEMENT
Three high risks were identified for 2013. Their impact on the Group and the proactive steps taken were as follows.
CHANGE AGENDA RELATED TO THE SUPPLY CHAIN INTEGRATIONIn late 2011, it was decided to integrate and centralise the Carlsberg supply chain, incorp-orating procurement, planning, production and logistics and rolling out the business standardisation project (BSP1).
Due to the scale of the BSP1 project and the dependency on initiatives being implemented smoothly, the change agenda related to the integration of the supply chain was deemed a high risk for 2013.
During 2013, a number of initiatives were undertaken to ensure the smooth implemen-tation of BSP1. Initiatives included frequent communication and regular interaction with markets and commercial teams to increase awareness and resolve questions. Also, the change agenda was a standard item on the senior supply chain management agenda. In addition, close continuous cooperation be-tween the business standardisation implemen-tation teams and the supply chain ensured alignment of tasks, needs, requirements etc.
The integration and centralisation of the supply chain and the roll-out of BSP1 remain key priorities for the Group, and the associ-ated risks are still considered high.
LEGAL RESTRICTIONS IN EASTERN EUROPEEastern Europe accounts for approximately 35% of Group beer volumes and 40% of operating profit. In recent years, our largest market in the region, Russia, has passed new regulations impacting the beer industry, such as sales and advertising restrictions and recipe requirements. For 2013, the Group considered the changing laws and regula-tions in Russia and the rest of the region to be a high risk.
The changing laws led to a change in the retail landscape in Russia in 2013, which had a negative impact on Russian beer consump-tion in 2013. The market volume decline im-pacted our Russian volumes, but was partly mitigated through lower costs of goods sold, significant efficiency improvements across the region and lower marketing expenses.
In addition, senior management at Group and local level maintained a sharp focus on government relations in 2013. We also engaged in coordinated initiatives with the other brewers in Russia aimed at bet-
ter representation of the industry to the government and other key stakeholders. In continuation of this, the Russian brewers have announced a self-regulation scheme concerning beer bottle sizes.
The Group still considers legal restrictions in Eastern Europe a strategic risk, although not a high risk for 2014. Consequently, we will continue our proactive approach to government relations and initiatives with the brewers’ associations in our Eastern European markets.
PROMOTIONAL PRESSURE FROM RETAILIn late 2012, the global economic environ-ment was challenging and consumer senti-ment was under pressure, particularly in Western Europe.
In view of this, increased pressure from customers for more promotions leading to lower net sales/hl was considered a high risk for 2013.
A number of actions were taken in response to this high risk. The most important of these was the continued development and roll-out of our sophisticated value manage-ment toolbox, which aims at strengthening our position with customers and increasing the net sales value per hl in close cooper-
ation with our customers. In addition, we continued the development and roll-out of tools to measure the return on marketing investment (ROMI).
These tools have increased the transparency and oversight of the Group’s pricing and promotional decisions and marketing invest-ments, and have enabled us to optimise net sales per hl and the value gained from sales and marketing activities. Consequently, the risk has been reduced and is not a part of the heat map for 2014.
High risks 2013
Carlsberg Group Annual Report 2013 33Management review RISK MANAGEMENT
The Carlsberg Group’s Executive Committee has identified three high risks facing the Group in 2014. These risks were assessed to be placed in the upper-right quartile of the risk heat map.
ECONOMIC SLOWDOWNDescriptionThe economic slowdown of recent years continues, particularly in Western Europe. But slower growth is also evident in Eastern Europe and some Asian countries.
Possible impactSlower economic growth particularly impacts emerging markets, including Eastern Europe, where there is a clear correlation between GDP growth and growth in beer consump-tion. However, in the mature markets of Western Europe the challenging macroecon-omy has also had a negative impact on beer consumption. Declining or slower growth in beer consumption may negatively impact the Group’s net revenue and operating profit.
MitigationWe continuously monitor the macroeconomic health of our markets and will continue to take actions to reduce the impact of the ad-verse economic environment. Mitigating fac-tors and actions include our broad portfolio of beer, which caters to different price segments, and the active diversification of our portfolio outside beer, for example the Somersby cider brand. From a cost perspective, we apply a systematic and focused approach to allocate our resources to fewer things with the highest impact. The many efficiency initiatives across the business will also reduce the cost base.
IMPLEMENTATION OF BSP1Description2013 was the first year of the three-year implementation period of the supply chain integration and business standardisation project (BSP1). The project is a key enabler for the transformation of the operating model in Western Europe and will lead to increased speed, optimised asset utilisa-tion and improved capabilities. The project will yield significant long-term benefits in Western Europe.
Possible impactRolling out the BSP1 project requires signifi-cant resources and entails substantial imple-mentation costs. If the implementation of the project or the adoption of the new oper-ating model fails, this could have a negative impact on regional and Group earnings.
MitigationIn order to reduce the risk of not being able to manage the BSP1 implementation and the business transformation, a number of activi-ties are ongoing, including: post go-live assessment of ways of working to identify issues and create solutions; accumulating and adapting to lessons learned from past roll-outs; securing key resources across the mar-kets; and, when and if appropriate, reorganising the BSP1 teams to ensure clear responsibilities at all times during the roll-out period.
IMPACT AND SPEED OF LARGE GROUP PROJECTSDescription In addition to the BSP1 project, the Carlsberg Group is running a number of large structural and efficiency projects to reduce the overall cost base of the Group. Another large project in 2014 will be the integration of the newly acquired Chongqing Brewery.
Possible impactIn light of the challenging economic environ-ment in many of the Group’s markets, the structural, efficiency and integration projects represent important levers for growing Group operating profit. Failure to successfully implement the projects therefore represents a risk to achieving the Group’s financial ambitions.
MitigationTo ensure the development and implementa-tion of the large Group projects, they are the focus of attention for top management. In addition, the Group has adopted a rigid and systematic approach to closely monitor and track the status of key initiatives, includ-ing progress versus plan, issues, risks and savings. Where relevant, KPIs are linked to project performance.
High risks 2014
Carlsberg Group Annual Report 2013 34Management review RISK MANAGEMENT
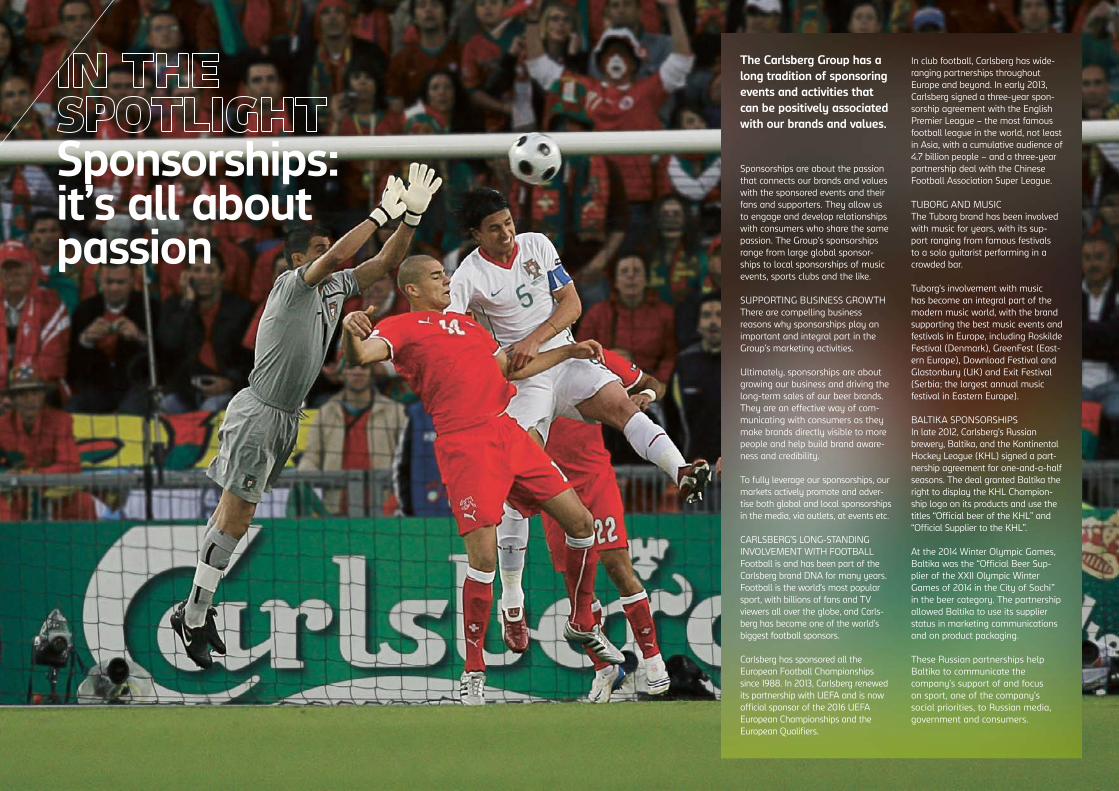
Sponsorships: it’s all about passion
The Carlsberg Group has a long tradition of sponsoring events and activities that can be positively associated with our brands and values.
Sponsorships are about the passion that connects our brands and values with the sponsored events and their fans and supporters. They allow us to engage and develop relationships with consumers who share the same passion. The Group’s sponsorships range from large global sponsor-ships to local sponsorships of music events, sports clubs and the like.
SUPPORTING BUSINESS GROWTHThere are compelling business reasons why sponsorships play an important and integral part in the Group’s marketing activities.
Ultimately, sponsorships are about growing our business and driving the long-term sales of our beer brands. They are an effective way of com-municating with consumers as they make brands directly visible to more people and help build brand aware-ness and credibility.
To fully leverage our sponsorships, our markets actively promote and adver-tise both global and local sponsorships in the media, via outlets, at events etc.
CARLSBERG’S LONG-STANDING INVOLVEMENT WITH FOOTBALLFootball is and has been part of the Carlsberg brand DNA for many years. Football is the world’s most popular sport, with billions of fans and TV viewers all over the globe, and Carls-berg has become one of the world’s biggest football sponsors.
Carlsberg has sponsored all the European Football Championships since 1988. In 2013, Carlsberg renewed its partnership with UEFA and is now official sponsor of the 2016 UEFA European Championships and the European Qualifiers.
In club football, Carlsberg has wide-ranging partnerships throughout Europe and beyond. In early 2013, Carlsberg signed a three-year spon-sorship agreement with the English Premier League – the most famous football league in the world, not least in Asia, with a cumulative audience of 4.7 billion people – and a three-year partnership deal with the Chinese Football Association Super League.
TUBORG AND MUSICThe Tuborg brand has been involved with music for years, with its sup-port ranging from famous festivals to a solo guitarist performing in a crowded bar.
Tuborg’s involvement with music has become an integral part of the modern music world, with the brand supporting the best music events and festivals in Europe, including Roskilde Festival (Denmark), GreenFest (East-ern Europe), Download Festival and Glastonbury (UK) and Exit Festival (Serbia; the largest annual music festival in Eastern Europe).
BALTIKA SPONSORSHIPSIn late 2012, Carlsberg’s Russian brewery, Baltika, and the Kontinental Hockey League (KHL) signed a part-nership agreement for one-and-a-half seasons. The deal granted Baltika the right to display the KHL Champion-ship logo on its products and use the titles “Official beer of the KHL” and “Official Supplier to the KHL”.
At the 2014 Winter Olympic Games, Baltika was the “Official Beer Sup-plier of the XXII Olympic Winter Games of 2014 in the City of Sochi” in the beer category. The partnership allowed Baltika to use its supplier status in marketing communications and on product packaging.
These Russian partnerships help Baltika to communicate the company’s support of and focus on sport, one of the company’s social priorities, to Russian media, government and consumers.
Carlsberg aims to maintain an appropriate corporate governance framework to ensure active, reliable and profitable business management across the Group.
Carlsberg’s Supervisory Board and Executive Board constantly strive to ensure that the Group’s management structure and control systems are appropriate and work satisfac-torily. A number of internal procedures have been developed and are regularly updated in order to ensure active, reliable and profitable business management.
The basis of the Group’s corporate govern-ance includes the Danish Companies Act, the Danish Financial Statements Act, IFRS, the Danish Securities Trading Act, NASDAQ OMX Copenhagen A/S’s rules for issuers of shares, and the Company’s Articles of Association.
RECOMMENDATIONS ON CORPORATE GOVERNANCE The recommendations of the Danish Com-mittee on Corporate Governance form part of NASDAQ OMX Copenhagen A/S’s rules
for issuers of shares. These recommendations were last amended in May 2013 and can be found online1.
As in other European countries, companies must either comply with the recommenda-tions or explain any deviation.
The Supervisory Board actively uses the corporate governance recommendations in rel-evant areas to optimise the way it works, and Carlsberg complies with all recommendations.
Carlsberg’s statutory report on corporate governance includes a full list of the recom-mendations of the Committee on Corporate Governance, together with Carlsberg’s com-ments with regard to each recommendation; see www.carlsberggroup.com/Company/ Governance/Pages/UKrecommendations.aspx.
SHAREHOLDERS AND CAPITAL STRUCTURECarlsberg aims to provide information and opportunities for dialogue to its shareholders through regular publication of news, interim reports and annual reports, and at General Meetings. The Company’s website is continu-ously updated with published information. Regular teleconferences, conferences and meetings are also arranged with investors.
The Supervisory Board regularly assesses whether the Company’s capital structure fulfils the interests of the Group and its shareholders. The overall goal is to ensure a capital structure that supports long-term profitable growth and value creation. The Company’s Articles of Association contain no limits on ownership or voting rights.
Carlsberg’s share capital is divided into two classes. All shares have the same nomi-nal value (DKK 20). An A share carries 20 votes, while a B share carries two votes and is entitled to a preferential dividend. Both classes of shares are listed on NASDAQ OMX Copenhagen. The Supervisory Board believes that the different share classes, combined with the Carlsberg Foundation’s position as principal shareholder, have been and will re-main advantageous for all of the Company’s shareholders as this structure supports the long-term development of the business.
THE GENERAL MEETINGThe General Meeting is the Company’s supreme governing body. The Supervisory Board believes that it is important that shareholders receive detailed information and are provided with an adequate basis for the decisions to be made at the General Meeting.
Notice of a General Meeting is published at least three weeks prior to the meeting and is sent to all shareholders who have provided an e-mail address. In 2013, the Company sent notices to shareholders who had re-quested to be notified of General Meetings by ordinary mail, but at the same time informed the shareholders that this service would be discontinued after the Annual General Meeting in 2013, as already provided for in the Articles of Association. All share-holders who own shares one week before the General Meeting are entitled to partici-pate in and vote at the General Meeting, provided they have requested an admission card no later than three days before the meeting. Any shareholder is also entitled to put forward proposals for consideration at the Annual General Meeting to the Super-visory Board no later than six weeks before the date of the meeting.
Any shareholder who has the right to attend the General Meeting may give proxy to the Supervisory Board or to somebody else attending the General Meeting for each indi-vidual item on the agenda or vote by letter as set out in the notice of the General Meeting.
Minutes of the General Meeting are made available on the Company’s website no later than two weeks after the meeting.
According to the authorisation of the Gen-eral Meeting, the Supervisory Board may, in the period until 24 March 2015, allow the Company to acquire treasury shares up to a total holding of 10% of the nominal share capital at the price quoted on NASDAQ OMX Copenhagen at the time of acquisition with a deviation of up to 10%.
1 www.corporategovernance.dk/file/371640/commitee_on_corporate_governance_recommendations_on_corporate_governance.pdfCarlsberg Group Annual Report 2013 36Management review CORPORATE GOVERNANCE

PROVISIONS GOVERNING ALTERATIONS OF THE ARTICLES OF ASSOCIATIONIn order to pass a resolution to alter the Articles of Association or to dissolve the Company that is not proposed or endorsed by the Supervisory Board, at least one third of the possible number of votes representing the total share capital shall be represented at the General Meeting and the resolution shall be passed by three quarters of both the total number of votes cast and of the voting share capital represented at the General Meeting. If the resolution is proposed or endorsed by the Supervisory Board, a qualified majority of two thirds of both the total number of votes cast and of the voting share capital repre-sented at the General Meeting is required.
If the prescribed portion of the voting share capital is not sufficiently represented at the General Meeting but a resolution is nonethe-less passed, such resolution may be finally passed at an Extraordinary General Meeting convened by the Supervisory Board within 14 days of the first General Meeting, irrespective of the number of votes represented at the Extraordinary General Meeting. In order for a resolution not endorsed by the Supervisory
Board to be passed successfully at this sec-ond General Meeting, three quarters of both the total number of votes cast and of the vot-ing share capital represented at the General Meeting must vote in favour of the resolution. STAKEHOLDERS AND THE COMPANYCarlsberg aims to develop and maintain a good relationship with its stakeholders as this is important for the Company’s development.
Therefore, the Company has formulated policies for a number of key areas, such as communications, human resources, envi-ronment, business ethics, competition law, marketing communication and responsibility to customers and society in general. One element of the Supervisory Board’s work is to ensure compliance with and regular ad-justment of policies to reflect developments both inside and outside the Company. The Communications Policy and related proce-dures serve to ensure that information of importance to investors, employees, authori-ties and others is made available to them and published in accordance with applicable rules and regulations.
Communication with investors and analysts is primarily handled by the Company’s Executive Board and the Investor Relations department.
This dialogue includes a comprehensive pro-gramme of activities and complies with the rules of NASDAQ OMX Copenhagen A/S. All company announcements are published in English and, for the time being, simul-taneously in Danish, and are distributed electronically directly to shareholders and others who have requested them immedi-ately following publication.
Investor presentations are usually made available on the Company’s website at the same time as the presentations are given.
THE COMPOSITION OF THE SUPERVISORY BOARDThe General Meeting elects the Supervisory Board. The Supervisory Board currently has 10 members elected by the General Meeting and four members elected by the employees in accordance with the Danish Companies Act. The Supervisory Board thus has a total of 14 members.
The members elected by the employees hold the same rights and obligations as the members elected by the General Meeting and are elected for a term of four years. The current employee representatives were elected in 2010.
The next election will take place in February 2014, when five employee representatives will be elected.
Five of the members elected by the General Meeting are affiliated to the Carlsberg Foun-dation, the Company’s principal shareholder, and have an academic background, while five members have an international business background. This composition ensures appro-priate diversity and breadth in the members’ approach to their duties. The Supervisory Board believes that this also helps to ensure that decisions are well considered.
According to the Articles of Association, the members of the Supervisory Board are elected individually and for a term of one year. Re-election is possible. Members must step down at the first General Meeting after they reach the age of 70.
Each year, the Supervisory Board considers the skills that should be represented on the Supervisory Board on the basis of a recom-mendation from the Nomination Committee. These skills are described in the Specification of Competencies, which is posted on www.carlsberggroup.com. The Nomination Commit-tee and the Supervisory Board take the descrip-tion of the required skills into consideration when recommending new candidates for the Supervisory Board. A description of the com-position of the Supervisory Board and the indi-vidual members’ particular competences with respect to the work of the Supervisory Board is found on page 162 as well as on the Company’s website. None of the members of the Super-visory Board are or have been involved in the executive management of the Group.
Prior to recommending candidates for elec-tion at the General Meeting, the Supervisory Board (based on a proposal from the Nomi-nation Committee) distributes a presentation of each candidate’s background, relevant competences and any managerial positions or positions of responsibility, and the Superviso-ry Board justifies its recommendations on the basis of the recruitment criteria and Specifica-tion of Competencies it has laid down.
DIVERSITYIn March 2013, the Supervisory Board adjust-ed the Company’s objectives for the diversity of the Supervisory Board members elected by the General Meeting in relation to gender and international experience in order to comply with new Danish legislation on objectives to increase the proportion of the underrepresent-ed gender on the Supervisory Board.
The new legislation also requires the Supervisory Board to decide on a policy
Carlsberg’s statutory report on corporate governance includes our comments on each recommendation of the Committee on Corporate Governance. www.carlsberggroup.com/company/governance
Carlsberg Group Annual Report 2013 37Management review CORPORATE GOVERNANCE
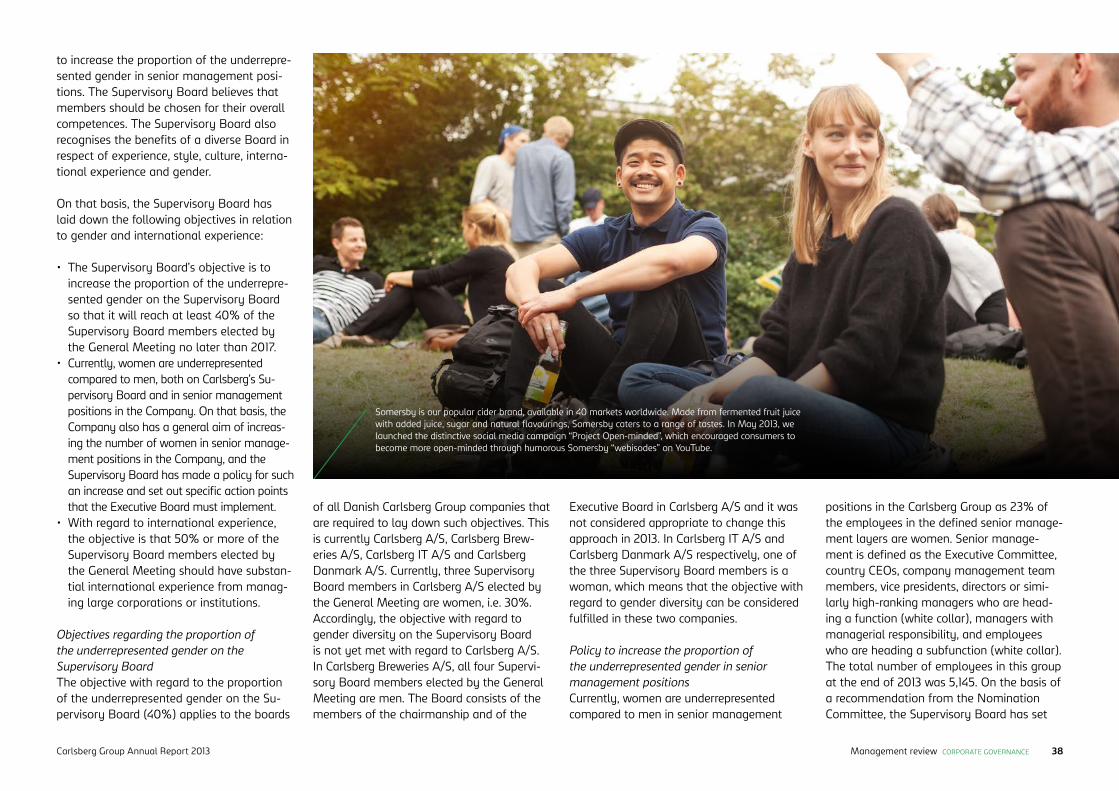
to increase the proportion of the underrepre-sented gender in senior management posi-tions. The Supervisory Board believes that members should be chosen for their overall competences. The Supervisory Board also recognises the benefits of a diverse Board in respect of experience, style, culture, interna-tional experience and gender.
On that basis, the Supervisory Board has laid down the following objectives in relation to gender and international experience:
• The Supervisory Board’s objective is to increase the proportion of the underrepre-sented gender on the Supervisory Board so that it will reach at least 40% of the Supervisory Board members elected by the General Meeting no later than 2017.
• Currently, women are underrepresented compared to men, both on Carlsberg’s Su-pervisory Board and in senior management positions in the Company. On that basis, the Company also has a general aim of increas-ing the number of women in senior manage-ment positions in the Company, and the Supervisory Board has made a policy for such an increase and set out specific action points that the Executive Board must implement.
• With regard to international experience, the objective is that 50% or more of the Supervisory Board members elected by the General Meeting should have substan-tial international experience from manag-ing large corporations or institutions.
Objectives regarding the proportion of the underrepresented gender on the Supervisory Board The objective with regard to the proportion of the underrepresented gender on the Su-pervisory Board (40%) applies to the boards
of all Danish Carlsberg Group companies that are required to lay down such objectives. This is currently Carlsberg A/S, Carlsberg Brew-eries A/S, Carlsberg IT A/S and Carlsberg Danmark A/S. Currently, three Supervisory Board members in Carlsberg A/S elected by the General Meeting are women, i.e. 30%. Accordingly, the objective with regard to gender diversity on the Supervisory Board is not yet met with regard to Carlsberg A/S. In Carlsberg Breweries A/S, all four Supervi-sory Board members elected by the General Meeting are men. The Board consists of the members of the chairmanship and of the
Executive Board in Carlsberg A/S and it was not considered appropriate to change this approach in 2013. In Carlsberg IT A/S and Carlsberg Danmark A/S respectively, one of the three Supervisory Board members is a woman, which means that the objective with regard to gender diversity can be considered fulfilled in these two companies.
Policy to increase the proportion of the underrepresented gender in senior management positionsCurrently, women are underrepresented compared to men in senior management
positions in the Carlsberg Group as 23% of the employees in the defined senior manage-ment layers are women. Senior manage-ment is defined as the Executive Committee, country CEOs, company management team members, vice presidents, directors or simi-larly high-ranking managers who are head-ing a function (white collar), managers with managerial responsibility, and employees who are heading a subfunction (white collar). The total number of employees in this group at the end of 2013 was 5,145. On the basis of a recommendation from the Nomination Committee, the Supervisory Board has set
Somersby is our popular cider brand, available in 40 markets worldwide. Made from fermented fruit juice with added juice, sugar and natural flavourings, Somersby caters to a range of tastes. In May 2013, we launched the distinctive social media campaign “Project Open-minded”, which encouraged consumers to become more open-minded through humorous Somersby “webisodes” on YouTube.
Carlsberg Group Annual Report 2013 38Management review CORPORATE GOVERNANCE
out a policy to increase the proportion of women in senior management positions. The relevant action items are as follows:• Headhunters must present at least one
qualified female candidate when recruit-ing for senior management positions. This requirement has been incorporated into the Group Recruitment Policy but it is too early to judge the impact of the initiative.
• The Carlsberg Group has a leadership pro-gramme (ALDP – Accelerated Leadership Development Programme) to which qual-ified employees are appointed once a year. The target is to ensure that at least one third of the participants in each programme are women. In 2013, 35% of the appointed participants were women, an increase of more than 30% compared to 2012.
• Finally, any woman who, based on a very strong performance and potential rating, including full international mobil-ity, qualifies to take on a role at CEO or management board level in Carlsberg’s local subsidiaries and/or in the commercial supply chain or finance areas at VP level in Carlsberg Group functions/headquarters/ regions/Carlsberg Supply Company AG, Switzerland, must have a mentor ap-pointed. The mentor must be a senior manager, and the role of the mentor is to encourage the strong-performing woman to continue to develop her competences within management and consider career opportunities and promotions (including in Carlsberg businesses in other countries). All women from this group who received a strong performance rating in 2013 already have a mentor or will have one appointed during the first six months of 2014. Similarly, mentors will be appointed for qualifying women in 2014. Group HR is considering whether a structured men-
tor guideline should be drawn up, but at present the mentor is relatively free to decide on how to fulfil the mentor role as long as the aim is to encourage women to develop management skills and consider relevant opportunities and promotions. It is expected that the mentor programme will increase the number of women who decide on a management career in Carls-berg, but it is too early to judge the actual impact of the programme.
Carlsberg wants to be an attractive work-place for both female and male managers where men and women consider that they have equal and fair opportunities for promo-tion to higher managerial positions and that their competences can be used in the best possible way irrespective of gender.
International experienceThe objective regarding the international experience of Supervisory Board members is met as at least six of the 10 members of the Supervisory Board elected by the General Meeting can be considered to have substantial international experience from managing large corporations or institutions and all members elected by the General Meeting are able to operate in an interna-tional environment.
THE WORK OF THE SUPERVISORY BOARDThe Supervisory Boards of the Parent Company, Carlsberg A/S, and of the other companies in the Group ensure that their Executive Boards observe the goals, strate-gies and business procedures established by the Supervisory Boards. Information from the Executive Boards of the various companies is provided systematically at meetings, as well as in written and oral reports covering
areas such as market developments and the companies’ performance, profitability and financial position.
The Supervisory Board of Carlsberg A/S held nine meetings in 2013 and a two-day strategy seminar combined with a visit to Carlsberg’s supply chain organisation in Switzerland. The strategy seminar and six of the Supervisory Board meetings were attended by all Supervisory Board members. The remaining meetings were attended by all but one member. According to its Rules of Procedure, the Supervisory Board meets at least six times a year in addition to an annual strategy meeting at which the Com-pany’s strategy and overall organisation are discussed. In between its ordinary meetings, the Supervisory Board receives written in-formation on the Company’s operations and financial position. Extraordinary meetings are convened if necessary. The Supervisory Board decides on major investments and divestments, the size and composition of the Company’s capital base, long-term obliga-tions, significant policies, control and audit issues, risk management and significant operational matters.
The Supervisory Board’s Rules of Procedure set out the procedures for the Executive Board’s reporting to the Supervisory Board and for any other communication between the two bodies. The Rules of Procedure are reviewed annually by the Supervisory Board and adjusted if required.
The Chairman and Deputy Chairman of the Supervisory Board constitute the Chairman-ship, which organises meetings of the Super-visory Board in cooperation with the Exe-cutive Board. The Chairmanship held eight
meetings in 2013 and they were all attended by both the Chairman and the Deputy Chair-man. The specific duties of the Chairman and – in his absence – the Deputy Chairman are set out in the Rules of Procedure.
Each year, the Chairman of the Supervisory Board heads a structured evaluation of the Board’s work, accomplishments and com-position in a structured dialogue with each Board member. The evaluation is carried out in accordance with a written procedure estab-lished by the Supervisory Board on the basis of a recommendation from the Nomination Committee and on the basis of a question-naire with a number of items that the Supervisory Board members are to consider as part of the evaluation. This evaluation also includes the cooperation between the Supervisory Board and the Executive Board, and the work, accomplishments and compo-sition of the Executive Board and a session without the presence of the Executive Board at which its performance is evaluated.
Finally, the process includes a meeting without the presence of the Chairman at which the performance of the Chairman is discussed. During the evaluation process in 2013, the Supervisory Board members generally expressed that they were very content with the structure and function of the Supervisory Board and, in particular, with the detailed meeting planning, the amount and quality of meeting material and the presentation of issues by the Execu-tive Board and the subsequent open discus-sions at the Supervisory Board meetings.
The Supervisory Board also expressed content with the focus on risk evaluation, strategy and direction-setting during Board
Carlsberg Group Annual Report 2013 39Management review CORPORATE GOVERNANCE
discussions. The evaluation process led to a short catalogue of ideas for minor changes to the way the Supervisory Board works. These ideas will be considered and imple-mented by the Supervisory Board as relevant, and some of them have been incorporated into the Supervisory Board’s meeting plan and procedures for 2014.
The Supervisory Board considers regularly – and at least once a year – whether its members’ expertise should be updated or strengthened with respect to their duties. In 2013, this was based on input from the Nomination Committee as well as the board evaluation process. Carlsberg provides a detailed introduction programme to all new Supervisory Board members and holds relevant courses for all Supervisory Board members.
BOARD COMMITTEESThe Audit CommitteeIn 2013, the Audit Committee consisted of four members of the Supervisory Board: Jess Søderberg (Chairman), Flemming Besen-bacher, Richard Burrows and Donna Cordner. Jess Søderberg, Richard Burrows and Donna Cordner all qualify as being independent of the Company and all possess the relevant financial expertise.
The Audit Committee is appointed for one year at a time. For 2014, Jess Søderberg, Richard Burrows and Donna Cordner have been appointed to the Committee, Jess Søderberg as Chairman.
The Audit Committee works according to Terms of Reference, which are reviewed and approved annually by the Supervisory Board, and a detailed annual meeting plan approved
by the Supervisory Board prior to the begin-ning of each financial year. The Supervisory Board approved the current Terms of Refer-ence and the Audit Committee meeting plan for 2013 at its meeting in December 2012 and approved the 2014 meeting plan at its meet-ing in December 2013. The Terms of Refer-ence are available on the Company’s website.
In 2013, the Audit Committee held five meet-ings. All members participated in four of the meetings. At one meeting, one member was absent. In accordance with its Terms of Reference and annual meeting plan, the Audit Committee has primarily carried out the following work:
a) Monitored the financial reporting process. The presentations to the Audit Committee and the Audit Committee’s discussions had special focus on management judgements, estimates, and changes in accounting policies and procedures and the clarity of disclosures. In addition, they focused on compliance with accounting standards and stock exchange and other legal require-ments related to financial reporting. The Audit Committee also discussed the as-sumptions behind the Company’s full-year profit expectations before all releases of financial statements. In addition, the Audit Committee reviewed the financial personnel succession planning.
b) Monitored the effectiveness of the internal control and risk management systems. This work included regular updates from Group Finance with regard to Carlsberg’s financial control framework. The Audit Committee reviewed the Company’s relevant policies in relation to internal control and risk management systems
and the financial reporting process and received reports and presentations from Group Finance about the effectiveness of these systems as well as the scope, plans and status for controls throughout the year. The Audit Committee also reviewed quarterly reports from Group Internal Audit on risk management, including the risk management process at Carlsberg and the status of risks identified in the strategic risk map and heat map. Finally, the Audit Committee monitored the devel-opment and implementation of a global expense policy.
c) Monitored the internal audit function. The work included a review and approval of internal audit plans and a review of the internal audit function. The Audit Com-mittee was presented with several of the tools used by Group Internal Audit in its work, including tools to mitigate fraud risk in the financial reporting process.
d) Monitored the external audit of financial reporting and the independence of the external audit. The work included discus-sions regarding audit planning and scope, terms of engagement, audit fees and a review at each meeting of the external auditors’ work and findings.
In accordance with the Terms of Reference, four of the Audit Committee meetings were held prior to the approval and announce-ment of the external financial reporting.
In addition, and in accordance with the Terms of Reference, all minutes and material were made available to the Supervisory Board, internal and external auditors and the Exe-cutive Board. The Audit Committee Chairman
also reported at each Supervisory Board meeting on the key findings and conclusions from the previous Audit Committee meeting.
At each Audit Committee meeting, the Audit Committee examines relevant issues with the external auditors and the head of Group Internal Audit, and the Committee invites other relevant function heads from the Carlsberg organisation depending on the topics being discussed at the meeting. The heads of Group Finance and Group Ac-counting are usually invited to participate in the Audit Committee meetings. In 2013, the Audit Committee held regular meetings with the external auditors and Group Internal Audit as well as with other relevant internal function heads without the presence of the Executive Board of the Company.
The Nomination CommitteeIn 2013, the Nomination Committee con-sisted of three members of the Supervisory Board: Flemming Besenbacher (Chairman), Jess Søderberg and Kees van der Graaf. Jess Søderberg and Kees van der Graaf are independent of the Company as defined in the recommendations. The Committee held three meetings in 2013 and all members at-tended all meetings. For 2014, Jess Søder-berg, Kees van der Graaf and Flemming Besenbacher have all been reappointed to the Committee and Flemming Besenbacher is continuing as Chairman.
The Nomination Committee works according to Terms of Reference, which are reviewed and approved annually by the Supervisory Board. The Terms of Reference are avail-able on the Company’s website. In 2013, the Committee’s work included recommendations to the Supervisory Board with regard to the
Carlsberg Group Annual Report 2013 40Management review CORPORATE GOVERNANCE
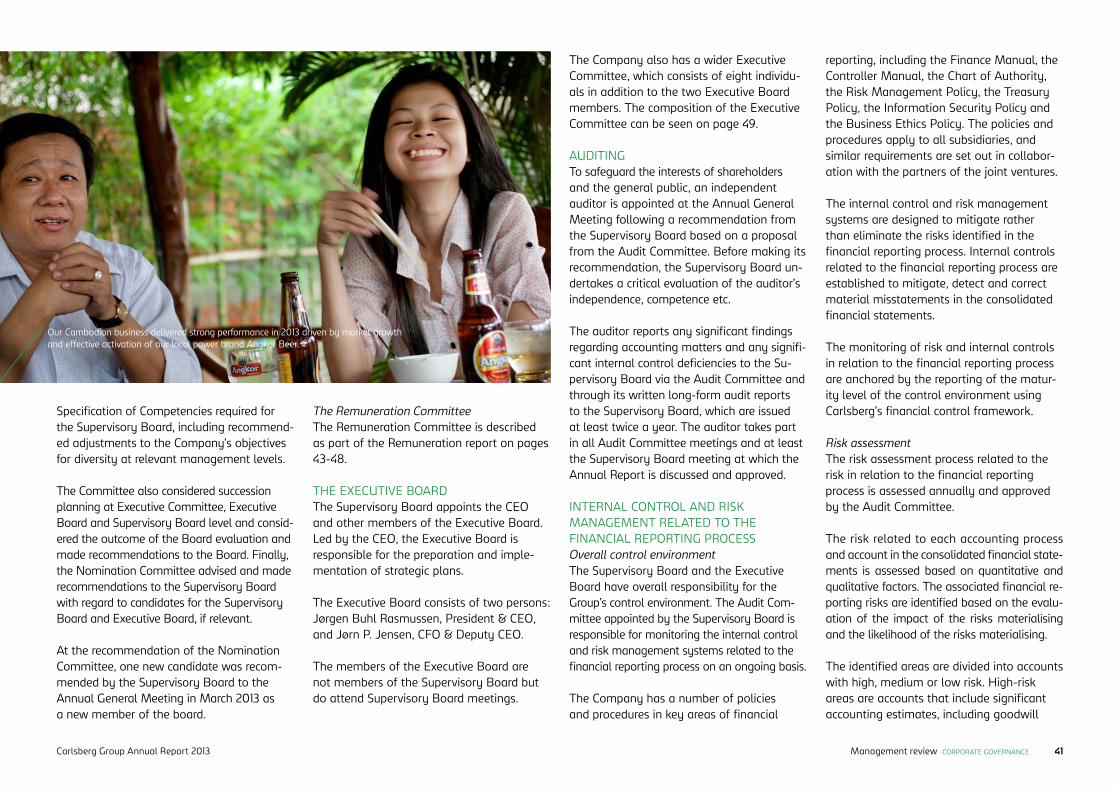
Specification of Competencies required for the Supervisory Board, including recommend-ed adjustments to the Company’s objectives for diversity at relevant management levels.
The Committee also considered succession planning at Executive Committee, Executive Board and Supervisory Board level and consid-ered the outcome of the Board evaluation and made recommendations to the Board. Finally, the Nomination Committee advised and made recommendations to the Supervisory Board with regard to candidates for the Supervisory Board and Executive Board, if relevant.
At the recommendation of the Nomination Committee, one new candidate was recom-mended by the Supervisory Board to the Annual General Meeting in March 2013 as a new member of the board.
The Remuneration CommitteeThe Remuneration Committee is described as part of the Remuneration report on pages 43-48.
THE EXECUTIVE BOARDThe Supervisory Board appoints the CEO and other members of the Executive Board. Led by the CEO, the Executive Board is responsible for the preparation and imple-mentation of strategic plans.
The Executive Board consists of two persons: Jørgen Buhl Rasmussen, President & CEO, and Jørn P. Jensen, CFO & Deputy CEO.
The members of the Executive Board are not members of the Supervisory Board but do attend Supervisory Board meetings.
The Company also has a wider Executive Committee, which consists of eight individu-als in addition to the two Executive Board members. The composition of the Executive Committee can be seen on page 49.
AUDITINGTo safeguard the interests of shareholders and the general public, an independent auditor is appointed at the Annual General Meeting following a recommendation from the Supervisory Board based on a proposal from the Audit Committee. Before making its recommendation, the Supervisory Board un-dertakes a critical evaluation of the auditor’s independence, competence etc.
The auditor reports any significant findings regarding accounting matters and any signifi-cant internal control deficiencies to the Su-pervisory Board via the Audit Committee and through its written long-form audit reports to the Supervisory Board, which are issued at least twice a year. The auditor takes part in all Audit Committee meetings and at least the Supervisory Board meeting at which the Annual Report is discussed and approved.
INTERNAL CONTROL AND RISK MANAGEMENT RELATED TO THE FINANCIAL REPORTING PROCESSOverall control environmentThe Supervisory Board and the Executive Board have overall responsibility for the Group’s control environment. The Audit Com-mittee appointed by the Supervisory Board is responsible for monitoring the internal control and risk management systems related to the financial reporting process on an ongoing basis.
The Company has a number of policies and procedures in key areas of financial
reporting, including the Finance Manual, the Controller Manual, the Chart of Authority, the Risk Management Policy, the Treasury Policy, the Information Security Policy and the Business Ethics Policy. The policies and procedures apply to all subsidiaries, and similar requirements are set out in collabor-ation with the partners of the joint ventures.
The internal control and risk management systems are designed to mitigate rather than eliminate the risks identified in the financial reporting process. Internal controls related to the financial reporting process are established to mitigate, detect and correct material misstatements in the consolidated financial statements.
The monitoring of risk and internal controls in relation to the financial reporting process are anchored by the reporting of the matur-ity level of the control environment using Carlsberg’s financial control framework.
Risk assessmentThe risk assessment process related to the risk in relation to the financial reporting process is assessed annually and approved by the Audit Committee.
The risk related to each accounting process and account in the consolidated financial state-ments is assessed based on quantitative and qualitative factors. The associated financial re-porting risks are identified based on the evalu-ation of the impact of the risks materialising and the likelihood of the risks materialising.
The identified areas are divided into accounts with high, medium or low risk. High-risk areas are accounts that include significant accounting estimates, including goodwill
Our Cambodian business delivered strong performance in 2013 driven by market growth and effective activation of our local power brand Angkor Beer.
Carlsberg Group Annual Report 2013 41Management review CORPORATE GOVERNANCE

and special items, and the sales and pur-chase process. Carlsberg’s financial control framework reporting covers relevant Group companies and functions to the level where high-risk accounts are covered at least 80% and medium-risk accounts at least 60%. Low-risk accounts are not covered.
Control activitiesThe Group has implemented a formalised financial reporting process for the strategy process, budget process, quarterly estimates and monthly reporting on actual performance. The accounting information reported by all Group companies is reviewed both by con-trollers with regional or functional in-depth knowledge of the individual companies/ functions and by technical accounting special-ists. In addition, significant Group companies have controllers with extensive commercial and/or accounting knowledge and insight.
Based on the risk assessment, the Group has established minimum requirements for the conducting and documentation of IT and manual control activities to mitigate identi-fied significant financial reporting risks. Carls-berg’s financial control framework covers 132 controls relating to 23 accounting processes and areas.
The relevant Group companies and functions must ensure that Carlsberg’s financial control framework is implemented in their business and that individual controls are designed to cover the predefined specific risk. The local management is responsible for ensuring that the internal control activities are performed and documented, and is required to report the compliance quarterly to the Group’s finance organisation.
The entities in the Group are dependent on IT systems. Any weaknesses in the system controls or IT environment are compensated for by manual controls in order to mitigate any significant risk relating to the financial reporting. This includes the implementation of compensating controls during the imple-mentation of the supply chain integration and business standardisation project given that an increased number of people will have access to systems. Sweden was the first country to implement the project in the spring of 2013.
Information and communicationThe Group has established information and communication systems to ensure that ac-counting and internal control compliance are established, including a Finance Manual, a Controller Manual and internal control requirements.
Besides this, the Group has implemented a formalised reporting process for reporting monthly, quarterly, budget and estimate figures from all countries and functions.
MonitoringThe Audit Committee’s monitoring covers both the internal control environment and business risk. The monitoring of the internal control environment is covered by Carlsberg’s financial control framework. The business risk is assessed and reviewed at multiple levels in the Group, such as periodic review of control documentation, controller visits and audits performed by Group Internal Audit.
Additionally, business risks are discussed and monitored at business review meetings between the Executive Committee, regional management and local management at which potential financial impacts are identified.
The Audit Committee’s Terms of Reference outline its roles and responsibilities concerning supervision and monitoring of the internal con-trol and risk management systems related to financial reporting. The monitoring is performed on the basis of periodic reporting from the fi-nance organisation, internal and external audit.
GROUP INTERNAL AUDITThe Internal Audit department ensures objective and independent assessment of the adequacy, effectiveness and quality of the Group’s internal controls. The head of Group Internal Audit reports to the Chairman of the Audit Committee. The Audit Committee must approve the appointment and potential dismissal of the head of Group Internal Audit as well as changes to his or her terms. Group Internal Audit works in accordance with a charter and Terms of Reference approved by the Audit Committee.
Group Internal Audit conducts an annual review of business risks. On the basis of this and input from the Supervisory Board, the Audit Committee and senior executives in the Group, an audit plan is drawn up for the year. The plan is reviewed and approved by the Audit Committee and the Supervisory Board. Group Internal Audit is responsible for planning, executing and reporting on the audit performed. The reporting includes observations and conclusions, together with suggestions for improvements to the internal controls in each area audited.
When conducting an audit, Group Internal Audit assesses whether the audited entity/function has well-established accounting practices, written policies and procedures in all important business areas, and adequate internal control procedures. This includes the
assessment of whether controls in relation to key IT systems are satisfactory and whether they comply with the IT Policy.
The Carlsberg Group has a whistleblower system that enables employees to report activities that may involve criminal conduct or violations of the Carlsberg Group’s policies and guidelines.
The whistleblower system consists of a web-site and a hotline set up by an independent third party to ensure the highest level of secu-rity and confidentiality. Reports filed through the whistleblower system are handled by a few specific employees within Group Internal Audit who are charged with the responsibility of evaluating any potential violation. Group Internal Audit regularly, and at least every quarter, reports to the Audit Committee on issues reported via the whistleblower system and action taken as a result thereof. In 2013, 26 reports were made to the system.
Since the establishment of the whistle-blower system in April 2010, some reports and their subsequent investigation have led to various disciplinary sanctions for one or more employees, including dismissals on the basis of violation of Group policies and, in some cases, relevant criminal laws.
Most of these matters related to isolated incidents of fraud carried out by individual employees in the Group. The incidents have not had any material impact on the financial results of the Group or the Group company in question.
Carlsberg Group Annual Report 2013 42Management review CORPORATE GOVERNANCE
We want our executives to share our shareholders’ long-term interests, and the remuneration of the executive directors should support this alignment.
Carlsberg established the Remuneration Committee in late 2010. In 2012, we under-took a complete review of the remuneration policy and structure for executive directors, which resulted in several changes to the Remuneration Policy. These changes were approved by the shareholders at the Annual General Meeting in March 2013. Our princi-pal aim was to ensure that the Company’s executives share our shareholders’ long-term performance and value perspective, and that their remuneration aligns these interests.
During 2013, the Committee oversaw the implementation of the new policy.
Our continuing policy is to provide a good balance between the drivers of performance and alignment with shareholders. Our new policy does this by tilting the balance of executive remuneration towards the
long term and requiring executives to build up a significant shareholding in the Com-pany by retaining shares that they earn.
In light of the changes made in 2013, the Committee has continued to monitor the new arrangements but does not anticipate further changes in 2014.
OUR APPROACH TO REMUNERATION
Carlsberg’s remuneration is designed to enable us to recruit and retain individuals with the expertise and ability required to run a growing international company, and to do so in a way that drives our business success and rewards executives when shareholders are rewarded.
Levels of fixed remuneration are set based on individuals’ experience and contribution, and in the context of the external market. While we do not seek to adhere rigidly to market benchmarks, we monitor and take into account pay levels and incentive opportunities in the principal markets from which we recruit: our European brewing and spirits peers and the global consumer goods sector as well as companies across industry sectors in the Nordic region.
Many of our investors – including our main shareholder – are long-term holders of our shares. We want our executives to share their perspective and believe that remuneration should align their interests accordingly. Recent developments in our remuneration have sought to strengthen this link by tilting the balance of the package to long-term share-based pay and requiring that any shares awarded be retained for longer.
The Company’s full Remuneration Policy for the Supervisory Board and Executive Board and guidelines for incentive pro-grammes as approved at the Annual General Meeting on 21 March 2013 are available on the Company’s website.
MAIN ACTIVITIES IN 2013During 2013, the main activities of the Remuneration Committee were:
• Considering the achievement of per-formance criteria for the annual bonus plan and approving levels of vesting.
• Determining levels of long-term incen-tive awards for 2013.
• Considering shareholders’ feedback from the 2013 Annual General Meeting.
• Reviewing fixed salary levels, bonus targets and levels of long-term incentive awards for 2014.
• Evaluating the remuneration of the Supervisory Board.
• Reviewing the Remuneration Com- mittee’s Terms of Reference and its effectiveness.
2014 OBJECTIVES• Ensuring that senior executives remain
appropriately compensated and incen-tivised to deliver on our strategy.
• Monitoring the workings and outcomes of the changes made in 2013 to the remuneration structure, which has been extended to all senior management.
Carlsberg Group Annual Report 2013 43Management review REMUNERATION REPORT
THE COMMITTEE’S RESPONSIBILITIES
Carlsberg’s Remuneration Committee was established by the Supervisory Board in late 2010.
The Committee is responsible for the Remuneration Policy (including the general guidelines for incentive programmes) for all members of the Supervisory Board and the Executive Board, for recommending proposals on changes to the Remuneration Policy, and for obtaining the approval of the Supervisory Board prior to seeking shareholders’ approval at the Annual General Meeting.
The Committee is responsible for making proposals to the Supervisory Board on the actual structure and content of the remuneration pack-ages (in accordance with the policy approved by the shareholders) of the members of the Supervisory Board and the Executive Board.
The Committee monitors and advises the Super visory Board on any major changes to the policy on senior em-ployee remuneration structures for the Group, including for the Executive Com-mittee. The Committee’s Terms of Refer-ence, which govern how it operates, are approved by the Supervisory Board and are available on the Company’s website.
ATTENDANCE AT COMMITTEE MEETINGS AND ADVISERS
The CEO, Deputy CEO, Senior Vice Presi-dent HR and Vice President Compensa-tion & Benefits are invited to attend meetings of the Committee where ap-propriate but are not present when their own remuneration is discussed directly.
In 2013, the Remuneration Committee held four meetings. At three meetings all the members participated, while at one meeting one member was absent.
New Bridge Street, an Aon Hewitt company, is the Committee’s external adviser. No other services are provided to the Group by Aon Hewitt, and the Committee is satisfied as to the inde-pendence of its advisers.
REMUNERATION POLICYThe main elements of the executive directors’ remuneration arrangements are summarised in the table below and are explained in more detail in the sub-sequent paragraphs.
Fixed salaryThe Committee reviews fixed salaries an-nually, taking into account a number of relevant factors, including the individual’s performance, role and responsibilities.
The Committee also takes into account levels of remuneration for similar roles at comparable companies in both the drinks and fast moving consumer goods sectors as well as companies across industry sectors based in the Nordic region.
Annual bonusThe annual bonus is structured to incentiv-ise the executive directors to deliver on the Group’s short-term strategic objectives.
For 2014, the potential maximum bonus will remain at 100% of fixed salary with 60% of fixed salary payable for on-target perform-ance. A scorecard of performance measures is used to assess performance.
The determination of the final bonus is sub-ject to the discretion of the Committee and the Supervisory Board, taking into account the overall performance of the business.
The measures used in the scorecard for the 2014 annual bonus are operating profit, free cash flow, net profit and growth in market share; these are the same measures that were applied for 2013.
Long-term incentive arrangementsAward levels and types of awardThe long-term incentive arrangements for the executive directors currently comprise two types of award:• Share options, which vest after three years
subject to continued employment. • Performance shares, which vest over three
years subject to the performance condition.
The maximum combined value of awards that can be made in any one financial year is 200% of fixed salary (calculated in accord-ance with International Financial Reporting Standards (IFRS) at the date of grant).
This level was increased in 2013 (100% prior to 2013), and whilst the Committee has not granted at this level to date and does not intend to grant at the maximum level in the near future, it wishes to have the flexibility to do so if it deems higher awards to be appropriate in future years.
Each year, the Committee determines the total level of long-term incentive award to be made to each executive director and how much of that award will be made using per-formance shares and how much using share options. All long-term incentive awards are made at the discretion of the Committee.
COMMITTEE MEMBERS1
Richard Burrows (Chairman)Jess SøderbergFlemming BesenbacherKees van der GraafElisabeth Fleuriot
1 Richard Burrows, Jess Søderberg, Kees van der Graaf and Elisabeth Fleuriot are independent of the Company as defined in the recommen-dations of the Danish Committee on Corporate Governance.
Carlsberg Group Annual Report 2013 44Management review REMUNERATION REPORT
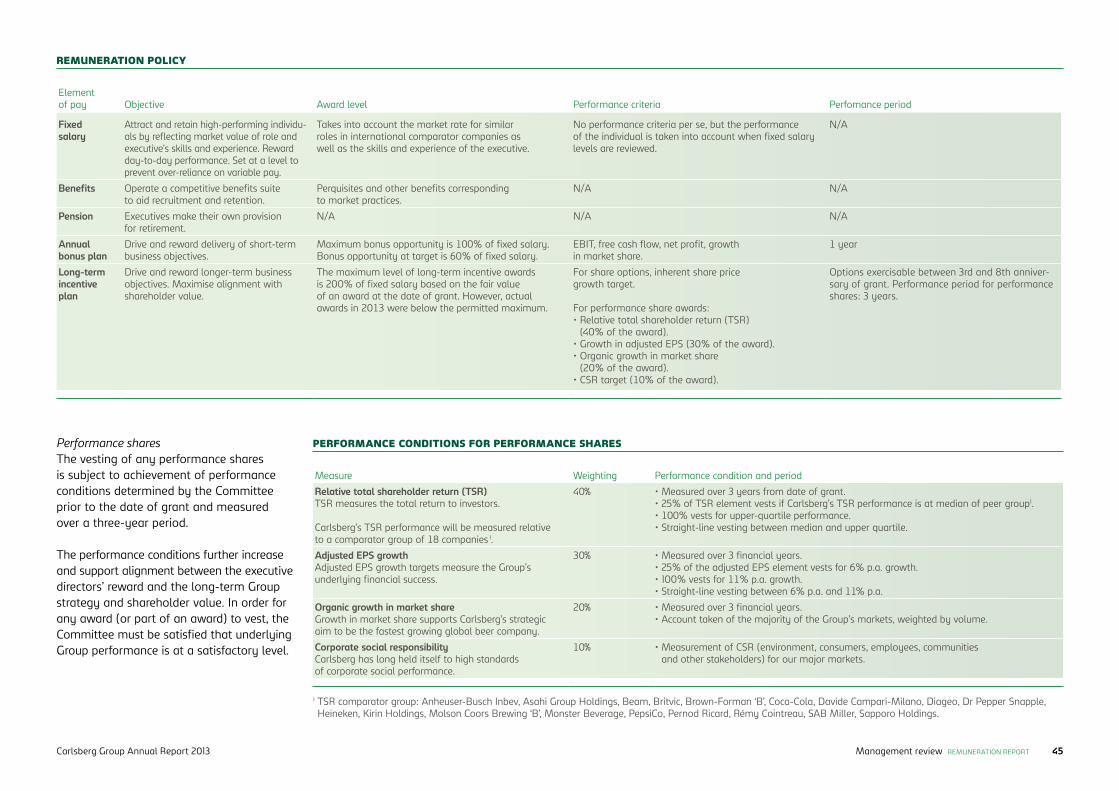
Element of pay Objective Award level Performance criteria Perfomance period
Fixed salary
Attract and retain high-performing individu-als by reflecting market value of role and executive’s skills and experience. Reward day-to-day performance. Set at a level to prevent over-reliance on variable pay.
Takes into account the market rate for similar roles in international comparator companies as well as the skills and experience of the executive.
No performance criteria per se, but the performance of the individual is taken into account when fixed salary levels are reviewed.
N/A
Benefits Operate a competitive benefits suite to aid recruitment and retention.
Perquisites and other benefits corresponding to market practices.
N/A N/A
Pension Executives make their own provision for retirement.
N/A N/A N/A
Annual bonus plan
Drive and reward delivery of short-term business objectives.
Maximum bonus opportunity is 100% of fixed salary. Bonus opportunity at target is 60% of fixed salary.
EBIT, free cash flow, net profit, growth in market share.
1 year
Long-term incentive plan
Drive and reward longer-term business objectives. Maximise alignment with shareholder value.
The maximum level of long-term incentive awards is 200% of fixed salary based on the fair value of an award at the date of grant. However, actual awards in 2013 were below the permitted maximum.
For share options, inherent share price growth target. For performance share awards:• Relative total shareholder return (TSR)
(40% of the award).• Growth in adjusted EPS (30% of the award).• Organic growth in market share
(20% of the award).• CSR target (10% of the award).
Options exercisable between 3rd and 8th anniver-sary of grant. Performance period for performance shares: 3 years.
REMUNERATION POLICY
Performance shares The vesting of any performance shares is subject to achievement of performance conditions determined by the Committee prior to the date of grant and measured over a three-year period.
The performance conditions further increase and support alignment between the executive directors’ reward and the long-term Group strategy and shareholder value. In order for any award (or part of an award) to vest, the Committee must be satisfied that underlying Group performance is at a satisfactory level.
Measure Weighting Performance condition and period
Relative total shareholder return (TSR)TSR measures the total return to investors.
Carlsberg’s TSR performance will be measured relative to a comparator group of 18 companies 1.
40% • Measured over 3 years from date of grant. • 25% of TSR element vests if Carlsberg’s TSR performance is at median of peer group1.• 100% vests for upper-quartile performance. • Straight-line vesting between median and upper quartile.
Adjusted EPS growthAdjusted EPS growth targets measure the Group’s underlying financial success.
30% • Measured over 3 financial years.• 25% of the adjusted EPS element vests for 6% p.a. growth. • 100% vests for 11% p.a. growth.• Straight-line vesting between 6% p.a. and 11% p.a.
Organic growth in market share Growth in market share supports Carlsberg’s strategic aim to be the fastest growing global beer company.
20% • Measured over 3 financial years.• Account taken of the majority of the Group’s markets, weighted by volume.
Corporate social responsibility Carlsberg has long held itself to high standards of corporate social performance.
10% • Measurement of CSR (environment, consumers, employees, communities and other stakeholders) for our major markets.
1 TSR comparator group: Anheuser-Busch Inbev, Asahi Group Holdings, Beam, Britvic, Brown-Forman ‘B’, Coca-Cola, Davide Campari-Milano, Diageo, Dr Pepper Snapple, Heineken, Kirin Holdings, Molson Coors Brewing ‘B’, Monster Beverage, PepsiCo, Pernod Ricard, Rémy Cointreau, SAB Miller, Sapporo Holdings.
PERFORMANCE CONDITIONS FOR PERFORMANCE SHARES
Carlsberg Group Annual Report 2013 45Management review REMUNERATION REPORT
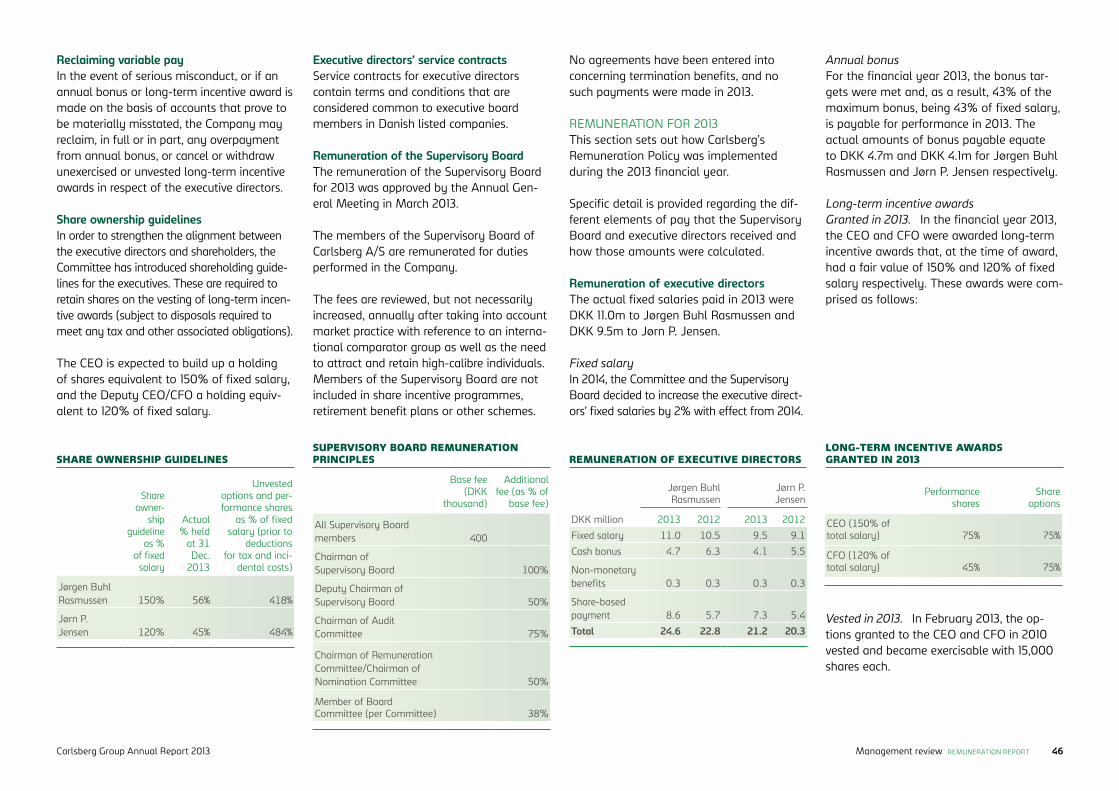
Reclaiming variable payIn the event of serious misconduct, or if an annual bonus or long-term incentive award is made on the basis of accounts that prove to be materially misstated, the Company may reclaim, in full or in part, any overpayment from annual bonus, or cancel or withdraw unexercised or unvested long-term incentive awards in respect of the executive directors.
Share ownership guidelinesIn order to strengthen the alignment between the executive directors and shareholders, the Committee has introduced shareholding guide-lines for the executives. These are required to retain shares on the vesting of long-term incen-tive awards (subject to disposals required to meet any tax and other associated obligations).
The CEO is expected to build up a holding of shares equivalent to 150% of fixed salary, and the Deputy CEO/CFO a holding equiv-alent to 120% of fixed salary.
Executive directors’ service contractsService contracts for executive directors contain terms and conditions that are considered common to executive board members in Danish listed companies.
Remuneration of the Supervisory BoardThe remuneration of the Supervisory Board for 2013 was approved by the Annual Gen-eral Meeting in March 2013.
The members of the Supervisory Board of Carlsberg A/S are remunerated for duties performed in the Company.
The fees are reviewed, but not necessarily increased, annually after taking into account market practice with reference to an interna-tional comparator group as well as the need to attract and retain high-calibre individuals. Members of the Supervisory Board are not included in share incentive programmes, retirement benefit plans or other schemes.
SUPERVISORY BOARD REMUNERATION PRINCIPLES
Base fee (DKK
thousand)
Additional fee (as % of
base fee)
All Supervisory Board members 400
Chairman of Supervisory Board 100%
Deputy Chairman of Supervisory Board 50%
Chairman of Audit Committee 75%
Chairman of Remuneration Committee/Chairman of Nomination Committee 50%
Member of Board Committee (per Committee) 38%
SHARE OWNERSHIP GUIDELINES
Share owner-
ship guideline
as % of fixed
salary
Actual % held
at 31 Dec.
2013
Unvested options and per-formance shares
as % of fixed salary (prior to
deductions for tax and inci-
dental costs)
Jørgen Buhl Rasmussen 150% 56% 418%
Jørn P. Jensen 120% 45% 484%
No agreements have been entered into concerning termination benefits, and no such payments were made in 2013.
REMUNERATION FOR 2013This section sets out how Carlsberg’s Remuneration Policy was implemented during the 2013 financial year.
Specific detail is provided regarding the dif-ferent elements of pay that the Supervisory Board and executive directors received and how those amounts were calculated.
Remuneration of executive directors The actual fixed salaries paid in 2013 were DKK 11.0m to Jørgen Buhl Rasmussen and DKK 9.5m to Jørn P. Jensen.
Fixed salaryIn 2014, the Committee and the Supervisory Board decided to increase the executive direct-ors’ fixed salaries by 2% with effect from 2014.
Jørgen Buhl Rasmussen
Jørn P. Jensen
DKK million 2013 2012 2013 2012
Fixed salary 11.0 10.5 9.5 9.1
Cash bonus 4.7 6.3 4.1 5.5
Non-monetary benefits 0.3 0.3 0.3 0.3
Share-based payment 8.6 5.7 7.3 5.4
Total 24.6 22.8 21.2 20.3
REMUNERATION OF EXECUTIVE DIRECTORS
Annual bonusFor the financial year 2013, the bonus tar-gets were met and, as a result, 43% of the maximum bonus, being 43% of fixed salary, is payable for performance in 2013. The actual amounts of bonus payable equate to DKK 4.7m and DKK 4.1m for Jørgen Buhl Rasmussen and Jørn P. Jensen respectively.
Long-term incentive awards Granted in 2013. In the financial year 2013, the CEO and CFO were awarded long-term incentive awards that, at the time of award, had a fair value of 150% and 120% of fixed salary respectively. These awards were com-prised as follows:
Vested in 2013. In February 2013, the op-tions granted to the CEO and CFO in 2010 vested and became exercisable with 15,000 shares each.
Performance shares
Share options
CEO (150% of total salary) 75% 75%
CFO (120% of total salary) 45% 75%
LONG-TERM INCENTIVE AWARDS GRANTED IN 2013
Carlsberg Group Annual Report 2013 46Management review REMUNERATION REPORT
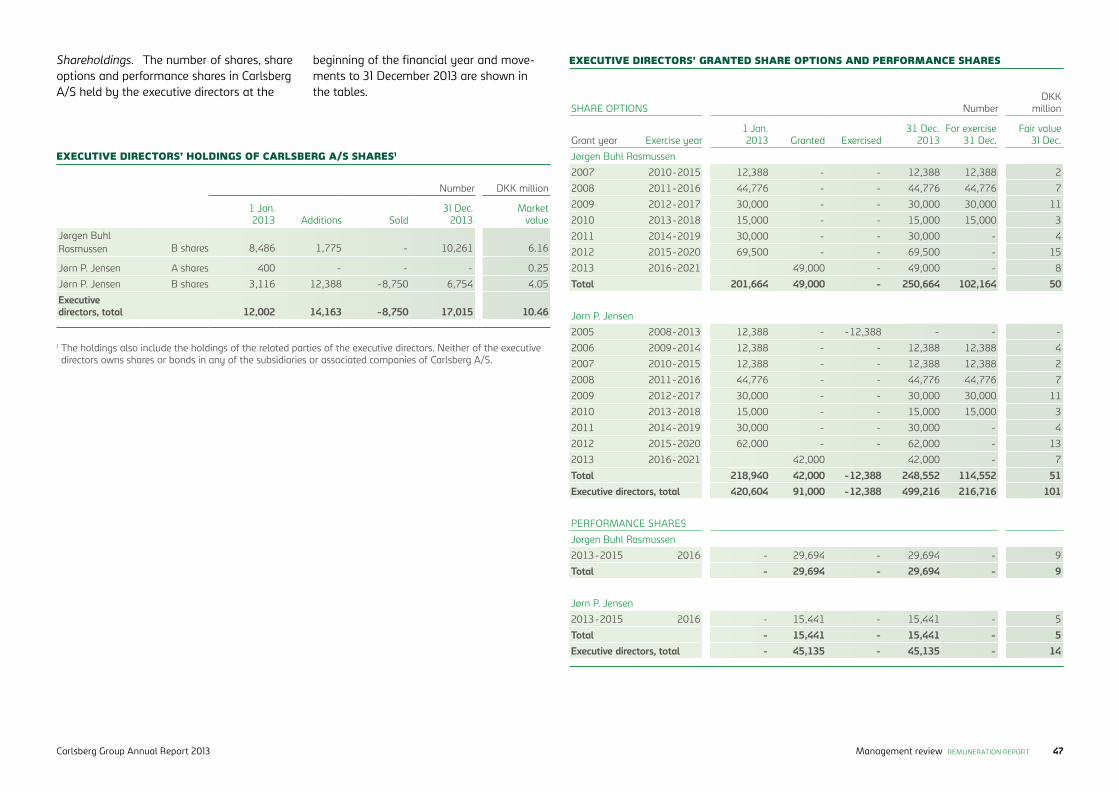
Shareholdings. The number of shares, share options and performance shares in Carlsberg A/S held by the executive directors at the
EXECUTIVE DIRECTORS’ HOLDINGS OF CARLSBERG A/S SHARES1
Number DKK million
1 Jan. 2013 Additions Sold
31 Dec. 2013
Market value
Jørgen Buhl Rasmussen B shares 8,486 1,775 - 10,261 6.16
Jørn P. Jensen A shares 400 - - - 0.25
Jørn P. Jensen B shares 3,116 12,388 -8,750 6,754 4.05
Executive directors, total 12,002 14,163 -8,750 17,015 10.46
1 The holdings also include the holdings of the related parties of the executive directors. Neither of the executive directors owns shares or bonds in any of the subsidiaries or associated companies of Carlsberg A/S.
SHARE OPTIONS NumberDKK
million
Grant year Exercise year1 Jan. 2013 Granted Exercised
31 Dec. 2013
For exercise 31 Dec.
Fair value31 Dec.
Jørgen Buhl Rasmussen
2007 2010-2015 12,388 - - 12,388 12,388 2
2008 2011-2016 44,776 - - 44,776 44,776 7
2009 2012-2017 30,000 - - 30,000 30,000 11
2010 2013-2018 15,000 - - 15,000 15,000 3
2011 2014-2019 30,000 - - 30,000 - 4
2012 2015-2020 69,500 - - 69,500 - 15
2013 2016-2021 49,000 - 49,000 - 8
Total 201,664 49,000 - 250,664 102,164 50
Jørn P. Jensen
2005 2008-2013 12,388 - -12,388 - - -
2006 2009-2014 12,388 - - 12,388 12,388 4
2007 2010-2015 12,388 - - 12,388 12,388 2
2008 2011-2016 44,776 - - 44,776 44,776 7
2009 2012-2017 30,000 - - 30,000 30,000 11
2010 2013-2018 15,000 - - 15,000 15,000 3
2011 2014-2019 30,000 - - 30,000 - 4
2012 2015-2020 62,000 - - 62,000 - 13
2013 2016-2021 42,000 42,000 - 7
Total 218,940 42,000 -12,388 248,552 114,552 51Executive directors, total 420,604 91,000 -12,388 499,216 216,716 101
PERFORMANCE SHARES
Jørgen Buhl Rasmussen
2013-2015 2016 - 29,694 - 29,694 - 9
Total - 29,694 - 29,694 - 9
Jørn P. Jensen
2013-2015 2016 - 15,441 - 15,441 - 5
Total - 15,441 - 15,441 - 5Executive directors, total - 45,135 - 45,135 - 14
EXECUTIVE DIRECTORS’ GRANTED SHARE OPTIONS AND PERFORMANCE SHARESbeginning of the financial year and move-ments to 31 December 2013 are shown in the tables.
Carlsberg Group Annual Report 2013 47Management review REMUNERATION REPORT
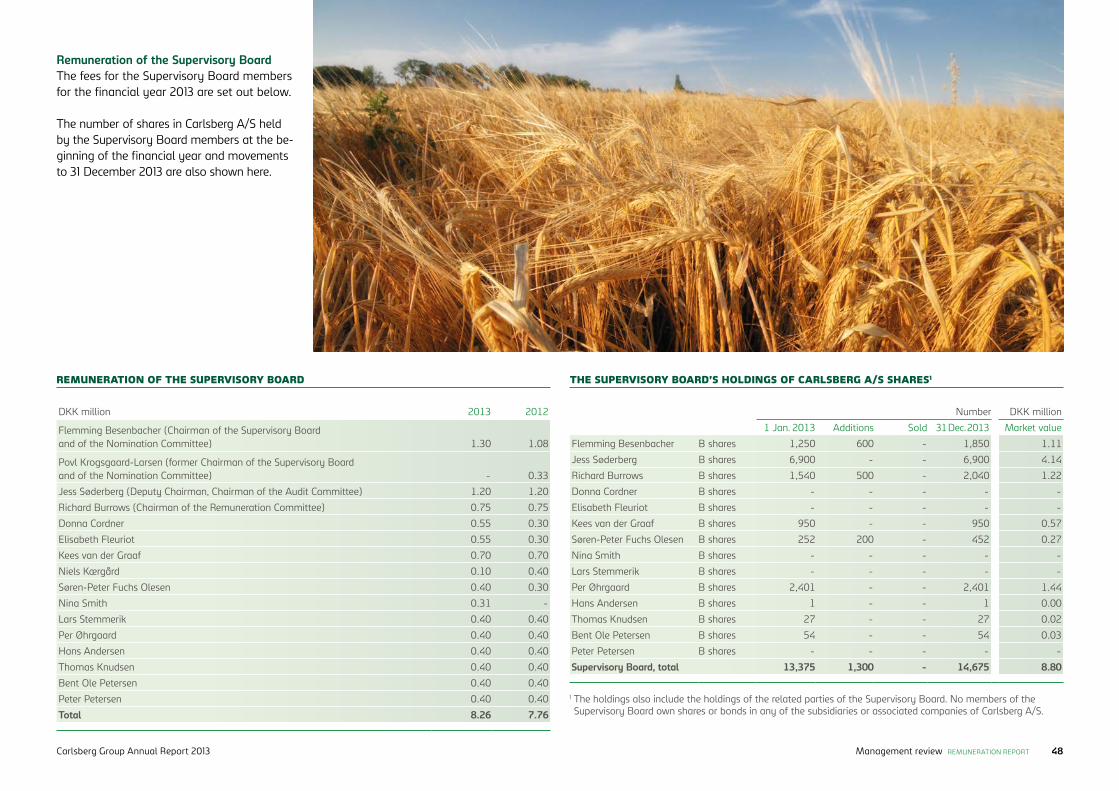
DKK million 2013 2012
Flemming Besenbacher (Chairman of the Supervisory Board and of the Nomination Committee) 1.30 1.08
Povl Krogsgaard-Larsen (former Chairman of the Supervisory Board and of the Nomination Committee) - 0.33
Jess Søderberg (Deputy Chairman, Chairman of the Audit Committee) 1.20 1.20
Richard Burrows (Chairman of the Remuneration Committee) 0.75 0.75
Donna Cordner 0.55 0.30
Elisabeth Fleuriot 0.55 0.30
Kees van der Graaf 0.70 0.70
Niels Kærgård 0.10 0.40
Søren-Peter Fuchs Olesen 0.40 0.30
Nina Smith 0.31 -
Lars Stemmerik 0.40 0.40
Per Øhrgaard 0.40 0.40
Hans Andersen 0.40 0.40
Thomas Knudsen 0.40 0.40
Bent Ole Petersen 0.40 0.40
Peter Petersen 0.40 0.40
Total 8.26 7.76
REMUNERATION OF THE SUPERVISORY BOARD
Number DKK million
1 Jan. 2013 Additions Sold 31 Dec. 2013 Market value
Flemming Besenbacher B shares 1,250 600 - 1,850 1.11
Jess Søderberg B shares 6,900 - - 6,900 4.14
Richard Burrows B shares 1,540 500 - 2,040 1.22
Donna Cordner B shares - - - - -
Elisabeth Fleuriot B shares - - - - -
Kees van der Graaf B shares 950 - - 950 0.57
Søren-Peter Fuchs Olesen B shares 252 200 - 452 0.27
Nina Smith B shares - - - - -
Lars Stemmerik B shares - - - - -
Per Øhrgaard B shares 2,401 - - 2,401 1.44
Hans Andersen B shares 1 - - 1 0.00
Thomas Knudsen B shares 27 - - 27 0.02
Bent Ole Petersen B shares 54 - - 54 0.03
Peter Petersen B shares - - - - -
Supervisory Board, total 13,375 1,300 - 14,675 8.80
THE SUPERVISORY BOARD’S HOLDINGS OF CARLSBERG A/S SHARES1
Remuneration of the Supervisory Board The fees for the Supervisory Board members for the financial year 2013 are set out below.
The number of shares in Carlsberg A/S held by the Supervisory Board members at the be-ginning of the financial year and movements to 31 December 2013 are also shown here.
1 The holdings also include the holdings of the related parties of the Supervisory Board. No members of the Supervisory Board own shares or bonds in any of the subsidiaries or associated companies of Carlsberg A/S.
Carlsberg Group Annual Report 2013 48Management review REMUNERATION REPORT
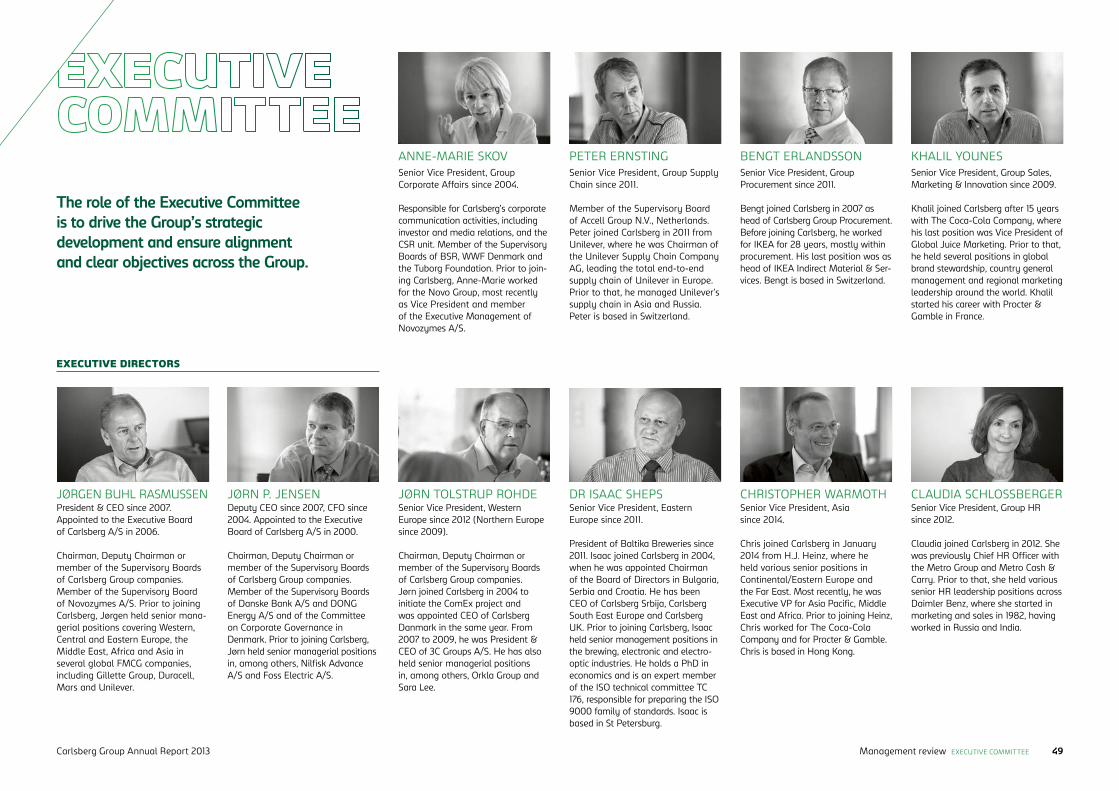
The role of the Executive Committee is to drive the Group’s strategic development and ensure alignment and clear objectives across the Group.
JØRN P. JENSENDeputy CEO since 2007, CFO since 2004. Appointed to the Executive Board of Carlsberg A/S in 2000.
Chairman, Deputy Chairman or member of the Supervisory Boards of Carlsberg Group companies. Member of the Supervisory Boards of Danske Bank A/S and DONG Energy A/S and of the Committee on Corporate Governance in Denmark. Prior to joining Carlsberg, Jørn held senior managerial positions in, among others, Nilfisk Advance A/S and Foss Electric A/S.
JØRGEN BUHL RASMUSSENPresident & CEO since 2007. Appointed to the Executive Board of Carlsberg A/S in 2006.
Chairman, Deputy Chairman or member of the Supervisory Boards of Carlsberg Group companies. Member of the Supervisory Board of Novozymes A/S. Prior to joining Carlsberg, Jørgen held senior mana-gerial positions covering Western, Central and Eastern Europe, the Middle East, Africa and Asia in several global FMCG companies, including Gillette Group, Duracell, Mars and Unilever.
JØRN TOLSTRUP ROHDESenior Vice President, Western Europe since 2012 (Northern Europe since 2009).
Chairman, Deputy Chairman or member of the Supervisory Boards of Carlsberg Group companies.Jørn joined Carlsberg in 2004 to initiate the ComEx project and was appointed CEO of Carlsberg Danmark in the same year. From 2007 to 2009, he was President & CEO of 3C Groups A/S. He has also held senior managerial positions in, among others, Orkla Group and Sara Lee.
CHRISTOPHER WARMOTHSenior Vice President, Asia since 2014.
Chris joined Carlsberg in January 2014 from H.J. Heinz, where he held various senior positions in Continental/Eastern Europe and the Far East. Most recently, he was Executive VP for Asia Pacific, Middle East and Africa. Prior to joining Heinz, Chris worked for The Coca-Cola Company and for Procter & Gamble. Chris is based in Hong Kong.
CLAUDIA SCHLOSSBERGERSenior Vice President, Group HR since 2012.
Claudia joined Carlsberg in 2012. She was previously Chief HR Officer with the Metro Group and Metro Cash & Carry. Prior to that, she held various senior HR leadership positions across Daimler Benz, where she started in marketing and sales in 1982, having worked in Russia and India.
KHALIL YOUNESSenior Vice President, Group Sales, Marketing & Innovation since 2009.
Khalil joined Carlsberg after 15 years with The Coca-Cola Company, where his last position was Vice President of Global Juice Marketing. Prior to that, he held several positions in global brand stewardship, country general management and regional marketing leadership around the world. Khalil started his career with Procter & Gamble in France.
BENGT ERLANDSSONSenior Vice President, Group Procurement since 2011.
Bengt joined Carlsberg in 2007 as head of Carlsberg Group Procurement. Before joining Carlsberg, he worked for IKEA for 28 years, mostly within procurement. His last position was as head of IKEA Indirect Material & Ser-vices. Bengt is based in Switzerland.
DR ISAAC SHEPSSenior Vice President, Eastern Europe since 2011.
President of Baltika Breweries since 2011. Isaac joined Carlsberg in 2004, when he was appointed Chairman of the Board of Directors in Bulgaria, Serbia and Croatia. He has been CEO of Carlsberg Srbija, Carlsberg South East Europe and Carlsberg UK. Prior to joining Carlsberg, Isaac held senior management positions in the brewing, electronic and electro-optic industries. He holds a PhD in economics and is an expert member of the ISO technical committee TC 176, responsible for preparing the ISO 9000 family of standards. Isaac is based in St Petersburg.
ANNE-MARIE SKOVSenior Vice President, Group Corporate Affairs since 2004.
Responsible for Carlsberg’s corporate communication activities, including investor and media relations, and the CSR unit. Member of the Supervisory Boards of BSR, WWF Denmark and the Tuborg Foundation. Prior to join-ing Carlsberg, Anne-Marie worked for the Novo Group, most recently as Vice President and member of the Executive Management of Novozymes A/S.
PETER ERNSTINGSenior Vice President, Group Supply Chain since 2011.
Member of the Supervisory Board of Accell Group N.V., Netherlands. Peter joined Carlsberg in 2011 from Unilever, where he was Chairman of the Unilever Supply Chain Company AG, leading the total end-to-end supply chain of Unilever in Europe. Prior to that, he managed Unilever’s supply chain in Asia and Russia. Peter is based in Switzerland.
EXECUTIVE DIRECTORS
Carlsberg Group Annual Report 2013 49Management review EXECUTIVE COMMITTEE
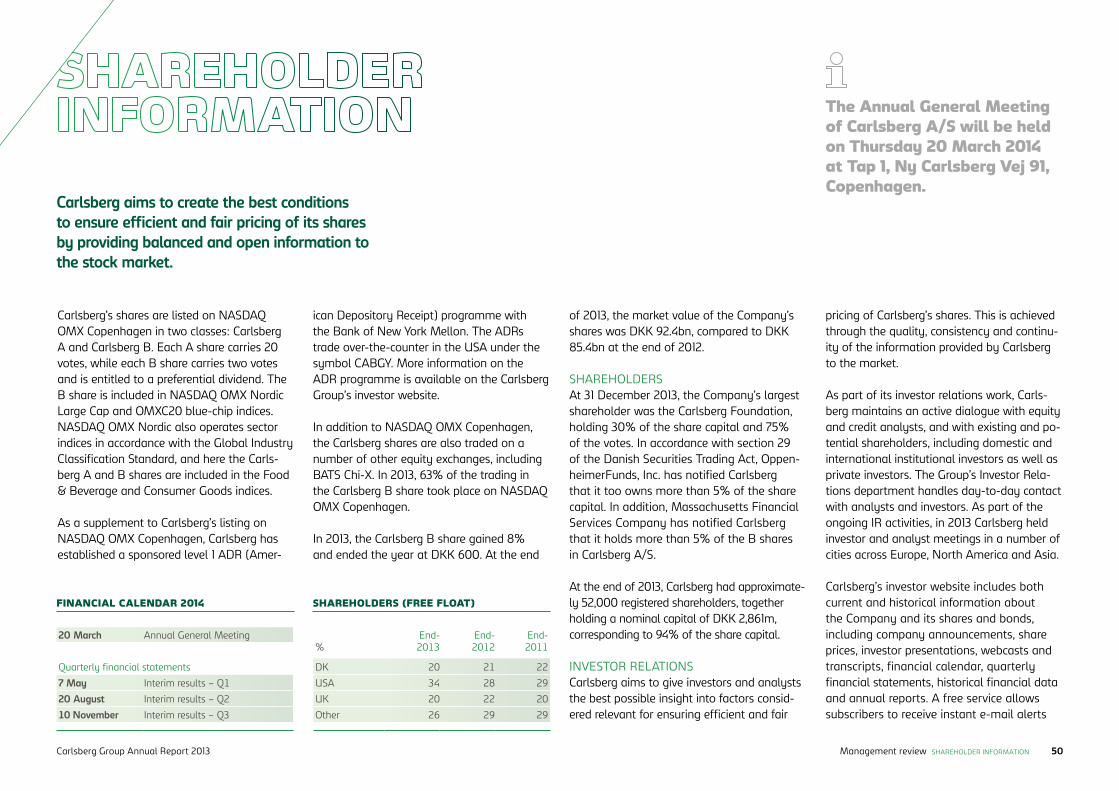
of 2013, the market value of the Company’s shares was DKK 92.4bn, compared to DKK 85.4bn at the end of 2012.
SHAREHOLDERSAt 31 December 2013, the Company’s largest shareholder was the Carlsberg Foundation, holding 30% of the share capital and 75% of the votes. In accordance with section 29of the Danish Securities Trading Act, Oppen-heimerFunds, Inc. has notified Carlsbergthat it too owns more than 5% of the sharecapital. In addition, Massachusetts Financial Services Company has notified Carlsberg that it holds more than 5% of the B shares in Carlsberg A/S.
At the end of 2013, Carlsberg had approximate-ly 52,000 registered shareholders, together holding a nominal capital of DKK 2,861m, corresponding to 94% of the share capital.
INVESTOR RELATIONSCarlsberg aims to give investors and analysts the best possible insight into factors consid-ered relevant for ensuring efficient and fair
ican Depository Receipt) programme with the Bank of New York Mellon. The ADRs trade over-the-counter in the USA under the symbol CABGY. More information on the ADR programme is available on the Carlsberg Group’s investor website.
In addition to NASDAQ OMX Copenhagen, the Carlsberg shares are also traded on a number of other equity exchanges, including BATS Chi-X. In 2013, 63% of the trading in the Carlsberg B share took place on NASDAQ OMX Copenhagen.
In 2013, the Carlsberg B share gained 8% and ended the year at DKK 600. At the end
Carlsberg’s shares are listed on NASDAQ OMX Copenhagen in two classes: Carlsberg A and Carlsberg B. Each A share carries 20 votes, while each B share carries two votes and is entitled to a preferential dividend. The B share is included in NASDAQ OMX Nordic Large Cap and OMXC20 blue-chip indices. NASDAQ OMX Nordic also operates sector indices in accordance with the Global Industry Classification Standard, and here the Carls-berg A and B shares are included in the Food & Beverage and Consumer Goods indices.
As a supplement to Carlsberg’s listing on NASDAQ OMX Copenhagen, Carlsberg has established a sponsored level 1 ADR (Amer-
pricing of Carlsberg’s shares. This is achieved through the quality, consistency and continu-ity of the information provided by Carlsberg to the market.
As part of its investor relations work, Carls-berg maintains an active dialogue with equity and credit analysts, and with existing and po-tential shareholders, including domestic and international institutional investors as well as private investors. The Group’s Investor Rela-tions department handles day-to-day contact with analysts and investors. As part of the ongoing IR activities, in 2013 Carlsberg held investor and analyst meetings in a number of cities across Europe, North America and Asia.
Carlsberg’s investor website includes both current and historical information about the Company and its shares and bonds, including company announcements, share prices, investor presentations, webcasts and transcripts, financial calendar, quarterly financial statements, historical financial data and annual reports. A free service allows subscribers to receive instant e-mail alerts
Carlsberg aims to create the best conditions to ensure efficient and fair pricing of its shares by providing balanced and open information to the stock market.
The Annual General Meeting of Carlsberg A/S will be held on Thursday 20 March 2014 at Tap 1, Ny Carlsberg Vej 91, Copenhagen.
FINANCIAL CALENDAR 2014 SHAREHOLDERS (FREE FLOAT)
%End- 2013
End- 2012
End- 2011
DK 20 21 22
USA 34 28 29
UK 20 22 20
Other 26 29 29
20 March Annual General Meeting
Quarterly financial statements
7 May Interim results – Q1
20 August Interim results – Q2
10 November Interim results – Q3
Carlsberg Group Annual Report 2013 50Management review SHAREHOLDER INFORMATION
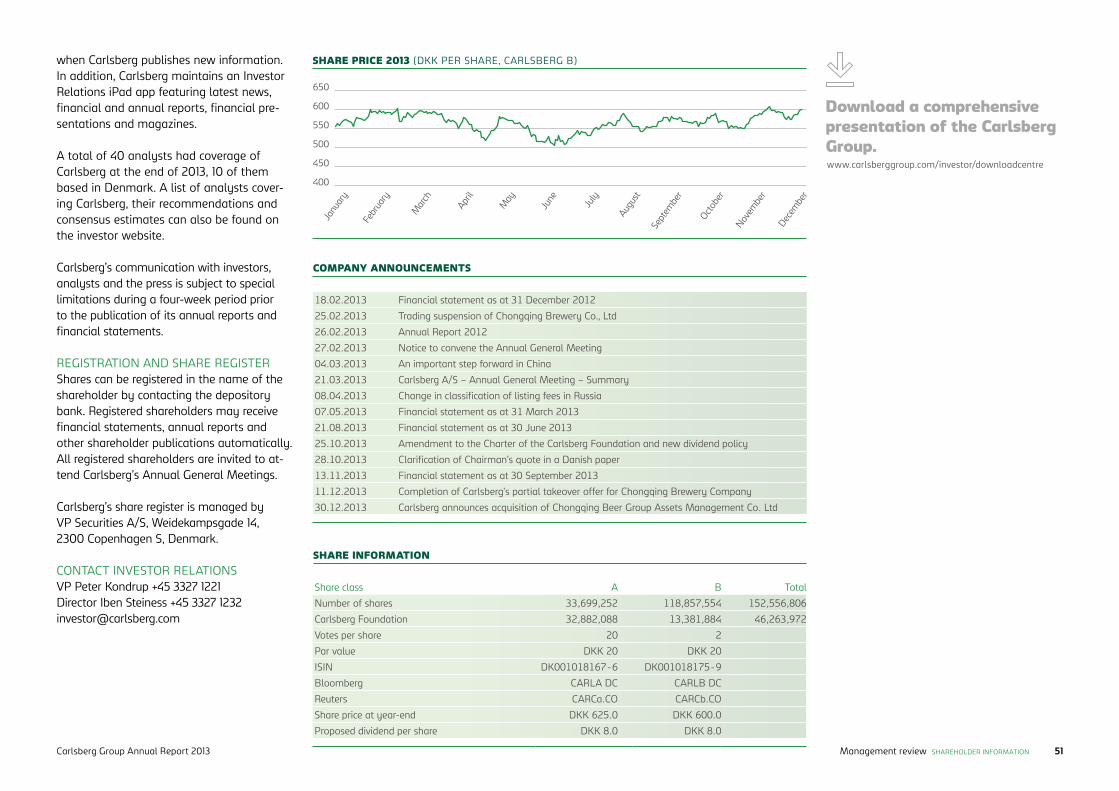
when Carlsberg publishes new information. In addition, Carlsberg maintains an Investor Relations iPad app featuring latest news, financial and annual reports, financial pre-sentations and magazines.
A total of 40 analysts had coverage of Carlsberg at the end of 2013, 10 of them based in Denmark. A list of analysts cover-ing Carlsberg, their recommendations and consensus estimates can also be found on the investor website.
Carlsberg’s communication with investors, analysts and the press is subject to special limitations during a four-week period prior to the publication of its annual reports and financial statements.
REGISTRATION AND SHARE REGISTERShares can be registered in the name of the shareholder by contacting the depository bank. Registered shareholders may receive financial statements, annual reports and other shareholder publications automatically. All registered shareholders are invited to at-tend Carlsberg’s Annual General Meetings.
Carlsberg’s share register is managed byVP Securities A/S, Weidekampsgade 14,2300 Copenhagen S, Denmark.
CONTACT INVESTOR RELATIONSVP Peter Kondrup +45 3327 1221Director Iben Steiness +45 3327 [email protected]
18.02.2013 Financial statement as at 31 December 2012
25.02.2013 Trading suspension of Chongqing Brewery Co., Ltd
26.02.2013 Annual Report 2012
27.02.2013 Notice to convene the Annual General Meeting
04.03.2013 An important step forward in China
21.03.2013 Carlsberg A/S – Annual General Meeting – Summary
08.04.2013 Change in classification of listing fees in Russia
07.05.2013 Financial statement as at 31 March 2013
21.08.2013 Financial statement as at 30 June 2013
25.10.2013 Amendment to the Charter of the Carlsberg Foundation and new dividend policy
28.10.2013 Clarification of Chairman’s quote in a Danish paper
13.11.2013 Financial statement as at 30 September 2013
11.12.2013 Completion of Carlsberg’s partial takeover offer for Chongqing Brewery Company
30.12.2013 Carlsberg announces acquisition of Chongqing Beer Group Assets Management Co. Ltd
COMPANY ANNOUNCEMENTS
Share class A B Total
Number of shares 33,699,252 118,857,554 152,556,806
Carlsberg Foundation 32,882,088 13,381,884 46,263,972
Votes per share 20 2
Par value DKK 20 DKK 20
ISIN DK001018167-6 DK001018175-9
Bloomberg CARLA DC CARLB DC
Reuters CARCa.CO CARCb.CO
Share price at year-end DKK 625.0 DKK 600.0
Proposed dividend per share DKK 8.0 DKK 8.0
SHARE INFORMATION
Download a comprehensive presentation of the Carlsberg Group. www.carlsberggroup.com/investor/downloadcentre
650
600
550
500
450
400
Janu
ary
Octobe
r
April
July
Novem
ber
Decem
ber
Febr
uary
Mar
ch
May
June
Augu
st
Sept
embe
r
SHARE PRICE 2013 (DKK PER SHARE, CARLSBERG B)
Carlsberg Group Annual Report 2013 51Management review SHAREHOLDER INFORMATION
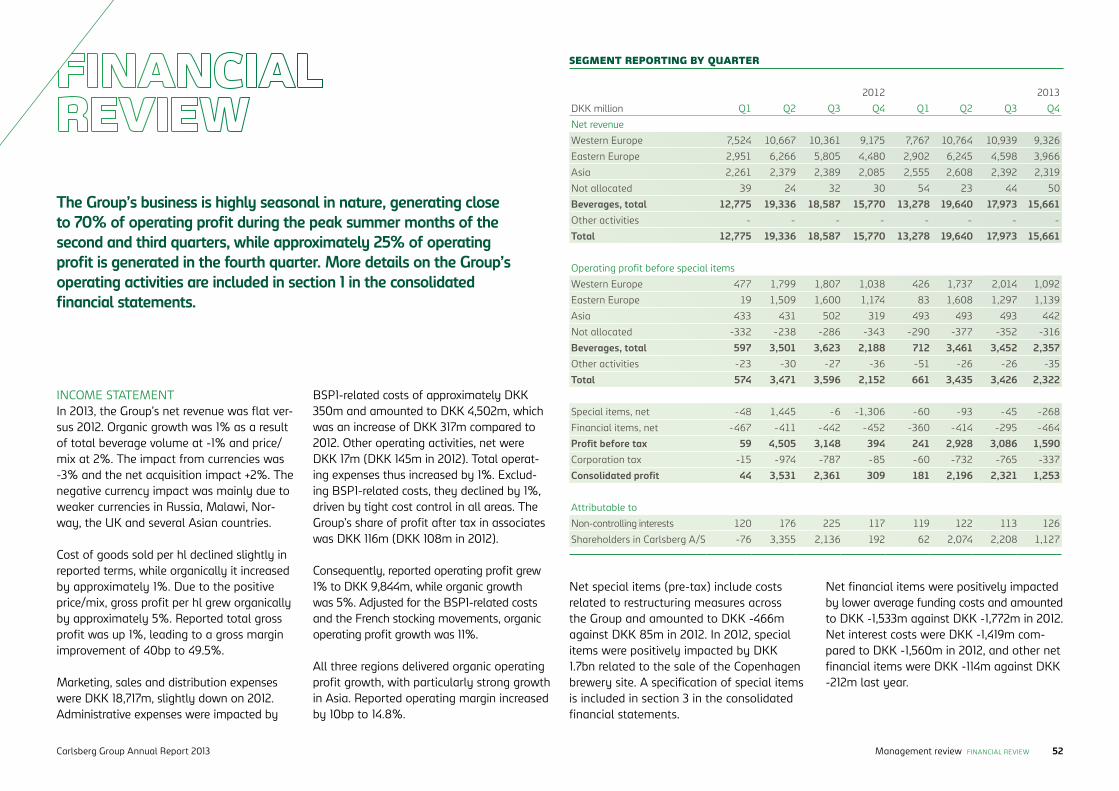
INCOME STATEMENTIn 2013, the Group’s net revenue was flat ver-sus 2012. Organic growth was 1% as a result of total beverage volume at -1% and price/mix at 2%. The impact from currencies was -3% and the net acquisition impact +2%. The negative currency impact was mainly due to weaker currencies in Russia, Malawi, Nor-way, the UK and several Asian countries.
Cost of goods sold per hl declined slightly in reported terms, while organically it increased by approximately 1%. Due to the positive price/mix, gross profit per hl grew organically by approximately 5%. Reported total gross profit was up 1%, leading to a gross margin improvement of 40bp to 49.5%.
Marketing, sales and distribution expenses were DKK 18,717m, slightly down on 2012. Administrative expenses were impacted by
BSP1-related costs of approximately DKK 350m and amounted to DKK 4,502m, which was an increase of DKK 317m compared to 2012. Other operating activities, net were DKK 17m (DKK 145m in 2012). Total operat-ing expenses thus increased by 1%. Exclud-ing BSP1-related costs, they declined by 1%, driven by tight cost control in all areas. The Group’s share of profit after tax in associates was DKK 116m (DKK 108m in 2012).
Consequently, reported operating profit grew 1% to DKK 9,844m, while organic growth was 5%. Adjusted for the BSP1-related costs and the French stocking movements, organic operating profit growth was 11%. All three regions delivered organic operating profit growth, with particularly strong growth in Asia. Reported operating margin increased by 10bp to 14.8%.
The Group’s business is highly seasonal in nature, generating close to 70% of operating profit during the peak summer months of the second and third quarters, while approximately 25% of operating profit is generated in the fourth quarter. More details on the Group’s operating activities are included in section 1 in the consolidated financial statements.
2012 2013
DKK million Q1 Q2 Q3 Q4 Q1 Q2 Q3 Q4
Net revenue
Western Europe 7,524 10,667 10,361 9,175 7,767 10,764 10,939 9,326
Eastern Europe 2,951 6,266 5,805 4,480 2,902 6,245 4,598 3,966
Asia 2,261 2,379 2,389 2,085 2,555 2,608 2,392 2,319
Not allocated 39 24 32 30 54 23 44 50
Beverages, total 12,775 19,336 18,587 15,770 13,278 19,640 17,973 15,661Other activities - - - - - - - -
Total 12,775 19,336 18,587 15,770 13,278 19,640 17,973 15,661
Operating profit before special items
Western Europe 477 1,799 1,807 1,038 426 1,737 2,014 1,092
Eastern Europe 19 1,509 1,600 1,174 83 1,608 1,297 1,139
Asia 433 431 502 319 493 493 493 442
Not allocated -332 -238 -286 -343 -290 -377 -352 -316
Beverages, total 597 3,501 3,623 2,188 712 3,461 3,452 2,357Other activities -23 -30 -27 -36 -51 -26 -26 -35
Total 574 3,471 3,596 2,152 661 3,435 3,426 2,322
Special items, net -48 1,445 -6 -1,306 -60 -93 -45 -268
Financial items, net -467 -411 -442 -452 -360 -414 -295 -464
Profit before tax 59 4,505 3,148 394 241 2,928 3,086 1,590Corporation tax -15 -974 -787 -85 -60 -732 -765 -337
Consolidated profit 44 3,531 2,361 309 181 2,196 2,321 1,253
Attributable to
Non-controlling interests 120 176 225 117 119 122 113 126
Shareholders in Carlsberg A/S -76 3,355 2,136 192 62 2,074 2,208 1,127
SEGMENT REPORTING BY QUARTER
Net special items (pre-tax) include costs related to restructuring measures across the Group and amounted to DKK -466m against DKK 85m in 2012. In 2012, special items were positively impacted by DKK 1.7bn related to the sale of the Copenhagen brewery site. A specification of special items is included in section 3 in the consolidated financial statements.
Net financial items were positively impacted by lower average funding costs and amounted to DKK -1,533m against DKK -1,772m in 2012. Net interest costs were DKK -1,419m com-pared to DKK -1,560m in 2012, and other net financial items were DKK -114m against DKK -212m last year.
Carlsberg Group Annual Report 2013 52Management review FINANCIAL REVIEW
Current and historical quarterly financial data are available in Excel.www.carlsberggroup.com/investor/financials
Tax totalled DKK -1,894m against DKK -1,861m in 2012. The tax rate was 24.1%.
Non-controlling interests were DKK 480m, a decrease of DKK 158m versus 2012 (DKK 638m) due to the exclusion of non-control-ling interests in Baltika Breweries following the buyout of minority shareholders in 2012. Carlsberg’s share of net profit was DKK 5,471m. Adjusted net profit (adjusted for special items after tax) was DKK 5,795m compared to DKK 5,504m in 2012.
STATEMENT OF FINANCIAL POSITIONAt 31 December 2013, Carlsberg had total assets of DKK 151.1bn against DKK 154.0bn at 31 December 2012.
AssetsIntangible assets were DKK 91.9bn (DKK 91.2bn at 31 December 2012). The increase of DKK 0.7bn was mainly due to acquisition of entities offset by foreign exchange adjust-ments, primarily related to Russia.
Property, plant and equipment increased to DKK 33.5bn against DKK 32.0bn at 31 De-
cember 2012, primarily impacted by higher CapEx and net foreign exchange adjust-ments, primarily related to Russia.
Financial assets declined by DKK 4.0bn to DKK 5.6bn due to the change in the accounting for Chongqing Brewery Group (now fully consolidated).
Inventories and receivables amounted to DKK 12.7bn (DKK 12.4bn in 2012). The change was driven by the acquisition of Chongqing Brewery Group.
Other receivables etc. totalled DKK 3.8bn against DKK 3.0bn at 31 December 2012. The change was mainly due to prepayments in relation to the acquisition of Chongqing Beer Group Assets Management (approval of transaction pending) and prepayments in connection with sponsorships.
Cash decreased from DKK 5.8bn at 31 De-cember 2012 to DKK 3.7bn at 31 December 2013, mainly due to acquisitions, CapEx and paid dividends.
LiabilitiesEquity decreased to DKK 71.5bn compared to DKK 73.7bn at 31 December 2012. DKK 67.8bn was attributed to shareholders in Carlsberg A/S and DKK 3.7bn to non- controlling interests.
The change in equity of DKK -2.2bn was mainly due to profit for the period of DKK +6.0bn; foreign exchange losses of DKK -7.5bn; payment of dividends to shareholders of DKK -1.3bn; acquisition of non-controlling interests (mainly in Laos) of DKK -0.6bn; retirement benefit obligations of DKK +0.8bn; and acquisition of entities of DKK +0.5bn
related to the acquisition of Chongqing Brewery Group.
Liabilities decreased to DKK 79.6bn com-pared to DKK 80.3bn at 31 December 2012. The decrease was due to lower deferred tax liabilities and retirement benefit obligations partly offset by higher trade payables.
The increase in current borrowings to DKK 9.5bn from DKK 3.4bn was due to a EUR bond of 1bn maturing in May 2014 and has consequently been moved from non-current to current borrowings.
CASH FLOW Operating profit before depreciation and amortisation was DKK 13,833m (DKK 13,812m in 2012).
The change in trade working capital was DKK 627m (DKK 852m in 2012). Other work-ing capital was DKK -884m (DKK -523m in 2012), impacted negatively primarily by an extraordinary increase in prepayments and a decrease in debt to public authorities. The main part of the development was of a one-off nature. Average trade working capital to net revenue continued to decline and was 0.2% at the end of the year versus 1.0% at the end of 2012.
Paid net interest etc. amounted to DKK -2,122m (DKK -1,996m in 2012). The slight increase versus 2012 was due to phasing into 2013 of coupon payments related to the bond issues in 2012.
In all, cash flow from operating activities was DKK 9,083m (DKK 9,871m in 2012), impacted by net working capital and higher paid restructuring costs versus 2012.
Cash flow from investing activities amounted to DKK -8,883m against DKK -3,974m in 2012.
Total operational investments were DKK 6.1bn (DKK 5.1bn in 2012) and primarily included capacity expansion in Poland and Asia, greenfield breweries in Asia, invest-ments related to network optimisation in Western Europe and sales investments.
Financial investments were impacted by the acquisition of 30.29% of the shares in Chongqing Brewery Company at the end of 2013 and prepayments related to the acquisi-tion of Chongqing Beer Group Assets Man-agement at the end of 2013. In 2012, cash flow from investing activities was positively impacted by the proceeds from the sale of the Copenhagen brewery site of DKK 1.9bn.
Free cash flow was DKK 200m against DKK 5,897m in 2012.
FINANCING At 31 December 2013, gross interest-bearing debt amounted to DKK 40.4bn and net interest-bearing debt amounted to DKK 35.0bn. The difference of DKK 5.4bn was other interest-bearing assets, including DKK 3.7bn in cash and cash equivalents.
Of the gross interest-bearing debt, 76% (DKK 30.7bn) was long-term, i.e. with maturity more than one year from 31 December 2013. The net interest-bearing debt consisted pri-marily of facilities in EUR and approximately 60% was at fixed interest (fixed-interest period exceeding one year).
Carlsberg Group Annual Report 2013 53Management review FINANCIAL REVIEW
Financial statements 55 Income statement 55 Statement of comprehensive income 56 Statement of financial position 57 Statement of changes in equity 59 Statement of cash flows 60 Notes140 Parent Company160 Reports
60SECTION 1 OPERATING ACTIVITIES
61 1.1 Business developments
62 1.2 Revenue and segmentation of operations64 1.3 Operating expenses, inventory
and deposit liability
67 1.4 Foreign exchange risk related to earnings
68 1.5 Cash flow from operating activities
69 1.6 Trade receivables and on-trade loans
72 SECTION 2 ASSET BASE AND RETURNS
73 2.1 Return on invested capital
74 2.2 Segmentation of assets
75 2.3 Impairment
80 2.4 Intangible assets and property, plant and equipment
85SECTION 3 SPECIAL ITEMS AND PROVISIONS
85 3.1 Special items
87 3.2 Provisions
88 3.3 Contingent liabilities
89SECTION 4 FINANCING COSTS, CAPITAL STRUCTURE AND EQUITY
90 4.1 Financial income and expenses
91 4.2 Net interest-bearing debt
92 4.3 Capital structure
94 4.4 Borrowings and cash
95 4.5 Foreign exchange risk related to net investments and financing activities
98 4.6 Interest rate risk
100 4.7 Liquidity risk
102 4.8 Financial instruments
104 4.9 Determination of fair value
105SECTION 5 ACQUISITIONS AND ASSOCIATES
105 5.1 Acquisition of subsidiaries
109 5.2 Impact from acquisitions
109 5.3 Cash flow effect from acquisitions
110 5.4 Non-controlling interests
111 5.5 Associates
112 5.6 Investments in proportionately consolidated entities
113 SECTION 6 TAX
113 6.1 Corporation tax
115 6.2 Deferred tax
117SECTION 7 STAFF COSTS AND REMUNERATION
117 7.1 Staff costs
118 7.2 Remuneration
119 7.3 Share-based payment
124 7.4 Retirement benefit obligations and similar obligations
127SECTION 8 OTHER DISCLOSURE REQUIREMENTS
127 8.1 Earnings per share
128 8.2 Related party disclosures
129 8.3 Fees to auditors
129 8.4 Events after the reporting period
130 SECTION 9 BASIS FOR PREPARATION
130 9.1 Significant accounting estimates
131 9.2 General accounting policies
136 9.3 New legislation
138 SECTION 10 GROUP COMPANIES
Carlsberg Group Annual Report 2013 54Consolidated financial statements CONTENTS
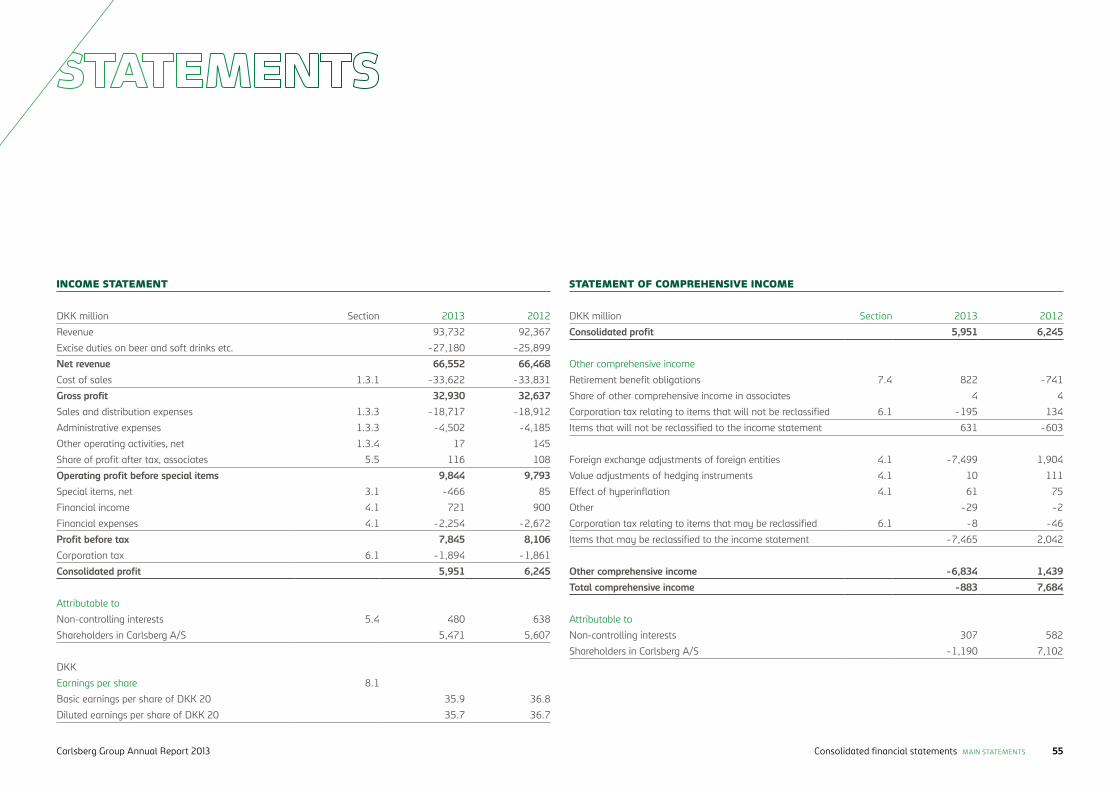
DKK million Section 2013 2012
Revenue 93,732 92,367
Excise duties on beer and soft drinks etc. -27,180 -25,899
Net revenue 66,552 66,468Cost of sales 1.3.1 -33,622 -33,831
Gross profit 32,930 32,637Sales and distribution expenses 1.3.3 -18,717 -18,912
Administrative expenses 1.3.3 -4,502 -4,185
Other operating activities, net 1.3.4 17 145
Share of profit after tax, associates 5.5 116 108
Operating profit before special items 9,844 9,793Special items, net 3.1 -466 85
Financial income 4.1 721 900
Financial expenses 4.1 -2,254 -2,672
Profit before tax 7,845 8,106Corporation tax 6.1 -1,894 -1,861
Consolidated profit 5,951 6,245
Attributable to
Non-controlling interests 5.4 480 638
Shareholders in Carlsberg A/S 5,471 5,607
DKK
Earnings per share 8.1
Basic earnings per share of DKK 20 35.9 36.8
Diluted earnings per share of DKK 20 35.7 36.7
INCOME STATEMENT
DKK million Section 2013 2012
Consolidated profit 5,951 6,245
Other comprehensive income
Retirement benefit obligations 7.4 822 -741
Share of other comprehensive income in associates 4 4
Corporation tax relating to items that will not be reclassified 6.1 -195 134
Items that will not be reclassified to the income statement 631 -603
Foreign exchange adjustments of foreign entities 4.1 -7,499 1,904
Value adjustments of hedging instruments 4.1 10 111
Effect of hyperinflation 4.1 61 75
Other -29 -2
Corporation tax relating to items that may be reclassified 6.1 -8 -46
Items that may be reclassified to the income statement -7,465 2,042
Other comprehensive income -6,834 1,439Total comprehensive income -883 7,684
Attributable to
Non-controlling interests 307 582
Shareholders in Carlsberg A/S -1,190 7,102
STATEMENT OF COMPREHENSIVE INCOME
Consolidated financial statements MAIN STATEMENTS 55Carlsberg Group Annual Report 2013
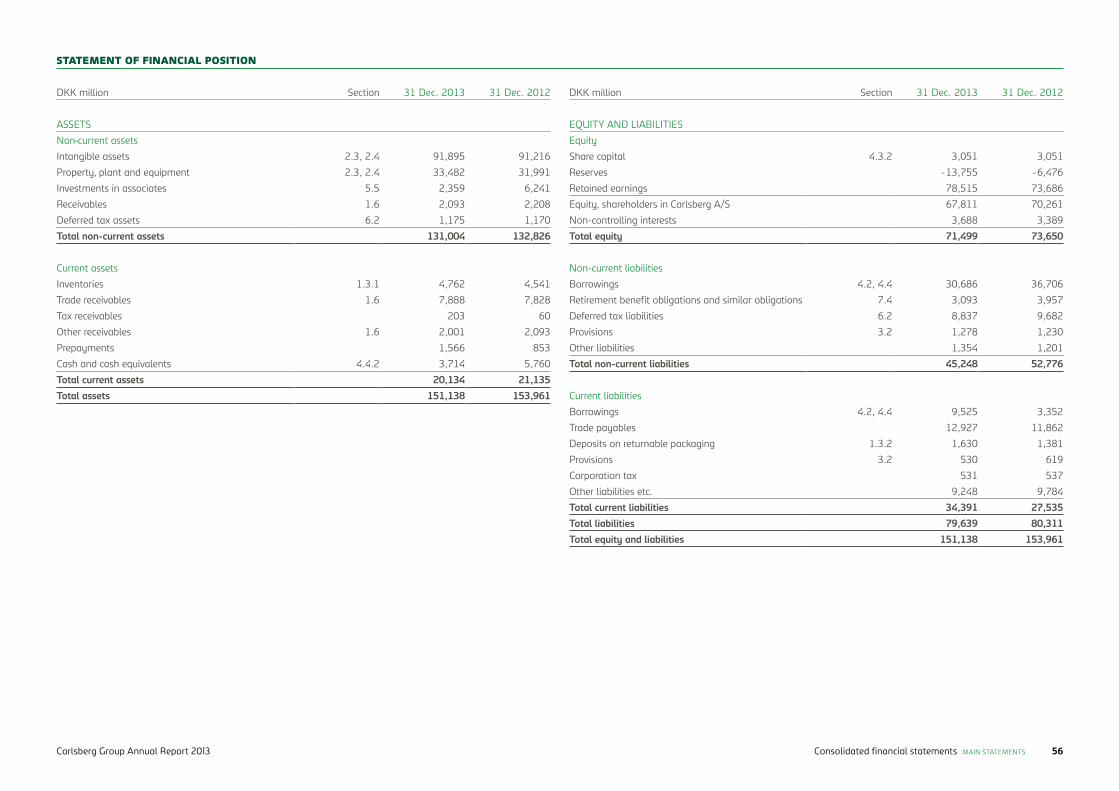
DKK million Section 31 Dec. 2013 31 Dec. 2012
ASSETS
Non-current assets
Intangible assets 2.3, 2.4 91,895 91,216
Property, plant and equipment 2.3, 2.4 33,482 31,991
Investments in associates 5.5 2,359 6,241
Receivables 1.6 2,093 2,208
Deferred tax assets 6.2 1,175 1,170
Total non-current assets 131,004 132,826
Current assets
Inventories 1.3.1 4,762 4,541
Trade receivables 1.6 7,888 7,828
Tax receivables 203 60
Other receivables 1.6 2,001 2,093
Prepayments 1,566 853
Cash and cash equivalents 4.4.2 3,714 5,760
Total current assets 20,134 21,135Total assets 151,138 153,961
DKK million Section 31 Dec. 2013 31 Dec. 2012
EQUITY AND LIABILITIES
Equity
Share capital 4.3.2 3,051 3,051
Reserves -13,755 -6,476
Retained earnings 78,515 73,686
Equity, shareholders in Carlsberg A/S 67,811 70,261
Non-controlling interests 3,688 3,389
Total equity 71,499 73,650
Non-current liabilities
Borrowings 4.2, 4.4 30,686 36,706
Retirement benefit obligations and similar obligations 7.4 3,093 3,957
Deferred tax liabilities 6.2 8,837 9,682
Provisions 3.2 1,278 1,230
Other liabilities 1,354 1,201
Total non-current liabilities 45,248 52,776
Current liabilities
Borrowings 4.2, 4.4 9,525 3,352
Trade payables 12,927 11,862
Deposits on returnable packaging 1.3.2 1,630 1,381
Provisions 3.2 530 619
Corporation tax 531 537
Other liabilities etc. 9,248 9,784
Total current liabilities 34,391 27,535Total liabilities 79,639 80,311Total equity and liabilities 151,138 153,961
STATEMENT OF FINANCIAL POSITION
Consolidated financial statements MAIN STATEMENTS 56Carlsberg Group Annual Report 2013
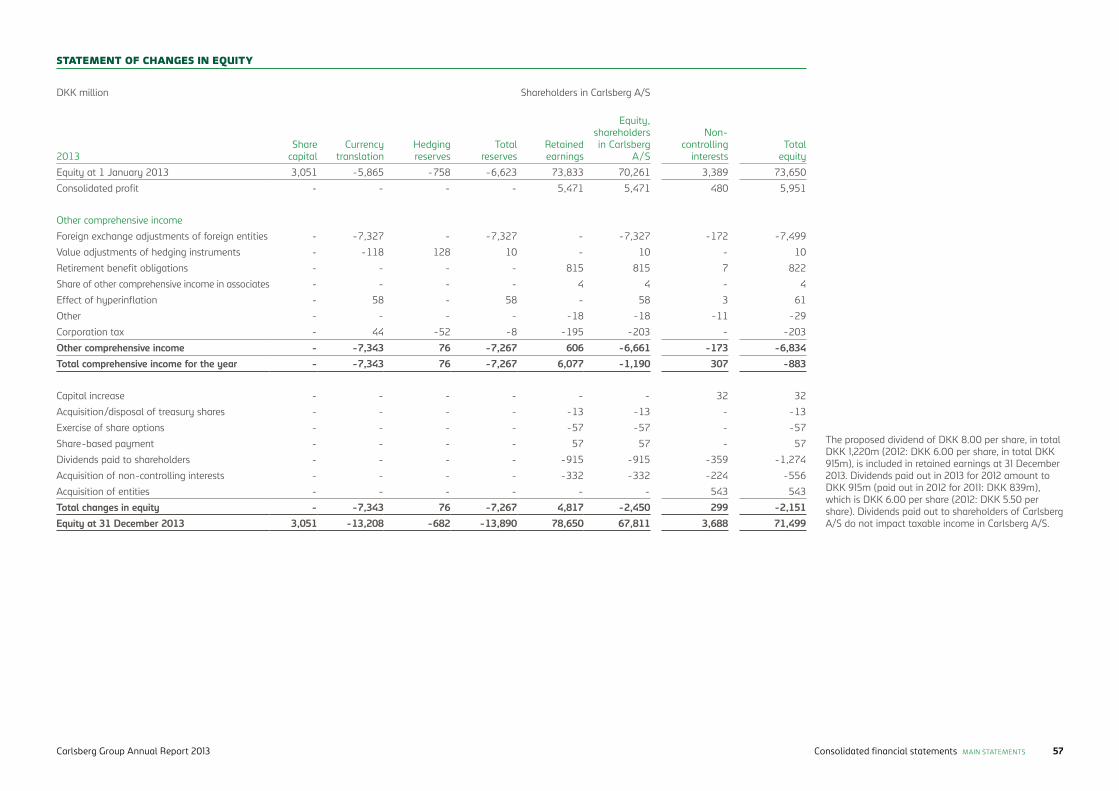
DKK million Shareholders in Carlsberg A/S
2013Share
capitalCurrency
translationHedgingreserves
Totalreserves
Retainedearnings
Equity,shareholders in Carlsberg
A/S
Non- controlling
interestsTotal
equity
Equity at 1 January 2013 3,051 -5,865 -758 -6,623 73,833 70,261 3,389 73,650
Consolidated profit - - - - 5,471 5,471 480 5,951
Other comprehensive income
Foreign exchange adjustments of foreign entities - -7,327 - -7,327 - -7,327 -172 -7,499
Value adjustments of hedging instruments - -118 128 10 - 10 - 10
Retirement benefit obligations - - - - 815 815 7 822
Share of other comprehensive income in associates - - - - 4 4 - 4
Effect of hyperinflation - 58 - 58 - 58 3 61
Other - - - - -18 -18 -11 -29
Corporation tax - 44 -52 -8 -195 -203 - -203
Other comprehensive income - -7,343 76 -7,267 606 -6,661 -173 -6,834Total comprehensive income for the year - -7,343 76 -7,267 6,077 -1,190 307 -883
Capital increase - - - - - - 32 32
Acquisition/disposal of treasury shares - - - - -13 -13 - -13
Exercise of share options - - - - -57 -57 - -57
Share-based payment - - - - 57 57 - 57
Dividends paid to shareholders - - - - -915 -915 -359 -1,274
Acquisition of non-controlling interests - - - - -332 -332 -224 -556
Acquisition of entities - - - - - - 543 543
Total changes in equity - -7,343 76 -7,267 4,817 -2,450 299 -2,151Equity at 31 December 2013 3,051 -13,208 -682 -13,890 78,650 67,811 3,688 71,499
STATEMENT OF CHANGES IN EQUITY
The proposed dividend of DKK 8.00 per share, in total DKK 1,220m (2012: DKK 6.00 per share, in total DKK 915m), is included in retained earnings at 31 December 2013. Dividends paid out in 2013 for 2012 amount to DKK 915m (paid out in 2012 for 2011: DKK 839m), which is DKK 6.00 per share (2012: DKK 5.50 per share). Dividends paid out to shareholders of Carlsberg A/S do not impact taxable income in Carlsberg A/S.
Consolidated financial statements MAIN STATEMENTS 57Carlsberg Group Annual Report 2013
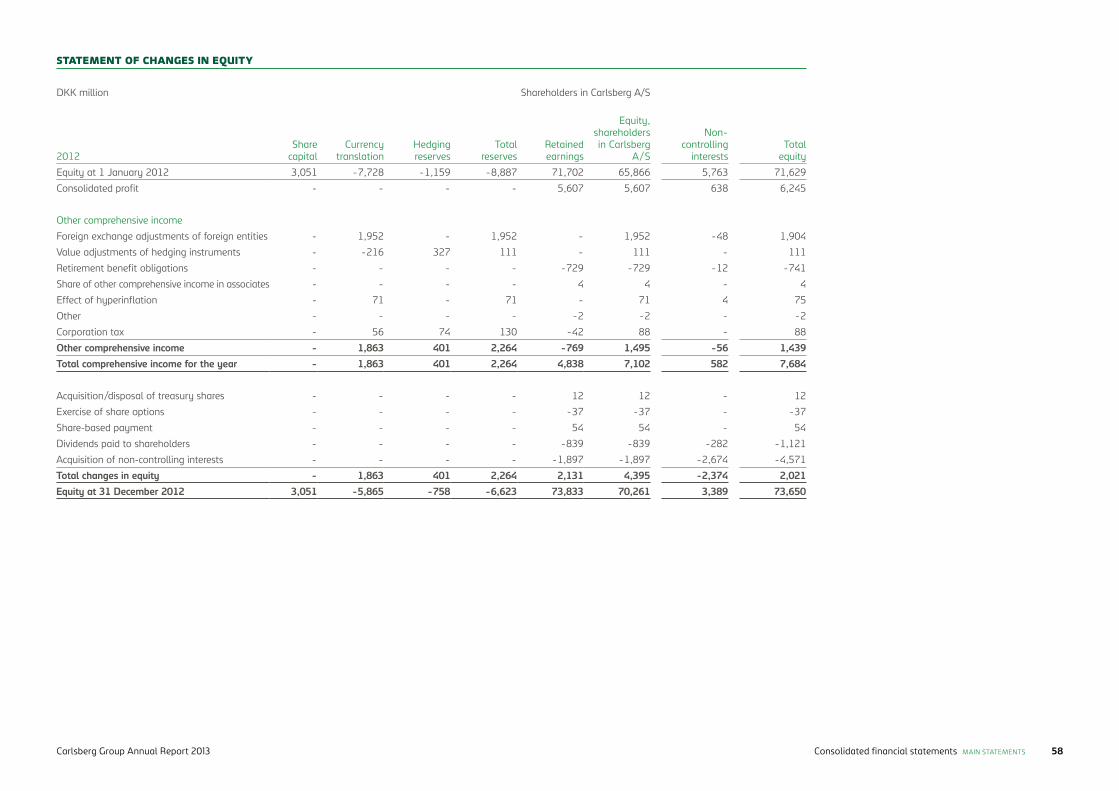
DKK million Shareholders in Carlsberg A/S
2012Share
capitalCurrency
translationHedgingreserves
Totalreserves
Retainedearnings
Equity,shareholders in Carlsberg
A/S
Non- controlling
interestsTotal
equity
Equity at 1 January 2012 3,051 -7,728 -1,159 -8,887 71,702 65,866 5,763 71,629
Consolidated profit - - - - 5,607 5,607 638 6,245
Other comprehensive income
Foreign exchange adjustments of foreign entities - 1,952 - 1,952 - 1,952 -48 1,904
Value adjustments of hedging instruments - -216 327 111 - 111 - 111
Retirement benefit obligations - - - - -729 -729 -12 -741
Share of other comprehensive income in associates - - - - 4 4 - 4
Effect of hyperinflation - 71 - 71 - 71 4 75
Other - - - - -2 -2 - -2
Corporation tax - 56 74 130 -42 88 - 88
Other comprehensive income - 1,863 401 2,264 -769 1,495 -56 1,439Total comprehensive income for the year - 1,863 401 2,264 4,838 7,102 582 7,684
Acquisition/disposal of treasury shares - - - - 12 12 - 12
Exercise of share options - - - - -37 -37 - -37
Share-based payment - - - - 54 54 - 54
Dividends paid to shareholders - - - - -839 -839 -282 -1,121
Acquisition of non-controlling interests - - - - -1,897 -1,897 -2,674 -4,571
Total changes in equity - 1,863 401 2,264 2,131 4,395 -2,374 2,021Equity at 31 December 2012 3,051 -5,865 -758 -6,623 73,833 70,261 3,389 73,650
STATEMENT OF CHANGES IN EQUITY
Consolidated financial statements MAIN STATEMENTS 58Carlsberg Group Annual Report 2013
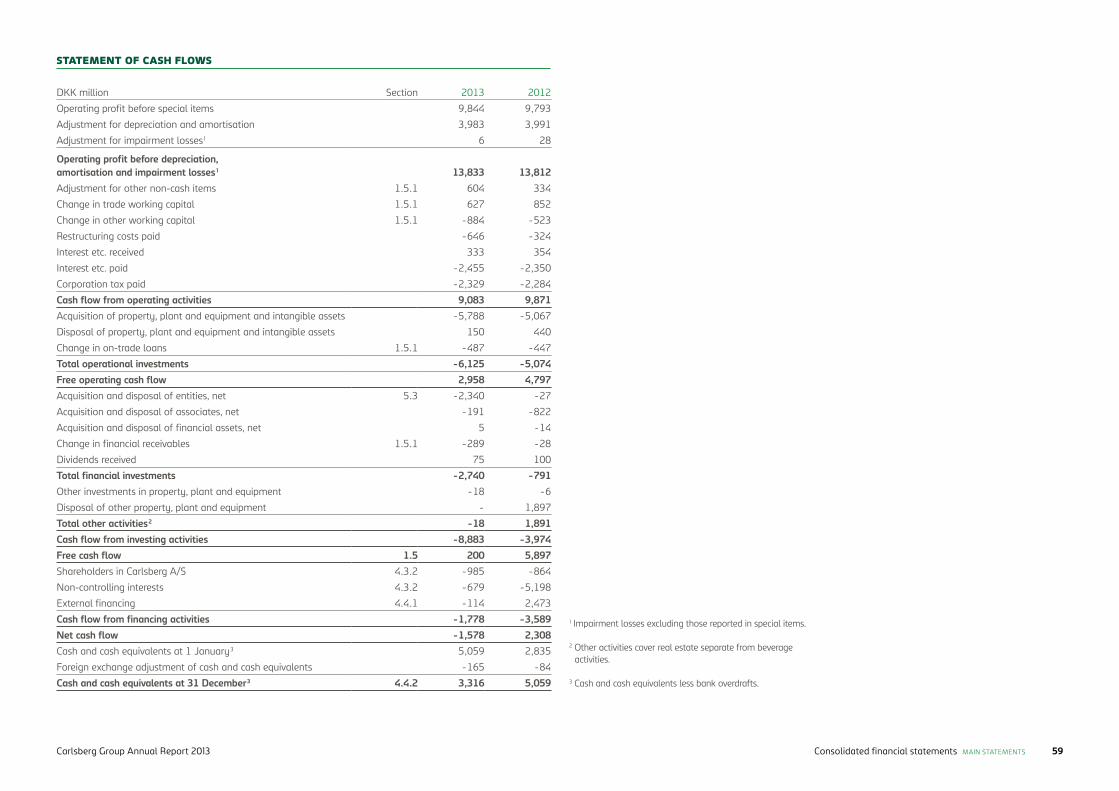
DKK million Section 2013 2012
Operating profit before special items 9,844 9,793
Adjustment for depreciation and amortisation 3,983 3,991
Adjustment for impairment losses1 6 28
Operating profit before depreciation, amortisation and impairment losses 1 13,833 13,812Adjustment for other non-cash items 1.5.1 604 334
Change in trade working capital 1.5.1 627 852
Change in other working capital 1.5.1 -884 -523
Restructuring costs paid -646 -324
Interest etc. received 333 354
Interest etc. paid -2,455 -2,350
Corporation tax paid -2,329 -2,284
Cash flow from operating activities 9,083 9,871Acquisition of property, plant and equipment and intangible assets -5,788 -5,067
Disposal of property, plant and equipment and intangible assets 150 440
Change in on-trade loans 1.5.1 -487 -447
Total operational investments -6,125 -5,074Free operating cash flow 2,958 4,797Acquisition and disposal of entities, net 5.3 -2,340 -27
Acquisition and disposal of associates, net -191 -822
Acquisition and disposal of financial assets, net 5 -14
Change in financial receivables 1.5.1 -289 -28
Dividends received 75 100
Total financial investments -2,740 -791Other investments in property, plant and equipment -18 -6
Disposal of other property, plant and equipment - 1,897
Total other activities2 -18 1,891Cash flow from investing activities -8,883 -3,974Free cash flow 1.5 200 5,897Shareholders in Carlsberg A/S 4.3.2 -985 -864
Non-controlling interests 4.3.2 -679 -5,198
External financing 4.4.1 -114 2,473
Cash flow from financing activities -1,778 -3,589Net cash flow -1,578 2,308Cash and cash equivalents at 1 January3 5,059 2,835
Foreign exchange adjustment of cash and cash equivalents -165 -84
Cash and cash equivalents at 31 December3 4.4.2 3,316 5,059
STATEMENT OF CASH FLOWS
1 Impairment losses excluding those reported in special items.
2 Other activities cover real estate separate from beverage activities.
3 Cash and cash equivalents less bank overdrafts.
Consolidated financial statements MAIN STATEMENTS 59Carlsberg Group Annual Report 2013
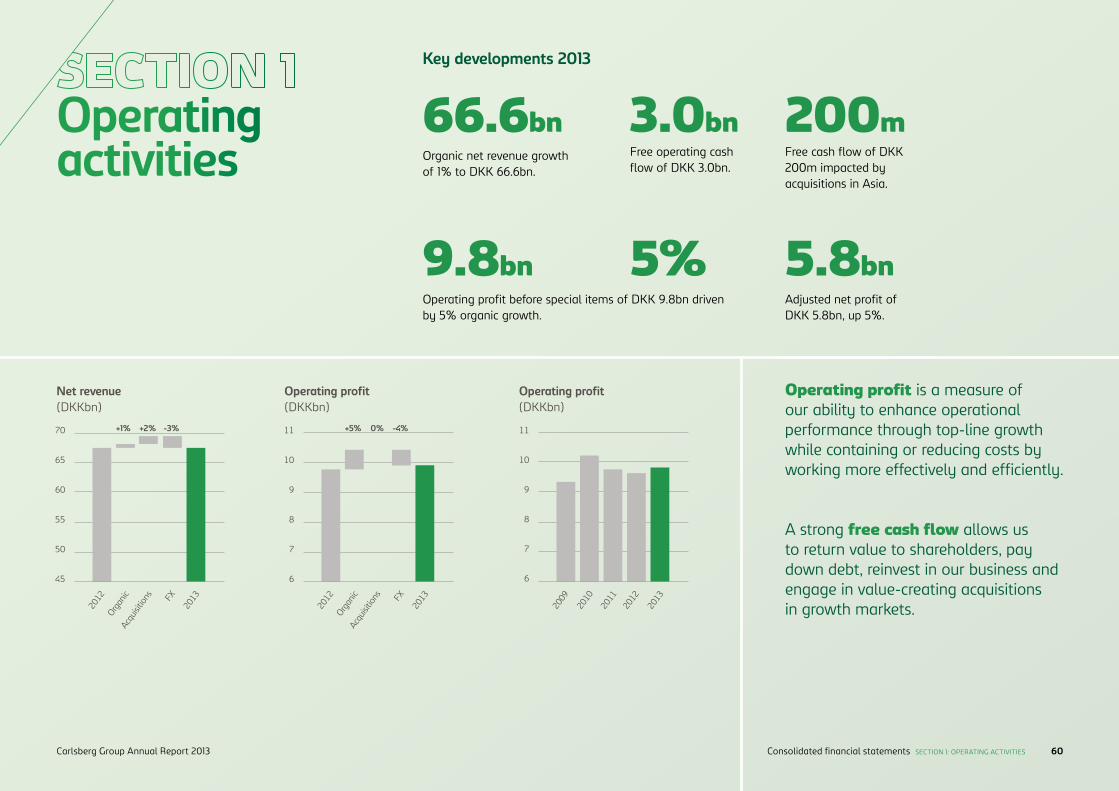
Operating activities
66.6bn
9.8bn
3.0bn
5% 5.8bn
200m
Key developments 2013
Organic net revenue growth of 1% to DKK 66.6bn.
Operating profit before special items of DKK 9.8bn driven by 5% organic growth.
Adjusted net profit of DKK 5.8bn, up 5%.
Free cash flow of DKK 200m impacted by acquisitions in Asia.
Free operating cash flow of DKK 3.0bn.
Operating profit is a measure of our ability to enhance operational performance through top-line growth while containing or reducing costs by working more effectively and efficiently.
A strong free cash flow allows us to return value to shareholders, pay down debt, reinvest in our business and engage in value-creating acquisitions in growth markets.
Operating profit(DKKbn)
Operating profit(DKKbn)
11
10
9
8
7
6
11
10
9
8
7
6
+5%+1% 0%+2% -4%-3%
2013
2013FX
2012
Organ
ic
2010
Acqu
isitio
ns
2011
2012
2009
Net revenue(DKKbn)
70
65
60
55
50
45
2013FX
Organ
icAc
quisi
tions
2012
Consolidated financial statements SECTION 1: OPERATING ACTIVITIESCarlsberg Group Annual Report 2013 60
Group beer volumes declined organically by 2%, while reported beer volumes declined by 1%. The growing volumes in Asia were not enough to offset the volume decline in Eastern and Western Europe. The acquisition impact of 1% mainly related to Chongqing Brewery Group in China and distribution enti-ties acquired from Nordic Getränke in Germa-ny. Other beverages grew organically by 2%.
Net revenue grew by 1% organically, while reported net revenue was flat as a result of -3% impact from currencies and acquisition impact of +2%. The negative currency im-pact was due to weaker currencies in Russia,
Malawi, Norway, the UK and several Asian countries.
Cost of goods sold per hl increased organi-cally by approximately 1%, but due to the positive price/mix gross profit per hl grew by approximately 5% organically. Reported cost of goods sold per hl declined slightly and reported gross profit per hl grew by 1%. Total gross profit grew organically by 3%. Reported gross margin improved by 40bp to 49.5%.
We invested in future efficiency improve-ments and reported operating expenses
GROUP
Change Change
DKK million 2012 Organic Acq., net FX 2013 Reported
Beer (million hl) 120.4 -2% 1% 119.7 -1%
Other beverages (million hl) 19.1 2% 1% 19.7 3%
Total volume, pro rata 139.5 -1% 1% 139.4 0%Net revenue 66,468 1% 2% -3% 66,552 0%
Operating profit before special items 9,793 5% 0% -4% 9,844 1%
Operating margin (%) 14.7 14.8 10bp
Business developments
grew by 1% impacted by BSP1-related costs of approximately DKK 350m. Excluding the BSP1-related costs, reported operating expenses declined by 1%, driven by tight cost control in all areas.
Consequently, operating profit before special items grew organically by 5%. All three regions delivered organic operating profit growth, with particularly strong growth in Asia. Reported operating profit was DKK 9,844m. Group operating margin increased by 10bp to 14.8%. Eastern Europe and Asia improved operating margins, while the West-ern European margin was flat versus prior year despite the BSP1-related costs.
1.1 ACCOUNTING POLICIES
Growth represents the combined effect of the following three elements: acquisitions, foreign exchange effects and organic growth. The acquisition effect is calculated as the effect of acquisitions and divestments, including any ad-ditional share obtained from increased owner-ship of proportionately consolidated entities and associates for a 12-month period from the acquisition date. The foreign exchange effect is the difference between the figures for the current reporting period translated at the exchange rates applying to the previous reporting period and at the rates applying to the current reporting period. Organic growth is the remaining growth that is not related to acquisitions, divestments or foreign exchange effects.
Reported net profit was DKK 5,471m (2012: DKK 5,607m). Net profit in 2012 was positively impacted by the disposal of the Copenhagen brewery site.
Adjusted net profit (adjusted for post-tax impact of special items) grew by 5% to DKK 5,795m versus DKK 5,504m last year.
Consolidated financial statements SECTION 1: OPERATING ACTIVITIESCarlsberg Group Annual Report 2013 61
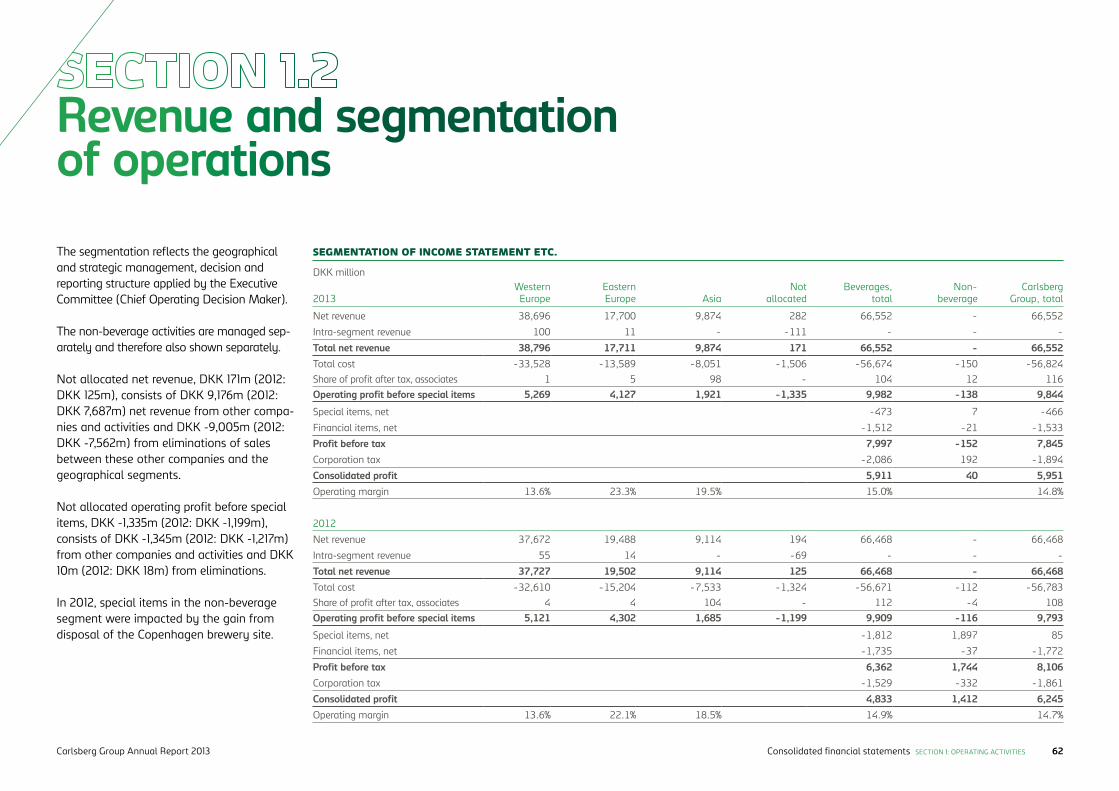
The segmentation reflects the geographical and strategic management, decision and reporting structure applied by the Executive Committee (Chief Operating Decision Maker).
The non-beverage activities are managed sep-arately and therefore also shown separately.
Not allocated net revenue, DKK 171m (2012: DKK 125m), consists of DKK 9,176m (2012: DKK 7,687m) net revenue from other compa-nies and activities and DKK -9,005m (2012: DKK -7,562m) from eliminations of sales between these other companies and the geographical segments.
Not allocated operating profit before special items, DKK -1,335m (2012: DKK -1,199m), consists of DKK -1,345m (2012: DKK -1,217m) from other companies and activities and DKK 10m (2012: DKK 18m) from eliminations.
In 2012, special items in the non-beverage segment were impacted by the gain from disposal of the Copenhagen brewery site.
DKK million
2013Western Europe
Eastern Europe Asia
Not allocated
Beverages, total
Non- beverage
Carlsberg Group, total
Net revenue 38,696 17,700 9,874 282 66,552 - 66,552
Intra-segment revenue 100 11 - -111 - - -
Total net revenue 38,796 17,711 9,874 171 66,552 - 66,552Total cost -33,528 -13,589 -8,051 -1,506 -56,674 -150 -56,824Share of profit after tax, associates 1 5 98 - 104 12 116Operating profit before special items 5,269 4,127 1,921 -1,335 9,982 -138 9,844
Special items, net -473 7 -466
Financial items, net -1,512 -21 -1,533
Profit before tax 7,997 -152 7,845Corporation tax -2,086 192 -1,894
Consolidated profit 5,911 40 5,951Operating margin 13.6% 23.3% 19.5% 15.0% 14.8%
2012
Net revenue 37,672 19,488 9,114 194 66,468 - 66,468
Intra-segment revenue 55 14 - -69 - - -
Total net revenue 37,727 19,502 9,114 125 66,468 - 66,468Total cost -32,610 -15,204 -7,533 -1,324 -56,671 -112 -56,783Share of profit after tax, associates 4 4 104 - 112 -4 108Operating profit before special items 5,121 4,302 1,685 -1,199 9,909 -116 9,793
Special items, net -1,812 1,897 85
Financial items, net -1,735 -37 -1,772
Profit before tax 6,362 1,744 8,106Corporation tax -1,529 -332 -1,861
Consolidated profit 4,833 1,412 6,245Operating margin 13.6% 22.1% 18.5% 14.9% 14.7%
SEGMENTATION OF INCOME STATEMENT ETC.
Revenue and segmentation of operations
Consolidated financial statements SECTION 1: OPERATING ACTIVITIESCarlsberg Group Annual Report 2013 62
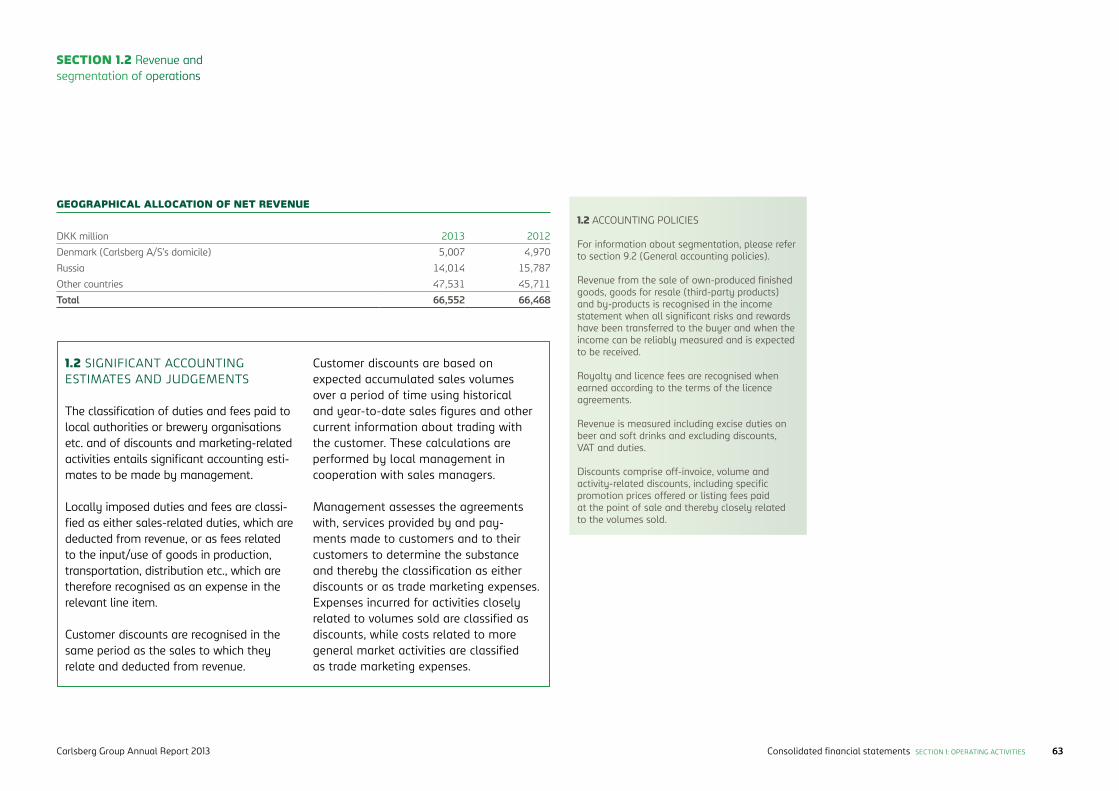
DKK million 2013 2012
Denmark (Carlsberg A/S’s domicile) 5,007 4,970
Russia 14,014 15,787
Other countries 47,531 45,711
Total 66,552 66,468
GEOGRAPHICAL ALLOCATION OF NET REVENUE1.2 ACCOUNTING POLICIES
For information about segmentation, please refer to section 9.2 (General accounting policies).
Revenue from the sale of own-produced finished goods, goods for resale (third-party products) and by-products is recognised in the income statement when all significant risks and rewards have been transferred to the buyer and when the income can be reliably measured and is expected to be received.
Royalty and licence fees are recognised when earned according to the terms of the licence agreements.
Revenue is measured including excise duties on beer and soft drinks and excluding discounts, VAT and duties.
Discounts comprise off-invoice, volume and activity-related discounts, including specific promotion prices offered or listing fees paid at the point of sale and thereby closely related to the volumes sold.
1.2 SIGNIFICANT ACCOUNTING ESTIMATES AND JUDGEMENTS
The classification of duties and fees paid to local authorities or brewery organisations etc. and of discounts and marketing-related activities entails significant accounting esti-mates to be made by management.
Locally imposed duties and fees are classi-fied as either sales-related duties, which are deducted from revenue, or as fees related to the input/use of goods in production, transportation, distribution etc., which are therefore recognised as an expense in the relevant line item.
Customer discounts are recognised in the same period as the sales to which they relate and deducted from revenue.
Customer discounts are based on expected accumulated sales volumes over a period of time using historical and year-to-date sales figures and other current information about trading with the customer. These calculations are performed by local management in cooperation with sales managers.
Management assesses the agreements with, services provided by and pay-ments made to customers and to their customers to determine the substance and thereby the classification as either discounts or as trade marketing expenses. Expenses incurred for activities closely related to volumes sold are classified as discounts, while costs related to more general market activities are classified as trade marketing expenses.
SECTION 1.2 Revenue and segmentation of operations
Consolidated financial statements SECTION 1: OPERATING ACTIVITIESCarlsberg Group Annual Report 2013 63
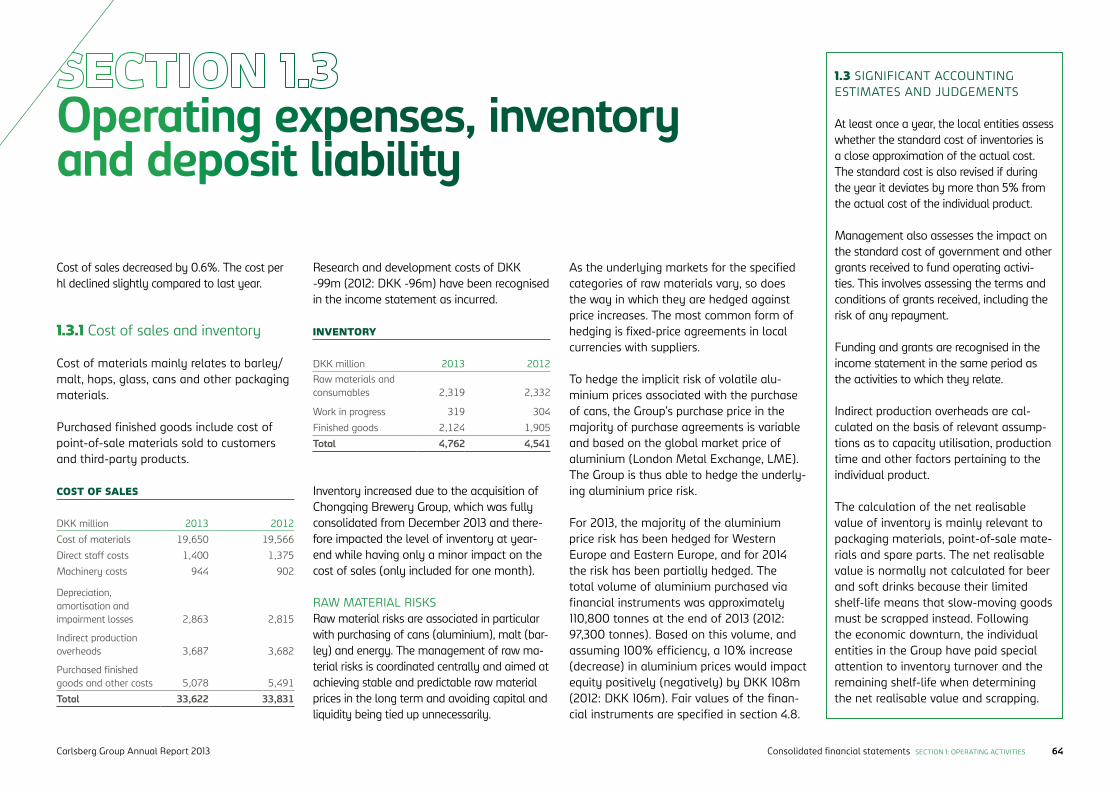
Cost of materials mainly relates to barley/malt, hops, glass, cans and other packaging materials.
Purchased finished goods include cost of point-of-sale materials sold to customers and third-party products.
1.3.1 Cost of sales and inventory
Operating expenses, inventory and deposit liability
Research and development costs of DKK -99m (2012: DKK -96m) have been recognised in the income statement as incurred.
DKK million 2013 2012
Cost of materials 19,650 19,566
Direct staff costs 1,400 1,375
Machinery costs 944 902
Depreciation, amortisation and impairment losses 2,863 2,815
Indirect production overheads 3,687 3,682
Purchased finished goods and other costs 5,078 5,491
Total 33,622 33,831
DKK million 2013 2012Raw materials and consumables 2,319 2,332
Work in progress 319 304
Finished goods 2,124 1,905
Total 4,762 4,541
COST OF SALES
INVENTORY
Inventory increased due to the acquisition of Chongqing Brewery Group, which was fully consolidated from December 2013 and there-fore impacted the level of inventory at year-end while having only a minor impact on the cost of sales (only included for one month).
RAW MATERIAL RISKSRaw material risks are associated in particular with purchasing of cans (aluminium), malt (bar-ley) and energy. The management of raw ma-terial risks is coordinated centrally and aimed at achieving stable and predictable raw material prices in the long term and avoiding capi tal and liquidity being tied up unnecessarily.
Cost of sales decreased by 0.6%. The cost per hl declined slightly compared to last year.
1.3 SIGNIFICANT ACCOUNTING ESTIMATES AND JUDGEMENTS
At least once a year, the local entities assess whether the standard cost of inventories is a close approximation of the actual cost. The standard cost is also revised if during the year it deviates by more than 5% from the actual cost of the individual product.
Management also assesses the impact on the standard cost of government and other grants received to fund operating activi-ties. This involves assessing the terms and conditions of grants received, including the risk of any repayment.
Funding and grants are recognised in the income statement in the same period as the activities to which they relate.
Indirect production overheads are cal-culated on the basis of relevant assump-tions as to capacity utilisation, production time and other factors pertaining to the individual product.
The calculation of the net realisable value of inventory is mainly relevant to packaging materials, point-of-sale mate-rials and spare parts. The net realisable value is normally not calculated for beer and soft drinks because their limited shelf-life means that slow-moving goods must be scrapped instead. Following the economic downturn, the individual entities in the Group have paid special attention to inventory turnover and the remaining shelf-life when determining the net realisable value and scrapping.
As the underlying markets for the specified categories of raw materials vary, so does the way in which they are hedged against price increases. The most common form of hedging is fixed-price agreements in local currencies with suppliers.
To hedge the implicit risk of volatile alu-minium prices associated with the purchase of cans, the Group’s purchase price in the majority of purchase agreements is variable and based on the global market price of aluminium (London Metal Exchange, LME). The Group is thus able to hedge the underly-ing aluminium price risk.
For 2013, the majority of the aluminium price risk has been hedged for Western Europe and Eastern Europe, and for 2014 the risk has been partially hedged. The total volume of aluminium purchased via financial instruments was approximately 110,800 tonnes at the end of 2013 (2012: 97,300 tonnes). Based on this volume, and assuming 100% efficiency, a 10% increase (decrease) in aluminium prices would impact equity positively (negatively) by DKK 108m (2012: DKK 106m). Fair values of the finan-cial instruments are specified in section 4.8.
Consolidated financial statements SECTION 1: OPERATING ACTIVITIESCarlsberg Group Annual Report 2013 64
1.3.1 ACCOUNTING POLICIES
Cost of sales comprises costs of products sold during the year, indirect production overheads not allocated to specific products (IPO) and development costs.
Own-produced finished goods and work in pro-gress are measured at standard cost comprising the cost of raw materials, consumables, direct labour and indirect production overheads. Indirect production overheads comprise indirect supplies, wages and salaries, amortisation of trademarks and software as well as maintenance and depre-ciation of machinery, plant and equipment used for production and costs of production, adminis-tration and management.
The cost of purchased finished goods, raw and packaging materials and point-of-sale materials includes any costs that are related directly to bringing inventories to the relevant place of sale and getting them ready for sale, e.g. purchase cost, insurance, freight, duties and similar costs.
Inventories are measured at the lower of standard cost (own-produced finished goods) and weighted average cost (other inventories) and net realis-able value. The net realisable value of inventories is calculated as the selling price less costs of com pletion and costs necessary to make the sale and is determined taking into account marketabil-ity, obsolescence and developments in expected selling price.
The cost of scrapped/impaired goods is expensed within the function (line item) responsible for the loss, i.e. losses during distribution are included in the cost of distribution while the scrapping of products due to sales not meeting forecasts is included in sales expenses.
SECTION 1.3 Operating expenses, inventory and deposit liability
It is Group policy to secure delivery of malt and hops for the coming budget year, and the main part of the exposure for 2013 was thus hedged through fixed-price purchase agreements for the majority of the Group in 2012. The percentage which is hedged or price-fixed is higher for Western Europe than for Eastern Europe.
1.3.2 ACCOUNTING POLICIES
The obligation to refund deposits on returnable packaging is stated on the basis of deposit price as well as an estimate of the number of bottles, kegs, cans and crates in circulation and expected return rates.
The accounting policy for returnable packaging capitalised as property, plant and equipment is described in section 2.4.
1.3.2 SIGNIFICANT ACCOUNTING ESTIMATES AND JUDGEMENTS
Management assesses the local busi-ness model, contracts and agreements, the level of control over the returnable packaging material and the return rate to determine the accounting treatment of the packaging material as either prop-erty, plant and equipment or inventory.
The deposit liability provided for is esti-mated based on movements during the year in recognised deposit liabilities and on historical information about return rates and loss of bottles in the market as well as planned changes in packaging types.
1.3.2 Deposit liabilities on returnable packaging
In a number of countries, the local entities have a legal or constructive obligation to take back returnable packaging from the market. When invoicing customers, the entity adds a deposit to the sales price and recog-nises a deposit liability. The deposit is paid out on return of bottles, cans etc.
The deposit liability amounted to DKK 1,630m (2012: DKK 1,381m) at 31 December 2013, while the value of returnable packag-ing materials amounted to DKK 2,001m (2012: DKK 1,727m). The capitalised value of returnable packaging materials exceeds the deposit liability as each of the return-able packaging items circulates a number of times in the market. The deposit liability was almost unchanged compared to the liability at the end of 2012 except for the effect of the Chongqing acquisition, which increased the deposit liability.
Consolidated financial statements SECTION 1: OPERATING ACTIVITIESCarlsberg Group Annual Report 2013 65
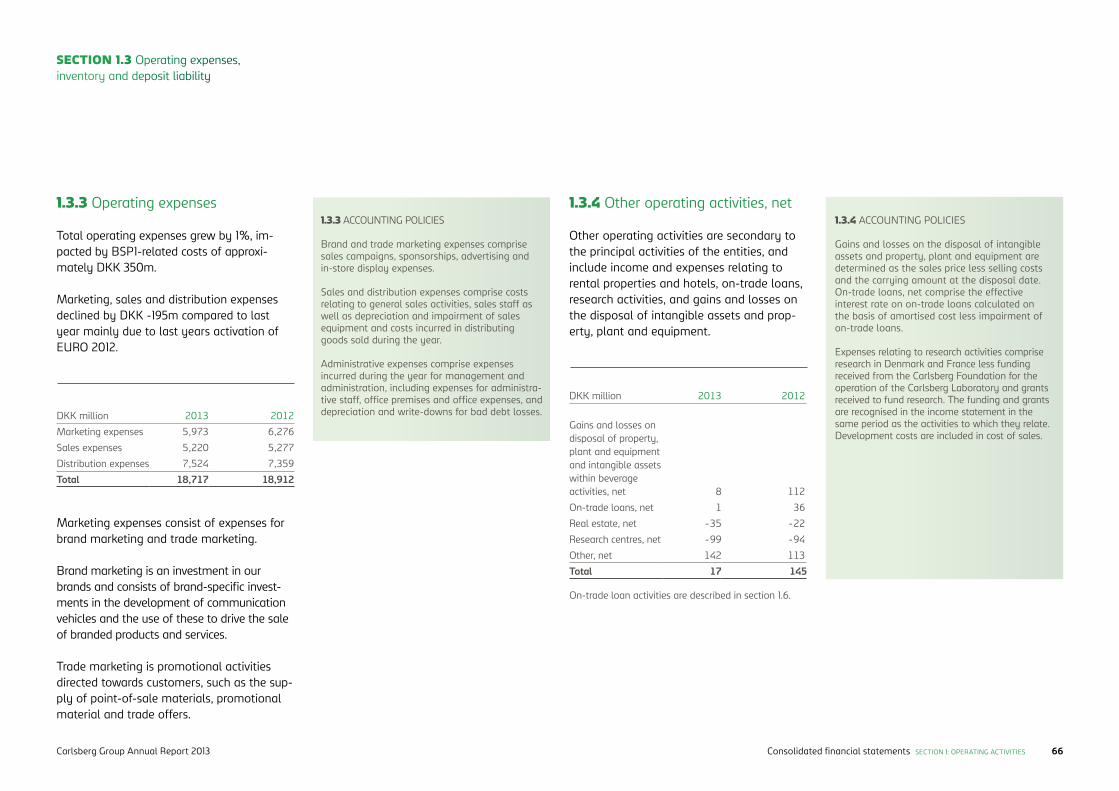
1.3.4 ACCOUNTING POLICIES
Gains and losses on the disposal of intangible assets and property, plant and equipment are determined as the sales price less selling costs and the carrying amount at the disposal date. On-trade loans, net comprise the effective interest rate on on-trade loans calculated on the basis of amortised cost less impairment of on-trade loans.
Expenses relating to research activities comprise research in Denmark and France less funding received from the Carlsberg Foundation for the operation of the Carlsberg Laboratory and grants received to fund research. The funding and grants are recognised in the income statement in the same period as the activities to which they relate. Development costs are included in cost of sales.
SECTION 1.3 Operating expenses, inventory and deposit liability
1.3.4 Other operating activities, net
Other operating activities are secondary to the principal activities of the entities, and include income and expenses relating to rental properties and hotels, on-trade loans, research activities, and gains and losses on the disposal of intangible assets and prop-erty, plant and equipment.
On-trade loan activities are described in section 1.6.
DKK million 2013 2012
Gains and losses on disposal of property, plant and equipment and intangible assets within beverage activities, net 8 112
On-trade loans, net 1 36
Real estate, net -35 -22
Research centres, net -99 -94
Other, net 142 113
Total 17 145
DKK million 2013 2012
Marketing expenses 5,973 6,276
Sales expenses 5,220 5,277
Distribution expenses 7,524 7,359
Total 18,717 18,912
1.3.3 ACCOUNTING POLICIES
Brand and trade marketing expenses comprise sales campaigns, sponsorships, advertising and in-store display expenses.
Sales and distribution expenses comprise costs relating to general sales activities, sales staff as well as depreciation and impairment of sales equipment and costs incurred in distributing goods sold during the year.
Administrative expenses comprise expenses incurred during the year for management and administration, including expenses for administra-tive staff, office premises and office expenses, and depreciation and write-downs for bad debt losses.
1.3.3 Operating expenses
Total operating expenses grew by 1%, im-pacted by BSP1-related costs of approxi-mately DKK 350m.
Marketing, sales and distribution expenses declined by DKK -195m compared to last year mainly due to last years activation of EURO 2012.
Marketing expenses consist of expenses for brand marketing and trade marketing.
Brand marketing is an investment in our brands and consists of brand-specific invest-ments in the development of communication vehicles and the use of these to drive the sale of branded products and services.
Trade marketing is promotional activities directed towards customers, such as the sup-ply of point-of-sale materials, promotional material and trade offers.
Consolidated financial statements SECTION 1: OPERATING ACTIVITIESCarlsberg Group Annual Report 2013 66
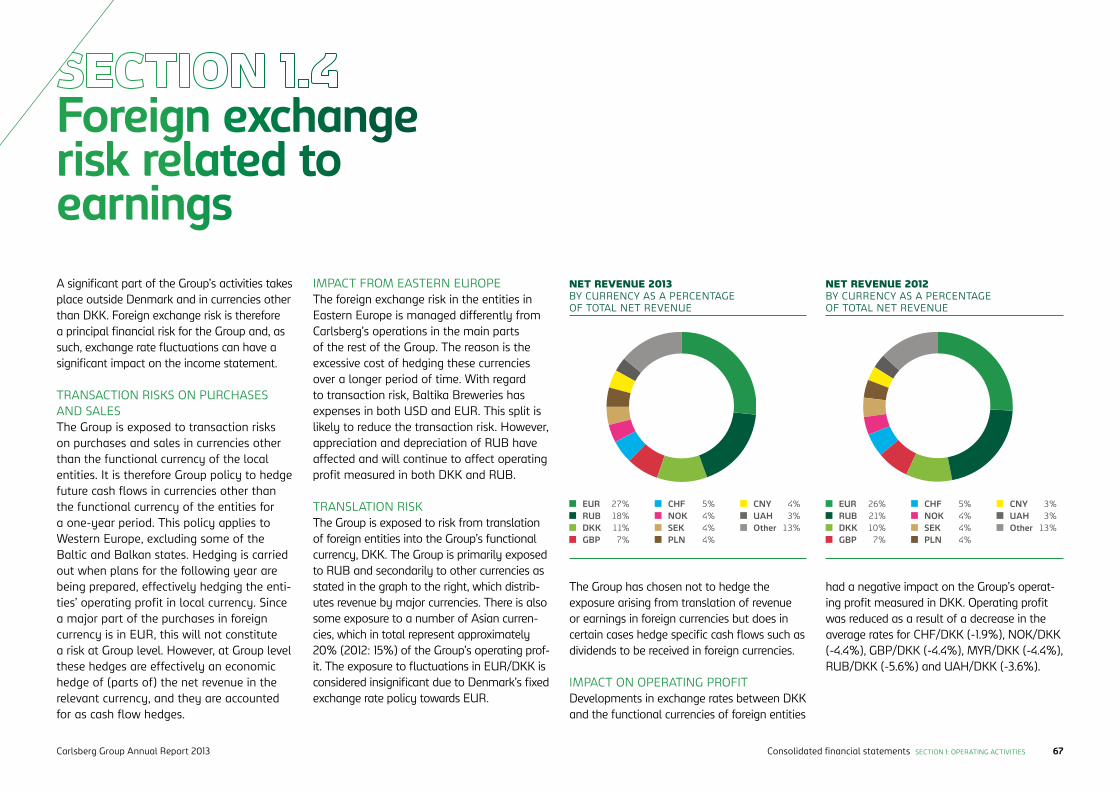
A significant part of the Group’s activities takes place outside Denmark and in currencies other than DKK. Foreign exchange risk is therefore a principal financial risk for the Group and, as such, exchange rate fluctuations can have a significant impact on the income statement.
TRANSACTION RISKS ON PURCHASES AND SALES The Group is exposed to transaction risks on purchases and sales in currencies other than the functional currency of the local entities. It is therefore Group policy to hedge future cash flows in currencies other than the functional currency of the entities for a one-year period. This policy applies to Western Europe, excluding some of the Baltic and Balkan states. Hedging is carried out when plans for the following year are being prepared, effectively hedging the enti-ties’ operating profit in local currency. Since a major part of the purchases in foreign currency is in EUR, this will not constitute a risk at Group level. However, at Group level these hedges are effectively an economic hedge of (parts of) the net revenue in the relevant currency, and they are accounted for as cash flow hedges.
IMPACT FROM EASTERN EUROPEThe foreign exchange risk in the entities in Eastern Europe is managed differently from Carlsberg’s operations in the main parts of the rest of the Group. The reason is the excessive cost of hedging these currencies over a longer period of time. With regard to transaction risk, Baltika Breweries has expenses in both USD and EUR. This split is likely to reduce the transaction risk. However, appreciation and depreciation of RUB have affected and will continue to affect operating profit measured in both DKK and RUB.
TRANSLATION RISK The Group is exposed to risk from translation of foreign entities into the Group’s functional currency, DKK. The Group is primarily exposed to RUB and secondarily to other currencies as stated in the graph to the right, which distrib-utes revenue by major currencies. There is also some exposure to a number of Asian curren-cies, which in total represent approximately 20% (2012: 15%) of the Group’s operating prof-it. The exposure to fluctuations in EUR/DKK is considered insignificant due to Denmark’s fixed exchange rate policy towards EUR.
Foreign exchange risk related to earnings
The Group has chosen not to hedge the exposure arising from translation of revenue or earnings in foreign currencies but does in certain cases hedge specific cash flows such as dividends to be received in foreign currencies.
IMPACT ON OPERATING PROFITDevelopments in exchange rates between DKK and the functional currencies of foreign entities
EUR 27% RUB 18% DKK 11% GBP 7%
NET REVENUE 2013 BY CURRENCY AS A PERCENTAGE OF TOTAL NET REVENUE
CHF 5% NOK 4% SEK 4% PLN 4%
CNY 4% UAH 3% Other 13%
EUR 26% RUB 21% DKK 10% GBP 7%
NET REVENUE 2012 BY CURRENCY AS A PERCENTAGE OF TOTAL NET REVENUE
CHF 5% NOK 4% SEK 4% PLN 4%
CNY 3% UAH 3% Other 13%
had a negative impact on the Group’s operat-ing profit measured in DKK. Operating profit was reduced as a result of a decrease in the average rates for CHF/DKK (-1.9%), NOK/DKK (-4.4%), GBP/DKK (-4.4%), MYR/DKK (-4.4%), RUB/DKK (-5.6%) and UAH/DKK (-3.6%).
Consolidated financial statements SECTION 1: OPERATING ACTIVITIESCarlsberg Group Annual Report 2013 67
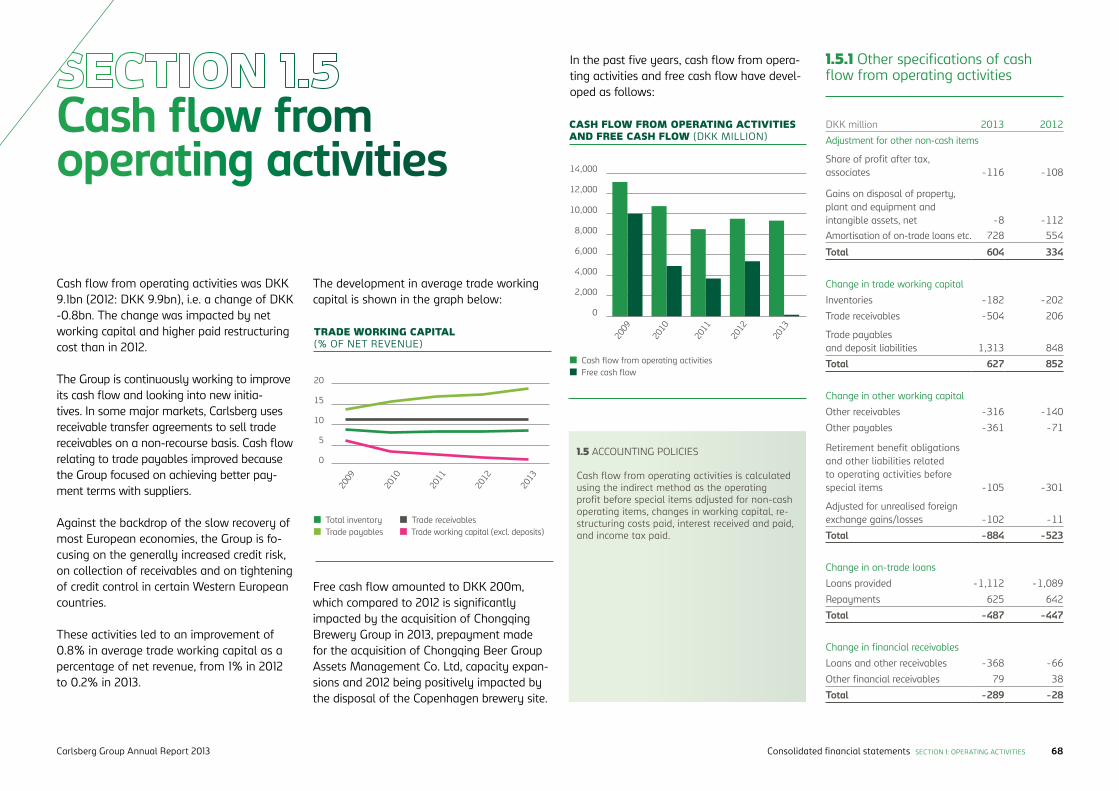
DKK million 2013 2012
Adjustment for other non-cash items
Share of profit after tax, associates -116 -108
Gains on disposal of property, plant and equipment and intangible assets, net -8 -112Amortisation of on-trade loans etc. 728 554
Total 604 334
Change in trade working capital
Inventories -182 -202
Trade receivables -504 206
Trade payables and deposit liabilities 1,313 848
Total 627 852
Change in other working capital
Other receivables -316 -140
Other payables -361 -71
Retirement benefit obligations and other liabilities related to operating activities before special items -105 -301
Adjusted for unrealised foreign exchange gains/losses -102 -11
Total -884 -523
Change in on-trade loans
Loans provided -1,112 -1,089
Repayments 625 642
Total -487 -447
Change in financial receivables
Loans and other receivables -368 -66
Other financial receivables 79 38
Total -289 -28
Cash flow from operating activities
Cash flow from operating activities was DKK 9.1bn (2012: DKK 9.9bn), i.e. a change of DKK -0.8bn. The change was impacted by net working capital and higher paid restructuring cost than in 2012.
The Group is continuously working to improve its cash flow and looking into new initia-tives. In some major markets, Carlsberg uses receivable transfer agreements to sell trade receivables on a non-recourse basis. Cash flow relating to trade payables improved because the Group focused on achieving better pay-ment terms with suppliers.
Against the backdrop of the slow recovery of most European economies, the Group is fo-cusing on the generally increased credit risk, on collection of receivables and on tightening of credit control in certain Western European countries.
These activities led to an improvement of 0.8% in average trade working capital as a percentage of net revenue, from 1% in 2012 to 0.2% in 2013.
1.5 ACCOUNTING POLICIES
Cash flow from operating activities is calculated using the indirect method as the operating profit before special items adjusted for non-cash operating items, changes in working capital, re-structuring costs paid, interest received and paid, and income tax paid.
1.5.1 Other specifications of cash flow from operating activities
2013
Trade payables Total inventory
Trade working capital (excl. deposits) Trade receivables
20
15
10
5
0
2011
2009
2010
2012
TRADE WORKING CAPITAL (% OF NET REVENUE)
In the past five years, cash flow from opera -ting activities and free cash flow have devel-oped as follows:
2009
14,000
12,000
10,000
8,000
6,000
4,000
2,000
0
Cash flow from operating activities Free cash flow
2011
2010
2012
2013
CASH FLOW FROM OPERATING ACTIVITIES AND FREE CASH FLOW (DKK MILLION)
The development in average trade working capital is shown in the graph below:
Free cash flow amounted to DKK 200m, which compared to 2012 is significantly impacted by the acquisition of Chongqing Brewery Group in 2013, prepayment made for the acquisition of Chongqing Beer Group Assets Management Co. Ltd, capacity expan-sions and 2012 being positively impacted by the disposal of the Copenhagen brewery site.
Consolidated financial statements SECTION 1: OPERATING ACTIVITIESCarlsberg Group Annual Report 2013 68
DKK million 2013 2012
Trade receivables 7,888 7,828
Other receivables 2,001 2,093
Total current receiva-bles 9,889 9,873Non-current receivables 2,093 2,208
Total 11,982 12,129
DKK million 2013 2012
Interest and amortisation of on-trade loans 79 91
Losses and write-downs on on-trade loans -78 -55
On-trade loans, net 1 36
% 2013 2012
On-trade loans 4.9 4.9
The Group’s non-current receivables mainly consist of on-trade loans.
The current receivables comprise receivables from trade and other receivables.
Trade receivables and on-trade loans
RECEIVABLES INCLUDED IN THE STATEMENT OF FINANCIAL POSITION
RECEIVABLES BY ORIGIN
AVERAGE EFFECTIVE INTEREST RATES
ON-TRADE LOANS
DKK million 2013 2012
Sale of goods and services 7,258 7,117
On-trade loans 1,916 2,022
Loans, fair value of hedging instruments and other receivables 2,808 2,990
Total 11,982 12,129
The fair value of the on-trade loans was DKK 1,916m (2012: DKK 2,022m).
1.6 SIGNIFICANT ACCOUNTING ESTIMATES AND JUDGEMENTS
The on-trade loan agreements are typi-cally complex and cover several aspects of the relationship between the parties. Management assesses the recognition and classification of income and expenses for each of these agreements, including the allocation of payments from the cus-tomer between revenue, discounts, inter-est on the loan (other operating activities) and repayment of the loan.
Trade receivables comprise invoiced goods and services as well as short-term on-trade loans to customers. Other receivables com-prise VAT receivables, loans to partners and associates, interest receivables and other financial receivables.
ON-TRADE LOANSUnder certain circumstances the Group grants loans to on-trade customers in France, the UK, Germany, Switzerland and Sweden. On-trade loans are spread across a large number of customers/debtors and consist of several types of loans, including loans repaid in cash or through reduced dis-counts, and prepaid discounts. The operating entities monitor and control these loans in accordance with central guidelines.
The following on-trade loan items are recog-nised in other operating activities, net:
Non-current receivables fall due more than one year from the end of the reporting period, with DKK 137m (2012: DKK 142m) falling due more than five years from the end of the reporting period.
Consolidated financial statements SECTION 1: OPERATING ACTIVITIESCarlsberg Group Annual Report 2013 69
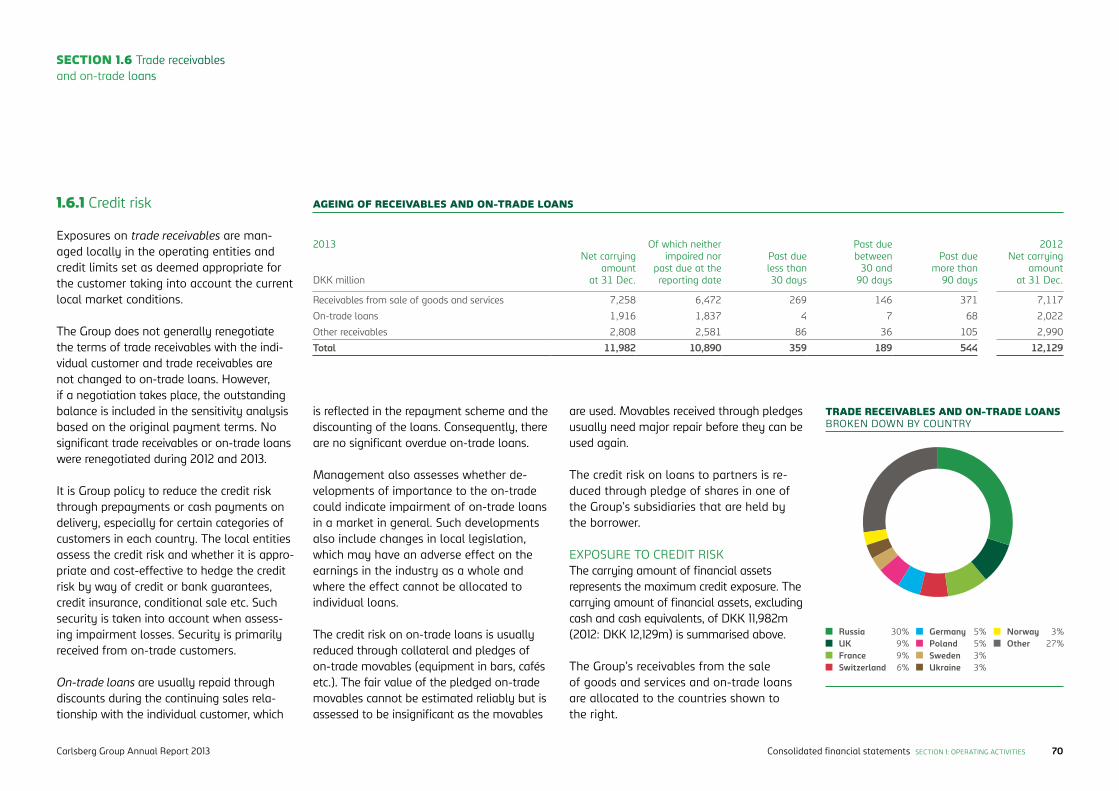
2013
DKK million
Net carrying amount
at 31 Dec.
Of which neither impaired nor
past due at the reporting date
Past due less than 30 days
Past due between
30 and 90 days
Past due more than
90 days
2012Net carrying
amount at 31 Dec.
Receivables from sale of goods and services 7,258 6,472 269 146 371 7,117
On-trade loans 1,916 1,837 4 7 68 2,022
Other receivables 2,808 2,581 86 36 105 2,990
Total 11,982 10,890 359 189 544 12,129
SECTION 1.6 Trade receivables and on-trade loans
Exposures on trade receivables are man-aged locally in the operating entities and credit limits set as deemed appropriate for the customer taking into account the current local market conditions.
The Group does not generally renegotiate the terms of trade receivables with the indi-vidual customer and trade receivables are not changed to on-trade loans. However, if a negotiation takes place, the outstanding balance is included in the sensitivity analysis based on the original payment terms. No sig ni ficant trade receivables or on-trade loans were renegotiated during 2012 and 2013.
It is Group policy to reduce the credit risk through prepayments or cash payments on delivery, especially for certain categories of customers in each country. The local entities assess the credit risk and whether it is appro-priate and cost-effective to hedge the credit risk by way of credit or bank guarantees, credit insurance, conditional sale etc. Such security is taken into account when assess-ing impairment losses. Security is primarily received from on-trade customers.
On-trade loans are usually repaid through discounts during the continuing sales rela-tionship with the individual customer, which
is reflected in the repayment scheme and the discounting of the loans. Consequently, there are no significant overdue on-trade loans.
Management also assesses whether de-velopments of importance to the on-trade could indicate impairment of on-trade loans in a market in general. Such developments also include changes in local legislation, which may have an adverse effect on the earnings in the industry as a whole and where the effect cannot be allocated to individual loans.
The credit risk on on-trade loans is usually reduced through collateral and pledges of on-trade movables (equipment in bars, cafés etc.). The fair value of the pledged on-trade movables cannot be estimated reliably but is assessed to be insignificant as the movables
are used. Movables received through pledges usually need major repair before they can be used again.
The credit risk on loans to partners is re-duced through pledge of shares in one of the Group’s subsidiaries that are held by the borrower.
EXPOSURE TO CREDIT RISKThe carrying amount of financial assets represents the maximum credit exposure. The carrying amount of financial assets, excluding cash and cash equivalents, of DKK 11,982m (2012: DKK 12,129m) is summarised above.
The Group’s receivables from the sale of goods and services and on-trade loans are allocated to the countries shown to the right.
1.6.1 Credit risk
Russia 30% UK 9% France 9% Switzerland 6%
TRADE RECEIVABLES AND ON-TRADE LOANS BROKEN DOWN BY COUNTRY
Germany 5% Poland 5% Sweden 3% Ukraine 3%
Norway 3% Other 27%
AGEING OF RECEIVABLES AND ON-TRADE LOANS
Consolidated financial statements SECTION 1: OPERATING ACTIVITIESCarlsberg Group Annual Report 2013 70
DKK million
2013Trade
receivablesOn-trade
loansOther
receivables Total2012Total
Impairment at 1 January 667 -231 -163 -1,061 -949
Impairment loss recognised -171 -101 -10 -282 -347
Realised impairment losses 115 82 3 200 194
Reversed impairments 24 23 121 168 41
Acquisition of entities -7 -7 - -14 -
Impairment at 31 December -706 -234 -49 -989 -1,061
1.6.1 ACCOUNTING POLICIES
Receivables are measured at amortised cost less impairment losses.
Regarding loans to the on-trade, any difference between present value and the nominal amount at the loan date is treated as a prepaid discount to the customer, which is recognised in the income statement in accordance with the terms of the agreement. The market interest rate is used as the discount rate, corresponding to the money market rate based on the maturity of the loan with the addition of a risk premium. The effective interest rate on these loans is recognised in other operating activities, net. The amortisation of the difference between the discount rate and the effective inter-est rate is included as a discount in revenue.
Objective indication of impairment is assessed for a portfolio of receivables when no objective indication of individual impairment losses exists. The portfolios are based on on-trade and off-trade customers, and on-trade receivables and loans. The objective indications used for portfolios are based on historical experiences and actual market developments.
Impairment losses are calculated as the difference between carrying amount and net realisable value, including the expected net realisable value of any collateral provided.
1.6.1 SIGNIFICANT ACCOUNTING ESTIMATES AND JUDGEMENTS
In assessing credit risk, management analy-ses the need for write-downs for bad debt losses due to customers’ inability to pay.
Impairment losses are based on an individu-al review for impairment based on custom-ers’ creditworthiness and expected ability to pay, customer insolvency or anticipated insolvency, and past due amounts as well as collateral received. Management also uses mathematically computed impairment losses based on customer segments, histori-cal information on payment patterns, terms of payment and concentration maturity, as well as information about the general eco-nomic situation in the markets/countries.
The financial uncertainty associated with write-downs for bad debt losses is usually considered to be limited. However, if the ability to pay deteriorates in the future, further write-downs may be necessary.
With regard to loans to the on-trade, the individual Group companies manage and control these loans as well as standard trade credits in accordance with Group guidelines.
Derecognition of groups of receivables, e.g. in business combinations or other structured transactions, is based on management’s judgement of contractual terms and other factors related to the transaction.
No significant impairment losses were incurred in respect of individual trade receivables or on-trade loans in 2013 and 2012. The impairment losses at 31 December 2013 relate to several minor customers that have – in different ways – indicated that they do not expect to be able to pay their
DEVELOPMENT IN IMPAIRMENT LOSSES ON RECEIVABLES
outstanding balances, mainly due to adverse economic developments. Relying on historic payment behaviour and extensive analysis of the underlying customers’ credit ratings, the Group believes that the unimpaired amounts that are past due by more than 30 days are still collectable.
SECTION 1.6 Trade receivables and on-trade loans
Consolidated financial statements SECTION 1: OPERATING ACTIVITIESCarlsberg Group Annual Report 2013 71
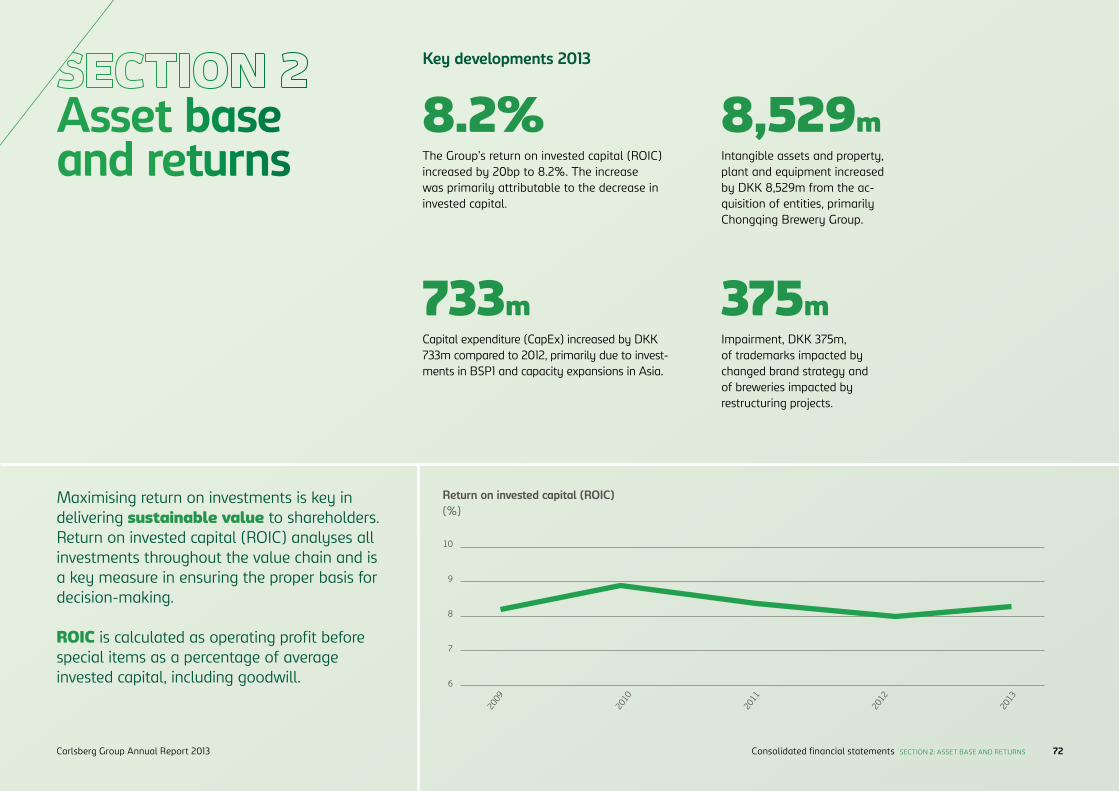
Asset base and returns
8.2%
733m
Key developments 2013
The Group’s return on invested capital (ROIC) increased by 20bp to 8.2%. The increase was primarily attributable to the decrease in invested capital.
Capital expenditure (CapEx) increased by DKK 733m compared to 2012, primarily due to invest-ments in BSP1 and capacity expansions in Asia.
Maximising return on investments is key in delivering sustainable value to shareholders. Return on invested capital (ROIC) analyses all investments throughout the value chain and is a key measure in ensuring the proper basis for decision-making.
ROIC is calculated as operating profit before special items as a percentage of average invested capital, including goodwill.
Return on invested capital (ROIC)(%)
8,529m
375m
Intangible assets and property, plant and equipment increased by DKK 8,529m from the ac-quisition of entities, primarily Chongqing Brewery Group.
Impairment, DKK 375m, of trademarks impacted by changed brand strategy and of breweries impacted by restructuring projects.
10
9
8
7
6
2011
2013
2010
2009
2012
Consolidated financial statements SECTION 2: ASSET BASE AND RETURNS 72Carlsberg Group Annual Report 2013
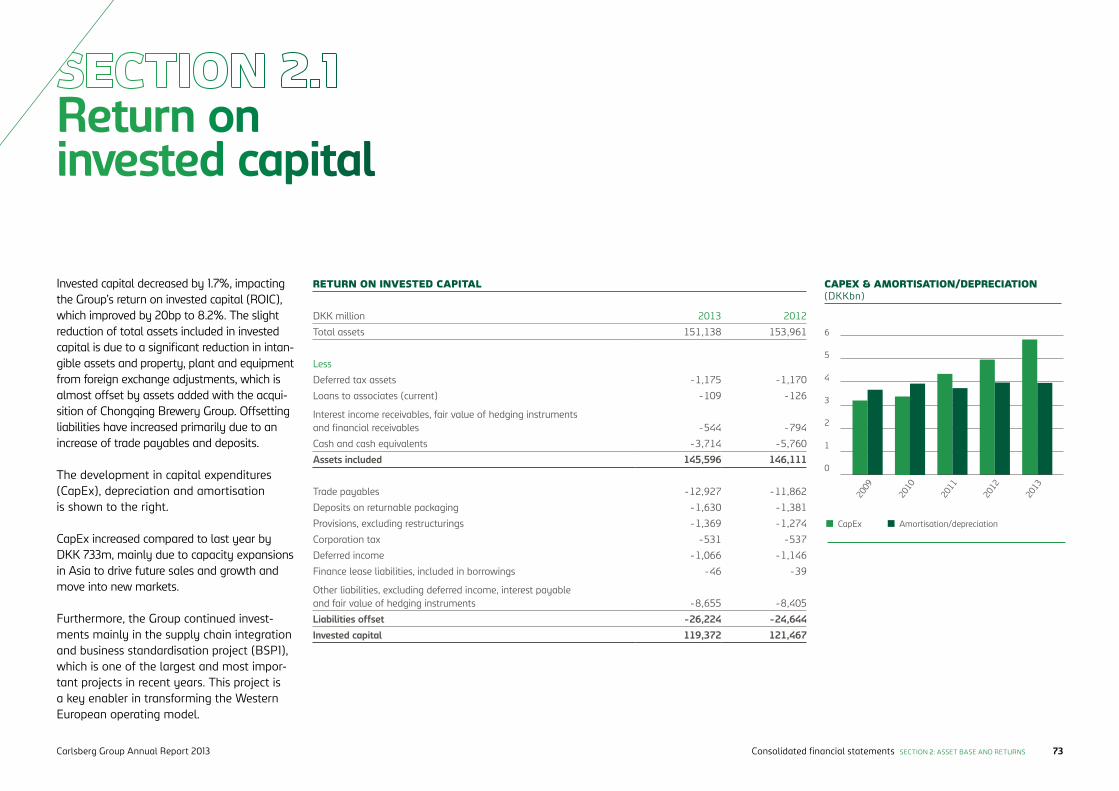
Invested capital decreased by 1.7%, impacting the Group’s return on invested capital (ROIC), which improved by 20bp to 8.2%. The slight reduction of total assets included in invested capital is due to a significant reduction in intan-gible assets and property, plant and equipment from foreign exchange adjustments, which is almost offset by assets added with the acqui-sition of Chongqing Brewery Group. Offsetting liabilities have increased primarily due to an increase of trade payables and deposits.
The development in capital expenditures (CapEx), depreciation and amortisation is shown to the right.
CapEx increased compared to last year by DKK 733m, mainly due to capacity expansions in Asia to drive future sales and growth and move into new markets.
Furthermore, the Group continued invest-ments mainly in the supply chain integration and business standardisation project (BSP1), which is one of the largest and most impor-tant projects in recent years. This project is a key enabler in transforming the Western European operating model.
Return on invested capital
RETURN ON INVESTED CAPITAL
DKK million 2013 2012
Total assets 151,138 153,961
Less
Deferred tax assets -1,175 -1,170
Loans to associates (current) -109 -126
Interest income receivables, fair value of hedging instruments and financial receivables -544 -794
Cash and cash equivalents -3,714 -5,760
Assets included 145,596 146,111
Trade payables -12,927 -11,862
Deposits on returnable packaging -1,630 -1,381
Provisions, excluding restructurings -1,369 -1,274
Corporation tax -531 -537
Deferred income -1,066 -1,146
Finance lease liabilities, included in borrowings -46 -39
Other liabilities, excluding deferred income, interest payable and fair value of hedging instruments -8,655 -8,405
Liabilities offset -26,224 -24,644Invested capital 119,372 121,467
6
5
4
3
2
1
0
CapEx Amortisation/depreciation
2011
2010
2012
2009
2013
CAPEX & AMORTISATION/DEPRECIATION (DKKbn)
Consolidated financial statements SECTION 2: ASSET BASE AND RETURNS 73Carlsberg Group Annual Report 2013
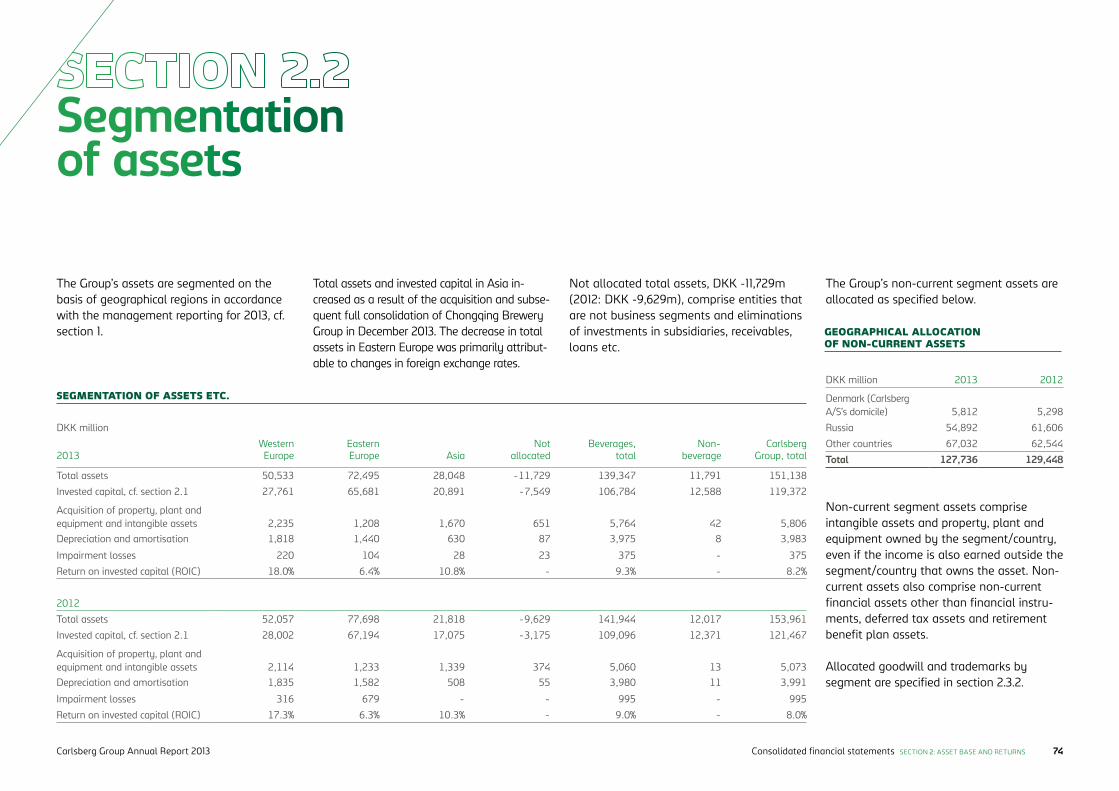
The Group’s assets are segmented on the basis of geographical regions in accordance with the management reporting for 2013, cf. section 1.
Segmentation of assets
DKK million
2013Western Europe
Eastern Europe Asia
Not allocated
Beverages, total
Non- beverage
Carlsberg Group, total
Total assets 50,533 72,495 28,048 -11,729 139,347 11,791 151,138
Invested capital, cf. section 2.1 27,761 65,681 20,891 -7,549 106,784 12,588 119,372
Acquisition of property, plant and equipment and intangible assets 2,235 1,208 1,670 651 5,764 42 5,806Depreciation and amortisation 1,818 1,440 630 87 3,975 8 3,983
Impairment losses 220 104 28 23 375 - 375
Return on invested capital (ROIC) 18.0% 6.4% 10.8% - 9.3% - 8.2%
2012
Total assets 52,057 77,698 21,818 -9,629 141,944 12,017 153,961
Invested capital, cf. section 2.1 28,002 67,194 17,075 -3,175 109,096 12,371 121,467
Acquisition of property, plant and equipment and intangible assets 2,114 1,233 1,339 374 5,060 13 5,073Depreciation and amortisation 1,835 1,582 508 55 3,980 11 3,991
Impairment losses 316 679 - - 995 - 995
Return on invested capital (ROIC) 17.3% 6.3% 10.3% - 9.0% - 8.0%
DKK million 2013 2012
Denmark (Carlsberg A/S’s domicile) 5,812 5,298
Russia 54,892 61,606
Other countries 67,032 62,544
Total 127,736 129,448
GEOGRAPHICAL ALLOCATION OF NON-CURRENT ASSETS
SEGMENTATION OF ASSETS ETC.
Total assets and invested capital in Asia in-creased as a result of the acquisition and subse-quent full consolidation of Chong qing Brewery Group in December 2013. The decrease in total assets in Eastern Europe was primarily attribut-able to changes in foreign exchange rates.
Not allocated total assets, DKK -11,729m (2012: DKK -9,629m), comprise entities that are not business segments and eliminations of investments in subsidiaries, receivables, loans etc.
The Group’s non-current segment assets are allocated as specified below.
Non-current segment assets comprise intangible assets and property, plant and equipment owned by the segment/country, even if the income is also earned outside the segment/country that owns the asset. Non-current assets also comprise non-current financial assets other than financial instru-ments, deferred tax assets and retirement benefit plan assets.
Allocated goodwill and trademarks by segment are specified in section 2.3.2.
Consolidated financial statements SECTION 2: ASSET BASE AND RETURNS 74Carlsberg Group Annual Report 2013
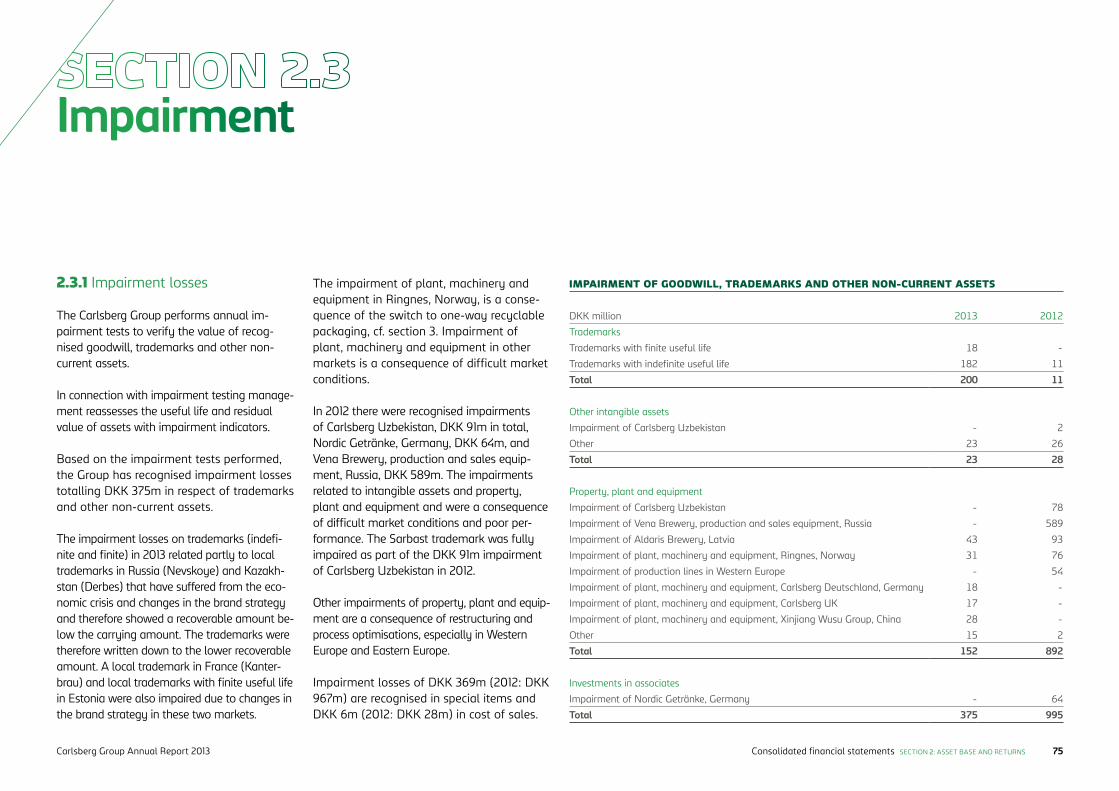
The Carlsberg Group performs annual im-pairment tests to verify the value of recog-nised goodwill, trademarks and other non-current assets.
In connection with impairment testing manage-ment reassesses the useful life and residual value of assets with impairment indicators.
Based on the impairment tests performed, the Group has recognised impairment losses totalling DKK 375m in respect of trademarks and other non-current assets.
The impairment losses on trademarks (indefi-nite and finite) in 2013 related partly to local trademarks in Russia (Nevskoye) and Kazakh-stan (Derbes) that have suffered from the eco-nomic crisis and changes in the brand strategy and therefore showed a recoverable amount be-low the carrying amount. The trademarks were therefore written down to the lower recoverable amount. A local trademark in France (Kanter-brau) and local trademarks with finite useful life in Estonia were also impaired due to changes in the brand strategy in these two markets.
Impairment
2.3.1 Impairment losses The impairment of plant, machinery and equipment in Ringnes, Norway, is a conse-quence of the switch to one-way recyclable packaging, cf. section 3. Impairment of plant, machinery and equipment in other markets is a consequence of difficult market conditions.
In 2012 there were recognised impairments of Carlsberg Uzbekistan, DKK 91m in total, Nordic Getränke, Germany, DKK 64m, and Vena Brewery, production and sales equip-ment, Russia, DKK 589m. The impairments related to intangible assets and property, plant and equipment and were a consequence of difficult market conditions and poor per-formance. The Sarbast trademark was fully impaired as part of the DKK 91m impairment of Carlsberg Uzbekistan in 2012.
Other impairments of property, plant and equip-ment are a consequence of restructuring and process optimisations, especially in Western Europe and Eastern Europe.
Impairment losses of DKK 369m (2012: DKK967m) are recognised in special items and DKK 6m (2012: DKK 28m) in cost of sales.
DKK million 2013 2012
Trademarks
Trademarks with finite useful life 18 -
Trademarks with indefinite useful life 182 11
Total 200 11
Other intangible assets
Impairment of Carlsberg Uzbekistan - 2
Other 23 26
Total 23 28
Property, plant and equipment
Impairment of Carlsberg Uzbekistan - 78
Impairment of Vena Brewery, production and sales equipment, Russia - 589
Impairment of Aldaris Brewery, Latvia 43 93
Impairment of plant, machinery and equipment, Ringnes, Norway 31 76
Impairment of production lines in Western Europe - 54
Impairment of plant, machinery and equipment, Carlsberg Deutschland, Germany 18 -
Impairment of plant, machinery and equipment, Carlsberg UK 17 -
Impairment of plant, machinery and equipment, Xinjiang Wusu Group, China 28 -
Other 15 2
Total 152 892
Investments in associates
Impairment of Nordic Getränke, Germany - 64
Total 375 995
IMPAIRMENT OF GOODWILL, TRADEMARKS AND OTHER NON-CURRENT ASSETS
Consolidated financial statements SECTION 2: ASSET BASE AND RETURNS 75Carlsberg Group Annual Report 2013

The impairment test of goodwill is per-formed for Western Europe and Eastern Europe, while entities in Asia are tested at sub-regional levels. Entities that are less integrated in regions or sub-regions are tested at individual entity level.
Management of the Group is centralised and driven through the regional manage-ments, which are responsible for perfor-mance, investments and growth initiatives in their respective regions. The management structure and responsibilities support and promote optimisations across countries focusing on the Group or region as a whole and not just on the specific country. Changes in procurement and sourcing between coun-tries increase intra-Group trade/transactions, which will also have an increasing impact on the allocation of profits.
Trademarks are impairment-tested individu-ally at Group level. The carrying amount of trademarks which have an indefinite useful life and therefore are not amortised was DKK 32,191m (2012: DKK 35,395m) at 31 De-cember 2013, equivalent to 98% (2012: 99%) of the capitalised trademarks. Management assesses that the value of these trademarks
SECTION 2.3 Impairment
DKK million 2013 % 2012 %
Western Europe
Western Europe excl. Unicer-Bebidas de Portugal 20,238 35% 20,275 38%
Unicer-Bebidas de Portugal 536 1% 536 1%
Eastern Europe
Eastern Europe 23,865 42% 26,378 49%
Asia
Greater China and Malaysia 1,869 3% 2,187 4%
Chongqing Brewery Group 6,166 11% - 0%
Indochina 3,844 7% 3,936 7%
India 211 0% 247 0%
Nepal 303 1% 355 1%
Total 57,032 100% 53,914 100%
DKK million 2013 % 2012 %
Western Europe 6,325 20% 6,411 19%
Eastern Europe 25,381 79% 28,479 80%
Asia 485 1% 505 1%
Total 32,191 100% 35,395 100%
2.3.2 Impairment test of goodwill and trademarks
GOODWILL
TRADEMARKS WITH INDEFINITE USEFUL LIFE
can be maintained for an indefinite period, as these are well-established trademarks in the markets concerned and these markets are expected to be profitable in the long term. In the opinion of management, there is only a minimal risk of the current situa-tion in the markets reducing the useful life of these trademarks, primarily due to the respective market share in each market and the current and planned marketing efforts, which are helping to maintain and increase the value of these trademarks.
For the Group’s cash-generating units, the carrying amount of goodwill and trademarks with indefinite useful life at 31 December is summarised to the right.
Goodwill and trademarks with indefinite use-ful life related to Baltika Breweries (Russia), Brasseries Kronenbourg (France) and the acquisition of the 40% non-controlling inter-est in Carlsberg Breweries A/S each comprise 10% or more of the total carrying amount of goodwill and trademarks with an indefinite useful life at 31 December 2013.
Consolidated financial statements SECTION 2: ASSET BASE AND RETURNS 76Carlsberg Group Annual Report 2013
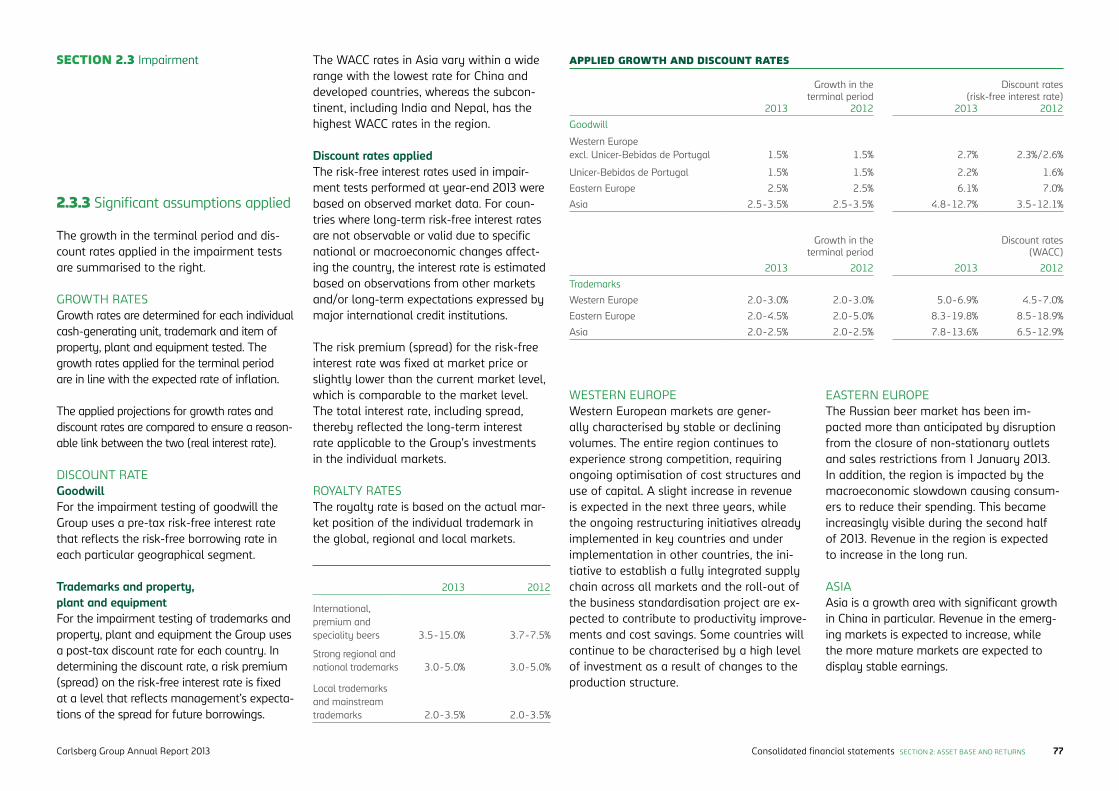
The growth in the terminal period and dis-count rates applied in the impairment tests are summarised to the right.
GROWTH RATES Growth rates are determined for each indi vidual cash-generating unit, trademark and item of property, plant and equipment tested. The growth rates applied for the terminal period are in line with the expected rate of inflation.
The applied projections for growth rates and discount rates are compared to ensure a reason-able link between the two (real interest rate).
DISCOUNT RATEGoodwill For the impairment testing of goodwill the Group uses a pre-tax risk-free interest rate that reflects the risk-free borrowing rate in each particular geographical segment.
Trademarks and property, plant and equipment For the impairment testing of trademarks and property, plant and equipment the Group uses a post-tax discount rate for each country. In determining the discount rate, a risk premium (spread) on the risk-free interest rate is fixed at a level that reflects management’s expecta-tions of the spread for future borrowings.
SECTION 2.3 Impairment
2.3.3 Significant assumptions applied
The WACC rates in Asia vary within a wide range with the lowest rate for China and developed countries, whereas the subcon-tinent, including India and Nepal, has the highest WACC rates in the region.
Discount rates appliedThe risk-free interest rates used in impair-ment tests performed at year-end 2013 were based on observed market data. For coun-tries where long-term risk-free interest rates are not observable or valid due to specific national or macroeconomic changes affect-ing the country, the interest rate is estimated based on observations from other markets and/or long-term expectations expressed by major international credit institutions.
The risk premium (spread) for the risk-free interest rate was fixed at market price or slightly lower than the current market level, which is comparable to the market level. The total interest rate, including spread, thereby reflected the long-term interest rate applicable to the Group’s investments in the individual markets.
ROYALTY RATES The royalty rate is based on the actual mar-ket position of the individual trademark in the global, regional and local markets.
WESTERN EUROPEWestern European markets are gener-ally characterised by stable or declining volumes. The entire region continues to experience strong competition, requiring ongoing optimisation of cost structures and use of capital. A slight increase in revenue is expected in the next three years, while the ongoing restructuring initiatives already implemented in key countries and under implementation in other countries, the ini-tiative to establish a fully integrated supply chain across all markets and the roll-out of the business standardisation project are ex-pected to contribute to productivity improve-ments and cost savings. Some countries will continue to be characterised by a high level of investment as a result of changes to the production structure.
EASTERN EUROPEThe Russian beer market has been im-pacted more than anticipated by disruption from the closure of non-stationary outlets and sales restrictions from 1 January 2013. In addition, the region is impacted by the macroeconomic slowdown causing consum-ers to reduce their spending. This became increasingly visible during the second half of 2013. Revenue in the region is expected to increase in the long run.
ASIAAsia is a growth area with significant growth in China in particular. Revenue in the emerg-ing markets is expected to increase, while the more mature markets are expected to display stable earnings.
Growth in the terminal period
Discount rates (risk-free interest rate)
2013 2012 2013 2012
Goodwill
Western Europe excl. Unicer-Bebidas de Portugal 1.5% 1.5% 2.7% 2.3%/2.6%
Unicer-Bebidas de Portugal 1.5% 1.5% 2.2% 1.6%
Eastern Europe 2.5% 2.5% 6.1% 7.0%
Asia 2.5-3.5% 2.5-3.5% 4.8-12.7% 3.5-12.1%
Growth in the terminal period
Discount rates (WACC)
2013 2012 2013 2012
Trademarks
Western Europe 2.0-3.0% 2.0-3.0% 5.0-6.9% 4.5-7.0%
Eastern Europe 2.0-4.5% 2.0-5.0% 8.3-19.8% 8.5-18.9%
Asia 2.0-2.5% 2.0-2.5% 7.8-13.6% 6.5-12.9%
2013 2012
International, premium and speciality beers 3.5-15.0% 3.7-7.5%
Strong regional and national trademarks 3.0-5.0% 3.0-5.0%
Local trademarks and mainstream trademarks 2.0-3.5% 2.0-3.5%
APPLIED GROWTH AND DISCOUNT RATES
Consolidated financial statements SECTION 2: ASSET BASE AND RETURNS 77Carlsberg Group Annual Report 2013
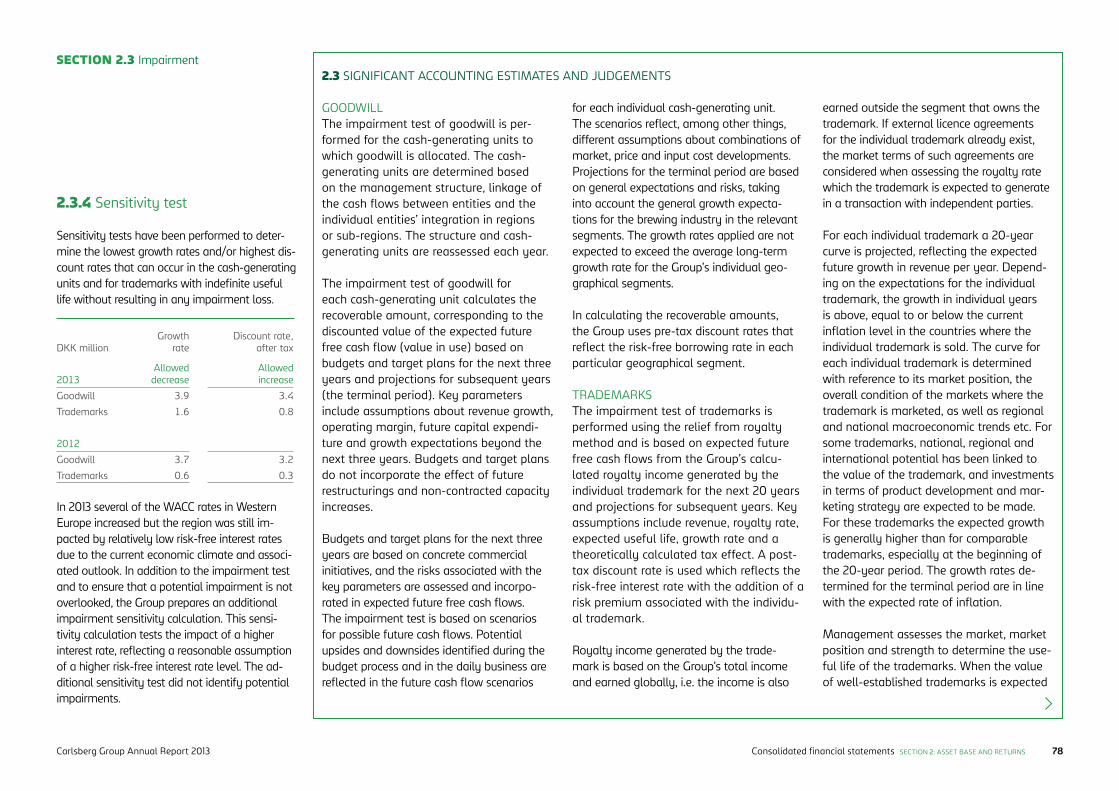
SECTION 2.3 Impairment
2.3.4 Sensitivity test
Sensitivity tests have been performed to de ter -mine the lowest growth rates and/or highest dis-count rates that can occur in the cash-genera ting units and for trademarks with indefinite useful life without resulting in any impairment loss.
DKK millionGrowth
rateDiscount rate,
after tax
2013Allowed decrease
Allowed increase
Goodwill 3.9 3.4
Trademarks 1.6 0.8
2012
Goodwill 3.7 3.2
Trademarks 0.6 0.3
2.3 SIGNIFICANT ACCOUNTING ESTIMATES AND JUDGEMENTS
GOODWILLThe impairment test of goodwill is per-formed for the cash-generating units to which goodwill is allocated. The cash- generating units are determined based on the management structure, linkage of the cash flows between entities and the individual entities’ integration in regions or sub-regions. The structure and cash-generating units are reassessed each year.
The impairment test of goodwill for each cash-generating unit calculates the recoverable amount, corresponding to the discounted value of the expected future free cash flow (value in use) based on budgets and target plans for the next three years and projections for subsequent years (the terminal period). Key parameters include assumptions about revenue growth, operating margin, future capital expendi-ture and growth expectations beyond the next three years. Budgets and target plans do not incorporate the effect of future restructurings and non-contracted capacity increases.
Budgets and target plans for the next three years are based on concrete commercial initiatives, and the risks associated with the key parameters are assessed and incorpo-rated in expected future free cash flows. The impairment test is based on scenarios for possible future cash flows. Potential upsides and downsides identified during the budget process and in the daily business are reflected in the future cash flow scenarios
for each individual cash-generating unit. The scenarios reflect, among other things, different assumptions about combinations of market, price and input cost developments. Projections for the terminal period are based on general expectations and risks, taking into account the general growth expecta-tions for the brewing industry in the relevant segments. The growth rates applied are not expected to exceed the average long-term growth rate for the Group’s individual geo-graphical segments.
In calculating the recoverable amounts, the Group uses pre-tax discount rates that reflect the risk-free borrowing rate in each particular geographical segment.
TRADEMARKSThe impairment test of trademarks is performed using the relief from royalty method and is based on expected future free cash flows from the Group’s calcu-lated royalty income generated by the individual trademark for the next 20 years and projections for subsequent years. Key assumptions include revenue, royalty rate, expected useful life, growth rate and a theoretically calculated tax effect. A post-tax discount rate is used which reflects the risk-free interest rate with the addition of a risk premium associated with the individu-al trademark.
Royalty income generated by the trade-mark is based on the Group’s total income and earned globally, i.e. the income is also
earned outside the segment that owns the trademark. If external licence agreements for the individual trademark already exist, the market terms of such agreements are considered when assessing the royalty rate which the trademark is expected to generate in a transaction with independent parties.
For each individual trademark a 20-year curve is projected, reflecting the expected future growth in revenue per year. Depend-ing on the expectations for the individual trademark, the growth in individual years is above, equal to or below the current inflation level in the countries where the individual trademark is sold. The curve for each individual trademark is determined with reference to its market position, the overall condition of the markets where the trademark is marketed, as well as regional and national macroeconomic trends etc. For some trademarks, national, regional and international potential has been linked to the value of the trademark, and investments in terms of product development and mar-keting strategy are expected to be made. For these trademarks the expected growth is generally higher than for comparable trademarks, especially at the beginning of the 20-year period. The growth rates de-termined for the terminal period are in line with the expected rate of inflation.
Management assesses the market, market position and strength to determine the use-ful life of the trademarks. When the value of well-established trademarks is expected
In 2013 several of the WACC rates in Western Europe increased but the region was still im-pacted by relatively low risk-free interest rates due to the current economic climate and associ-ated outlook. In addition to the impairment test and to ensure that a potential impairment is not overlooked, the Group prepares an additional impairment sensitivity calculation. This sensi-tivity calculation tests the impact of a higher interest rate, reflecting a reasonable assumption of a higher risk-free interest rate level. The ad-ditional sensitivity test did not identify potential impairments.
Consolidated financial statements SECTION 2: ASSET BASE AND RETURNS 78Carlsberg Group Annual Report 2013
SECTION 2.3 Impairment
to be maintained for an indefinite period in the relevant markets, and these markets are expected to be profitable for a long period, the useful life of the trademark is determined to be indefinite.
The tax rate is the expected future tax rate in each country based on current legislation. The impairment test at year-end 2013 incor-porated tax rates in the range of 15-34%.
The discount rate is an after-tax WACC cal-culated country by country based on long-term expectations for each trademark.
PROPERTY, PLANT AND EQUIPMENTProperty, plant and equipment are impair-ment-tested when there are indications of impairment. Management performs an annual assessment of the assets’ future application, e.g. in relation to changes in production structure, restructurings or closing of breweries. The impairment test is based on budgeted and estimated cash flows from the cash-generating unit. The assessment is based on the lowest cash-generating unit affected by the changes that indicate impair-ment. The discount rate is an after-tax WACC
that reflects the risk-free interest rate with the addition of a risk premium associated with the particular asset.
ASSOCIATESManagement performs an impairment test of investments in associates when there are indications of impairment, e.g. due to loss-making activities or major changes in the business environment. The impairment test is based on budgeted and estimated cash flows from the associate and related assets which form an integrated cash-generating unit. The pre-tax discount rate reflects the risk-free interest rate with the addition of a risk premium associated with the particular investments.
2.3 SIGNIFICANT ACCOUNTING ESTIMATES AND JUDGEMENTS (CONTINUED) 2.3 ACCOUNTING POLICIES
Goodwill and trademarks with indefinite useful life are subject to an annual impairment test, initially before the end of the acquisition year.
The carrying amount of goodwill is tested for impairment annually, together with the other non-current assets in the cash-generating unit to which goodwill is allocated. The recoverable amount is generally calculated as the present value of expected future net cash flows (value in use) from the entity or activity (cash-generating unit) to which the goodwill is allocated.
The carrying amount of trademarks with indefinite useful life is subject to an annual impairment test. The recoverable amount is generally calculated as the present value of expected future net cash flows from the trademark in the form of royalties (the relief from royalty method).
The carrying amount of other non-current assets is subject to an annual test for indications of impair-ment. When there is an indication that assets may be impaired, the recoverable amount of the asset is determined. The impairment test is performed for the individual asset or in combination with related assets which form an integrated cash-generating unit. The recoverable amount is the higher of an asset’s fair value less expected costs to sell and its value in use. Value in use is the present value of the future cash flows expected to be derived from an asset or the cash-generating unit to which the asset belongs.
An impairment loss is recognised if the carrying amount of an asset or its cash-generating unit exceeds the recoverable amount of the asset or the cash-generating unit. Impairment of goodwill, trademarks and significant impairment losses on property, plant and equipment and associates, and impairment losses arising on extensive struc-turing of processes and fundamental structural adjustments are recognised under special items. Minor impairment losses are recognised in the income statement under cost of sales, sales and distribution expenses, administrative expenses or other operating activities, net.
Impairment of goodwill is not reversed. Impair-ment of other assets is reversed only to the extent of changes in the assumptions and estimates underlying the impairment calculation. Impairment is only reversed to the extent that the asset’s new carrying amount does not exceed the carrying amount of the asset after amortisation/deprecia-tion had the asset not been impaired.
Consolidated financial statements SECTION 2: ASSET BASE AND RETURNS 79Carlsberg Group Annual Report 2013
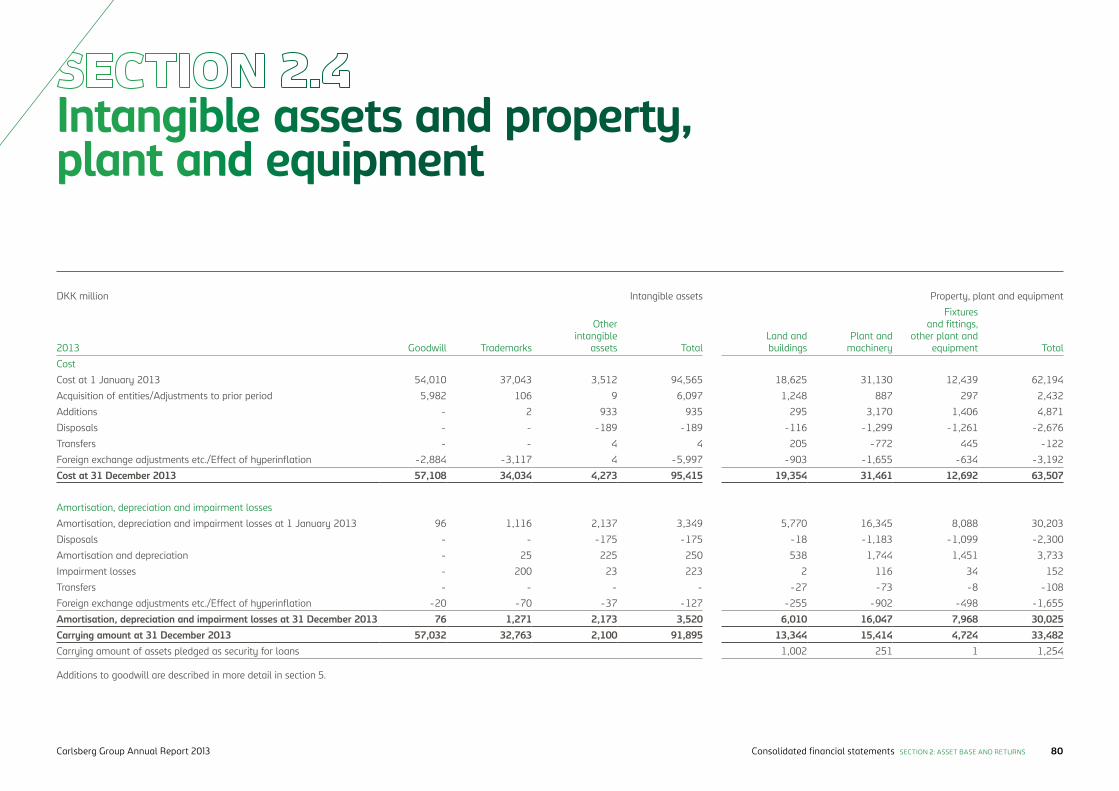
Intangible assets and property, plant and equipment
DKK million Intangible assets Property, plant and equipment
2013 Goodwill Trademarks
Other intangible
assets TotalLand and buildings
Plant and machinery
Fixtures and fittings,
other plant and equipment Total
Cost
Cost at 1 January 2013 54,010 37,043 3,512 94,565 18,625 31,130 12,439 62,194
Acquisition of entities/Adjustments to prior period 5,982 106 9 6,097 1,248 887 297 2,432
Additions - 2 933 935 295 3,170 1,406 4,871
Disposals - - -189 -189 -116 -1,299 -1,261 -2,676
Transfers - - 4 4 205 -772 445 -122
Foreign exchange adjustments etc./Effect of hyperinflation -2,884 -3,117 4 -5,997 -903 -1,655 -634 -3,192
Cost at 31 December 2013 57,108 34,034 4,273 95,415 19,354 31,461 12,692 63,507
Amortisation, depreciation and impairment losses
Amortisation, depreciation and impairment losses at 1 January 2013 96 1,116 2,137 3,349 5,770 16,345 8,088 30,203
Disposals - - -175 -175 -18 -1,183 -1,099 -2,300
Amortisation and depreciation - 25 225 250 538 1,744 1,451 3,733
Impairment losses - 200 23 223 2 116 34 152
Transfers - - - - -27 -73 -8 -108
Foreign exchange adjustments etc./Effect of hyperinflation -20 -70 -37 -127 -255 -902 -498 -1,655
Amortisation, depreciation and impairment losses at 31 December 2013 76 1,271 2,173 3,520 6,010 16,047 7,968 30,025Carrying amount at 31 December 2013 57,032 32,763 2,100 91,895 13,344 15,414 4,724 33,482Carrying amount of assets pledged as security for loans 1,002 251 1 1,254
Additions to goodwill are described in more detail in section 5.
Consolidated financial statements SECTION 2: ASSET BASE AND RETURNS 80Carlsberg Group Annual Report 2013
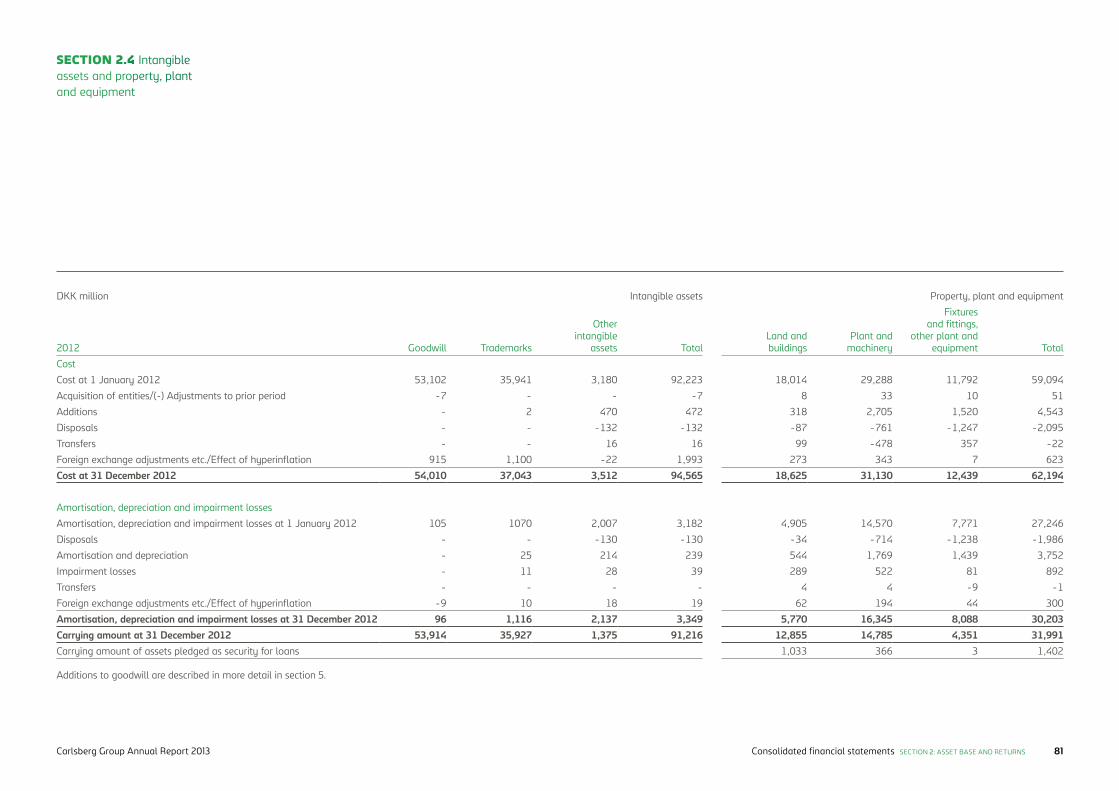
SECTION 2.4 Intangible assets and property, plant and equipment
DKK million Intangible assets Property, plant and equipment
2012 Goodwill Trademarks
Other intangible
assets TotalLand and buildings
Plant and machinery
Fixtures and fittings,
other plant and equipment Total
Cost
Cost at 1 January 2012 53,102 35,941 3,180 92,223 18,014 29,288 11,792 59,094
Acquisition of entities/(-) Adjustments to prior period -7 - - -7 8 33 10 51
Additions - 2 470 472 318 2,705 1,520 4,543
Disposals - - -132 -132 -87 -761 -1,247 -2,095
Transfers - - 16 16 99 -478 357 -22
Foreign exchange adjustments etc./Effect of hyperinflation 915 1,100 -22 1,993 273 343 7 623
Cost at 31 December 2012 54,010 37,043 3,512 94,565 18,625 31,130 12,439 62,194
Amortisation, depreciation and impairment losses
Amortisation, depreciation and impairment losses at 1 January 2012 105 1070 2,007 3,182 4,905 14,570 7,771 27,246
Disposals - - -130 -130 -34 -714 -1,238 -1,986
Amortisation and depreciation - 25 214 239 544 1,769 1,439 3,752
Impairment losses - 11 28 39 289 522 81 892
Transfers - - - - 4 4 -9 -1
Foreign exchange adjustments etc./Effect of hyperinflation -9 10 18 19 62 194 44 300
Amortisation, depreciation and impairment losses at 31 December 2012 96 1,116 2,137 3,349 5,770 16,345 8,088 30,203Carrying amount at 31 December 2012 53,914 35,927 1,375 91,216 12,855 14,785 4,351 31,991Carrying amount of assets pledged as security for loans 1,033 366 3 1,402
Additions to goodwill are described in more detail in section 5.
Consolidated financial statements SECTION 2: ASSET BASE AND RETURNS 81Carlsberg Group Annual Report 2013
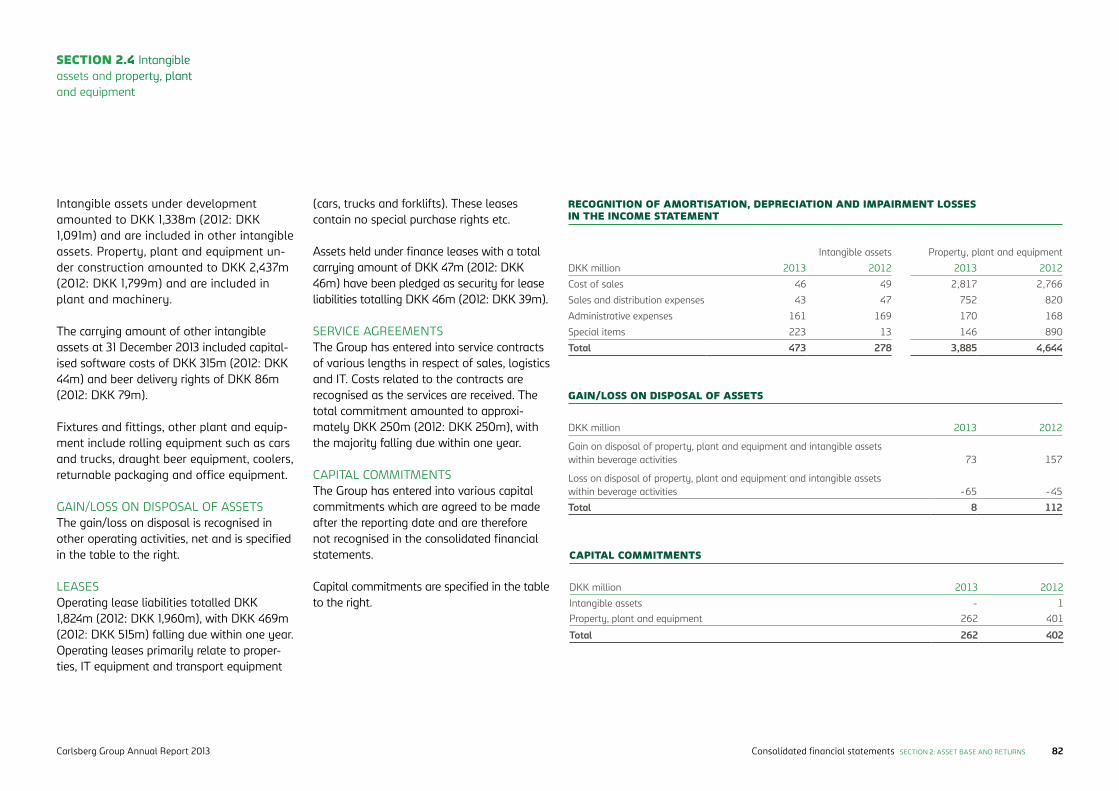
Intangible assets under development amounted to DKK 1,338m (2012: DKK 1,091m) and are included in other intangible assets. Property, plant and equipment un-der construction amounted to DKK 2,437m (2012: DKK 1,799m) and are included in plant and machinery.
The carrying amount of other intangible assets at 31 December 2013 included capital-ised software costs of DKK 315m (2012: DKK 44m) and beer delivery rights of DKK 86m (2012: DKK 79m).
Fixtures and fittings, other plant and equip-ment include rolling equipment such as cars and trucks, draught beer equipment, coolers, returnable packaging and office equipment.
GAIN/LOSS ON DISPOSAL OF ASSETSThe gain/loss on disposal is recognised in other operating activities, net and is specified in the table to the right.
LEASES Operating lease liabilities totalled DKK 1,824m (2012: DKK 1,960m), with DKK 469m (2012: DKK 515m) falling due within one year. Operating leases primarily relate to proper-ties, IT equipment and transport equipment
(cars, trucks and forklifts). These leases contain no special purchase rights etc.
Assets held under finance leases with a total carrying amount of DKK 47m (2012: DKK 46m) have been pledged as security for lease liabilities totalling DKK 46m (2012: DKK 39m).
SERVICE AGREEMENTS The Group has entered into service contracts of various lengths in respect of sales, logistics and IT. Costs related to the contracts are recognised as the services are received. The total commitment amounted to approxi-mately DKK 250m (2012: DKK 250m), with the majority falling due within one year.
CAPITAL COMMITMENTS The Group has entered into various capital commitments which are agreed to be made after the reporting date and are therefore not recognised in the consolidated financial statements.
Capital commitments are specified in the table to the right.
Intangible assets Property, plant and equipment
DKK million 2013 2012 2013 2012
Cost of sales 46 49 2,817 2,766
Sales and distribution expenses 43 47 752 820
Administrative expenses 161 169 170 168
Special items 223 13 146 890
Total 473 278 3,885 4,644
DKK million 2013 2012
Gain on disposal of property, plant and equipment and intangible assets within beverage activities 73 157
Loss on disposal of property, plant and equipment and intangible assets within beverage activities -65 -45
Total 8 112
RECOGNITION OF AMORTISATION, DEPRECIATION AND IMPAIRMENT LOSSES IN THE INCOME STATEMENT
GAIN/LOSS ON DISPOSAL OF ASSETS
DKK million 2013 2012
Intangible assets - 1Property, plant and equipment 262 401
Total 262 402
CAPITAL COMMITMENTS
SECTION 2.4 Intangible assets and property, plant and equipment
Consolidated financial statements SECTION 2: ASSET BASE AND RETURNS 82Carlsberg Group Annual Report 2013
2.4 SIGNIFICANT ACCOUNTING ESTIMATES AND JUDGEMENTS
USEFUL LIFE AND RESIDUAL VALUE OF INTANGIBLE ASSETS WITH FINITE USEFUL LIFE AND PROPERTY, PLANT AND EQUIPMENT Useful life and residual value are initially assessed both in acquisitions and in busi-ness combinations, cf. section 5. The value of the trademarks acquired and their ex-pected useful life are assessed based on the trademarks’ market position, expected long-term developments in the relevant markets and the trademarks’ profitability.
Management assesses trademarks and property, plant and equipment for changes in useful life. When there is an indication of a reduction in the value or useful life, the asset is tested for impairment and is written down if necessary, or the amortisation/deprecia-tion period is reassessed and if necessary adjusted in line with the asset’s changed useful life.
Reassessment of the expected future use is as a minimum made in connection with an evaluation of changes in production struc-ture, restructuring and brewery closures. The expected future use and residual values may
not be realised, which will require reassess-ment of useful life and residual value and recognition of impairment losses or losses on disposal of non-current assets.
When changing the amortisation or depre-ciation period due to a change in the useful life, the effect on the amortisation/deprecia-tion is recognised prospectively as a change in accounting estimates.
The Group has entered into a number of leases and service contracts. When enter-ing into these agreements, management considers the substance of the service being rendered in order to classify the agreement as either a lease or a service contract. In making this judgement, particular impor-tance is attached to whether fulfilment of the agreement depends on the use of specific assets. The Group assesses whether contracts are onerous by determining only the direct variable costs and not the costs that relate to the business as a whole.
For leases, an assessment is made as to whether the lease is a finance lease or an operating lease. The Group has mainly en-
tered into operating leases for standardised assets with a short duration relative to the life of the assets, and accordingly the leases are classified as operating leases.
Leases are classified as finance leases if they transfer substantially all the risks and rewards incident to ownership to the lessee. All other leases are classified as operating leases.
Significant accounting estimates and judge-ments related to impairment are described above, cf. section 2.3.
SECTION 2.4 Intangible assets and property, plant and equipment
Consolidated financial statements SECTION 2: ASSET BASE AND RETURNS 83Carlsberg Group Annual Report 2013
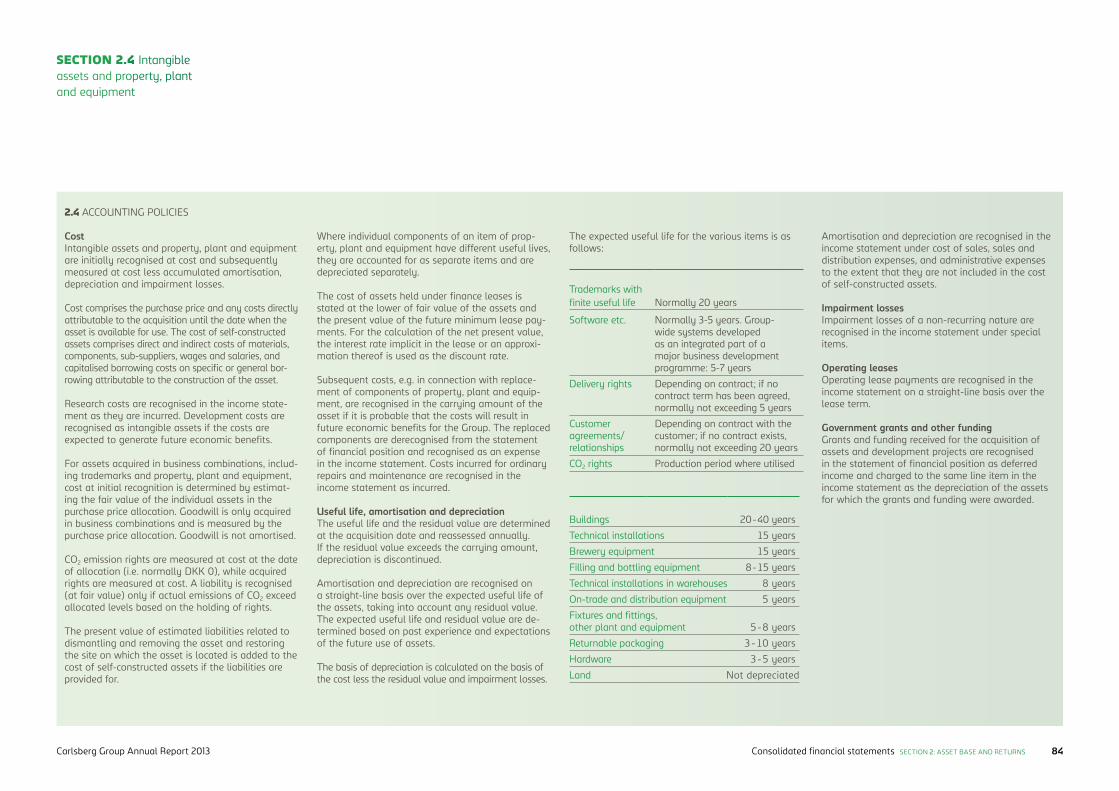
2.4 ACCOUNTING POLICIES
Cost Intangible assets and property, plant and equipment are initially recognised at cost and subsequently measured at cost less accumulated amortisation, depreciation and impairment losses.
Cost comprises the purchase price and any costs directly attributable to the acquisition until the date when the asset is available for use. The cost of self-constructed assets comprises direct and indirect costs of materials, components, sub-suppliers, wages and salaries, and capitalised borrowing costs on specific or general bor-rowing attributable to the construction of the asset.
Research costs are recognised in the income state-ment as they are incurred. Development costs are recognised as intangible assets if the costs are expected to generate future economic benefits.
For assets acquired in business combinations, includ-ing trademarks and property, plant and equipment, cost at initial recognition is determined by estimat-ing the fair value of the individual assets in the purchase price allocation. Goodwill is only acquired in business combinations and is measured by the purchase price allocation. Goodwill is not amortised.
CO2 emission rights are measured at cost at the date of allocation (i.e. normally DKK 0), while acquired rights are measured at cost. A liability is recognised (at fair value) only if actual emissions of CO2 exceed allocated levels based on the holding of rights.
The present value of estimated liabilities related to dismantling and removing the asset and restoring the site on which the asset is located is added to the cost of self-constructed assets if the liabilities are provided for.
Where individual components of an item of prop-erty, plant and equipment have different useful lives, they are accounted for as separate items and are depreciated separately.
The cost of assets held under finance leases is stated at the lower of fair value of the assets and the present value of the future minimum lease pay-ments. For the calculation of the net present value, the interest rate implicit in the lease or an approxi-mation thereof is used as the discount rate.
Subsequent costs, e.g. in connection with replace-ment of components of property, plant and equip-ment, are recognised in the carrying amount of the asset if it is probable that the costs will result in future economic benefits for the Group. The replaced components are derecognised from the statement of financial position and recognised as an expense in the income statement. Costs incurred for ordinary repairs and maintenance are recognised in the income statement as incurred.
Useful life, amortisation and depreciation The useful life and the residual value are determined at the acquisition date and reassessed annually. If the residual value exceeds the carrying amount, depreciation is discontinued.
Amortisation and depreciation are recognised on a straight-line basis over the expected useful life of the assets, taking into account any residual value. The expected useful life and residual value are de-termined based on past experience and expectations of the future use of assets.
The basis of depreciation is calculated on the basis of the cost less the residual value and impairment losses.
The expected useful life for the various items is as follows:
Trademarks with finite useful life Normally 20 years
Software etc. Normally 3-5 years. Group-wide systems developed as an integrated part of a major business development programme: 5-7 years
Delivery rights Depending on contract; if no contract term has been agreed, normally not exceeding 5 years
Customer agreements/ relationships
Depending on contract with the customer; if no contract exists, normally not exceeding 20 years
CO2 rights Production period where utilised
Buildings 20-40 years
Technical installations 15 years
Brewery equipment 15 years
Filling and bottling equipment 8-15 years
Technical installations in warehouses 8 years
On-trade and distribution equipment 5 years
Fixtures and fittings, other plant and equipment 5-8 years
Returnable packaging 3-10 years
Hardware 3-5 years
Land Not depreciated
Amortisation and depreciation are recognised in the income statement under cost of sales, sales and distribution expenses, and administrative expenses to the extent that they are not included in the cost of self-constructed assets.
Impairment losses Impairment losses of a non-recurring nature are recognised in the income statement under special items.
Operating leases Operating lease payments are recognised in the income statement on a straight-line basis over the lease term.
Government grants and other funding Grants and funding received for the acquisition of assets and development projects are recognised in the statement of financial position as deferred income and charged to the same line item in the income statement as the depreciation of the assets for which the grants and funding were awarded.
SECTION 2.4 Intangible assets and property, plant and equipment
Consolidated financial statements SECTION 2: ASSET BASE AND RETURNS 84Carlsberg Group Annual Report 2013
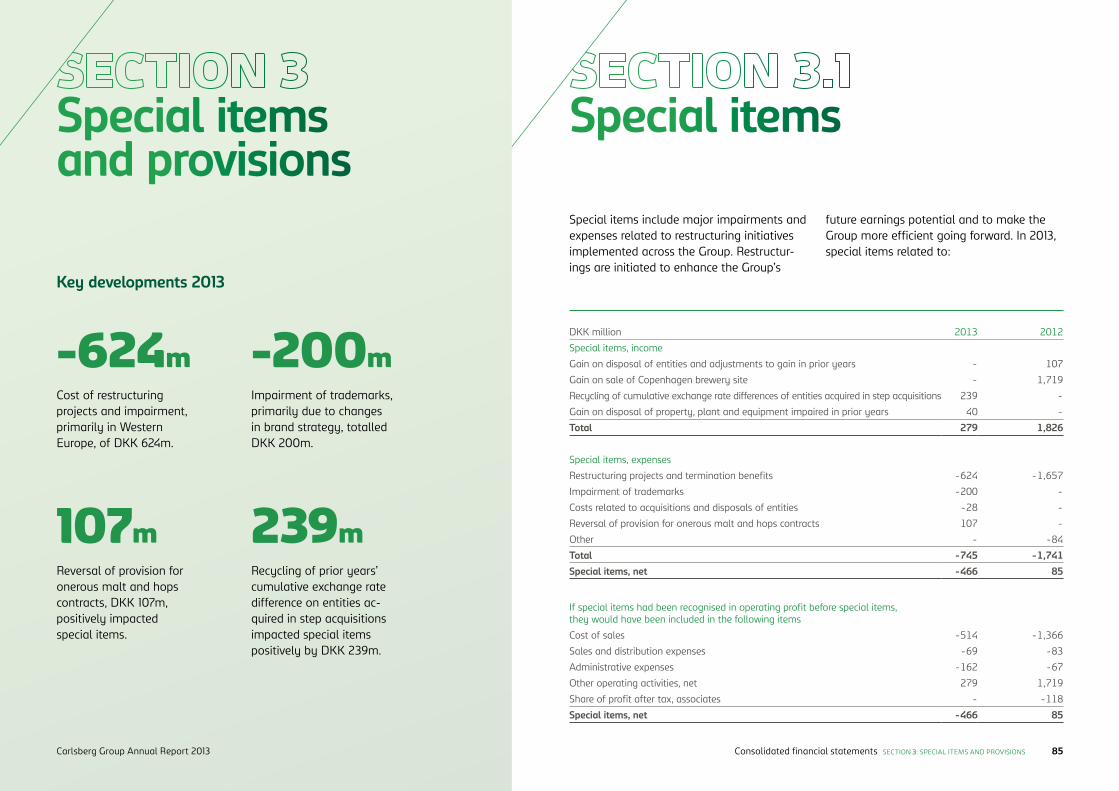
Special items Special items and provisions
107m 239mReversal of provision for onerous malt and hops contracts, DKK 107m, positively impacted special items.
Recycling of prior years’ cumulative exchange rate difference on entities ac-quired in step acquisitions impacted special items positively by DKK 239m.
-624mCost of restructuring projects and impairment, primarily in Western Europe, of DKK 624m.
-200mImpairment of trademarks, primarily due to changes in brand strategy, totalled DKK 200m.
Special items include major impairments and expenses related to restructuring initiatives implemented across the Group. Restructur-ings are initiated to enhance the Group’s
DKK million 2013 2012
Special items, income
Gain on disposal of entities and adjustments to gain in prior years - 107
Gain on sale of Copenhagen brewery site - 1,719
Recycling of cumulative exchange rate differences of entities acquired in step acquisitions 239 -
Gain on disposal of property, plant and equipment impaired in prior years 40 -
Total 279 1,826
Special items, expenses
Restructuring projects and termination benefits -624 -1,657
Impairment of trademarks -200 -
Costs related to acquisitions and disposals of entities -28 -
Reversal of provision for onerous malt and hops contracts 107 -
Other - -84
Total -745 -1,741Special items, net -466 85
If special items had been recognised in operating profit before special items, they would have been included in the following items
Cost of sales -514 -1,366
Sales and distribution expenses -69 -83
Administrative expenses -162 -67
Other operating activities, net 279 1,719
Share of profit after tax, associates - -118
Special items, net -466 85
future earnings potential and to make the Group more efficient going forward. In 2013, special items related to:
Key developments 2013
Consolidated financial statements SECTION 3: SPECIAL ITEMS AND PROVISIONS 85Carlsberg Group Annual Report 2013
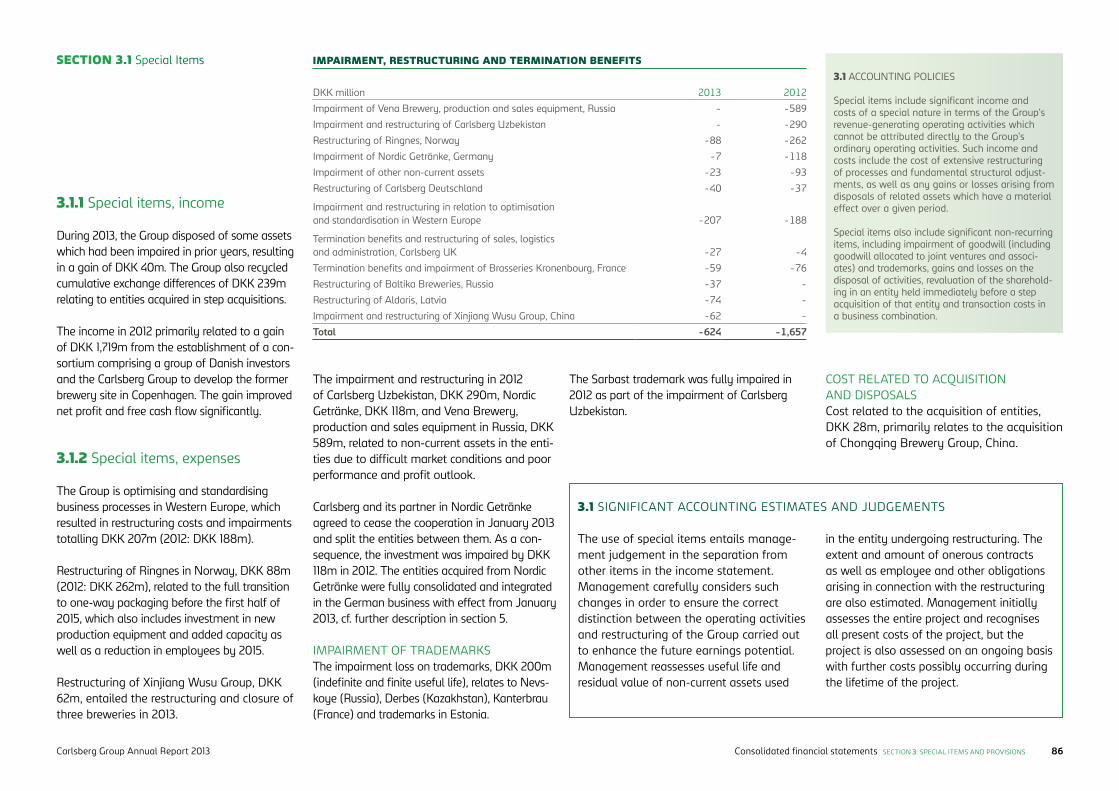
SECTION 3.1 Special Items
The Group is optimising and standardising business processes in Western Europe, which resulted in restructuring costs and impairments totalling DKK 207m (2012: DKK 188m).
Restructuring of Ringnes in Norway, DKK 88m (2012: DKK 262m), related to the full transition to one-way packaging before the first half of 2015, which also includes investment in new production equipment and added capacity as well as a reduction in employees by 2015.
Restructuring of Xinjiang Wusu Group, DKK 62m, entailed the restructuring and closure of three breweries in 2013.
The impairment and restructuring in 2012 of Carlsberg Uzbekistan, DKK 290m, Nordic Getränke, DKK 118m, and Vena Brewery, production and sales equipment in Russia, DKK 589m, related to non-current assets in the enti-ties due to difficult market conditions and poor performance and profit outlook.
Carlsberg and its partner in Nordic Getränke agreed to cease the cooperation in January 2013 and split the entities between them. As a con-sequence, the investment was impaired by DKK 118m in 2012. The entities acquired from Nordic Getränke were fully consolidated and integrated in the German business with effect from January 2013, cf. further description in section 5.
IMPAIRMENT OF TRADEMARKSThe impairment loss on trademarks, DKK 200m (indefinite and finite useful life), relates to Nevs-koye (Russia), Derbes (Kazakhstan), Kanterbrau (France) and trademarks in Estonia.
3.1.2 Special items, expenses
DKK million 2013 2012
Impairment of Vena Brewery, production and sales equipment, Russia - -589
Impairment and restructuring of Carlsberg Uzbekistan - -290
Restructuring of Ringnes, Norway -88 -262
Impairment of Nordic Getränke, Germany -7 -118
Impairment of other non-current assets -23 -93
Restructuring of Carlsberg Deutschland -40 -37
Impairment and restructuring in relation to optimisation and standardisation in Western Europe -207 -188
Termination benefits and restructuring of sales, logistics and administration, Carlsberg UK -27 -4
Termination benefits and impairment of Brasseries Kronenbourg, France -59 -76
Restructuring of Baltika Breweries, Russia -37 -
Restructuring of Aldaris, Latvia -74 -
Impairment and restructuring of Xinjiang Wusu Group, China -62 -
Total -624 -1,657
IMPAIRMENT, RESTRUCTURING AND TERMINATION BENEFITS
COST RELATED TO ACQUISITION AND DISPOSALSCost related to the acquisition of entities, DKK 28m, primarily relates to the acquisition of Chongqing Brewery Group, China.
3.1 ACCOUNTING POLICIES
Special items include significant income and costs of a special nature in terms of the Group’s revenue-generating operating activities which cannot be attributed directly to the Group’s ordinary operating activities. Such income and costs include the cost of extensive restructuring of processes and fundamental structural adjust-ments, as well as any gains or losses arising from disposals of related assets which have a material effect over a given period.
Special items also include significant non-recurring items, including impairment of goodwill (including goodwill allocated to joint ventures and associ-ates) and trademarks, gains and losses on the disposal of activities, revaluation of the sharehold-ing in an entity held immediately before a step acquisition of that entity and transaction costs in a business combination.
3.1 SIGNIFICANT ACCOUNTING ESTIMATES AND JUDGEMENTS
The use of special items entails manage-ment judgement in the separation from other items in the income statement. Management carefully considers such changes in order to ensure the correct distinction between the operating activities and restructuring of the Group carried out to enhance the future earnings potential.Management reassesses useful life and residual value of non-current assets used
in the entity undergoing restructuring. The extent and amount of onerous contracts as well as employee and other obligations arising in connection with the restructuring are also estimated. Management initially assesses the entire project and recognises all present costs of the project, but the project is also assessed on an ongoing basis with further costs possibly occurring during the lifetime of the project.
3.1.1 Special items, income
During 2013, the Group disposed of some assets which had been impaired in prior years, resulting in a gain of DKK 40m. The Group also recycled cumulative exchange differences of DKK 239m relating to entities acquired in step acquisitions.
The income in 2012 primarily related to a gain of DKK 1,719m from the establishment of a con-sortium comprising a group of Danish in vestors and the Carlsberg Group to develop the former brewery site in Copenhagen. The gain improved net profit and free cash flow significantly.
The Sarbast trademark was fully impaired in 2012 as part of the impairment of Carlsberg Uzbekistan.
Consolidated financial statements SECTION 3: SPECIAL ITEMS AND PROVISIONS 86Carlsberg Group Annual Report 2013
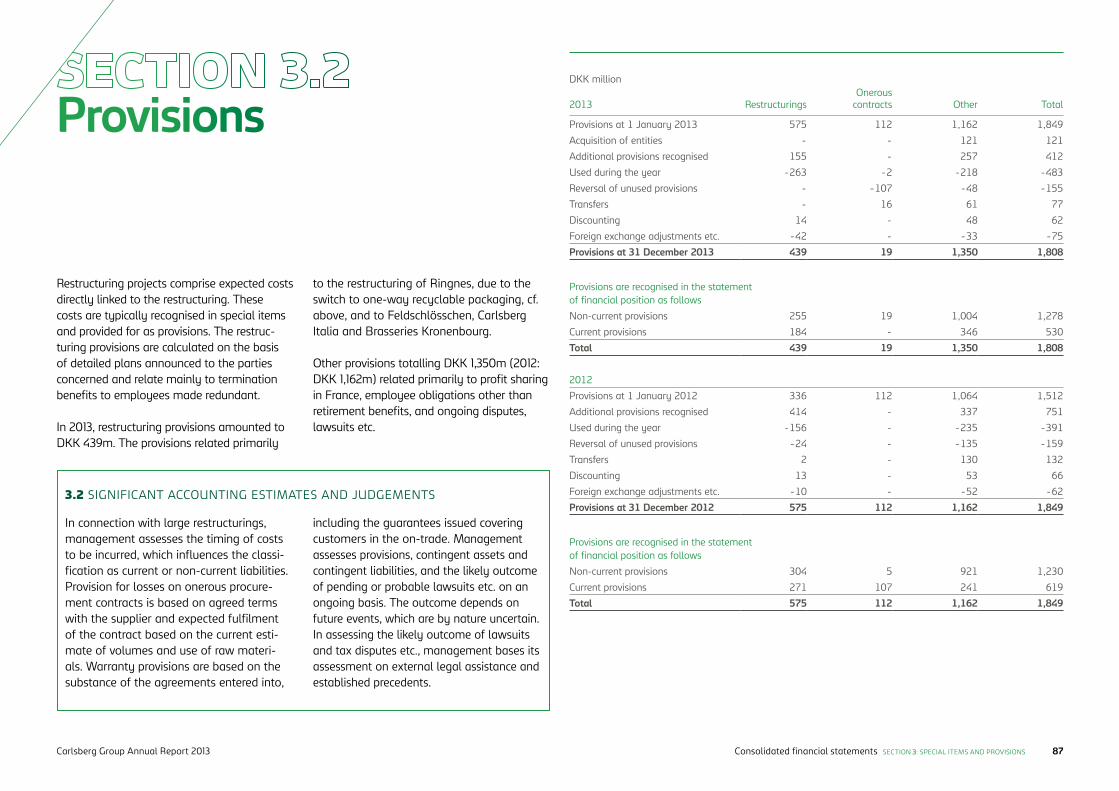
Provisions
Restructuring projects comprise expected costs directly linked to the restructuring. These costs are typically recognised in special items and provided for as provisions. The restruc-turing provisions are calculated on the basis of detailed plans announced to the parties concerned and relate mainly to termination benefits to employees made redundant.
In 2013, restructuring provisions amounted to DKK 439m. The provisions related primarily
to the restructuring of Ringnes, due to the switch to one-way recyclable packaging, cf. above, and to Feldschlösschen, Carlsberg Italia and Brasseries Kronenbourg.
Other provisions totalling DKK 1,350m (2012: DKK 1,162m) related primarily to profit sharing in France, employee obligations other than retirement benefits, and ongoing disputes, lawsuits etc.
DKK million
2013 RestructuringsOnerous
contracts Other Total
Provisions at 1 January 2013 575 112 1,162 1,849
Acquisition of entities - - 121 121
Additional provisions recognised 155 - 257 412
Used during the year -263 -2 -218 -483
Reversal of unused provisions - -107 -48 -155
Transfers - 16 61 77
Discounting 14 - 48 62
Foreign exchange adjustments etc. -42 - -33 -75
Provisions at 31 December 2013 439 19 1,350 1,808
Provisions are recognised in the statement of financial position as follows
Non-current provisions 255 19 1,004 1,278
Current provisions 184 - 346 530
Total 439 19 1,350 1,808
2012
Provisions at 1 January 2012 336 112 1,064 1,512
Additional provisions recognised 414 - 337 751
Used during the year -156 - -235 -391
Reversal of unused provisions -24 - -135 -159
Transfers 2 - 130 132
Discounting 13 - 53 66
Foreign exchange adjustments etc. -10 - -52 -62
Provisions at 31 December 2012 575 112 1,162 1,849
Provisions are recognised in the statement of financial position as follows
Non-current provisions 304 5 921 1,230
Current provisions 271 107 241 619
Total 575 112 1,162 1,849
3.2 SIGNIFICANT ACCOUNTING ESTIMATES AND JUDGEMENTS
In connection with large restructurings, management assesses the timing of costs to be incurred, which influences the classi-fication as current or non-current liabilities. Provision for losses on onerous procure-ment contracts is based on agreed terms with the supplier and expected fulfilment of the contract based on the current esti-mate of volumes and use of raw materi-als. Warranty provisions are based on the substance of the agreements entered into,
including the guarantees issued covering customers in the on-trade. Management assesses provisions, contingent assets and contingent liabilities, and the likely outcome of pending or probable lawsuits etc. on an ongoing basis. The outcome depends on future events, which are by nature uncertain. In assessing the likely outcome of lawsuits and tax disputes etc., management bases its assessment on external legal assistance and established precedents.
Consolidated financial statements SECTION 3: SPECIAL ITEMS AND PROVISIONS 87Carlsberg Group Annual Report 2013
The Group is party to certain lawsuits, dis-putes etc. of various scopes. It is manage-ment’s opinion that, apart from items recog-nised in the statement of financial position or disclosed in the consolidated financial statements, the outcome of these lawsuits, disputes etc. will not have a material effect on the Group’s financial position.
The Group has issued guarantees for loans etc. raised by third parties (non-consolidated entities) of DKK 626m (2012: DKK 674m). Guarantees issued for loans raised by joint ventures and associates are described in sec-tion 5.5 and 5.6.
Certain guarantees etc. are issued in connec-tion with disposal of entities and activities etc. Apart from items recognised in the state-ment of financial position or disclosed in the consolidated financial statements, these guarantees etc. will not have a material ef-fect on the Group’s financial position.
Contractual commitments, and lease and ser-vice agreements are described in section 2.4.
3.2 ACCOUNTING POLICIES
Provisions, including warranty provisions, are recognised when, as a result of events arising before or at the end of the reporting period, the Group has a legal or a constructive obligation and it is probable that there may be an outflow of resources embodying economic benefits to settle the obliga-tion. Other provisions are discounted if the effect is material to the measurement of the liability. The Carlsberg Group’s average borrowing rate is used as the discount rate.
Restructuring costs are recognised under liabilities when a detailed, formal restructuring plan has been announced to the persons affected no later than at the end of the reporting period. On acquisition of entities, restructuring provisions in the acquiree
are only included in the opening balance when the acquiree has a restructuring liability at the acquisi-tion date.
A provision for onerous contracts is recognised when the benefits expected to be derived by the Group from a contract are lower than the unavoid-able costs of meeting its obligations under the contract.
When the Group has a legal obligation to disman-tle or remove an asset or restore the site on which the asset is located, a provision is recognised cor-responding to the present value of expected future costs.
Contingent liabilities
SECTION 3.2 Provisions
Consolidated financial statements SECTION 3: SPECIAL ITEMS AND PROVISIONS 88Carlsberg Group Annual Report 2013
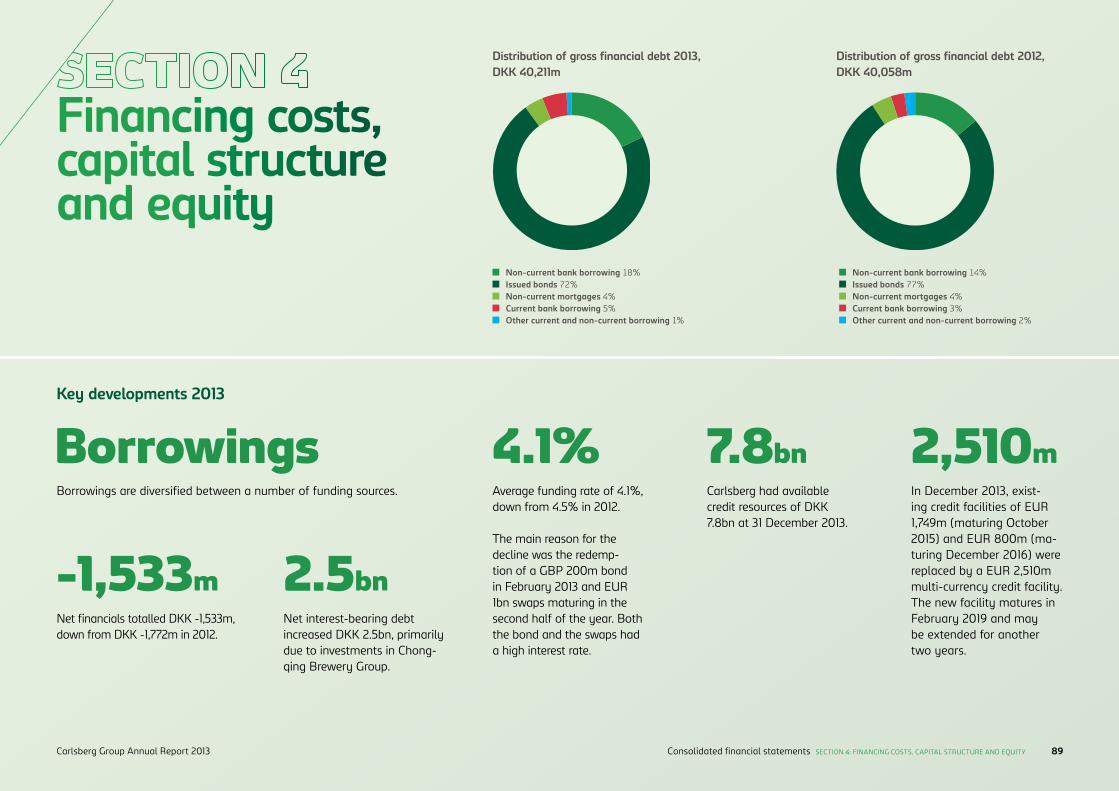
Financing costs, capital structure and equity
BorrowingsKey developments 2013
-1,533mNet financials totalled DKK -1,533m, down from DKK -1,772m in 2012.
4.1%Average funding rate of 4.1%, down from 4.5% in 2012.
The main reason for the decline was the redemp-tion of a GBP 200m bond in February 2013 and EUR 1bn swaps maturing in the second half of the year. Both the bond and the swaps had a high interest rate.
2.5bnNet interest-bearing debt increased DKK 2.5bn, primarily due to investments in Chong-qing Brewery Group.
2,510mIn December 2013, exist-ing credit facilities of EUR 1,749m (maturing October 2015) and EUR 800m (ma-turing December 2016) were replaced by a EUR 2,510m multi-currency credit facility. The new facility matures in February 2019 and may be extended for another two years.
Borrowings are diversified between a number of funding sources.
7.8bnCarlsberg had available credit resources of DKK 7.8bn at 31 December 2013.
Distribution of gross financial debt 2013,DKK 40,211m
Distribution of gross financial debt 2012,DKK 40,058m
Non-current bank borrowing 14% Issued bonds 77% Non-current mortgages 4% Current bank borrowing 3% Other current and non-current borrowing 2%
Non-current bank borrowing 18% Issued bonds 72% Non-current mortgages 4% Current bank borrowing 5% Other current and non-current borrowing 1%
Consolidated financial statements SECTION 4: FINANCING COSTS, CAPITAL STRUCTURE AND EQUITY 89Carlsberg Group Annual Report 2013
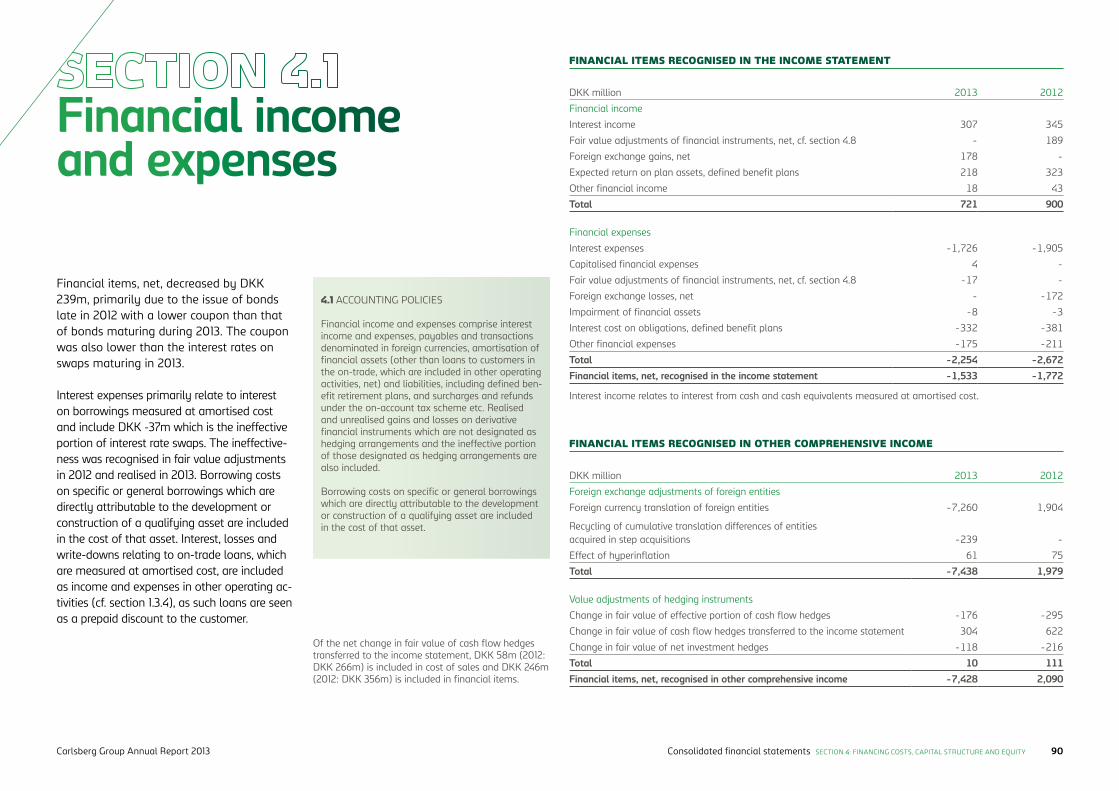
Financial income and expenses
Financial items, net, decreased by DKK 239m, primarily due to the issue of bonds late in 2012 with a lower coupon than that of bonds maturing during 2013. The coupon was also lower than the interest rates on swaps maturing in 2013.
Interest expenses primarily relate to interest on borrowings measured at amortised cost and include DKK -37m which is the ineffective portion of interest rate swaps. The ineffective-ness was recognised in fair value adjustments in 2012 and realised in 2013. Borrowing costs on specific or general borrowings which are directly attributable to the development or construction of a qualifying asset are included in the cost of that asset. Interest, losses and write-downs relating to on-trade loans, which are measured at amortised cost, are included as income and expenses in other operating ac-tivities (cf. section 1.3.4), as such loans are seen as a prepaid discount to the customer.
4.1 ACCOUNTING POLICIES
Financial income and expenses comprise interest income and expenses, payables and transactions denominated in foreign currencies, amortisation of financial assets (other than loans to customers in the on-trade, which are included in other operating activities, net) and liabilities, including defined ben-efit retirement plans, and surcharges and refunds under the on-account tax scheme etc. Realised and unrealised gains and losses on derivative financial instruments which are not designated as hedging arrangements and the ineffective portion of those designated as hedging arrangements are also included.
Borrowing costs on specific or general borrowings which are directly attributable to the development or construction of a qualifying asset are included in the cost of that asset.
DKK million 2013 2012
Financial income
Interest income 307 345
Fair value adjustments of financial instruments, net, cf. section 4.8 - 189
Foreign exchange gains, net 178 -
Expected return on plan assets, defined benefit plans 218 323
Other financial income 18 43
Total 721 900
Financial expenses
Interest expenses -1,726 -1,905
Capitalised financial expenses 4 -
Fair value adjustments of financial instruments, net, cf. section 4.8 -17 -
Foreign exchange losses, net - -172
Impairment of financial assets -8 -3
Interest cost on obligations, defined benefit plans -332 -381
Other financial expenses -175 -211
Total -2,254 -2,672Financial items, net, recognised in the income statement -1,533 -1,772
DKK million 2013 2012
Foreign exchange adjustments of foreign entities
Foreign currency translation of foreign entities -7,260 1,904
Recycling of cumulative translation differences of entities acquired in step acquisitions -239 -
Effect of hyperinflation 61 75
Total -7,438 1,979
Value adjustments of hedging instruments
Change in fair value of effective portion of cash flow hedges -176 -295
Change in fair value of cash flow hedges transferred to the income statement 304 622
Change in fair value of net investment hedges -118 -216
Total 10 111Financial items, net, recognised in other comprehensive income -7,428 2,090
FINANCIAL ITEMS RECOGNISED IN THE INCOME STATEMENT
FINANCIAL ITEMS RECOGNISED IN OTHER COMPREHENSIVE INCOME
Of the net change in fair value of cash flow hedges transferred to the income statement, DKK 58m (2012: DKK 266m) is included in cost of sales and DKK 246m (2012: DKK 356m) is included in financial items.
Interest income relates to interest from cash and cash equivalents measured at amortised cost.
Consolidated financial statements SECTION 4: FINANCING COSTS, CAPITAL STRUCTURE AND EQUITY 90Carlsberg Group Annual Report 2013
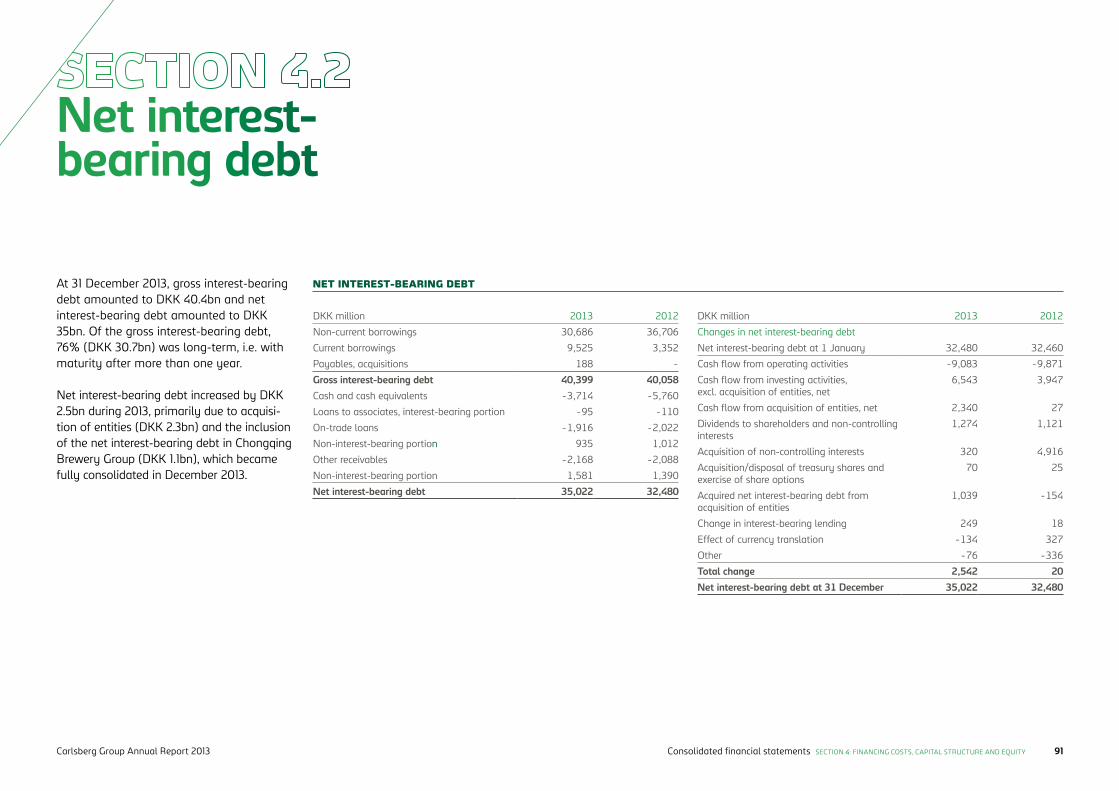
Net interest-bearing debt
At 31 December 2013, gross interest-bearing debt amounted to DKK 40.4bn and net interest-bearing debt amounted to DKK 35bn. Of the gross interest-bearing debt, 76% (DKK 30.7bn) was long-term, i.e. with maturity after more than one year.
Net interest-bearing debt increased by DKK 2.5bn during 2013, primarily due to acquisi-tion of entities (DKK 2.3bn) and the inclusion of the net interest-bearing debt in Chongqing Brewery Group (DKK 1.1bn), which became fully consolidated in December 2013.
DKK million 2013 2012
Non-current borrowings 30,686 36,706
Current borrowings 9,525 3,352
Payables, acquisitions 188 -
Gross interest-bearing debt 40,399 40,058Cash and cash equivalents -3,714 -5,760
Loans to associates, interest-bearing portion -95 -110
On-trade loans -1,916 -2,022
Non-interest-bearing portion 935 1,012
Other receivables -2,168 -2,088
Non-interest-bearing portion 1,581 1,390
Net interest-bearing debt 35,022 32,480
NET INTEREST-BEARING DEBT
DKK million 2013 2012
Changes in net interest-bearing debt
Net interest-bearing debt at 1 January 32,480 32,460
Cash flow from operating activities -9,083 -9,871
Cash flow from investing activities, excl. acquisition of entities, net
6,543 3,947
Cash flow from acquisition of entities, net 2,340 27
Dividends to shareholders and non-controlling interests
1,274 1,121
Acquisition of non-controlling interests 320 4,916
Acquisition/disposal of treasury shares and exercise of share options
70 25
Acquired net interest-bearing debt from acquisition of entities
1,039 -154
Change in interest-bearing lending 249 18
Effect of currency translation -134 327
Other -76 -336
Total change 2,542 20Net interest-bearing debt at 31 December 35,022 32,480
Consolidated financial statements SECTION 4: FINANCING COSTS, CAPITAL STRUCTURE AND EQUITY 91Carlsberg Group Annual Report 2013
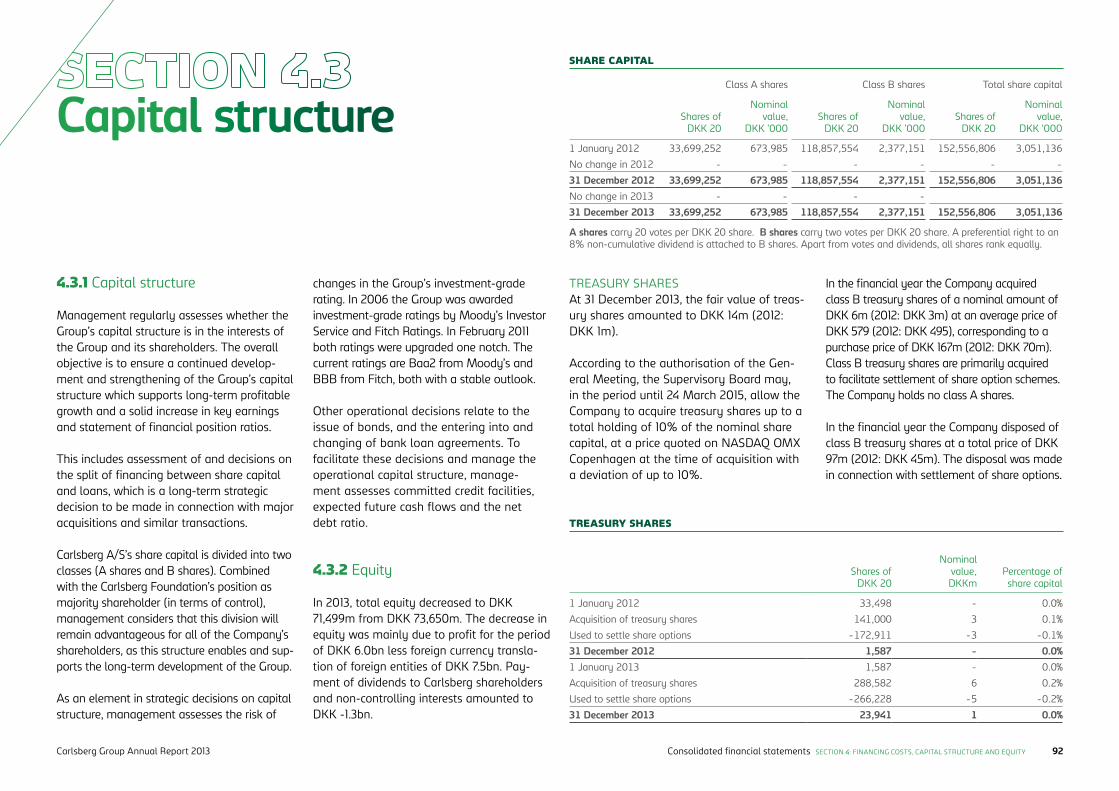
Capital structure
Management regularly assesses whether the Group’s capital structure is in the interests of the Group and its shareholders. The overall objective is to ensure a continued develop-ment and strengthening of the Group’s capital structure which supports long-term profitable growth and a solid increase in key earnings and statement of financial position ratios.
This includes assessment of and decisions on the split of financing between share capital and loans, which is a long-term strategic decision to be made in connection with major acquisitions and similar transactions.
Carlsberg A/S’s share capital is divided into two classes (A shares and B shares). Combined with the Carlsberg Foundation’s position as majority shareholder (in terms of control), management considers that this division will remain advantageous for all of the Company’s shareholders, as this structure enables and sup-ports the long-term development of the Group.
As an element in strategic decisions on capital structure, management assesses the risk of
In 2013, total equity decreased to DKK 71,499m from DKK 73,650m. The decrease in equity was mainly due to profit for the period of DKK 6.0bn less foreign currency transla-tion of foreign entities of DKK 7.5bn. Pay-ment of dividends to Carlsberg shareholders and non-controlling interests amounted to DKK -1.3bn.
TREASURY SHARESAt 31 December 2013, the fair value of treas-ury shares amounted to DKK 14m (2012: DKK 1m).
According to the authorisation of the Gen-eral Meeting, the Supervisory Board may, in the period until 24 March 2015, allow the Company to acquire treasury shares up to a total holding of 10% of the nominal share capital, at a price quoted on NASDAQ OMX Copenhagen at the time of acquisition with a deviation of up to 10%.
changes in the Group’s investment-grade rating. In 2006 the Group was awarded investment-grade ratings by Moody’s Investor Service and Fitch Ratings. In February 2011 both ratings were upgraded one notch. The current ratings are Baa2 from Moody’s and BBB from Fitch, both with a stable outlook.
Other operational decisions relate to the issue of bonds, and the entering into and changing of bank loan agreements. To facilitate these decisions and manage the operational capital structure, manage-ment assesses committed credit facilities, expected future cash flows and the net debt ratio.
4.3.1 Capital structure
4.3.2 Equity
Class A shares Class B shares Total share capital
Shares of DKK 20
Nominal value,
DKK ’000Shares of
DKK 20
Nominal value,
DKK ’000Shares of
DKK 20
Nominal value,
DKK ’000
1 January 2012 33,699,252 673,985 118,857,554 2,377,151 152,556,806 3,051,136
No change in 2012 - - - - - -
31 December 2012 33,699,252 673,985 118,857,554 2,377,151 152,556,806 3,051,136No change in 2013 - - - -
31 December 2013 33,699,252 673,985 118,857,554 2,377,151 152,556,806 3,051,136
SHARE CAPITAL
In the financial year the Company acquired class B treasury shares of a nominal amount of DKK 6m (2012: DKK 3m) at an average price of DKK 579 (2012: DKK 495), corresponding to a purchase price of DKK 167m (2012: DKK 70m). Class B treasury shares are primarily acquired to facilitate settlement of share option schemes. The Company holds no class A shares.
In the financial year the Company disposed of class B treasury shares at a total price of DKK 97m (2012: DKK 45m). The disposal was made in connection with settlement of share options.
Shares of DKK 20
Nominal value, DKKm
Percentage of share capital
1 January 2012 33,498 - 0.0%
Acquisition of treasury shares 141,000 3 0.1%
Used to settle share options -172,911 -3 -0.1%
31 December 2012 1,587 - 0.0%1 January 2013 1,587 - 0.0%
Acquisition of treasury shares 288,582 6 0.2%
Used to settle share options -266,228 -5 -0.2%
31 December 2013 23,941 1 0.0%
TREASURY SHARES
A shares carry 20 votes per DKK 20 share. B shares carry two votes per DKK 20 share. A preferential right to an 8% non-cumulative dividend is attached to B shares. Apart from votes and dividends, all shares rank equally.
Consolidated financial statements SECTION 4: FINANCING COSTS, CAPITAL STRUCTURE AND EQUITY 92Carlsberg Group Annual Report 2013
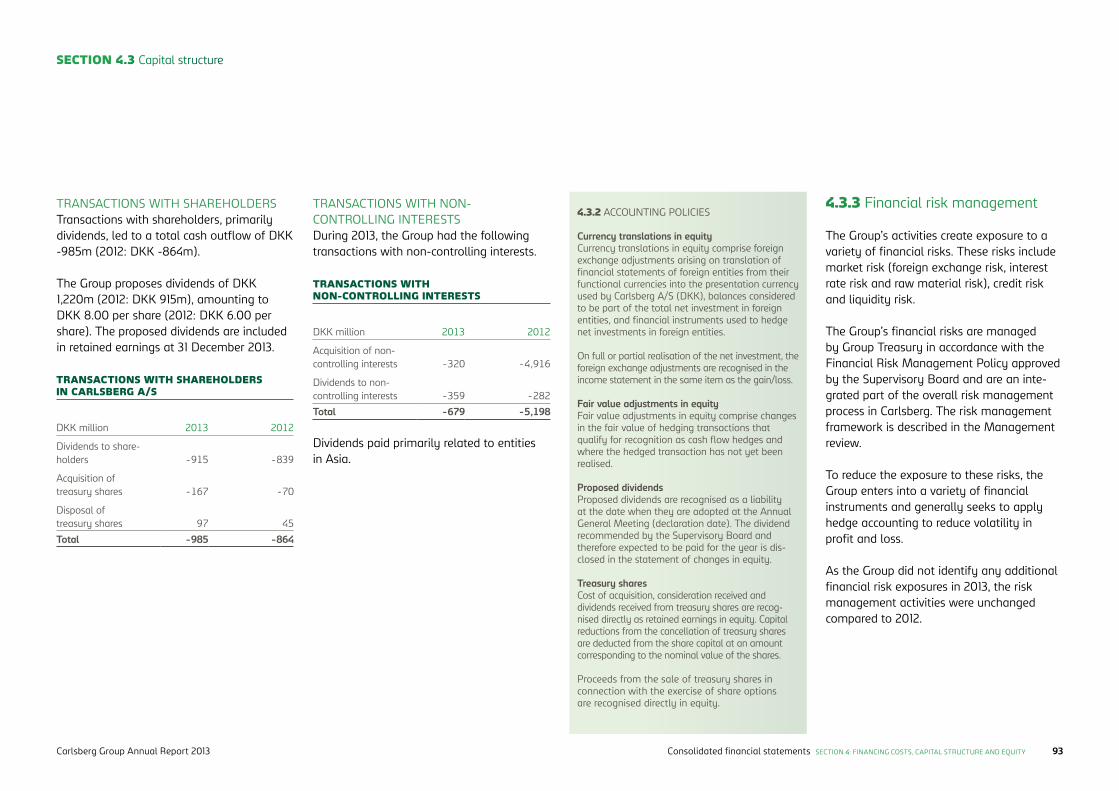
SECTION 4.3 Capital structure
4.3.2 ACCOUNTING POLICIES
Currency translations in equityCurrency translations in equity comprise foreign exchange adjustments arising on translation of financial statements of foreign entities from their functional currencies into the presentation currency used by Carlsberg A/S (DKK), balances considered to be part of the total net investment in foreign entities, and financial instruments used to hedge net investments in foreign entities.
On full or partial realisation of the net investment, the foreign exchange adjustments are recognised in the income statement in the same item as the gain/loss.
Fair value adjustments in equityFair value adjustments in equity comprise changes in the fair value of hedging transactions that qualify for recognition as cash flow hedges and where the hedged transaction has not yet been realised.
Proposed dividendsProposed dividends are recognised as a liability at the date when they are adopted at the Annual General Meeting (declaration date). The dividend recommended by the Supervisory Board and therefore expected to be paid for the year is dis-closed in the statement of changes in equity.
Treasury shares Cost of acquisition, consideration received and dividends received from treasury shares are recog-nised directly as retained earnings in equity. Capital reductions from the cancellation of treasury shares are deducted from the share capital at an amount corresponding to the nominal value of the shares.
Proceeds from the sale of treasury shares in connection with the exercise of share options are recognised directly in equity.
TRANSACTIONS WITH SHAREHOLDERS IN CARLSBERG A/S
DKK million 2013 2012
Dividends to share-holders -915 -839
Acquisition of treasury shares -167 -70
Disposal of treasury shares 97 45
Total -985 -864
TRANSACTIONS WITH NON-CONTROLLING INTERESTS
DKK million 2013 2012
Acquisition of non-controlling interests -320 -4,916
Dividends to non- controlling interests -359 -282
Total -679 -5,198
The Group’s activities create exposure to a variety of financial risks. These risks include market risk (foreign exchange risk, interest rate risk and raw material risk), credit risk and liquidity risk.
The Group’s financial risks are managed by Group Treasury in accordance with the Financial Risk Management Policy approved by the Supervisory Board and are an inte-grated part of the overall risk management process in Carlsberg. The risk management framework is described in the Management review.
To reduce the exposure to these risks, the Group enters into a variety of financial instruments and generally seeks to apply hedge accounting to reduce volatility in profit and loss.
As the Group did not identify any additional financial risk exposures in 2013, the risk management activities were unchanged compared to 2012.
4.3.3 Financial risk managementTRANSACTIONS WITH SHAREHOLDERSTransactions with shareholders, primarily dividends, led to a total cash outflow of DKK -985m (2012: DKK -864m).
The Group proposes dividends of DKK 1,220m (2012: DKK 915m), amounting to DKK 8.00 per share (2012: DKK 6.00 per share). The proposed dividends are included in retained earnings at 31 December 2013.
TRANSACTIONS WITH NON-CONTROLLING INTERESTSDuring 2013, the Group had the following transactions with non-controlling interests.
Dividends paid primarily related to entities in Asia.
Consolidated financial statements SECTION 4: FINANCING COSTS, CAPITAL STRUCTURE AND EQUITY 93Carlsberg Group Annual Report 2013
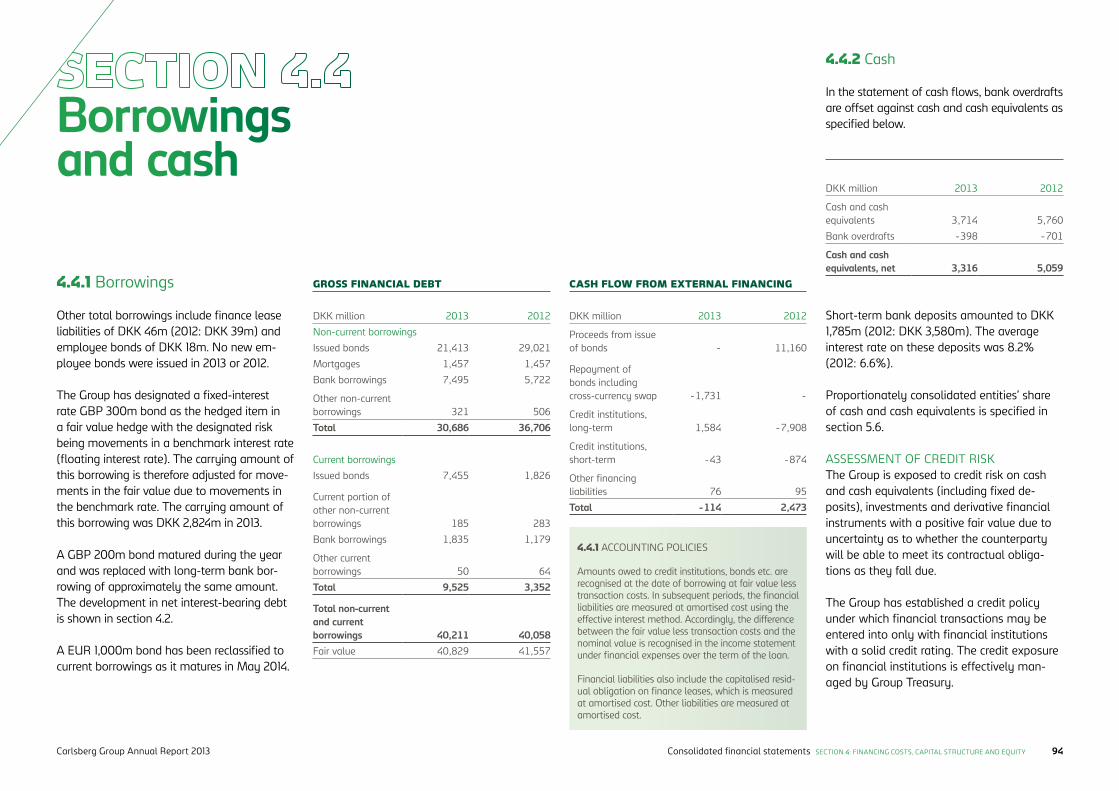
Borrowings and cash
Other total borrowings include finance lease liabilities of DKK 46m (2012: DKK 39m) and employee bonds of DKK 18m. No new em-ployee bonds were issued in 2013 or 2012.
The Group has designated a fixed-interest rate GBP 300m bond as the hedged item in a fair value hedge with the designated risk being movements in a benchmark interest rate (floating interest rate). The carrying amount of this borrowing is therefore adjusted for move-ments in the fair value due to movements in the benchmark rate. The carrying amount of this borrowing was DKK 2,824m in 2013.
A GBP 200m bond matured during the year and was replaced with long-term bank bor-rowing of approximately the same amount. The development in net interest-bearing debt is shown in section 4.2.
A EUR 1,000m bond has been reclassified to current borrowings as it matures in May 2014.
4.4.1 Borrowings
In the statement of cash flows, bank overdrafts are offset against cash and cash equivalents as specified below.
4.4.2 Cash
DKK million 2013 2012
Cash and cash equivalents 3,714 5,760
Bank overdrafts -398 -701
Cash and cash equivalents, net 3,316 5,059
DKK million 2013 2012
Non-current borrowings
Issued bonds 21,413 29,021
Mortgages 1,457 1,457
Bank borrowings 7,495 5,722
Other non-current borrowings 321 506
Total 30,686 36,706
Current borrowings
Issued bonds 7,455 1,826
Current portion of other non-current borrowings 185 283
Bank borrowings 1,835 1,179
Other current borrowings 50 64
Total 9,525 3,352
Total non-current and current borrowings 40,211 40,058Fair value 40,829 41,557
GROSS FINANCIAL DEBT
4.4.1 ACCOUNTING POLICIES
Amounts owed to credit institutions, bonds etc. are recognised at the date of borrowing at fair value less transaction costs. In subsequent periods, the financial liabilities are measured at amortised cost using the effective interest method. Accordingly, the difference between the fair value less transaction costs and the nominal value is recognised in the income statement under financial expenses over the term of the loan.
Financial liabilities also include the capitalised resid-ual obligation on finance leases, which is measured at amortised cost. Other liabilities are measured at amortised cost.
CASH FLOW FROM EXTERNAL FINANCING
DKK million 2013 2012
Proceeds from issue of bonds - 11,160
Repayment of bonds including cross-currency swap -1,731 -
Credit institutions, long-term 1,584 -7,908
Credit institutions, short-term -43 -874
Other financing liabilities 76 95
Total -114 2,473
Short-term bank deposits amounted to DKK 1,785m (2012: DKK 3,580m). The average interest rate on these deposits was 8.2% (2012: 6.6%). Proportionately consolidated entities’ share of cash and cash equivalents is specified in section 5.6.
ASSESSMENT OF CREDIT RISKThe Group is exposed to credit risk on cash and cash equivalents (including fixed de-posits), investments and derivative financial instruments with a positive fair value due to uncertainty as to whether the counterparty will be able to meet its contractual obliga-tions as they fall due.
The Group has established a credit policy under which financial transactions may be entered into only with financial institutions with a solid credit rating. The credit exposure on financial institutions is effectively man-aged by Group Treasury.
Consolidated financial statements SECTION 4: FINANCING COSTS, CAPITAL STRUCTURE AND EQUITY 94Carlsberg Group Annual Report 2013

SECTION 4.4 Borrowings and cash
Foreign exchange risk related to net investments and financing activities
The Group primarily enters into financial instru-ments and transactions with the Group’s rela-tionship banks, i.e. banks extending loans to the Group. In most cases, the Group will be in a net debt position with its relationship banks.
Group Treasury monitors the Group’s gross credit exposure to banks and operates with individual limits on banks based on rating, level of government support and access to netting of assets and liabilities.
EXPOSURE TO CREDIT RISK The carrying amount of DKK 3,714m (2012: DKK 5,760m) represents the maximum credit exposure related to cash and cash equivalents.
The credit risk on receivables is described in section 1.6.1.
The Group is exposed to foreign exchange risk on the translation of the net result and net assets in foreign investments to DKK and on borrowings denominated in a currency other than the functional currency of the individual Group entity.
4.5.1 Currency profile of the Group’s borrowings
The Group is exposed to foreign exchange risk on borrowings denominated in a cur-rency other than the Group’s functional currency due to the foreign exchange risk as well as the risk that arises when net cash in-flow is generated in one currency and loans are denominated in and have to be repaid in another currency.
At 31 December 2013, 79% of the Group’s net financial debt was in EUR (2012: 87%), cf. section 4.6.
2013DKK million
Original principal
Effect of swap
After swap
CHF 40 1,825 1,865
DKK 1,788 265 2,053
EUR 32,128 -2,668 29,460
GBP 2,796 -2,720 76
RUB 3 -390 -387
USD 1,730 1,771 3,501
Other 1,726 1,917 3,643
Total 40,211 - 40,211Total 2012 40,058 - 40,058
CURRENCY PROFILE OF BORROWINGS BEFORE AND AFTER DERIVATIVE FINANCIAL INSTRUMENTS
4.5.2 Hedging of net investments in foreign subsidiaries
The Group holds a number of investments in foreign subsidiaries where the translation of net assets to DKK is exposed to foreign ex-change risks. The Group hedges part of this foreign exchange exposure by entering into forward exchange contracts (net investment hedges). This applies to net investments in CHF, CNY, MYR, HKD and SEK. The basis for hedging is reviewed at least once a year, and the two parameters, risk reduction and cost, are balanced.
Where the fair value adjustments do not exceed the value adjustments of the invest-ment, the adjustments of the financial instruments are recognised in other com-prehensive income; otherwise the fair value adjustments are recognised in the income statement. For 2013, all fair value adjust-ments were recognised in other comprehen-sive income. The effect of net investment hedges on the income statement and other comprehensive income is summarised on the next page.
Consolidated financial statements SECTION 4: FINANCING COSTS, CAPITAL STRUCTURE AND EQUITY 95Carlsberg Group Annual Report 2013
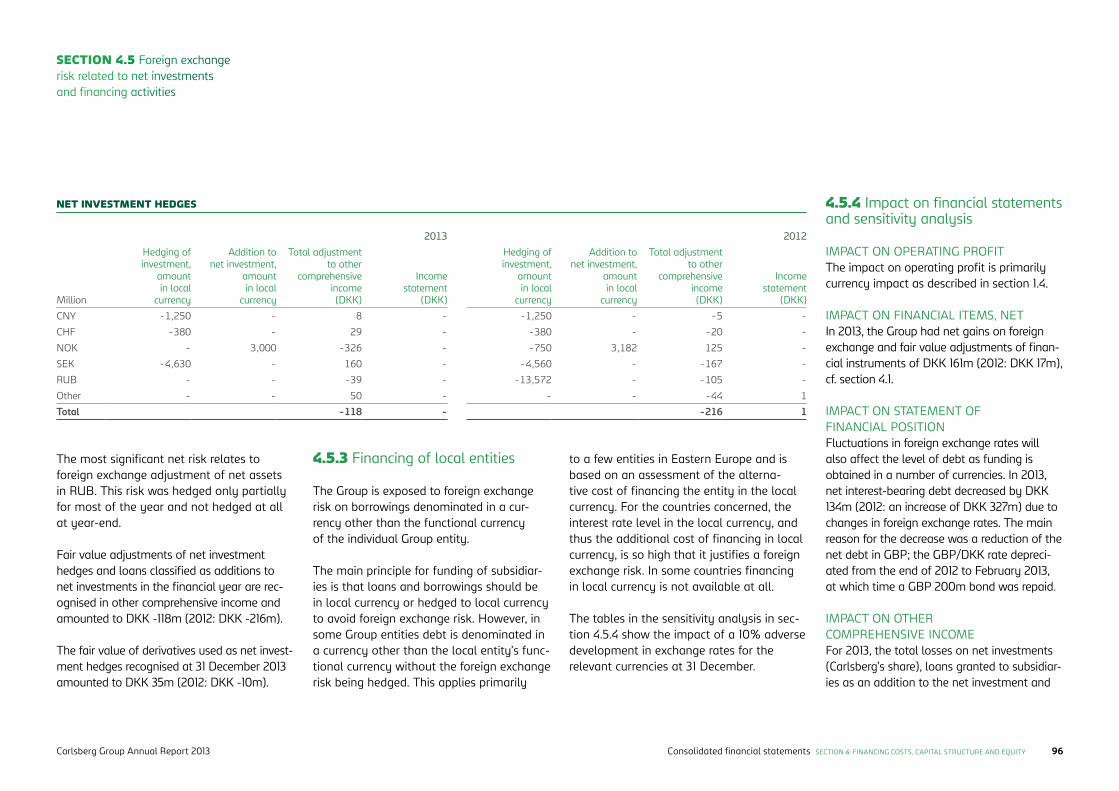
SECTION 4.5 Foreign exchange risk related to net investments and financing activities
2013 2012
Million
Hedging of investment,
amount in local
currency
Addition to net investment,
amount in local
currency
Total adjust ment to other
comprehensive income(DKK)
Incomestatement
(DKK)
Hedging of investment,
amount in local
currency
Addition to net investment,
amount in local
currency
Total adjustment to other
comprehensive income(DKK)
Incomestatement
(DKK)
CNY -1,250 - 8 - -1,250 - -5 -
CHF -380 - 29 - -380 - -20 -
NOK - 3,000 -326 - -750 3,182 125 -
SEK -4,630 - 160 - -4,560 - -167 -
RUB - - -39 - -13,572 - -105 -
Other - - 50 - - - -44 1
Total -118 - -216 1
NET INVESTMENT HEDGES
The most significant net risk relates to foreign exchange adjustment of net assets in RUB. This risk was hedged only partially for most of the year and not hedged at all at year-end.
Fair value adjustments of net investment hedges and loans classified as additions to net investments in the financial year are rec-ognised in other comprehensive income and amounted to DKK -118m (2012: DKK -216m).
The fair value of derivatives used as net invest-ment hedges recognised at 31 December 2013 amounted to DKK 35m (2012: DKK -10m).
4.5.3 Financing of local entities
The Group is exposed to foreign exchange risk on borrowings denominated in a cur-rency other than the functional currency of the individual Group entity.
The main principle for funding of subsidiar-ies is that loans and borrowings should be in local currency or hedged to local currency to avoid foreign exchange risk. However, in some Group entities debt is denominated in a currency other than the local entity’s func-tional currency without the foreign exchange risk being hedged. This applies primarily
to a few entities in Eastern Europe and is based on an assessment of the alterna-tive cost of financing the entity in the local currency. For the countries concerned, the interest rate level in the local currency, and thus the additional cost of financing in local currency, is so high that it justifies a foreign exchange risk. In some countries financing in local currency is not available at all.
The tables in the sensitivity analysis in sec-tion 4.5.4 show the impact of a 10% adverse development in exchange rates for the relevant currencies at 31 December.
4.5.4 Impact on financial statements and sensitivity analysis
IMPACT ON OPERATING PROFITThe impact on operating profit is primarily currency impact as described in section 1.4.
IMPACT ON FINANCIAL ITEMS, NETIn 2013, the Group had net gains on foreign exchange and fair value adjustments of finan-cial instruments of DKK 161m (2012: DKK 17m), cf. section 4.1.
IMPACT ON STATEMENT OF FINANCIAL POSITIONFluctuations in foreign exchange rates will also affect the level of debt as funding is obtained in a number of currencies. In 2013, net interest-bearing debt decreased by DKK 134m (2012: an increase of DKK 327m) due to changes in foreign exchange rates. The main reason for the decrease was a reduction of the net debt in GBP; the GBP/DKK rate depreci-ated from the end of 2012 to February 2013, at which time a GBP 200m bond was repaid.
IMPACT ON OTHER COMPREHENSIVE INCOMEFor 2013, the total losses on net investments (Carlsberg’s share), loans granted to subsidiar-ies as an addition to the net investment and
Consolidated financial statements SECTION 4: FINANCING COSTS, CAPITAL STRUCTURE AND EQUITY 96Carlsberg Group Annual Report 2013
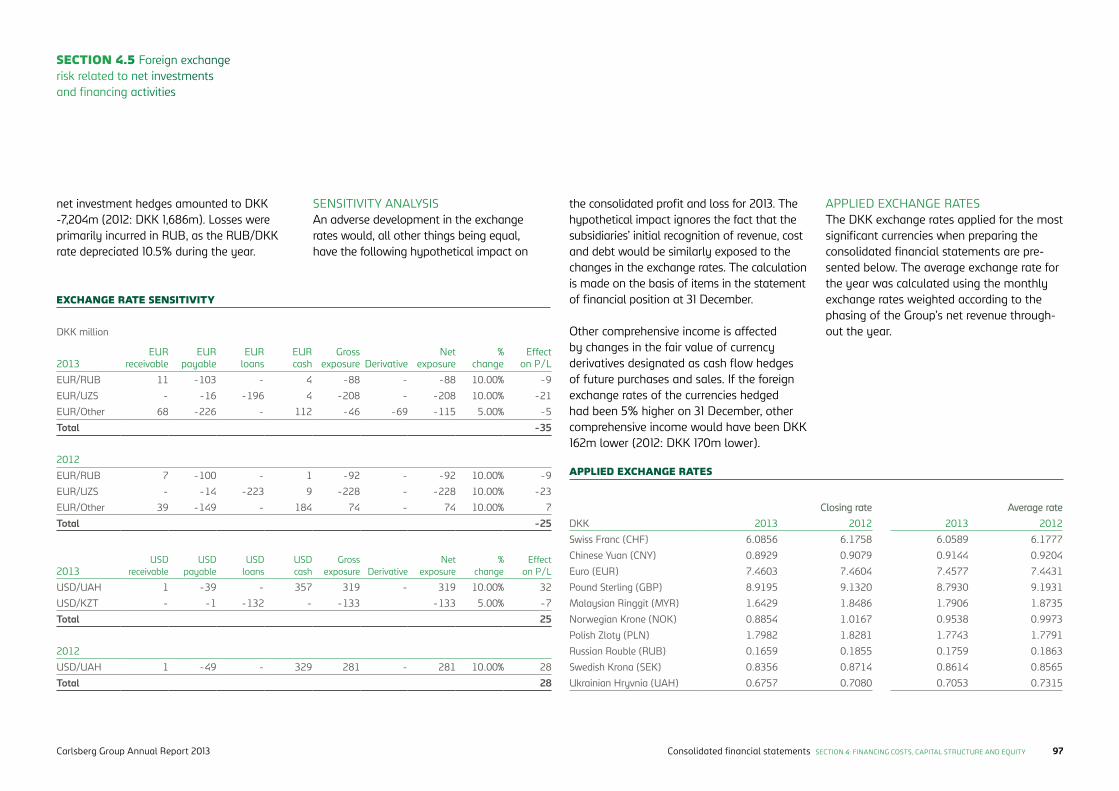
net investment hedges amounted to DKK -7,204m (2012: DKK 1,686m). Losses were primarily incurred in RUB, as the RUB/DKK rate depreciated 10.5% during the year.
DKK million
2013EUR
receivableEUR
payableEUR
loansEUR cash
Gross exposure Derivative
Net exposure
% change
Effect on P/L
EUR/RUB 11 -103 - 4 -88 - -88 10.00% -9
EUR/UZS - -16 -196 4 -208 - -208 10.00% -21
EUR/Other 68 -226 - 112 -46 -69 -115 5.00% -5
Total -35
2012
EUR/RUB 7 -100 - 1 -92 - -92 10.00% -9
EUR/UZS - -14 -223 9 -228 - -228 10.00% -23
EUR/Other 39 -149 - 184 74 - 74 10.00% 7
Total -25
2013USD
receivableUSD
payableUSD
loansUSD cash
Gross exposure Derivative
Net exposure
% change
Effect on P/L
USD/UAH 1 -39 - 357 319 - 319 10.00% 32
USD/KZT - -1 -132 - -133 -133 5.00% -7
Total 25
2012
USD/UAH 1 -49 - 329 281 - 281 10.00% 28
Total 28
SENSITIVITY ANALYSISAn adverse development in the exchange rates would, all other things being equal, have the following hypothetical impact on
the consolidated profit and loss for 2013. The hypothetical impact ignores the fact that the subsidiaries’ initial recognition of revenue, cost and debt would be similarly exposed to the changes in the exchange rates. The calculation is made on the basis of items in the statement of financial position at 31 December.
Other comprehensive income is affected by changes in the fair value of currency derivatives designated as cash flow hedges of future purchases and sales. If the foreign exchange rates of the currencies hedged had been 5% higher on 31 December, other comprehensive income would have been DKK 162m lower (2012: DKK 170m lower).
Closing rate Average rate
DKK 2013 2012 2013 2012
Swiss Franc (CHF) 6.0856 6.1758 6.0589 6.1777
Chinese Yuan (CNY) 0.8929 0.9079 0.9144 0.9204
Euro (EUR) 7.4603 7.4604 7.4577 7.4431
Pound Sterling (GBP) 8.9195 9.1320 8.7930 9.1931
Malaysian Ringgit (MYR) 1.6429 1.8486 1.7906 1.8735
Norwegian Krone (NOK) 0.8854 1.0167 0.9538 0.9973
Polish Zloty (PLN) 1.7982 1.8281 1.7743 1.7791
Russian Rouble (RUB) 0.1659 0.1855 0.1759 0.1863
Swedish Krona (SEK) 0.8356 0.8714 0.8614 0.8565
Ukrainian Hryvnia (UAH) 0.6757 0.7080 0.7053 0.7315
APPLIED EXCHANGE RATES The DKK exchange rates applied for the most significant currencies when preparing the consolidated financial statements are pre-sented below. The average exchange rate for the year was calculated using the monthly exchange rates weighted according to the phasing of the Group’s net revenue through-out the year.
EXCHANGE RATE SENSITIVITY
APPLIED EXCHANGE RATES
SECTION 4.5 Foreign exchange risk related to net investments and financing activities
Consolidated financial statements SECTION 4: FINANCING COSTS, CAPITAL STRUCTURE AND EQUITY 97Carlsberg Group Annual Report 2013
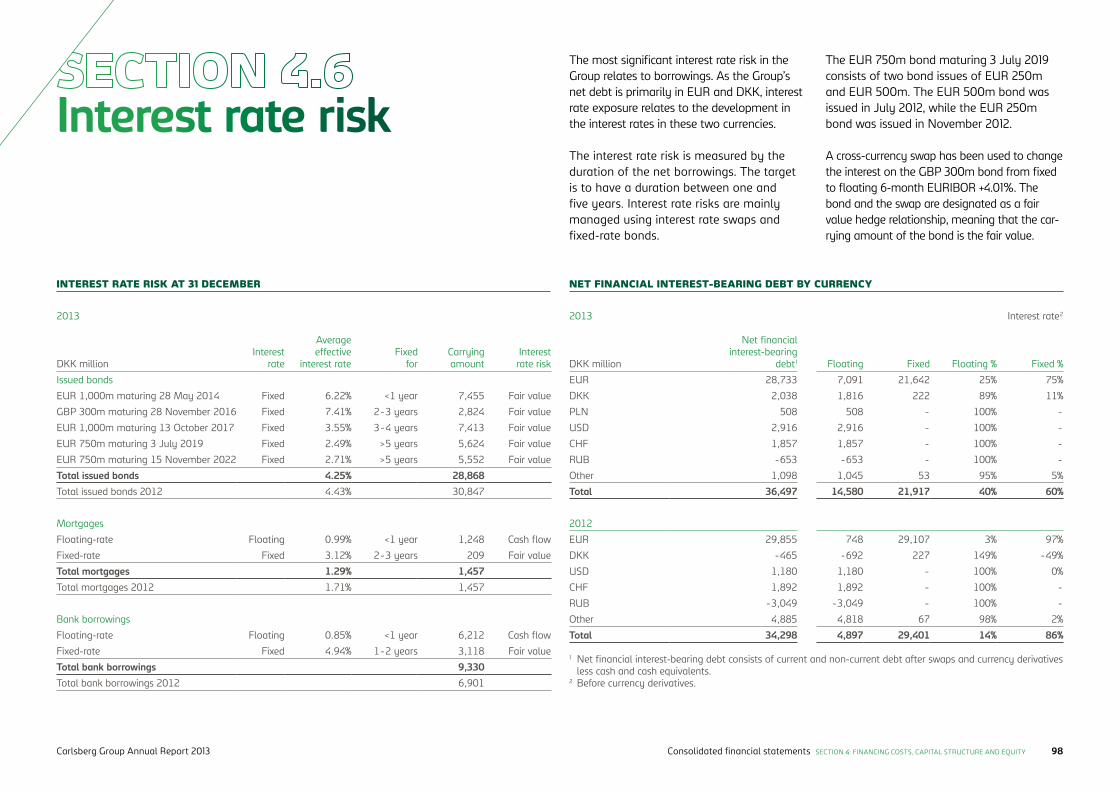
Interest rate risk
2013
DKK millionInterest
rate
Average effective
interest rateFixed
forCarrying amount
Interest rate risk
Issued bonds
EUR 1,000m maturing 28 May 2014 Fixed 6.22% <1 year 7,455 Fair value
GBP 300m maturing 28 November 2016 Fixed 7.41% 2-3 years 2,824 Fair value
EUR 1,000m maturing 13 October 2017 Fixed 3.55% 3-4 years 7,413 Fair value
EUR 750m maturing 3 July 2019 Fixed 2.49% >5 years 5,624 Fair value
EUR 750m maturing 15 November 2022 Fixed 2.71% >5 years 5,552 Fair value
Total issued bonds 4.25% 28,868Total issued bonds 2012 4.43% 30,847
Mortgages
Floating-rate Floating 0.99% <1 year 1,248 Cash flow
Fixed-rate Fixed 3.12% 2-3 years 209 Fair value
Total mortgages 1.29% 1,457Total mortgages 2012 1.71% 1,457
Bank borrowings
Floating-rate Floating 0.85% <1 year 6,212 Cash flow
Fixed-rate Fixed 4.94% 1-2 years 3,118 Fair value
Total bank borrowings 9,330Total bank borrowings 2012 6,901
INTEREST RATE RISK AT 31 DECEMBER NET FINANCIAL INTEREST-BEARING DEBT BY CURRENCY
2013 Interest rate2
DKK million
Net financial interest-bearing
debt1 Floating Fixed Floating % Fixed %
EUR 28,733 7,091 21,642 25% 75%
DKK 2,038 1,816 222 89% 11%
PLN 508 508 - 100% -
USD 2,916 2,916 - 100% -
CHF 1,857 1,857 - 100% -
RUB -653 -653 - 100% -
Other 1,098 1,045 53 95% 5%
Total 36,497 14,580 21,917 40% 60%
2012
EUR 29,855 748 29,107 3% 97%
DKK -465 -692 227 149% -49%
USD 1,180 1,180 - 100% 0%
CHF 1,892 1,892 - 100% -
RUB -3,049 -3,049 - 100% -
Other 4,885 4,818 67 98% 2%
Total 34,298 4,897 29,401 14% 86%
The most significant interest rate risk in the Group relates to borrowings. As the Group’s net debt is primarily in EUR and DKK, interest rate exposure relates to the development in the interest rates in these two currencies.
The interest rate risk is measured by the duration of the net borrowings. The target is to have a duration between one and five years. Interest rate risks are mainly managed using interest rate swaps and fixed-rate bonds.
The EUR 750m bond maturing 3 July 2019 consists of two bond issues of EUR 250m and EUR 500m. The EUR 500m bond was issued in July 2012, while the EUR 250m bond was issued in November 2012.
A cross-currency swap has been used to change the interest on the GBP 300m bond from fixed to floating 6-month EURIBOR +4.01%. The bond and the swap are designated as a fair value hedge relationship, meaning that the car-rying amount of the bond is the fair value.
1 Net financial interest-bearing debt consists of current and non-current debt after swaps and currency derivatives less cash and cash equivalents.
2 Before currency derivatives.
Consolidated financial statements SECTION 4: FINANCING COSTS, CAPITAL STRUCTURE AND EQUITY 98Carlsberg Group Annual Report 2013
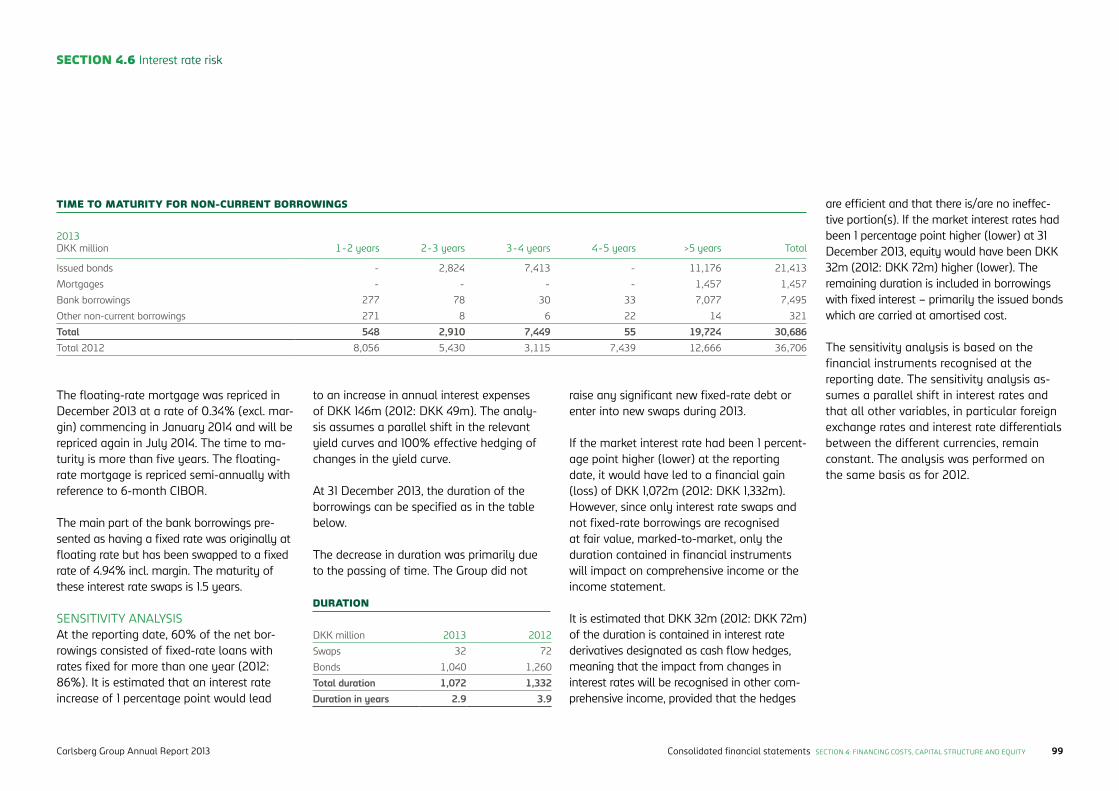
SECTION 4.6 Interest rate risk
The floating-rate mortgage was repriced in December 2013 at a rate of 0.34% (excl. mar-gin) commencing in January 2014 and will be repriced again in July 2014. The time to ma-turity is more than five years. The floating-rate mortgage is repriced semi-annually with reference to 6-month CIBOR.
The main part of the bank borrowings pre-sented as having a fixed rate was originally at floating rate but has been swapped to a fixed rate of 4.94% incl. margin. The maturity of these interest rate swaps is 1.5 years.
SENSITIVITY ANALYSISAt the reporting date, 60% of the net bor-rowings consisted of fixed-rate loans with rates fixed for more than one year (2012: 86%). It is estimated that an interest rate increase of 1 percentage point would lead
to an increase in annual interest expenses of DKK 146m (2012: DKK 49m). The analy-sis assumes a parallel shift in the relevant yield curves and 100% effective hedging of changes in the yield curve.
At 31 December 2013, the duration of the borrowings can be specified as in the table below.
The decrease in duration was primarily due to the passing of time. The Group did not
2013DKK million 1-2 years 2-3 years 3-4 years 4-5 years >5 years Total
Issued bonds - 2,824 7,413 - 11,176 21,413
Mortgages - - - - 1,457 1,457
Bank borrowings 277 78 30 33 7,077 7,495
Other non-current borrowings 271 8 6 22 14 321
Total 548 2,910 7,449 55 19,724 30,686Total 2012 8,056 5,430 3,115 7,439 12,666 36,706
TIME TO MATURITY FOR NON-CURRENT BORROWINGS
raise any significant new fixed-rate debt or enter into new swaps during 2013.
If the market interest rate had been 1 percent-age point higher (lower) at the reporting date, it would have led to a financial gain (loss) of DKK 1,072m (2012: DKK 1,332m). However, since only interest rate swaps and not fixed-rate borrowings are recognised at fair value, marked-to-market, only the duration contained in financial instruments will impact on comprehensive income or the income statement.
It is estimated that DKK 32m (2012: DKK 72m) of the duration is contained in interest rate derivatives designated as cash flow hedges, meaning that the impact from changes in interest rates will be recognised in other com-prehensive income, provided that the hedges
DKK million 2013 2012
Swaps 32 72
Bonds 1,040 1,260
Total duration 1,072 1,332Duration in years 2.9 3.9
DURATION
are efficient and that there is/are no ineffec-tive portion(s). If the market interest rates had been 1 percentage point higher (lower) at 31 December 2013, equity would have been DKK 32m (2012: DKK 72m) higher (lower). The remaining duration is included in borrowings with fixed interest – primarily the issued bonds which are carried at amortised cost.
The sensitivity analysis is based on the financial instruments recognised at the re porting date. The sensitivity analysis as-sumes a parallel shift in interest rates and that all other variables, in particular foreign exchange rates and interest rate differentials between the different currencies, remain constant. The analysis was performed on the same basis as for 2012.
Consolidated financial statements SECTION 4: FINANCING COSTS, CAPITAL STRUCTURE AND EQUITY 99Carlsberg Group Annual Report 2013
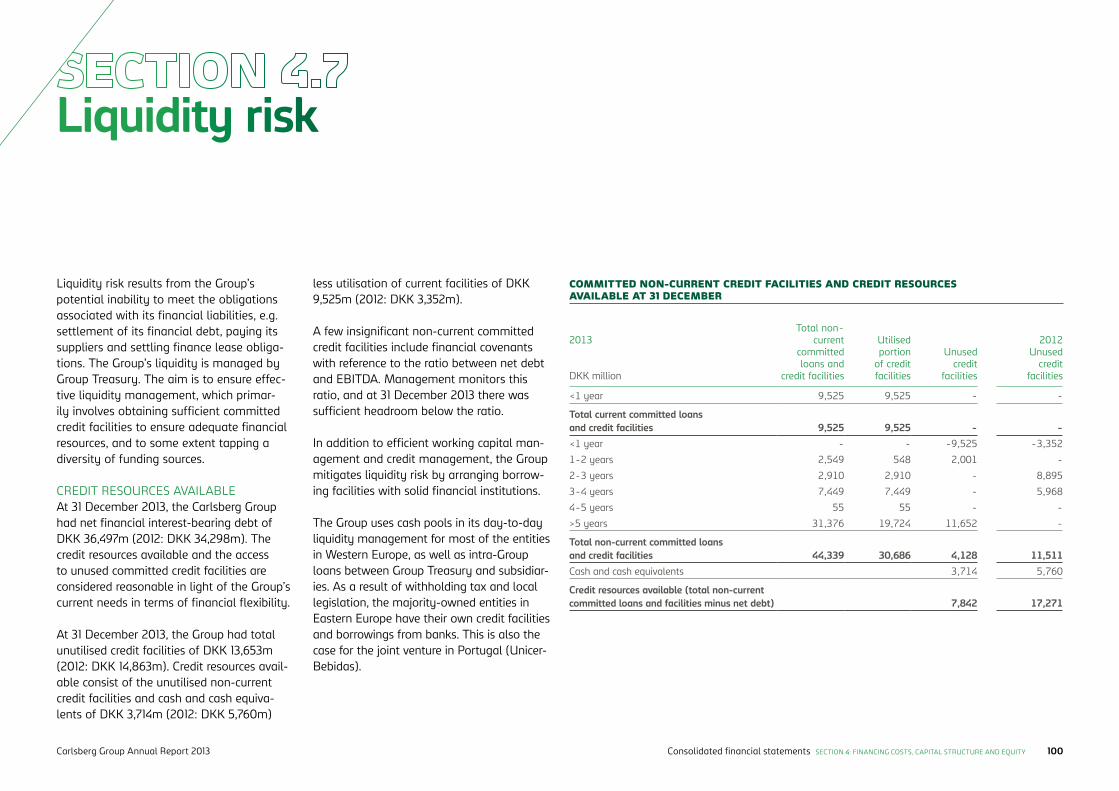
Liquidity risk
Liquidity risk results from the Group’s potential inability to meet the obligations associated with its financial liabilities, e.g. settlement of its financial debt, paying its suppliers and settling finance lease obliga-tions. The Group’s liquidity is managed by Group Treasury. The aim is to ensure effec-tive liquidity management, which primar-ily involves obtaining sufficient committed credit facilities to ensure adequate financial resources, and to some extent tapping a diversity of funding sources.
CREDIT RESOURCES AVAILABLEAt 31 December 2013, the Carlsberg Group had net financial interest-bearing debt of DKK 36,497m (2012: DKK 34,298m). The credit resources available and the access to unused committed credit facilities are considered reasonable in light of the Group’s current needs in terms of financial flexibility.
At 31 December 2013, the Group had total unutilised credit facilities of DKK 13,653m (2012: DKK 14,863m). Credit resources avail-able consist of the unutilised non-current credit facilities and cash and cash equiva-lents of DKK 3,714m (2012: DKK 5,760m)
less utilisation of current facilities of DKK 9,525m (2012: DKK 3,352m).
A few insignificant non-current committed credit facilities include financial covenants with reference to the ratio between net debt and EBITDA. Management monitors this ratio, and at 31 December 2013 there was sufficient headroom below the ratio.
In addition to efficient working capital man-agement and credit management, the Group mitigates liquidity risk by arranging borrow-ing facilities with solid financial institutions.
The Group uses cash pools in its day-to-day liquidity management for most of the entities in Western Europe, as well as intra-Group loans between Group Treasury and subsidiar-ies. As a result of withholding tax and local legislation, the majority-owned entities in Eastern Europe have their own credit facilities and borrowings from banks. This is also the case for the joint venture in Portugal (Unicer-Bebidas).
2013
DKK million
Total non-current
committed loans and
credit facilities
Utilised portion
of credit facilities
Unused credit
facilities
2012Unused
credit facilities
<1 year 9,525 9,525 - -
Total current committed loans and credit facilities 9,525 9,525 - -<1 year - - -9,525 -3,352
1-2 years 2,549 548 2,001 -
2-3 years 2,910 2,910 - 8,895
3-4 years 7,449 7,449 - 5,968
4-5 years 55 55 - -
>5 years 31,376 19,724 11,652 -
Total non-current committed loans and credit facilities 44,339 30,686 4,128 11,511Cash and cash equivalents 3,714 5,760
Credit resources available (total non-current committed loans and facilities minus net debt) 7,842 17,271
COMMITTED NON-CURRENT CREDIT FACILITIES AND CREDIT RESOURCES AVAILABLE AT 31 DECEMBER
Consolidated financial statements SECTION 4: FINANCING COSTS, CAPITAL STRUCTURE AND EQUITY 100Carlsberg Group Annual Report 2013
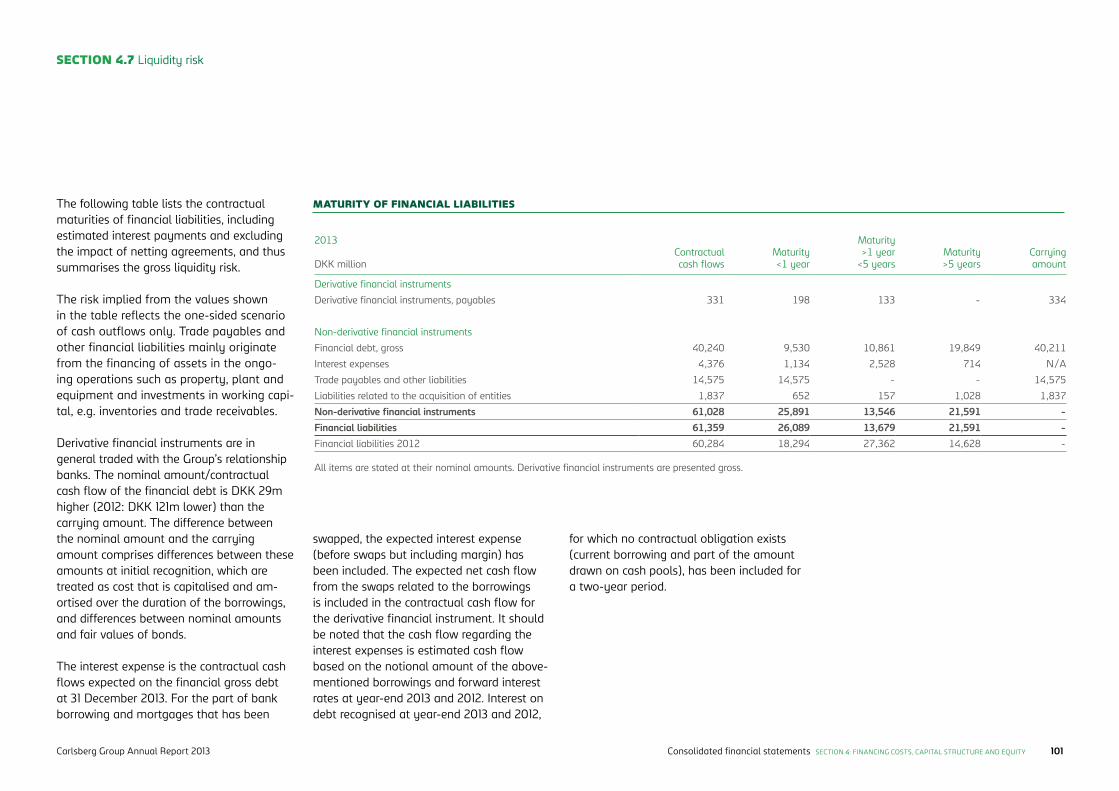
SECTION 4.7 Liquidity risk
The following table lists the contractual maturities of financial liabilities, including estimated interest payments and excluding the impact of netting agreements, and thus summarises the gross liquidity risk.
The risk implied from the values shown in the table reflects the one-sided scenario of cash outflows only. Trade payables and other financial liabilities mainly originate from the financing of assets in the ongo-ing operations such as property, plant and equipment and investments in working capi-tal, e.g. inventories and trade receivables.
Derivative financial instruments are in general traded with the Group’s relationship banks. The nominal amount/contractual cash flow of the financial debt is DKK 29m higher (2012: DKK 121m lower) than the carrying amount. The difference between the nominal amount and the carrying amount comprises differences between these amounts at initial recognition, which are treated as cost that is capitalised and am-ortised over the duration of the borrowings, and differences between nominal amounts and fair values of bonds.
The interest expense is the contractual cash flows expected on the financial gross debt at 31 December 2013. For the part of bank borrowing and mortgages that has been
swapped, the expected interest expense (before swaps but including margin) has been included. The expected net cash flow from the swaps related to the borrowings is included in the contractual cash flow for the derivative financial instrument. It should be noted that the cash flow regarding the interest expenses is estimated cash flow based on the notional amount of the above-mentioned borrowings and forward interest rates at year-end 2013 and 2012. Interest on debt recognised at year-end 2013 and 2012,
for which no contractual obligation exists (current borrowing and part of the amount drawn on cash pools), has been included for a two-year period.
2013
DKK millionContractualcash flows
Maturity<1 year
Maturity>1 year
<5 yearsMaturity>5 years
Carryingamount
Derivative financial instruments
Derivative financial instruments, payables 331 198 133 - 334
Non-derivative financial instruments
Financial debt, gross 40,240 9,530 10,861 19,849 40,211
Interest expenses 4,376 1,134 2,528 714 N/A
Trade payables and other liabilities 14,575 14,575 - - 14,575
Liabilities related to the acquisition of entities 1,837 652 157 1,028 1,837
Non-derivative financial instruments 61,028 25,891 13,546 21,591 -Financial liabilities 61,359 26,089 13,679 21,591 -Financial liabilities 2012 60,284 18,294 27,362 14,628 -
MATURITY OF FINANCIAL LIABILITIES
All items are stated at their nominal amounts. Derivative financial instruments are presented gross.
Consolidated financial statements SECTION 4: FINANCING COSTS, CAPITAL STRUCTURE AND EQUITY 101Carlsberg Group Annual Report 2013
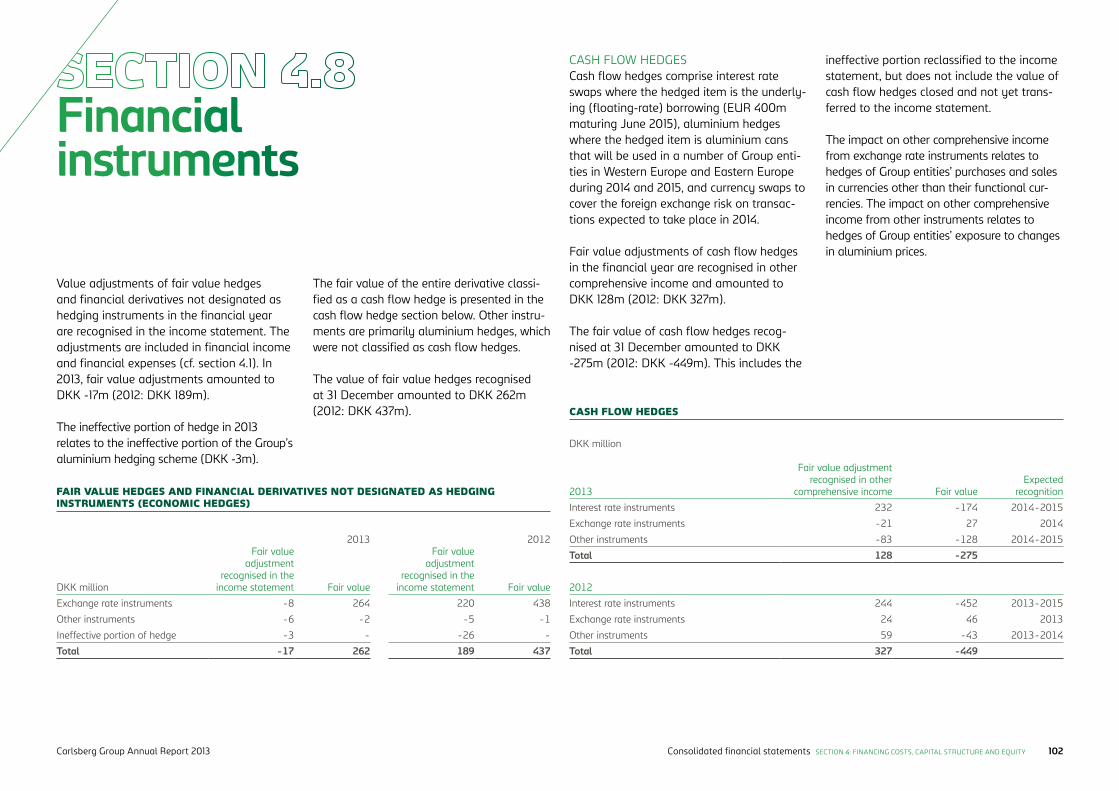
Financial instruments
Value adjustments of fair value hedges and financial derivatives not designated as hedging instruments in the financial year are recognised in the income statement. The adjustments are included in financial income and financial expenses (cf. section 4.1). In 2013, fair value adjustments amounted to DKK -17m (2012: DKK 189m).
The ineffective portion of hedge in 2013 relates to the ineffective portion of the Group’s aluminium hedging scheme (DKK -3m).
The fair value of the entire derivative classi-fied as a cash flow hedge is presented in the cash flow hedge section below. Other instru-ments are primarily aluminium hedges, which were not classified as cash flow hedges.
The value of fair value hedges recognised at 31 December amounted to DKK 262m (2012: DKK 437m).
DKK million
Fair value adjustment
recognised in the income statement
2013
Fair value
Fair value adjustment
recognised in the income statement
2012
Fair value
Exchange rate instruments -8 264 220 438
Other instruments -6 -2 -5 -1
Ineffective portion of hedge -3 - -26 -
Total -17 262 189 437
FAIR VALUE HEDGES AND FINANCIAL DERIVATIVES NOT DESIGNATED AS HEDGING INSTRUMENTS (ECONOMIC HEDGES)
CASH FLOW HEDGESCash flow hedges comprise interest rate swaps where the hedged item is the underly-ing (floating-rate) borrowing (EUR 400m maturing June 2015), aluminium hedges where the hedged item is aluminium cans that will be used in a number of Group enti-ties in Western Europe and Eastern Europe during 2014 and 2015, and currency swaps to cover the foreign exchange risk on transac-tions expected to take place in 2014.
Fair value adjustments of cash flow hedges in the financial year are recognised in other comprehensive income and amounted to DKK 128m (2012: DKK 327m).
The fair value of cash flow hedges recog-nised at 31 December amounted to DKK -275m (2012: DKK -449m). This includes the
DKK million
2013
Fair value adjustment recognised in other
comprehensive income Fair valueExpected
recognition
Interest rate instruments 232 -174 2014-2015
Exchange rate instruments -21 27 2014
Other instruments -83 -128 2014-2015
Total 128 -275
2012
Interest rate instruments 244 -452 2013-2015
Exchange rate instruments 24 46 2013
Other instruments 59 -43 2013-2014
Total 327 -449
CASH FLOW HEDGES
ineffective portion reclassified to the income statement, but does not include the value of cash flow hedges closed and not yet trans-ferred to the income statement.
The impact on other comprehensive income from exchange rate instruments relates to hedges of Group entities’ purchases and sales in currencies other than their functional cur-rencies. The impact on other comprehensive income from other instruments relates to hedges of Group entities’ exposure to changes in aluminium prices.
Consolidated financial statements SECTION 4: FINANCING COSTS, CAPITAL STRUCTURE AND EQUITY 102Carlsberg Group Annual Report 2013
SECTION 4.8 Financial instruments
4.8 ACCOUNTING POLICIES
Derivative financial instruments are initially recog-nised in the statement of financial position at fair value on the trade date and subsequently measured at fair value. Attributable transaction costs are recognised in the income statement.
The fair values of derivative financial instruments are included in other receivables and other paya-bles, and positive and negative values are offset only when the Group has the right and the intention to settle several financial instruments net. Fair val-ues of derivative financial instruments are computed on the basis of current market data and generally accepted valuation methods.
Changes in the fair value of derivative financial in-struments designated as and qualifying for recogni-tion as a fair value hedge of recognised assets and liabilities are recognised in the income statement, together with changes in the value of the hedged asset or liability with respect to the hedged portion. Except for foreign currency hedges, hedging of future cash flows according to a firm agreement is treated as a fair value hedge of a recognised asset or liability.
Changes in the portion of the fair value of derivative financial instruments which are designated and qualify as a cash flow hedge and which effectively hedge changes in the value of the hedged item are recognised in other comprehensive income and attributed to a separate reserve in equity. When the hedged transaction results in gains or losses, amounts previously recognised in other compre-hensive income are transferred to the same item as the hedged item when the hedged risk impacts the income statement. When the hedged item is a
non-financial asset, the amount recognised in other comprehensive income is transferred to the carrying amount of the asset when the non-financial asset is recognised.
Derivatives designated as and qualifying for recog-nition as a cash flow hedge of financial investments are recognised in other comprehensive income. On complete or partial disposal of the financial invest-ment, the portion of the hedging instrument that is recognised in other comprehensive income and relates to that financial investment is recognised in the income statement when the gain or loss on disposal is recognised.
For derivative financial instruments that do not qualify for hedge accounting, changes in fair value are recognised in the income statement as financial income or financial expenses.
Changes in the fair value of derivative financial instruments used to hedge net investments in foreign subsidiaries, joint ventures or associates and which ef-fectively hedge currency fluctuations in these entities are recognised in other comprehensive income and at-tributed to a separate translation reserve in equity.
Embedded derivatives are recognised separately from the host contract and measured at fair value if their economic characteristics and risks are not closely related to those of the host contract, as a separate instrument with the same terms would meet the definition of a derivative, and the entire combined instrument is not measured at fair value through profit and loss. Separated embedded de-rivatives are subsequently measured at fair value.
4.8 SIGNIFICANT ACCOUNTING ESTIMATES AND JUDGEMENTS
When entering into financial instruments, management assesses whether the instru-ment is an effective hedge of recognised assets and liabilities, expected future cash flows or financial investments. The effectiveness of recognised hedge instru-ments is assessed at least quarterly. Any ineffectiveness is recognised in the income statement.
Consolidated financial statements SECTION 4: FINANCING COSTS, CAPITAL STRUCTURE AND EQUITY 103Carlsberg Group Annual Report 2013
Determination of fair value
Carlsberg has no financial instruments measured at fair value on the basis of level 1 input (quoted prices) or level 3 input (non-observable data).
The fair value of borrowings is disclosed in section 4.4.1. The carrying amount of other financial assets and liabilities approximates their fair value.
METHODS AND ASSUMPTIONS TO DETERMINE FAIR VALUE The methods and assumptions used in determining the fair values of each category of financial assets and financial liabilities are described in the table. The methods are unchanged from 2012.
CATEGORY MEASUREMENT METHOD
Derivative financial instruments
Fair value is determined based on observable market data using generally accepted methods. Internally calculated values are used, and these are compared to external market quotes on a quarterly basis. Calculated by
a) estimating the notional future cash flows using observable mar-ket data such as yield curves and the aluminium forward curves
b) discounting the estimated and fixed cash flow to present valuec) translating the amounts in foreign currency into the functional
currency at the year-end foreign exchange rate
Loans and other receivables Carrying amount approximates fair value
On-trade loans Recognised at amortised cost. Based on discounted cash flows using the interest rates at the end of the reporting year, these loans have a fair value of DKK 1,916m (2012: DKK 2,022m)
Other financial liabilities Other financial liabilities, including issued bonds, mortgages, bank borrowings, finance lease obligations, trade payables and other liabilities, are measured at amortised cost with the exception of a GBP 300m bond, which is measured at fair value based on move-ments in a benchmark interest rate
Consolidated financial statements SECTION 4: FINANCING COSTS, CAPITAL STRUCTURE AND EQUITY 104Carlsberg Group Annual Report 2013
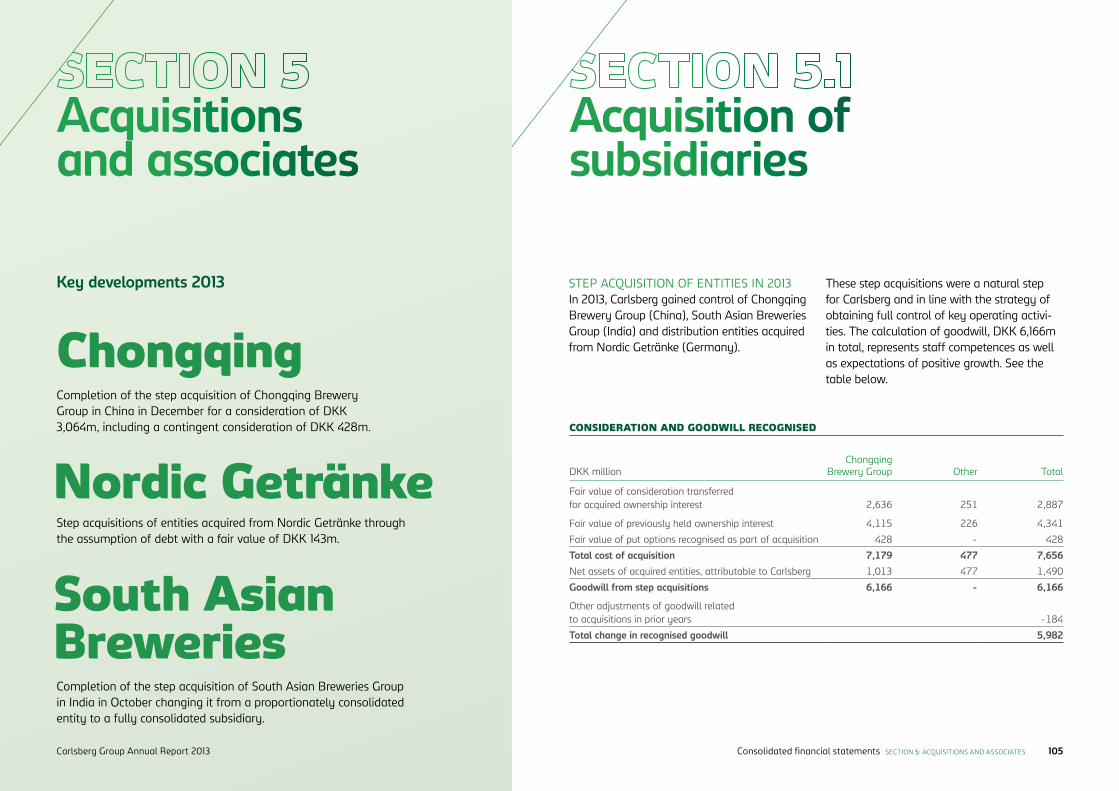
Acquisition of subsidiaries
Acquisitions and associates
ChongqingCompletion of the step acquisition of Chongqing Brewery Group in China in December for a consideration of DKK 3,064m, including a contingent consideration of DKK 428m.
South Asian Breweries
Nordic Getränke Step acquisitions of entities acquired from Nordic Getränke through the assumption of debt with a fair value of DKK 143m.
Completion of the step acquisition of South Asian Breweries Group in India in October changing it from a proportionately consolidated entity to a fully consolidated subsidiary.
STEP ACQUISITION OF ENTITIES IN 2013In 2013, Carlsberg gained control of Chongqing Brewery Group (China), South Asian Breweries Group (India) and distribution entities acquired from Nordic Getränke (Germany).
DKK millionChongqing
Brewery Group Other Total
Fair value of consideration transferred for acquired ownership interest 2,636 251 2,887
Fair value of previously held ownership interest 4,115 226 4,341
Fair value of put options recognised as part of acquisition 428 - 428
Total cost of acquisition 7,179 477 7,656Net assets of acquired entities, attributable to Carlsberg 1,013 477 1,490
Goodwill from step acquisitions 6,166 - 6,166
Other adjustments of goodwill related to acquisitions in prior years -184
Total change in recognised goodwill 5,982
CONSIDERATION AND GOODWILL RECOGNISED
These step acquisitions were a natural step for Carlsberg and in line with the strategy of obtaining full control of key operating activi-ties. The calculation of goodwill, DKK 6,166m in total, represents staff competences as well as expectations of positive growth. See the table below.
Key developments 2013
Consolidated financial statements SECTION 5: ACQUISITIONS AND ASSOCIATES 105Carlsberg Group Annual Report 2013
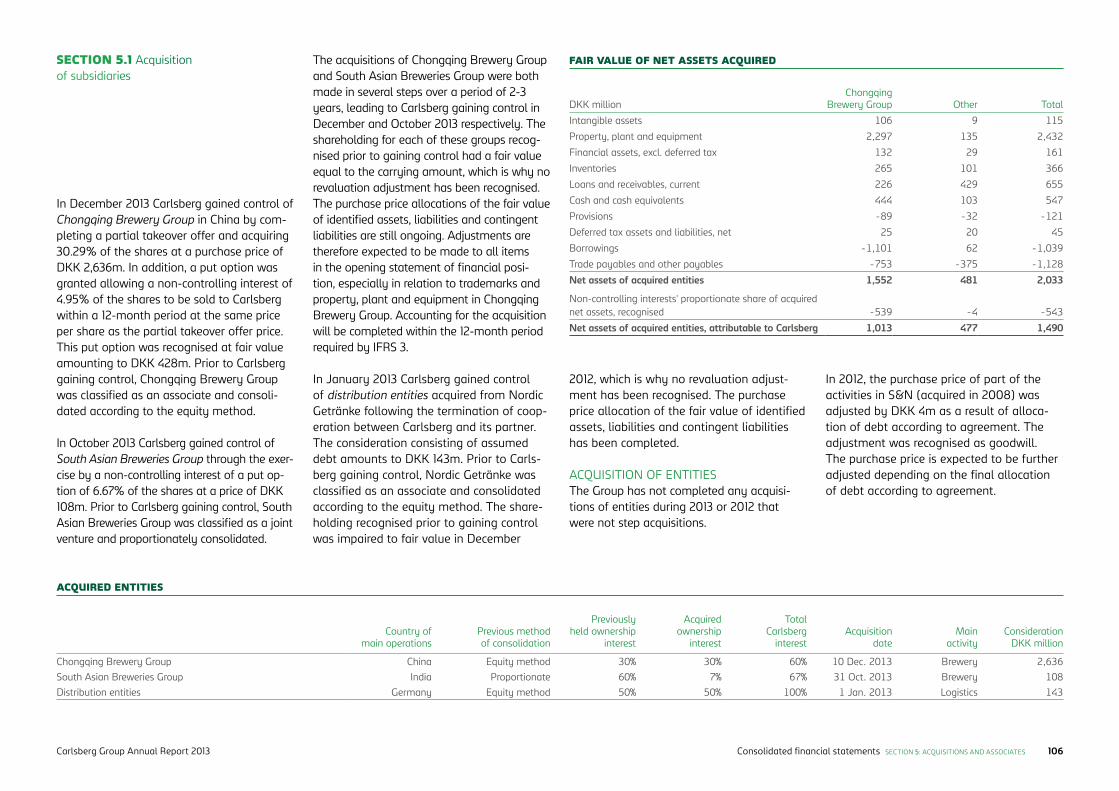
Country of main operations
Previous method of consolidation
Previously held ownership
interest
Acquired ownership
interest
Total Carlsberg
interestAcquisition
dateMain
activityConsideration
DKK million
Chongqing Brewery Group China Equity method 30% 30% 60% 10 Dec. 2013 Brewery 2,636South Asian Breweries Group India Proportionate 60% 7% 67% 31 Oct. 2013 Brewery 108Distribution entities Germany Equity method 50% 50% 100% 1 Jan. 2013 Logistics 143
ACQUIRED ENTITIES
In December 2013 Carlsberg gained control of Chongqing Brewery Group in China by com-pleting a partial takeover offer and acquiring 30.29% of the shares at a purchase price of DKK 2,636m. In addition, a put option was granted allowing a non-controlling interest of 4.95% of the shares to be sold to Carlsberg within a 12-month period at the same price per share as the partial takeover offer price. This put option was recognised at fair value amounting to DKK 428m. Prior to Carlsberg gaining control, Chongqing Brewery Group was classified as an associate and consoli-dated according to the equity method.
In October 2013 Carlsberg gained control of South Asian Breweries Group through the exer-cise by a non-controlling interest of a put op-tion of 6.67% of the shares at a price of DKK 108m. Prior to Carlsberg gaining control, South Asian Breweries Group was classified as a joint venture and proportionately consolidated.
DKK millionChongqing
Brewery Group Other Total
Intangible assets 106 9 115
Property, plant and equipment 2,297 135 2,432
Financial assets, excl. deferred tax 132 29 161
Inventories 265 101 366
Loans and receivables, current 226 429 655
Cash and cash equivalents 444 103 547
Provisions -89 -32 -121
Deferred tax assets and liabilities, net 25 20 45
Borrowings -1,101 62 -1,039
Trade payables and other payables -753 -375 -1,128
Net assets of acquired entities 1,552 481 2,033
Non-controlling interests' proportionate share of acquired net assets, recognised -539 -4 -543
Net assets of acquired entities, attributable to Carlsberg 1,013 477 1,490
FAIR VALUE OF NET ASSETS ACQUIREDThe acquisitions of Chongqing Brewery Group and South Asian Breweries Group were both made in several steps over a period of 2-3 years, leading to Carlsberg gaining control in December and October 2013 respectively. The shareholding for each of these groups recog-nised prior to gaining control had a fair value equal to the carrying amount, which is why no revaluation adjustment has been recognised. The purchase price allocations of the fair value of identified assets, liabilities and contingent liabilities are still ongoing. Adjustments are therefore expected to be made to all items in the opening statement of financial posi-tion, especially in relation to trademarks and property, plant and equipment in Chongqing Brewery Group. Accounting for the acquisition will be completed within the 12-month period required by IFRS 3.
In January 2013 Carlsberg gained control of distribution entities acquired from Nordic Getränke following the termination of coop-eration between Carlsberg and its partner. The consideration consisting of assumed debt amounts to DKK 143m. Prior to Carls-berg gaining control, Nordic Getränke was classified as an associate and consolidated according to the equity method. The share-holding recognised prior to gaining control was impaired to fair value in December
SECTION 5.1 Acquisition of subsidiaries
2012, which is why no revaluation adjust-ment has been recognised. The purchase price allocation of the fair value of identified assets, liabilities and contingent liabilities has been completed.
ACQUISITION OF ENTITIESThe Group has not completed any acquisi-tions of entities during 2013 or 2012 that were not step acquisitions.
In 2012, the purchase price of part of the activities in S&N (acquired in 2008) was adjusted by DKK 4m as a result of alloca-tion of debt according to agreement. The adjustment was recognised as goodwill. The purchase price is expected to be further adjusted depending on the final allocation of debt according to agreement.
Consolidated financial statements SECTION 5: ACQUISITIONS AND ASSOCIATES 106Carlsberg Group Annual Report 2013
SECTION 5.1 Acquisition of subsidiaries
5.1 SIGNIFICANT ACCOUNTING ESTIMATES AND JUDGEMENTS
PURCHASE PRICE ALLOCATION For acquisitions of entities, the assets, liabili-ties and contingent liabilities of the acquiree are recognised using the acquisition method. The most significant assets acquired generally comprise goodwill, trademarks, non-current assets, receivables and inventories. No active market exists for the majority of the acquired assets and liabilities, in particular in respect of acquired intangible assets. Accord-ingly, management makes estimates of the fair value of acquired assets, liabilities and contingent liabilities. Depending on the nature of the item, the determined fair value of an item may be associated with uncertainty and possibly adjusted subsequently.
The unallocated purchase price (positive amount) is recognised in the statement of financial position as goodwill, which is allocated to the Group’s cash-generating units. Management makes estimates of the acquired cash-generating units, the cash- generating units that already existed in the Group and the allocation of goodwill. The allocation of goodwill is based on the expected future cash flows for each activity. In each business combination, management decides whether or not to recognise goodwill related to non-controlling interests. If such goodwill is recognised, it is estimated based
on the fair value of the non-controlling inter-ests less the non-controlling interests’ share of the fair value of acquired assets, liabilities and contingent liabilities. The fair value of the non-controlling interests is estimated based on the net present value of expected future cash flows from the entity, the cost of newly acquired shareholdings in the entity excluding a control premium paid, and other fair value models as applicable for the transaction.
In a step acquisition, the Group gains control of an entity in which the Group already held a shareholding immediately before the step acquisition. Management estimates the total fair value of the shareholding in the entity held immediately after the completion of the step acquisition. The estimated total fair value is accounted for as the cost of the total shareholding in the entity. The shareholding held immediately before the step acquisition is remeasured at fair value at the acquisition date. The fair value is calculated as the esti-mated total fair value less the fair value of the consideration paid for the shareholdings ac-quired in the step acquisition and the fair value of non-controlling interests. The resulting gain or loss on the remeasurement is recognised in the income statement under special items.
The total fair value is based on various valuation methods, including the net present
value of expected future cash flows from the entity, the cost of newly acquired sharehold-ings in the entity including a control premium paid, and other fair value models as applic-able for the transaction.
The net present value of expected future cash flows (value in use) is based on budgets and business plans for the next three years and projections for subsequent years as well as management’s expectations for the future development following gain of control of the business. Key parameters are revenue growth, operating margin, future capital expenditure and growth expectations beyond the next three years. Budgets and business plans for the next three years are based on concrete commercial initiatives. Projections for the fol-lowing years (up to seven years) are based on more general expectations and risks for the entity and assumptions about the market in which it operates. As the risk associated with cash flows is not included in the expected cash flows for newly acquired entities, the ex-pected future cash flows are discounted using a WACC rate, cf. the description below.
Management believes that the purchase price accounted for in the consolidated financial statements reflects the best estimate of the total fair value of the business and the fair value of the non-controlling interests, and
hence the allocation of goodwill to controlling and non-controlling interests.
TRADEMARKS The value of the trademarks acquired and their expected useful life are assessed based on the trademarks’ market posi-tion, expected long-term developments in the relevant markets and the trademarks’ profitability. The estimated value of acquired trademarks includes all future cash flows associated with the trademarks, including the value of customer relations etc. related to the trademarks. For most entities ac-quired there is a close relationship between trademarks and sales. Consumer demand for beer and other beverages drives sales, and therefore the value of a trademark is closely linked to consumer demands, while there is no separate value attached to customers (shops, bars etc.) as their choice of products is driven by consumer demand.
Management determines the useful life for each trademark based on its relative local, regional and global market strength, market share and the current and planned market-ing efforts which are helping to maintain and increase the value of the trademark. When the value of a well-established trademark is expected to be maintained for an indefinite period in the relevant markets, and these
Consolidated financial statements SECTION 5: ACQUISITIONS AND ASSOCIATES 107Carlsberg Group Annual Report 2013
SECTION 5.1 Acquisition of subsidiaries
5.1 SIGNIFICANT ACCOUNTING ESTIMATES AND JUDGEMENTS (CONTINUED)
markets are expected to be profitable for a long period, the useful life of the trademark is determined to be indefinite.
For each trademark or group of trademarks, measurement is based on the relief from royalty method under which the value is calculated based on expected future cash flows for the trademarks on the basis of key assumptions about expected useful life, roy-alty rate and growth rate and a theoretically calculated tax effect. A post-tax discount rate is used which reflects the risk-free inter-est rate with the addition of a risk premium associated with the particular trademark. The model and assumptions applied are consistent with those used in impairment testing and described in further detail in section 2.3.3.
CUSTOMER AGREEMENTS AND PORTFOLIOSIn business combinations, the value of ac-quired customer agreements and customer portfolios is assessed based on the local market and trading conditions. The relation-ship between trademarks and customers is carefully considered so that trademarks and customer agreements are not both recognised on the basis of the same underlying cash flows. Usually there is a particularly close relationship between trademarks and sales. In these cases, no separate value for cus-
tomer relations is recognised as the relations are closely associated with the value of the acquired trademarks.
FAIR VALUE OF PROPERTY, PLANT AND EQUIPMENT In business combinations, the fair value of land and buildings, and standard pro-duction and office equipment is based, as far as possible, on the fair value of assets of similar type and condition that may be bought and sold in the open market.
Property, plant and equipment for which there is no reliable evidence of the fair value in the market (in particular breweries, including production equip-ment) are valued using the depreciated replacement cost method.
This method is based on the replace-ment cost of a similar asset with similar functionality and capacity. The calculated replacement cost for each asset is then reduced to reflect functional and physical obsolescence. The expected synergies and the user-specific intentions for the expected use of assets are not included in the determination of the fair value.
5.1 ACCOUNTING POLICIES
For acquisitions of new subsidiaries, joint ventures and associates, the acquisition method is used. The acquired entities’ identifiable assets, liabilities and contingent liabilities are measured at fair value at the acquisition date. Identifiable intangible assets are rec-ognised if they are separable or arise from a contrac-tual right. Deferred tax on revaluations is recognised.
The acquisition date is the date when the Carlsberg Group effectively obtains control of an acquired sub-sidiary, enters the management of a joint venture or obtains significant influence over an associate.
The cost of a business combination comprises the fair value of the consideration agreed upon. When a business combination agreement provides for an ad-justment to the cost of the combination contingent on future events, the fair value of that adjustment is included in the cost of the combination.
Goodwill and fair value adjustments in connection with the acquisition of a foreign entity with a func-tional currency other than the presentation currency used in the Carlsberg Group are treated as assets and liabilities belonging to the foreign entity and translated into the foreign entity’s functional currency at the exchange rate at the transaction date.
If uncertainties regarding measurement of acquired identifiable assets, liabilities and contingent liabili-ties exist at the acquisition date, initial recognition will take place on the basis of preliminary fair values. If identifiable assets, liabilities and contin-gent liabilities are subsequently determined to have a different fair value at the acquisition date from that first assumed, goodwill is adjusted up until 12 months after the acquisition. The effect of the adjustments is recognised in the opening balance of equity and the comparative figures are restated accordingly.
Changes in estimates of contingent purchase considerations, except in cases of material error, are recognised in the income statement under special items. Changes in estimates of contingent purchase considerations in business combinations completed no later than 31 December 2009 are recognised as an adjustment to goodwill.
Step acquisitions In a business combination achieved in stages (step acquisition), the shareholding held immediately be-fore the step acquisition is remeasured at fair value at the acquisition date. The resulting gain or loss is recognised in the income statement under special items. The total fair value of the shareholding held immediately after the step acquisition is estimated and recognised as the cost of the total sharehold-ing in the entity.
Non-controlling interests in a business combination In each business combination, management decides whether or not to recognise goodwill related to non- controlling interests. If such goodwill is recognised, it is estimated based on the fair value of the non- controlling interests less the non-controlling interests’ share of the fair value of acquired assets, liabilities and contingent liabilities.
Consolidated financial statements SECTION 5: ACQUISITIONS AND ASSOCIATES 108Carlsberg Group Annual Report 2013

In 2013, Carlsberg gained control of Chongqing Brewery Group, South Asian Breweries Group in India and distribution entities acquired from Nordic Getränke, which impacted the income statement by the following amounts:
Impact from acquisitions
DKK million 2013 2012
Operating profit before special items -93 -
Net profit for the year -163 -
Net profit for the year had the acquisition been completed 1 January 48 -
The cash flow from acquisition of entities comprises the cash consideration paid net of cash and cash equivalents acquired with the entities.
Cash flow effect from acquisitions
CONTINGENT CONSIDERATIONIn 2013 Carlsberg revalued contingent con-siderations for the previous acquisition of shareholdings in Gorkha Brewery (Nepal), Carlsberg South Asia (Singapore), and Oli-varia (Belarus). The revaluations are based on updated information since the initial recognition of the liabilities including new budgets and sales forecasts, discount rates etc. The total revaluation recognised in 2013 is DKK 131m (2012: DKK 17m).
DKK millionChongqing
Brewery Group Other Total
Cash 2,636 251 2,887
Cash and cash equivalents acquired -444 -103 -547
Total cash consideration paid 2,192 148 2,340
DKK million 2013 2012
Step acquisitions, cash outflow, net -2,340 -
Acquisition of proportionately consolidated entities, cash outflow - -23
Payment regarding acquisition in previous years - -4
Net -2,340 -27
ELEMENTS OF CASH CONSIDERATION PAID
TOTAL CASH FLOW FROM ACQUISITION OF ENTITIES
Consolidated financial statements SECTION 5: ACQUISITIONS AND ASSOCIATES 109Carlsberg Group Annual Report 2013
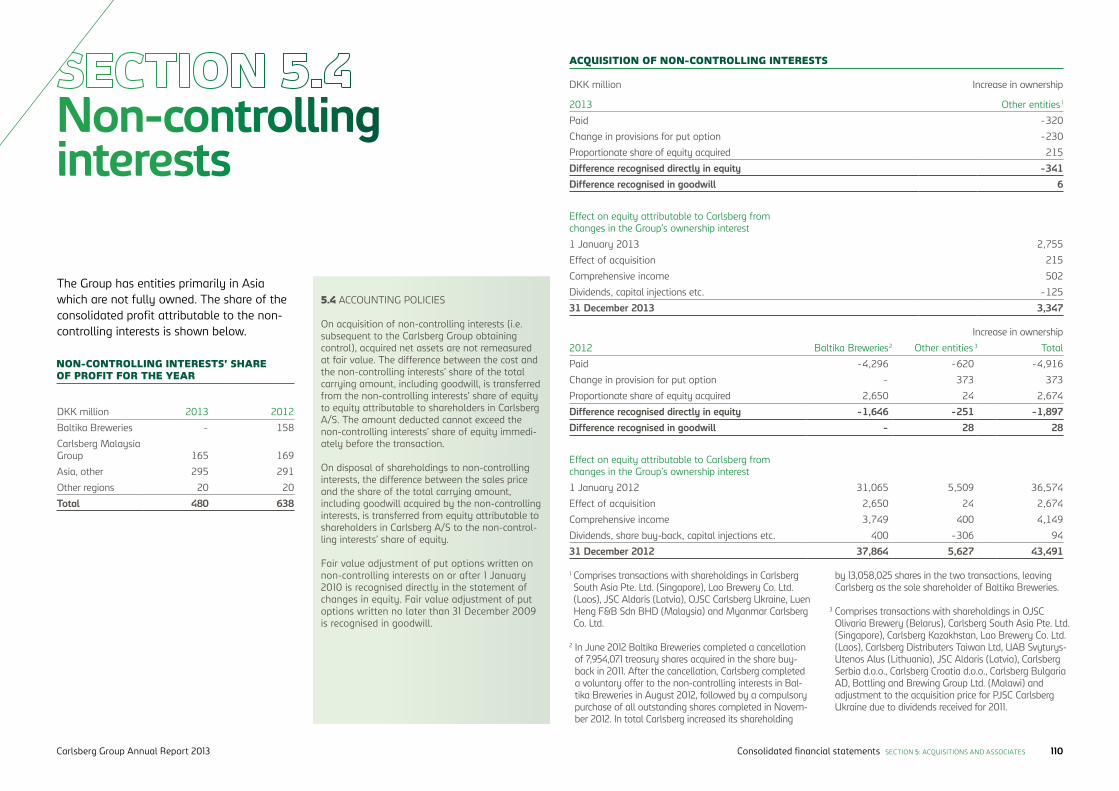
Non-controlling interests
DKK million Increase in ownership
2013 Other entities 1
Paid -320
Change in provisions for put option -230
Proportionate share of equity acquired 215
Difference recognised directly in equity -341Difference recognised in goodwill 6
Effect on equity attributable to Carlsberg from changes in the Group’s ownership interest
1 January 2013 2,755
Effect of acquisition 215
Comprehensive income 502
Dividends, capital injections etc. -125
31 December 2013 3,347
Increase in ownership
2012 Baltika Breweries2 Other entities 3 Total
Paid -4,296 -620 -4,916
Change in provision for put option - 373 373
Proportionate share of equity acquired 2,650 24 2,674
Difference recognised directly in equity -1,646 -251 -1,897Difference recognised in goodwill - 28 28
Effect on equity attributable to Carlsberg from changes in the Group’s ownership interest
1 January 2012 31,065 5,509 36,574
Effect of acquisition 2,650 24 2,674
Comprehensive income 3,749 400 4,149
Dividends, share buy-back, capital injections etc. 400 -306 94
31 December 2012 37,864 5,627 43,491
5.4 ACCOUNTING POLICIES
On acquisition of non-controlling interests (i.e. subsequent to the Carlsberg Group obtaining control), acquired net assets are not remeasured at fair value. The difference between the cost and the non-controlling interests’ share of the total carrying amount, including goodwill, is transferred from the non-controlling interests’ share of equity to equity attributable to shareholders in Carlsberg A/S. The amount deducted cannot exceed the non-controlling interests’ share of equity immedi-ately before the transaction.
On disposal of shareholdings to non-controlling interests, the difference between the sales price and the share of the total carrying amount, including goodwill acquired by the non-controlling interests, is transferred from equity attributable to share holders in Carlsberg A/S to the non-control-ling interests’ share of equity.
Fair value adjustment of put options written on non-controlling interests on or after 1 January 2010 is recognised directly in the statement of changes in equity. Fair value adjustment of put options written no later than 31 December 2009 is recognised in goodwill.
DKK million 2013 2012
Baltika Breweries - 158
Carlsberg Malaysia Group 165 169
Asia, other 295 291
Other regions 20 20
Total 480 638
NON-CONTROLLING INTERESTS’ SHARE OF PROFIT FOR THE YEAR
ACQUISITION OF NON-CONTROLLING INTERESTS
The Group has entities primarily in Asia which are not fully owned. The share of the consolidated profit attributable to the non-controlling interests is shown below.
1 Comprises transactions with shareholdings in Carlsberg South Asia Pte. Ltd. (Singapore), Lao Brewery Co. Ltd. (Laos), JSC Aldaris (Latvia), OJSC Carlsberg Ukraine, Luen Heng F&B Sdn BHD (Malaysia) and Myanmar Carlsberg Co. Ltd.
2 In June 2012 Baltika Breweries completed a cancellation of 7,954,071 treasury shares acquired in the share buy-back in 2011. After the cancellation, Carlsberg completed a voluntary offer to the non-controlling interests in Bal-tika Breweries in August 2012, followed by a compulsory purchase of all outstanding shares completed in Novem-ber 2012. In total Carlsberg increased its shareholding
by 13,058,025 shares in the two transactions, leaving Carlsberg as the sole shareholder of Baltika Breweries.
3 Comprises transactions with shareholdings in OJSC Olivaria Brewery (Belarus), Carlsberg South Asia Pte. Ltd. (Singapore), Carlsberg Kazakhstan, Lao Brewery Co. Ltd. (Laos), Carlsberg Distributers Taiwan Ltd, UAB Svyturys-Utenos Alus (Lithuania), JSC Aldaris (Latvia), Carlsberg Serbia d.o.o., Carlsberg Croatia d.o.o., Carlsberg Bulgaria AD, Bottling and Brewing Group Ltd. (Malawi) and adjustment to the acquisition price for PJSC Carlsberg Ukraine due to dividends received for 2011.
Consolidated financial statements SECTION 5: ACQUISITIONS AND ASSOCIATES 110Carlsberg Group Annual Report 2013
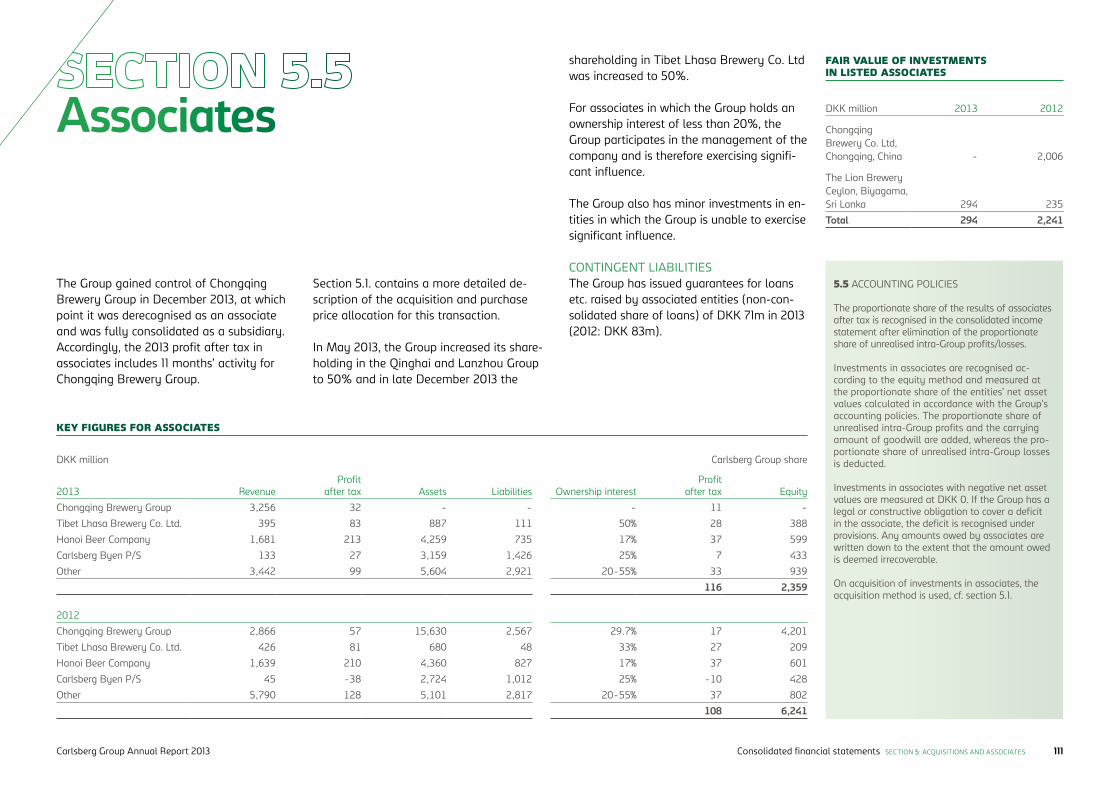
DKK million Carlsberg Group share
2013 RevenueProfit
after tax Assets Liabilities Ownership interestProfit
after tax Equity
Chongqing Brewery Group 3,256 32 - - - 11 -
Tibet Lhasa Brewery Co. Ltd. 395 83 887 111 50% 28 388
Hanoi Beer Company 1,681 213 4,259 735 17% 37 599
Carlsberg Byen P/S 133 27 3,159 1,426 25% 7 433
Other 3,442 99 5,604 2,921 20-55% 33 939
116 2,359
2012
Chongqing Brewery Group 2,866 57 15,630 2,567 29.7% 17 4,201
Tibet Lhasa Brewery Co. Ltd. 426 81 680 48 33% 27 209
Hanoi Beer Company 1,639 210 4,360 827 17% 37 601
Carlsberg Byen P/S 45 -38 2,724 1,012 25% -10 428
Other 5,790 128 5,101 2,817 20-55% 37 802
108 6,241
The Group gained control of Chongqing Brewery Group in December 2013, at which point it was derecognised as an associate and was fully consolidated as a subsidiary. Accordingly, the 2013 profit after tax in associates includes 11 months’ activity for Chongqing Brewery Group.
Associates
5.5 ACCOUNTING POLICIES
The proportionate share of the results of associates after tax is recognised in the consolidated income statement after elimination of the proportionate share of unrealised intra-Group profits/losses.
Investments in associates are recognised ac-cording to the equity method and measured at the proportionate share of the entities’ net asset values calculated in accordance with the Group’s accounting policies. The proportionate share of unrealised intra-Group profits and the carrying amount of goodwill are added, whereas the pro-portionate share of unrealised intra-Group losses is deducted.
Investments in associates with negative net asset values are measured at DKK 0. If the Group has a legal or constructive obligation to cover a deficit in the associate, the deficit is recognised under provisions. Any amounts owed by associates are written down to the extent that the amount owed is deemed irrecoverable.
On acquisition of investments in associates, the acquisition method is used, cf. section 5.1.
Section 5.1. contains a more detailed de-scription of the acquisition and purchase price allocation for this transaction.
In May 2013, the Group increased its share-holding in the Qinghai and Lanzhou Group to 50% and in late December 2013 the
KEY FIGURES FOR ASSOCIATES
FAIR VALUE OF INVESTMENTS IN LISTED ASSOCIATES
DKK million 2013 2012
Chongqing Brewery Co. Ltd, Chongqing, China - 2,006
The Lion Brewery Ceylon, Biyagama, Sri Lanka 294 235
Total 294 2,241
shareholding in Tibet Lhasa Brewery Co. Ltd was increased to 50%.
For associates in which the Group holds an ownership interest of less than 20%, the Group participates in the management of the company and is therefore exercising signifi-cant influence.
The Group also has minor investments in en-tities in which the Group is unable to exercise significant influence.
CONTINGENT LIABILITIES The Group has issued guarantees for loans etc. raised by associated entities (non-con-solidated share of loans) of DKK 71m in 2013 (2012: DKK 83m).
Consolidated financial statements SECTION 5: ACQUISITIONS AND ASSOCIATES 111Carlsberg Group Annual Report 2013
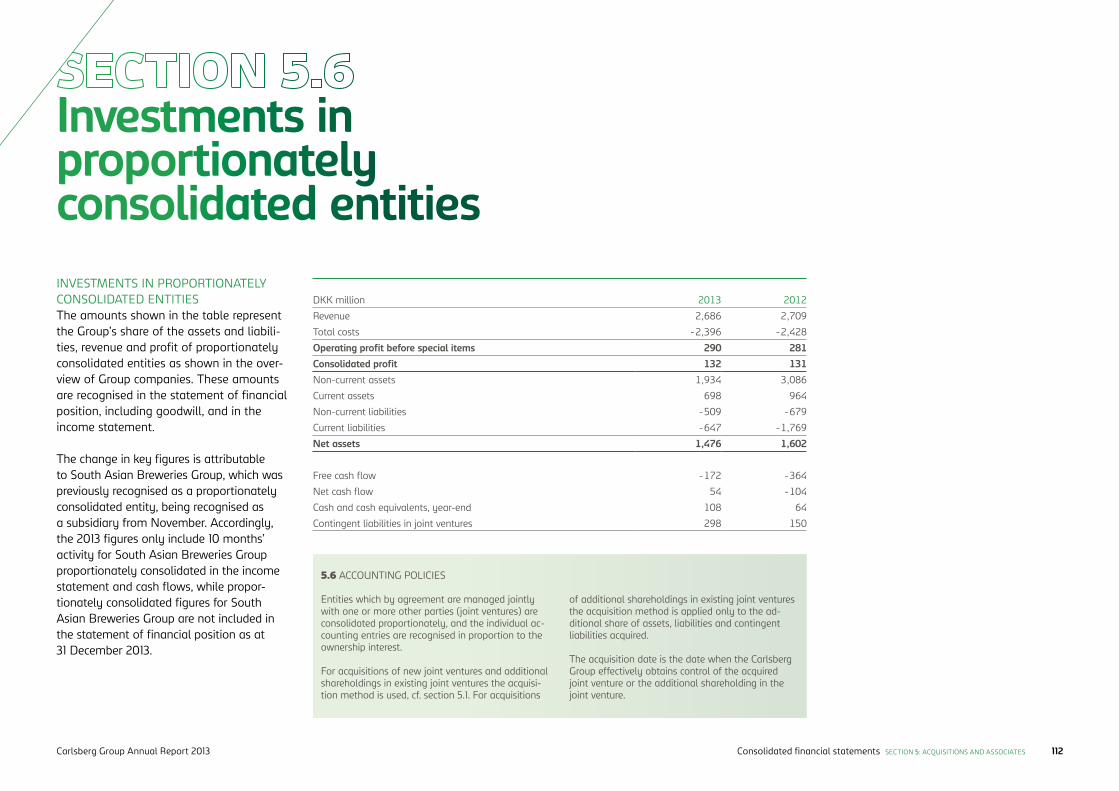
Investments in proportionately consolidated entitiesINVESTMENTS IN PROPORTIONATELY CONSOLIDATED ENTITIESThe amounts shown in the table represent the Group’s share of the assets and liabili-ties, revenue and profit of proportionately consolidated entities as shown in the over-view of Group companies. These amounts are recognised in the statement of financial position, including goodwill, and in the income statement.
The change in key figures is attributable to South Asian Breweries Group, which was previously recognised as a proportionately consolidated entity, being recognised as a subsidiary from November. Accordingly, the 2013 figures only include 10 months’ activity for South Asian Breweries Group proportionately consolidated in the income statement and cash flows, while propor-tionately consolidated figures for South Asian Breweries Group are not included in the statement of financial position as at 31 December 2013.
5.6 ACCOUNTING POLICIES
Entities which by agreement are managed jointly with one or more other parties (joint ventures) are consolidated proportionately, and the individual ac-counting entries are recognised in proportion to the ownership interest.
For acquisitions of new joint ventures and additional shareholdings in existing joint ventures the acquisi-tion method is used, cf. section 5.1. For acquisitions
of additional shareholdings in existing joint ventures the acquisition method is applied only to the ad-ditional share of assets, liabilities and contingent liabilities acquired.
The acquisition date is the date when the Carlsberg Group effectively obtains control of the acquired joint venture or the additional shareholding in the joint venture.
DKK million 2013 2012
Revenue 2,686 2,709
Total costs -2,396 -2,428
Operating profit before special items 290 281Consolidated profit 132 131Non-current assets 1,934 3,086
Current assets 698 964
Non-current liabilities -509 -679
Current liabilities -647 -1,769
Net assets 1,476 1,602
Free cash flow -172 -364
Net cash flow 54 -104
Cash and cash equivalents, year-end 108 64
Contingent liabilities in joint ventures 298 150
Consolidated financial statements SECTION 5: ACQUISITIONS AND ASSOCIATES 112Carlsberg Group Annual Report 2013
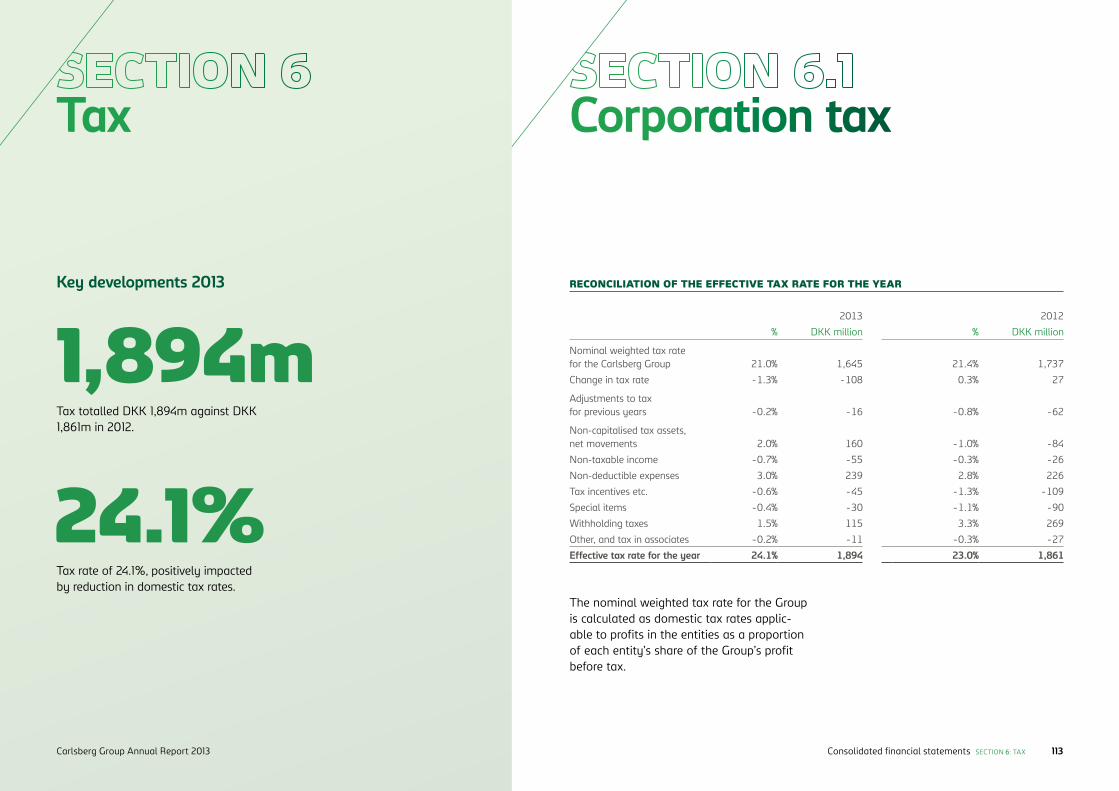
Corporation taxTax
2013 2012
% DKK million % DKK million
Nominal weighted tax rate for the Carlsberg Group 21.0% 1,645 21.4% 1,737
Change in tax rate -1.3% -108 0.3% 27
Adjustments to tax for previous years -0.2% -16 -0.8% -62
Non-capitalised tax assets, net movements 2.0% 160 -1.0% -84
Non-taxable income -0.7% -55 -0.3% -26
Non-deductible expenses 3.0% 239 2.8% 226
Tax incentives etc. -0.6% -45 -1.3% -109
Special items -0.4% -30 -1.1% -90
Withholding taxes 1.5% 115 3.3% 269
Other, and tax in associates -0.2% -11 -0.3% -27
Effective tax rate for the year 24.1% 1,894 23.0% 1,861
RECONCILIATION OF THE EFFECTIVE TAX RATE FOR THE YEAR
The nominal weighted tax rate for the Group is calculated as domestic tax rates applic-able to profits in the entities as a proportion of each entity’s share of the Group’s profit before tax.
1,894mTax totalled DKK 1,894m against DKK 1,861m in 2012.
24.1%Tax rate of 24.1%, positively impacted by reduction in domestic tax rates.
Key developments 2013
Consolidated financial statements SECTION 6: TAX 113Carlsberg Group Annual Report 2013
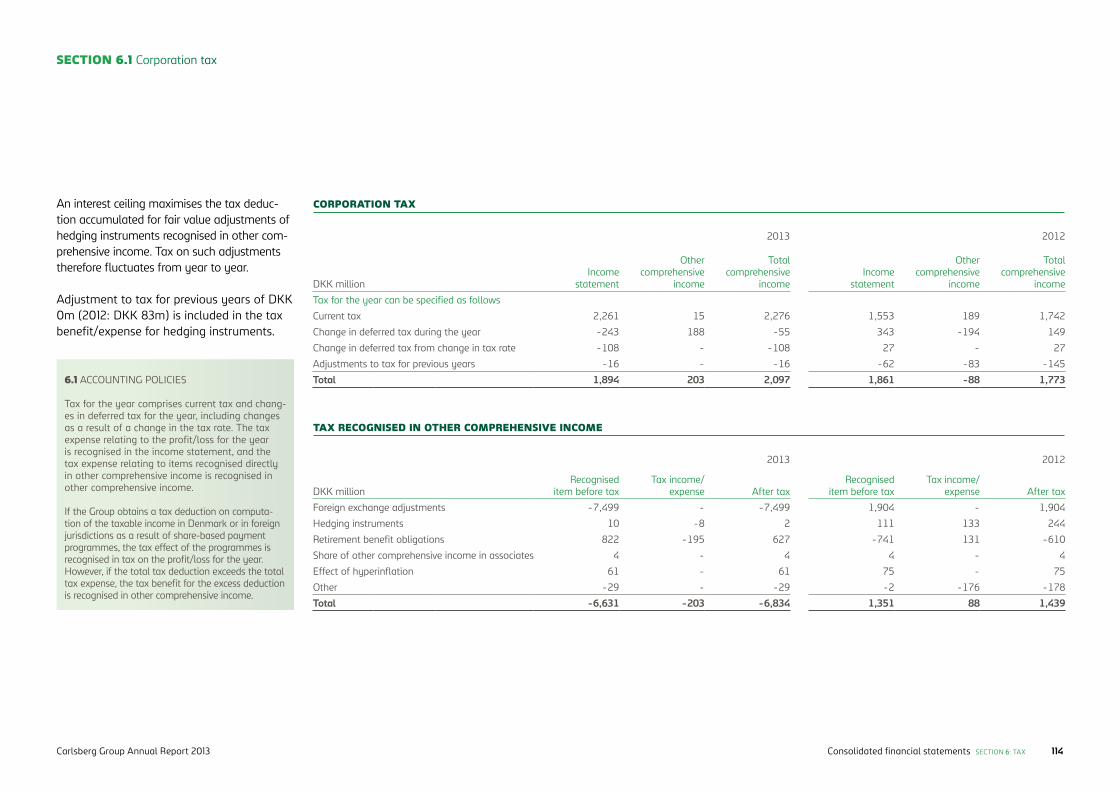
SECTION 6.1 Corporation tax
6.1 ACCOUNTING POLICIES
Tax for the year comprises current tax and chang-es in deferred tax for the year, including changes as a result of a change in the tax rate. The tax expense relating to the profit/loss for the year is recognised in the income statement, and the tax expense relating to items recognised directly in other comprehensive income is recognised in other comprehensive income.
If the Group obtains a tax deduction on computa-tion of the taxable income in Denmark or in foreign jurisdictions as a result of share-based payment programmes, the tax effect of the programmes is recognised in tax on the profit/loss for the year. However, if the total tax deduction exceeds the total tax expense, the tax benefit for the excess deduction is recognised in other comprehensive income.
TAX RECOGNISED IN OTHER COMPREHENSIVE INCOME
2013 2012
DKK millionRecognised
item before taxTax income/
expense After taxRecognised
item before taxTax income/
expense After tax
Foreign exchange adjustments -7,499 - -7,499 1,904 - 1,904
Hedging instruments 10 -8 2 111 133 244
Retirement benefit obligations 822 -195 627 -741 131 -610
Share of other comprehensive income in associates 4 - 4 4 - 4
Effect of hyperinflation 61 - 61 75 - 75
Other -29 - -29 -2 -176 -178
Total -6,631 -203 -6,834 1,351 88 1,439
CORPORATION TAX
2013 2012
DKK millionIncome
statement
Other comprehensive
income
Total comprehensive
incomeIncome
statement
Other comprehensive
income
Total comprehensive
income
Tax for the year can be specified as follows
Current tax 2,261 15 2,276 1,553 189 1,742
Change in deferred tax during the year -243 188 -55 343 -194 149
Change in deferred tax from change in tax rate -108 - -108 27 - 27
Adjustments to tax for previous years -16 - -16 -62 -83 -145
Total 1,894 203 2,097 1,861 -88 1,773
An interest ceiling maximises the tax deduc-tion accumulated for fair value adjustments of hedging instruments recognised in other com-prehensive income. Tax on such adjustments therefore fluctuates from year to year.
Adjustment to tax for previous years of DKK 0m (2012: DKK 83m) is included in the tax benefit/expense for hedging instruments.
Consolidated financial statements SECTION 6: TAX 114Carlsberg Group Annual Report 2013
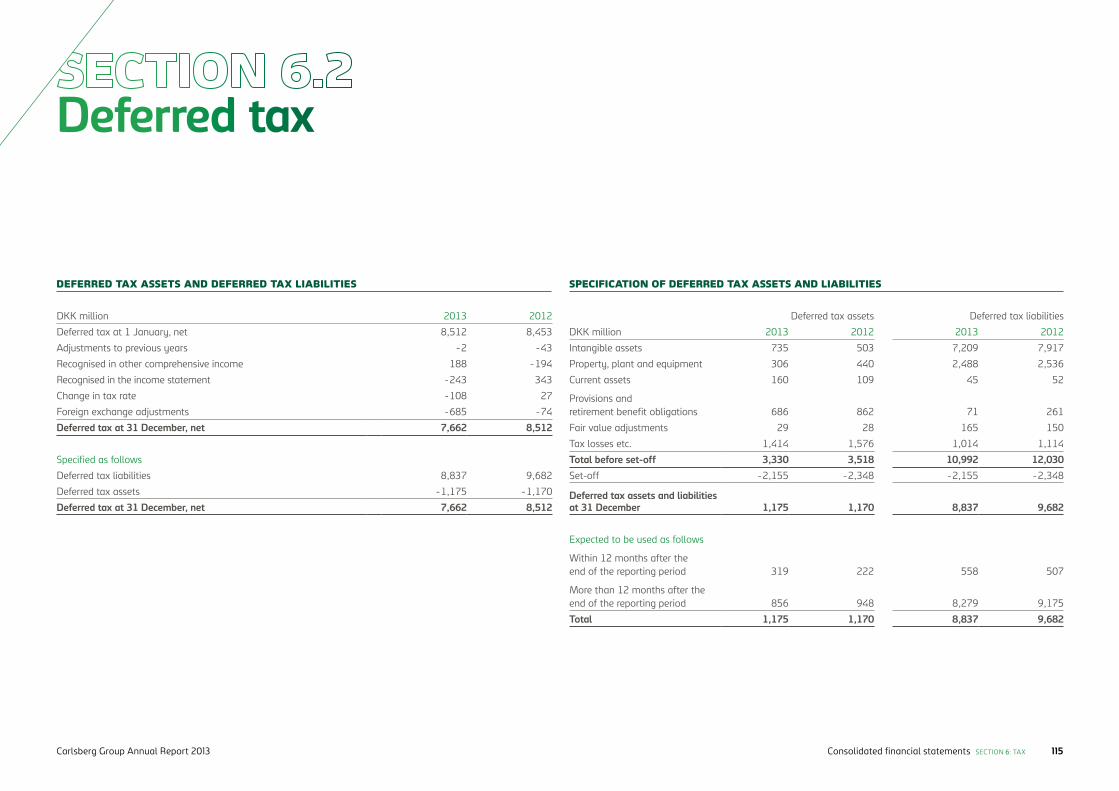
Deferred tax
DKK million 2013 2012
Deferred tax at 1 January, net 8,512 8,453
Adjustments to previous years -2 -43
Recognised in other comprehensive income 188 -194
Recognised in the income statement -243 343
Change in tax rate -108 27
Foreign exchange adjustments -685 -74
Deferred tax at 31 December, net 7,662 8,512
Specified as follows
Deferred tax liabilities 8,837 9,682
Deferred tax assets -1,175 -1,170
Deferred tax at 31 December, net 7,662 8,512
DEFERRED TAX ASSETS AND DEFERRED TAX LIABILITIES SPECIFICATION OF DEFERRED TAX ASSETS AND LIABILITIES
Deferred tax assets Deferred tax liabilities
DKK million 2013 2012 2013 2012
Intangible assets 735 503 7,209 7,917
Property, plant and equipment 306 440 2,488 2,536
Current assets 160 109 45 52
Provisions and retirement benefit obligations 686 862 71 261
Fair value adjustments 29 28 165 150
Tax losses etc. 1,414 1,576 1,014 1,114
Total before set-off 3,330 3,518 10,992 12,030Set-off -2,155 -2,348 -2,155 -2,348
Deferred tax assets and liabilities at 31 December 1,175 1,170 8,837 9,682
Expected to be used as follows
Within 12 months after the end of the reporting period 319 222 558 507
More than 12 months after the end of the reporting period 856 948 8,279 9,175
Total 1,175 1,170 8,837 9,682
Consolidated financial statements SECTION 6: TAX 115Carlsberg Group Annual Report 2013

Of the total deferred tax assets recognised, DKK 728m (2012: DKK 718m) related to tax loss carryforwards, the utilisation of which depends on future positive taxable income exceeding the realised deferred tax liabilities. It is management’s opinion that the tax loss carryforwards can be utilised.
Tax assets not recognised, DKK 1,489m (2012: DKK 1,328m), primarily related to tax losses which are not expected to be utilised in the foreseeable future. Tax losses that will not expire amounted to DKK 1,102m (2012: DKK 1,093m).
Deferred tax of DKK 77m (2012: DKK 160m) was recognised in respect of earnings in enti-ties in the Eastern Europe region which are intended for distribution in the short term, as tax of 5% is payable on distributions. For other subsidiaries where distributable reserves are planned to be distributed, any distribution of earnings will not trigger a significant tax liability based on current tax legislation.
Deferred tax on temporary differences relating to investments in subsidiaries, joint ventures and associates amounted to DKK 0m (2012: DKK 0m).
SECTION 6.2 Deferred tax
6.2 ACCOUNTING POLICIES
Current tax payable and receivable is recognised in the statement of financial position as tax computed on the taxable income for the year, adjusted for tax on the taxable income of prior years and for tax paid on account.
Deferred tax on all temporary differences between the carrying amount and the tax base of assets and liabilities is measured using the balance sheet liability method. However, deferred tax is not recognised on temporary differences relating to goodwill which is not deductible for tax purposes or on office premises and other items where tem-porary differences, apart from business combina-tions, arise at the acquisition date without affecting either profit/loss for the year or taxable income. Where alternative tax rules can be applied to de termine the tax base, deferred tax is measured based on management’s planned use of the asset or settlement of the liability.
If specific dividend plans exist for subsidiaries, joint ventures and associates in countries levying withholding tax on distributions, deferred tax is recognised on expected dividend payments.
Deferred tax assets, including the tax base of tax loss carryforwards, are recognised under other non-current assets at the expected value of their utilisation, either as a set-off against tax on future income or as a set-off against deferred tax liabili-ties in the same legal tax entity and jurisdiction. Deferred tax assets and tax liabilities are offset if the entity has a legally enforceable right to offset
current tax liabilities and tax assets or intends either to settle current tax liabilities and tax assets or to realise the assets and settle the liabilities simultaneously. Deferred tax assets are subject to annual impairment tests and are recognised only to the extent that it is probable that the assets will be utilised.
Adjustment is made to deferred tax resulting from elimination of unrealised intra-Group profits and losses.
Deferred tax is measured according to the tax rules and at the tax rates applicable in the respective countries at the end of the reporting period and when the deferred tax is expected to crystallise as current tax. The change in deferred tax as a result of changes in tax rates is recognised in the income statement. Changes to deferred tax on items recog-nised in other comprehensive income are, however, recognised in other comprehensive income.
6.2 SIGNIFICANT ACCOUNTING ESTIMATES AND JUDGEMENTS
The Group recognises deferred tax as-sets, including the expected tax value of tax loss carryforwards, if management assesses that these tax assets can be offset against positive taxable income in the foreseeable future. This judgement is made annually and based on budgets and business plans for the coming years, including planned commercial initiatives.
Consolidated financial statements SECTION 6: TAX 116Carlsberg Group Annual Report 2013
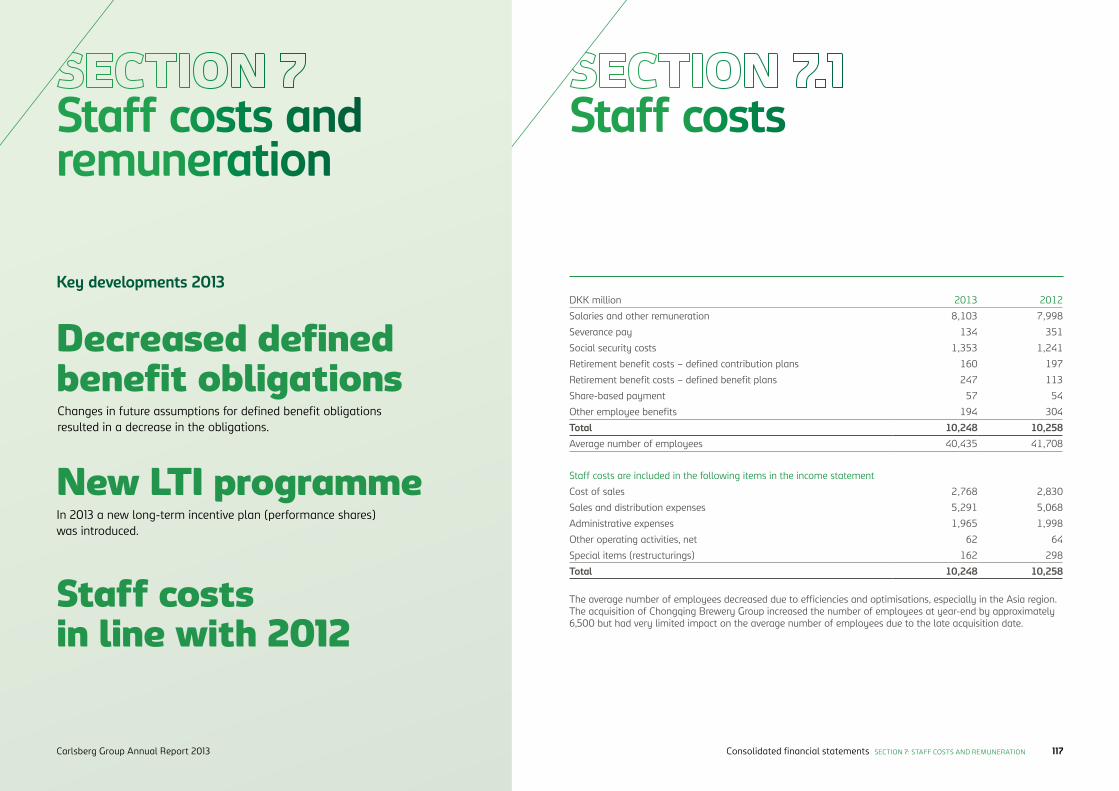
Staff costsStaff costs and remuneration
Decreased defined benefit obligations
New LTI programme
Staff costs in line with 2012
Changes in future assumptions for defined benefit obligations resulted in a decrease in the obligations.
In 2013 a new long-term incentive plan (performance shares) was introduced.
DKK million 2013 2012
Salaries and other remuneration 8,103 7,998
Severance pay 134 351
Social security costs 1,353 1,241
Retirement benefit costs – defined contribution plans 160 197
Retirement benefit costs – defined benefit plans 247 113
Share-based payment 57 54
Other employee benefits 194 304
Total 10,248 10,258Average number of employees 40,435 41,708
Staff costs are included in the following items in the income statement
Cost of sales 2,768 2,830
Sales and distribution expenses 5,291 5,068
Administrative expenses 1,965 1,998
Other operating activities, net 62 64
Special items (restructurings) 162 298
Total 10,248 10,258
The average number of employees decreased due to efficiencies and optimisations, especially in the Asia region. The acquisition of Chongqing Brewery Group increased the number of employees at year-end by approximately 6,500 but had very limited impact on the average number of employees due to the late acquisition date.
Key developments 2013
Consolidated financial statements SECTION 7: STAFF COSTS AND REMUNERATION 117Carlsberg Group Annual Report 2013
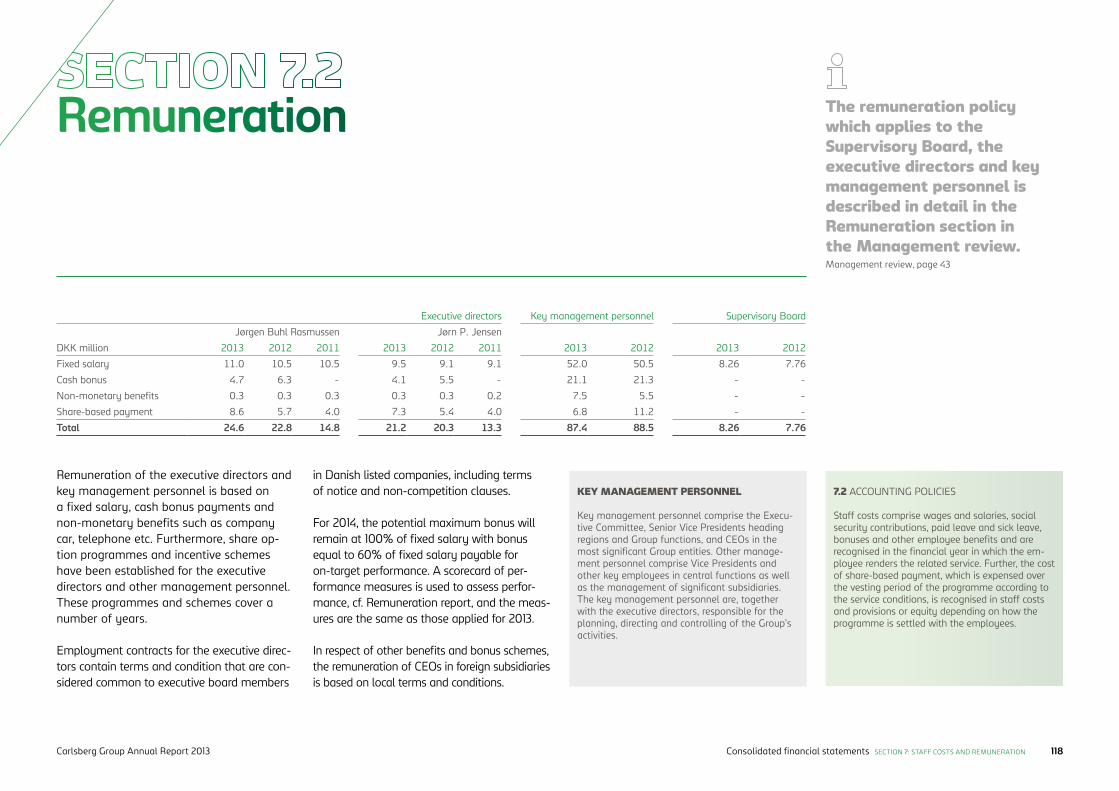
Remuneration
Remuneration of the executive directors and key management personnel is based on a fixed salary, cash bonus payments and non-monetary benefits such as company car, telephone etc. Furthermore, share op-tion programmes and incentive schemes have been established for the executive directors and other management personnel. These pro grammes and schemes cover a number of years.
Employment contracts for the executive direc-tors contain terms and condition that are con-sidered common to executive board members
Executive directors Key management personnel Supervisory Board
Jørgen Buhl Rasmussen Jørn P. Jensen
DKK million 2013 2012 2011 2013 2012 2011 2013 2012 2013 2012
Fixed salary 11.0 10.5 10.5 9.5 9.1 9.1 52.0 50.5 8.26 7.76
Cash bonus 4.7 6.3 - 4.1 5.5 - 21.1 21.3 - -
Non-monetary benefits 0.3 0.3 0.3 0.3 0.3 0.2 7.5 5.5 - -
Share-based payment 8.6 5.7 4.0 7.3 5.4 4.0 6.8 11.2 - -
Total 24.6 22.8 14.8 21.2 20.3 13.3 87.4 88.5 8.26 7.76
KEY MANAGEMENT PERSONNEL
Key management personnel comprise the Execu-tive Committee, Senior Vice Presidents heading regions and Group functions, and CEOs in the most significant Group entities. Other manage-ment personnel comprise Vice Presidents and other key employees in central functions as well as the management of significant subsidiaries. The key management personnel are, together with the executive directors, responsible for the planning, directing and controlling of the Group’s activities.
7.2 ACCOUNTING POLICIES
Staff costs comprise wages and salaries, social security contributions, paid leave and sick leave, bonuses and other employee benefits and are recognised in the financial year in which the em-ployee renders the related service. Further, the cost of share-based payment, which is expensed over the vesting period of the programme according to the service conditions, is recognised in staff costs and provisions or equity depending on how the programme is settled with the employees.
The remuneration policy which applies to the Supervisory Board, the executive directors and key management personnel is described in detail in the Remuneration section in the Management review.Management review, page 43
in Danish listed companies, including terms of notice and non-competition clauses.
For 2014, the potential maximum bonus will remain at 100% of fixed salary with bonus equal to 60% of fixed salary payable for on-target performance. A scorecard of per-formance measures is used to assess perfor-mance, cf. Remuneration report, and the meas-ures are the same as those applied for 2013.
In respect of other benefits and bonus schemes, the remuneration of CEOs in foreign subsidiaries is based on local terms and conditions.
Consolidated financial statements SECTION 7: STAFF COSTS AND REMUNERATION 118Carlsberg Group Annual Report 2013
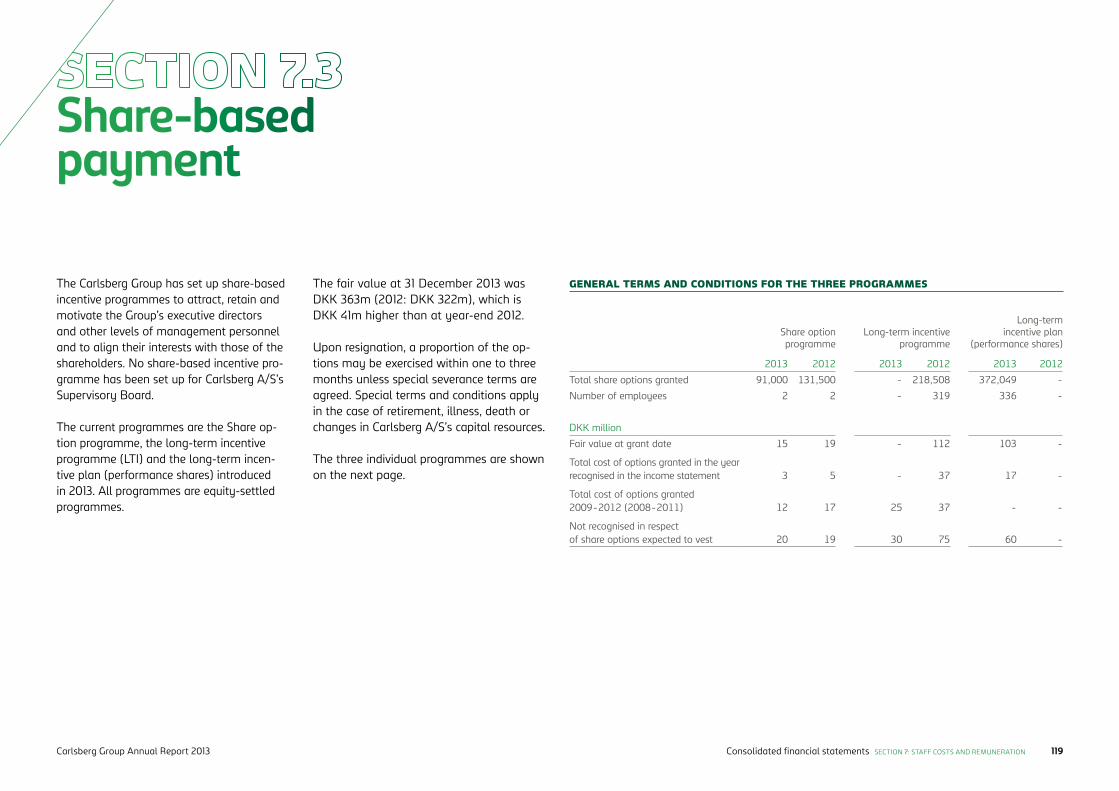
Share-based payment
The Carlsberg Group has set up share-based incentive programmes to attract, retain and motivate the Group’s executive directors and other levels of management personnel and to align their interests with those of the shareholders. No share-based incentive pro-gramme has been set up for Carlsberg A/S’s Supervisory Board.
The current programmes are the Share op-tion programme, the long-term incentive programme (LTI) and the long-term incen-tive plan (performance shares) introduced in 2013. All programmes are equity-settled programmes.
Share option programme
Long-term incentive programme
Long-term incentive plan
(performance shares)
2013 2012 2013 2012 2013 2012
Total share options granted 91,000 131,500 - 218,508 372,049 -
Number of employees 2 2 - 319 336 -
DKK million
Fair value at grant date 15 19 - 112 103 -
Total cost of options granted in the year recognised in the income statement 3 5 - 37 17 -
Total cost of options granted 2009-2012 (2008-2011) 12 17 25 37 - -
Not recognised in respect of share options expected to vest 20 19 30 75 60 -
The fair value at 31 December 2013 was DKK 363m (2012: DKK 322m), which is DKK 41m higher than at year-end 2012.
Upon resignation, a proportion of the op-tions may be exercised within one to three months unless special severance terms are agreed. Special terms and conditions apply in the case of retirement, illness, death or changes in Carlsberg A/S’s capital resources.
The three individual programmes are shown on the next page.
GENERAL TERMS AND CONDITIONS FOR THE THREE PROGRAMMES
Consolidated financial statements SECTION 7: STAFF COSTS AND REMUNERATION 119Carlsberg Group Annual Report 2013
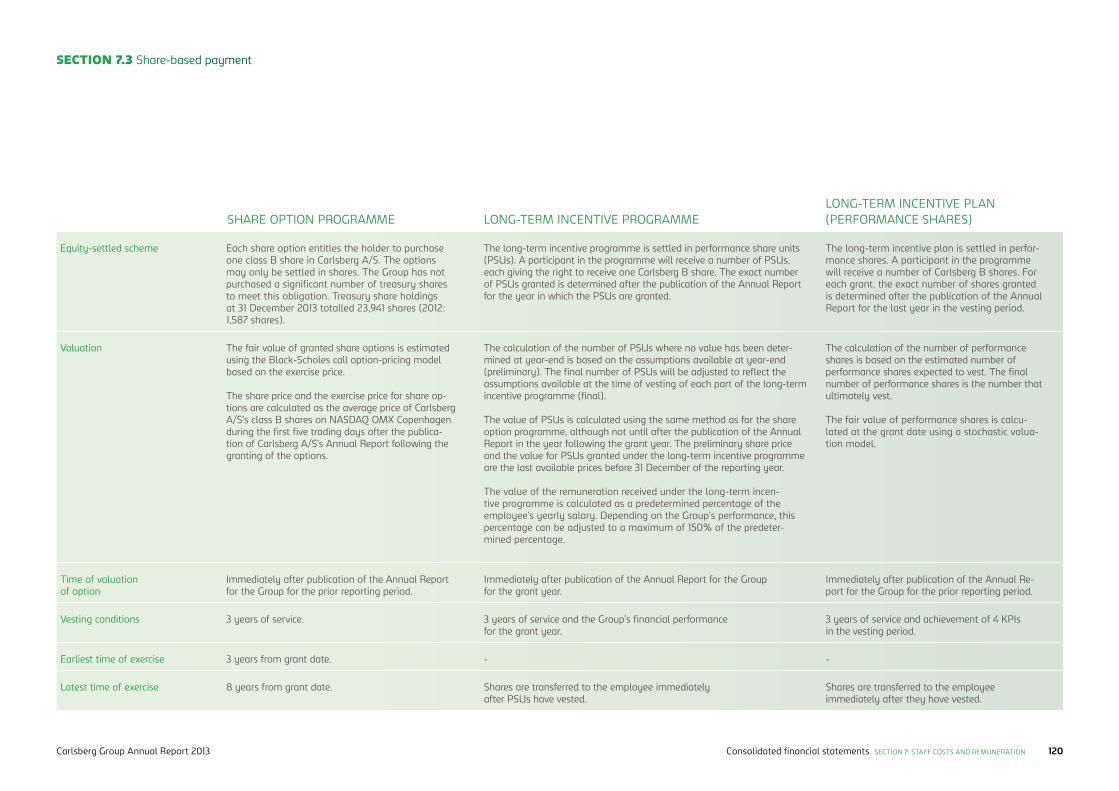
SECTION 7.3 Share-based payment
SHARE OPTION PROGRAMME LONG-TERM INCENTIVE PROGRAMMELONG-TERM INCENTIVE PLAN (PERFORMANCE SHARES)
Equity-settled scheme Each share option entitles the holder to purchase one class B share in Carlsberg A/S. The options may only be settled in shares. The Group has not purchased a significant number of treasury shares to meet this obligation. Treasury share holdings at 31 December 2013 totalled 23,941 shares (2012: 1,587 shares).
The long-term incentive programme is settled in performance share units (PSUs). A participant in the programme will receive a number of PSUs, each giving the right to receive one Carlsberg B share. The exact number of PSUs granted is determined after the publication of the Annual Report for the year in which the PSUs are granted.
The long-term incentive plan is settled in perfor-mance shares. A participant in the programme will receive a number of Carlsberg B shares. For each grant, the exact number of shares granted is determined after the publication of the Annual Report for the last year in the vesting period.
Valuation The fair value of granted share options is estimated using the Black-Scholes call option-pricing model based on the exercise price.
The share price and the exercise price for share op-tions are calculated as the average price of Carlsberg A/S’s class B shares on NASDAQ OMX Copenhagen during the first five trading days after the publica-tion of Carlsberg A/S’s Annual Report following the granting of the options.
The calculation of the number of PSUs where no value has been deter-mined at year-end is based on the assumptions available at year-end (preliminary). The final number of PSUs will be adjusted to reflect the assumptions available at the time of vesting of each part of the long-term incentive programme (final).
The value of PSUs is calculated using the same method as for the share option programme, although not until after the publication of the Annual Report in the year following the grant year. The preliminary share price and the value for PSUs granted under the long-term incentive programme are the last available prices before 31 December of the reporting year.
The value of the remuneration received under the long-term incen-tive programme is calculated as a predetermined percentage of the employee’s yearly salary. Depending on the Group’s performance, this percentage can be adjusted to a maximum of 150% of the predeter-mined percentage.
The calculation of the number of performance shares is based on the estimated number of performance shares expected to vest. The final number of performance shares is the number that ultimately vest.
The fair value of performance shares is calcu-lated at the grant date using a stochastic valua-tion model.
Time of valuation of option
Immediately after publication of the Annual Report for the Group for the prior reporting period.
Immediately after publication of the Annual Report for the Group for the grant year.
Immediately after publication of the Annual Re-port for the Group for the prior reporting period.
Vesting conditions 3 years of service. 3 years of service and the Group’s financial performance for the grant year.
3 years of service and achievement of 4 KPIs in the vesting period.
Earliest time of exercise 3 years from grant date. - -
Latest time of exercise 8 years from grant date. Shares are transferred to the employee immediately after PSUs have vested.
Shares are transferred to the employee immediately after they have vested.
Consolidated financial statements SECTION 7: STAFF COSTS AND REMUNERATION 120Carlsberg Group Annual Report 2013
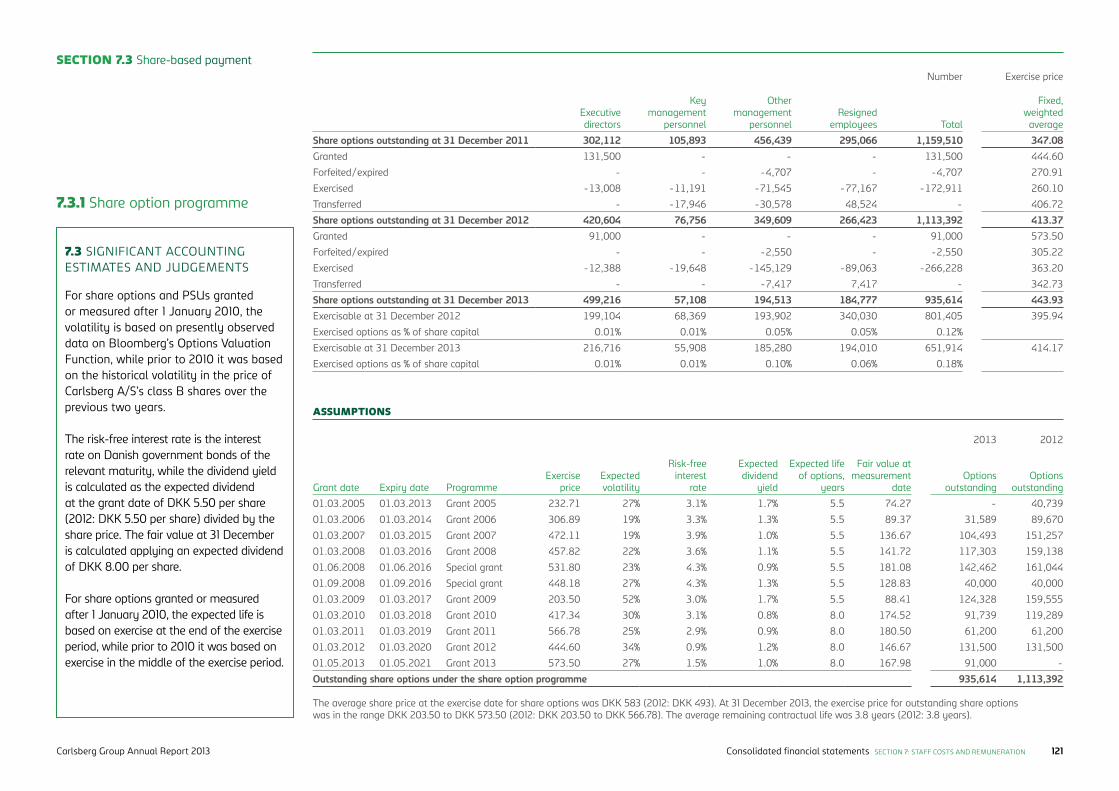
SECTION 7.3 Share-based paymentNumber Exercise price
Executive directors
Key management
personnel
Other management
personnelResigned
employees Total
Fixed, weighted average
Share options outstanding at 31 December 2011 302,112 105,893 456,439 295,066 1,159,510 347.08Granted 131,500 - - - 131,500 444.60
Forfeited/expired - - -4,707 - -4,707 270.91
Exercised -13,008 -11,191 -71,545 -77,167 -172,911 260.10
Transferred - -17,946 -30,578 48,524 - 406.72
Share options outstanding at 31 December 2012 420,604 76,756 349,609 266,423 1,113,392 413.37Granted 91,000 - - - 91,000 573.50
Forfeited/expired - - -2,550 - -2,550 305.22
Exercised -12,388 -19,648 -145,129 -89,063 -266,228 363.20
Transferred - - -7,417 7,417 - 342.73
Share options outstanding at 31 December 2013 499,216 57,108 194,513 184,777 935,614 443.93Exercisable at 31 December 2012 199,104 68,369 193,902 340,030 801,405 395.94
Exercised options as % of share capital 0.01% 0.01% 0.05% 0.05% 0.12%
Exercisable at 31 December 2013 216,716 55,908 185,280 194,010 651,914 414.17
Exercised options as % of share capital 0.01% 0.01% 0.10% 0.06% 0.18%
2013 2012
Grant date Expiry date ProgrammeExercise
priceExpected volatility
Risk-free interest
rate
Expected dividend
yield
Expected life of options,
years
Fair value at measure ment
dateOptions
outstandingOptions
outstanding
01.03.2005 01.03.2013 Grant 2005 232.71 27% 3.1% 1.7% 5.5 74.27 - 40,739
01.03.2006 01.03.2014 Grant 2006 306.89 19% 3.3% 1.3% 5.5 89.37 31,589 89,670
01.03.2007 01.03.2015 Grant 2007 472.11 19% 3.9% 1.0% 5.5 136.67 104,493 151,257
01.03.2008 01.03.2016 Grant 2008 457.82 22% 3.6% 1.1% 5.5 141.72 117,303 159,138
01.06.2008 01.06.2016 Special grant 531.80 23% 4.3% 0.9% 5.5 181.08 142,462 161,044
01.09.2008 01.09.2016 Special grant 448.18 27% 4.3% 1.3% 5.5 128.83 40,000 40,000
01.03.2009 01.03.2017 Grant 2009 203.50 52% 3.0% 1.7% 5.5 88.41 124,328 159,555
01.03.2010 01.03.2018 Grant 2010 417.34 30% 3.1% 0.8% 8.0 174.52 91,739 119,289
01.03.2011 01.03.2019 Grant 2011 566.78 25% 2.9% 0.9% 8.0 180.50 61,200 61,200
01.03.2012 01.03.2020 Grant 2012 444.60 34% 0.9% 1.2% 8.0 146.67 131,500 131,500
01.05.2013 01.05.2021 Grant 2013 573.50 27% 1.5% 1.0% 8.0 167.98 91,000 -
Outstanding share options under the share option programme 935,614 1,113,392
The average share price at the exercise date for share options was DKK 583 (2012: DKK 493). At 31 December 2013, the exercise price for outstanding share options was in the range DKK 203.50 to DKK 573.50 (2012: DKK 203.50 to DKK 566.78). The average remaining contractual life was 3.8 years (2012: 3.8 years).
7.3.1 Share option programme
ASSUMPTIONS
7.3 SIGNIFICANT ACCOUNTING ESTIMATES AND JUDGEMENTS
For share options and PSUs granted or measured after 1 January 2010, the volatility is based on presently observed data on Bloomberg’s Options Valuation Function, while prior to 2010 it was based on the historical volatility in the price of Carlsberg A/S’s class B shares over the previous two years.
The risk-free interest rate is the interest rate on Danish government bonds of the relevant maturity, while the dividend yield is calculated as the expected dividend at the grant date of DKK 5.50 per share (2012: DKK 5.50 per share) divided by the share price. The fair value at 31 December is calculated applying an expected dividend of DKK 8.00 per share.
For share options granted or measured after 1 January 2010, the expected life is based on exercise at the end of the exercise period, while prior to 2010 it was based on exercise in the middle of the exercise period.
Consolidated financial statements SECTION 7: STAFF COSTS AND REMUNERATION 121Carlsberg Group Annual Report 2013

SECTION 7.3 Share-based payment
7.3.2 Long-term incentive programme
NumberExecutive directors
Key management
personnel
Other management
personnelResigned
employees Total
Performance share units outstanding at 31 December 2011 - - - - -Granted - 28,455 174,500 - 202,955
Transferred - -3,860 -5,670 9,530 -
Performance share units outstanding at 31 December 2012 - 24,595 168,830 9,530 202,955Forfeited/expired - - - -6,547 -6,547
Adjusted - 3,278 19,061 -239 22,100
Transferred - -3,614 -11,955 15,569 -
Performance share units outstanding at 31 December 2013 - 24,259 175,936 18,313 218,508
2013 2012
Grant date Expiry date ProgrammeExercise
priceExpected volatility
Risk-free interest
rate
Expected dividend
yield
Expected life of units,
years
Fair value at measurement
dateUnits
outstandingUnits
outstanding
01.01.2012 01.03.2015 LTI 2012-2014 (preliminary)
None 284% 0.3% 1.2% 3.2 542.22 - 202,955
01.01.2012 01.03.2015 LTI 2012-2014 (final)
None 284% 0.3% 1.2% 3.2 542.22 218,508 -
Outstanding performance share units under the long-term incentive programme 218,508 202,955
ASSUMPTIONS
There were no exercisable PSUs in the long-term incentive programme at 31 December 2013.
Transferred PSUs comprise PSUs that have been granted to employees who have either moved between management categories or left the Group during the year.
Consolidated financial statements SECTION 7: STAFF COSTS AND REMUNERATION 122Carlsberg Group Annual Report 2013
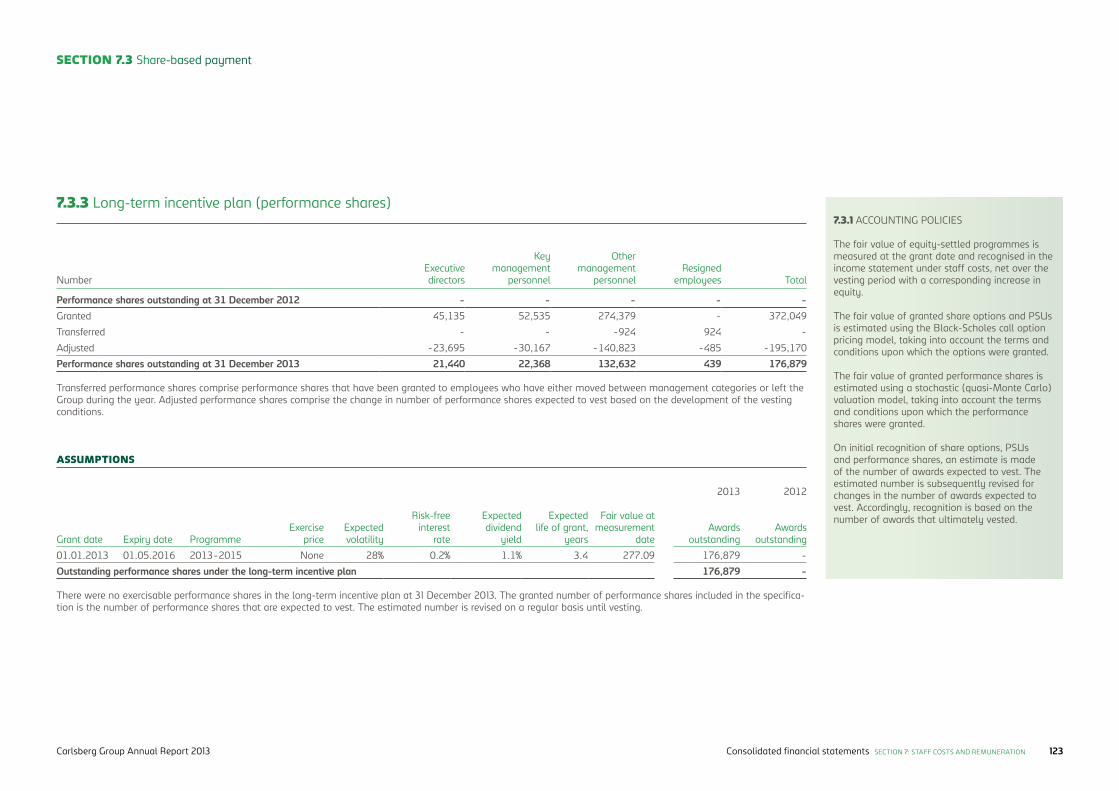
SECTION 7.3 Share-based payment
7.3.3 Long-term incentive plan (performance shares)7.3.1 ACCOUNTING POLICIES
The fair value of equity-settled programmes is measured at the grant date and recognised in the income statement under staff costs, net over the vesting period with a corresponding increase in equity.
The fair value of granted share options and PSUs is estimated using the Black-Scholes call option pricing model, taking into account the terms and conditions upon which the options were granted.
The fair value of granted performance shares is estimated using a stochastic (quasi-Monte Carlo) valuation model, taking into account the terms and conditions upon which the performance shares were granted.
On initial recognition of share options, PSUs and performance shares, an estimate is made of the number of awards expected to vest. The estimated number is subsequently revised for changes in the number of awards expected to vest. Accordingly, recognition is based on the number of awards that ultimately vested.
NumberExecutive directors
Key management
personnel
Other management
personnelResigned
employees Total
Performance shares outstanding at 31 December 2012 - - - - -Granted 45,135 52,535 274,379 - 372,049
Transferred - - -924 924 -
Adjusted -23,695 -30,167 -140,823 -485 -195,170
Performance shares outstanding at 31 December 2013 21,440 22,368 132,632 439 176,879
2013 2012
Grant date Expiry date ProgrammeExercise
priceExpected volatility
Risk-free interest
rate
Expected dividend
yield
Expected life of grant,
years
Fair value at measurement
dateAwards
outstandingAwards
outstanding
01.01.2013 01.05.2016 2013-2015 None 28% 0.2% 1.1% 3.4 277.09 176,879 -
Outstanding performance shares under the long-term incentive plan 176,879 -
ASSUMPTIONS
There were no exercisable performance shares in the long-term incentive plan at 31 December 2013. The granted number of performance shares included in the specifica-tion is the number of performance shares that are expected to vest. The estimated number is revised on a regular basis until vesting.
Transferred performance shares comprise performance shares that have been granted to employees who have either moved between management categories or left the Group during the year. Adjusted performance shares comprise the change in number of performance shares expected to vest based on the development of the vesting conditions.
Consolidated financial statements SECTION 7: STAFF COSTS AND REMUNERATION 123Carlsberg Group Annual Report 2013
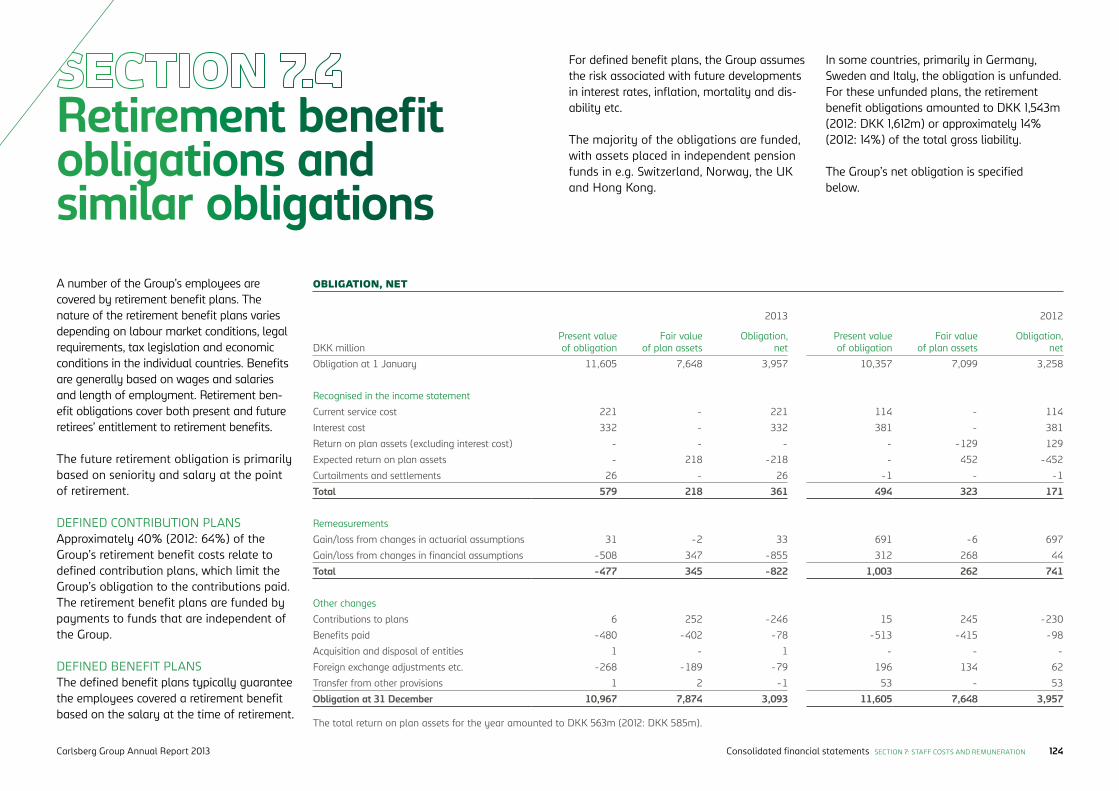
Retirement benefit obligations and similar obligations
2013 2012
DKK millionPresent value of obligation
Fair value of plan assets
Obligation, net
Present value of obligation
Fair value of plan assets
Obligation, net
Obligation at 1 January 11,605 7,648 3,957 10,357 7,099 3,258
Recognised in the income statement
Current service cost 221 - 221 114 - 114
Interest cost 332 - 332 381 - 381
Return on plan assets (excluding interest cost) - - - - -129 129
Expected return on plan assets - 218 -218 - 452 -452
Curtailments and settlements 26 - 26 -1 - -1
Total 579 218 361 494 323 171
Remeasurements
Gain/loss from changes in actuarial assumptions 31 -2 33 691 -6 697
Gain/loss from changes in financial assumptions -508 347 -855 312 268 44
Total -477 345 -822 1,003 262 741
Other changes
Contributions to plans 6 252 -246 15 245 -230
Benefits paid -480 -402 -78 -513 -415 -98
Acquisition and disposal of entities 1 - 1 - - -
Foreign exchange adjustments etc. -268 -189 -79 196 134 62
Transfer from other provisions 1 2 -1 53 - 53
Obligation at 31 December 10,967 7,874 3,093 11,605 7,648 3,957
OBLIGATION, NET
The total return on plan assets for the year amounted to DKK 563m (2012: DKK 585m).
A number of the Group’s employees are covered by retirement benefit plans. The nature of the retirement benefit plans varies depending on labour market conditions, legal requirements, tax legislation and economic conditions in the individual countries. Benefits are generally based on wages and salaries and length of employment. Retirement ben-efit obligations cover both present and future retirees’ entitlement to retirement benefits.
The future retirement obligation is primarily based on seniority and salary at the point of retirement.
DEFINED CONTRIBUTION PLANSApproximately 40% (2012: 64%) of the Group’s retirement benefit costs relate to defined contribution plans, which limit the Group’s obligation to the contributions paid. The retirement benefit plans are funded by payments to funds that are independent of the Group.
DEFINED BENEFIT PLANS The defined benefit plans typically guarantee the employees covered a retirement benefit based on the salary at the time of retirement.
For defined benefit plans, the Group assumes the risk associated with future developments in interest rates, inflation, mortality and dis-ability etc.
The majority of the obligations are funded, with assets placed in independent pension funds in e.g. Switzerland, Norway, the UK and Hong Kong.
In some countries, primarily in Germany, Sweden and Italy, the obligation is unfunded. For these unfunded plans, the retirement benefit obligations amounted to DKK 1,543m (2012: DKK 1,612m) or approximately 14% (2012: 14%) of the total gross liability.
The Group’s net obligation is specified below.
Consolidated financial statements SECTION 7: STAFF COSTS AND REMUNERATION 124Carlsberg Group Annual Report 2013
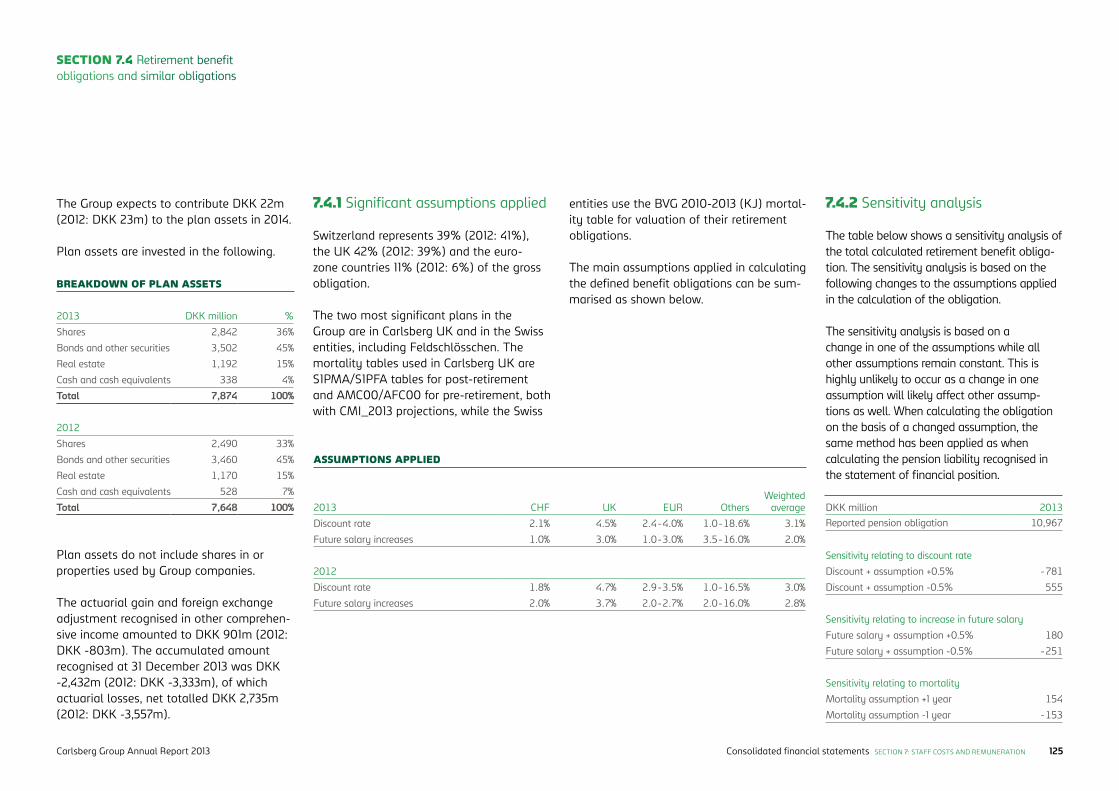
SECTION 7.4 Retirement benefit obligations and similar obligations
2013 DKK million %
Shares 2,842 36%
Bonds and other securities 3,502 45%
Real estate 1,192 15%
Cash and cash equivalents 338 4%
Total 7,874 100%
2012
Shares 2,490 33%
Bonds and other securities 3,460 45%
Real estate 1,170 15%
Cash and cash equivalents 528 7%
Total 7,648 100%
BREAKDOWN OF PLAN ASSETS
The Group expects to contribute DKK 22m (2012: DKK 23m) to the plan assets in 2014.
Plan assets are invested in the following.
2013 CHF UK EUR OthersWeighted
average
Discount rate 2.1% 4.5% 2.4-4.0% 1.0-18.6% 3.1%
Future salary increases 1.0% 3.0% 1.0-3.0% 3.5-16.0% 2.0%
2012
Discount rate 1.8% 4.7% 2.9-3.5% 1.0-16.5% 3.0%
Future salary increases 2.0% 3.7% 2.0-2.7% 2.0-16.0% 2.8%
ASSUMPTIONS APPLIED
7.4.1 Significant assumptions applied
Switzerland represents 39% (2012: 41%), the UK 42% (2012: 39%) and the euro-zone countries 11% (2012: 6%) of the gross obligation.
The two most significant plans in the Group are in Carlsberg UK and in the Swiss entities, including Feldschlösschen. The mortality tables used in Carlsberg UK are S1PMA/S1PFA tables for post-retirement and AMC00/AFC00 for pre-retirement, both with CMI_2013 projections, while the Swiss
7.4.2 Sensitivity analysis
The table below shows a sensitivity analysis of the total calculated retirement benefit obliga-tion. The sensitivity analysis is based on the following changes to the assumptions applied in the calculation of the obligation.
The sensitivity analysis is based on a change in one of the assumptions while all other assumptions remain constant. This is highly unlikely to occur as a change in one assumption will likely affect other assump-tions as well. When calculating the obligation on the basis of a changed assump tion, the same method has been applied as when calculating the pension liability recognised in the statement of financial position.
DKK million 2013Reported pension obligation 10,967
Sensitivity relating to discount rate
Discount + assumption +0.5% -781
Discount + assumption -0.5% 555
Sensitivity relating to increase in future salary
Future salary + assumption +0.5% 180
Future salary + assumption -0.5% -251
Sensitivity relating to mortality
Mortality assumption +1 year 154
Mortality assumption -1 year -153
entities use the BVG 2010-2013 (KJ) mortal-ity table for valuation of their retirement obligations.
The main assumptions applied in calculating the defined benefit obligations can be sum-marised as shown below.
Plan assets do not include shares in or properties used by Group companies.
The actuarial gain and foreign exchange adjustment recognised in other comprehen-sive income amounted to DKK 901m (2012: DKK -803m). The accumulated amount recognised at 31 December 2013 was DKK -2,432m (2012: DKK -3,333m), of which actuarial losses, net totalled DKK 2,735m (2012: DKK -3,557m).
Consolidated financial statements SECTION 7: STAFF COSTS AND REMUNERATION 125Carlsberg Group Annual Report 2013
DKK million<1
year1-5
years>5
years Total
Pension benefits 365 1,808 18,441 20,614
MATURITY OF PENSION OBLIGATIONS
7.4 ACCOUNTING POLICIES
A defined contribution plan is a post-employment benefit plan under which the Group pays fixed contributions into a separate entity and will have no legal or constructive obligation to pay further amounts. Contributions to defined contribution plans are recognised in the income statement in the period during which services are rendered by employees. Any contributions outstanding are recognised in the state-ment of financial position as other liabilities.
A defined benefit plan is a post-employment bene-fit plan other than a defined contribution plan. The Group’s net obligation in respect of defined benefit pension plans is calculated separately for each plan by estimating the amount of future benefits that employ-ees have earned in return for their service in the current and previous years. The future benefits are discounted to determine the present value. The calculation is performed annually by a qualified actuary.
The present value is determined on the basis of as-sumptions about the future development in variables such as salary levels, interest rates, inflation and mor-tality. The actuarial present value less the fair value of any plan assets is recognised in the statement of financial position under retirement benefit obligations.
Pension costs for the year are recognised in the income statement based on actuarial estimates and financial expectations at the beginning of the year. Any difference between the expected development in pension assets and liabilities and realised amounts at year-end are designated as actuarial gains or losses and recognised in other comprehensive income.
If changes in benefits relating to services rendered by employees in previous years result in changes in the actuarial present value, the changes are recognised as historical costs. Historical costs are recognised imme-diately, provided employees have already earned the changed benefits. If employees have not earned the benefits, the historical costs are recognised in the in-come statement over the period in which the changed benefits are earned by the employees.
If a retirement benefit plan constitutes a net asset, the asset is only recognised if it offsets future refunds from the plan or will lead to reduced future payments to the plan.
Interest on retirement benefit obligations and the expected return on plan assets are recognised under financial income or financial expenses.
Realised gains and losses on the adjustment of retire-ment benefit obligations as a result of large-scale termination of jobs in connection with restructurings are recognised in the income statement under special items.
Realised gains and losses on the curtailment or settle-ment of retirement benefit plans are recognised in the income statement under staff costs.
7.4 SIGNIFICANT ACCOUNTING ESTIMATES AND JUDGEMENTS
When calculating the value of the Group’s defined benefit plans, a number of sig-nificant actuarial assumptions are made, including discount rates, expected return on plan assets, expected growth in wages and salaries, mortality and retirement benefits. The range and weighted average for these assumptions are disclosed in the table.
The value of the Group’s defined benefit plans is based on valuations from external actuaries.
The actuarial assumptions underlying the calculations and valuations vary from country to country due to local economic conditions and labour market conditions.
The present value of the net obligation is calculated based on the expected long-term interest rate in each country, where available, based on long-term govern-ment bonds.
Mortality assumptions are based on the Group entity’s best estimate of the mortal-ity of plan members during and after em-ployment, and include expected changes in mortality, for example using estimates of mortality improvements. Due to the broad range of entities comprising the retirement benefit obligation, several different mortal-ity tables are used to calculate the future retirement benefit obligation.
SECTION 7.4 Retirement benefit obligations and similar obligations
EXPECTED MATURITY AND DURATIONRetirement benefit obligations are primarily expected to mature after 5 years. The non-discounted maturity is:
The expected duration of the obligations at year-end 2013 was 20 years, comprising active employees at 26 years and retired employees at 15 years.
The duration is calculated using a weighted average of the duration compared to the benefit obligation.
Consolidated financial statements SECTION 7: STAFF COSTS AND REMUNERATION 126Carlsberg Group Annual Report 2013
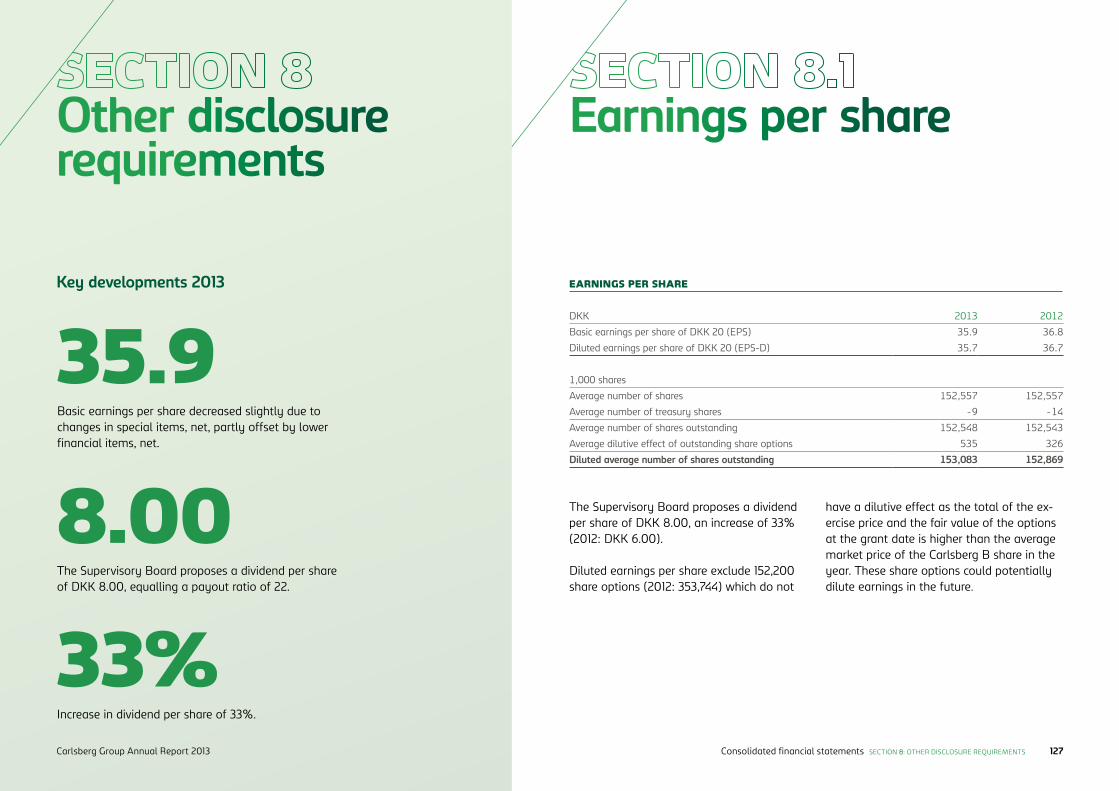
Earnings per shareOther disclosure requirements
EARNINGS PER SHARE
DKK 2013 2012
Basic earnings per share of DKK 20 (EPS) 35.9 36.8
Diluted earnings per share of DKK 20 (EPS-D) 35.7 36.7
1,000 shares
Average number of shares 152,557 152,557
Average number of treasury shares -9 -14
Average number of shares outstanding 152,548 152,543
Average dilutive effect of outstanding share options 535 326
Diluted average number of shares outstanding 153,083 152,869
The Supervisory Board proposes a dividend per share of DKK 8.00, an increase of 33% (2012: DKK 6.00).
Diluted earnings per share exclude 152,200 share options (2012: 353,744) which do not
have a dilutive effect as the total of the ex-ercise price and the fair value of the options at the grant date is higher than the average market price of the Carlsberg B share in the year. These share options could potentially dilute earnings in the future.
8.00The Supervisory Board proposes a dividend per share of DKK 8.00, equalling a payout ratio of 22.
33%Increase in dividend per share of 33%.
35.9Basic earnings per share decreased slightly due to changes in special items, net, partly offset by lower financial items, net.
Key developments 2013
Consolidated financial statements SECTION 8: OTHER DISCLOSURE REQUIREMENTS 127Carlsberg Group Annual Report 2013
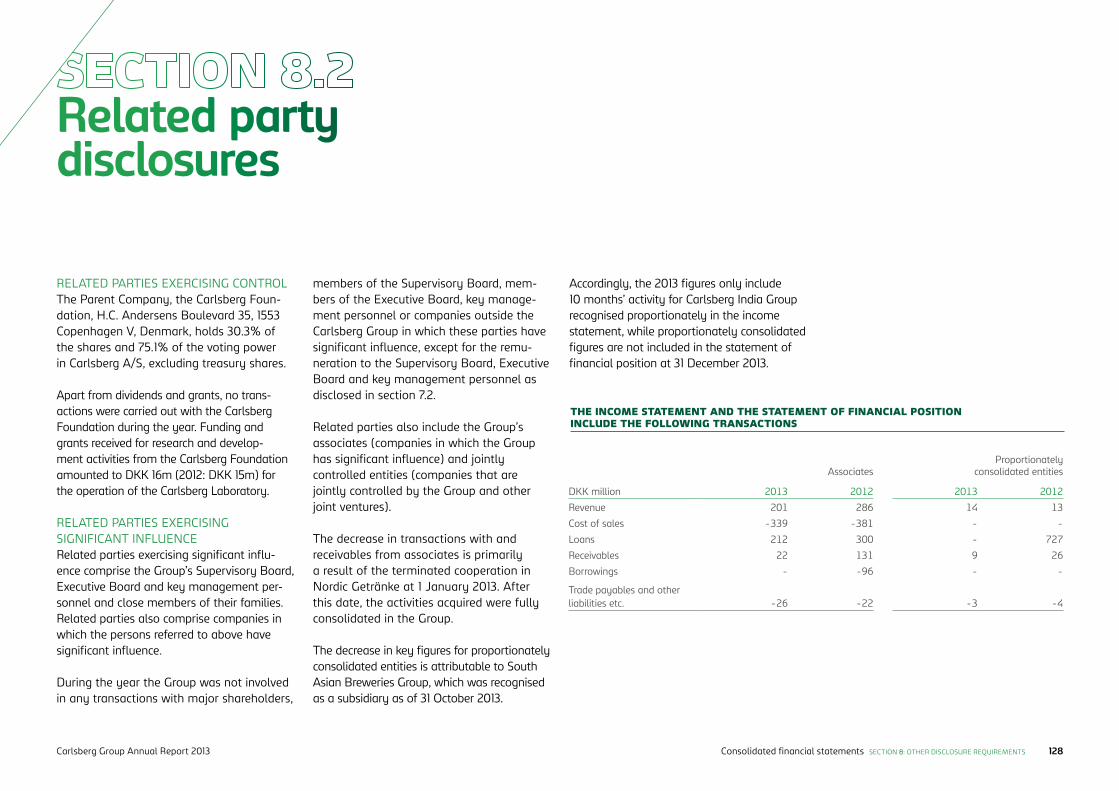
Related party disclosures
RELATED PARTIES EXERCISING CONTROLThe Parent Company, the Carlsberg Foun-dation, H.C. Andersens Boulevard 35, 1553 Copenhagen V, Denmark, holds 30.3% of the shares and 75.1% of the voting power in Carlsberg A/S, excluding treasury shares.
Apart from dividends and grants, no trans-actions were carried out with the Carlsberg Foundation during the year. Funding and grants received for research and develop-ment activities from the Carlsberg Foundation amounted to DKK 16m (2012: DKK 15m) for the operation of the Carlsberg Laboratory.
RELATED PARTIES EXERCISING SIGNIFICANT INFLUENCE Related parties exercising significant influ-ence comprise the Group’s Supervisory Board, Executive Board and key management per-sonnel and close members of their families. Related parties also comprise companies in which the persons referred to above have significant influence.
During the year the Group was not involved in any transactions with major shareholders,
members of the Supervisory Board, mem-bers of the Executive Board, key manage-ment personnel or companies outside the Carlsberg Group in which these parties have significant influence, except for the remu-neration to the Supervisory Board, Executive Board and key management personnel as disclosed in section 7.2.
Related parties also include the Group’s associates (companies in which the Group has significant influence) and jointly controlled entities (companies that are jointly controlled by the Group and other joint ventures).
The decrease in transactions with and receivables from associates is primarily a result of the terminated cooperation in Nordic Getränke at 1 January 2013. After this date, the activities acquired were fully consolidated in the Group.
The decrease in key figures for proportionately consolidated entities is attributable to South Asian Breweries Group, which was recognised as a subsidiary as of 31 October 2013.
AssociatesProportionately
consolidated entities
DKK million 2013 2012 2013 2012
Revenue 201 286 14 13
Cost of sales -339 -381 - -
Loans 212 300 - 727
Receivables 22 131 9 26
Borrowings - -96 - -
Trade payables and other liabilities etc. -26 -22 -3 -4
Accordingly, the 2013 figures only include 10 months’ activity for Carlsberg India Group recognised proportionately in the income statement, while proportionately consolidated figures are not included in the statement of financial position at 31 December 2013.
THE INCOME STATEMENT AND THE STATEMENT OF FINANCIAL POSITION INCLUDE THE FOLLOWING TRANSACTIONS
Consolidated financial statements SECTION 8: OTHER DISCLOSURE REQUIREMENTS 128Carlsberg Group Annual Report 2013
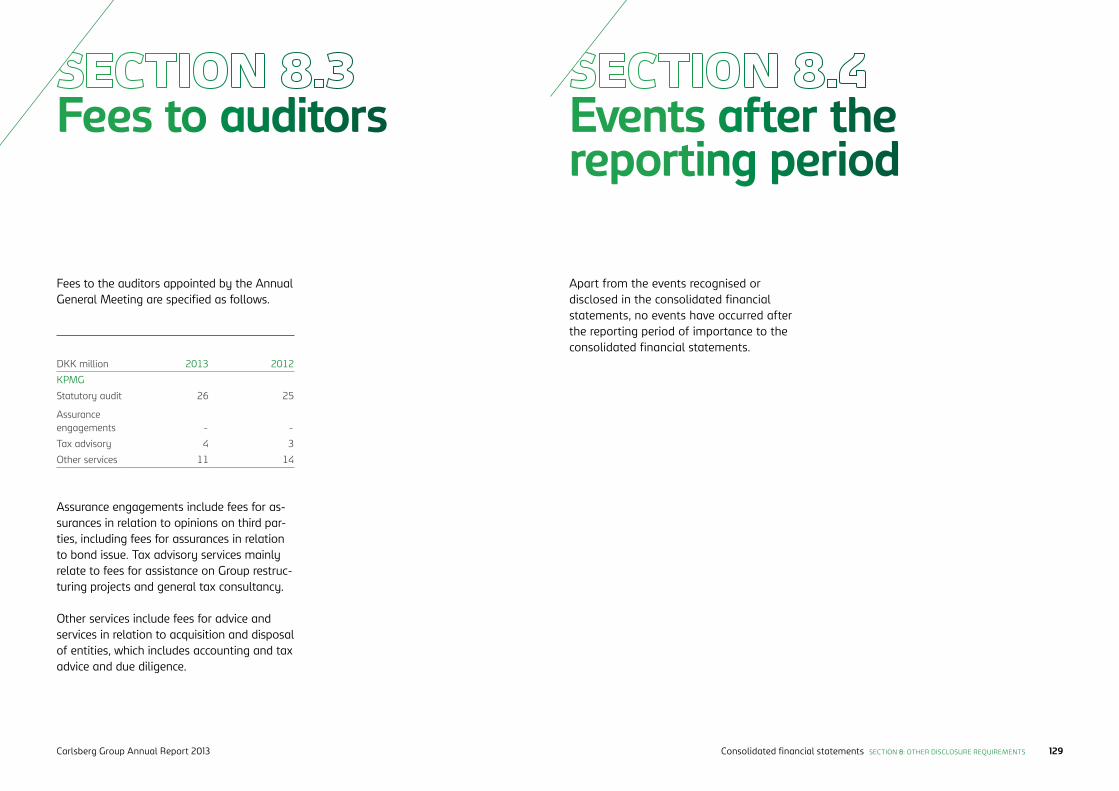
Fees to auditors
Assurance engagements include fees for as-surances in relation to opinions on third par-ties, including fees for assurances in relation to bond issue. Tax advisory services mainly relate to fees for assistance on Group restruc-turing projects and general tax consultancy.
Other services include fees for advice and services in relation to acquisition and disposal of entities, which includes accounting and tax advice and due diligence.
DKK million 2013 2012
KPMG
Statutory audit 26 25
Assurance engagements - -
Tax advisory 4 3
Other services 11 14
Apart from the events recognised or disclosed in the consolidated financial statements, no events have occurred after the reporting period of importance to the consolidated financial statements.
Events after the reporting period
Fees to the auditors appointed by the Annual General Meeting are specified as follows.
Consolidated financial statements SECTION 8: OTHER DISCLOSURE REQUIREMENTS 129Carlsberg Group Annual Report 2013
Significant accounting estimates
Basis for preparation
In preparing the Carlsberg Group’s consoli dated financial statements, management makes various accounting estimates, judgements and assumptions which form the basis of presenta-tion, recognition and measurement of the Group’s assets and liabilities.
The judgements, estimates and assumptions made are based on historical experience and other factors which management assesses to be reliable, but which, by their very na-ture, are associated with uncertainty and un-predictability. These assumptions may prove incomplete or incorrect, and unexpected events or circumstances may arise.
The significant accounting estimates and judgements made and the accounting pol-icies specific to the income statement, state-ment of financial position and statement of cash flows are presented in the explanatory notes in section 1-7:
Business combinations: SECTION 5
Impairment testing: SECTION 2
Useful life and residual value of intangible assets with finite useful life and property, plant and equipment: SECTION 2
Restructurings: SECTION 3
Provisions and contingencies: SECTION 3
Receivables: SECTION 1
Deferred tax assets: SECTION 6
Retirement benefit obligations and similar obligations: SECTION 7
New presentation of financial statements and explanatory notesThe presentation of the financial statements for 2013 has been changed to improve the information and provide a better presentation of the financial flows.
Change in presentation of listing feesAs a result of changes in the Russian retail landscape as well as recent changes in marketing regulation, the Group has changed the presentation of listing fees.
Key developments 2013
Consolidated financial statements SECTION 9: BASIS FOR PREPARATION 130Carlsberg Group Annual Report 2013
General accounting policies
The 2013 consolidated financial statements of the Carlsberg Group have been prepared in accordance with International Financial Reporting Standards (IFRS) as adopted by the EU and Danish disclosure requirements for listed companies, cf. the statutory order pursuant to the Danish Financial State-ments Act.
The consolidated financial statements are presented in Danish kroner (DKK), which is the Parent Company’s functional currency.
The consolidated financial statements have been prepared on the historical cost basis except for the following assets and liabilities measured at fair value: derivative financial instruments, financial instruments in the trading portfolio and financial instru-ments classified as available-for-sale.
Non-current assets and disposal groups classified as held for sale are measured at the lower of the carrying amount before the changed classification and fair value less costs to sell.
CHANGED ACCOUNTING POLICIES AND PRESENTATION OF THE ANNUAL REPORT 2013 Apart from the implementation of the amended IAS 19 “Employee Benefits”, the Annual Report has been prepared using the same accounting policies for recogni-tion and measurement as those applied to the consolidated financial statements for 2012. The amended standard has changed the recognition of the expected return on pension plan assets. Under the changed accounting policy applicable from 1 January 2013, the expected return on plan assets is calculated on the basis of the discount rate used to measure retirement benefit obliga-tions, whereas previously the return was based on the expected return on the specific plan assets. The change did not have any significant impact on the Annual Report.
The presentation format has been changed for the Annual Report 2013, resulting in minor changes to the classification of elements in the financial statements. Furthermore, the structure of the explanatory notes has been changed significantly to improve the informa-
tion provided. The comparative figures have been restated accordingly.
Furthermore, the Carlsberg Group has changed the presentation of listing fees in Russia as of 1 January 2013. Following changes in Russian marketing regulation, the nature of the cooperation with and services provided by retailers has changed. Specific listing fees closely related to the sale of beer are therefore now presented as discounts that reduce net revenue. Listing fees in Russia were previously included in sales and distri-bution expenses in line with the main nature of the activities. Comparative figures for 2012 have been restated accordingly.
IFRS 13 “Fair Value Measurement” and the amendments to IAS 1 “Other Comprehensive Income”, IFRS 7 “Disclosures – Offsetting Financial Assets and Financial Liabilities” and IAS 32 “Offsetting Financial Assets and Financial Liabilities”, and the “Annual Improvements to IFRSs 2009-2011” have been implemented from 1 January 2013. The new and amended standards have changed the presentation of other comprehensive
income. The changes did not have any significant impact on the Annual Report.
The accounting policies set out below have been used consistently in respect of the financial year and the comparative figures.
CONSOLIDATED FINANCIAL STATEMENTSThe consolidated financial statements comprise the Parent Company, Carlsberg A/S, and sub-sidiaries in which Carlsberg A/S has control, i.e. the power to govern the financial and operat-ing policies. Control is obtained when Carlsberg A/S directly or indirectly owns or controls more than 50% of the voting rights in the subsidiary or has control in some other way.
Entities over which the Group exercises a significant influence, but which it does not control, are considered associates. Significant influence is generally obtained by direct or indirect ownership or control of more than 20% but less than 50% of the voting rights. When assessing whether Carlsberg A/S exer-cises control or significant influence, potential voting rights exercisable at the end of the reporting period are taken into account.
Consolidated financial statements SECTION 9: BASIS FOR PREPARATION 131Carlsberg Group Annual Report 2013
Entities which by agreement are managed jointly with one or more other parties (joint ventures) are consolidated proportionately, and the individual accounting entries are recognised in proportion to the ownership interest.
The consolidated financial statements have been prepared as a consolidation of the financial statements of the Parent Company, subsidiaries and proportionately consolidated entities according to the Group’s accounting policies. On consolidation, intra-Group income and expenses, shareholdings, intra-Group balances and dividends, and realised and un-realised gains on intra-Group transactions are eliminated. Unrealised gains on trans actions with associates and proportionately consoli-dated entities are eliminated in proportion to the Group’s ownership share of the entity. Unrealised losses are eliminated in the same way as unrealised gains to the extent that impairment has not taken place.
Investments in subsidiaries and propor-tionately consolidated entities are set off against the proportionate share of the sub-sidiaries’ fair value of identifiable net assets, including recognised contingent liabilities, at the acquisition date.
The accounting items of subsidiaries are included in full in the consolidated financial statements. Non-controlling interests’ share
of the profit/loss for the year and of the eq-uity of subsidiaries is included in the Group’s profit/loss and equity respectively, but is disclosed separately.
Entities acquired or formed during the year are recognised in the consolidated financial statements from the date of acquisition or formation. Entities which are disposed of or wound up are recognised in the consolidated income statement until the date of disposal or winding-up. The comparative figures are not restated for entities acquired, disposed of or wound up.
Foreign currency translation For each of the reporting entities in the Group, a functional currency is determined. The func-tional currency is the primary currency used for the reporting entity’s operations. Transac-tions denominated in currencies other than the functional currency are considered transactions denominated in foreign currencies.
On initial recognition, transactions denomi-nated in foreign currencies are translated to the functional currency at the exchange rates at the transaction date. Foreign exchange differences arising between the exchange rates at the transaction date and at the date of payment are recognised in the income statement as financial income or financial expenses.
Receivables, payables and other monetary items denominated in foreign currencies are translated at the exchange rates at the end of the reporting period. The difference between the exchange rates at the end of the reporting period and at the date at which the receivable or payable arose or the exchange rate in the latest consolidated financial statements is rec-ognised in the income statement as financial income or financial expenses.
On recognition in the consolidated financial statements of entities with a functional currency other than the presentation cur-rency of Carlsberg A/S (DKK), the income statement and statement of cash flows are translated at the exchange rates at the transaction date, and the statement of financial position items are translated at the exchange rates at the end of the report-ing period. An average exchange rate for the month is used as the exchange rate at the transaction date to the extent that this does not significantly deviate from the ex-change rate at the transaction date. Foreign exchange differences arising on translation of the opening balance of equity of foreign entities at the exchange rates at the end of the reporting period and on translation of the income statement from the exchange rates at the transaction date to the ex-change rates at the end of the reporting period are recognised in other comprehen-
sive income and attributed to a separate translation reserve in equity.
Foreign exchange adjustment of balances with foreign entities which are considered part of the investment in the entity is recog-nised in the consolidated financial statements in other comprehensive income if the balance is denominated in the functional currency of the Parent Company or the foreign entity. Correspondingly, foreign exchange gains and losses on the part of loans and derivative financial instruments which is designated as hedges of investments in foreign entities with a functional currency other than that of Carlsberg A/S and which effectively hedge against corresponding foreign exchange gains and losses on the investment in the entity are also recognised in other comprehensive income and attributed to a separate transla-tion reserve in equity.
On recognition in the consolidated financial statements of associates with a functional currency other than the presentation cur-rency of Carlsberg A/S, the share of profit/loss and other comprehensive income for the year is translated at average exchange rates and the share of equity, including goodwill, is translated at the exchange rates at the end of the reporting period. Foreign exchange differences arising on the translation of the share of the opening balance of equity of
SECTION 9.2 General accounting policies
Consolidated financial statements SECTION 9: BASIS FOR PREPARATION 132Carlsberg Group Annual Report 2013
foreign associates at the exchange rates at the end of the reporting period, and on trans-lation of the share of profit/loss and other comprehensive income for the year from average exchange rates to the exchange rates at the end of the reporting period, are recognised in other comprehensive income and attributed to a separate translation reserve in equity.
On complete or partial disposal of a foreign entity or on repayment of balances which constitute part of the net investment in the foreign entity, the share of the cumula-tive amount of the exchange differences recognised in other comprehensive income relating to that foreign entity is recognised in the income statement when the gain or loss on disposal is recognised.
Prior to translation of the financial state-ments of foreign entities in countries with hyperinflation, the financial statements are inflation-adjusted for changes in purchasing power in the local currency. Inflation adjust-ment is based on relevant price indexes at the end of the reporting period.
HyperinflationThe financial statements of foreign entities whose functional currency is the currency of a hyperinflationary market are stated in terms of the measuring unit current at the end of the
reporting period using a general price index. Non-monetary assets are restated to the cur-rent purchasing power at the reporting date from the value on the date when they were first recognised in the financial statements.
The gain/loss is recognised in other com-prehensive income. The gain/loss on the net monetary position is recognised as financial income or expenses in the income statement. Income statement items are restated from the value on the transaction date to the value on the reporting date except for items related to non-monetary assets, such as depreciation and amortisa-tion and consumption of inventories etc. Deferred tax is adjusted accordingly. The comparative figures for the Group are not restated in terms of the measuring unit current at the end of the reporting period.
Derivative financial instruments Derivative financial instruments are initially recognised in the statement of financial position at fair value on the trade date and subsequently measured at fair value. At-tributable transaction costs are recognised in the income statement.
The fair values of derivative financial instru-ments are included in other receivables and other payables, and positive and negative values are offset only when the Group has the
right and the intention to settle several finan-cial instruments net. Fair values of derivative financial instruments are computed on the basis of current market data and generally accepted valuation methods.
Changes in the fair value of derivative finan-cial instruments designated as and qualifying for recognition as a fair value hedge of recog-nised assets and liabilities are recognised in the income statement, together with changes in the value of the hedged asset or liability with respect to the hedged portion. Except for foreign currency hedges, hedging of future cash flows according to a firm agreement is treated as a fair value hedge of a recognised asset or liability.
Changes in the portion of the fair value of derivative financial instruments which are designated and qualify as a cash flow hedge and which effectively hedge changes in the value of the hedged item are recognised in other comprehensive income and attributed to a separate reserve in equity. When the hedged transaction results in gains or losses, amounts previously recognised in other comprehensive income are transferred to the same item as the hedged item when the hedged risk impacts the income statement. When the hedged item is a non-financial as-set, the amount recognised in other compre-hensive income is transferred to the carrying
amount of the asset when the non-financial asset is recognised.
Derivatives designated as and qualifying for recognition as a cash flow hedge of financial investments are recognised in other com-prehensive income. On complete or partial disposal of the financial investment, the portion of the hedging instrument that is recognised in other comprehensive income and relates to that financial investment is recognised in the income statement when the gain or loss on disposal is recognised.
For derivative financial instruments that do not qualify for hedge accounting, changes in fair value are recognised in the income statement as financial income or financial expenses.
Changes in the fair value of derivative financial instruments used to hedge net investments in foreign subsidiaries, joint ventures or associ-ates and which effectively hedge currency fluctua tions in these entities are recognised in the consolidated financial statements in other comprehensive income and attributed to a separate translation reserve in equity.
Embedded derivatives are recognised sepa-rately from the host contract and measured at fair value if their economic characteristics and risks are not closely related to those of the host contract, as a separate instru-
SECTION 9.2 General accounting policies
Consolidated financial statements SECTION 9: BASIS FOR PREPARATION 133Carlsberg Group Annual Report 2013
ment with the same terms would meet the definition of a derivative, and the entire combined instrument is not measured at fair value through profit and loss. Separated embedded derivatives are subsequently measured at fair value.
INCOME STATEMENT AND STATEMENT OF FINANCIAL POSITION, GENERALSpecial items These items are shown separately in order to give a more true and fair view of the Group’s operating profit.
PRESENTATION OF DISCONTINUED OPERATIONSDiscontinued operations comprise activities and cash flows that can be clearly distinguished from the other business areas and have either been disposed of or are held for sale. The sale is expected to be carried out within 12 months in accordance with a formal plan.
Discontinued operations also include entities which are classified as held for sale in con-nection with an acquisition.
Discontinued operations are presented in a separate line in the income statement and as assets and liabilities held for sale in the statement of financial position, and main items are specified in the notes. Compara-tive figures are restated.
STATEMENT OF CASH FLOWSThe statement of cash flows shows the cash flows from operating, investing and financ-ing activities for the year, the year’s changes in cash and cash equivalents as well as cash and cash equivalents at the beginning and end of the year.
Cash flow from operating activities Cash flow from operating activities are cal culated using the indirect method as the opera ting profit before special items adjusted for non-cash operating items, changes in working capital, restructuring costs paid, interest received and paid, and income tax paid.
Cash flow from investing activitiesCash flow from investing activities comprise payments in connection with acquisitions and disposals of entities and activities, and of intangible assets, property, plant and equipment and other non-current assets.
The cash flow effect of acquisitions and disposals of entities is shown separately in cash flows from investing activities. Cash flows from acquisitions of entities are recognised in the statement of cash flows from the acquisition date. Cash flows from disposals of entities are recognised up until the disposal date.
Acquisitions of assets by means of finance leases are treated as non-cash transactions.
Cash flow from financing activities Cash flow from financing activities comprise changes in the size or composition of the share capital and related costs as well as the acquisition and disposal of non-control-ling interests, raising of loans, repayment of interest-bearing debt, acquisition and disposal of treasury shares, and payment of dividends to shareholders.
Cash flows from assets held under finance leases are recognised as payment of inter-est and repayment of debt.
Cash and cash equivalentsCash and cash equivalents comprise cash, less bank overdrafts, and short-term marketable securities with a term of three months or less at the acquisition date which are subject to an insignificant risk of changes in value.
Cash flows in currencies other than the functional currency are translated using av-erage exchange rates, unless these deviate significantly from the exchange rates at the transaction date.
SEGMENT INFORMATIONFor segment reporting purposes, the Chief Operating Decision Maker is the Executive Committee. The Executive Committee man-ages and makes business decisions based on geographical regional information. Seg-ments are managed and decisions are made based on business performance measured as operating profit before special items. Decisions on financing and tax planning are made based on information for the Group as a whole and therefore not segmented. The non-beverage activities are managed sepa-rately and therefore also shown separately. The segmentation reflects the structure used for internal reporting and monitoring of the strategic and financial targets of the Carlsberg Group.
In accordance with the Group’s manage-ment structure, beverage activities are segmented according to the geographi-cal regions where production takes place. The segment information is based on the Group’s accounting policies.
A segment’s operating profit/loss includes revenue, operating costs and share of profit/loss in associates to the extent that they can be allocated directly to the individual segment. Income and expenses related to Group functions have not been allocated
SECTION 9.2 General accounting policies
Consolidated financial statements SECTION 9: BASIS FOR PREPARATION 134Carlsberg Group Annual Report 2013
and, as is the case with eliminations and non-beverage activities, are not included in the operating profit/loss of the segments.
Total segment assets comprise non-current assets used directly in the operating activities of the segment, including intangible assets, property, plant and equipment, investments in associates and current segment assets to the extent that they can be allocated directly to the individual segment, including invento-ries, trade receivables, other receivables and prepayments.
The geographical allocation is made on the basis of the selling countries’ domicile and comprises countries individually accounting for more than 10% of the Group’s consolidated net revenue as well as the domicile country.
FINANCIAL RATIOSEarnings per share (EPS) and diluted earnings per share (EPS-D) are calculated in accord-ance with IAS 33.
Other financial ratios are calculated in accord-ance with the Danish Society of Financial Ana-lysts’ guidelines on the calculation of financial ratios, “Recommendations and Financial Ratios 2010”, unless specifically stated.
Cash flow from operating activities per share (CFPS)
Cash flow from operating activities divided by the number of shares outstanding, fully diluted for share options in the money in accordance with IAS 331.
Debt/operating profit before depreciation, amor-tisation and impairment
Net interest-bearing debt2 divided by operating profit before special items adjusted for depreciation, amor-tisation and impairment.
Earnings per share (EPS) Consolidated profit for the year, excluding non-controlling interests, divided by the average number of shares outstanding.
Earnings per share, adjusted (EPS-A)
Consolidated profit for the year adjusted for special items after tax, excluding non-controlling interests, divided by the average number of shares outstanding.
Earnings per share, diluted (EPS-D)
Consolidated profit for the year, excluding non-con-trolling interests, divided by the average number of shares outstanding, fully diluted for share options in the money and the bonus element in a rights issue in accordance with IAS 331.
Equity ratio Equity attributable to shareholders in Carlsberg A/S at year-end as a percentage of total assets at year-end.
Financial gearing Net interest-bearing debt2 at year-end divided by total equity at year-end.
Free cash flow per share (FCFPS)
Free cash flow3 divided by average number of shares outstanding, fully diluted for share options in the money in accordance with IAS 331.
Interest cover Operating profit before special items divided by interest expenses, net.
Number of shares, average Number of issued shares, excluding treasury shares, as an average for the year (= average number of shares outstanding).
Number of shares, year-end
Total number of issued shares, excluding treasury shares, at year-end (= number of shares outstanding at year-end).
Operating margin Operating profit before special items as a percentage of revenue.
Operating profit Expression used for operating profit before special items in the Management review.
Organic development
Measure of growth excluding the impact of ac-quisitions, divestitures and foreign exchange from year-over-year comparisons. We believe this provides investors with a better understanding of underlying trends.
Payout ratio Dividend for the year as a percentage of consolidat-ed profit, excluding non-controlling interests.
Pro rata volumes The Group’s sale of beverages in consolidated enti-ties, and 100% of the sale of the Group’s interna-tional brands in proportionately consolidated entities and associates and the proportionate share of the sale of local brands in these entities.
Return on average invested capital, including goodwill (ROIC)
Operating profit before special items as a percentage of average invested capital4.
Volumes The Group’s total sale of beverages, including the total sales through proportionately consolidated entities and associates.
1 The dilutive effect is calculated as the difference between the number of shares that could be acquired at fair value for the proceeds from the exercise of the share op-tions and the number of shares that could be issued assuming that the options are exercised.
2 The calculation of net interest-bearing debt is specified in section 4.2.3 The calculation of free cash flow is specified in the statement of cash flows.4 The calculation of invested capital is specified in section 2.1.
CALCULATION OF THE KEY FIGURES AND FINANCIAL RATIOS STATED IN THE ANNUAL REPORT
SECTION 9.2 General accounting policies
Consolidated financial statements SECTION 9: BASIS FOR PREPARATION 135Carlsberg Group Annual Report 2013
New legislation
NEW IFRSs AND INTERPRETATIONS New IFRSs and Interpretations New and amended IFRSs and Interpretations not yet applicable within the EUIFRS 10-12 and the amendments to IAS 27-28 have not yet been implemented. The stand-ards are effective for financial years begin-ning on or after 1 January 2013, however not until 1 January 2014 for companies within the EU. The amendments to IAS 36 and 39 are effective for financial years beginning on or after 1 January 2014. The Group will imple-ment the standards as of 1 January 2014:
• IFRS 10 “Consolidated Financial State-ments”. The standard changes the definition of control over an entity following which de facto control will result in full consolida-tion of the entity and potential voting rights could require full consolidation.
• IFRS 11 “Joint Arrangements”. The stand-ard supersedes IAS 31 “Interests in Joint Ventures” and eliminates the possibility of proportionate consolidation of joint ven-tures. The standard distinguishes between joint ventures (recognised according to the
equity method) and joint arrangements (proportionate consolidation). The stand-ard changes the Group’s recognition and measurement of joint ventures.
• IFRS 12 “Disclosure of Interests in Other Entities”. The standard defines disclosure requirements for consolidated financial statements.
• Amendments to IAS 27 “Separate Finan-cial Statements”. The standard contains requirements for the accounting treatment of and disclosures for investments in sub-sidiaries, joint ventures and associates in parent company financial statements. The standard does not change recognition and measurement for the Parent Company.
• Amendments to IAS 28 “Investments in Associates and Joint Ventures”. The stand-ard prescribes the accounting treatment of investments in joint ventures and associ-ates according to the equity method.
• Amendments to IFRS 10, IFRS 11 and IFRS 12 “Consolidated Financial Statements, Joint
Arrangements and Disclosures of Interests in Other Entities – Transition Guidance”.
• Amendments to IAS 36 “Recoverable Amount Disclosures for Non-Financial As-sets”. The standard prescribes disclosures about the measurement of impaired assets (or a group of assets) with a recoverable amount based on fair value less costs of disposal.
• Amendments to IAS 39 “Novation of Deriv-atives and Continuation of Hedge Account-ing”. The standard prescribes an exception to the re quirement for the discontinuation of hedge ac counting in circumstances where a hedging instrument is required to be no-vated to a central counterparty as a result of laws or regulations.
IMPACT FROM CHANGES IN ACCOUNTING POLICIES FOR 2014The implementation of IFRS 10-12 and the amendments to IAS 27-28 as of 1 January 2014 will impact the Group’s financials and segments as proportionately consolidated entities will be included as associates, i.e.
accounted for using the equity method in-stead of proportionate consolidation.
The consequences of the change in consoli-dation method have been assessed for each individual shareholding taking the changed guidance on assessment of control into con-sideration. The change will primarily impact the currently proportionately consolidated companies such as Unicer and Cambrew.
The impact from the changed accounting policies on key financials for the Group and segments for 2013 is specified in the table on the next page.
The changes in accounting policies have no impact on the equity attributable to share-holders in Carlsberg A/S, whereas the equity attributable to non-controlling interests will decrease DKK 13m at 31 December 2013 (31 December 2012: DKK 13m).
Consolidated financial statements SECTION 9: BASIS FOR PREPARATION 136Carlsberg Group Annual Report 2013
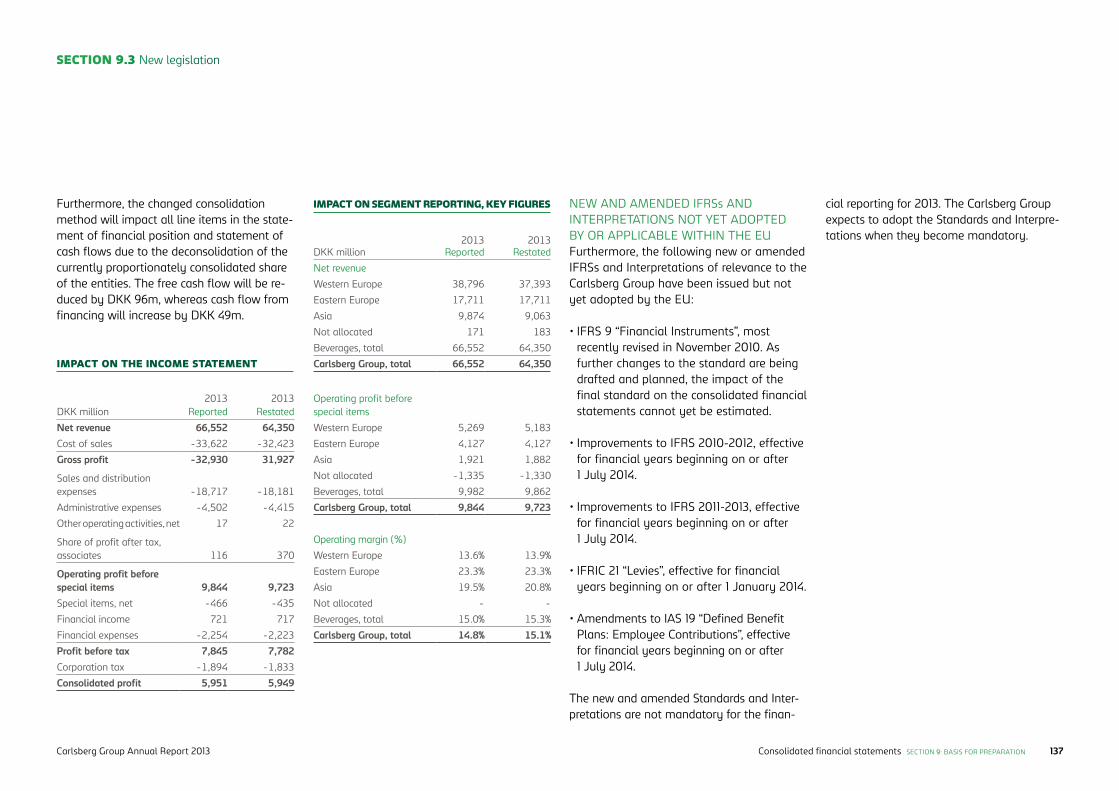
Furthermore, the changed consolidation method will impact all line items in the state-ment of financial position and statement of cash flows due to the deconsolidation of the currently proportionately consolidated share of the entities. The free cash flow will be re-duced by DKK 96m, whereas cash flow from financing will increase by DKK 49m.
SECTION 9.3 New legislation
IMPACT ON THE INCOME STATEMENT
IMPACT ON SEGMENT REPORTING, KEY FIGURES
DKK million2013
Reported2013
Restated
Net revenue 66,552 64,350 Cost of sales -33,622 -32,423
Gross profit -32,930 31,927
Sales and distribution expenses -18,717 -18,181
Administrative expenses -4,502 -4,415
Other operating activities, net 17 22
Share of profit after tax, associates 116 370
Operating profit before special items 9,844 9,723 Special items, net -466 -435
Financial income 721 717
Financial expenses -2,254 -2,223
Profit before tax 7,845 7,782 Corporation tax -1,894 -1,833
Consolidated profit 5,951 5,949
DKK million2013
Reported2013
Restated
Net revenue
Western Europe 38,796 37,393
Eastern Europe 17,711 17,711
Asia 9,874 9,063
Not allocated 171 183
Beverages, total 66,552 64,350
Carlsberg Group, total 66,552 64,350
Operating profit before special items
Western Europe 5,269 5,183
Eastern Europe 4,127 4,127
Asia 1,921 1,882
Not allocated -1,335 -1,330
Beverages, total 9,982 9,862
Carlsberg Group, total 9,844 9,723
Operating margin (%)
Western Europe 13.6% 13.9%
Eastern Europe 23.3% 23.3%
Asia 19.5% 20.8%
Not allocated - -
Beverages, total 15.0% 15.3%
Carlsberg Group, total 14.8% 15.1%
NEW AND AMENDED IFRSs AND INTERPRETATIONS NOT YET ADOPTED BY OR APPLICABLE WITHIN THE EUFurthermore, the following new or amended IFRSs and Interpretations of relevance to the Carlsberg Group have been issued but not yet adopted by the EU:
• IFRS 9 “Financial Instruments”, most recently revised in November 2010. As further changes to the standard are being drafted and planned, the impact of the final standard on the consolidated financial statements cannot yet be estimated.
• Improvements to IFRS 2010-2012, effective for financial years beginning on or after 1 July 2014.
• Improvements to IFRS 2011-2013, effective for financial years beginning on or after 1 July 2014.
• IFRIC 21 “Levies”, effective for financial years beginning on or after 1 January 2014.
• Amendments to IAS 19 “Defined Benefit Plans: Employee Contributions”, effective for financial years beginning on or after 1 July 2014.
The new and amended Standards and Inter-pretations are not mandatory for the finan-
cial reporting for 2013. The Carlsberg Group expects to adopt the Standards and Interpre-tations when they become mandatory.
Consolidated financial statements SECTION 9: BASIS FOR PREPARATION 137Carlsberg Group Annual Report 2013
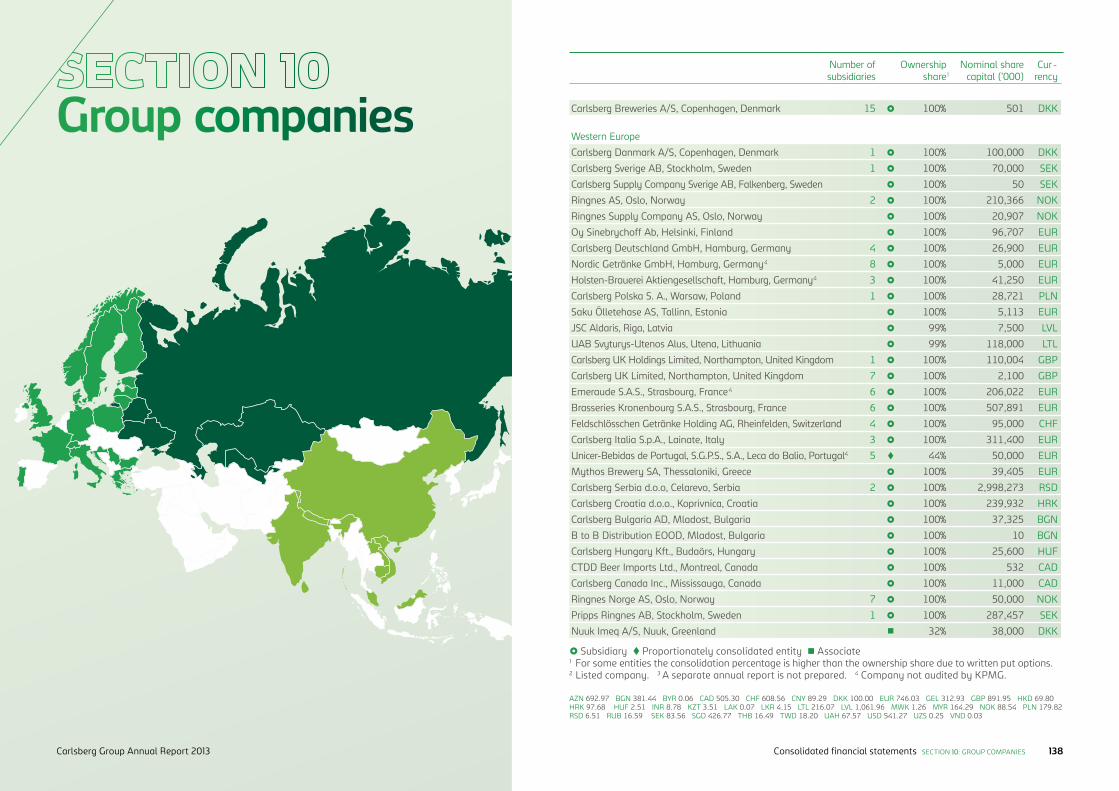
Group companiesNumber of subsidiaries
Ownership share1
Nominal share capital (’000)
Cur-rency
Carlsberg Breweries A/S, Copenhagen, Denmark 15 £ 100% 501 DKK
Western Europe
Carlsberg Danmark A/S, Copenhagen, Denmark 1 £ 100% 100,000 DKK
Carlsberg Sverige AB, Stockholm, Sweden 1 £ 100% 70,000 SEK
Carlsberg Supply Company Sverige AB, Falkenberg, Sweden £ 100% 50 SEK
Ringnes AS, Oslo, Norway 2 £ 100% 210,366 NOK
Ringnes Supply Company AS, Oslo, Norway £ 100% 20,907 NOK
Oy Sinebrychoff Ab, Helsinki, Finland £ 100% 96,707 EUR
Carlsberg Deutschland GmbH, Hamburg, Germany 4 £ 100% 26,900 EUR
Nordic Getränke GmbH, Hamburg, Germany4 8 £ 100% 5,000 EUR
Holsten-Brauerei Aktiengesellschaft, Hamburg, Germany4 3 £ 100% 41,250 EUR
Carlsberg Polska S. A., Warsaw, Poland 1 £ 100% 28,721 PLN
Saku Ölletehase AS, Tallinn, Estonia £ 100% 5,113 EUR
JSC Aldaris, Riga, Latvia £ 99% 7,500 LVL
UAB Svyturys-Utenos Alus, Utena, Lithuania £ 99% 118,000 LTL
Carlsberg UK Holdings Limited, Northampton, United Kingdom 1 £ 100% 110,004 GBP
Carlsberg UK Limited, Northampton, United Kingdom 7 £ 100% 2,100 GBP
Emeraude S.A.S., Strasbourg, France4 6 £ 100% 206,022 EUR
Brasseries Kronenbourg S.A.S., Strasbourg, France 6 £ 100% 507,891 EUR
Feldschlösschen Getränke Holding AG, Rheinfelden, Switzerland 4 £ 100% 95,000 CHF
Carlsberg Italia S.p.A., Lainate, Italy 3 £ 100% 311,400 EUR
Unicer-Bebidas de Portugal, S.G.P.S., S.A., Leca do Balio, Portugal4 5 t 44% 50,000 EUR
Mythos Brewery SA, Thessaloniki, Greece £ 100% 39,405 EUR
Carlsberg Serbia d.o.o, Celarevo, Serbia 2 £ 100% 2,998,273 RSD
Carlsberg Croatia d.o.o., Koprivnica, Croatia £ 100% 239,932 HRK
Carlsberg Bulgaria AD, Mladost, Bulgaria £ 100% 37,325 BGN
B to B Distribution EOOD, Mladost, Bulgaria £ 100% 10 BGN
Carlsberg Hungary Kft., Budaörs, Hungary £ 100% 25,600 HUF
CTDD Beer Imports Ltd., Montreal, Canada £ 100% 532 CAD
Carlsberg Canada Inc., Mississauga, Canada £ 100% 11,000 CAD
Ringnes Norge AS, Oslo, Norway 7 £ 100% 50,000 NOK
Pripps Ringnes AB, Stockholm, Sweden 1 £ 100% 287,457 SEK
Nuuk Imeq A/S, Nuuk, Greenland n 32% 38,000 DKK
£Subsidiary tProportionately consolidated entity n Associate 1 For some entities the consolidation percentage is higher than the ownership share due to written put options.2 Listed company. 3 A separate annual report is not prepared. 4 Company not audited by KPMG.
AZN 692.97 BGN 381.44 BYR 0.06 CAD 505.30 CHF 608.56 CNY 89.29 DKK 100.00 EUR 746.03 GEL 312.93 GBP 891.95 HKD 69.80 HRK 97.68 HUF 2.51 INR 8.78 KZT 3.51 LAK 0.07 LKR 4.15 LTL 216.07 LVL 1,061.96 MWK 1.26 MYR 164.29 NOK 88.54 PLN 179.82 RSD 6.51 RUB 16.59 SEK 83.56 SGD 426.77 THB 16.49 TWD 18.20 UAH 67.57 USD 541.27 UZS 0.25 VND 0.03
Consolidated financial statements SECTION 10: GROUP COMPANIES 138Carlsberg Group Annual Report 2013
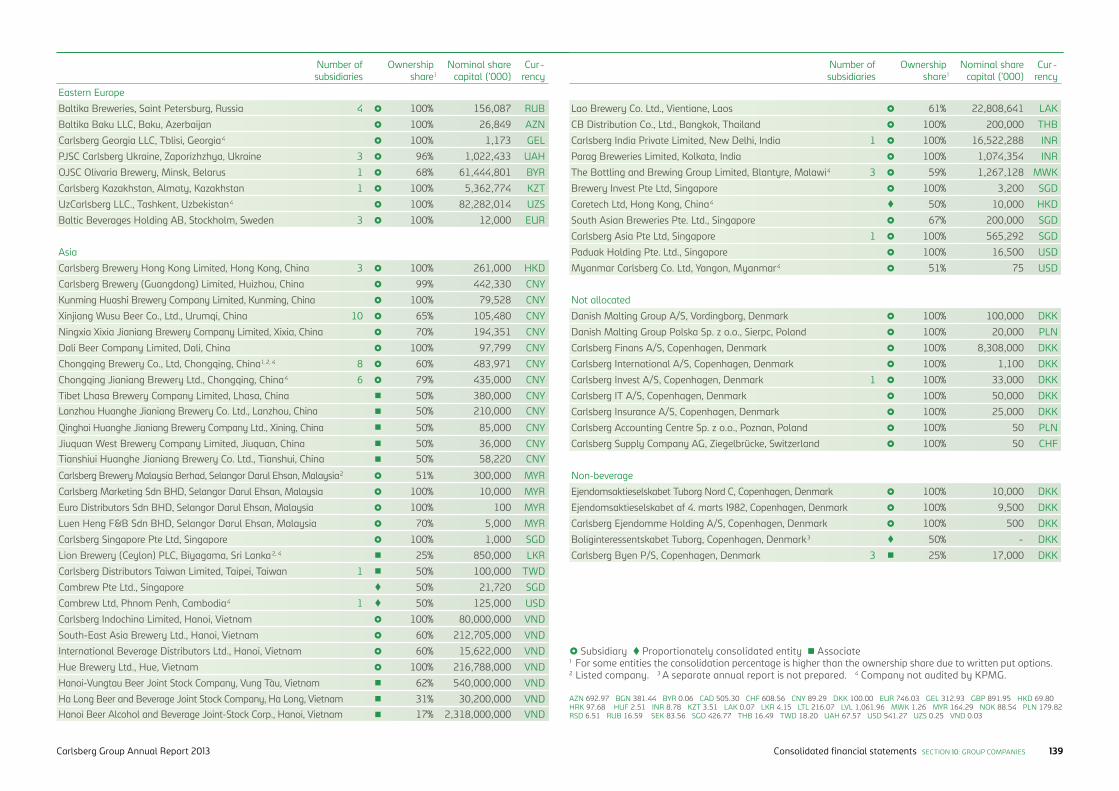
Number of subsidiaries
Ownership share1
Nominal share capital (’000)
Cur-rency
Eastern Europe
Baltika Breweries, Saint Petersburg, Russia 4 £ 100% 156,087 RUB
Baltika Baku LLC, Baku, Azerbaijan £ 100% 26,849 AZN
Carlsberg Georgia LLC, Tblisi, Georgia4 £ 100% 1,173 GEL
PJSC Carlsberg Ukraine, Zaporizhzhya, Ukraine 3 £ 96% 1,022,433 UAH
OJSC Olivaria Brewery, Minsk, Belarus 1 £ 68% 61,444,801 BYR
Carlsberg Kazakhstan, Almaty, Kazakhstan 1 £ 100% 5,362,774 KZT
UzCarlsberg LLC., Tashkent, Uzbekistan4 £ 100% 82,282,014 UZS
Baltic Beverages Holding AB, Stockholm, Sweden 3 £ 100% 12,000 EUR
Asia
Carlsberg Brewery Hong Kong Limited, Hong Kong, China 3 £ 100% 261,000 HKD
Carlsberg Brewery (Guangdong) Limited, Huizhou, China £ 99% 442,330 CNY
Kunming Huashi Brewery Company Limited, Kunming, China £ 100% 79,528 CNY
Xinjiang Wusu Beer Co., Ltd., Urumqi, China 10 £ 65% 105,480 CNY
Ningxia Xixia Jianiang Brewery Company Limited, Xixia, China £ 70% 194,351 CNY
Dali Beer Company Limited, Dali, China £ 100% 97,799 CNY
Chongqing Brewery Co., Ltd, Chongqing, China1, 2, 4 8 £ 60% 483,971 CNY
Chongqing Jianiang Brewery Ltd., Chongqing, China4 6 £ 79% 435,000 CNY
Tibet Lhasa Brewery Company Limited, Lhasa, China n 50% 380,000 CNYLanzhou Huanghe Jianiang Brewery Co. Ltd., Lanzhou, China n 50% 210,000 CNY
Qinghai Huanghe Jianiang Brewery Company Ltd., Xining, China n 50% 85,000 CNY
Jiuquan West Brewery Company Limited, Jiuquan, China n 50% 36,000 CNYTianshiui Huanghe Jianiang Brewery Co. Ltd., Tianshui, China n 50% 58,220 CNY
Carlsberg Brewery Malaysia Berhad, Selangor Darul Ehsan, Malaysia2 £ 51% 300,000 MYR
Carlsberg Marketing Sdn BHD, Selangor Darul Ehsan, Malaysia £ 100% 10,000 MYR
Euro Distributors Sdn BHD, Selangor Darul Ehsan, Malaysia £ 100% 100 MYR
Luen Heng F&B Sdn BHD, Selangor Darul Ehsan, Malaysia £ 70% 5,000 MYR
Carlsberg Singapore Pte Ltd, Singapore £ 100% 1,000 SGD
Lion Brewery (Ceylon) PLC, Biyagama, Sri Lanka 2, 4 n 25% 850,000 LKR
Carlsberg Distributors Taiwan Limited, Taipei, Taiwan 1 n 50% 100,000 TWD
Cambrew Pte Ltd., Singapore t 50% 21,720 SGD
Cambrew Ltd, Phnom Penh, Cambodia4 1 t 50% 125,000 USD
Carlsberg Indochina Limited, Hanoi, Vietnam £ 100% 80,000,000 VND
South-East Asia Brewery Ltd., Hanoi, Vietnam £ 60% 212,705,000 VND
International Beverage Distributors Ltd., Hanoi, Vietnam £ 60% 15,622,000 VND
Hue Brewery Ltd., Hue, Vietnam £ 100% 216,788,000 VND
Hanoi-Vungtau Beer Joint Stock Company, Vung Tàu, Vietnam n 62% 540,000,000 VND
Ha Long Beer and Beverage Joint Stock Company, Ha Long, Vietnam n 31% 30,200,000 VNDHanoi Beer Alcohol and Beverage Joint-Stock Corp., Hanoi, Vietnam n 17% 2,318,000,000 VND
Number of subsidiaries
Ownership share1
Nominal share capital (’000)
Cur-rency
Lao Brewery Co. Ltd., Vientiane, Laos £ 61% 22,808,641 LAK
CB Distribution Co., Ltd., Bangkok, Thailand £ 100% 200,000 THB
Carlsberg India Private Limited, New Delhi, India 1 £ 100% 16,522,288 INR
Parag Breweries Limited, Kolkata, India £ 100% 1,074,354 INR
The Bottling and Brewing Group Limited, Blantyre, Malawi4 3 £ 59% 1,267,128 MWK
Brewery Invest Pte Ltd, Singapore £ 100% 3,200 SGD
Caretech Ltd, Hong Kong, China4 t 50% 10,000 HKD
South Asian Breweries Pte. Ltd., Singapore £ 67% 200,000 SGD
Carlsberg Asia Pte Ltd, Singapore 1 £ 100% 565,292 SGD
Paduak Holding Pte. Ltd., Singapore £ 100% 16,500 USD
Myanmar Carlsberg Co. Ltd, Yangon, Myanmar4 £ 51% 75 USD
Not allocated
Danish Malting Group A/S, Vordingborg, Denmark £ 100% 100,000 DKK
Danish Malting Group Polska Sp. z o.o., Sierpc, Poland £ 100% 20,000 PLN
Carlsberg Finans A/S, Copenhagen, Denmark £ 100% 8,308,000 DKK
Carlsberg International A/S, Copenhagen, Denmark £ 100% 1,100 DKK
Carlsberg Invest A/S, Copenhagen, Denmark 1 £ 100% 33,000 DKK
Carlsberg IT A/S, Copenhagen, Denmark £ 100% 50,000 DKK
Carlsberg Insurance A/S, Copenhagen, Denmark £ 100% 25,000 DKK
Carlsberg Accounting Centre Sp. z o.o., Poznan, Poland £ 100% 50 PLN
Carlsberg Supply Company AG, Ziegelbrücke, Switzerland £ 100% 50 CHF
Non-beverage
Ejendomsaktieselskabet Tuborg Nord C, Copenhagen, Denmark £ 100% 10,000 DKK
Ejendomsaktieselskabet af 4. marts 1982, Copenhagen, Denmark £ 100% 9,500 DKK
Carlsberg Ejendomme Holding A/S, Copenhagen, Denmark £ 100% 500 DKK
Boliginteressentskabet Tuborg, Copenhagen, Denmark3 t 50% - DKK
Carlsberg Byen P/S, Copenhagen, Denmark 3 n 25% 17,000 DKK
£Subsidiary tProportionately consolidated entity n Associate 1 For some entities the consolidation percentage is higher than the ownership share due to written put options.2 Listed company. 3 A separate annual report is not prepared. 4 Company not audited by KPMG.
AZN 692.97 BGN 381.44 BYR 0.06 CAD 505.30 CHF 608.56 CNY 89.29 DKK 100.00 EUR 746.03 GEL 312.93 GBP 891.95 HKD 69.80 HRK 97.68 HUF 2.51 INR 8.78 KZT 3.51 LAK 0.07 LKR 4.15 LTL 216.07 LVL 1,061.96 MWK 1.26 MYR 164.29 NOK 88.54 PLN 179.82 RSD 6.51 RUB 16.59 SEK 83.56 SGD 426.77 THB 16.49 TWD 18.20 UAH 67.57 USD 541.27 UZS 0.25 VND 0.03
Consolidated financial statements SECTION 10: GROUP COMPANIES 139Carlsberg Group Annual Report 2013

Parent Company
144SECTION 1 OPERATING ACTIVITIES
144 1.1 Other operating activities, net
144 1.2 Cash flow
144 1.3 Receivables
145 SECTION 2 ASSET BASE
145 2.1 Intangible assets and property, plant and equipment
147SECTION 3 SPECIAL ITEMS AND PROVISIONS
147 3.1 Special items
147 3.2 Provisions
147 3.3 Contingent liabilities
148SECTION 4 CAPITAL STRUCTURE AND EQUITY
148 4.1 Financial income and expenses
148 4.2 Net interest-bearing debt
148 4.3 Equity
149 4.4 Borrowings
149 4.5 Interest rate risk
151SECTION 5 INVESTMENTS IN SUB SIDIARIES, ASSOCIATES AND JOINT VENTURES
151 5.1 Investments in subsidiaries
152 SECTION 6 TAX
152 6.1 Corporation tax
153 6.2 Deferred tax
154SECTION 7 STAFF COSTS AND REMUNERATION
154 7.1 Staff costs and remuneration of executive directors
154 7.2 Share-based payment157 7.3 Retirement benefit obligations
and similar obligations
158SECTION 8 OTHER DISCLOSURE REQUIREMENTS
158 8.1 Related party diclosures
158 8.2 Fees to auditors
158 8.3 Events after the reporting period
159SECTION 9 GENERAL ACCOUTING POLICIES
141 Income statement 141 Statement of comprehensive income 142 Statement of financial position 142 Statement of changes in equity 143 Statement of cash flows
Carlsberg Group Annual Report 2013 140Parent company CONTENTS
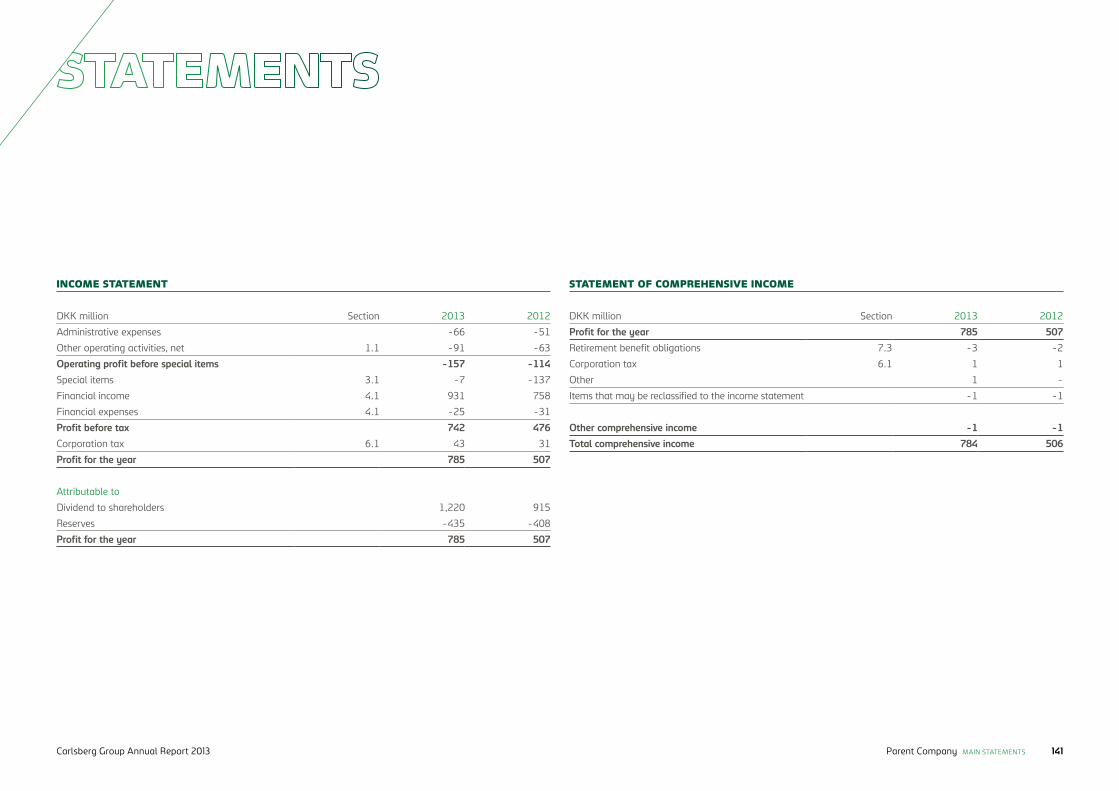
DKK million Section 2013 2012
Administrative expenses -66 -51
Other operating activities, net 1.1 -91 -63
Operating profit before special items -157 -114Special items 3.1 -7 -137
Financial income 4.1 931 758
Financial expenses 4.1 -25 -31
Profit before tax 742 476Corporation tax 6.1 43 31
Profit for the year 785 507
Attributable to
Dividend to shareholders 1,220 915
Reserves -435 -408
Profit for the year 785 507
INCOME STATEMENT
DKK million Section 2013 2012
Profit for the year 785 507Retirement benefit obligations 7.3 -3 -2
Corporation tax 6.1 1 1
Other 1 -
Items that may be reclassified to the income statement -1 -1
Other comprehensive income -1 -1Total comprehensive income 784 506
STATEMENT OF COMPREHENSIVE INCOME
Parent Company MAIN STATEMENTS 141Carlsberg Group Annual Report 2013
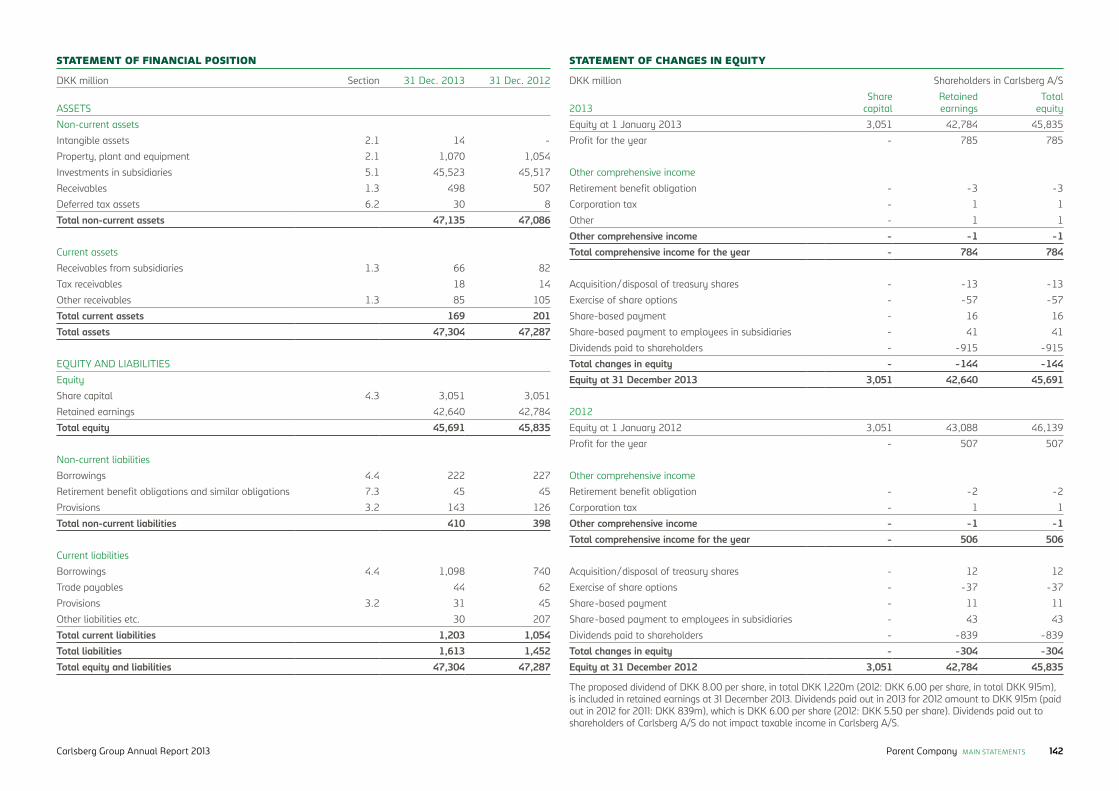
DKK million Shareholders in Carlsberg A/S
2013Share
capitalRetained earnings
Total equity
Equity at 1 January 2013 3,051 42,784 45,835
Profit for the year - 785 785
Other comprehensive income
Retirement benefit obligation - -3 -3
Corporation tax - 1 1
Other - 1 1
Other comprehensive income - -1 -1Total comprehensive income for the year - 784 784
Acquisition/disposal of treasury shares - -13 -13
Exercise of share options - -57 -57
Share-based payment - 16 16
Share-based payment to employees in subsidiaries - 41 41
Dividends paid to shareholders - -915 -915
Total changes in equity - -144 -144Equity at 31 December 2013 3,051 42,640 45,691
2012
Equity at 1 January 2012 3,051 43,088 46,139
Profit for the year - 507 507
Other comprehensive income
Retirement benefit obligation - -2 -2
Corporation tax - 1 1
Other comprehensive income - -1 -1Total comprehensive income for the year - 506 506
Acquisition/disposal of treasury shares - 12 12
Exercise of share options - -37 -37
Share-based payment - 11 11
Share-based payment to employees in subsidiaries - 43 43
Dividends paid to shareholders - -839 -839
Total changes in equity - -304 -304Equity at 31 December 2012 3,051 42,784 45,835
STATEMENT OF CHANGES IN EQUITY
The proposed dividend of DKK 8.00 per share, in total DKK 1,220m (2012: DKK 6.00 per share, in total DKK 915m), is included in retained earnings at 31 December 2013. Dividends paid out in 2013 for 2012 amount to DKK 915m (paid out in 2012 for 2011: DKK 839m), which is DKK 6.00 per share (2012: DKK 5.50 per share). Dividends paid out to shareholders of Carlsberg A/S do not impact taxable income in Carlsberg A/S.
STATEMENT OF FINANCIAL POSITION
DKK million Section 31 Dec. 2013 31 Dec. 2012
ASSETS
Non-current assets
Intangible assets 2.1 14 -
Property, plant and equipment 2.1 1,070 1,054
Investments in subsidiaries 5.1 45,523 45,517
Receivables 1.3 498 507
Deferred tax assets 6.2 30 8
Total non-current assets 47,135 47,086
Current assets
Receivables from subsidiaries 1.3 66 82
Tax receivables 18 14
Other receivables 1.3 85 105
Total current assets 169 201Total assets 47,304 47,287
EQUITY AND LIABILITIES
Equity
Share capital 4.3 3,051 3,051
Retained earnings 42,640 42,784
Total equity 45,691 45,835
Non-current liabilities
Borrowings 4.4 222 227
Retirement benefit obligations and similar obligations 7.3 45 45
Provisions 3.2 143 126
Total non-current liabilities 410 398
Current liabilities
Borrowings 4.4 1,098 740
Trade payables 44 62
Provisions 3.2 31 45
Other liabilities etc. 30 207
Total current liabilities 1,203 1,054Total liabilities 1,613 1,452Total equity and liabilities 47,304 47,287
Parent Company MAIN STATEMENTS 142Carlsberg Group Annual Report 2013
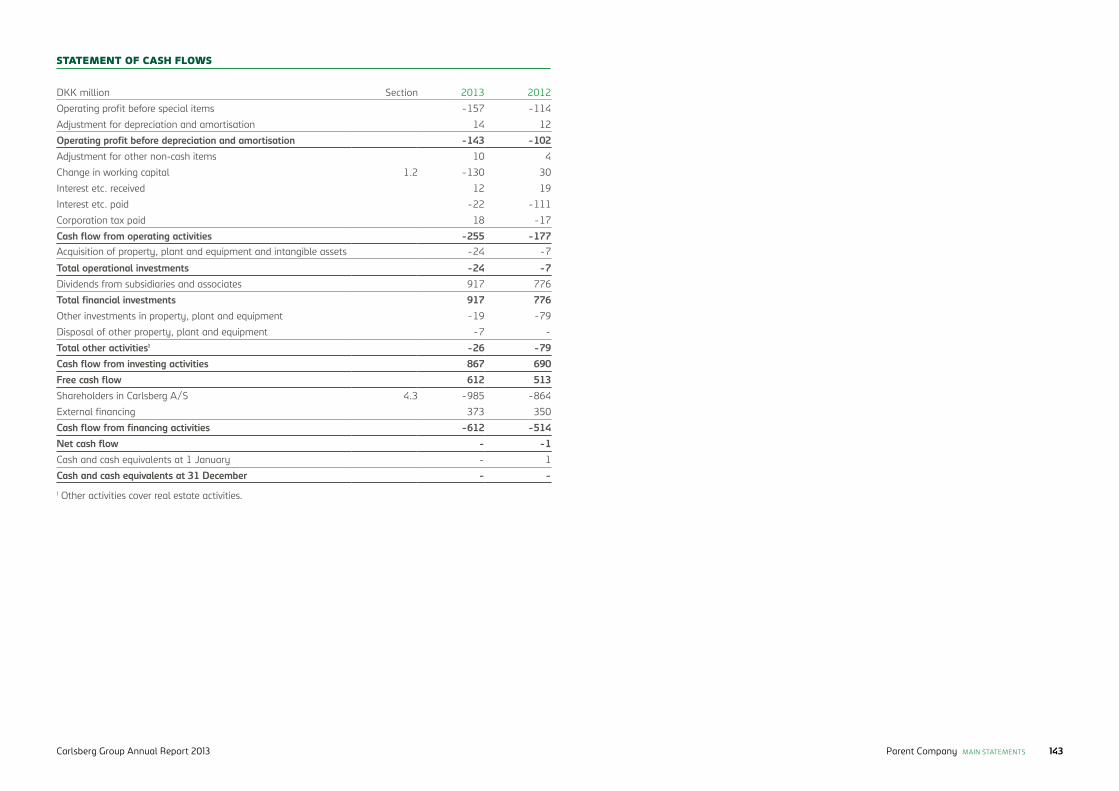
DKK million Section 2013 2012
Operating profit before special items -157 -114
Adjustment for depreciation and amortisation 14 12
Operating profit before depreciation and amortisation -143 -102Adjustment for other non-cash items 10 4
Change in working capital 1.2 -130 30
Interest etc. received 12 19
Interest etc. paid -22 -111
Corporation tax paid 18 -17
Cash flow from operating activities -255 -177Acquisition of property, plant and equipment and intangible assets -24 -7
Total operational investments -24 -7Dividends from subsidiaries and associates 917 776
Total financial investments 917 776Other investments in property, plant and equipment -19 -79
Disposal of other property, plant and equipment -7 -
Total other activities1 -26 -79Cash flow from investing activities 867 690Free cash flow 612 513Shareholders in Carlsberg A/S 4.3 -985 -864
External financing 373 350
Cash flow from financing activities -612 -514Net cash flow - -1Cash and cash equivalents at 1 January - 1
Cash and cash equivalents at 31 December - -
STATEMENT OF CASH FLOWS
1 Other activities cover real estate activities.
Parent Company MAIN STATEMENTS 143Carlsberg Group Annual Report 2013

1.1 Other operating activities, net 1.2 Cash flow 1.3 Receivables
DKK million 2013 2012
Real estate, net -36 -7
Research activities, including operation of the Carlsberg Laboratory, net -46 -46
Other, net -9 -10
Total -91 -63
DKK million 2013 2012
Other receivables 10 7
Trade payables and other liabilities -140 23
Total -130 30
The fair value of receivables corresponds to the carry-ing amount in all material respects.
Operating activities
OTHER OPERATING ACTIVITIES CHANGE IN WORKING CAPITAL RECEIVABLES BY ORIGIN
DKK million 2013 2012
Loans to subsidiaries 501 521
Receivables from subsidiaries 57 64
Other receivables 91 109
Total 649 694
% 2013 2012
Loans to associates 1.3 1.5
AVERAGE EFFECTIVE INTEREST RATES
Parent Company SECTION 1: OPERATING ACTIVITIES 144Carlsberg Group Annual Report 2013
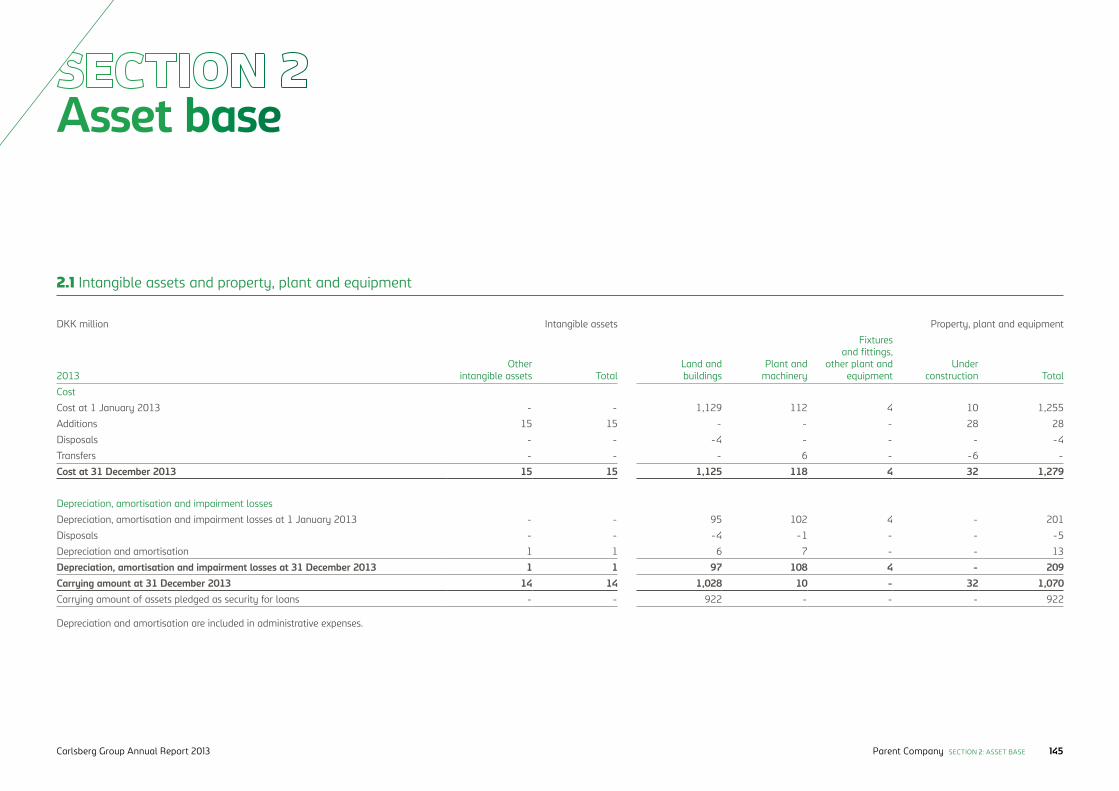
Asset base
DKK million Intangible assets Property, plant and equipment
2013Other
intangible assets TotalLand and buildings
Plant and machinery
Fixtures and fittings,
other plant and equipment
Underconstruction Total
Cost
Cost at 1 January 2013 - - 1,129 112 4 10 1,255
Additions 15 15 - - - 28 28
Disposals - - -4 - - - -4
Transfers - - - 6 - -6 -
Cost at 31 December 2013 15 15 1,125 118 4 32 1,279
Depreciation, amortisation and impairment losses
Depreciation, amortisation and impairment losses at 1 January 2013 - - 95 102 4 - 201
Disposals - - -4 -1 - - -5
Depreciation and amortisation 1 1 6 7 - - 13
Depreciation, amortisation and impairment losses at 31 December 2013 1 1 97 108 4 - 209Carrying amount at 31 December 2013 14 14 1,028 10 - 32 1,070Carrying amount of assets pledged as security for loans - - 922 - - - 922
2.1 Intangible assets and property, plant and equipment
Depreciation and amortisation are included in administrative expenses.
Parent Company SECTION 2: ASSET BASE 145Carlsberg Group Annual Report 2013
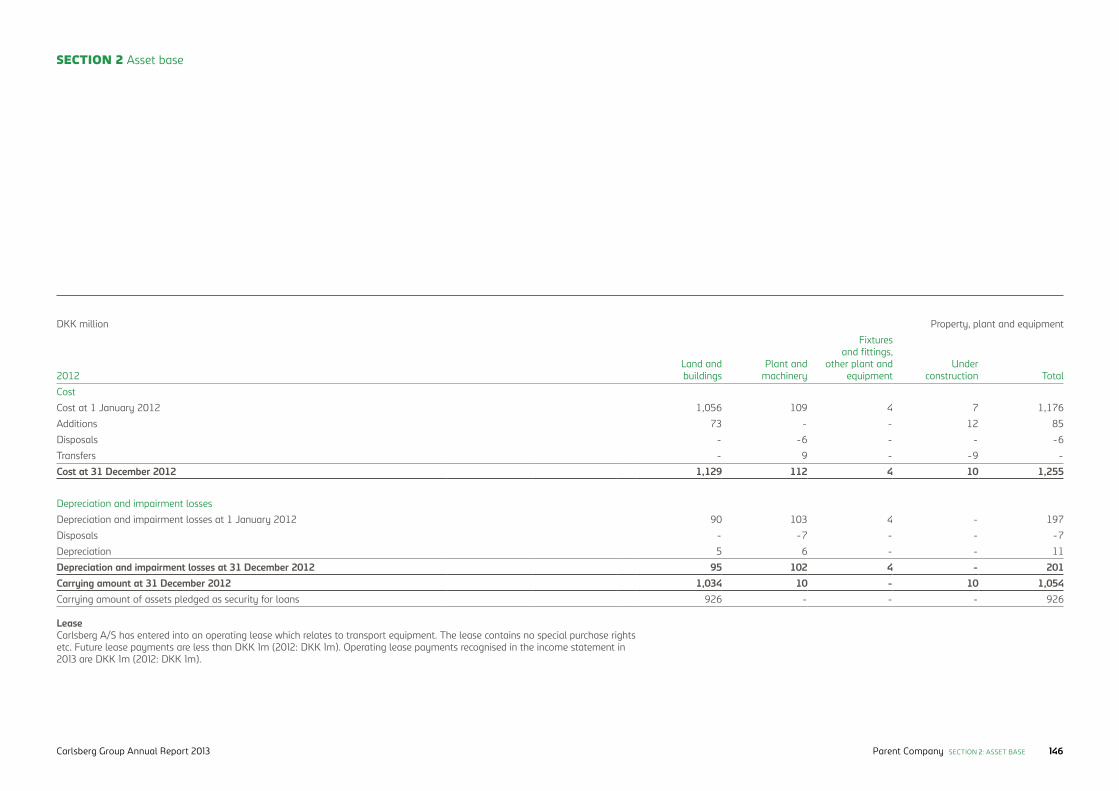
SECTION 2 Asset base
DKK million Property, plant and equipment
2012Land and buildings
Plant and machinery
Fixtures and fittings,
other plant and equipment
Underconstruction Total
Cost
Cost at 1 January 2012 1,056 109 4 7 1,176
Additions 73 - - 12 85
Disposals - -6 - - -6
Transfers - 9 - -9 -
Cost at 31 December 2012 1,129 112 4 10 1,255
Depreciation and impairment losses
Depreciation and impairment losses at 1 January 2012 90 103 4 - 197
Disposals - -7 - - -7
Depreciation 5 6 - - 11
Depreciation and impairment losses at 31 December 2012 95 102 4 - 201Carrying amount at 31 December 2012 1,034 10 - 10 1,054Carrying amount of assets pledged as security for loans 926 - - - 926
Lease Carlsberg A/S has entered into an operating lease which relates to transport equipment. The lease contains no special purchase rights etc. Future lease payments are less than DKK 1m (2012: DKK 1m). Operating lease payments recognised in the income statement in 2013 are DKK 1m (2012: DKK 1m).
Parent Company SECTION 2: ASSET BASE 146Carlsberg Group Annual Report 2013
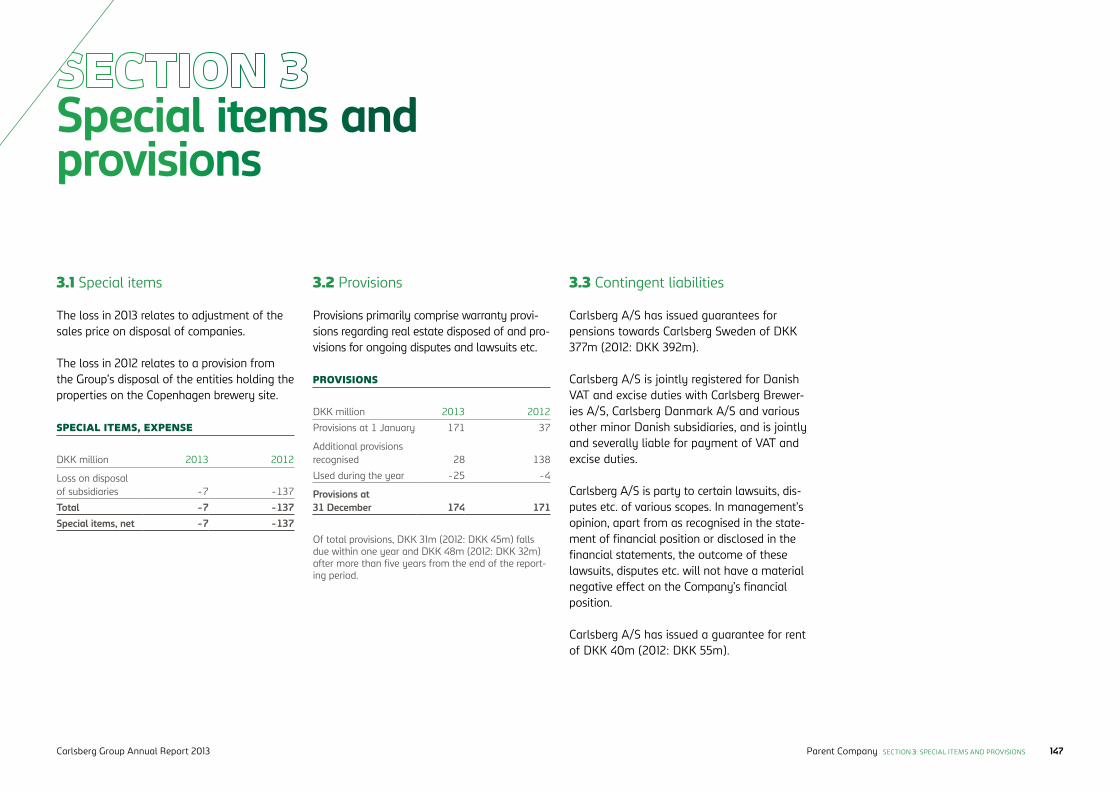
Special items and provisions
DKK million 2013 2012
Loss on disposal of subsidiaries -7 -137
Total -7 -137Special items, net -7 -137
DKK million 2013 2012
Provisions at 1 January 171 37
Additional provisions recognised 28 138
Used during the year -25 -4
Provisions at 31 December 174 171
3.1 Special items 3.2 Provisions 3.3 Contingent liabilities
SPECIAL ITEMS, EXPENSE
PROVISIONS
The loss in 2013 relates to adjustment of the sales price on disposal of companies.
The loss in 2012 relates to a provision from the Group’s disposal of the entities holding the properties on the Copenhagen brewery site.
Provisions primarily comprise warranty provi-sions regarding real estate disposed of and pro-visions for ongoing disputes and lawsuits etc.
Carlsberg A/S has issued guarantees for pensions towards Carlsberg Sweden of DKK 377m (2012: DKK 392m).
Carlsberg A/S is jointly registered for Danish VAT and excise duties with Carlsberg Brewer-ies A/S, Carlsberg Danmark A/S and various other minor Danish subsidiaries, and is jointly and severally liable for payment of VAT and excise duties.
Carlsberg A/S is party to certain lawsuits, dis-putes etc. of various scopes. In management’s opinion, apart from as recognised in the state-ment of financial position or disclosed in the financial statements, the outcome of these lawsuits, disputes etc. will not have a material negative effect on the Company’s financial position.
Carlsberg A/S has issued a guarantee for rent of DKK 40m (2012: DKK 55m).
Of total provisions, DKK 31m (2012: DKK 45m) falls due within one year and DKK 48m (2012: DKK 32m) after more than five years from the end of the report-ing period.
Parent Company SECTION 3: SPECIAL ITEMS AND PROVISIONS 147Carlsberg Group Annual Report 2013
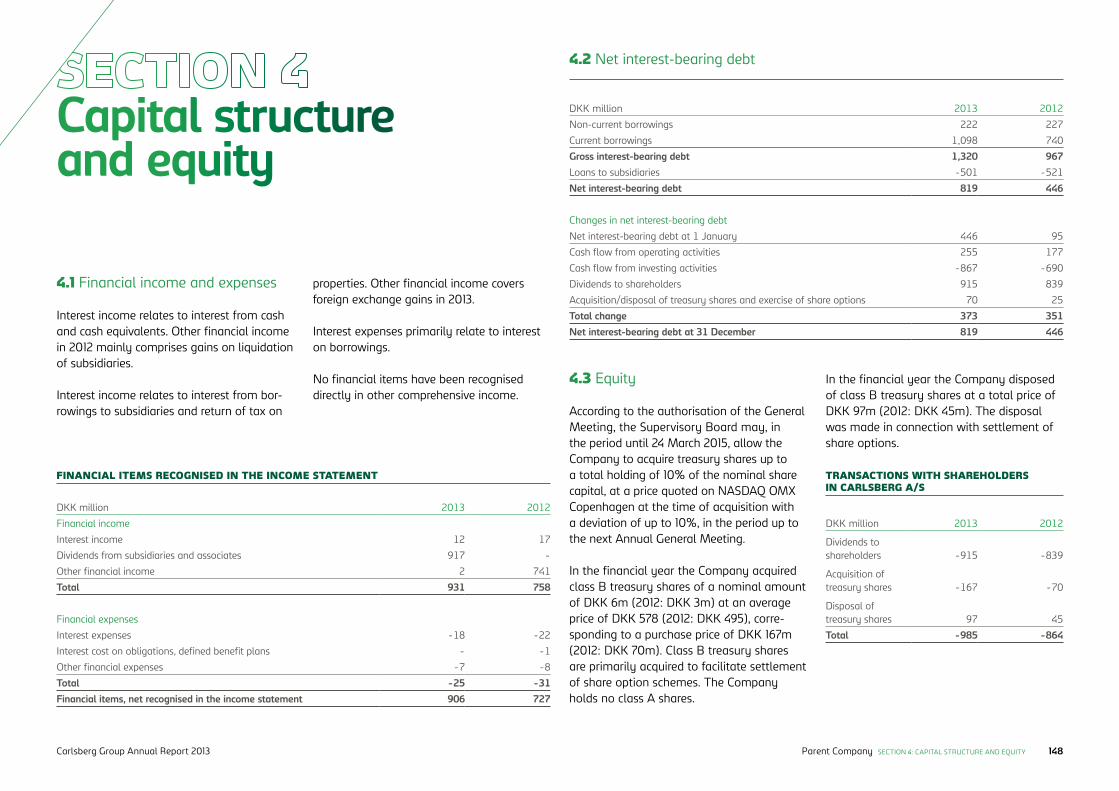
Capital structure and equity
DKK million 2013 2012
Financial income
Interest income 12 17
Dividends from subsidiaries and associates 917 -
Other financial income 2 741
Total 931 758
Financial expenses
Interest expenses -18 -22
Interest cost on obligations, defined benefit plans - -1
Other financial expenses -7 -8
Total -25 -31Financial items, net recognised in the income statement 906 727
FINANCIAL ITEMS RECOGNISED IN THE INCOME STATEMENT
4.1 Financial income and expenses
4.2 Net interest-bearing debt
Interest income relates to interest from cash and cash equivalents. Other financial income in 2012 mainly comprises gains on liquidation of subsidiaries.
Interest income relates to interest from bor-rowings to subsidiaries and return of tax on
properties. Other financial income covers foreign exchange gains in 2013.
Interest expenses primarily relate to interest on borrowings.
No financial items have been recognised directly in other comprehensive income.
DKK million 2013 2012
Non-current borrowings 222 227
Current borrowings 1,098 740
Gross interest-bearing debt 1,320 967Loans to subsidiaries -501 -521
Net interest-bearing debt 819 446
Changes in net interest-bearing debt
Net interest-bearing debt at 1 January 446 95
Cash flow from operating activities 255 177
Cash flow from investing activities -867 -690
Dividends to shareholders 915 839
Acquisition/disposal of treasury shares and exercise of share options 70 25
Total change 373 351Net interest-bearing debt at 31 December 819 446
According to the authorisation of the General Meeting, the Supervisory Board may, in the period until 24 March 2015, allow the Company to acquire treasury shares up to a total holding of 10% of the nominal share capital, at a price quoted on NASDAQ OMX Copenhagen at the time of acquisition with a deviation of up to 10%, in the period up to the next Annual General Meeting.
In the financial year the Company acquired class B treasury shares of a nominal amount of DKK 6m (2012: DKK 3m) at an average price of DKK 578 (2012: DKK 495), corre-sponding to a purchase price of DKK 167m (2012: DKK 70m). Class B treasury shares are primarily acquired to facilitate settlement of share option schemes. The Company holds no class A shares.
4.3 Equity In the financial year the Company disposed of class B treasury shares at a total price of DKK 97m (2012: DKK 45m). The disposal was made in connection with settlement of share options.
TRANSACTIONS WITH SHAREHOLDERS IN CARLSBERG A/S
DKK million 2013 2012
Dividends toshareholders -915 -839
Acquisition oftreasury shares -167 -70
Disposal oftreasury shares 97 45
Total -985 -864
Parent Company SECTION 4: CAPITAL STRUCTURE AND EQUITY 148Carlsberg Group Annual Report 2013
SECTION 4 Capital structure and equity
Class A shares Class B shares Total share capital
Shares of DKK 20
Nominal value,
DKK ’000Shares of
DKK 20
Nominal value,
DKK ’000Shares of
DKK 20
Nominal value,
DKK ’000
1 January 2012 33,699,252 673,985 118,857,554 2,377,151 152,556,806 3,051,136
No change in 2012 - - - - - -
31 December 2012 33,699,252 673,985 118,857,554 2,377,151 152,556,806 3,051,136No change in 2013 - - - - - -
31 December 2013 33,699,252 673,985 118,857,554 2,377,151 152,556,806 3,051,136
SHARE CAPITAL
Shares of DKK 20
Nominal value, DKKm
Percentage of share
capital
1 January 2012 33,498 - 0.0%
Acquisition of treasury shares 141,000 3 0.1%
Used to settle share options -172,911 -3 -0.1%
31 December 2012 1,587 - 0.0%1 January 2013 1,587 - 0.0%
Acquisition of treasury shares 288,582 6 0.2%
Used to settle share options -266,228 -5 -0.2%
31 December 2013 23,941 1 0.0%
TREASURY SHARES
A shares carry 20 votes per DKK 20 share.
At 31 December 2013 the fair value of treasury shares amounted to DKK 14m (2012: DKK 1m).
4.4 Borrowings
DKK million 2013 2012
Non-current borrowings
Mortgages 209 209
Other non-current borrowings 13 18
Total 222 227Current borrowings
Current portion of other non-current borrowings 5 -
Borrowings from subsidiaries 1,093 740
Total 1,098 740Total non-current and current borrowings 1,320 967Fair value 1,327 980
Other non-current borrowings include employee bonds of DKK 13m (2012: DKK 18m). No bonds have been issued in 2013 or 2012.
Borrowings are measured at amortised cost.
The fair value of borrowings in subsidiaries corresponds to the carrying amount in all material respects.
DKK millionAverage effective
interest rate2013Interest
rate Fixed forCarrying amount
Interest rate risk
Mortgages
Fixed-rate Fixed 3.12% 2-3 years 209 Fair value
Total mortgage 3.12% 209
2012
Mortgages
Fixed-rate Fixed 2.85% 3-4 years 209 Fair value
Total mortgages 2.85% 209
INTEREST RATE RISK
2013 The fixed-rate mortgage is one loan which has a fixed interest rate until 2017.
Non-current borrowing consists of employee bonds that carry a fixed interest rate and one mortgage carrying a fixed interest.
2012 The fixed-rate mortgages comprised one mort-gage with a time to maturity of more than five years.
Swaps were settled in 2012, so there were no fair value adjustment in 2013 (2012: DKK -8m).
B shares carry two votes per DKK 20 share. A prefer-ential right to an 8% non-cumulative dividend is attached to B shares. Apart from votes and dividends, all shares rank equally.
4.5 Interest rate risk
Parent Company SECTION 4: CAPITAL STRUCTURE AND EQUITY 149Carlsberg Group Annual Report 2013
SECTION 4 Capital structure and equity
DKK million
2013 1-2 years 2-3 years 3-4 years 4-5 years >5 years Total
Mortgages - - - - 209 209
Other non-current borrowings 13 - - - - 13
Total 13 - - - 209 222
2012
Mortgages - - - - 209 209
Other non-current borrowings 5 13 - - - 18
Total - 13 - - - 227
TIME TO MATURITY FOR NON-CURRENT BORROWINGS
DKK million Currency profile of borrowings before and after
derivative financial instruments
Next repricing (of principal before
currency swaps)
2013Original principal
Effect of swap
After swap 2014 2015 2016 2017 2018 2019-
227 - 227 5 13 - - - 209
2012 2013 2014 2015 2016 2017 2018-
227 - 227 - 5 13 - - 209
CURRENCY PROFILE OF BORROWINGS BEFORE AND AFTER DERIVATIVE FINANCIAL INSTRUMENTS
EXTERNAL FINANCING
DKK million 2013 2012
Intercompany loans, short-term 373 350
Total 373 350
Parent Company SECTION 4: CAPITAL STRUCTURE AND EQUITY 150Carlsberg Group Annual Report 2013
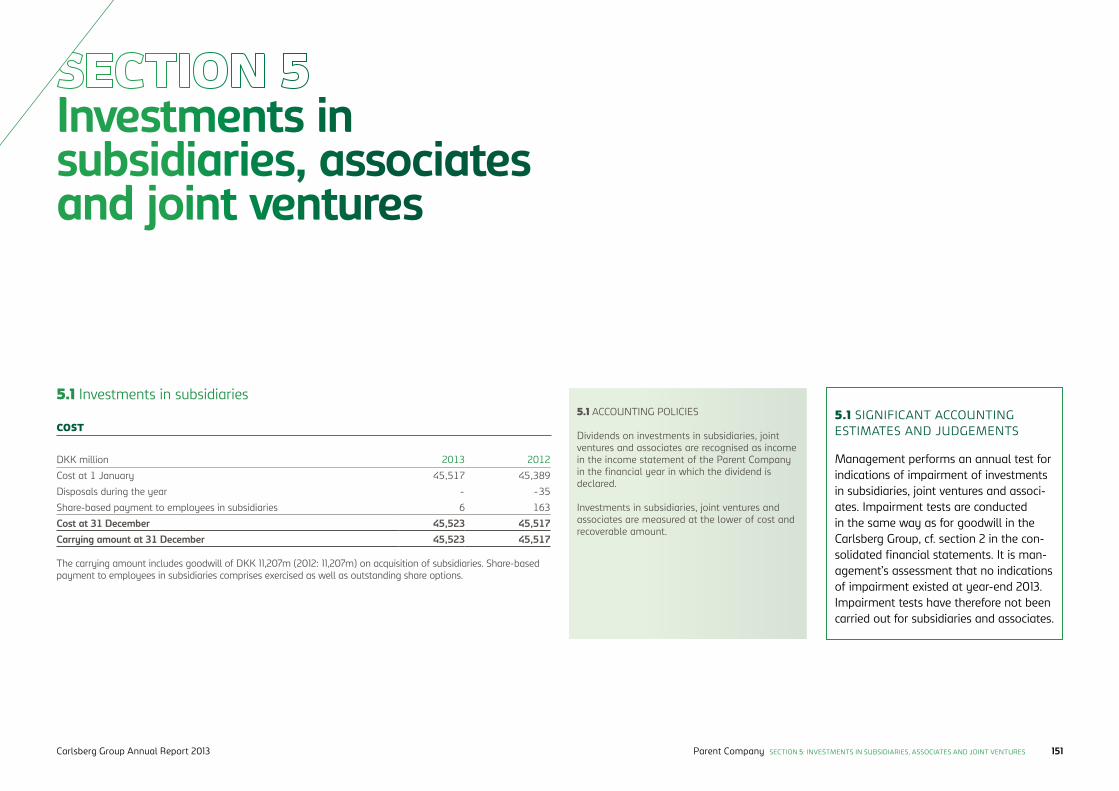
Investments in subsidiaries, associates and joint ventures
5.1 SIGNIFICANT ACCOUNTING ESTIMATES AND JUDGEMENTS
Management performs an annual test for indications of impairment of investments in subsidiaries, joint ventures and associ-ates. Impairment tests are conducted in the same way as for goodwill in the Carlsberg Group, cf. section 2 in the con-solidated financial statements. It is man-agement’s assessment that no indications of impairment existed at year-end 2013. Impairment tests have therefore not been carried out for subsidiaries and associates.
DKK million 2013 2012
Cost at 1 January 45,517 45,389
Disposals during the year - -35
Share-based payment to employees in subsidiaries 6 163
Cost at 31 December 45,523 45,517Carrying amount at 31 December 45,523 45,517
COST5.1 ACCOUNTING POLICIES
Dividends on investments in subsidiaries, joint ventures and associates are recognised as income in the income statement of the Parent Company in the financial year in which the dividend is declared.
Investments in subsidiaries, joint ventures and associates are measured at the lower of cost and recoverable amount.
The carrying amount includes goodwill of DKK 11,207m (2012: 11,207m) on acquisition of subsidiaries. Share-based payment to employees in subsidiaries comprises exercised as well as outstanding share options.
5.1 Investments in subsidiaries
Parent Company SECTION 5: INVESTMENTS IN SUBSIDIARIES, ASSOCIATES AND JOINT VENTURES 151Carlsberg Group Annual Report 2013
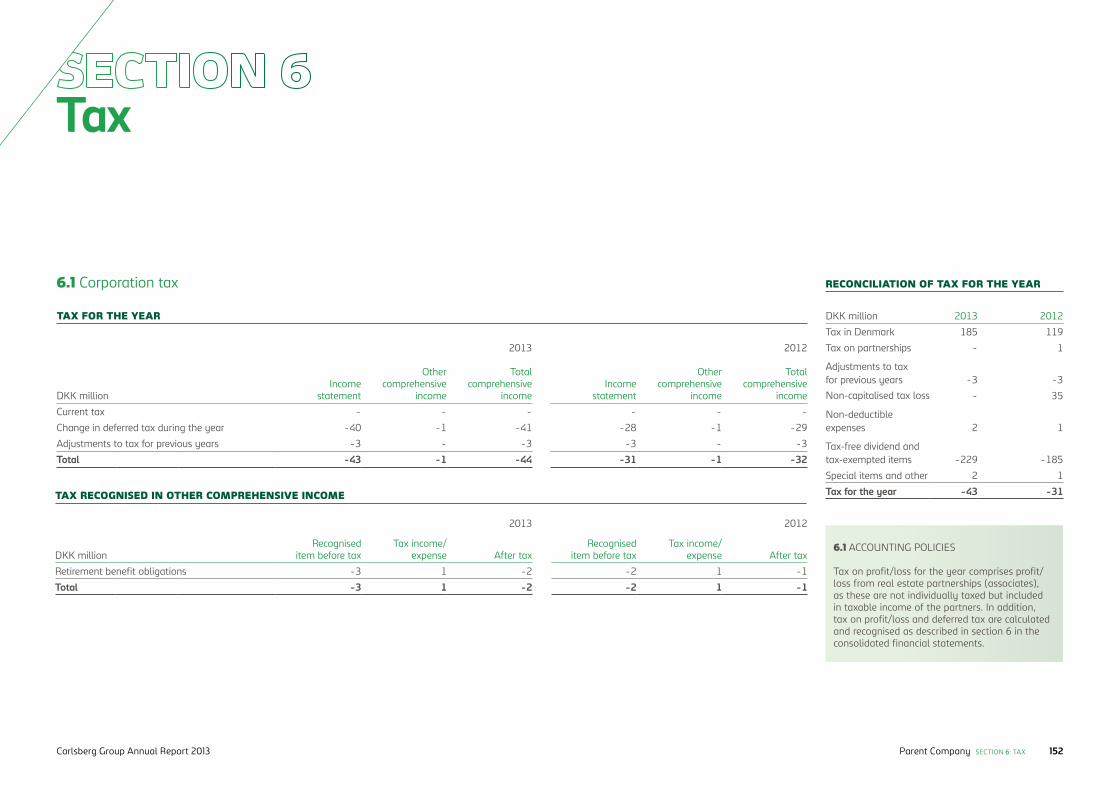
Tax
TAX RECOGNISED IN OTHER COMPREHENSIVE INCOME
2013 2012
DKK millionRecognised
item before taxTax income/
expense After taxRecognised
item before taxTax income/
expense After tax
Retirement benefit obligations -3 1 -2 -2 1 -1
Total -3 1 -2 -2 1 -1
TAX FOR THE YEAR
2013 2012
DKK millionIncome
statement
Other comprehensive
income
Total comprehensive
incomeIncome
statement
Other comprehensive
income
Total comprehensive
income
Current tax - - - - - -
Change in deferred tax during the year -40 -1 -41 -28 -1 -29
Adjustments to tax for previous years -3 - -3 -3 - -3
Total -43 -1 -44 -31 -1 -32
6.1 Corporation tax RECONCILIATION OF TAX FOR THE YEAR
DKK million 2013 2012
Tax in Denmark 185 119
Tax on partnerships - 1
Adjustments to tax for previous years -3 -3Non-capitalised tax loss - 35
Non-deductible expenses 2 1
Tax-free dividend and tax-exempted items -229 -185
Special items and other 2 1
Tax for the year -43 -31
6.1 ACCOUNTING POLICIES
Tax on profit/loss for the year comprises profit/loss from real estate partnerships (associates), as these are not individually taxed but included in taxable income of the partners. In addition, tax on profit/loss and deferred tax are calculated and recognised as described in section 6 in the consolidated financial statements.
Parent Company SECTION 6: TAX 152Carlsberg Group Annual Report 2013
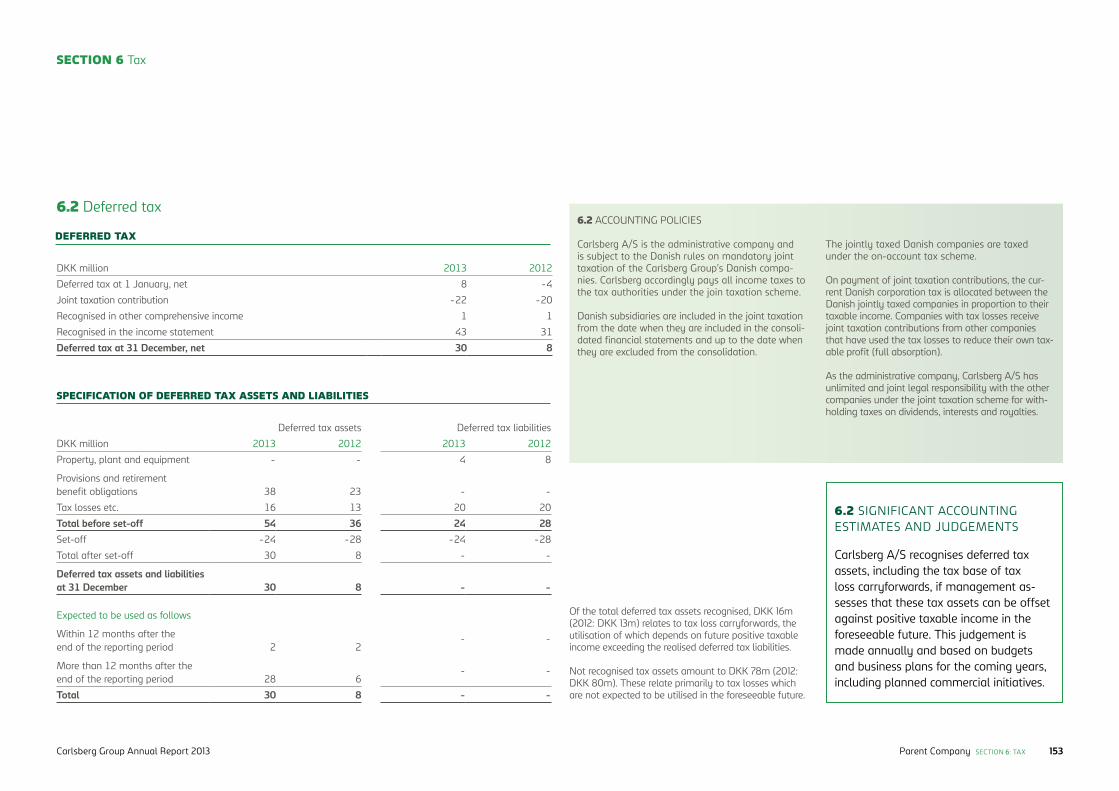
SECTION 6 Tax
6.2 Deferred tax
DKK million 2013 2012
Deferred tax at 1 January, net 8 -4
Joint taxation contribution -22 -20
Recognised in other comprehensive income 1 1
Recognised in the income statement 43 31
Deferred tax at 31 December, net 30 8
DEFERRED TAX
SPECIFICATION OF DEFERRED TAX ASSETS AND LIABILITIES
Deferred tax assets Deferred tax liabilities
DKK million 2013 2012 2013 2012
Property, plant and equipment - - 4 8
Provisions and retirement benefit obligations 38 23 - -
Tax losses etc. 16 13 20 20
Total before set-off 54 36 24 28Set-off -24 -28 -24 -28
Total after set-off 30 8 - -
Deferred tax assets and liabilities at 31 December 30 8 - -
Expected to be used as follows
Within 12 months after the end of the reporting period 2 2
- -
More than 12 months after the end of the reporting period 28 6
- -
Total 30 8 - -
Of the total deferred tax assets recognised, DKK 16m (2012: DKK 13m) relates to tax loss carryforwards, the utilisation of which depends on future positive taxable income exceeding the realised deferred tax liabilities.
Not recognised tax assets amount to DKK 78m (2012: DKK 80m). These relate primarily to tax losses which are not expected to be utilised in the foreseeable future.
6.2 SIGNIFICANT ACCOUNTING ESTIMATES AND JUDGEMENTS
Carlsberg A/S recognises deferred tax assets, including the tax base of tax loss carryforwards, if management as-sesses that these tax assets can be offset against positive taxable income in the foreseeable future. This judgement is made annually and based on budgets and business plans for the coming years, including planned commercial initiatives.
6.2 ACCOUNTING POLICIES
Carlsberg A/S is the administrative company and is subject to the Danish rules on mandatory joint taxation of the Carlsberg Group’s Danish compa-nies. Carlsberg accordingly pays all income taxes to the tax authorities under the join taxation scheme.
Danish subsidiaries are included in the joint taxation from the date when they are included in the consoli-dated financial statements and up to the date when they are excluded from the consolidation.
The jointly taxed Danish companies are taxed under the on-account tax scheme.
On payment of joint taxation contributions, the cur-rent Danish corporation tax is allocated between the Danish jointly taxed companies in proportion to their taxable income. Companies with tax losses receive joint taxation contributions from other companies that have used the tax losses to reduce their own tax-able profit (full absorption).
As the administrative company, Carlsberg A/S has unlimited and joint legal responsibility with the other companies under the joint taxation scheme for with-holding taxes on dividends, interests and royalties.
Parent Company SECTION 6: TAX 153Carlsberg Group Annual Report 2013
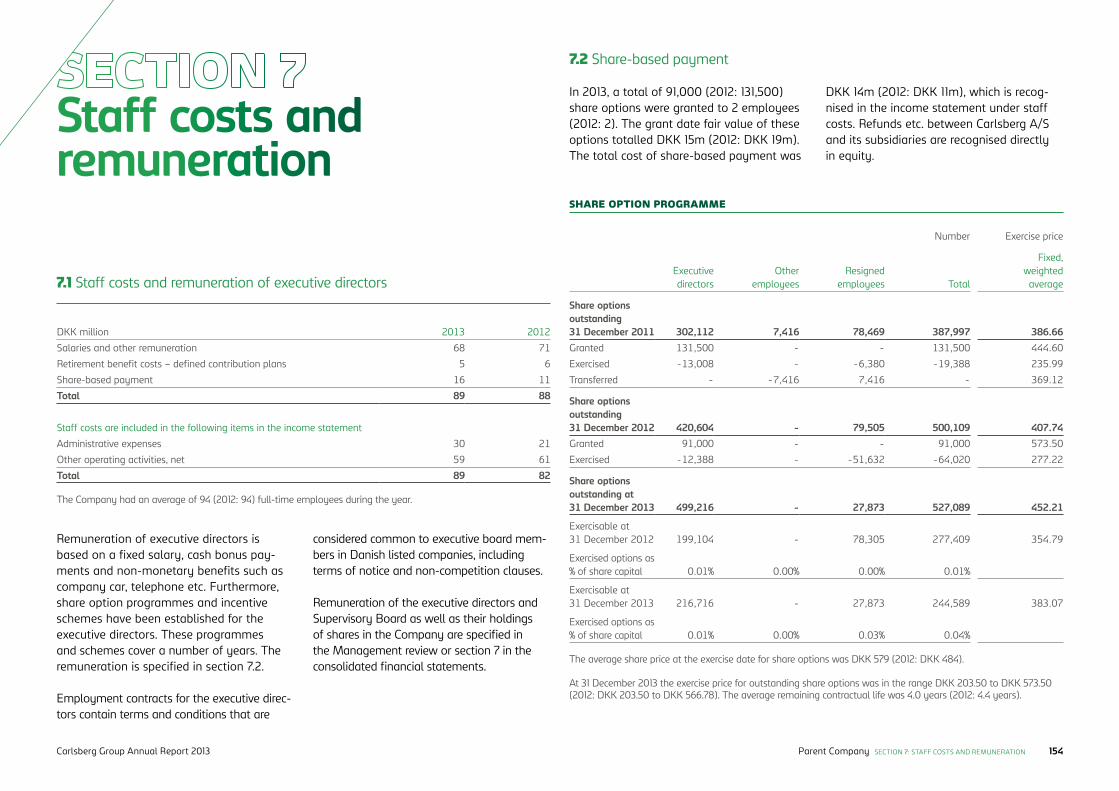
Staff costs and remuneration
DKK million 2013 2012
Salaries and other remuneration 68 71
Retirement benefit costs – defined contribution plans 5 6
Share-based payment 16 11
Total 89 88
Staff costs are included in the following items in the income statement
Administrative expenses 30 21
Other operating activities, net 59 61
Total 89 82
7.1 Staff costs and remuneration of executive directors
7.2 Share-based payment
Remuneration of executive directors is based on a fixed salary, cash bonus pay-ments and non-monetary benefits such as company car, telephone etc. Furthermore, share option programmes and incentive schemes have been established for the executive directors. These programmes and schemes cover a number of years. The remuneration is specified in section 7.2.
Employment contracts for the executive direc-tors contain terms and conditions that are
In 2013, a total of 91,000 (2012: 131,500) share options were granted to 2 employees (2012: 2). The grant date fair value of these options totalled DKK 15m (2012: DKK 19m). The total cost of share-based payment was
The Company had an average of 94 (2012: 94) full-time employees during the year.
The average share price at the exercise date for share options was DKK 579 (2012: DKK 484).
At 31 December 2013 the exercise price for outstanding share options was in the range DKK 203.50 to DKK 573.50 (2012: DKK 203.50 to DKK 566.78). The average remaining contractual life was 4.0 years (2012: 4.4 years).
considered common to executive board mem-bers in Danish listed companies, including terms of notice and non-competition clauses.
Remuneration of the executive directors and Supervisory Board as well as their holdings of shares in the Company are specified in the Management review or section 7 in the consolidated financial statements.
DKK 14m (2012: DKK 11m), which is recog-nised in the income statement under staff costs. Refunds etc. between Carlsberg A/S and its subsidiaries are recognised directly in equity.
Number Exercise price
Executive directors
Other employees
Resigned employees Total
Fixed, weighted average
Share options outstanding 31 December 2011 302,112 7,416 78,469 387,997 386.66Granted 131,500 - - 131,500 444.60
Exercised -13,008 - -6,380 -19,388 235.99
Transferred - -7,416 7,416 - 369.12
Share options outstanding 31 December 2012 420,604 - 79,505 500,109 407.74Granted 91,000 - - 91,000 573.50
Exercised -12,388 - -51,632 -64,020 277.22
Share options outstanding at 31 December 2013 499,216 - 27,873 527,089 452.21
Exercisable at 31 December 2012 199,104 - 78,305 277,409 354.79
Exercised options as % of share capital 0.01% 0.00% 0.00% 0.01%
Exercisable at 31 December 2013 216,716 - 27,873 244,589 383.07
Exercised options as % of share capital 0.01% 0.00% 0.03% 0.04%
SHARE OPTION PROGRAMME
Parent Company SECTION 7: STAFF COSTS AND REMUNERATION 154Carlsberg Group Annual Report 2013

SECTION 7 STAFF COSTS AND REMUNERATION
The average share price at the exercise date for share options was DKK 579 (2012: DKK 484).
At 31 December 2013 the exercise price for outstanding share options was in the range DKK 203.50 to DKK 573.50 (2012: DKK 203.50 to DKK 566.78). The average remaining contractual life was 4.0 years (2012: 4.4 years).
2013 2012
Grant date Expiry date ProgrammeExercise
priceExpected volatility
Risk-free interest rate
Expected dividend
yield
Expected life of options,
years
Fair value at measure ment
dateOptions
outstandingOptions
outstanding
01.03.2005 01.03.2013 Grant 2005 232.71 27% 3.1% 1.7% 5.5 74.27 - 31,828
01.03.2006 01.03.2014 Grant 2006 306.89 19% 3.3% 1.3% 5.5 89.37 14,246 39,022
01.03.2007 01.03.2015 Grant 2007 472.11 19% 3.9% 1.0% 5.5 136.67 50,791 52,649
01.03.2008 01.03.2016 Grant 2008 457.82 22% 3.6% 1.1% 5.5 141.72 49,552 51,410
01.09.2008 01.09.2016 Special grant 448.18 27% 4.3% 1.3% 5.5 128.83 40,000 40,000
01.03.2009 01.03.2017 Grant 2009 203.50 52% 3.0% 1.7% 5.5 88.41 60,000 62,500
01.03.2010 01.03.2018 Grant 2010 417.34 30% 3.1% 0.8% 8.0 174.52 30,000 31,200
01.03.2011 01.03.2019 Grant 2011 566.78 25% 2.9% 0.9% 8.0 180.50 60,000 60,000
01.03.2012 01.03.2020 Grant 2012 444.60 34% 0.9% 1.2% 8.0 146.67 131,500 131,500
01.05.2013 01.05.2021 Grant 2013 573.50 27% 1.5% 1.0% 8.0 167.98 91,000 -
Outstanding share options under the share option programme 527,089 500,109
ASSUMPTIONS
Parent Company SECTION 7: STAFF COSTS AND REMUNERATION 155Carlsberg Group Annual Report 2013
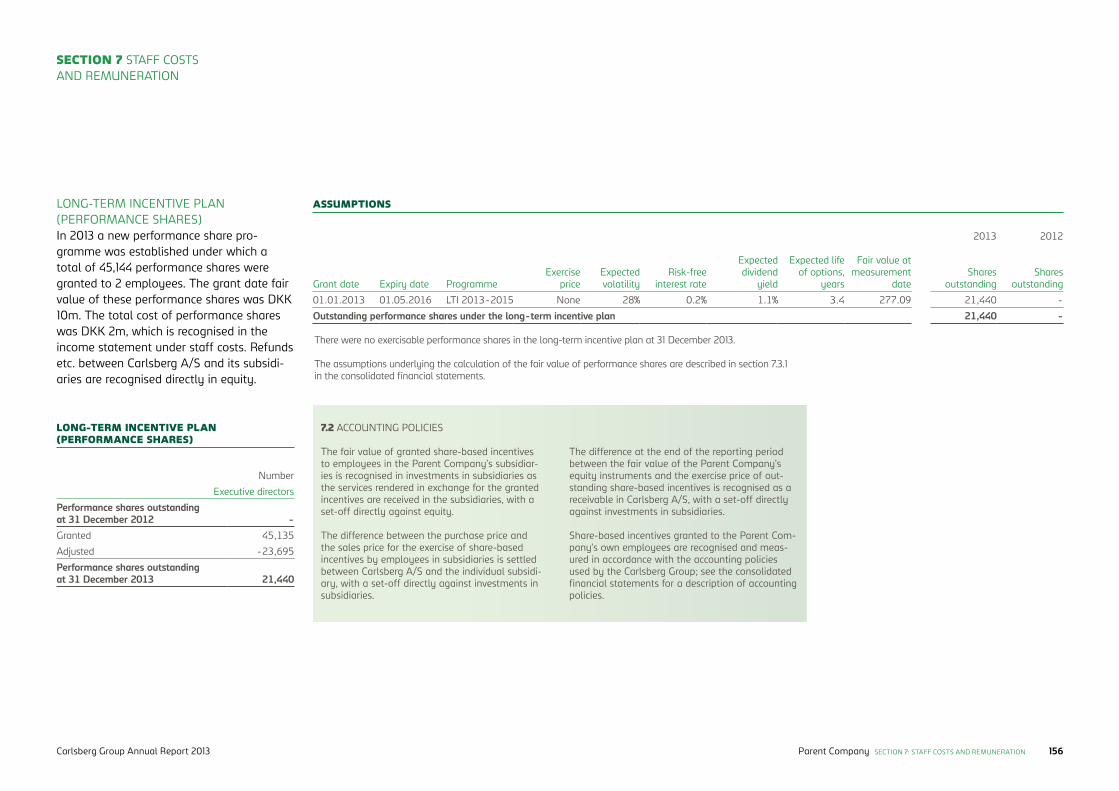
There were no exercisable performance shares in the long-term incentive plan at 31 December 2013.
The assumptions underlying the calculation of the fair value of performance shares are described in section 7.3.1 in the consolidated financial statements.
Number
Executive directors
Performance shares outstanding at 31 December 2012 -Granted 45,135
Adjusted -23,695
Performance shares outstanding at 31 December 2013 21,440
2013 2012
Grant date Expiry date ProgrammeExercise
priceExpected volatility
Risk-free interest rate
Expected dividend
yield
Expected life of options,
years
Fair value at measure ment
dateShares
outstandingShares
outstanding
01.01.2013 01.05.2016 LTI 2013-2015 None 28% 0.2% 1.1% 3.4 277.09 21,440 -
Outstanding performance shares under the long-term incentive plan 21,440 -
ASSUMPTIONSLONG-TERM INCENTIVE PLAN (PERFORMANCE SHARES)In 2013 a new performance share pro-gramme was established under which a total of 45,144 performance shares were granted to 2 em ployees. The grant date fair value of these per formance shares was DKK 10m. The total cost of performance shares was DKK 2m, which is recognised in the income statement under staff costs. Refunds etc. between Carlsberg A/S and its subsidi-aries are recognised directly in equity.
7.2 ACCOUNTING POLICIES
The fair value of granted share-based incentives to employees in the Parent Company’s subsidiar-ies is recognised in investments in subsidiaries as the services rendered in exchange for the granted incentives are received in the subsidiaries, with a set-off directly against equity.
The difference between the purchase price and the sales price for the exercise of share-based incentives by employees in subsidiaries is settled between Carlsberg A/S and the individual subsidi-ary, with a set-off directly against investments in subsidiaries.
The difference at the end of the reporting period between the fair value of the Parent Company’s equity instruments and the exercise price of out-standing share-based incentives is recognised as a receivable in Carlsberg A/S, with a set-off directly against investments in subsidiaries.
Share-based incentives granted to the Parent Com-pany’s own employees are recognised and meas-ured in accordance with the accounting policies used by the Carlsberg Group; see the consolidated financial statements for a description of accounting policies.
LONG-TERM INCENTIVE PLAN (PERFORMANCE SHARES)
SECTION 7 STAFF COSTS AND REMUNERATION
Parent Company SECTION 7: STAFF COSTS AND REMUNERATION 156Carlsberg Group Annual Report 2013

DKK million 2013 2012
Total obligations at 1 January 45 45
Interest cost - 1
Actuarial losses 3 2
Benefits paid -3 -3
Total obligations at 31 December 45 45
2013 2012
Discount rate 1.0% 1.0%
Future retirement benefit increases 2.0% 2.0%
OBLIGATIONS
ASSUMPTIONS APPLIED
MATURITY OF PENSION OBLIGATIONS
7.3 Retirement benefit obligations and similar obligations
Retirement benefit obligations and similar obligations comprise payments to retired directors that are not covered by an insur-ance company. The plan is unfunded.
The actuarial assumptions underlying the calculations are based on local economic conditions and labour market conditions.
The interest rate cost, DKK 0m, is recognised in the income statement, while the actuarial losses, DKK 3m, are recognised in other comprehensive income.
DKK million<1
year1-5
years>5
years Total
Pension benefits 3 14 28 45
SECTION 7 STAFF COSTS AND REMUNERATION
Parent Company SECTION 7: STAFF COSTS AND REMUNERATION 157Carlsberg Group Annual Report 2013
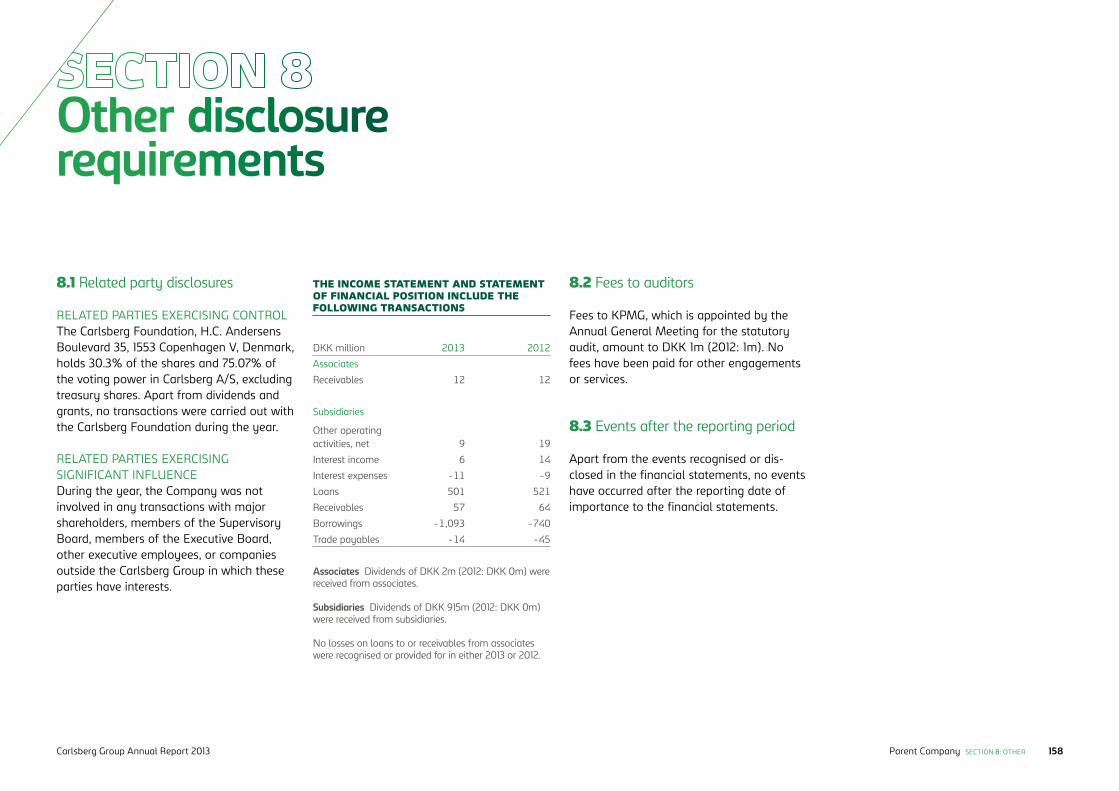
Other disclosure requirements
8.1 Related party disclosures 8.2 Fees to auditors
8.3 Events after the reporting period
RELATED PARTIES EXERCISING CONTROLThe Carlsberg Foundation, H.C. Andersens Boulevard 35, 1553 Copenhagen V, Denmark, holds 30.3% of the shares and 75.07% of the voting power in Carlsberg A/S, excluding treasury shares. Apart from dividends and grants, no transactions were carried out with the Carlsberg Foundation during the year.
RELATED PARTIES EXERCISING SIGNIFICANT INFLUENCEDuring the year, the Company was not involved in any transactions with major shareholders, members of the Supervisory Board, members of the Executive Board, other executive employees, or companies outside the Carlsberg Group in which these parties have interests.
Fees to KPMG, which is appointed by the Annual General Meeting for the statutory audit, amount to DKK 1m (2012: 1m). No fees have been paid for other engagements or services.
Apart from the events recognised or dis-closed in the financial statements, no events have occurred after the reporting date of importance to the financial statements.
DKK million 2013 2012
Associates
Receivables 12 12
Subsidiaries
Other operating activities, net 9 19
Interest income 6 14
Interest expenses -11 -9
Loans 501 521
Receivables 57 64
Borrowings -1,093 -740
Trade payables -14 -45
THE INCOME STATEMENT AND STATEMENT OF FINANCIAL POSITION INCLUDE THE FOLLOWING TRANSACTIONS
Associates Dividends of DKK 2m (2012: DKK 0m) were received from associates.
Subsidiaries Dividends of DKK 915m (2012: DKK 0m) were received from subsidiaries.
No losses on loans to or receivables from associates were recognised or provided for in either 2013 or 2012.
Parent Company SECTION 8: OTHER 158Carlsberg Group Annual Report 2013
General accounting policies
The 2013 financial statements of Carlsberg A/S have been prepared in accordance with International Financial Reporting Standards (IFRS) as adopted by the EU and Danish disclosure requirements for listed companies, cf. the statutory order pursuant to the Dan-ish Financial Statements Act.
The financial statements are presented in Danish kroner (DKK), which is the functional currency.
The accounting policies for the Parent Com-pany are the same as for the Carlsberg Group; see section 9 in the consolidated financial statements and the individual sections.
SIGNIFICANT ACCOUNTING ESTIMATESIn preparing Carlsberg A/S’s financial state-ments, management makes various account-ing estimates and assumptions which form the basis of presentation, recognition and measurement of the Company’s assets and liabilities.
The judgements, estimates and assumptions made are based on historical experience and other factors which management assesses to be reliable, but which by their very nature are associated with uncertainty and unpredictabil-ity. These assumptions may prove incomplete or incorrect, and unexpected events or circum-stances may arise.
The significant accounting estimates and judgements made and accounting policies specific to the Parent Company are present-ed in the explanatory notes.
Parent Company SECTION 9: GENERAL ACCOUNTING POLICIES 159Carlsberg Group Annual Report 2013
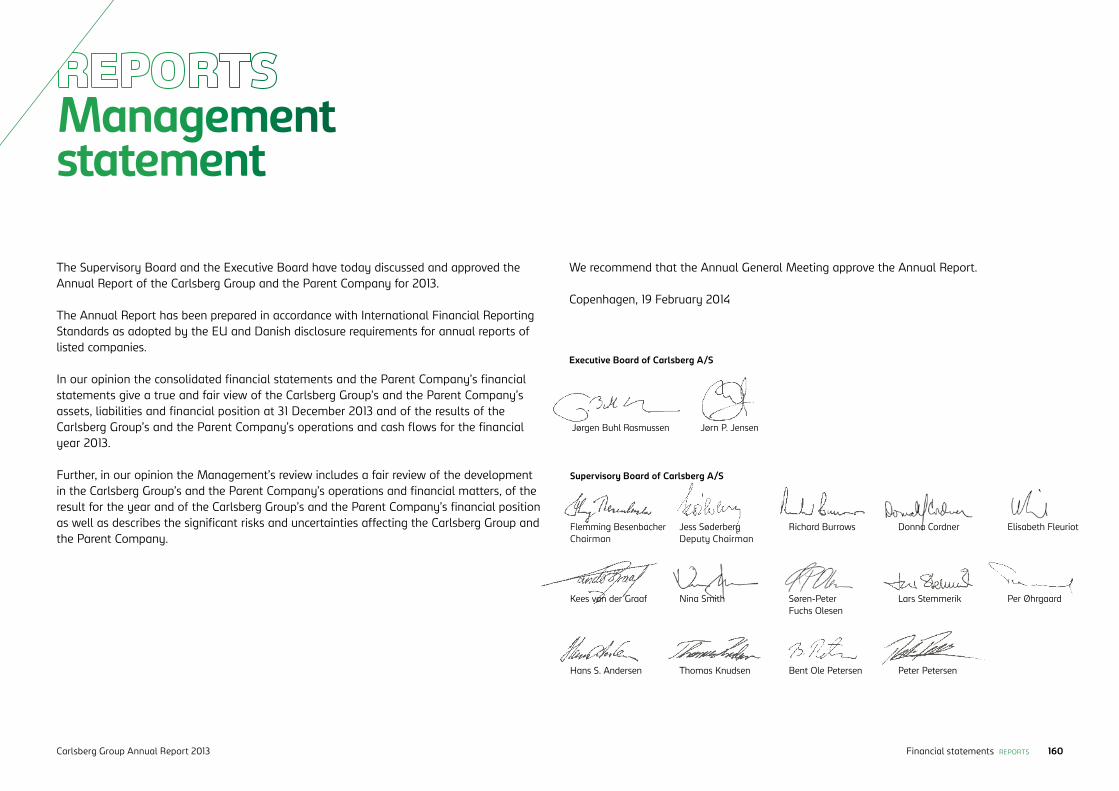
Management statement
The Supervisory Board and the Executive Board have today discussed and approved the Annual Report of the Carlsberg Group and the Parent Company for 2013.
The Annual Report has been prepared in accordance with International Financial Reporting Standards as adopted by the EU and Danish disclosure requirements for annual reports of listed companies.
In our opinion the consolidated financial statements and the Parent Company’s financial statements give a true and fair view of the Carlsberg Group’s and the Parent Company’s assets, liabilities and financial position at 31 December 2013 and of the results of the Carlsberg Group’s and the Parent Company’s operations and cash flows for the financial year 2013.
Further, in our opinion the Management’s review includes a fair review of the development in the Carlsberg Group’s and the Parent Company’s operations and financial matters, of the result for the year and of the Carlsberg Group’s and the Parent Company’s financial position as well as describes the significant risks and uncertainties affecting the Carlsberg Group and the Parent Company.
Jørn P. JensenJørgen Buhl Rasmussen
Supervisory Board of Carlsberg A/S
Flemming BesenbacherChairman
Kees van der Graaf
Hans S. Andersen
Jess SøderbergDeputy Chairman
Nina Smith
Thomas Knudsen
Richard Burrows
Søren-Peter Fuchs Olesen
Bent Ole Petersen
Donna Cordner
Lars Stemmerik
Peter Petersen
Elisabeth Fleuriot
Per Øhrgaard
We recommend that the Annual General Meeting approve the Annual Report.
Copenhagen, 19 February 2014
Executive Board of Carlsberg A/S
Carlsberg Group Annual Report 2013 160Financial statements REPORTS
Henrik Kronborg IversenState AuthorisedPublic Accountant
Jesper Ridder OlsenState AuthorisedPublic Accountant
The independent auditors’ report
TO THE SHAREHOLDERS OF CARLSBERG A/S
INDEPENDENT AUDITORS’ REPORT ON THE CONSOLIDATED FINANCIAL STATEMENTS AND THE PARENT COMPANY FINANCIAL STATEMENTSWe have audited the consolidated financial statements and the Parent Company financial state-ments of Carlsberg A/S for the financial year 2013. The consolidated financial statements and the Parent Company financial statements comprise income statement, statement of compre-hensive income, statement of financial position, statement of changes in equity, statement of cash flows and notes, including a summary of significant accounting policies for the Carlsberg Group as well as for the Parent Company. The consolidated financial statements and the Parent Company financial statements are prepared in accordance with International Financial Reporting Standards as adopted by the EU and Danish disclosure requirements for listed companies.
Management’s responsibility for the consolidated financial statements and the Parent Company financial statementsManagement is responsible for the preparation of consolidated financial statements and Parent Company financial statements that give a true and fair view in accordance with Inter-national Financial Reporting Standards as adopted by the EU and Danish disclosure require-ments for listed companies and for such internal control that Management determines is nec-essary to enable the preparation of consolidated financial statements and Parent Company financial statements that are free from material misstatement, whether due to fraud or error.
Auditors’ responsibilityOur responsibility is to express an opinion on the consolidated financial statements and the Parent Company financial statements based on our audit. We conducted our audit in accord-ance with International Standards on Auditing and additional requirements under Danish au-dit regulation. This requires that we comply with ethical requirements and plan and perform the audit to obtain reasonable assurance as to whether the consolidated financial statements and the Parent Company financial statements are free from material misstatement.
An audit involves performing procedures to obtain audit evidence about the amounts and dis-closures in the consolidated financial statements and the Parent Company financial statements. The procedures selected depend on the auditors’ judgement, including the assessment of the risks of material misstatement of the consolidated financial statements and the Parent Com-pany financial statements, whether due to fraud or error. In making those risk assessments, the auditors consider internal control relevant to the Company’s preparation of consolidated financial statements and Parent Company financial statements that give a true and fair view in order to design audit procedures that are appropriate in the circumstances, but not for the purpose of ex-pressing an opinion on the effectiveness of the Company’s internal control. An audit also includes evaluating the appropriateness of accounting policies used and the reasonableness of accounting estimates made by Management, as well as evaluating the overall presentation of the consoli-dated financial statements and the Parent Company financial statements.
We believe that the audit evidence we have obtained is sufficient and appropriate to provide a basis for our opinion.
Our audit has not resulted in any qualification.
OpinionIn our opinion, the consolidated financial statements and the Parent Company financial statements give a true and fair view of the Carlsberg Group’s and the parent company’s financial position at 31 December 2013 and of the results of the Carlsberg Group’s and the Parent Company’s operations and cash flows for the financial year 2013 in accordance with International Financial Reporting Standards as adopted by the EU and Danish disclosure requirements for listed companies.
STATEMENT ON THE MANAGEMENT’S REVIEWPursuant to the Danish Financial Statements Act, we have read the Management’s review. We have not performed any further procedures in addition to the audit of the consolidated financial statements and the Parent Company financial statements. On this basis, it is our opinion that the information provided in the Management’s review is consistent with the consolidated financial statements and the Parent Company financial statements.
Copenhagen, 19 February 2014
KPMGStatsautoriseret Revisionspartnerselskab
Carlsberg Group Annual Report 2013 161Financial statements REPORTS

Carlsberg’s Supervisory Board has 14 members; five members are attached to the Carlsberg Foundation, the Company’s principal shareholder, five members have an international business background and four members are elected by the employees.
FLEMMING BESENBACHERChairmanBorn 1952. Professor, D.Sc., h.c. mult., FRSC. Elected 2005 and 2013. Election period expires 2014. Chair-man of the Supervisory Board and the Nomination Committee since March 2012. Member of the Audit and Remuneration Committees 2012-2013. Member of the Board of Directors of the Carlsberg Founda-tion (Chairman as of 1 January 2012) and of the Supervisory Boards of property companies affiliated to the Carlsberg Foundation. Chairman of the Board of Trustees of the Carls-berg Laboratory and member of the Boards of the Tuborg Foundation, MedTech Innovation Center, LevOss and the Danish management de-velopment organisation CfL. He was director of the Interdisciplinary Nano-science Center (iNANO), Aarhus University, from 2002 to 2012. He has extensive experience of managing large knowledge-based organisations and has strong competences relating to innovation, research, CSR and sus-tainable development. He is Professor Honoris Causa at 10 international universities and has received many international awards, including the Friendship Award and The Chinese Government Highest International Scientific and Technological Cooper-ation Award of the People’s Republic of China. Most recently appointed as Foreign Academician of the Chinese Academy of Sciences, which advises the Chinese government on major scientific decisions.
JESS SØDERBERG1
Deputy ChairmanBorn 1944. Elected 2008 and 2013. Election period expires 2014. Chair-man of the Audit Committee and member of the Nomination and Remuneration Committees. Former CEO of the A.P. Møller - Mærsk Group (1993-2007) and before that CFO of the same company from 1981. Member of the Supervisory Board and the Finance and Audit Com-mittees of The Chubb Corporation, advisor to Permira and member of Danske Bank’s Advisory Board. Managing Director of J.S. Invest ApS and one subsidiary. Mr Søderberg has broad international experience and extensive experience of financial management and financial reporting processes, performance manage-ment, and stakeholder and investor relations management as a result of many years in the senior manage-ment of A.P. Møller - Mærsk. He has wide experience of growth markets and the identification and manage-ment of business risks.
RICHARD BURROWS1
Born 1946. Elected 2009 and 2013. Election period expires 2014. Chair-man of the Remuneration Commit-tee and member of the Audit Com-mittee. Mr Burrows has spent most of his career in the drinks business. He was joint CEO of Pernod Ricard from 2000 to 2005. He is Chairman of British American Tobacco and VoiceSage Ltd. and a non-executive director of the board of Rentokil Initial plc. Mr Burrows has exten-sive experience of the branded consumer goods sector and wide international business experience gained through his career with Irish Distillers Group plc and Pernod Ricard. He has extensive experience of shareholder and investor rela-tions and a broad understanding of the assessment and mitigation of business risks. Mr Burrows has worked extensively with developing markets and product innovation, and has substantial experience of financial management and report-ing processes.
DONNA CORDNER1
Born 1956. Elected 2012 and 2013. Election period expires 2014. Mem-ber of the Audit Committee from 1 January 2013. Ms Cordner is a mem-ber of the Advisory Board of Vosges Haut Chocolat, managing partner of OKM Capital, a venture fund invest-ing in disruptive medical technology, and CEO of HelpAge USA, the US affiliate of HelpAge International, an international NGO working to address issues that affect older people worldwide. Non-executive director of Millicom International Cellular SA 2004-2013, where she was a member of the Audit Commit-tee and CSR Committee. Formerly Managing Director and Global Head of Telecommunications and Media Structured Finance at Citigroup. She has also held senior positions at So-ciété Générale and ABN Amro Bank N.V. in the USA and Europe. She has been CEO of HOFKAM Limited, the largest rural microfinance company in Uganda, and held the positions of Executive Vice President of Corpor-ate Finance and Treasury, Market Area Director and CEO for Russia at Tele2 AB. Ms Cordner has ex-tensive international management experience, including experience of growth markets. She has substantial experience of financial management and financial reporting processes, stakeholder and investor relations management, and the assessment and mitigation of business risks. She has also worked extensively with performance management and CSR and sustainable development.
1 Independent board member.Carlsberg Group Annual Report 2013 162Management review SUPERVISORY BOARD
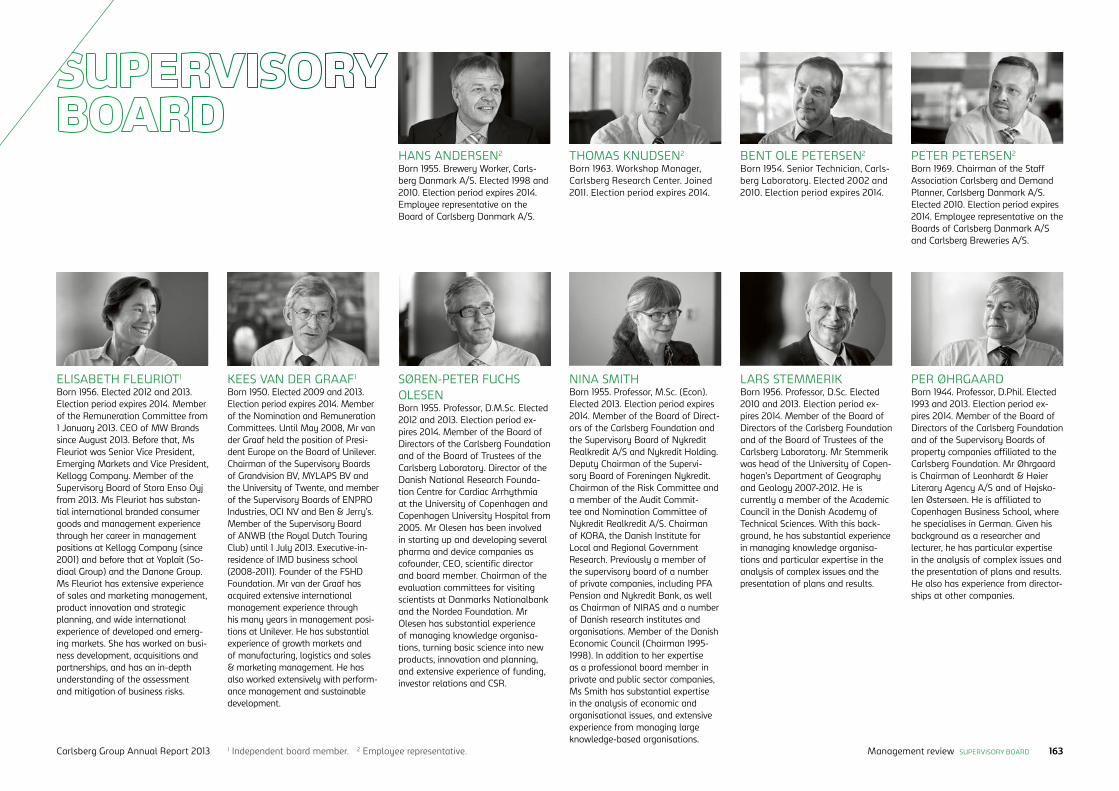
KEES VAN DER GRAAF1
Born 1950. Elected 2009 and 2013. Election period expires 2014. Member of the Nomination and Remuneration Committees. Until May 2008, Mr van der Graaf held the position of Presi-dent Europe on the Board of Unilever. Chairman of the Supervisory Boards of Grandvision BV, MYLAPS BV and the University of Twente, and member of the Supervisory Boards of ENPRO Industries, OCI NV and Ben & Jerry’s. Member of the Supervisory Board of ANWB (the Royal Dutch Touring Club) until 1 July 2013. Executive-in-residence of IMD business school (2008-2011). Founder of the FSHD Foundation. Mr van der Graaf has acquired extensive international management experience through his many years in management posi-tions at Unilever. He has substantial experience of growth markets and of manufacturing, logistics and sales & marketing management. He has also worked extensively with perform-ance management and sustainable development.
ELISABETH FLEURIOT1 Born 1956. Elected 2012 and 2013. Election period expires 2014. Member of the Remuneration Committee from 1 January 2013. CEO of MW Brands since August 2013. Before that, Ms Fleuriot was Senior Vice President, Emerging Markets and Vice President, Kellogg Company. Member of the Supervisory Board of Stora Enso Oyj from 2013. Ms Fleuriot has substan-tial international branded consumer goods and management experience through her career in management positions at Kellogg Company (since 2001) and before that at Yoplait (So-diaal Group) and the Danone Group. Ms Fleuriot has extensive experience of sales and marketing management, product innovation and strategic planning, and wide international experience of developed and emerg-ing markets. She has worked on busi-ness development, acquisitions and partnerships, and has an in-depth understanding of the assessment and mitigation of business risks.
SØREN-PETER FUCHS OLESEN Born 1955. Professor, D.M.Sc. Elected 2012 and 2013. Election period ex-pires 2014. Member of the Board of Directors of the Carlsberg Foundation and of the Board of Trustees of the Carlsberg Laboratory. Director of the Danish National Research Founda-tion Centre for Cardiac Arrhythmia at the University of Copenhagen and Copenhagen University Hospital from 2005. Mr Olesen has been involved in starting up and developing several pharma and device companies as cofounder, CEO, scientific director and board member. Chairman of the evaluation committees for visiting scientists at Danmarks Nationalbank and the Nordea Foundation. Mr Olesen has substantial experience of managing knowledge organisa-tions, turning basic science into new products, innovation and planning, and extensive experience of funding, investor relations and CSR.
LARS STEMMERIKBorn 1956. Professor, D.Sc. Elected 2010 and 2013. Election period ex-pires 2014. Member of the Board of Directors of the Carlsberg Foundation and of the Board of Trustees of the Carlsberg Laboratory. Mr Stemmerik was head of the University of Copen-hagen’s Department of Geography and Geology 2007-2012. He is currently a member of the Academic Council in the Danish Academy of Technical Sciences. With this back-ground, he has substantial experience in managing knowledge organisa-tions and particular expertise in the analysis of complex issues and the presentation of plans and results.
PER ØHRGAARDBorn 1944. Professor, D.Phil. Elected 1993 and 2013. Election period ex-pires 2014. Member of the Board of Directors of the Carlsberg Foundation and of the Supervisory Boards of property companies affiliated to the Carlsberg Foundation. Mr Øhrgaard is Chairman of Leonhardt & Høier Literary Agency A/S and of Højsko-len Østersøen. He is affiliated to Copenhagen Business School, where he specialises in German. Given his background as a researcher and lecturer, he has particular expertise in the analysis of complex issues and the presentation of plans and results. He also has experience from director-ships at other companies.
PETER PETERSEN2
Born 1969. Chairman of the Staff Association Carlsberg and Demand Planner, Carlsberg Danmark A/S. Elected 2010. Election period expires 2014. Employee representative on the Boards of Carlsberg Danmark A/S and Carlsberg Breweries A/S.
BENT OLE PETERSEN2
Born 1954. Senior Technician, Carls-berg Laboratory. Elected 2002 and 2010. Election period expires 2014.
NINA SMITHBorn 1955. Professor, M.Sc. (Econ). Elected 2013. Election period expires 2014. Member of the Board of Direct-ors of the Carlsberg Foundation and the Supervisory Board of Nykredit Realkredit A/S and Nykredit Holding. Deputy Chairman of the Supervi-sory Board of Foreningen Nykredit. Chairman of the Risk Committee and a member of the Audit Commit-tee and Nomination Committee of Nykredit Realkredit A/S. Chairman of KORA, the Danish Institute for Local and Regional Government Research. Previously a member of the supervisory board of a number of private companies, including PFA Pension and Nykredit Bank, as well as Chairman of NIRAS and a number of Danish research institutes and organisations. Member of the Danish Economic Council (Chairman 1995-1998). In addition to her expertise as a professional board member in private and public sector companies, Ms Smith has substantial expertise in the analysis of economic and organisational issues, and extensive experience from managing large knowledge-based organisations.
HANS ANDERSEN2
Born 1955. Brewery Worker, Carls-berg Danmark A/S. Elected 1998 and 2010. Election period expires 2014. Employee representative on the Board of Carlsberg Danmark A/S.
THOMAS KNUDSEN2
Born 1963. Workshop Manager, Carlsberg Research Center. Joined 2011. Election period expires 2014.
1 Independent board member. 2 Employee representative.Carlsberg Group Annual Report 2013 163Management review SUPERVISORY BOARD

Carlsberg A/S100 Ny Carlsberg Vej1799 Copenhagen VDenmark
Phone +45 3327 3300Fax +45 3327 4701www.carlsberggroup.com
CVR No. 61056416