annual report - scandinavian biogas
TRANSCRIPT
ANNUAL REPORT
2017

SCANDINAVIAN BIOGAS FUELS INTERNATIONAL AB (publ) ANNUAL REPORT 2017 2
Contents3 About Scandinavian Biogas
4 2017 in brief
6 CEO commentary
8 Strategy and business model
11 Market and key drivers
15 Operations
16 Sweden
18 Norway
19 South Korea
20 Sustainability
21 An attractive employer
22 Environment
23 2017 materiality analysis
25 Board of Directors
27 Executive management
29 Board of Directors’ report
36 Consolidated statement ofcomprehensive income
37 Consolidated balance sheet
39 Consolidated statement of changesin equity
40 Consolidated statement of cash flows
41 Parent company income statement
42 Parent company balance sheet
44 Parent company changes in equity
45 Parent company statement of cashflows
46 Accounting principles and notes tothe accounts
66 Audit report
70 Glossary
Contact Scandinavian Biogas Holländargatan 21A 111 60 Stockholm
Tel: +46 (0)8 503 872 20 Email: [email protected] www.scandinavianbiogas.com
Cover photo: Local and regional markets for compressed biogas for light vehicles have to date been the primary segment for biogas. On the cover: Two Audi A4 Avant g-trons, a gas- optimised version of Audi's petrol-powered 2.0 TFSI turbo engine with 170 horsepower and 270 Nm torque.
Every care has been taken in the translation of this annual report. In the event of discrepancies, however, the Swedish original will supersede the English translation.
SCANDINAVIAN BIOGAS FUELS INTERNATIONAL AB (publ) ANNUAL REPORT 2017 3
About Scandinavian Biogas
Scandinavian Biogas, founded in 2005, sells biogas-based re-newable energy and related services. The Group is a leading player in large-scale biogas production in the Nordic region and South Korea, with world-leading expertise in the design and operation of biogas facilities to optimise biogas and bio-fertiliser production. The Group’s focus is on facilitating the transition from fossil fuels to renewable energy. Continuous process optimisation and develop-ment is essential in this work, from the pre-treatment of waste to biogas purification and, in future, also including liquefaction as gas is produced in liquid form. The Group is a world leader in this development.
As a fundamental part of its strategic focus, Scandinavian Biogas places high priority on developing methods and services to improve biogas and bio-fertiliser production efficiency for established as well as new types of waste, including residues and other organic material. Cost and resource efficiency improvements to production are made possible thanks to research and development in new, more efficient methods. The Group also has leading expertise in the purification process for upgrading biogas to vehicle fuel quality.
Scandinavian Biogas’s business concept is to be a leader in the design, management and operation of biogas facilities in markets where the Company operates. This is achieved by constantly improving the biogas production digestion process from various types of biomass, including sludge generated primarily from wastewater treatment, food waste, and industrial processes such as food and biofuel (e.g., glycerol) manufacturing.
The Company also works in close collaboration with partners and customers to identify growth projects outside its Nordic home market. These projects primarily cover value-creation services in the design, construction and operation of new plants and improving existing plants' efficiency through process improvements.
The Company's main products are biogas used in electricity and heat production, upgraded (and soon also liquid) biogas used as vehicle fuel, and bio-fertiliser as a substitute for artificial fertiliser. Focus is on markets in the Nordic region and South Korea. In other markets the Group provides its expertise as a service in close collaboration with partners.
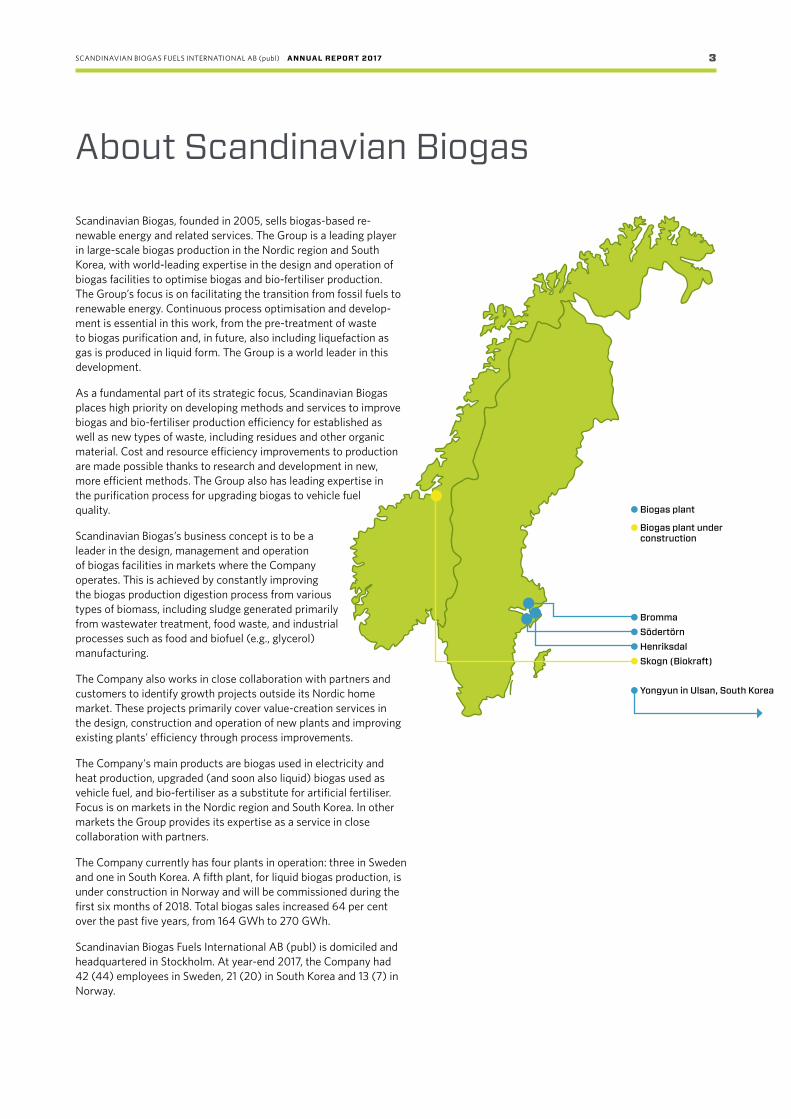
The Company currently has four plants in operation: three in Sweden and one in South Korea. A fifth plant, for liquid biogas production, is under construction in Norway and will be commissioned during the first six months of 2018. Total biogas sales increased 64 per cent over the past five years, from 164 GWh to 270 GWh.
Scandinavian Biogas Fuels International AB (publ) is domiciled and headquartered in Stockholm. At year-end 2017, the Company had 42 (44) employees in Sweden, 21 (20) in South Korea and 13 (7) in Norway.
● Bromma● Södertörn● Henriksdal● Skogn (Biokraft)
● Yongyun in Ulsan, South Korea
● Biogas plant
● Biogas plant under construction

SCANDINAVIAN BIOGAS FUELS INTERNATIONAL AB (publ) ANNUAL REPORT 2017 4
2017 in brief
New environmental permit Scandinavian Biogas's facility at Södertörn was granted a new environmental permit in January 2017. Under the new permit, the facility is entitled to process up to 260,000 tonnes of organic waste (compared with the former permit's limit of 50,000 tonnes) and to increase biogas production to 20 million normal cubic metres (Nm3) of upgraded biogas, or about 200 GWh.
Evaporator commissionedThe evaporator at Södertörn was commissioned
during Q1 2017. The evaporator treats water used in production for re-use as dilution water in the process,
which reduces both the amount of wastewater and the consumption of fresh water. The goal is for the facility
to be self-supporting. The investment was financed by a loan from the Parent Company and a grant from the
Swedish Energy Agency.
Oversubscribed preferential rights issueScandinavian Biogas conducted a preferential rights issue of approximately SEK 23.4 million in May 2017.
A directed share issue of SEK 42.9 million was also conducted in April 2017. Wipunen varainhallinta Oy subscribed for 11 million shares, representing an app-roximate 10 per cent dilution for existing shareholders. The subscription price was SEK 3.90 per share.
Bond issueAn additional SEK 30 million in bonds were issued
in June 2017 within the scope of the Company’s outstanding bond loan. The issue amount is available
to finance additional investments in the Biokraft project near Trondheim, Norway and to amortise
external loans. The subsequent bond has been listed on NASDAQ Stockholm since 18 August 2017.
Evaluation of strategic and capital structure alternatives As part of Scandinavian Biogas’s strategic plan, the Board of Directors and Group management have begun working on a prospective listing of the Company’s share in a suitable marketplace. In parallel with these efforts, various strategic and capital structure alternatives will be evaluated to create value in the Group’s business opportunities and maximise shareholder value.
JAN
MAY
JUNE
2018
SCANDINAVIAN BIOGAS FUELS INTERNATIONAL AB (publ) ANNUAL REPORT 2017 5
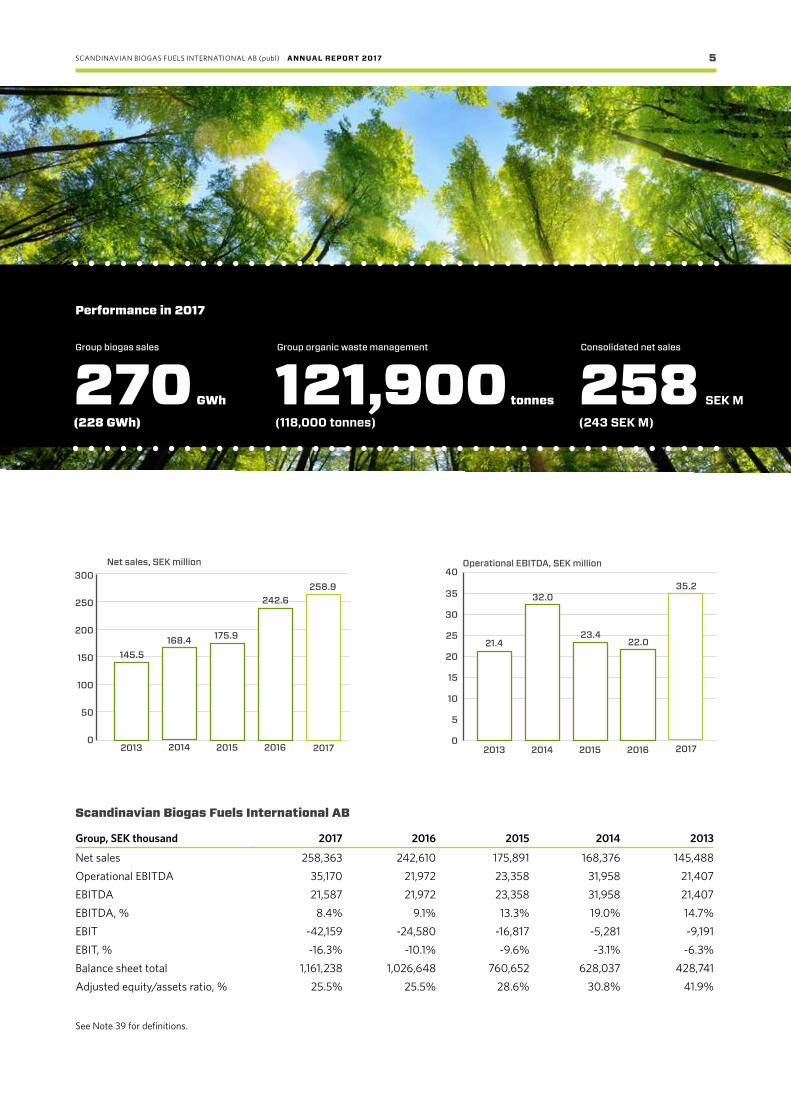
Performance in 2017
Group biogas sales Group organic waste management Consolidated net sales
270 GWh
(228 GWh)
121,900 tonnes
(118,000 tonnes)
258 SEK M
(243 SEK M)
Scandinavian Biogas Fuels International AB
Group, SEK thousand 2017 2016 2015 2014 2013
Net sales 258,363 242,610 175,891 168,376 145,488Operational EBITDA 35,170 21,972 23,358 31,958 21,407EBITDA 21,587 21,972 23,358 31,958 21,407EBITDA, % 8.4% 9.1% 13.3% 19.0% 14.7%EBIT -42,159 -24,580 -16,817 -5,281 -9,191EBIT, % -16.3% -10.1% -9.6% -3.1% -6.3%Balance sheet total 1,161,238 1,026,648 760,652 628,037 428,741Adjusted equity/assets ratio, % 25.5% 25.5% 28.6% 30.8% 41.9%
0
50
100
150
200
250
300Net sales, SEK million
2015
175.9
2016
242.6
2017
258.9
2014
168.4
2013
145.5
0
5
10
15
35
30
25
20
Operational EBITDA, SEK million
2015
23.4
2016
22.0
2017
35.2
2014
32.0
2013
21.4
See Note 39 for definitions.
40
SCANDINAVIAN BIOGAS FUELS INTERNATIONAL AB (publ) ANNUAL REPORT 2017 6
Our investments to increase operational capacity have produced results. We had a record high production level in 2017 at our plants in Sweden, despite operational disturbances at Södertörn. Our gas security of supply was also good. With our new environmental permit at Södertörn, we can increase our capacity ceiling over time to as-yet-unseen levels and are there-fore well positioned to continue our strong regional growth.
Initiatives to improve profitabilityWe have made additional investments to improve our profit-ability, including in a new evaporation plant to treat production water at Södertörn. This also improves our process from an environmental perspective. The goal is that the facility will be water self-sufficient, which will reduce costs. The plant also produces a concentrated bio-fertiliser that generates higher value.
We raised additional capital during the year through the issue of shares and bonds. The outcome is proof of the confidence investors have in the company's future. The next step in Scandinavian Biogas's strategic plan is a prospective listing of the share in a suitable marketplace. The board of directors and management team began working on this during the year and, in parallel, are evaluating various strategic and capital structure alternatives to create the greatest possible shareholder value and maximum leverage for the group's business opportunities.
As previously announced, and on a less positive note, we have been ordered to pay a penalty fee for a delayed investment in the upgrading facility in Ulsan, South Korea. A separate lawsuit is underway regarding the invoicing of certain service costs to Ulsan City. We are contesting the amount of the penalty fee, and the recorded provision has a negative impact on 2017 earnings. Underlying earnings, however, continued to develop positively. In 2017, operational profitability (EBITDA) improved significantly, by over 60%.
A broader offerPersonally, I also think it is worth noting that we are continuing to broaden our offer. In recent years we have complemented our core business – industrial biogas production and waste manage-ment – with the production of various types of bio-fertiliser. We are also packaging our proven expertise and offering it to others as a service during the planning, investment and operational phases. The aim is to lay the groundwork for a more stable revenue stream and achieve lower total risk for the business.
Bio-fertiliser is a rapidly growing market. We passed a key milestone with the SPCR 120 certification of Södertörn's
bio-fertiliser, which is now approved for use in organic farming. The closed-loop mind-set that underlies our entire operation has therefore become even clearer. We know there is great potential for bio-fertiliser and that many farmers are demanding more organic alternatives to mineral fertilisers. To take best advantage of this potential, we need to ensure that we meet their environmental requirements. Using bio-fertiliser reduces the need to use the finite resource phosphorus. It also reduces nitrogen leakage.
CEO commentary
2017 was an intensive year for Scandinavian Biogas, as well as for biogas policy. We also received a strong response from the capital markets and positive confirmation of our direction. Employees, the board of directors, the management team and everyone else have all shown great commitment. Through our shared efforts, we have built a stable, solidly profitable business in a market and political environment that have not always been supportive of biogas operations.
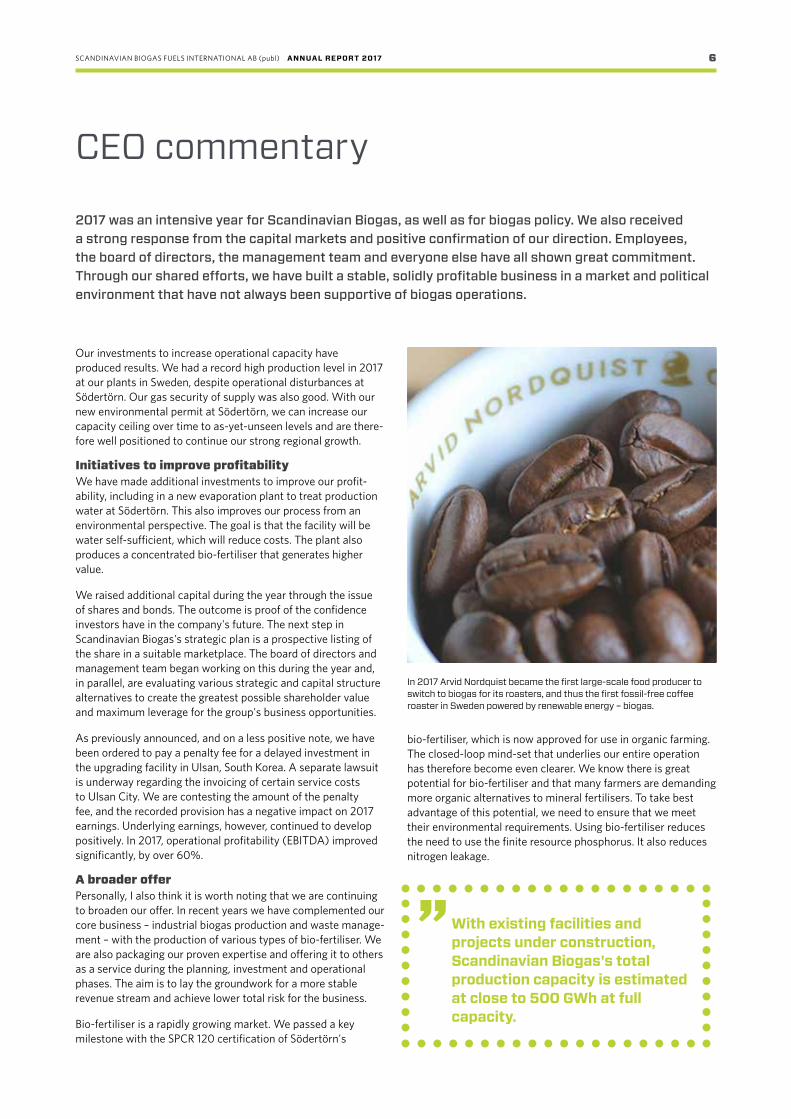
In 2017 Arvid Nordquist became the first large-scale food producer to switch to biogas for its roasters, and thus the first fossil-free coffee roaster in Sweden powered by renewable energy – biogas.
” With existing facilities and projects under construction, Scandinavian Biogas's total production capacity is estimated at close to 500 GWh at full capacity.
SCANDINAVIAN BIOGAS FUELS INTERNATIONAL AB (publ) ANNUAL REPORT 2017 7
”We are seeing growth in the biogas market throughout the Nordic region, with biogas becoming an increasingly important source of vehicle fuel. In heavy transport and other sectors, demand for liquid biogas is expected to increase significantly in coming years. The launch of several new biogas-fuelled lorry models in recent years is certainly an important milestone.
Stockholm, February 2018
Matti VikkulaPresident and CEO
A growing biogas marketOn the biogas side, bus services remain our single most important segment. There are many good reasons to use biogas as fuel. Compared with diesel-powered buses, biogas buses are significantly better for the local environment due to their low emissions of nitric oxide and particles.
Several lorry manufacturers, including Volvo and Scania, have launched new biogas-fuelled lorry models. This segment will continue to grow, while growth in the car segment has stagna-ted somewhat. Despite this, biogas consumption is presumed to have increased by a few per cent in 2017.
Increasing biogas use by several orders of magnitude will requi-re an increased supply of liquid biogas. Biogas can then become a realistic alternative for the shipping and industrial sectors. In light of this, our project in Norway is extremely important for the development of biogas. Start of production is expected during the first six months of 2018.
Policy is taking two steps forward, one step backIn 2017, two important decisions for renewable fuel were made in Sweden. First, a new tax system for cars ('incentive/penalty') will be introduced as from 1 July 2018. This will dramatically increase the tax on fossil-fuelled cars, while biogas-powered cars will receive a bonus when purchased.
The other major change is the introduction of a carbon reduc-tion obligation for all petrol and diesel suppliers, which imposes requirements for reductions in carbon emissions from petrol and diesel. Biogas is not covered by this regulatory framework, however, and retains its tax exempt status through 2020. None-theless, a growing market for biofuels is also positive for biogas, as the reduction obligation is likely to strengthen demand for other biofuels.
OutlookThere is an enormous need for renewable energy that can replace fossil fuels. We are also seeing an increased interest in biogas throughout the Nordic region. Demand for biogas is expected to increase along with supply.
For our part, we intend to ensure the growth of biogas deliveries and consumption by utilising our expertise and experience. We have set a series of long-term goals for growth, profitability and equity/assets ratio that we will be communicating externally as from 2018.
We took many important steps in 2017, including sharpening our strategy to increase profitability, and we enter 2018 ready to offer more people the opportunity to join one of Sweden's and Scandinavia's leading biogas companies on our journey.
SCANDINAVIAN BIOGAS FUELS INTERNATIONAL AB (publ) ANNUAL REPORT 2017 8
Strategy and business model
Strategy for continued long-term profitable growth Scandinavian Biogas's vision is to be world-leading in large-scale biogas and bio-fertiliser production. The Company's strategy is to use its expertise and experience to ensure an expansion of biogas supply, and in this way facilitate the transition from fossil fuels to renewable energy.
Scandinavian Biogas is a leading player in renewable biogas- based energy and related products and services. In view of the
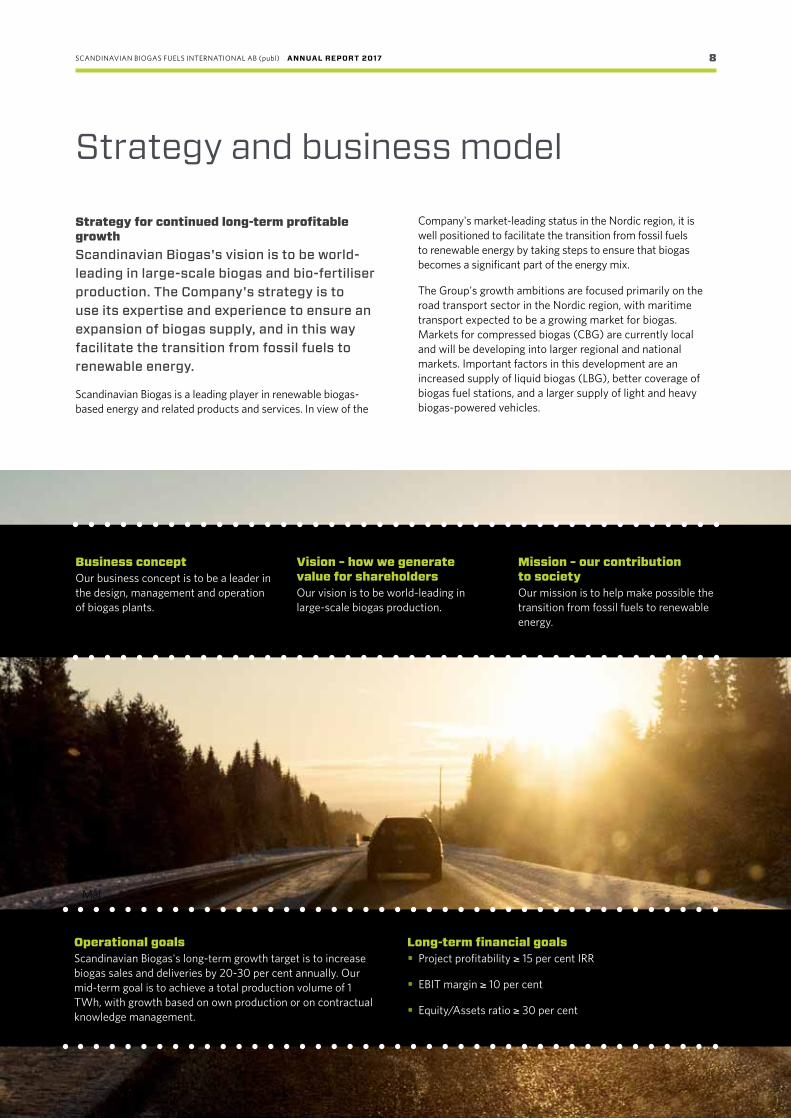
Business conceptOur business concept is to be a leader in the design, management and operation of biogas plants.
Vision – how we generatevalue for shareholdersOur vision is to be world-leading in large-scale biogas production.
Mission – our contributionto societyOur mission is to help make possible the transition from fossil fuels to renewable energy.
Mål
Operational goalsScandinavian Biogas's long-term growth target is to increase biogas sales and deliveries by 20-30 per cent annually. Our mid-term goal is to achieve a total production volume of 1 TWh, with growth based on own production or on contractual knowledge management.
Long-term financial goals• Project profitability ≥ 15 per cent IRR
• EBIT margin ≥ 10 per cent
• Equity/Assets ratio ≥ 30 per cent
Company's market-leading status in the Nordic region, it is well positioned to facilitate the transition from fossil fuels to renewable energy by taking steps to ensure that biogas becomes a significant part of the energy mix.
The Group's growth ambitions are focused primarily on the road transport sector in the Nordic region, with maritime transport expected to be a growing market for biogas. Markets for compressed biogas (CBG) are currently local and will be developing into larger regional and national markets. Important factors in this development are an increased supply of liquid biogas (LBG), better coverage of biogas fuel stations, and a larger supply of light and heavy biogas-powered vehicles.

SCANDINAVIAN BIOGAS FUELS INTERNATIONAL AB (publ) ANNUAL REPORT 2017 9
In order to realise its vision, Scandinavian Biogas is concentrating its growth strategy for the next few years on the following three main areas:
Utilise HOLD Technology™ and the Company's unique expertise At the core of Scandinavian Biogas is its self-developed HOLD Technology™, an advanced technology for large-scale optimisation of biogas production considered the world's most efficient method. After more than ten years of research and development and full-scale application, mainly at the Company's plant in Ulsan, South Korea, Scandinavian Biogas now has world-leading expertise in designing and operating biogas facilities to achieve a high, steady production of biogas, mostly from waste and residues.
By combining everything from substrate mix and temperature to chemical additives and after-treatment, Scandinavian Biogas has developed stable processes that can handle large loads. The result is an industrial production that can be operated with greater resource and energy efficiency. Based on its world-leading technology and expertise, Scandinavian Biogas is considered well positioned to capture growth in the market for resource and energy recovery as new needs and opportunities arise.
Increase own production capacityThe Company works continuously and in a variety of ways to increase own production capacity.
New investment opportunities are monitored on a regular basis, in terms of new plant construction, acquisition of third-party facilities and expansion investments in existing facilities to streamline and increase production capacity. The Company's HOLD Technology™ and core competence in optimisation of biogas production will be further developed and utilised in future.
Biogas production facilities are expected to become larger in line with the general market trend. Scandinavian Biogas's strategy is to focus on plants with an annual capacity of over 50 GWh (CBG) or over 100 GWh (LBG).
The Company's strategy has been to take a strong position within CBG in the Stockholm area. As an example, the supply of raw gas to Henriksdal and Bromma is secured through 2038 under an agreement with Stockholm Vatten och Avfall. The next step involves increasing LBG production capacity, which will provide access to national and Scandinavian gas markets. The investment in Biokraft in Norway is a step in this strategic direction.
It is also becoming increasingly important to identify and use new, under-utilised substrate sources, as amounts of food waste will be a limiting factor in future. Potentially interesting substrates may come from the pulp and paper industry and from various types of wood chips. The Company's extensive research and development efforts have evaluated more than 300 organic materials for suitability as biogas production substrate.
Develop partnershipsScandinavian Biogas will continue to secure long-term strategic partnerships across the entire value chain – from sub-strate suppliers to valuable by-product customers. Scandinavian Biogas’s market-leading expertise in designing plants, optimising digestion processes and upgrading raw gas to vehicle gas has enabled us to form trusting relationships with local and regional players. An example of this is the partnership with Stockholm Vatten och Avfall, with whom Scandina-vian Biogas now has a long-term agreement covering the conversion of local waste resources into biogas.
The Company also looks for growth projects outside its Nordic home market, in close collaboration with partners and customers. These projects focus primarily on the Company's value-creating services in the design, construction and operation of new plants and improving existing plants' efficiency through continuous process improvements.
In assessing potential new growth projects, the Company uses its well-established project development process, which covers everything from thorough evaluation of the project's potential, application for necessary permits and detailed feasibility studies to groundwork and construction of the plant in accordance with HOLD Technology™. Based on this concept, Scandinavian Biogas can offer long-term partnerships – either by designing and operating biogas plants for external partners or by increasing value through provision of qualified services.
SCANDINAVIAN BIOGAS FUELS INTERNATIONAL AB (publ) ANNUAL REPORT 2017 10
Value creation through Scandinavian Biogas's qualified biogas expertise
• Produce more gas per cubic metre of digestion tank volume
• Provide qualified expertise for a wide range of substrates
• Dramatically shorten the period between start-up and full production capacity
• Achieve greater reactor stability during the digestion process
• Ensure high-quality bio-fertiliser
• Upgrade gas with very low levels of methane leakage
• Achieve cost- and resource-efficient production
• Continuously increase production capacity through process improvements
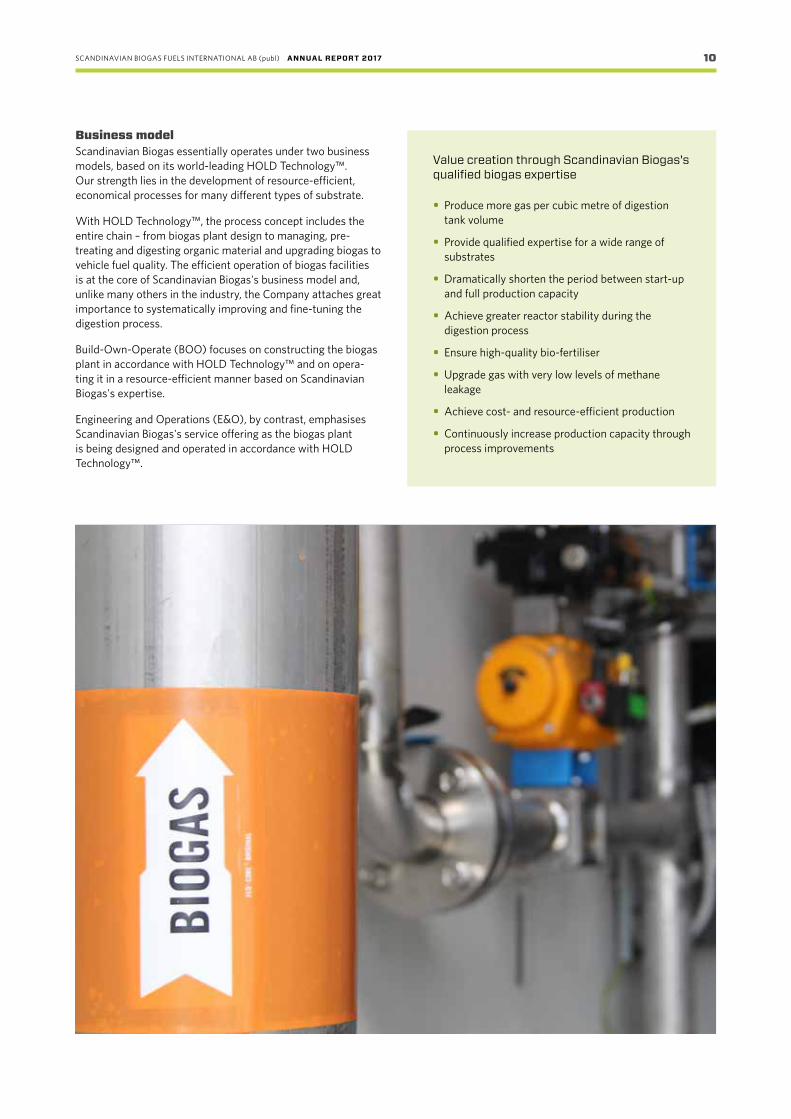
Business modelScandinavian Biogas essentially operates under two business models, based on its world-leading HOLD Technology™. Our strength lies in the development of resource-efficient, economical processes for many different types of substrate.
With HOLD Tech nology™, the process concept includes the entire chain – from biogas plant design to managing, pre- treating and digesting organic material and upgrading biogas to vehicle fuel quality. The efficient operation of biogas facilities is at the core of Scandinavian Biogas's business model and, unlike many others in the industry, the Company attaches great importance to systematically improving and fine-tuning the digestion process.
Build-Own-Operate (BOO) focuses on constructing the biogas plant in accordance with HOLD Technology™ and on opera-ting it in a resource-efficient manner based on Scandinavian Biogas's expertise.
Engineering and Operations (E&O), by contrast, emphasises Scandinavian Biogas's service offering as the biogas plant is being designed and operated in accordance with HOLD Technology™.
SCANDINAVIAN BIOGAS FUELS INTERNATIONAL AB (publ) ANNUAL REPORT 2017 11
The infrastructure for natural gas is well developed, and includes pipelines as well as land and sea transport of liquid gas to its destination. Heavy vehicles and vessels – for which it is currently difficult to find entirely renewable alternatives – are also powered by gas. Since natural gas and biogas are chemi-cally identical, biogas can be blended into existing natural gas flows. And with low particle and nitric oxide emissions, biogas benefits the local environment as well as helping to reduce global carbon emissions.
The biogas marketBiogas has a wide range of applications, with the significance of these applications varying by market. In Scandinavia, biogas is used primarily as fuel or for heating. In South Korea, most of the biogas volume is used to produce industrial heat. The electricity and heat markets have different key drivers, and in these mar-kets biogas competitiveness depends mainly on the large-scale use of natural gas, with which biogas can be easily blended to improve a plant's climate performance. Sweden and Norway have plants of this type, which serves to limit biogas potential. In these areas, biogas has the greatest growth potential in the fuel markets, industrial processes and shipping.
Biogas is distributed locally and regionally by lorry, or via the gas pipeline network. Under the 'green gas principle', which is analogous with the 'green electricity principle', biogas suppliers can inject gas into the natural gas pipeline in one place and deliver gas from another part of the network. It does not matter that biogas is blended with natural gas, as long as suppliers do not sell more biogas than they pump in. To reach a national market that has no pipeline network, biogas needs to be conver-ted to liquid form and transported by sea or by lorry.
Scandinavian Biogas works with five main market segments for biogas (see diagram on following page). The bio-fertiliser by-product market is also significant. The key to realising the long-term potential of biogas lies in scaling up production of liquid biogas far above current volumes, as biogas can then be used more easily for heavy transport, within industry and as ship fuel. The supply of feedstock is another key aspect affecting the cost of biogas.
Feedstock for biogas It is impossible to produce biogas without a supply of sub-strate, which is most often comprised of waste. As the circular economy mind-set gains more traction, society and various players are well on the way to shifting people's perception of waste as being a nuisance to being an economic resource. This means that there is growing competition for certain waste streams. In order to develop an efficient, competitive biogas production, it is therefore necessary to identify waste streams, or substrates, that do not generate a great deal of competition and are available in large volumes.
The substrates used most commonly in Sweden for biogas production in 2016 were sewage sludge (34 per cent of
Market and key driversBiogas has many advantages as an energy source. It is often produced from locally produced organic waste that has few other uses. It also contributes to the circular economy and the circular energy system.
produced biogas), manure (19 per cent), food waste (11 per cent), food industry waste (10 per cent), and the meat industry (6 per cent). Most treatment plants are already equipped with digestion tanks. The growth potential for sewage sludge as a substrate is therefore limited.
Food waste is one substrate that still has great potential, as only a small amount of household food waste is currently being collected. Approximately 38 per cent of the food waste produced through consumption in Sweden was collected in 2014, and only 27 per cent was digested into biogas.1 Meat industry residues are an increasingly significant feedstock for biogas production, and forestry residues are another substrate that is being developed and may be used in future for biogas production.
1 Matavfall i Sverige – uppkomst och behandling 2014 (Food Waste in Sweden - Origin and Treatment 2014), Swedish Environmental Protection Agency, p. 4. https://www.naturvardsverket.se/Documents/publikationer6400/978-91-620-8765-4.pdf?pid=18807
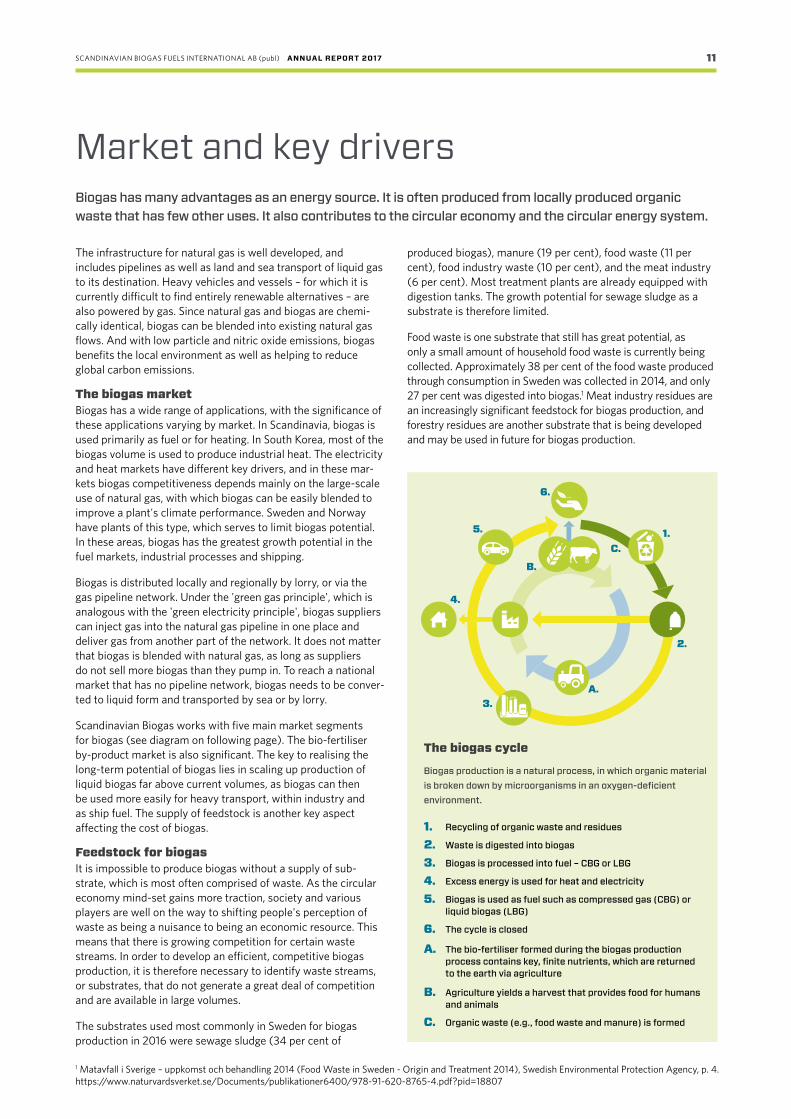
The biogas cycle
Biogas production is a natural process, in which organic material is broken down by microorganisms in an oxygen-deficient environment.
1. Recycling of organic waste and residues
2. Waste is digested into biogas
3. Biogas is processed into fuel – CBG or LBG
4. Excess energy is used for heat and electricity
5. Biogas is used as fuel such as compressed gas (CBG) or liquid biogas (LBG)
6. The cycle is closed
A. The bio-fertiliser formed during the biogas production process contains key, finite nutrients, which are returned to the earth via agriculture
B. Agriculture yields a harvest that provides food for humansand animals
C. Organic waste (e.g., food waste and manure) is formed
1.
2.
3.
4.
5.
6.
A.
B.
C.

SCANDINAVIAN BIOGAS FUELS INTERNATIONAL AB (publ) ANNUAL REPORT 2017 12
Light vehicles
• CBG• Local market• Potential:
4 TWh
• CBG• Local market• Potential :
4 TWh
• LNG/LBG• Scandinavian
market• Potential:
10 TWh
• LNG/LBG• Scandinavian
market• Potential:
20 TWh
• LNG/LBG• Scandinavian
market• Potential:
96 TWh
• Three different products
• SPCR 120-certified
• Local market
Buses Heavy transport
Industry Shipping Bio- fertiliser
Scandinavian Biogas
Main market segments for biogas Light vehiclesLocal and regional markets for CBG for light vehicles has been the main segment to date for biogas, although this market remains dependent on policy instruments and a good supply of natural gas cars and filling stations. In Sweden, filling stations are mainly concentrated in metropolitan areas, along the natural gas pipeline on Sweden's west coast (with a detour to Gnosjö in Småland), and in Bergslagen. Currently, though, it is entirely possible to drive a natural gas vehicle throughout Göta- and Svealand and along the entire Norrland coast.
Buses The public transport market for biogas is strong and will remain crucial to the sector’s development. In 2016, 20.5 per cent of Sweden’s buses ran on biogas, an increase of just over one per cent from last year – although the increase is over 10 per cent
when calculated by number of vehicle kilometres.1 A leading factor has been that municipalities, often responsible for city traffic, also oversee water and wastewater treatment. This allows for creation of a cycle that is also financially advanta-geous for the municipality. The largest single player in Sweden is Stockholm Public Transport (SL), which used approximately 13.3 mio Nm3 of biogas in 2016.
Heavy transportSeveral good models of biogas-powered heavy vehicles have been available for the past few years – IVECO, Scania, Volvo and MAN have introduced new models. The main bottlenecks are currently liquid biogas production and filling station access-ibility. Since freight transport by road is well integrated across national borders, Sweden and Norway are impacted by deve-lopments in other European countries. The increased interest in natural gas lorries in several European countries is therefore a positive sign. Hauliers operate in a low-margin industry and, in addition to environmental considerations, need to take econo-mic factors into account. Oil prices are closely linked to diesel prices, and thus to operating costs for diesel-powered lorries. Although oil prices have been extremely volatile in recent years, the long-term trend indicates continued high prices, which will benefit renewable alternatives in the long run.
IndustryMost of the industries that currently use natural gas are located along the gas grid on Sweden's west coast. A total of approx-imately 9 TWh of natural gas is used by industry, with biogas so far representing a relatively small share of this amount. Reasons for converting to natural gas from oil and other sources are associated with the superior environmental performance of gas and options for more precise process control. The food industry is particularly interested in using natural gas as a fuel for the latter reason. Estrella, for example, switched entirely to biogas in 2017 in its production of crisps and snacks,2 reducing its carbon emissions by 92 per cent. If biogas is to achieve a real impact, stronger financial incentives to increase biogas blend and an increased production of liquid biogas are needed.
ShippingThe shipping sector has increased its use of liquid natural gas (LNG) and is paving the way for increased blends of liquid
1 Swedish Public Transport Association database (FRIDA). 2 https://www.mynewsdesk.com/se/estrella/pressreleases/estrella-minskar-sin-klimatpaaverkan-med-92-procent-2279286

SCANDINAVIAN BIOGAS FUELS INTERNATIONAL AB (publ) ANNUAL REPORT 2017 13
biogas. A review in spring 2017 of newly ordered vessels with links to Sweden showed that half of all new vessels were built to run on natural gas. Several major shipping companies have already commissioned vessels fuelled with liquid gas. The key drivers for this trend have been the sector’s environmental ambitions and tough new sulphur emissions standards for the Baltic Sea. Neither natural gas nor biogas give rise to sulphur emissions. Carbon dioxide emissions can be reduced by around 30 per cent using natural gas instead of heavy oil, and by 90 per cent using biogas. This segment is therefore of great interest for the future. As an example, the Viking Grace ferry alone would require around 300 GWh of gas per year, corresponding to around 17 per cent of total current Swedish biogas production.
Market for bio-fertiliser by-product In a biogas plant, organic waste is broken down into biogas. Digestate is produced as a by-product of the digestion process. This digestate is called 'digested sludge' at treatment plants and 'bio-fertiliser' at co-digestion plants and farms. Digested sludge and bio-fertiliser can both be used for manuring. Half
1 Produktion och användning av biogas och rötrester år 2016 (Production and Consumption of Biogas and Digestates 2016), Swedish Energy Agency, p. 15.
of all digestate/bio-fertiliser is used for manuring in Sweden, corresponding to over two million tonnes (wet weight).1
Bio-fertiliser is made of nutrients recovered from waste, in solid or liquid form. Essentially all bio-fertiliser produced at biogas plants is sold to the agricultural sector. Not all substrate is suitable for biogas production – animal waste normally needs to be heat-treated before being used as fertiliser, while vegetable waste can be used freely. Bio-fertiliser is nitrogen-rich and can be used in organic farming, for which few other nitrogen fertiliser alternatives are available. Fertiliser production will be a significant revenue stream for the biogas plants.
Demand for liquid biogas in the heavy transport sector is expected to increase significantly in coming years. New biogas-powered lorry models have been launched by several lorry manufacturers, including Volvo and Scania. Pictured above: Volvo's biogas-powered FE CNG lorry.

SCANDINAVIAN BIOGAS FUELS INTERNATIONAL AB (publ) ANNUAL REPORT 2017 14
Biogas consumption in Scandinavian Biogas markets
Sweden• The Swedish biogas market is distinguished by having a large
number of small-scale operators – a total of 279 plants.1
• Biogas production increased to 2,018 GWh in 2016, a 27 per cent increase since 2012. The increase is driven mainly by greater use of upgraded biogas, which currently represents 64 per cent of total demand.2
• The co-digestion plants account for the largest production increase. The greatest total production comes from sewage sludge (34 per cent), manure (19 per cent) and food waste (11 per cent).3
• In the transport sector, biogas consumption increased 43 per cent during the 2012-16 period. The number of newly registered biogas cars increased nearly 3 per cent in 2017 as compared with 2013.4
• The Energigas Sverige trade association has a target of increasing biogas production 3,500 GWh by 2020, a 73 per cent increase over 2016.5
Norway• Norway’s biogas production is the least developed among
Nordic countries, although there is a clear strategy to increase production in coming years.
• The Norwegian Environment Agency estimates a potential increase in biogas production of 400 per cent during the 2015-25 period.
• Gas-powered buses are driving demand for biogas.
• In autum 2017 Norwegian Enova presented a new support system for investments in heavy transport and refuelling infrastructure. Several transport companies are investing in liquid biogas and have signed letters of intent for hundreds of heavy biogas-powered vehicles.
• There is great potential within shipping, where liquid biogas can be used as a natural gas supplement and a fossil fuel substitute.
South Korea• The market is comprised of a few large-scale biogas plants.
• Electricity and heat production account for most biogas consumption, with vehicle fuel accounting for only a small percentage.
• The main focus of biogas production is electricity generation, which is expected to increase 27 per cent by 2020.6
• Several biogas plants are under construction and 454 GWh in annual biogas production is expected to be added by 2017.
Biogas consumption, Norway 2016
Electricity and heatUpgraded biogas
IndustryFlaringOther
Biogas consumption, South Korea 20142
Upgraded biogasElectricity
FlaringHeat
Other
Biogas consumption, Sweden 20161
Upgraded biogas
Flaring
ElectricityHeat Industrial consumption
3%3%
64%
9%
20%
1 Produktion och användning av biogas och rötrester år 2016 (Production and Consumption of Biogas and Digestates 2016), Swedish Energy Agency, p. 14. 2 Ibid., p. 9. 3 Ibid., p. 13. 4 Fordonsstatistik januari 2006-december 2017 (Vehicle Statistics, January 2006-December 2017), Statistics Sweden (SCB). 5 http://www.energigas.se/om-oss/fokusomraaden/produktion/ 6 Ministry of Environment
40%
23%
6%
4%
27%
540 GWh
51%
26%
17%
6%
2,603 GWh
1 Swedish Energy Agency 2 IEA Bioenergy
2,018 GWh
1%

SCANDINAVIAN BIOGAS FUELS INTERNATIONAL AB (publ) ANNUAL REPORT 2017 15
Cost-efficient, large-scale biogas plants in the Nordic region and South KoreaScandinavian Biogas's operations have historically been focused on the upgrading of biogas in Sweden and a pre-treatment and anaerobic digestion plant in South Korea. Thanks to its world-leading HOLD Technology™ for large-scale optimisation of biogas production, the Company's production is more efficient than conventional methods. In Ulsan, for example, production is 3-5 times more efficient after the introduction of HOLD Technology™. The method was developed by the Company's R&D department in partnership with Linköping University.
The next step in the Company’s development is to increase production capacity for liquid biogas. The first step was taken in 2016 with the start of construction of a plant in Skogn, Norway under direction of majority-owned subsidiary Biokraft AS. This plant is scheduled for commissioning during the first six months of 2018. Liquid biogas provides access to larger markets and new market segments (see 'Markets and key drivers' section on page 11).
Long-term profitable biogas production requires an easily ac-cessible, abundant supply of feedstock (substrate). Scandinavi-an Biogas uses food waste from restaurants and households, as
Operations
well as meat industry waste and sewage sludge. The facility at Skogn will use fish ensilage from the fish farming industry and process water from the pulp and paper industry as substrate in the biogas production process. New substrates are continuously studied within the scope of the Company's research and development efforts.
The EffiSludge project is focused on developing a demonstra-tion plant in Skogn, Norway to produce biogas from the pulp and paper industry's wastewater sludge. Scandinavian Biogas was awarded a research grant from EU/LIFE for this project. The total project cost is estimated at SEK 30 million, with the EU grant equivalent to SEK 16 million.
SCANDINAVIAN BIOGAS FUELS INTERNATIONAL AB (publ) ANNUAL REPORT 2017 16
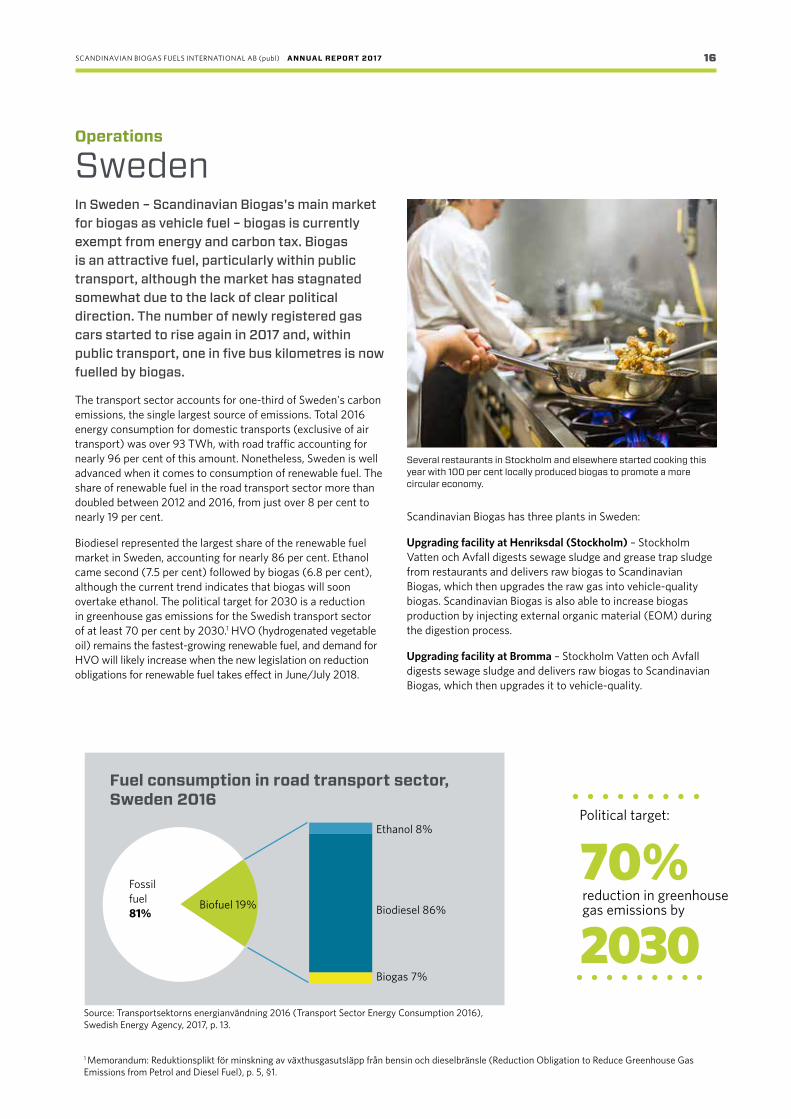
SwedenIn Sweden – Scandinavian Biogas's main market for biogas as vehicle fuel – biogas is currently exempt from energy and carbon tax. Biogas is an attractive fuel, particularly within public transport, although the market has stagnated somewhat due to the lack of clear political direction. The number of newly registered gas cars started to rise again in 2017 and, within public transport, one in five bus kilometres is now fuelled by biogas.
The transport sector accounts for one-third of Sweden's carbon emissions, the single largest source of emissions. Total 2016 energy consumption for domestic transports (exclusive of air transport) was over 93 TWh, with road traffic accounting for nearly 96 per cent of this amount. Nonetheless, Sweden is well advanced when it comes to consumption of renewable fuel. The share of renewable fuel in the road transport sector more than doubled between 2012 and 2016, from just over 8 per cent to nearly 19 per cent.
Biodiesel represented the largest share of the renewable fuel market in Sweden, accounting for nearly 86 per cent. Ethanol came second (7.5 per cent) followed by biogas (6.8 per cent), although the current trend indicates that biogas will soon overtake ethanol. The political target for 2030 is a reduction in greenhouse gas emissions for the Swedish transport sector of at least 70 per cent by 2030.1 HVO (hydrogenated vegetable oil) remains the fastest-growing renewable fuel, and demand for HVO will likely increase when the new legislation on reduction obligations for renewable fuel takes effect in June/July 2018.
Scandinavian Biogas has three plants in Sweden:
Upgrading facility at Henriksdal (Stockholm) – Stockholm Vatten och Avfall digests sewage sludge and grease trap sludge from restaurants and delivers raw biogas to Scandinavian Biogas, which then upgrades the raw gas into vehicle-quality biogas. Scandinavian Biogas is also able to increase biogas production by injecting external organic material (EOM) during the digestion process.
Upgrading facility at Bromma – Stockholm Vatten och Avfall digests sewage sludge and delivers raw biogas to Scandinavian Biogas, which then upgrades it to vehicle-quality.
Operations
1 Memorandum: Reduktionsplikt för minskning av växthusgasutsläpp från bensin och dieselbränsle (Reduction Obligation to Reduce Greenhouse Gas Emissions from Petrol and Diesel Fuel), p. 5, §1.
Source: Transportsektorns energianvändning 2016 (Transport Sector Energy Consumption 2016), Swedish Energy Agency, 2017, p. 13.
Political target:
Fossil fuel 81%
Biofuel 19% Biodiesel 86%
Biogas 7%
Ethanol 8%
Fuel consumption in road transport sector, Sweden 2016
70%2030reduction in greenhouse gas emissions by
Several restaurants in Stockholm and elsewhere started cooking this year with 100 per cent locally produced biogas to promote a more circular economy.

SCANDINAVIAN BIOGAS FUELS INTERNATIONAL AB (publ) ANNUAL REPORT 2017 17
SLUDGE BIOGAS
BUSES
SANITATION
CARS
203 GWh
Production 2017
300 GWh
At full capacity
Biogas production plant at Södertörn – approximately 60,000 tonnes of food waste is pre-treated and used in the production of biogas each year.
The plants’ locations are based on Scandinavian Biogas’s strategy to establish a strong foothold in the regional market focused on biogas as vehicle fuel. Strong relationships with long-term partners have allowed the Company to deploy and further develop the facilities. Measured in terms of revenues, Henriksdal is the Company’s single largest facility.
Demand increasing as Stockholm grows Stockholm's population passed the 900,000 mark in February 2017, and is expected to exceed 1 million by 2020. To meet the needs of a growing population, the City of Stockholm has deci-ded to modernise and expand wastewater treatment capacity and to increase biogas production. Construction of a tunnel to transport wastewater from Stockholm's northwest areas to the Henriksdal wastewater treatment plant commenced in late 2017. The treatment plant at Bromma can therefore be phased out and capacity at Henriksdal expanded to manage the larger volumes, with improved purification technology and greater biogas production.
Close collaboration with Stockholm Vatten och Avfall at Henriksdal and BrommaToday, all biogas production at Henriksdal and Bromma is conducted in close collaboration with Stockholm Vatten och
Avfall, which is responsible for slurry and raw gas production, while Scandinavian Biogas operates the upgrading facilities. The upgrading plant atop Henriksdalsberget in Stockholm is the largest biogas facility in the Nordic region.
A project is underway at the Henriksdal plant to increase raw gas production by gradually increasing organic loads for existing digesters. Due to the aggregate production capacity of 200 gigawatt hours, biogas production at Henriksdal is able to deliver the equivalent of 10 per cent of all biogas delivered in Sweden in 2016.
Food waste from 900,000 StockholmersThe pre-treatment plant at Södertörn is operated in collabora-tion with SRV Återvinning AB, a recycling company owned by the municipalities of Huddinge, Haninge, Botkyrka, Salem and Nynäshamn.
The biogas plant is Stockholm County’s first industrial facility for the digestion of food waste. The plant's current capacity is 60,000 tonnes of food waste, equivalent to the amount produced by one-third of Stockholm County's two million plus residents every year. Biogas is produced by converting food waste into renewable biogas and high-quality bio-fertiliser. Due to the plant’s efficiency, 70-80 per cent of food waste energy is converted to biogas.
Scandinavian Biogas was granted a new environmental permit in 2017, a prerequisite for increasing capacity at the plant. The plant is now licensed to process up to 260,000 tonnes of organic waste and produce up to 200 GWh of biogas annually. The plant’s current capacity is 80 GWh, corresponding to 8.8 million litres of petrol and enough to meet the annual fuel needs of 5,000 private motorists. The plant will also produce 14,000 tonnes of dewatered bio-fertiliser that returns important nutri-ents such as nitrogen, phosphorus and potassium to the earth. The Company's bio-fertiliser received SPCR 120 certification during the year, which makes it suitable for organic farming.
Plants in Sweden
FOOD WASTE
BIO- FERTILISER
AGRICULTURE
SCANDINAVIAN BIOGAS FUELS INTERNATIONAL AB (publ) ANNUAL REPORT 2017 18
Norway
Based on the need to convert the Norwegian economy – which requires more industrial activity within the bioeconomy framework – the Norwegian parliament and government have improved conditions for biogas production. The goal is to produce 1 TWh of biogas in Norway by 2020. The Norwegian public sector is also at the forefront and leading the way in terms of using biogas as vehicle fuel. Public transport in Oslo (Ruter) and Trondheim (AtB) are two good examples of this. Of Ruter's 1,100 buses, 151 are fuelled by biogas.
A report published in autumn 2017 on behalf of Norwegian Enova focused on options for increasing biogas use for tranport in Norway. The report concluded that, with the right policy instruments and environmental policies, annual biogas demand can reach 8.5 TWh by 2030.
A new support system for investments in heavy transport and development of refuelling infrastructure was introduced in Norway during the autumn.
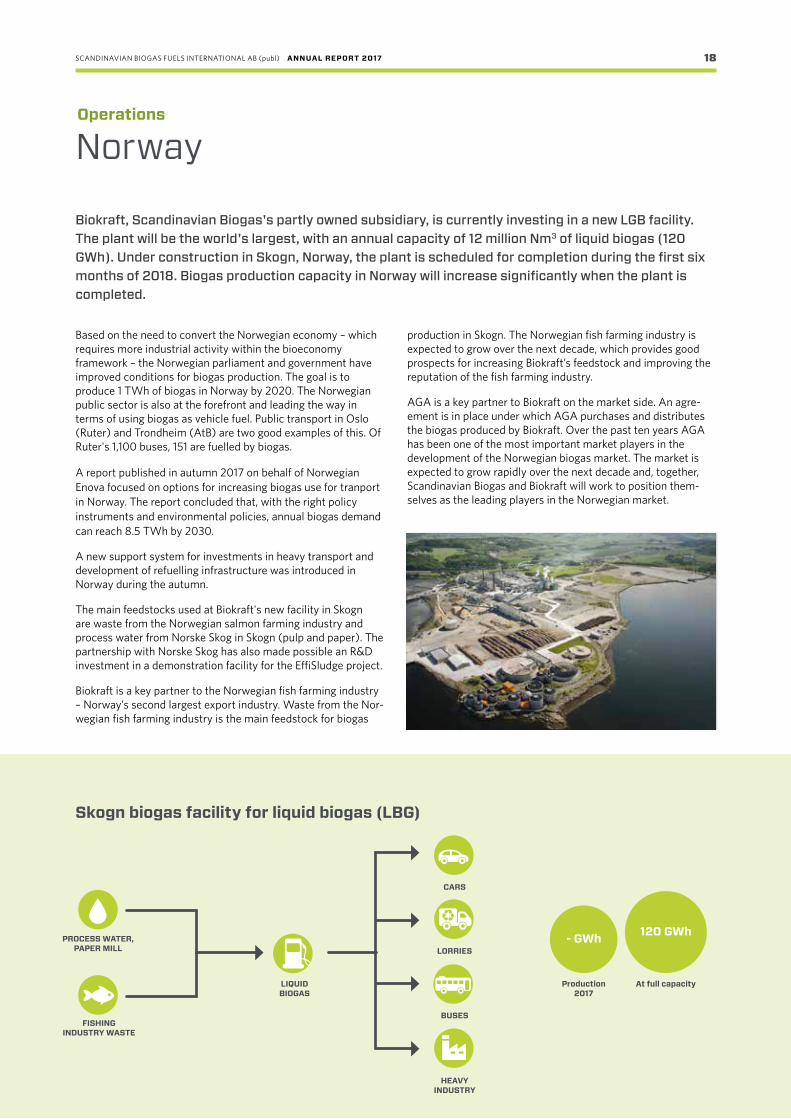
The main feedstocks used at Biokraft's new facility in Skogn are waste from the Norwegian salmon farming industry and process water from Norske Skog in Skogn (pulp and paper). The partnership with Norske Skog has also made possible an R&D investment in a demonstration facility for the EffiSludge project.
Biokraft is a key partner to the Norwegian fish farming industry – Norway’s second largest export industry. Waste from the Nor-wegian fish farming industry is the main feedstock for biogas
production in Skogn. The Norwegian fish farming industry is expected to grow over the next decade, which provides good prospects for increasing Biokraft’s feedstock and improving the reputation of the fish farming industry.
AGA is a key partner to Biokraft on the market side. An agre-ement is in place under which AGA purchases and distributes the biogas produced by Biokraft. Over the past ten years AGA has been one of the most important market players in the development of the Norwegian biogas market. The market is expected to grow rapidly over the next decade and, together, Scandinavian Biogas and Biokraft will work to position them- selves as the leading players in the Norwegian market.
LIQUID BIOGAS
PROCESS WATER, PAPER MILL
FISHING INDUS TRY WASTE
LORRIES
BUSES
HEAVY INDUSTRY
CARS
Biokraft, Scandinavian Biogas's partly owned subsidiary, is currently investing in a new LGB facility. The plant will be the world's largest, with an annual capacity of 12 million Nm3 of liquid biogas (120 GWh). Under construction in Skogn, Norway, the plant is scheduled for completion during the first six months of 2018. Biogas production capacity in Norway will increase significantly when the plant is completed.
Operations
- GWh
Production 2017
120 GWh
At full capacity
Skogn biogas facility for liquid biogas (LBG)
SCANDINAVIAN BIOGAS FUELS INTERNATIONAL AB (publ) ANNUAL REPORT 2017 19
South KoreaOperations
At the Yongyun plant in Ulsan, South Korea, Scandinavian Biogas manages the food waste produced by the one million inhabitants of the industrial city of Ulsan. Biogas is produced through pre-treatment of collected food waste followed by co-digestion with primary sludge from Yongyun’s wastewater treatment plant.
prices in South Korea are low, Group management has decided to wait until such an investment can be made more profitably. There is also a dispute between Scandinavian Biogas and Ulsan City regarding the upgrading investment and the penalty associated with the investment and biogas sales.
Environment on the political agendaThe new South Korean government, which took office in May 2017, has presented a more aggressive climate policy agenda. Among other measures, it intends to close down ten coal-fired power plants and stop all expansion of coal power in the country. Government authorities have announced an increase of renewable electricity to 20 per cent by 2030, which will allow South Korea to meet the climate targets it undertook in the Paris Agreement.
Due to its rapidly growing economy and other factors, South Korea's greenhouse gas emissions more than doubled between 1990 and 2012 – placing it among the OECD countries with the fastest-growing emissions. Forty-three per cent of the country's electricity production is based on coal, and only a small percen-tage on renewable energy sources. There is space for biogas in this scenario, particularly as the intention is to phase out coal power and replace it with natural gas.
The transport sector has set an emissions target in line with Europe's target (97 g CO2 /km by 2020, as compared with 95 g CO2 /km by 2021 in the EU). Biogas can increase its market share in this area as well.
0
50
100
150
250
200
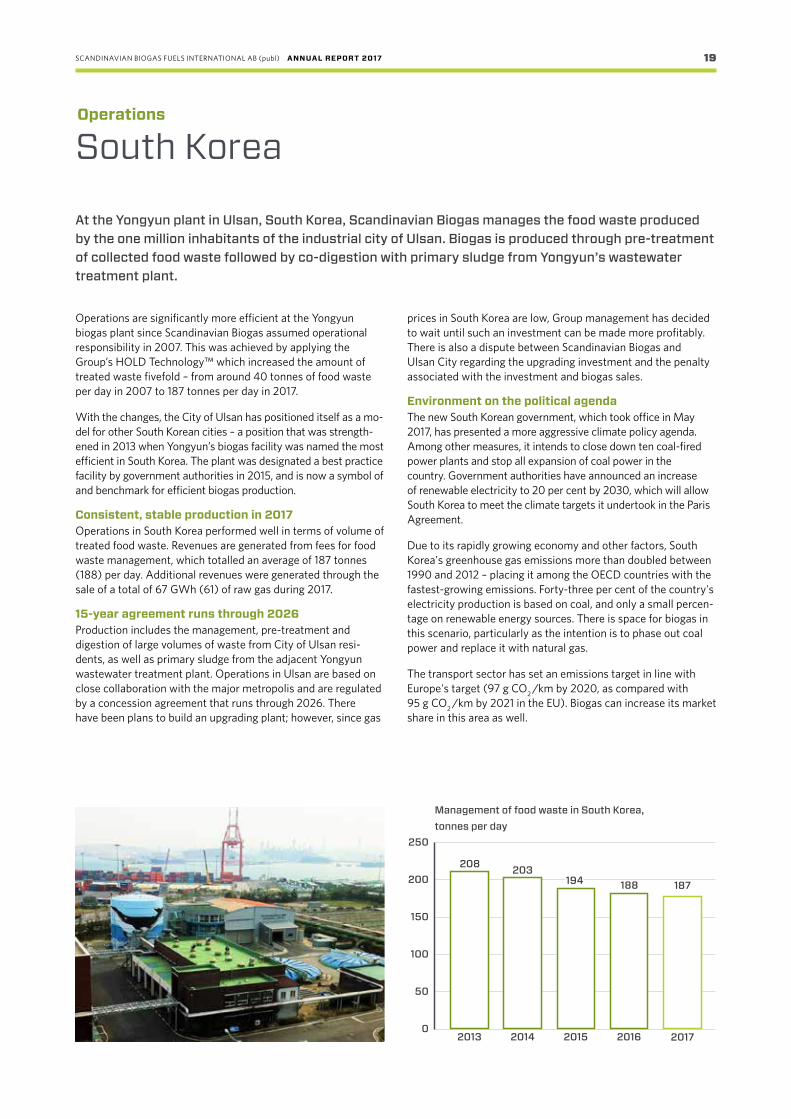
Management of food waste in South Korea, tonnes per day
2015
194
2016
188
2017
187
2014
203
2013
208
Operations are significantly more efficient at the Yongyun biogas plant since Scandinavian Biogas assumed operational responsibility in 2007. This was achieved by applying the Group’s HOLD Technology™ which increased the amount of treated waste fivefold – from around 40 tonnes of food waste per day in 2007 to 187 tonnes per day in 2017.
With the changes, the City of Ulsan has positioned itself as a mo-del for other South Korean cities – a position that was strength-ened in 2013 when Yongyun’s biogas facility was named the most efficient in South Korea. The plant was designated a best practice facility by government authorities in 2015, and is now a symbol of and benchmark for efficient biogas production.
Consistent, stable production in 2017Operations in South Korea performed well in terms of volume of treated food waste. Revenues are generated from fees for food waste management, which totalled an average of 187 tonnes (188) per day. Additional revenues were generated through the sale of a total of 67 GWh (61) of raw gas during 2017.
15-year agreement runs through 2026Production includes the management, pre-treatment and digestion of large volumes of waste from City of Ulsan resi-dents, as well as primary sludge from the adjacent Yongyun wastewater treatment plant. Operations in Ulsan are based on close collaboration with the major metropolis and are regulated by a concession agreement that runs through 2026. There have been plans to build an upgrading plant; however, since gas
SCANDINAVIAN BIOGAS FUELS INTERNATIONAL AB (publ) ANNUAL REPORT 2017 20
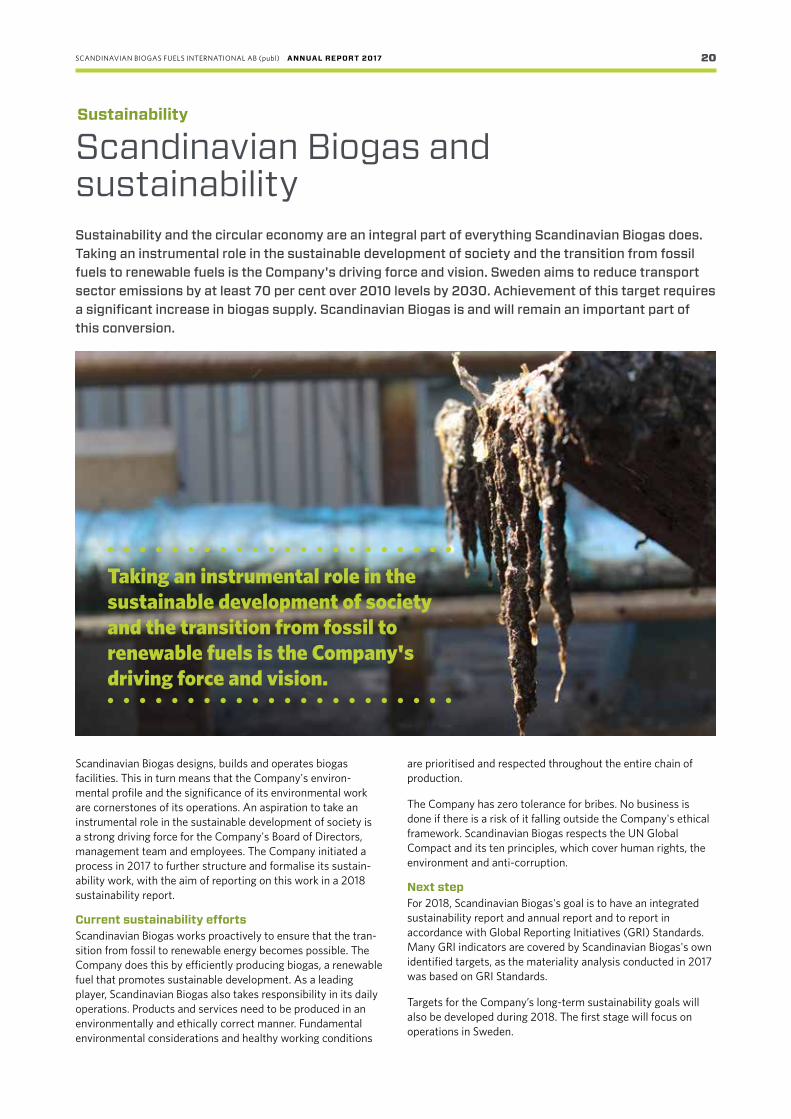
Scandinavian Biogas and sustainability Sustainability and the circular economy are an integral part of everything Scandinavian Biogas does. Taking an instrumental role in the sustainable development of society and the transition from fossil fuels to renewable fuels is the Company's driving force and vision. Sweden aims to reduce transport sector emissions by at least 70 per cent over 2010 levels by 2030. Achievement of this target requires a significant increase in biogas supply. Scandinavian Biogas is and will remain an important part of this conversion.
Scandinavian Biogas designs, builds and operates biogas facilities. This in turn means that the Company's environ-mental profile and the significance of its environmental work are cornerstones of its operations. An aspiration to take an instrumental role in the sustainable development of society is a strong driving force for the Company's Board of Directors, management team and employees. The Company initiated a process in 2017 to further structure and formalise its sustain-ability work, with the aim of reporting on this work in a 2018 sustainability report.
Current sustainability efforts Scandinavian Biogas works proactively to ensure that the tran-sition from fossil to renewable energy becomes possible. The Company does this by efficiently producing biogas, a renewable fuel that promotes sustainable development. As a leading player, Scandinavian Biogas also takes responsibility in its daily operations. Products and services need to be produced in an environmentally and ethically correct manner. Fundamental environmental considerations and healthy working conditions
are prioritised and respected throughout the entire chain of production.
The Company has zero tolerance for bribes. No business is done if there is a risk of it falling outside the Company's ethical framework. Scandinavian Biogas respects the UN Global Compact and its ten principles, which cover human rights, the environment and anti-corruption.
Next stepFor 2018, Scandinavian Biogas's goal is to have an integrated sustainability report and annual report and to report in accordance with Global Reporting Initiatives (GRI) Standards. Many GRI indicators are covered by Scandinavian Biogas's own identified targets, as the materiality analysis conducted in 2017 was based on GRI Standards.
Targets for the Company’s long-term sustainability goals will also be developed during 2018. The first stage will focus on operations in Sweden.
Sustainability
Taking an instrumental role in the sustainable development of society and the transition from fossil to renewable fuels is the Company's driving force and vision.

SCANDINAVIAN BIOGAS FUELS INTERNATIONAL AB (publ) ANNUAL REPORT 2017 21
Skilled and committed employees are essential for Scandinavian Biogas's continued development. The Company needs to be an attractive employer, and aspires to be the employer of choice in the industry. This should be reflected in the entire employee experience – from recruitment and employment until the employees leaves the Company.
Sustainability
An attractive employer
With a qualitative introduction programme for new employees, Scandinavian Biogas aims to create involvement, security and broad internal expertise. This is based on information, knowledge and participation in the Company's current and future operations. A training register has been developed to ensure all employees have the knowledge and skills they need – in particular with respect to safety rules and requirements at the production facilities.
Working conditions are evaluated and renegotiated annually, and the Company has policies in place in areas including pre-ventive healthcare, working hours, holidays and parental leave.
Health and safety Providing a safe and secure work environment is one of Scandinavian Biogas's most important issues. Employees need to feel that they have a safe workplace and are encouraged to take individual responsibility for this within the organisation. The Company works continuously with work environment evaluations and improvements to ensure a safe and secure workplace over the long term. Scandinavian Biogas has in place a work environment policy and a policy covering offensive and discriminatory treatment.
The Södertörn facility was inspected by the Swedish Work Environment Authority in 2016 and an action plan was developed. Implementation of preventive measures continued in 2017 and included regular safety inspections, secure storage of components and chemical products, first aid training, and establishment of a control programme for pressurised devices.
Co-operation with local trade unions continued during the year. The Company has also set up a safety committee for construc-tive and open dialogue on health and safety issues.
Work will continue in 2018 to establish and maintain a safe and secure work environment at all facilities. This will be done in close collaboration with employees and external partners.
Number of employees at 31 December 2017
Sweden 55%South Korea 28%Norway 17%
Gender distribution
Total
Executive management
Board of Directors
76
Women Men
SCANDINAVIAN BIOGAS FUELS INTERNATIONAL AB (publ) ANNUAL REPORT 2017 22
EnvironmentSustainability
Emissions and materials management Scandinavian Biogas's production facilities in Sweden are operated by three Swedish subsidiaries which are subject to authorisation and notification requirements. Accordingly, the companies are required to have environmental permits as well as permits to use explosives and inflammable products and substances in their operations. The control programmes in Scandinavian Biogas's operating system include systematic fire and environmental protection, which involves regular controls and ongoing incident management, aimed at minimising the risk of external environmental impact.
The plants' emissions are the most significant issue from an environmental perspective, and the entire operation works continuously to reduce these emissions.
Environmental work during the year was focused on developing procedures for systematic methane leakage detection, work with chemicals, waste management, minimising risk of spills to soil and water, and establishing environmental safety inspec-tions at the Södertörn plant. Procedures and knowledge are regularly shared between the Södertörn, Bromma and Henriks-
dal plants.
Södertörn's bio-fertiliser has been certified under the Swedish Waste Management and Recycling Association's SPCR 120 regulations. This certifi-cation involves thorough quality controls of input
feedstocks through to final product, with demanding standards for traceability, infectious disease control, metal content, visible contaminants, etc.
The climate issue and the traceability of waste and residues
received by the plants are central issues for Scandinavian Biogas. The operating companies have sustainability determi-nations from the Swedish Energy Agency, signifying that they meet the sustainability criteria required for exemption from the carbon tax. To meet these criteria, feedstocks received for biogas production must not have caused damage to areas with high biological value, and the biogas produced must emit at least 50 per cent less greenhouse gases than fossil fuel. The operating companies ensure this by conducting regular sub-strate evaluations and life cycle analyses that take into account the plants' transport emissions, energy consumption, water and chemical products, and methane emissions.
Water and energy consumption Scandinavian Biogas works continuously to reduce resource use in biogas production. As an example, the Company has improved the sewage sludge digestion process, resulting in a fourfold increase in gas production. Another focus has been on developing stable processes that are able to handle high volumes of organic material, which makes production more efficient.
An evaporator was installed at Södertörn during first quarter 2017. The function of the evaporator is to treat water that is used in production, allowing it to be re-used as dilution water. This will reduce the amount of wastewater and significantly reduce the consumption of fresh water – the goal is that the facility will be self-supporting, which will reduce costs. The evaporation plant will also produce a concentrated bio-fertiliser that will generate higher value and lower logistics costs.
The plants at Södertörn, Henriksdal and Bromma have a policy of always buying green electricity origin-labelled as a Bra Miljöval (Good Environmental Choice).
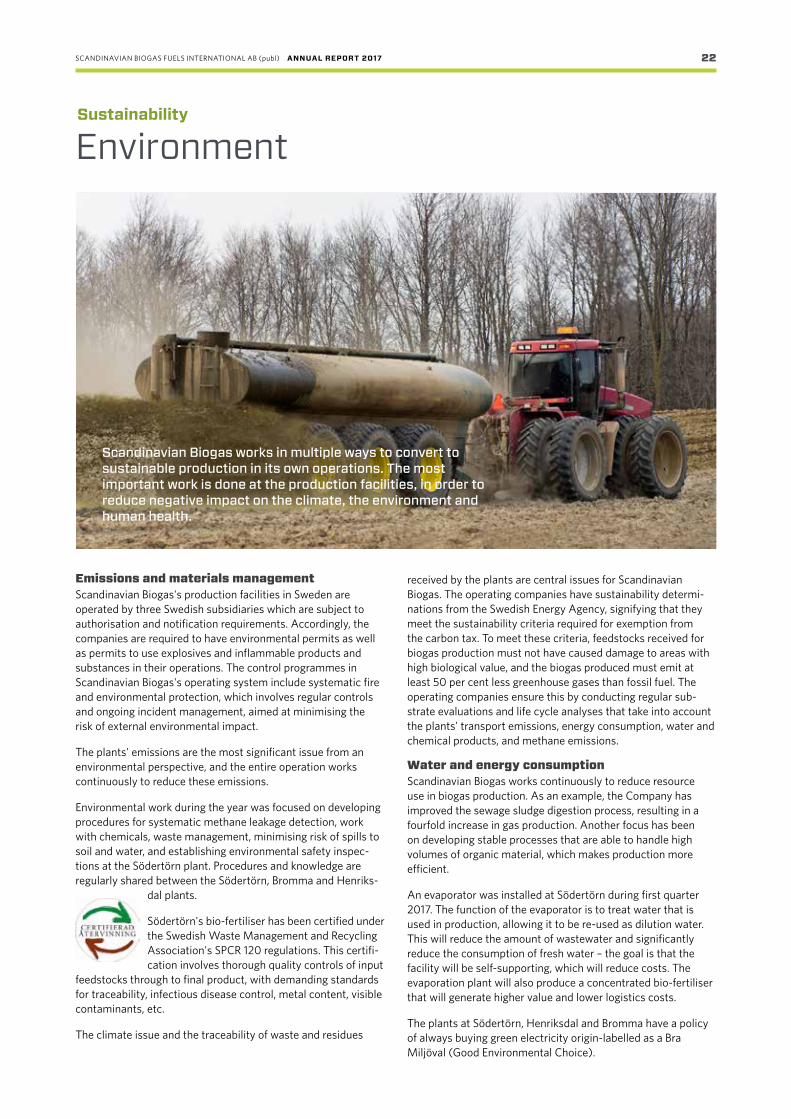
Scandinavian Biogas works in multiple ways to convert to sustainable production in its own operations. The most important work is done at the production facilities, in order to reduce negative impact on the climate, the environment and human health.
SCANDINAVIAN BIOGAS FUELS INTERNATIONAL AB (publ) ANNUAL REPORT 2017 23
2017 materiality analysisScandinavian Biogas launched efforts in 2017 to lay the founda-tion for its future sustainability work and a comprehensive 2018 sustainability report. A materiality analysis, which included an internal workshop for executive management and experts and a survey of employees in Sweden, was conducted in order to identify the Company's key sustainability issues from an impact perspective. The questions were based on the Global Reporting Initiative (GRI) Standards for sustainability reporting and the sector disclosure for the oil and gas industry.
The employee survey also focused on current perceptions of the Company's sustainability work. Results indicated widespread
internal pride in Scandinavian Biogas's operations and direction, and a clear understanding that the Company plays an important role in society. Employees also saw a need for more structural efforts around the Company's internal sustainability work. Health and safety, compliance, and business ethics were the most important sustainability issues for employees.
Scandinavian Biogas also identified its key stakeholders through the materiality analysis. Stakeholders with the most impact on the Company's operations are customers, owners and financiers, employees, the media, government authorities, and suppliers and partners.
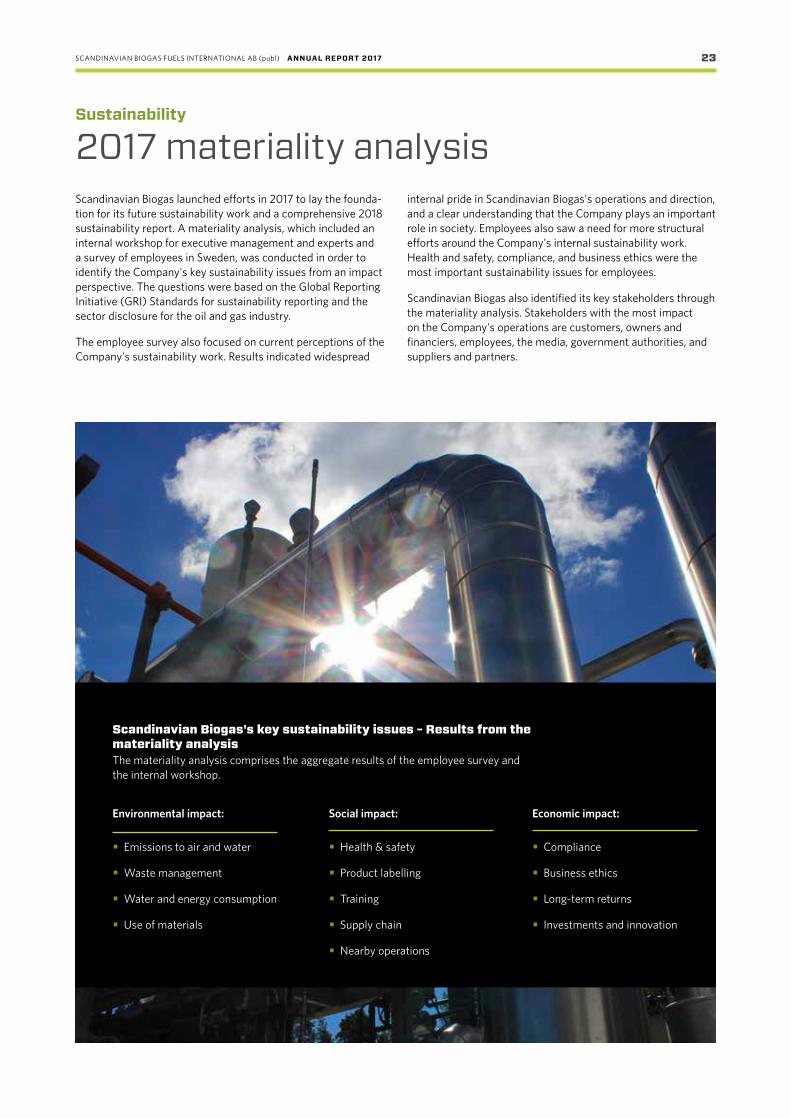
Scandinavian Biogas's key sustainability issues – Results from the materiality analysis The materiality analysis comprises the aggregate results of the employee survey and the internal workshop.
Environmental impact:
• Emissions to air and water
• Waste management
• Water and energy consumption
• Use of materials
Social impact:
• Health & safety
• Product labelling
• Training
• Supply chain
• Nearby operations
Economic impact:
• Compliance
• Business ethics
• Long-term returns
• Investments and innovation
Sustainability
SCANDINAVIAN BIOGAS FUELS INTERNATIONAL AB (publ) ANNUAL REPORT 2017 24
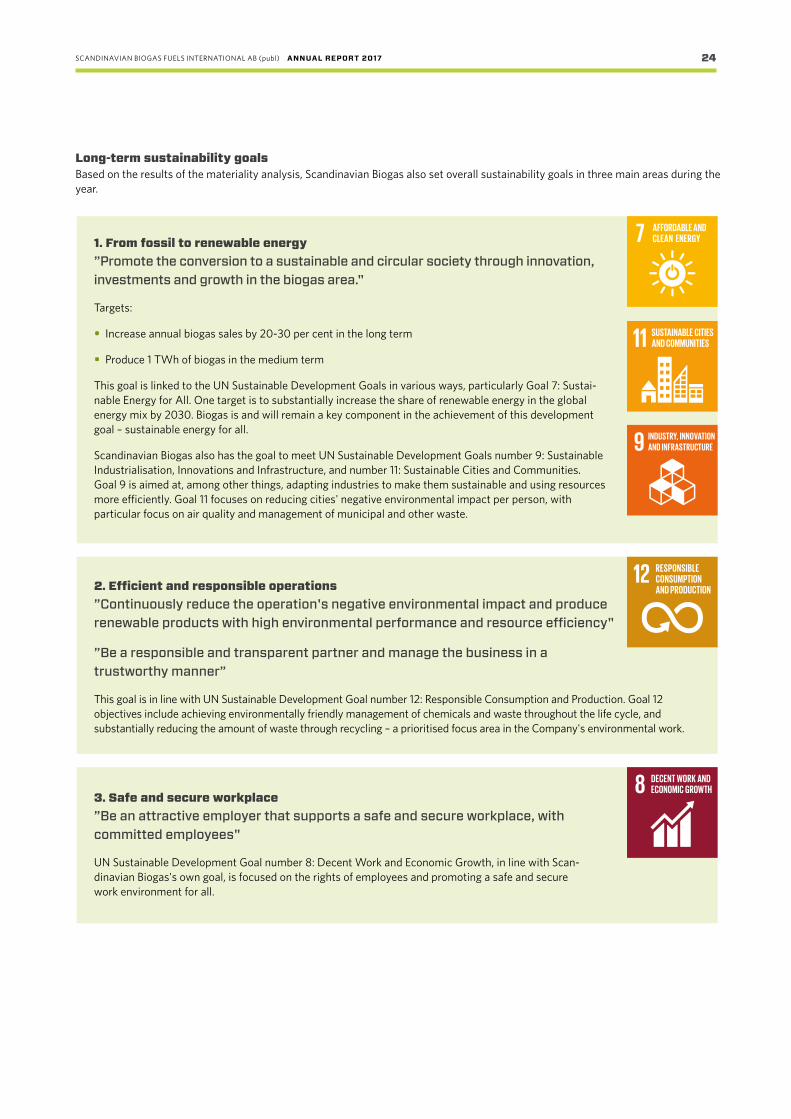
Long-term sustainability goalsBased on the results of the materiality analysis, Scandinavian Biogas also set overall sustainability goals in three main areas during the year.
1. From fossil to renewable energy ”Promote the conversion to a sustainable and circular society through innovation, investments and growth in the biogas area."
Targets:
• Increase annual biogas sales by 20-30 per cent in the long term
• Produce 1 TWh of biogas in the medium term
This goal is linked to the UN Sustainable Development Goals in various ways, particularly Goal 7: Sustai-nable Energy for All. One target is to substantially increase the share of renewable energy in the global energy mix by 2030. Biogas is and will remain a key component in the achievement of this development goal – sustainable energy for all.
Scandinavian Biogas also has the goal to meet UN Sustainable Development Goals number 9: Sustainable Industrialisation, Innovations and Infrastructure, and number 11: Sustainable Cities and Communities. Goal 9 is aimed at, among other things, adapting industries to make them sustainable and using resources more efficiently. Goal 11 focuses on reducing cities' negative environmental impact per person, with particular focus on air quality and management of municipal and other waste.
2. Efficient and responsible operations ”Continuously reduce the operation's negative environmental impact and produce renewable products with high environmental performance and resource efficiency"
”Be a responsible and transparent partner and manage the business in a trustworthy manner”
This goal is in line with UN Sustainable Development Goal number 12: Responsible Consumption and Production. Goal 12 objectives include achieving environmentally friendly management of chemicals and waste throughout the life cycle, and substantially reducing the amount of waste through recycling – a prioritised focus area in the Company's environmental work.
3. Safe and secure workplace ”Be an attractive employer that supports a safe and secure workplace, with committed employees"
UN Sustainable Development Goal number 8: Decent Work and Economic Growth, in line with Scan-dinavian Biogas's own goal, is focused on the rights of employees and promoting a safe and secure work environment for all.

SCANDINAVIAN BIOGAS FUELS INTERNATIONAL AB (publ) ANNUAL REPORT 2017 25
Board of Directors
Göran PerssonChairman of the boardBorn 1949
Chairman of Scandinavian Biogas since November 2009. Prime minister of Sweden 1996-2006, finance minister 1994-96. Persson’s extensive experience covers public affairs, financial markets, mergers & acquisitions, international politics and the EU. Chairman of LKAB, Pegroco Invest AB, Cambio Healthcare Systems AB and Foresto AB.
Andreas AhlströmBorn 1976. Elected as board member 2011.
M.Sc. from the Hanken School of Economics in Helsinki. Ahlström has worked for Ahlström Capital since 2010, with overall responsibility for the company’s new cleantech investments. He sits on the boards of three of the company’s fund portfolio companies.
Sara AndersonBorn 1976. Elected as board member 2015.
M.Sc. in Chemical Engineering from the Royal Institute of Technology in Stockholm. Fifteen years’ experience in working with implementation of and increased use of biogas as a vehicle fuel. Anderson has worked as fuel and transportation consultant and expert at 2050 Consulting since 2014. Prior to that, she was responsible for fuel and energy strategy at Stockholm Public Transport (SL).
Anders BengtssonBorn 1963. Elected as board member 2009.
MBA from the Monterey Institute of International Studies, USA. Twenty years’ experience as CEO of small and mid-sized companies and several years’ experience as management consultant (including at Semcon AB). Board member and partner at Bengtssons Tidnings AB, board member of Diös Fastighe-ter AB and Nordic Iron AB. Bengtsson invests in renewable energy and other companies and sits on the boards of several companies.

SCANDINAVIAN BIOGAS FUELS INTERNATIONAL AB (publ) ANNUAL REPORT 2017 26
Board of Directors, continued
Hans HanssonBorn 1947. Elected as board member 2013.
Hansson has served as CEO of seven Scania Group companies, including the group’s bus operations and bus factory in Denmark, and established a truck factory in Russia. Currently runs his own business.
David SchelinBorn 1965. Elected as board member 2017.
M.Sc. in Electrical Engineering from Chalmers Univerisity of Technology and Columbia Business School. Serves as board member and advisor to several companies. Former CEO of Ragn-Sells AB and COO of Niscayah Group. Schelin has also held senior positions in the telecom sector, most recently as VP Services for Ericsson in Southeast Asia. CEO of Euromaint Rail since 2017 and chairman of re:newcell ab.
Erik DanielssonHonorary chairman
Erik Danielsson, former President and CEO of Pharmacia, is founder of Scandinavian Biogas and was appointed honorary chairman on 26 November 2009.
Danielsson’s experience and drive have contributed significantly to Scandinavian Biogas's develop-ment. He was involved in establishing operations in Sweden and South Korea during his tenure as chairman of the board, and his strong commitment and entrepreneurial spirit were crucial in efforts to move the Company into the next phase in the face of numerous challenges and financial difficulties during the 2008-09 financial crisis.

SCANDINAVIAN BIOGAS FUELS INTERNATIONAL AB (publ) ANNUAL REPORT 2017 27
Executive management
Matti VikkulaPresident and CEO
President and CEO of Scandinavian Biogas since 2011. M.Sc. in Economics from the Helsinki School of Economics. Chairman of AinaCom Oy and iTaito Oy. Previously management group member at telecom operator Elisa, CEO of Saunalahti, partner at PwC Management Consulting and chairman of Efore Oyj.
Michael Wallis OlaussonDirector Business Area Sweden
Employed since 2009. Responsible for Business Area Sweden, including customer and business strategies and development of new business opportunities and collaborations. Formerly Lt. Colonel, Swedish Armed Forces, and management consultant at Deloitte. MBA from the Stockholm School of Economics.
Jörgen EjlertssonDirector of R&D
Professor Jörgen Ejlertsson is a co-founder of Scandinavian Biogas Fuels AB and has been active within R&D since then. M.Sc. in Agricul-ture from the Swedish Uni versity of Agricultural Sciences (SLU) in Uppsala and PhD in Environmental Microbiology from Linköping Univer-sity, where he is a senior lecturer in Water in Nature and Society.
Lotta LindstamCFO
Employed since 2011. Group CFO, responsible for internal and external financial reporting, and personnel director. Previous employers include publishers Hachette and Metro. Certified Controller, IHM Business School.
Jean CollinCTO
Employed since 2007. Responsible for the engineering department, which encompasses project (delivery of plant solutions) and R&D (development of new digestion concepts) activities. M.Sc. in Agroecology from ISARA, Lyon France.
Lars HammarloSenior Operations Advisor and Biogas Specialist
Employed since 2010. Primary responsibilities include co-ordinating and developing the technical operations of the Group’s plants to increase profitability.
Johan LarssonHead of Sourcing & Supply Chain
Employed since 2012. Head of the Sourcing & Supply Chain unit and responsible for the Company’s strategy and implementation of substrate supply, bio-fertiliser sales and associated logistics solutions. Previously worked with strategic purchasing of liquid biofuels and physical commodity trading (e.g., coal, metal concentrates and metals). MBA from Uppsala University.

SCANDINAVIAN BIOGAS FUELS INTERNATIONAL AB (publ) ANNUAL REPORT 2017 28
Don’t forget that five millionSwedes sort their food waste.They expect it to be used toproduce fuel they can fill theircars with to drive to work orgo on holiday.” Göran Persson,
chairman Scandinavian Biogas
”

SCANDINAVIAN BIOGAS FUELS INTERNATIONAL AB (publ) ANNUAL REPORT 2017 29
Board of Directors' reportThe Board of Directors and the Chief Executive Officer of Scan-dinavian Biogas Fuels International AB (publ), 556528 -4733, hereby submit the annual report and consolidated accounts for financial year 2017.
OperationsScandinavian Biogas is a leading player in large- scale biogas production, with world -leading expertise in the design and operation of biogas facilities – encompassing everything from pre- treatment to fuel upgrading – to optimise biogas produc-tion. The Group’s focus is on facilitating the transition from fossil to renewable energy.
Scandinavian Biogas’s business concept is to be a leader in the design, management and operation of biogas plants. This is achieved by constantly improving the biogas production digestion process from various types of biomass, generated primarily from wastewater treatment sludge, food waste, and industrial processes such as food and biofuel (e.g., glycerol) manufacturing. The Group also provides leading expertise in the purification process for upgrading biogas to vehicle fuel quality and for utilising digestion process residues as bio-fertiliser. Scandinavian Biogas is focused on markets in the Nordic region and South Korea. The Group invests in owned or leased produc-tion facilities, primarily in the Nordic region, and provides its expertise as a service in other markets.
With the Group’s strategic focus on research and development, Scandinavian Biogas places high priority on developing methods to improve biogas and bio-fertiliser production efficiency for both established and new types of waste, residues and other organic material. Cost and resource efficiency improvements to production are made possible thanks to the Company’s expertise and methodology.
The Group’s operations are primarily conducted via subsidi-aries, while the Parent Company serves in an administrative capacity.
Scandinavian Biogas Fuels International AB (publ) is domi-ciled and headquartered in Stockholm. At year -end 2017 the Company had 42 (44) employees in Sweden, 21 (20) in South Korea and 13 (7) in Norway.
Licensable activitiesThe Company conducts operations subject to the environmen-tal code in three Swedish subsidiaries. The Group’s licence and registration activities affect the external environment mainly through subsidiaries Scandinavian Biogas Stockholm AB (SBSt), Scandinavian Biogas Södertörn AB (SBSö) and Scandinavian Biogas Recycling AB (SBR), which are subject to environmental permits and permits to conduct business with explosive and flammable products and substances. SBSt and SBSö produce upgraded biogas and may affect the external environment through the emission of methane. SBSö also produces bio- fertiliser, which may affect the external environment through the leakage of nitrogen- rich bio- fertiliser.
SBR receives and pre -treats organic waste, which may affect the external environment primarily through the leakage of pre treated organic waste (slurry). To enable minimisation of the risk of external influences on the environment, all companies have a business system that includes regular controls and the ongoing management of any incidents. The upgrading facilities, for example, are connected to methane deconstruction facilities in order to combust any leakage of methane.
The Group Scandinavian Biogas Fuels International AB (publ) is the Parent Company of the Scandinavian Biogas Group, which encompas-ses a number of wholly and partly owned companies registered in Sweden, South Korea and Norway. Operations are primarily conducted in subsidiaries. Scandinavian Biogas Fuels AB also has a branch office in Norway.
Corporate governanceScandinavian Biogas Fuels International AB (publ) is governed, managed and controlled through a division of responsibilities between shareholders at the Annual General Meeting, the board of directors and the chief executive officer in accordance with the Swedish Companies Act. The Company’s corporate governance is organised and monitored as illustrated below.
Corporate governance within Scandinavian Biogas follows
the Swedish Annual Accounts Act but does not yet follow the Swedish Corporate Governance Code. The internal corporate governance framework is comprised of the Company’s Articles of Association, rules of procedure for the board of directors, instructions for the CEO, instructions for financial reporting, and other policies and guidelines.
Shareholders exercise their influence at the Annual General Meeting (AGM), the Company’s highest decision- making body. The AGM elects the board of directors and auditors; adopts the income statement and balance sheet; and resolves on appro-priation of profits, discharge from liability and amendments to the Articles of Association. The AGM also adopts guidelines for board fees and resolves on new share issues. The Swedish Companies Act (2005:551) and the Articles of Association stipulate the manner in which Annual General Meeting and Extraordinary General Meeting notices are to be issued and specify who is entitled to attend and vote at meetings.
Annual General Meeting (AGM)
Board of Directors
Nomination Committee
Remuneration Committee
Audit Committee
Auditors
CEO

SCANDINAVIAN BIOGAS FUELS INTERNATIONAL AB (publ) ANNUAL REPORT 2017 30
Shareholders may not vote or otherwise participate in meetings remotely. Each share carries one vote and all shareholders have identical rights.
The AGM is held within six months of the close of the financial year. Shareholders listed in the shareholders’ register as at the record date and who have provided notification of their participation are entitled to participate at the AGM. The AGM notice is published in the Swedish Official Gazette and made available on the Company’s website. Details on the AGM notice are published in Dagens Industri. Documents to be presented at the AGM are made available at the Company’s head office and on the Company’s website no less than three weeks prior to the AGM, and are mailed to shareholders upon request.
The AGM resolves on appointments and dismissals of board members and on amendments to the Articles of Association.
The AGM held on 5 May 2017 resolved to authorise the board to make decision(s), within the scope of the Articles of Association and during the period through the next AGM, on the issue of shares, bonds and/or convertible instruments. The board is authorised to approve the issue of a maximum total of 36,000,000 shares, corresponding to a maximum of 40 per cent of shares in the Company as at the date of the AGM not ice. The shares are to be issued at the market subscription price, subject to market rate subscription discounts when applicable. Payment for shares shall be in cash, in kind, set -off of Company debt or otherwise qualified.
Board of DirectorsThe board is comprised of Göran Persson (chairman), Anders Bengtsson, Andreas Ahlström, Hans Hansson (independent), Sara Anderson (independent) and David Schelin (independent). Board meetings are scheduled 12 months ahead of time, with at least five meetings per year. However, around 12 -15 meetings are usually held per year, of which a few are via telephone. The auditors participate in at least one board meeting per year to re-port the results of their audit of the Group and its legal entities.
Nomination CommitteeNomination Committee members are Göran Persson, Örjan Björnsson, Jonas Bengtsson, Peter Immonen and Andreas Ahl-ström. The committee meets at least once per year. Committee duties include proposing board composition, remuneration fees for board and committee work, and the election of auditors to the AGM.
Remuneration CommitteeRemuneration Committee members are Göran Persson, Anders Bengtsson and Andreas Ahlström. The committee is tasked with determining salary and other benefits for the CEO and other senior executives, as well as bonuses paid to other employees.
Audit CommitteeThe Audit Committee is comprised of Anders Bengtsson (chair-man), Hans Hansson and Sara Anderson. The committee is responsible for i) monitoring the Company’s financial reporting, ii) with respect to financial reporting, monitoring the efficiency of the Company’s internal control and risk management, iii) staying informed on the audit of the annual report and conso-lidated accounts, iv) reviewing and monitoring the auditors’ impartiality and independence, paying particular attention to
whether the auditors provide the Company with services other than auditing services, and v) assisting in the preparation of proposals for the Annual General Meeting’s election of auditors.
Internal control and auditUnder the provisions of the Companies Act (2005:551), the board of directors has overall responsibility for ensuring that the Company’s organisation is designed in such a way as to provide satisfactory control of the Company’s accounting, management of assets and financial condition. The Company’s internal control structure is based on division of duties between the board and the CEO. Regular reporting and examination of financial results is conducted by the operational units’ manage-ment bodies and by the board of directors.
The Parent Company’s Articles of Association stipulate that one or two approved or authorised public accountants and up to two deputy auditors or, alternatively, a registered public accounting firm, are to be appointed by the AGM. The auditor and deputy auditors (if any) are elected on an annual basis by the AGM for the period through conclusion of the next AGM.
The auditor examines the annual accounts, consolidated accounts and accounting records, as well as administration by the board and CEO.
Executive managementThe Group’s management team is comprised of President & CEO Matti Vikkula, Director of Business Area Sweden Michael Wallis Olausson, Director of R&D Jörgen Ejlertsson, CFO Lotta Lindstam, CTO Jean Collin, Senior Operations Advisor and Bio-gas Specialist Lars Hammarlo, and Head of Sourcing & Supply Chain Johan Larsson. Other key people in the Group include General Manager of South Korean operations Kenny Cho and General Manager of Norwegian operations Håvard Wollan.
Ownership structure on balance sheet date, percentageAC Cleantech Growth Fund 1 Holding AB and related parties 29.3%Bengtssons Tidnings AB and related parties 28.8% Wipunen varainhallinta Oy 10.3%Ajanta Oy and related parties 5.5%Reliquum (formerly Novator Biogas Sweden SARL) 5.3%Erik Danielsson and family, incl. companies 5.1%John Nurminen Oy and related parties 4.0%Other 11.7%
Financial overviewGroup
(SEK thousand)31 Dec
201731 Dec
201631 Dec
201531 Dec
201431 Dec
2013
Net sales 258,363 242,610 175,891 168,376 145,488EBITDA 21,587 21,972 23,358 31,958 21,407Operational EBITDA
35,170 21,972 23,358 31,958 21,407
Operating results -42,159 -24,580 -16,817 -5,281 -9,191Balance sheet total
1,161,238 1,026,648 760,652 628,037 428,741
Adjusted equity/ assets ratio, %
25.5 25.5 28.6 30.8 41.9
SCANDINAVIAN BIOGAS FUELS INTERNATIONAL AB (publ) ANNUAL REPORT 2017 31
Parent Company
(SEK thousand) 31 Dec 2017 31 Dec 2016 31 Dec 2015 31 Dec 2014 31 Dec 2013
Net sales 1,200 1,200 1,200 1,200 1,200Operating results -1,930 -1,965 -2,513 -1,104 -2,259Balance sheet total
517,628 504,351 299,093 353,168 351,357
Adjusted equity/assets ratio, %
49.4 55.1 98.9 86.0 85.8
Consolidated net sales for the financial year totalled SEK 258.4 million (242.6), a year-on-year increase of 6.5 per cent. The increase is mainly attributable to increased biogas sales in Sweden. Total revenues for 2017 amounted to SEK 289.3 million (266.2), an increase of 8.7 per cent. Other operating income in-cludes SEK 8.6 million (2.8) of re-invoicing, with corresponding expenses reported under other external costs. Other external costs increased during the financial year due to increased maintenance costs and an accounting principle change made by a subsidiary (between raw materials & consumables and other external costs; see Note 2, Summary of Key Accounting Principles). Personnel costs increased due to the addition of personnel, mainly in Norway.
Consolidated operational EBITDA totalled SEK 35.2 million (22.0), a year-on-year increase of 60.1 per cent. The increase is mainly due to improved profitability at the Södertörn facility. Consolidated EBITDA for the financial year totalled SEK 21.6 million (22.0), due mainly to the penalty fee in Ulsan (see Note 28, Provisions).
The Group posted an operating loss for the financial year of SEK 42.2 million (-24.6), primarily attributable to an additional one-off cost of SEK 14 million for a penalty fee in Ulsan and an SEK 12 million impairment loss on the plant in Ulsan. See the section on Significant Events During the Year for details.
The Group posted a loss after tax of SEK 75.0 million (-47.7) for the financial year, of which SEK +1.1 million (+7.1) pertains to unrealised exchange rate fluctuations, attributable mainly to dollar-based, long-term intra-group financing in South Korea.
The balance sheet total increased 13.1 per cent year-on-year, totalling SEK 1,161.2 million (1,026.6) at the close of the financial year. Finance lease-related borrowing totalled SEK 257.7 million (254.6). The Group conducted two share issues during the year: a directed share issue of SEK 42.9 million in April (corresponding to 11 million shares) and a preferential rights issue of approximately SEK 23.4 million in May (corresponding to approximately 6 million shares). The subscription price was SEK 3.90 per share in both cases. In addition to being impact-ed by net profit/loss for the year, equity was impacted by a contribution in the form of a SEK 15.1 million new share issue from non-controlling interests in Biokraft Holding AS (see Note 17, Participations in Group Companies).
The consolidated cash balance was SEK 86.9 million (73.9) at 31 December 2017.
InvestmentsInvestments made in tangible and intangible assets during the year totalled SEK 167 million (208), of which SEK 122 million (161) in Norway. At 31 December 2017 the Group had commit-ments to make further investments, mainly in the new biogas plant in Skogn, Norway.
The carrying amount of the Group’s tangible and intangible assets was SEK 946.4 million (840.5) as at 31 December 2017, of which SEK 245.7 million (247.4) pertains to objects leased by the Group through non -current leasing agreements (> 20 years).
Parent CompanyParent Company income during the financial year totalled SEK 1.8 million (2.0). Results before appropriations and tax totalled SEK -35.6 million (-3.7). Following a regular impairment assess-ment, an SEK 27.1 million (0) write-down was done during the financial year on value of shares in subsidiaries. The impairment is mainly attributable to the penalty fee in Ulsan (see Note 28, Provisions).
Parent Company results after tax totalled SEK -87.1 million (-17.7) in 2017. Net results for the year include group contributions to subsidiaries totalling SEK 51.5 million (14.0), primarily attributa-ble to the penalty fee in Ulsan (see Note 28, Provisions).
The Parent Company balance sheet total was SEK 517.6 million (504.4) at the close of the financial year. The Parent Company's cash balance totalled SEK 7.5 million (0.7) at the same date.
Significant events during the yearNew environmental permit for Södertörn The facility at Södertörn was granted a new environmental permit in January 2017. Under the new permit, the facility is entitled to process up to 260,000 tonnes of organic waste (compared with the former permit’s limit of 50,000 tonnes) and to increase biogas production to 20 million normal cubic metres (Nm3 ) of upgraded biogas, or about 200 GWh. The environmental permit gives the Group numerous new oppor-tunities to develop the facility at Södertörn.
Evaporator The Group has invested in an evaporation plant at Södertörn, which was commissioned during first quarter 2017. The investment was financed by a loan from the Parent Company and a contribution from the Swedish Energy Agency. The function of the evaporator is to treat water that is used in production, allowing it to be re-used as dilution water. This will reduce the amount of wastewater and significantly reduce the consumption of fresh water; the goal is that the facility will be self-supporting, which will reduce costs. The evaporation plant will also produce a concentrated bio-fertiliser that will generate higher value and lower logistics costs.
Share issuesA directed share issue of SEK 42.9 million was conducted in April 2017. Wipunen varainhallinta Oy subscribed for 11 million shares, representing an approximate 10 per cent dilution for existing shareholders. The subscription price was SEK 3.90 per share.
A preferential rights issue of approximately SEK 23.4 million was conducted in May 2017. The subscription price was SEK 3.90 per share. The loans taken out early in the year were offset in conjunction with the preferential rights issue. The offset loans, including interest, totalled SEK 16.8 million.
One of the subsidiaries in Norway conducted a new share issue, contributing NOK 30 million to the subsidiary. NOK 15.0 million of this amount came from non-controlling interests.

SCANDINAVIAN BIOGAS FUELS INTERNATIONAL AB (publ) ANNUAL REPORT 2017 32
Bond issue SEK 30 million in bonds were issued in June 2017 within the scope of the Company’s outstanding bond loan. Following the issue, the Company’s outstanding bond loan is SEK 230 million and carries a 3-month STIBOR +9.75 per cent interest rate. The subsequent bond was priced at 100.5 per cent of the nominal value and listed on NASDAQ Stockholm on 18 August 2017. The issue proceeds have been and will be used to finance additional investments in the Biokraft project in Skogn, Norway, and to amortise external loans.
Prospective listing or other capital structure alternatives As part of the Group’s strategic plan, the board of directors and Group management began working in 2017 on a prospective listing of the Company’s share in a suitable marketplace. In parallel with these efforts, various strategic and capital structure alternatives are being evaluated to create and realise the value of the Group’s business opportunities and maximise shareholder value.
Investment project in Skogn, NorwayThe general contractor for the investment project in Skogn, Norway, has advised that delivery of the facility will be delayed. The plant in Skogn will be commissioned during the first six months of 2018.
Penalty fee in Ulsan The penalty fee, which is disputed by the parties, is based on a contractual obligation to invest in a gas upgrading facility at the Ulsan site by the end of 2017. As the financial conditions for an upgrading facility in Ulsan have been deemed disadvantageous in the current market climate, an impact assessment has been carried out. Consequently, the consolidated accounts for fourth quarter 2017 include a one-off non-cash provision for the net present value of the full gas penalty accrual for the period November 2012 through December 2017, with the additional amount equivalent to approximately SEK 14 million. Due to the one-off non-cash provision, there is a reduction in consolidated EBITDA for 2017. The net present value of the total accrual in the consolidated balance sheet as at 31 December 2017 is estimated at approximately SEK 25 million, corresponding to a nominal value of approximately SEK 55 million, and is assumed to be, at least partly, payable within the next eight years. See Information on Risks and Uncertainties; Note 4, Significant Estimates and Assessments; and Note 28, Provisions.
The consolidated accounts from 2018 and onwards will carry as an expense the full gas penalty of approximately SEK 8-9 million as an operative annual cost subject to annual gas sales volumes, prices and exchange rates. The full penalty will be paid to Ulsan City while the legal proceedings are underway, after which it is assumed that the Group will pay pursuant to the court's ruling. The change between calculations of the nominal and net present value of the provision will affect consolidated financial expense on an ongoing basis going forward.
Based on legal opinions from two leading South Korean law firms, which maintain that the penalty fee level is unreason able, the position of the Group board of directors remains unchang-ed. The reasonable penalty level according to South Korean legal precedent is assumed to be at maximum 30% of the contractual gas penalty, corresponding to an operative annual
cost of no more than approximately SEK 3 million, subject to future court decision. In the event the dispute is not settled in accordance with this legal assessment, there is a risk of an additional write-down requirement for the Ulsan facility.
The total nominal value of the gas penalty is estimated at approximately SEK 140 million, with the disputed amount corresponding to approximately SEK 100 million, for the entire contract period, subject to annual gas sales volumes, prices and exchange rates. A court decision is expected in 2018.
Dispute regarding service costs in UlsanIn view of the Group’s differences of opinion with Ulsan City re-garding the Group’s operations in Ulsan, South Korea, the South Korean subsidiary has initiated legal proceedings concern ing service costs invoiced to the subsidiary by Ulsan City since 2010, corresponding to a nominal value of approximately SEK 40 million at the end of 2017. The costs have been recorded regularly during the full contract period and will continue to be recorded as invoiced, notwithstanding the dispute. However, service costs were not paid in 2017 and, pursuant to court ruling, will not be paid prior to final adjudication of the matter.Annual service costs are approximately SEK 5 million, and it is therefore assumed that the outcome of the dispute will have a mainly positive effect on consolidated results, corresponding to an SEK 40 million reduction in the one-off cost and a reduction of approximately SEK 5 million per year going forward.
The total nominal value of the disputed amount is estimated at approximately SEK 80 million for the entire contract period, subject to residue volumes, prices and exchange rates. A court decision is expected in 2018.
Impairment testing – concession rightThe Group conducts annual impairments tests of the conces-sion right, and this intangible asset is recognised based on the fair value of consideration the Group has received or will receive. Fair value was estimated at the present value of future cash flows the Group expects to receive from the concession right. A 19.23 per cent cost of capital was applied during the balance sheet date review, with the cost of capital calculated based on assessments of weighted return requirements for interest-bearing liabilities and equity in proportion to estimated percentage in an optimal industrial capital structure. A specific risk premium is also included for both legal disputes; see Significant Events During the Year. In view of the upgrading issue and penalty fee levied by Ulsan City, an impairment loss of approximately SEK 12 million was recorded in fourth quarter 2017 for the production facility in Ulsan, South Korea. See Note 15, Intangible Assets.
ProductionBusiness Area Sweden Business Area Sweden has three biogas production facilities: at Bromma, Henriksdal and Södertörn. Operations in Sweden produced a total of 20.3 million Nm3 (16.7) of biogas during the financial year, corresponding to approximately 203 GWh (167). The increase is attributable to an increase in production at the plants in Henriksdal and Södertörn. The plant at Södertörn, however, produced lower volumes than planned due mainly to various operational problems, which also resulted in higher than planned costs. The price of external organic material (e.g., glycerol), which is used to some degree with food waste

SCANDINAVIAN BIOGAS FUELS INTERNATIONAL AB (publ) ANNUAL REPORT 2017 33
and sewage sludge in biogas production, was also higher than estimated. The reliability of gas supply was good, however, and all contracts were fulfilled satisfactorily. An average of 147 tonnes (125) of organic waste was processed per day.
Business Area South Korea The facility in South Korea received an average of 187 tonnes (188) of food waste per day during 2017. Sales of raw gas during the same period amounted to 9.8 million Nm3 (9.0), or approximately 67 GWh (61). A total of 10.6 million Nm3 (10.4) of raw gas was produced.
Business Area NorwayThe investment project in Skogn, Norway, is underway and is scheduled for commissioning during the first half of 2018.
Ongoing investment projectsSkogn, NorwayConstruction of a production plant for liquid biogas in Skogn, Norway, commenced in August 2015. The project is underway and scheduled for commissioning during the first half of 2018. In view of the fact that the project has been delayed, the Group began in December 2017 to enter the delay penalty as an in-vestment reduction. Production capacity is estimated at 12 Nm3 of liquid biogas, or approximately 120 GWh, at full capacity. Long-term sales contracts for all planned biogas production are in place and long-term access to most feedstock supply is secured through contracts with main feedstock suppliers.
Financing is by way of equity, loans from a bank consortium and Innovasjon Norge, and a contribution from Enova. A new share issue conducted by one of the Norwegian subsidiaries contributed NOK 30 million, of which NOK 15 million from non- controlling interests. The Norwegian operations raised a convertible loan of NOK 25 million in October 2017, of which nearly half was raised from non-controlling interests (pro rata).
EffiSludge/LIFEScandinavian Biogas has been awarded a grant from EU/LIFE aimed at increasing biogas production in the pulp and paper industry. The goal of the project is to build and operate the first demonstration process to produce biogas from wastewater from Norske Skog’s paper mill in Skogn while also reducing the plant’s electricity consumption. The total project cost is estima-ted at just under SEK 30 million, with the EU grant equivalent to approximately SEK 16 million.
Information on risks and uncertaintiesDescribed below are the main risks that may have an impact on Scandinavian Biogas’s operations and future development. The account does not purport to be comprehensive and the risk factors are not listed in any order of significance. See also Note 3, Financial Risk Management.
Competition and maintaining competitive edgeScandinavian Biogas’s operations are largely dependent on the demand for biogas, particularly in Sweden. Biogas is currently one of the most environmentally attractive energy carriers, and as the market matures more companies are expected to be established. Increased competition for the organic material used in biogas production is anticipated, both from other biogas producers and from producers of other renewable energy carriers. It is therefore vital that Scandinavian Biogas continue
its strategic research and development activities that facilitate the digestion of new types of substrates, and eventually identify ways of producing biogas from organic waste more efficiently.
Revenue generationRevenue streams from biogas production differ from market to market. At the same time, the price of biogas is of key signifi-cance to Scandinavian Biogas. There is a risk that revenue levels to fund the Group's future projects may not suffice if the market price of fossil energy remains at a low level.
Political risksThe political situation in areas where Scandinavian Biogas operates is of great significance to the Company’s operations. Partners, customers and suppliers are largely comprised of municipalities or the equivalent, public sector entities, and companies. This means that any change in political engage-ment or tax laws may have a major impact on projects and the Company’s ability to generate revenues despite contracts entered into previously. Many projects are also contract -based, with revenue streams spanning time horizons 15 years or longer. The uncertainty of unforeseen events that may occur in future poses a risk for the Group. Continued expansion into markets with stable conditions may mitigate this type of risk for Scandinavian Biogas. The risk of any political decisions that might have a negative impact on the production of biofuels is currently deemed to be limited.
Dependence on public authority decisions and permitsScandinavian Biogas’s operations are dependent on permits granted by public authorities under the environmental code and the approval of applications. Processing times may take up to one year or more in some cases, with some projects conse-quently coming to a halt and being delayed. All of the Group’s facilities hold valid permits.
Long sales cycles for new contractsThe sales cycle from the first point of contact with the customer to the generation of revenues may span several years. As a rule, projects are extensive and complex to carry out. Entrance into new markets also involves major work efforts and cultural understanding. All of these factors pose a risk, which may be mitigated through well -conducted market studies, employees with local knowledge and strong networks, and experience in the successful completion of similar projects.
Accidents and environmental hazardsOne example of environmental risk associated with biogas production is major leakage of methane. Another example is emission of nitrogen-rich bio-fertiliser to soil and groundwater. Accidents may also occur, and Scandinavian Biogas works continuously to enhance its safety and security procedures. In many areas these are now integrated with day -to -day business activities, and the Company continuously strives to mitigate the risk of accidents and environmental hazards.
Financial risksA number of technical challenges arose at the Södertörn biogas plant during the year, and production was consequently worse than planned. Various measures have been taken, but there re-mains a risk that ongoing process adaptations may tempor arily affect future production volumes. While the technical challeng-es resulted in diminished liquidity and consequently increased
SCANDINAVIAN BIOGAS FUELS INTERNATIONAL AB (publ) ANNUAL REPORT 2017 34
financial risk, this risk was reduced during the year through the injection of new capital via the new share issues conducted during the first six months of 2017. See Note 26, Share Capital, Other Paid-in Capital and Proposed Appropriation of Profits.
Disputes Due to a dispute with one of the Södertörn facility’s main suppliers, the Group has withheld the final payment due under the construction contract, as it deems that the counterparty failed to perform its duties under the contract. The counterparty has demanded that payment be made. The disputed payment is under arbitral review and the Group has set aside the disputed amount. The counterparty has also demanded payment for alleged additional work performed. The Group denies any obligation to pay for the alleged additional work and has filed a counterclaim for fees and expenses incurred to rectify faulty deliveries, which exceeds the amount of the counterparty’s claim.
Due to disagreements with Ulsan City regarding the Group’s operations in Ulsan, South Korea, the South Korean subsidiary has brought a lawsuit concerning certain expenses invoiced by Ulsan City to the subsidiary (see Significant Events During the Year). A court ruling is expected during 2018.
The Group has decided to take legal action against Ulsan City based on the upgrading investment requirement (see Signifi-cant Events During the Year). A court ruling is expected during 2018.
One of the Group’s suppliers to the project in Skogn, Norway, has claimed compensation of approximately NOK 52 million, mainly for groundwork. However, the Group previously entered into a settlement agreement with this supplier and is of the opinion that the current claim is included in the settlement amount.
Expectations regarding future developmentIncreasing demandThere is a great need for renewable energy that can re place fossil fuels such as coal, oil and natural gas at reasonable prices. Interest in biogas has increased in various evaluations of renewable alternatives that can be mass- produced, as has demand for biogas, which is expected to increase further as availability increases. In sectors including the heavy transport sector, demand for liquid biogas is expected to increase significantly in coming years. However, the current low market price of fossil energy causes some uncertainty as to the biogas market price as well as the growth of and new investments in renewable energy.
Policy instruments key to market development Biogas is among the renewable fuels that are most effective in reducing climate impact and improving air quality. The greatest environmental benefits are achieved in heavy vehicles (e.g., bus services), which is why more and more cities are choosing to prioritise biogas over other renewable alternatives. In some cases, however, biogas supply is a limiting factor. Sweden is a pioneer in the use of biogas as vehicle fuel, particularly within bus services, and the country’s strategy can be expected to spread to other countries. The Swedish public transport system is well advanced in this area and there are indications that biogas- powered public transport will spread to other Nordic countries. The increased use of biogas in the public transport
system lays the foundation for expanded production, parti-cularly in metropolitan regions. Scandinavian Biogas, through subgroup Scandinavian Biogas Sweden AB, has an excellent foundation for continued expansion in the Stockholm region. Due to high production costs, however, biogas will not be able to compete price- wise with natural gas in the foreseeable future – so it is essential that political interest, on the national and local levels, in supporting biogas production remains in place.
Long-term goalThe Group’s long-term goal is to utilise Scandinavian Biogas’s expertise and experience to ensure the expansion of biogas supply and use. Deliveries can be made not only from the Company’s facilities but also by third parties, contributing to Group sales via licencing, operating or service agreements, etc.
The Group’s long-term goal is to ensure
• growth corresponding to a 20 – 30 per cent increase in average annual biogas sales and deliveries
• total capacity of one TWh achieved during the first stage, with growth based on own production or on contractual knowledge management
• project profitability of at least 15% IRR
• an EBIT margin of at least 10%
• an equity/assets ratio of at least 30%
Production capacityIn recent years, the Group has pursued increased production in the Stockholm area – an effort that remains under way. The combined full technical capacity of all plants in Sweden is estimated at over 30 million Nm3 of fuel-quality biogas, or approximately 300 GWh. The new environmental permit at Södertörn also enables a sharp production increase at Södertörn over time. The plant in South Korea is expected to continue to have an annual production capacity of about 65 GWh. In addition, the annual production capacity in Norway is estimated at 12 million Nm3 of liquid biogas, or about 120 GWh. With its current plants and ongoing projects, the Group’s total production capacity is expected to be close to 500 GWh at full capacity.
The Group anticipates a positive development in operational profitability (EBITDA) in 2018 as compared with 2017, with commissioning of the plant in Skogn expected to contribute significantly to the profitability improvement (EBITDA).
FinancingOperations are financed through equity, loans from external creditors and finance leases. In Sweden, a major portion of the production facilities are leased under 25-year lease agreements. Non-current interest-bearing liabilities, exclusive of finance leases, totalled SEK 475.4 million (370.7) as at 31 December 2017. The Group’s cash balances totalled SEK 86.9 million (73.9) on that date.
The two new share issues conducted during second quarter 2017 contributed a total of SEK 64.8 million to consolidated equity, after issue expenses. The funds have been and will be used for outstanding investments in the Södertörn facility and to strengthen consolidated liquidity. The first issue was
SCANDINAVIAN BIOGAS FUELS INTERNATIONAL AB (publ) ANNUAL REPORT 2017 35
directed to Wipunen varainhallinta Oy, the Group’s third-largest shareholder as at the close of the financial year, with 10.3 per cent of the shares. The second issue was a preferential rights issue subscribed 85 per cent through subscription rights, with the remainder subscribed without subscription rights. The loans raised from several major shareholders early in the year were offset in conjunction with the preferential rights issue. The subscription price for both share issues was SEK 3.90 per share.
An additional SEK 30 million in bonds were issued in late June 2017 within the scope of the Company’s outstanding bond loan. Following the issue, the company’s outstanding bond loan is SEK 230 million and carries a 3-month STIBOR plus 9.75 per cent interest rate. The subsequent bond was priced at 100.5 per cent of the nominal value and listed on NASDAQ Stockholm on 18 August 2017. The issue proceeds have been and will be used to finance additional investments in the Biokraft project in Skogn, Norway, and to amortise external loans.
During the second quarter the additional financing requirement for the Norwegian project was estimated at approximately NOK 55 million. NOK 30 million of this amount has been provided to the project via the issue of new shares: approximately NOK 15 million from TrønderEnergi in late June and approximately NOK 15 million from Scandinavian Biogas Fuels International (as per participating interest) in early July. Pursuant to an agreement between the shareholders, the remaining NOK 25 million was borrowed from shareholders in the form of convertible loans in October 2017, corresponding to NOK 12.5 million for the Scandinavian Biogas Group.
The Group’s existing operations will be financed according to plan by consolidated cash flow and liquid resources. The Group aims to continue expanding, however, and is proactively pursuing new projects. The Group expects major future projects to require financing under various types of partnerships and funding, depending on project structure and location.
As part of the Group’s strategic plan, the board of directors and Group management have begun working on a prospective listing of the Company’s share in a suitable marketplace. In parallel with these efforts, the board of directors will be working with its advisors to evaluate various strategic and capital structure alternatives to create and realise the value of the Group’s business opportunities and maximise shareholder value.
The share A directed share issue of SEK 42.9 million was conducted in April 2017. Wipunen varainhallinta Oy subscribed for 11 million shares, representing an approximate 10 per cent dilution for existing shareholders. The subscription price was SEK 3.90 per share.
A preferential rights issue of approximately SEK 23.4 million was conducted in May 2017. The subscription price was SEK 3.90 per share. The loans taken out early in the year were offset in conjunction with the preferential rights issue. The offset loans, including interest, totalled SEK 16.8 million.
One of the subsidiaries in Norway conducted a new share issue, contributing NOK 30 million to the subsidiary. NOK 15.0 million of this amount came from non-controlling interests.
The number of the Company's shares totalled 107,098,839 (90,092,662) at 31 December 2017. The quotient value is SEK 0.20 per share. Each share carries one vote. All outstanding shares are ordinary shares and therefore carry the right to equal shares in the assets and profit of Scandinavian Biogas Fuels International AB. The number of shares was increased by 17,006,177 through new share issues conducted during the second quarter of the year.
Warrants Employees and the CEO held an aggregate of 565,000 (565,000) outstanding warrants at 31 December 2017 (see Note 37, Share-based Benefits). The subscription period runs through 1 April 2018. There was no change to the number of outstanding warrants during the financial year.
Significant events after the end of the periodThe filling station at the Group’s biogas facility at Södertörn was commissioned in early 2018. The filling station will primarily sell biogas for lorries and refuse lorries that visit SRV Återvinning’s plant at Södertörn. The plant was partly funded with a grant from Klimatklivet.
The Group has signed a co-operation agreement with Mönster-ås Biogas AB for the joint development of an investment project for possible biogas production in Mönsterås municipality. The development work will be done through a jointly owned com-pany, with a project objective of being able to treat 100,000 tonnes of manure and produce over 110 GWh of liquid biogas (LBG) annually.
Proposed allocation of profit/lossThe board of directors proposes that the following amount, SEK 232,242,542, be allocated as follows:
Amount in SEK
Accumulated profit/loss -294,140,354Share premium reserve 613,502,704Loss for the year -87,119,808Total 232,242,542
Carried forward 232,242,542Total 232,242,542
With regard to the Company’s performance and financial position, please refer to the following financial statements and accompanying notes.

SCANDINAVIAN BIOGAS FUELS INTERNATIONAL AB (publ) ANNUAL REPORT 2017 36
Amounts in SEK thousand Note 2017 2016
Operating income
Net sales 6 258,363 242,610Capitalised work on own account 8 15,841 16,129Other operating income 11, 13 15,127 7,439Total 289,331 266,178
Operating expensesRaw materials and consumables -137,890 -136,343Other external costs 9 -65,064 -51,404Personnel costs 10 -64,790 -56,459Depreciation, amortisation and impairment of tangible and intangible assets -62,802 -45,979Other operating expenses 11, 14 -944 -573Total operating expenses -331,490 -290,758Operating profit/loss -42,159 -24,580 Financial income 2,036 7,335Financial expense -37,552 -31,490Net financial items 12, 14 -35,516 -24,155Profit/loss before taxes -77,675 -48,735
Income tax 13 2,628 1,039Profit/loss for the year -75,047 -47,696
Other comprehensive incomeActuarial results on post -employment benefits 10 167 -121Exchange differences 14 -2,394 3,325Other comprehensive income for the year, net after tax -2,227 3,204Total comprehensive income for the period -77,274 -44,492
All items in the Group’s other comprehensive income may be reclassified in the income statement.
Profit/loss for the year attributable to:
Parent Company shareholders -68,587 -45,552Non -controlling interests -6,460 -2,144
-75,047 -47,696Total comprehensive income attributable to:
Parent Company shareholders -67,718 -43,510Non -controlling interests -9,556 -982
-77,274 -44,492
The notes presented on pages 46-65 are an integrated part of these annual and consolidated accounts.
Consolidated statement of comprehensive income
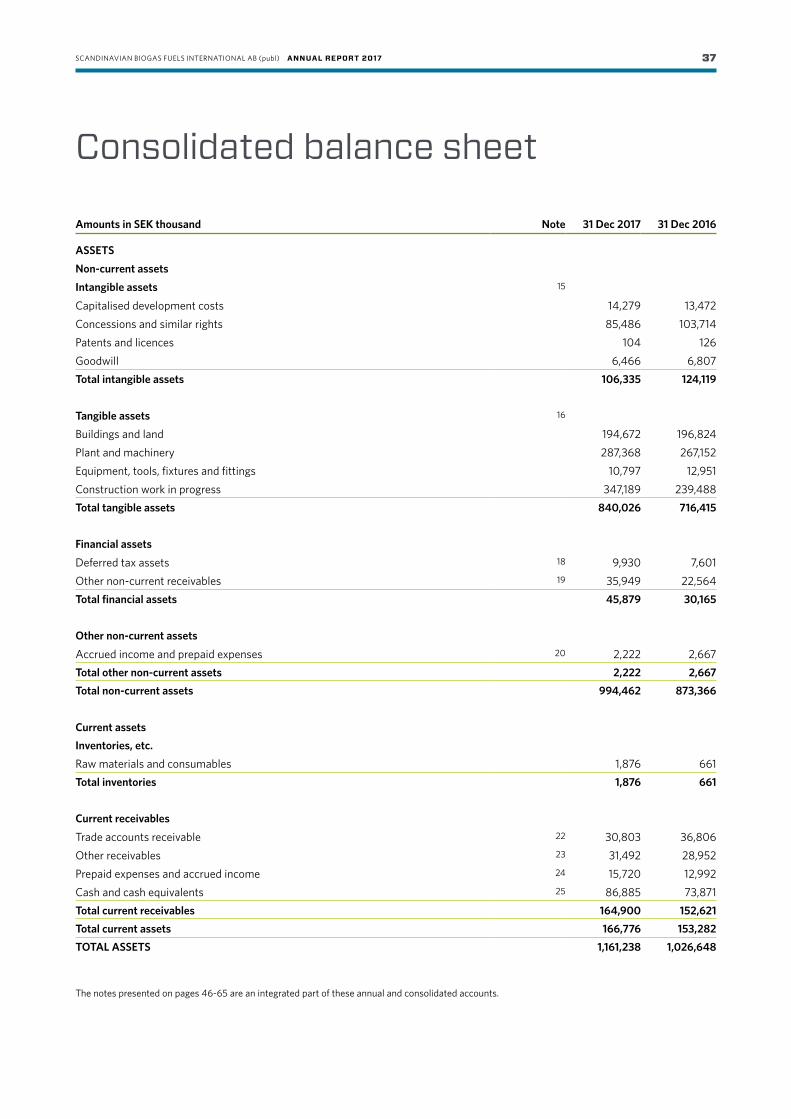
SCANDINAVIAN BIOGAS FUELS INTERNATIONAL AB (publ) ANNUAL REPORT 2017 37
Amounts in SEK thousand Note 31 Dec 2017 31 Dec 2016
ASSETSNon-current assetsIntangible assets 15
Capitalised development costs 14,279 13,472Concessions and similar rights 85,486 103,714Patents and licences 104 126Goodwill 6,466 6,807Total intangible assets 106,335 124,119
Tangible assets 16
Buildings and land 194,672 196,824Plant and machinery 287,368 267,152Equipment, tools, fixtures and fittings 10,797 12,951Construction work in progress 347,189 239,488Total tangible assets 840,026 716,415
Financial assets
Deferred tax assets 18 9,930 7,601Other non -current receivables 19 35,949 22,564Total financial assets 45,879 30,165
Other non-current assets
Accrued income and prepaid expenses 20 2,222 2,667Total other non-current assets 2,222 2,667Total non-current assets 994,462 873,366
Current assetsInventories, etc.Raw materials and consumables 1,876 661Total inventories 1,876 661
Current receivables
Trade accounts receivable 22 30,803 36,806Other receivables 23 31,492 28,952Prepaid expenses and accrued income 24 15,720 12,992Cash and cash equivalents 25 86,885 73,871Total current receivables 164,900 152,621Total current assets 166,776 153,282TOTAL ASSETS 1,161,238 1,026,648
The notes presented on pages 46-65 are an integrated part of these annual and consolidated accounts.
Consolidated balance sheet

SCANDINAVIAN BIOGAS FUELS INTERNATIONAL AB (publ) ANNUAL REPORT 2017 38
Amounts in SEK thousand Note 31 Dec 2017 31 Dec 2016
EQUITY Equity attributable to Parent Company shareholders
Share capital 26 21,420 18,019Other paid- in capital 754,685 693,305Reserves 1,872 1,136Retained earnings including comprehensive income for the year -608,597 -540,143
169,380 172,317Non-controlling interests 59,544 53,962Total equity 228,924 226,279
LIABILITIESNon-current liabilitiesBorrowings 27, 29, 30 718,366 612,736Deferred tax liabilities 18 2,101 1,968Other provisions 28, 30 24,925 9,375Total non-current liabilities 745,392 624,079
Current liabilitiesBorrowings 27 72,550 27,947Accounts payable 50,887 95,775Other liabilities 31 18,120 13,013Accrued expenses and deferred income 32 45,365 39,555Total current liabilities 186,922 176,290TOTAL EQUITY AND LIABILITIES 1,161,238 1,026,648
The notes presented on pages 46-65 are an integrated part of these annual and consolidated accounts.
Consolidated balance sheet, continued

SCANDINAVIAN BIOGAS FUELS INTERNATIONAL AB (publ) ANNUAL REPORT 2017 39
Attributable to Parent Company shareholders
Amounts in SEK thousand NoteShare
capitalOther paid-in
capital ReservesRetained earnings Total
Non-controlling interests Total equity
Opening balance, 1 January 2016 18,019 693,305 -1,008 -494,489 215,827 1,987 217,814Profit/loss for the year -45,552 -45,552 -2,144 -47,696
Other comprehensive incomeActuarial results on post -employment benefits -99 -99 -22 -121Exchange differences 2,144 -3 2,141 1,184 3,325Total comprehensive income 2,144 -45,654 -43,510 -982 -44,492Non- controlling interest arising from acquisition of subsidiaries 33 - 52,957 52,957Total contributions from and distributions to shareholders, recognised directly in equity
- 52,957 52,957
Closing balance, 31 December 2016 18,019 693,305 1,136 -540,143 172,317 53,962 226,279Opening balance, 1 January 2017 18,019 693,305 1,136 -540,143 172,317 53,962 226,279Profit/loss for the year -68,587 -68,587 -6,460 -75,047
Other comprehensive incomeActuarial results on post- employment benefits 133 133 34 167Exchange differences 736 736 -3,130 -2,394Total comprehensive income 736 -68,454 -67,718 -9,556 -77,274
New share issue 26 3,401 62,923 66,324 66,324
Issue expenses1 -1,543 -1,543 -1,543Contribution from non -controlling interests 17 - 15,138 15,138Total contributions from and distributions to shareholders, recognised directly in equity
3,401 61,380 - - 64,781 15,138 79,919
Closing balance, 31 December 2017 21,420 754,685 1,872 -608,597 169,380 59,544 228,924
The notes presented on pages 46-65 are an integrated part of these annual and consolidated accounts.1 The tax effect of issue expenses recognised in equity totals SEK 340 thousand (0).
Consolidated statement of changes in equity

SCANDINAVIAN BIOGAS FUELS INTERNATIONAL AB (publ) ANNUAL REPORT 2017 40
Amounts in SEK thousand Note 2017 2016
Cash flow from operating activities Operating profit/loss before financial items -42,159 -24,580Amortisation/depreciation 62,802 45,979Other non -cash items 35 23,893 5,051
Interest received 125 194Interest paid -35,913 -36,265Cash flow from operating activities before changes in working capital 8,748 -9,621
Cash flow from changes in working capital Increase/decrease in inventories -751 -77Increase/decrease in operating receivables 271 -30,268Increase/decrease in operating liabilities 5,496 15,216Total changes in working capital 5,016 -15,129Cash flow from operating activities 13,764 -24,750
Cash flow from investing activities
Acquisition of intangible assets 15 -2,216 -2,173Acquisition of tangible assets 16 -187,478 -200,909Investments in subsidiaries 33 - 42,974Divestment/amortisation of other financial assets 445 447Restricted bank balances and other changes in financial assets -14,430 -21,094Cash flow from investing activities -203,679 -180,755
Cash flow from financing activitiesNew share issue 26 64,781 -Loans raised 27 154,860 280,696Loan amortisation -30,929 -67,184Contributions to/from minority interests 17 15,138 -Cash flow from financing activities 203,850 213,512
Total cash flow for the year 13,935 8,007
Decrease/increase in cash and cash equivalents
Opening cash and cash equivalents 25 73,871 64,879Exchange differences in cash and cash equivalents -921 985Closing cash and cash equivalents 25 86,885 73,871
The notes presented on pages 46-65 are an integrated part of these annual and consolidated accounts.
Consolidated statement of cash flows

SCANDINAVIAN BIOGAS FUELS INTERNATIONAL AB (publ) ANNUAL REPORT 2017 41
Amounts in SEK thousand Note 2017 2016
Operating income
Net sales 6, 7 1,200 1,200Other operating income 11 594 846Total operating income 1,794 2,046
Operating expenses
Other external costs 9 -3,041 -3,609Personnel costs 10 -681 -401Other operating expenses 11 -2 -1Total operating expenses -3,724 -4,011Operating profit/loss -1,930 -1,965
Profit/loss from participations in group companies 12, 17 -27,067 -Interest income 21,721 19,429Interest expense -28,344 -21,135Net financial items 12 -33,690 -1,706Profit/loss before appropriations and tax -35,620 -3,671
AppropriationsGroup contributions paid -51,500 -14,000Total appropriations -51,500 -14,000Profit/loss before tax -87,120 -17,671
Income tax 13 - -Profit/loss for the year -87,120 -17,671
No items are recognised as other comprehensive income in the Parent Company and, accordingly, total comprehensive income corresponds with profit/loss for the period.
The notes presented on pages 46-65 are an integrated part of these annual and consolidated accounts.
Parent company income statement

SCANDINAVIAN BIOGAS FUELS INTERNATIONAL AB (publ) ANNUAL REPORT 2017 42
Amounts in SEK thousand Note 31 Dec 2017 31 Dec 2016
ASSETS Non-current assetsFinancial assets
Participations in group companies 17 175,899 187,810Receivables from group companies 144,292 171,505
Other non -current receivables 19 12,078 -
Total financial assets 332,269 359,315Total non-current assets 332,269 359,315
Current assetsCurrent receivables
Receivables from group companies 174,916 144,227Other receivables 23 555 8Prepaid expenses and accrued income 24 2,371 119 Total current receivables 177,842 114,354
Cash and bank balances 25 7,517 682Total current assets 185,359 145,036TOTAL ASSETS 517,628 504,351
The notes presented on pages 46-65 are an integrated part of these annual and consolidated accounts.
Parent company balance sheet
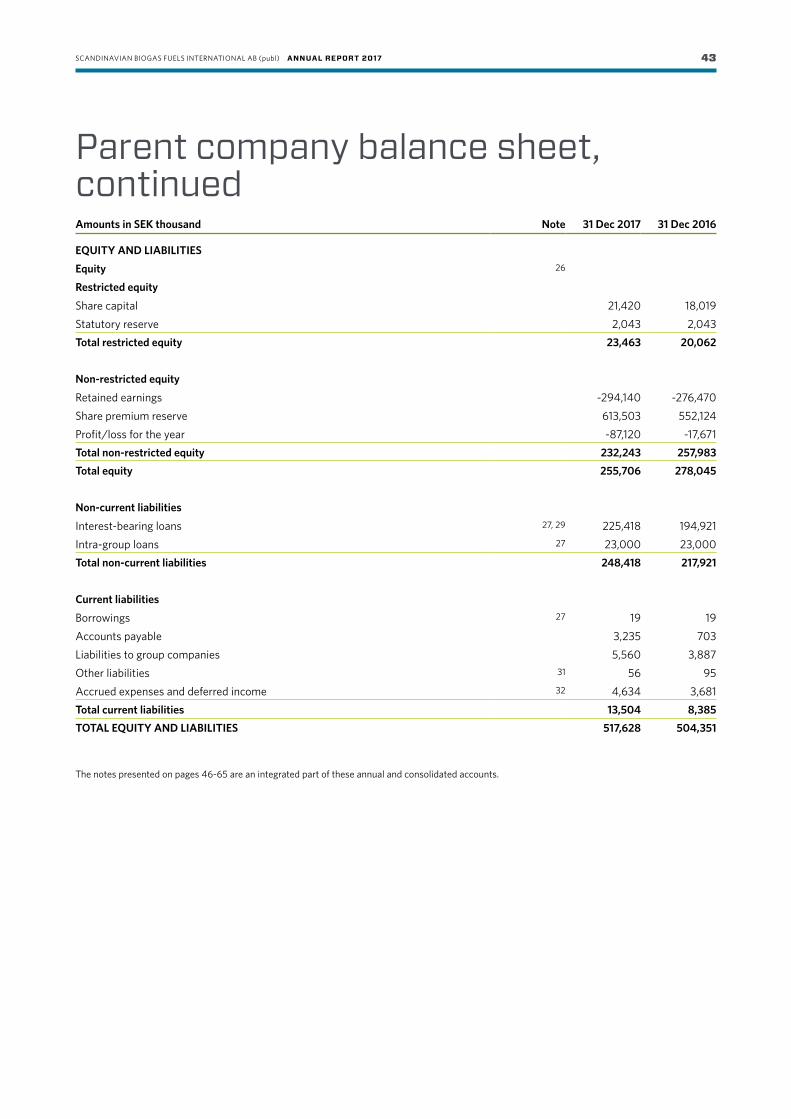
SCANDINAVIAN BIOGAS FUELS INTERNATIONAL AB (publ) ANNUAL REPORT 2017 43
Amounts in SEK thousand Note 31 Dec 2017 31 Dec 2016
EQUITY AND LIABILITIES Equity 26 Restricted equity
Share capital 21,420 18,019Statutory reserve 2,043 2,043Total restricted equity 23,463 20,062
Non-restricted equity
Retained earnings -294,140 -276,470Share premium reserve 613,503 552,124Profit/loss for the year -87,120 -17,671Total non-restricted equity 232,243 257,983Total equity 255,706 278,045
Non-current liabilities
Interest -bearing loans 27, 29 225,418 194,921Intra -group loans 27 23,000 23,000Total non-current liabilities 248,418 217,921
Current liabilities
Borrowings 27 19 19Accounts payable 3,235 703Liabilities to group companies 5,560 3,887Other liabilities 31 56 95Accrued expenses and deferred income 32 4,634 3,681Total current liabilities 13,504 8,385TOTAL EQUITY AND LIABILITIES 517,628 504,351
The notes presented on pages 46-65 are an integrated part of these annual and consolidated accounts.
Parent company balance sheet, continued
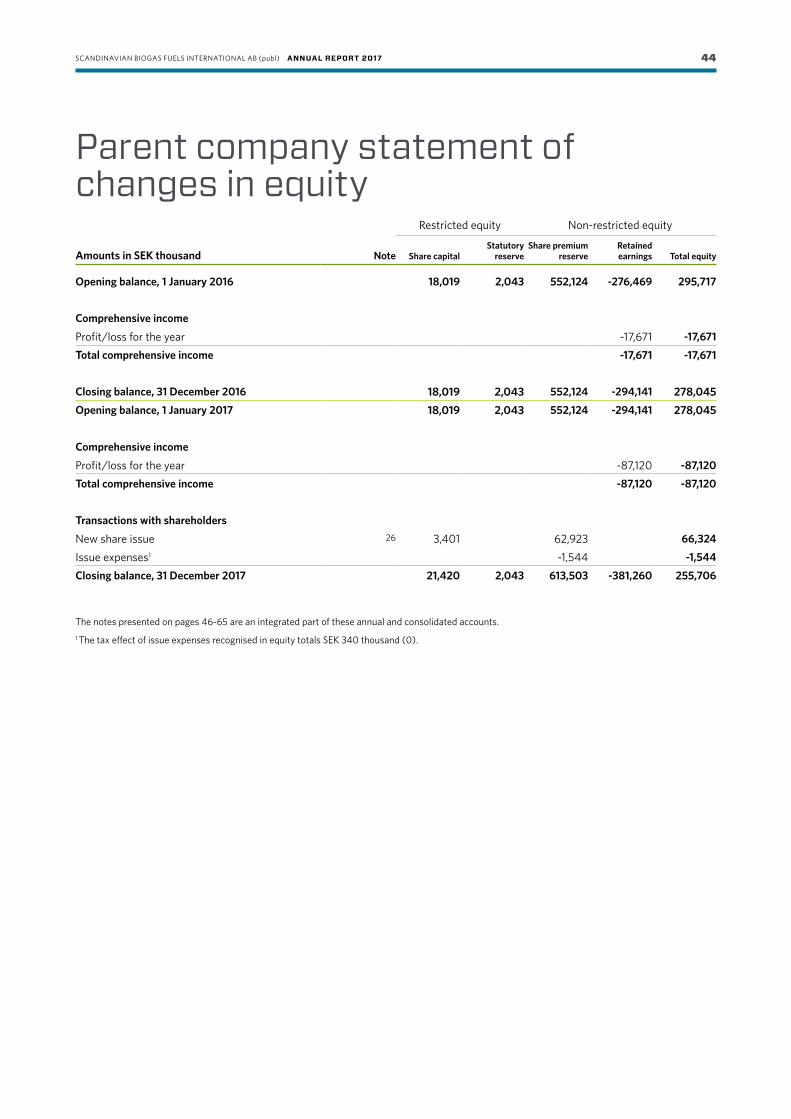
SCANDINAVIAN BIOGAS FUELS INTERNATIONAL AB (publ) ANNUAL REPORT 2017 44
Restricted equity Non -restricted equity
Amounts in SEK thousand Note Share capitalStatutory
reserveShare premium
reserveRetained earnings Total equity
Opening balance, 1 January 2016 18,019 2,043 552,124 -276,469 295,717
Comprehensive income
Profit/loss for the year -17,671 -17,671Total comprehensive income -17,671 -17,671
Closing balance, 31 December 2016 18,019 2,043 552,124 -294,141 278,045Opening balance, 1 January 2017 18,019 2,043 552,124 -294,141 278,045
Comprehensive income
Profit/loss for the year -87,120 -87,120Total comprehensive income -87,120 -87,120
Transactions with shareholders
New share issue 26 3,401 62,923 66,324
Issue expenses1 -1,544 -1,544Closing balance, 31 December 2017 21,420 2,043 613,503 -381,260 255,706
The notes presented on pages 46-65 are an integrated part of these annual and consolidated accounts.1 The tax effect of issue expenses recognised in equity totals SEK 340 thousand (0).
Parent company statement of changes in equity
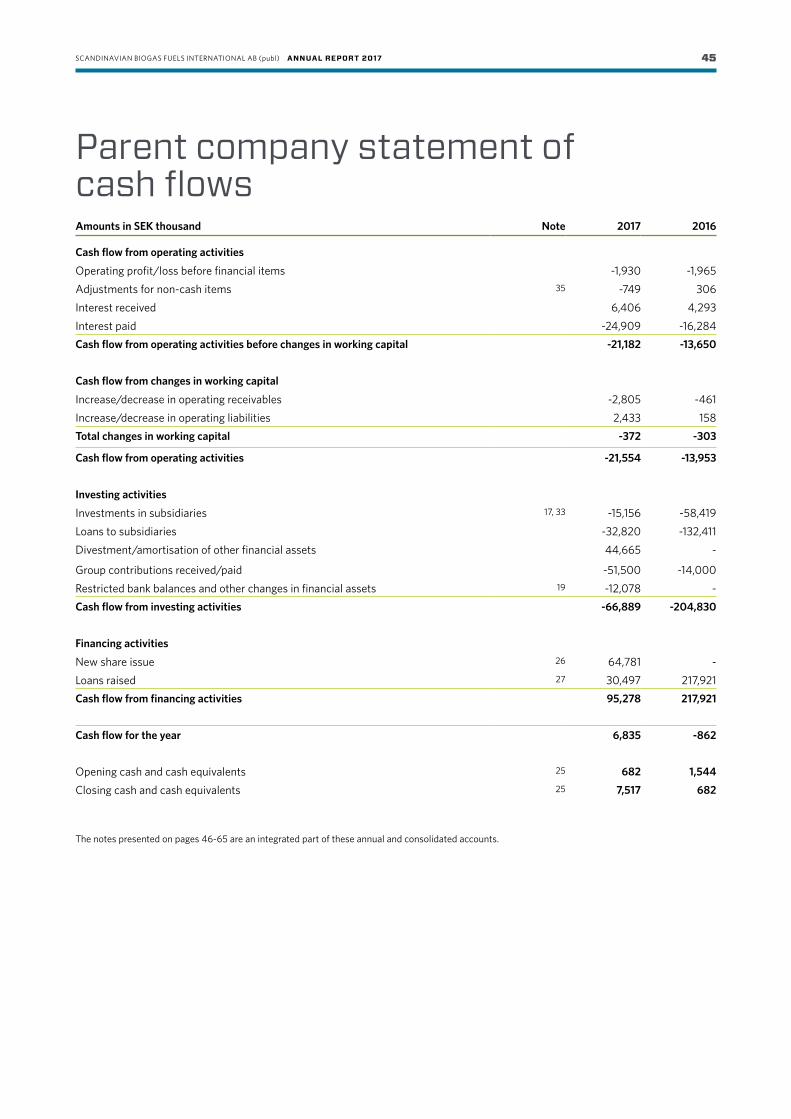
SCANDINAVIAN BIOGAS FUELS INTERNATIONAL AB (publ) ANNUAL REPORT 2017 45
Amounts in SEK thousand Note 2017 2016
Cash flow from operating activities Operating profit/loss before financial items -1,930 -1,965Adjustments for non- cash items 35 -749 306Interest received 6,406 4,293Interest paid -24,909 -16,284Cash flow from operating activities before changes in working capital -21,182 -13,650
Cash flow from changes in working capital Increase/decrease in operating receivables -2,805 -461Increase/decrease in operating liabilities 2,433 158Total changes in working capital -372 -303
Cash flow from operating activities -21,554 -13,953
Investing activities
Investments in subsidiaries 17, 33 -15,156 -58,419Loans to subsidiaries -32,820 -132,411Divestment/amortisation of other financial assets 44,665 -
Group contributions received/paid -51,500 -14,000Restricted bank balances and other changes in financial assets 19 -12,078 -Cash flow from investing activities -66,889 -204,830
Financing activities
New share issue 26 64,781 -Loans raised 27 30,497 217,921Cash flow from financing activities 95,278 217,921
Cash flow for the year 6,835 -862
Opening cash and cash equivalents 25 682 1,544
Closing cash and cash equivalents 25 7,517 682
The notes presented on pages 46-65 are an integrated part of these annual and consolidated accounts.
Parent company statement of cash flows

SCANDINAVIAN BIOGAS FUELS INTERNATIONAL AB (publ) ANNUAL REPORT 2017 46
Note 1 General informationScandinavian Biogas Fuels International AB (publ) is a public limited liabili-ty company and is registered in Stockholm, Sweden. The headquarters are located at Holländargatan 21A, SE 111 60, Stockholm, Sweden.
The board of directors approved the publication of the consolidated accounts and annual report on 27 February 2018.
Unless otherwise specified, all amounts are in SEK thousand. Figures in brackets pertain to the year-earlier period.
Note 2 Summary of key accounting principlesThe principal accounting policies applied in these consolidated accounts are set out below. These policies have been consistently applied to all years presented, unless otherwise stated. The consolidated accounts include Scandinavian Biogas Fuels International AB and its subsidiaries.
2.1 Basis of presentationThe consolidated accounts for Scandinavian Biogas Fuels International AB have been prepared in accordance with the Swedish Annual Accounts Act, RFR 1 'Supplementary Accounting Rules for Groups', and Interna-tional Financial Reporting Standards (IFRS) and interpretations by the IFRS Interpretations Committee (IFRS IC) as adopted by the EU. This is Scandinavian Biogas Fuels International AB’s sixth annual report prepared in accordance with the International Financial Reporting Standards (IFRS). The consolidated accounts have been prepared using the cost method.
The Parent Company’s financial statements are prepared in accordance with RFR 2 'Accounting for Legal Entities' and the Swedish Annual Ac-counts Act. In cases where the Parent Company applies other accounting principles than those applied by the Group, these are listed separately at the end of this note.
The preparation of financial statements in conformity with IFRS requires the use of certain significant estimates for accounting purposes. It also requires management to exercise its judgement in applying the Group’s accounting policies; see Note 4, Significant Estimates and Assessments.
2.1.1 Changes in accounting principles and disclosuresSince the start of the year, one subsidiary has changed its accounting principle pertaining to certain costs previously reported as raw materials and consumables, which are now reported as other external costs. In all other respects, accounting policies conform to those applied in the preceding financial year. Comparative figures for the previous year have not been restated; if they had been, raw materials and consumables would have been approximately SEK 6.8 million lower and other external costs higher by a corresponding amount.
New standards, amendments and interpretations applied by the GroupNo amended standards applicable during 2017 had a material impact on Scandinavian Biogas Fuels International AB’s accounting principles or disclosures.
New standards and interpretations not yet applied by the GroupA number of new standards and interpretations come into effect for financial years beginning after 1 January 2017 and were not applied when preparing these financial statements. Of these new standards and interpre-tations, it is primarily IFRS 9, IFRS 15 and IFRS 16 that may be expected to have a material impact on the Group’s financial statements.
IFRS 9 Financial Instruments covers the classification, valuation and reporting of financial assets and liabilities and introduces new rules for hedge accounting. The full version of IFRS 9 was issued in July 2014. It replaces the sections of IAS 39 covering classification and valuation of financial instruments and introduces a new impairment model.
There will be three valuation categories for financial assets: amortised cost, fair value through profit or loss, and fair value through comprehensive income. Classification of an instrument is determined by the company’s business model and the instrument’s characteristics. Investments in own
capital instruments will be recognised at fair value through comprehensive income, although there is also an option to recognise the instrument at fair value through profit or loss at initial recognition; in this case, there is no subsequent reclassification to the income statement when the instrument is sold. IFRS 9 also introduces a new model for calculating credit loss reserves, based on anticipated credit losses. There is no change to the classification and valuation of financial liabilities, except in cases where a liability is recognised at fair value through comprehensive income based on the fair value alternative. Changes in value attributable to changes in own credit risk will be reported in other comprehensive income.
IFRS 9 relaxes the requirements for application of hedge accounting by replacing the 80–125 criterion with requirements for the establishment of a financial relationship between hedging instrument and hedged item, and by stipulating that the hedging ratio must be the same as the figure applied in connection with risk management. There are also changes to hedging documentation, as compared with IAS 39 requirements. The standard is to be applied for financial years beginning on or after 1 January 2018, and the Group has elected not to apply the standard in advance. The Group has also elected to apply the simplification rule for trade receivables and con-tract assets. Accordingly, the Group will not be required to assess whether credit risk has increased since initial recognition, but can recognise a loss allowance corresponding to expected credit losses over the entire term of the financial asset.
The Group’s assessment is that IFRS 9 will not have an effect on the Group’s results or position. The Group’s financial assets are comprised solely of assets that will be classified at amortised cost and, based on current non-existent credit losses for these assets, a credit loss reserve is not deemed relevant.
IFRS 15 Revenue from contracts with customers regulates the manner in which revenue is recognised, replacing IAS 18 'Revenue', IAS 11 'Construction Contracts' and associated interpretations. The new standard introduces a new five-step model for revenue recognition based on when control of a good or service is transferred to the customer. The basic prin-ciple is that a company recognises revenue when (or as) the entity satisfies a performance obligation by transferring control of promised goods or services to a customer, at an amount that reflects that which the company expects to receive as compensation for the goods or services transferred. IFRS 15 introduces a five-step model:
Step 1 Identify the contract(s) with a customer Step 2 Identify the performance obligations in the contract Step 3 Determine the transaction price Step 4 Allocate the transaction price to the performance obligations in the contract Step 5 Recognise revenue when (or as) the entity satisfies a performance obligation
IFRS 15 provides additional guidance on and introduces increased disclosure requirements.
The Group has elected to apply the standard as from 1 January 2018 and not to apply the standard with full retroactivity. Under this method, adjustments are done only to contracts that are not completed prior to 1 January 2018, the effect of the transition is recognised in 2018 opening retained earnings, and comparative figures are not recalculated. Following a review of all significant customer contracts and application of the five-step model, the Group’s assessment is that IFRS 15 will not have any effect on the Group’s results or position, although it will entail substantially increased disclosure.
IFRS 16 Leases will replace IAS 17 'Leases'. Nearly all lease agreements will be recognised in the balance sheet, as distinction will no longer be made between operating and finance lease agreements. Under the new standard, an asset (the right to use a lease asset) and a financial obligation to pay leasing fees is recognised. Short-term leases and leases of low-value assets are excluded. The standard will mainly affect recognition of the Group’s operating lease agreements. The Group’s assessment is that IFRS 16 will involve recognition of a large number of the lease agreements currently recognised as operating leases (e.g., land and storage tank leases) as assets and liabilities as from 1 January 2019. This will result in a decrease in
Notes

SCANDINAVIAN BIOGAS FUELS INTERNATIONAL AB (publ) ANNUAL REPORT 2017 47
other external costs and an increase in amortisation and financial expense. The standard will also involve increased disclosure in the annual report. The Group will be applying a modified retroactive approach and does not intend to apply the standard in advance.
No other IFRS or IFRIC interpretations that are not yet effective are expected to have any significant impact on the Group.
2.2 Consolidated accountsA subsidiary is an entity over which the Group has the power to govern financial and operating policies (controlling interest) in a way normally associated with a shareholding of more than half of the voting rights. Subsidiaries are fully consolidated from the date on which control is transferred to the Group. A subsidiary is no longer consolidated from the date such control ceases.
The acquisition method is applied in reporting the Group’s business combinations. The purchase price for acquisition of a subsidiary is the fair value of transferred assets, liabilities and equity interests issued by the Group. The purchase price also includes the fair value of all assets and liabilities that are the result of an agreement on a conditional purchase price. Acquisition -related costs are expensed as incurred. Identifiable assets acquired and liabilities assumed in a business combination are initially measured at their fair values at the date of acquisition.
Intra -group transactions, balances and unrealised profit and loss on trans-actions between Group companies are eliminated. Accounting policies of subsidiaries have been changed where necessary to ensure consistent application of the Group’s policies.
2.3 Translation of foreign currencyFunctional currency and reporting currencyThe Group’s various units use local currency as functional currency, as local currency has been defined as the currency of the primary economic environment in which the entity mainly operates. The consolidated accounts are presented in Swedish Kronor (SEK), which is both the Parent Company’s functional currency and the Group’s presentation currency.
Transactions and balance sheet itemsForeign currency transactions are translated into functional currency using the exchange rates in effect on the transaction date. Exchange rate gains and losses resulting from the settlement of such transactions and from the translation of monetary assets and liabilities denominated in foreign currencies at the closing day rate are recognised in the income statement.
Translation of foreign Group companiesThe results and financial position of all Group entities with functional currency different from the reporting currency are translated into the reporting currency. Assets and liabilities from each entity’s balance sheet are translated from their functional currency into the Group’s reporting currency (Swedish Kronor) at the exchange rate in effect at the closing date. Revenues and expenses from each income statement are trans-lated to Swedish Kronor at the average exchange rates in effect at each transaction date. Exchange rate differences arising on translation of foreign operations are recognised in other comprehensive income.
2.4 Intangible assetsCapitalised expenditures for development and similar workCapitalised expenditures for development and similar work are comprised of internally developed intangible assets. The Scandinavian Biogas Fuels International Group engages in research and development. Research costs are expensed as research expenditures when incurred. Development ex-penditures or such costs incurred in the development phase of an internal project, which are directly attributable to the development and testing of the substrates from which biogas can be produced, are recognised as intangible assets when all criteria specified in IAS 38, p. 57, are satisfied.
Internally developed intangible assets are amortised on a straight- line basis over a 5 -10 year period.
Concessions and similar rightsThe subsidiary in Ulsan, South Korea has signed a service agreement that does not convey the right to control the use of the Company’s public ser-vice infrastructure. The Group recognises an intangible asset to the extent it is entitled to charge for the use of the public service (see also sub section
2.18, 'Service concession arrangements'). Amortisation is calculated over the contract period (i.e., 15- year period through March 2026) using the straight- line method.
GoodwillThe Group's goodwill is attributable to business combinations. The amount by which the purchase price exceeds the fair value of identifiable net assets acquired is reported as goodwill. If the amount is less than the fair value of the acquired subsidiary’s assets, in the event of a 'bargain purchase', the difference is recognised directly in the statement of comprehensive in come. The Group applies the 'partial goodwill' method in reporting good-will arising from business combinations; accordingly, goodwill is calculated as the difference between the purchase price paid and the Group’s share in identifiable acquired net assets. See Note 33, Business Combinations.
2.5 Tangible assets
Tangible assets are reported at cost of acquisition less depreciation. Cost of acquisition includes expenditures directly attributable to acquisition of the asset.
Subsequent costs are included in the asset’s carrying amount or recog-nised as a separate asset, as appropriate, only when it is probable that future economic benefits associated with the item will benefit the Group and the cost of the asset can be reliably measured. The carrying amount of a replaced part is removed from the balance sheet. All other repairs and maintenance are reported as expenses in the income statement during the period incurred.
Each part of a tangible asset with a cost of acquisition that is significant in relation to the asset’s total cost of acquisition is depreciated separately. Land and construction work in progress are not depreciated. Other assets are depreciated on a straight- line basis as follows:
Buildings 30 yearsPlant and machinery 10-30 yearsEquipment, tools, fixtures and fittings 3-5 years
The assets’ residual value and useful life are reviewed at each reporting date and adjusted if necessary. An asset’s carrying amount is immediately written down to its recoverable value if the carrying amount exceeds the estimated recoverable value. See also Note 4, Significant Estimates and Assessments.
Gains and losses on the disposal of tangible assets are determined by com-paring sale proceeds with the carrying amount and are recognised in other operating income and other operating expenses in the income statement.
Of total tangible and intangible assets of SEK 946.4 million (840.5), SEK 570.0 million (562.3) are located in Sweden, SEK 85.9 million (104.0) in South Korea, and SEK 290.5 million (174.3) in Norway.
2.6 Impairment of non-financial assetsAssets with an indefinite useful life (e.g., goodwill) are not written down but are tested annually for impairment. Assets are assessed for impair-ment whenever events or changes in circumstances indicate that the carry-ing amount may not be recoverable. An impairment loss is recognised as the amount by which the asset’s carrying amount exceeds its recoverable value. The recoverable value is an asset’s fair value less costs related to its sale or its value in use, whichever is greater. For purposes of assessing impairment, assets are grouped at the lowest levels for which there are separately identifiable cash flows (cash -generating units).
2.7 InventoriesInventories are comprised of granules and organic material substrates and are reported at acquisition cost or net realisable value, whichever is lower. Obsolescence risk is taken into account. Acquisition cost is calculated based on the first -in, first- out principle, and includes fees for bringing the goods to their present location and condition.
2.8 Financial instruments – generalFinancial instruments are included in several balance sheet items and are specified in sub sections 2.9 -2.12. Sub section 2.8 details the general rules applicable to financial instruments.

SCANDINAVIAN BIOGAS FUELS INTERNATIONAL AB (publ) ANNUAL REPORT 2017 48
2.8.1 ClassificationThe Group classifies its financial assets and liabilities in the following categories: financial assets and liabilities at fair value through the income statement; financial assets and liabilities at fair value through other com-prehensive income; loans and receivables; and other financial liabilities. Classification is based on the purpose for which the financial asset or liability was acquired. The Group has no assets or liabilities at fair value through the income statement for this or the previous financial year.
Financial assets and liabilities at fair value through other comprehensive income Non- monetary financial assets and liabilities are classified as financial assets and liabilities at fair value through other comprehensive income. An example of non- monetary financial assets and liabilities is the mandatory Severance Liability provision in South Korea.
Loans and receivablesLoans and receivables are non -derivative financial assets with fixed or determinable payments that are not quoted in an active market. They are included in current assets with the exception of items with maturities longer than 12 months after the balance sheet date, which are classified as non- current assets. Group loans and receivables are comprised of trade accounts receivable, cash and cash equivalents (see sub sections 2.9 and 2.10), and the financial instruments reported in other receivables.
Other financial liabilitiesGroup borrowings, loans from shareholders, convertible debt, trade accounts payable and the portion of other current liabilities relating to financial instruments are classified as other financial liabilities.
2.8.2 Reporting and valuation Purchases and sales of financial assets are recognised on the trade date, the date on which the Group commits to purchase or sell the asset. For all financial assets not carried at fair value through the income statement, financial instruments are initially recognised at fair value plus transaction costs. Financial assets are derecognised when the rights to receive cash flows from the instruments have expired or have been transferred and the Group has transferred substantially all risks and benefits of ownership. Financial liabilities are derecognised when the obligation in the agreement has been fulfilled or otherwise terminated.
Financial assets and liabilities at fair value through other comprehensive income are recognised with the application of the 'projected unit credit method'. The mandatory Severance Liability provision in South Korea is revalued to fair value through other comprehensive income pursuant to IAS 19, and other translation differences for non- monetary financial assets and liabilities are also valued at fair value through other comprehensive income.
Loans and receivables as well as other financial liabilities are carried at amortised cost after the acquisition date, applying the effective interest method.
2.8.3 Offsetting financial instrumentsFinancial assets and liabilities are offset and the net amount is presented in the balance sheet only when there is a legally enforceable right to offset the recognised amounts and an intention to adjust them on a net basis or to realise the asset and adjust the liability simultaneously.
2.8.4 Impairment of financial instruments
Assets carried at amortised cost (loans and receivables)
The Group assesses at the end of each reporting period whether there is objective evidence that a write -down is required for a financial asset or group of assets. A financial asset or group of assets is written down only if there is objective evidence that a write -down is required due to the occurrence of one or more events following initial recognition of the asset, which event(s) have an impact on estimated future cash flows for the financial asset or group of assets that can be reliably estimated.
Impairment is calculated as the difference between the asset’s carrying amount and the present value of estimated future cash flows, discounted at the financial asset’s original effective interest rate. The asset’s carrying
amount is written down and the impairment amount is recognised in the consolidated income statement within other external costs or net financial items, depending on which financial asset is impaired. If the write -down requirement decreases in a subsequent period and the decrease can be related objectively to an event occurring after the impairment was recog-nised, the reversal of the previously recognised impairment loss is reco g-nised in the consolidated income statement within other external costs or net financial items, depending on which financial asset was impaired.
2.9 Trade accounts receivableTrade accounts receivable are financial instruments comprised of amounts due from customers for goods and services sold in the ordinary course of business. Payments expected within a year or less are classified as current assets; other expected payments are reported as non- current assets.
Trade accounts receivable are initially recognised at fair value and subse-quently measured at amortised cost using the effective interest method, less any provisions for impairment.
2.10 Cash and cash equivalentsCash and cash equivalents are financial instruments and include cash and bank balances reported in the balance sheet and statement of cash flows. Restricted bank balances are not reported as cash and cash equivalents, but as financial assets or other current receivables, depending on when they are expected to be released.
2.11 Accounts payableAccounts payables are financial instruments and represent obligations to pay for goods and services acquired from suppliers in the ordinary course of business. Accounts payable are classified as current liabilities if payment is due within one year or less; otherwise, they are reported as non- current liabilities.
Accounts payable are recognised at nominal value. The carrying amount of accounts payable is assumed to approximate fair value, as this post is short -term in nature.
2.12 BorrowingsBorrowings and loans from shareholders are financial instruments and are initially recognised at fair value, net of transaction costs. Borrowings are sub-sequently stated at amortised cost, with any difference between the proceeds (net of transaction costs) and the redemption value recognised in the income statement over the term of the loan using the effective interest method.
Borrowings are classified as current liabilities unless the Group has an unconditional right to defer settlement of the liability for at least 12 months after the reporting period.
2.13 Borrowing costsGeneral and specific borrowing costs directly attributable to the acquisition, construction or production of qualifying assets (assets that necessarily take a substantial period of time to prepare for intended use or sale) are reported as part of such assets’ acquisition value. Capitalisation ceases when all activities necessary to prepare the asset for its intended use or sale are substantially completed.
Capitalisable borrowing costs are reduced by financial income arising from temporary investment of specifically borrowed capital pending use in the financing of the asset. All other borrowing costs are expensed as incurred.
2.14 Government grantsGovernment grants related to investments in plants, machinery and equipment are recognised as a liability until the corresponding investment cost has been incurred by the Company, after which the cost of acquisition for the relevant asset is reduced.
Government grants related to cost recovery are expensed and recognised as revenue in the income statement over the periods covered by the grants.
2.15 Current and deferred tax Tax expense for the year comprises current and deferred tax. Current tax expense is calculated based on tax provisions enacted or substantively enacted in the countries in which the Parent Company and its subsidiaries operate and generate taxable income.
SCANDINAVIAN BIOGAS FUELS INTERNATIONAL AB (publ) ANNUAL REPORT 2017 49
Deferred tax is recognised, using the liability method, on temporary differences arising between the tax base of assets and liabilities and their carrying amounts in the consolidated accounts. Deferred income tax is determined using tax rates enacted or substantively enacted as of the bal-ance sheet date and expected to be applicable when the related deferred income tax asset is realised or the deferred tax liability is paid.
Deferred tax assets on tax losses are recognised to the extent it is probable that future taxable profit will be available, against which the loss can be utilised.
Deferred tax assets and liabilities are offset when there is either a legally enforceable right to offset current tax assets against tax liabilities, or when the deferred tax assets and liabilities pertain to taxes levied by the same taxation authority on the same or different taxable entities and the intention is to settle the balances through net payments.
2.16 Employee benefitsPension commitmentsThe Group has defined contribution and defined benefit pension plans.
In Sweden, the Group’s primary defined contribution pension plan is the ITP1 plan, secured through fees to Alecta. The pension plan in Norway is similar to the plan in Sweden.
A defined contribution plan is a pension plan under which the Group pays fixed contributions to a separate legal entity. The Group has no legal or constructive obligations to pay further contributions if the legal entity does not hold sufficient assets to pay all employee benefits relating to employee service in current and prior periods.
For defined contribution plans, the Group pays contributions to publicly or privately administered pension insurance plans on a mandatory, contract-ual or voluntary basis. The Group has no further payment obligations once the contributions have been paid. The contributions are recognised as a personnel cost when they are due. Prepaid contributions are recognised as an asset to the extent that a cash refund or a reduction in future payments is available to the Group.
The Group has defined benefit plans in South Korea, where the employees are entitled to post -employment benefits based on final salary and length of employment.
Bonus plansThe Group recognises a liability and an expense for bonuses. The Group recognises a provision when there is a legal obligation or a constructive obligation to do so due to past practice.
2.17 Revenue recognition Revenues comprise the fair value of consideration received or receivable for goods sold in the Group’s operating activities. Revenues from the sale of goods mainly consist of the sale of biogas. Revenues are recognised net of VAT and discounts and after eliminating intra -group sales.
Revenues from the sale of goods are recognised when risks and rewards of ownership of the goods have passed to the buyer, which usually occurs in connection with delivery, and when the revenues and associated costs can be measured reliably and it is probable that the economic benefits associated with the sale of the units benefit the Group.
Revenues from services relate primarily to the collection of organic waste. Revenues from the sale of services are recognised over the period during which services are rendered. Revenue is calculated by determining the degree of completion of the specific transaction based on the amount of services rendered relative to total services to be performed.
2.18 Service concession arrangements The operations in South Korea have entered into service concession arrangements associated with the biogas plant there. As service concession arrangements do not transfer the right to control the use of the infrastructure for public services to the Group, infrastructure associated with these arrangements is not recognised as a tangible asset. Compen-sation received or receivable by the Group is recognised at fair value.
Compensation has been assessed as entitlement to an intangible asset, as the arrangement gives the Group the right (licence) to charge users for the public service.
2.19 LeasesThe Group holds operating leases, including for land, office space, cars, and storage tanks.
Leases in which a significant portion of the risks and rewards of ownership are retained by the lessor are classified as operating leases. Payments made under operating leases are charged to the income statement on a straight -line basis over the lease period.
The Group leases certain non- current assets. Leases of non -current assets in which the Group assumes substantially all of the risks and rewards of ownership are classified as finance leases.
Each finance lease payment comprises amortisation of the debt and financial charges. The corresponding payment obligations, net of financial charges, are included in the balance sheet items non -current borrowings and current borrowings. The interest element of the financial cost is recognised in the income statement over the lease period so that each accounting period is charged with an amount corresponding to a fixed interest rate for the balance of the liability. Non- current assets held under finance leases are depreciated over the asset's useful life or the lease term, whichever is shorter.
2.20 Cash flow statementThe cash flow statement is prepared using the indirect method. According-ly, operating income is adjusted for transactions that do not result in cash payments during the period and for any income or expense attributable to investment or financing activity cash flows.
2.21 Share capitalOrdinary shares are classified as equity. Transaction costs directly attributable to the issue of new shares or warrants are recognised in equity, net of tax, as a deduction from the issue proceeds.
2.22 Share-based benefitsThe Group has a share- based programme (warrants) in which payment is made with shares and under which the Company receives services from employees as consideration for the Group's own equity instruments (war-rants). The fair value of the service that entitles employees to allocation of warrants is expensed. The total amount to be expensed is based on the fair value of the warrants granted on the allocation date. As the programme is not combined with vesting conditions, the entire cost is recognised on the allocation date. When the warrants are exercised, the Company issues new shares. The proceeds received, net of any directly attributable transaction costs, are credited to share capital (nominal value) and other paid -in capital. The social fees generated by the programme are similarly charged to results on the allocation date.
2.23 Parent Company accounting principles The Parent Company applies accounting principles other than those applied by the Group as detailed below.
PresentationThe income statement and balance sheet follow the Swedish Annual Accounts Act. The statement of changes in equity also follows the Group’s table format but must contain the columns specified in the Annual Accounts Act. There are also differences in terminology, particularly in respect of financial income and expenses and equity.
Participations in subsidiariesParticipations in subsidiaries are recognised at cost after deduction for any impairment losses. Costs include acquisition- related expenses and any additional purchase consideration paid.
An estimate of recoverable amount is made when there is an indication that participations in subsidiaries have decreased in value. If this amount is lower than the carrying amount, a write -down is recognised and reported in profit/loss from participations in Group companies.
SCANDINAVIAN BIOGAS FUELS INTERNATIONAL AB (publ) ANNUAL REPORT 2017 50
Group contributionsGroup contributions are recognised as appropriations in the income statement.
Lease agreementsAll leases, regardless of whether they are finance or operating leases, are classified as operating lease agreements.
Financial instrumentsIAS 39 is not applied in the Parent Company, and financial instruments are valued at cost of acquisition.
Guarantee commitments/financial guaranteesThe Parent Company has signed guarantees on behalf of subsidiaries. Such commitments are classified under IFRS as financial guarantee contracts. For these agreements, the parent applies relaxation rules pursuant to RFR 2 (IAS 39, p. 2), and accordingly reports the surety as a contingent liability. A provision is made when the Parent Company believes that a payment will likely be required to settle an obligation.
Note 3 Financial risk management3.1 Financial risk factorsThrough its business activities, the Group is exposed to a variety of finan-cial risks: market risk (including currency risk and interest rate risk), credit risk and liquidity risk. The Group’s overall strategy focuses on reducing the potentially adverse effects on financial performance.
a) Market risk
(i) Currency riskScandinavian Biogas is exposed to currency risk given that the Company conducts transactions in foreign currencies (transaction risk) and has foreign subsidiaries (translation risk).
Transaction riskTransaction risk is the risk of impact on consolidated net income and cash flow due to changes to the value of commercial flows in foreign currencies following changes in exchange rates. The subsidiaries in South Korea and Norway use KRW and NOK, respectively, as accounting currency, but exposure is deemed negligible as revenue and expenses are in the same currency. The Group makes certain purchases in EUR but this does not present a significant currency risk, as it does not have any significant foreign currency transactions.
In 2017, exchange rate differences recognised in the consolidated income statement totalled SEK +1.0 million (+7.1). The Group has analysed its sen-sitivity to changes in exchange rates. If the Swedish Krona had weakened/ strengthened by one per cent against the USD, KRW and EUR, with all other variables held constant, net results for the year would have been SEK 1.9 million (2.2) higher/lower.
Translation riskThere is risk associated with the Group’s translation of the net assets of foreign subsidiaries to the consolidating currency, the Swedish Krona (SEK). The Group’s foreign subsidiaries are in South Korea (KRW) and Norway (NOK). The Group is also affected by the translation of foreign subsidiaries’ income statements into SEK. This exposure is not hedged.
The Group has analysed its sensitivity to changes in exchange rates. If the Swedish Krona had weakened/strengthened by one per cent against the KRW and NOK, with all other variables held constant, net results for the year would have been SEK 2.3 million (2.1) higher/lower.
(ii) Interest rate riskChanges in interest- bearing financial assets and liabilities held by the Group linked to market interest rates affect the results and cash flow from operations. Interest rate risk is the risk that changes in market interest rates may have an adverse impact on the Group’s net income. Borrowings issued at variable rates expose the Group to cash flow interest rate risk, which is partially offset by cash assets at floating rates. In 2017 and 2016, the Group’s borrowings at variable interest rates were in Swedish Kronor.
Of the Group’s total interest -bearing debt of SEK 791 million (641), SEK 226 million (108.5) is at a fixed interest rate and the remainder at a variable rate. The Group is therefore exposed to a certain amount of interest rate risk. The Group has cash and cash equivalents totalling SEK 866,885 thousand (73,871) at variable rates. The Group’s interest income is affected by the general interest rate climate.
Variable -rate liabilities as per the balance sheet date totalled SEK 564.7 million (532.2) and the Company’s cash and cash equivalents totalled SEK 86.9 million (73.9). A +/- one per cent change in interest rates would result in an impact on net interest income/expense of +/- SEK 5.6 million (5.3). An interest rate reduction produces a lower affect than an interest rate increase in SEK, as the rate on the corporate bond has a STIBOR floor of 0.00 per cent.
b) Credit riskCredit risk or counterparty risk is the risk that the counterparty to a finan cial transaction fails to fulfil its obligations when due. Scandinavian Biogas’s credit risk includes cash and cash equivalents, trade accounts re-ceivable and other receivables. With respect to cash and cash equivalents, credit risk is considered to be low given that counterparties are well-known banks with high credit ratings – such as Nordea (credit rating Aa3), Daegu Bank (credit rating A2) and Sparebank 1 SMN (credit rating A1) – for which loans to the Group are higher than deposits. Scandinavian Biogas deems credit risk to be low, as sales are made to large, stable customers with whom the Group has good WTP (willingness to pay) experience. The Group monitors customers’ credit ratings and reviews the terms of credit if necessary.
c) Liquidity riskLiquidity risk is the risk of the Group having insufficient funds to pay its financial liability obligations.
The objective of the Company’s liquidity management is to minimise the risk that the Group will not have sufficient cash to meet its commercial obligations. Cash flow forecasts are prepared regularly. Management closely monitors rolling forecasts of the Group’s liquidity reserve to ensure that the Group has sufficient cash resources to meet the needs of operating activities. Liquidity risks in the operating companies Scandi-navian Biogas Stockholm AB and Scandinavian Biogas Korea Co., Ltd. are considered minor, while the risk is higher in development company Scandinavian Biogas Fuels AB and in Scandinavian Biogas Södertörn AB.
The financing of existing projects and operations in the coming year will largely be resolved with equity. In order to arrange financing for future pro-jects and strengthen liquidity, the Group is looking at a number of different alternatives such as project financing, refinancing, listing of the Company's share, and other strategic and capital structure alternatives.
A number of capital adequacy requirements (covenants) are applicable to the Group’s borrowings. These are mainly comprised of requirements for financial key ratios such as profitability and equity/assets ratio, as well as requirements for cash -in -hand. The Group also has restricted bank deposits in Sweden and Norway. These are reported as other non current receivables in cases where the funds are restricted for more than one year; otherwise, they are reported as other receivables. Of the Group’s total borrowings of SEK 790.9 million (640.7), SEK 514.9 million (380.5) is subject to various capital adequacy requirements. There are no covenants for the Group’s finance leases.
At 31 December 2017 the Group’s liquid assets totalled SEK 86,885 thou-sand (73,871). The Group has no undrawn credit facilities. Other future liquidity pressures are the payment of accounts payable and other current liabilities and repayment of loans. The table below shows the contractual, undiscounted cash flows that comprise financial liabilities, broken down by duration on the balance sheet date to the contractual maturity date. The table includes future finance leases totalling SEK 12.4 million (17.8) which were not included in the balance sheet at the balance sheet date, due to the fact that the lease period does not commence until 2018. The Parent Company issued an SEK 200 million corporate bond in February 2016 and a subsequent bond of SEK 30 million in June 2017. The bonds have four-year durations and mature in February 2020.

SCANDINAVIAN BIOGAS FUELS INTERNATIONAL AB (publ) ANNUAL REPORT 2017 51
At 31 December 2017 (SEK thousand) < 1 year 1-2 years 2-5 years > 5 years
Borrowings 95,028 66,947 362,758 141,270Finance lease liabilities 21,456 23,902 70,327 254,566Other provisions 5,783 3,759 5,205 5,494Accounts payable 50,887 - - -Other current liabilities 176 - - -
At 31 December 2016
(SEK thousand) < 1 year 1-2 years 2-5 years > 5 years
Borrowings 45,941 87,360 292,679 80,549Finance lease liabilities 19,375 22,207 65,799 255,661Accounts payable 95,775 - - -Other current liabilities 124 - - -
3.2 Capital risk managementThe Group’s goal with regard to its capital structure is to safeguard the Group in its ability to continue its operations, in order to provide returns to shareholders and benefits for other stakeholders and to maintain an optimal capital structure to reduce the cost of capital.
3.3 Calculation of fair valueThe carrying value, less impairment provisions, of trade accounts receiv-able and other receivables and of accounts payable and other liabilities is assumed to correspond to their fair values, given that these items are short -term in nature.
Note 4 Significant estimates and assessments Estimates and assessments are evaluated regularly and are based on historical experience and other factors, including expectations of future events deemed reasonable under current conditions.
Significant estimates and assessments for accounting purposesThe Group makes estimates and assumptions about the future. The accounting estimates that result from these, by definition, seldom correspond to actual results. The estimates and assumptions that have a significant risk of material adjustments to the carrying values of assets and liabilities within the next financial year are outlined below.
Valuation of loss carry-forwardsThe Group reviews on an annual basis the appropriateness of capitalising deferred tax assets for the year’s tax loss carry -forwards. Deferred tax assets are only recognised for loss carry -forwards when it is probable they can be utilised against future taxable income and against temporary taxable differences. Loss carry -forwards in the Norwegian companies are valued upon determination that there is sufficient future profit to utilise them. No elements of the other loss carry -forwards have been valued, as it is not deemed that profits in the foreseeable future are likely to exceed the costs for development, commissioning of new investment projects and Group -wide functions. See Note 18, Deferred Tax.
GoodwillThe Group’s goodwill is derived from the acquisition of the Norwegian group and is considered to have an indefinite useful life. Impairment testing is conducted on a continuous basis through the Group’s review of future cash flows and determination of a number of estimates and assessments, mainly related to future biogas price and operating costs. As the facility in Norway is under construction, production and sales volumes are estimated based on previous experience, performance data from suppliers and management’s expectations for future market development. Cash flow forecasts are based on the approved budget and forecasts for the next five years. See Note 15, Intangible Assets.
Service concession arrangementsThe Group has service concession arrangements and, accordingly, an intangible asset (concession right) is recognised to the extent the Group is entitled to charge users of the public service. The intangible asset is
recognised based on the fair value of consideration the Group has received or will receive. Fair value was estimated at the present value of future cash flows the Group expects to receive from the concession rights. Assessment of expected future cash flows requires management to make estimates and assessments concerning the future, the most significant of which are future market price of liquid natural gas (LNG) and operating costs. See Note 15, Intangible Assets.
Valuation of tangible assetsImpairment testing of the Group’s facilities is conducted on a regular basis. Impairment testing is based on estimated future cash flows, with several assumptions applied in this assessment – the most significant of which are future production volumes, biogas price and operating costs. Each facility was assessed independently, excluding the two leased from Stockholm Vatten och Avfall (Bromma and Henriksdal), which were treated as a single cash-generating unit. See Note 16, Tangible Assets.
Penalty fee provisionA provision for the penalty fee in Ulsan City has been made in view of the upgrading issue at the plant in South Korea. The provision was calculated as the present value of the South Korean subsidiary's accumulated liability under the terms of the contract, as per the balance sheet date. An assess-ment of the probable amount of the penalty fee was made in calculating present value, which produced a discount rate of 25.48%. According to legal opinions from two leading South Korean law firms, the contractual amount is unreasonable and the penalty fee should be significantly lower – a maximum of 30 per cent of the contractual amount. Under the contract, the accumulated liability for the period November 2012 through December 2017 is to be amortised continuously through the end of the contractual period (i.e., for just over eight years). See also Note 28, Provisions.
Capitalised development costsThe Group recognises development costs that meet all criteria specified in IAS 38, p. 57, as intangible assets. Costs are primarily comprised of lab tests of various organic substrates and substrate combinations from which biogas can be produced and optimised. Capitalisation is only done on development costs for assets that the Group i) deems are technically possible to complete; ii) intends to complete; iii) deems are possible to use or sell; iv) deems will have the capacity to generate future financial advantages; v) deems there are sufficient technical, financial and other resources to complete; and vi) deems it is possible to reliably measure development costs. Estimates and assessments must be made in assessing which development costs to capitalise, based on expectations of future cash flows that the asset is expected to generate.
Investment in Biogas UpplandManagement has analysed the degree of influence the Group has over Biogas Uppland AB and has determined that the Group has control over operations. This determination was based on representation on the board and on contract terms, even though the Group holds a 50 per cent stake. The investment has therefore been classified as a subsidiary and has been consolidated.
Claims on subsidiaries in South KoreaIn the Swedish part of the Group there are claims on subsidiary Scandina-vian Biogas Korea Co., Ltd., denominated in USD and KRW. Exchange rate fluctuations in 2017 resulted in an unrealised exchange difference of SEK +1.1 million (+7.1). Given that debt is amortised pursuant to a fixed plan and is expected to be fully amortised by 2025, the Group has determined that this claim should not be seen as a net investment in the South Korean company. Accordingly, exchange rate fluctuations are recognised in net financial items and not, as otherwise would have been the case, in other comprehensive income.
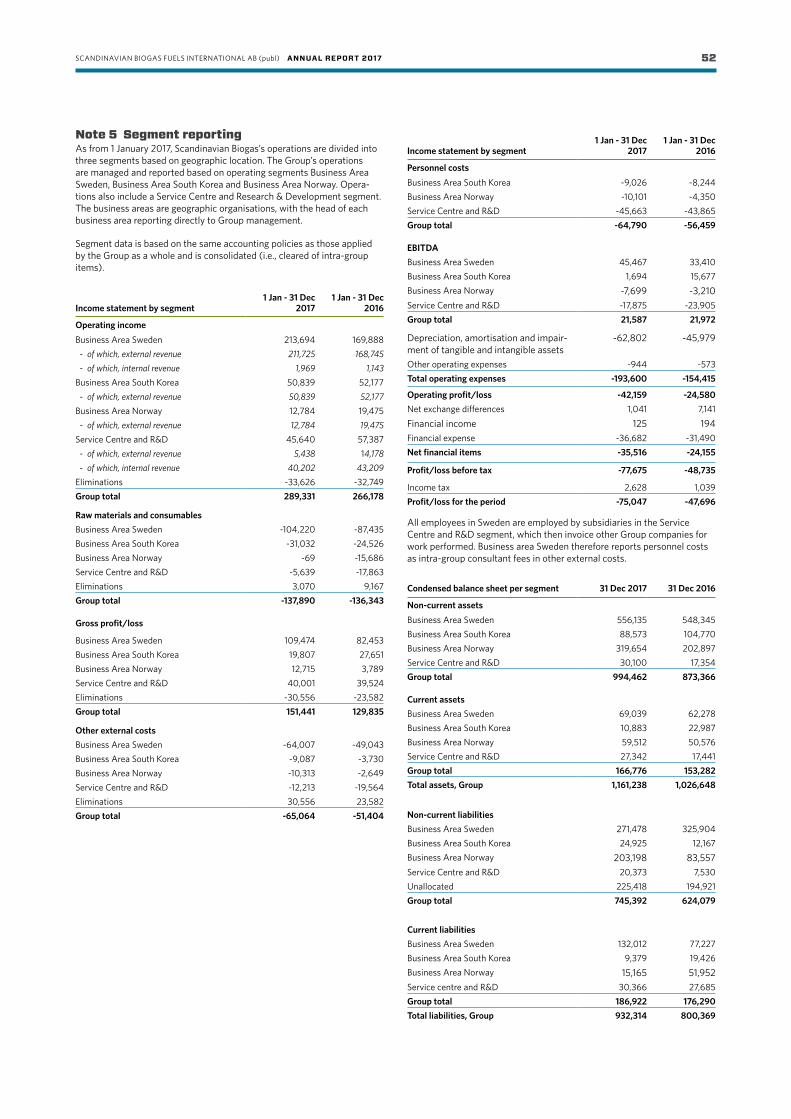
SCANDINAVIAN BIOGAS FUELS INTERNATIONAL AB (publ) ANNUAL REPORT 2017 52
Note 5 Segment reportingAs from 1 January 2017, Scandinavian Biogas’s operations are divided into three segments based on geographic location. The Group’s operations are managed and reported based on operating segments Business Area Sweden, Business Area South Korea and Business Area Norway. Opera-tions also include a Service Centre and Research & Development segment. The business areas are geographic organisations, with the head of each business area reporting directly to Group management.
Segment data is based on the same accounting policies as those applied by the Group as a whole and is consolidated (i.e., cleared of intra-group items).
Income statement by segment 1 Jan - 31 Dec
20171 Jan - 31 Dec
2016
Operating incomeBusiness Area Sweden 213,694 169,888 - of which, external revenue 211,725 168,745 - of which, internal revenue 1,969 1,143Business Area South Korea 50,839 52,177 - of which, external revenue 50,839 52,177Business Area Norway 12,784 19,475 - of which, external revenue 12,784 19,475Service Centre and R&D 45,640 57,387 - of which, external revenue 5,438 14,178 - of which, internal revenue 40,202 43,209Eliminations -33,626 -32,749Group total 289,331 266,178
Raw materials and consumablesBusiness Area Sweden -104,220 -87,435Business Area South Korea -31,032 -24,526Business Area Norway -69 -15,686Service Centre and R&D -5,639 -17,863Eliminations 3,070 9,167Group total -137,890 -136,343
Gross profit/loss
Business Area Sweden 109,474 82,453Business Area South Korea 19,807 27,651Business Area Norway 12,715 3,789Service Centre and R&D 40,001 39,524Eliminations -30,556 -23,582Group total 151,441 129,835
Other external costsBusiness Area Sweden -64,007 -49,043Business Area South Korea -9,087 -3,730Business Area Norway -10,313 -2,649Service Centre and R&D -12,213 -19,564Eliminations 30,556 23,582Group total -65,064 -51,404
Income statement by segment1 Jan - 31 Dec
20171 Jan - 31 Dec
2016
Personnel costsBusiness Area South Korea -9,026 -8,244Business Area Norway -10,101 -4,350Service Centre and R&D -45,663 -43,865Group total -64,790 -56,459
EBITDABusiness Area Sweden 45,467 33,410Business Area South Korea 1,694 15,677Business Area Norway -7,699 -3,210Service Centre and R&D -17,875 -23,905Group total 21,587 21,972
Depreciation, amortisation and impair-ment of tangible and intangible assets
-62,802 -45,979
Other operating expenses -944 -573Total operating expenses -193,600 -154,415
Operating profit/loss -42,159 -24,580Net exchange differences 1,041 7,141Financial income 125 194Financial expense -36,682 -31,490Net financial items -35,516 -24,155
Profit/loss before tax -77,675 -48,735
Income tax 2,628 1,039Profit/loss for the period -75,047 -47,696
All employees in Sweden are employed by subsidiaries in the Service Centre and R&D segment, which then invoice other Group companies for work performed. Business area Sweden therefore reports personnel costs as intra-group consultant fees in other external costs.
Condensed balance sheet per segment 31 Dec 2017 31 Dec 2016
Non-current assetsBusiness Area Sweden 556,135 548,345Business Area South Korea 88,573 104,770Business Area Norway 319,654 202,897Service Centre and R&D 30,100 17,354Group total 994,462 873,366
Current assetsBusiness Area Sweden 69,039 62,278Business Area South Korea 10,883 22,987Business Area Norway 59,512 50,576Service Centre and R&D 27,342 17,441Group total 166,776 153,282Total assets, Group 1,161,238 1,026,648
Non-current liabilitiesBusiness Area Sweden 271,478 325,904Business Area South Korea 24,925 12,167Business Area Norway 203,198 83,557Service Centre and R&D 20,373 7,530Unallocated 225,418 194,921Group total 745,392 624,079
Current liabilitiesBusiness Area Sweden 132,012 77,227Business Area South Korea 9,379 19,426Business Area Norway 15,165 51,952Service centre and R&D 30,366 27,685Group total 186,922 176,290Total liabilities, Group 932,314 800,369

SCANDINAVIAN BIOGAS FUELS INTERNATIONAL AB (publ) ANNUAL REPORT 2017 53
Note 6 Distribution of net salesNet sales are distributed by type of revenue as follows:
Group 2017 2016
Sale of goods, Sweden 182,874 146,783Sale of goods, South Korea 15,825 17,980Sale of goods, Norway - 14,982Sale of services, Sweden 21,596 17,969Sale of services, South Korea 35,015 34,196Sale of services, Norway 260 124Business- related re -invoicing, Sweden 2,793 10,576Group total 258,363 242,610
Parent Company 2017 2016
Sale of services 1,200 1,200Parent Company total 1,200 1,200
Business -related re -invoicing refers primarily to materials and consul-tant services purchased in the capacity as technical entrepreneur and re invoiced to external parties within the scope of various types of co- operation agreements.
Of the Group’s net sales of SEK 258.4 million (242.6), three individual customers account for SEK 88.4 million (71.9), SEK 35.0 million (34.2) and SEK 36.6 million (27.5), respectively. These customers account for 62 per cent (55) of the Group’s total net sales, of which 14 per cent (14) is attributable to South Korea and the remainder to Sweden. No other customers account for more than 10 per cent of sales.
Note 7 Parent Company sales to and purchases from Group companiesDuring the year the Parent Company invoiced subsidiaries SEK 1,792 thousand (2,046) for Group -wide services and purchased services from subsidiaries in the amount of SEK 17 thousand (0).
Note 8 Capitalised work on own accountThe Company capitalised staff costs related to work performed on new construction work in progress and on development projects. The costs capitalised relate to direct labour costs, social fees and a mark -up for other expenses.
Note 9 Remuneration to auditors An audit assignment refers to examination of the annual report and accounting records, the board and CEO’s administration of the Company, other duties resting with the Company’s auditors, and advisory services and other support arising in the course of such examination or perfor-mance of such other duties. Everything else is considered other services.
Group 2017 2016
PWC
Audit assignment 830 1,125 Audit work other than audit assignment 255 35 Tax consultancy 71 124 Other services 217 527Total 1,373 1,811
Other auditors Audit assignment 9 10 Tax consultancy 8 9 Other services 16 17Total 33 36Group total 1,406 1,847
Parent Company 2017 2016
PwC Audit assignment 360 586 Audit work other than audit assignment 242 11 Tax consultancy 4 14 Other services 69 256Total 675 868
During financial year 2017, Group payments to the audit firm and its network totalled SEK 1,373 thousand (of which SEK 918 thousand to the audit firm), distributed into the following categories:
• Audit assignment (SEK 830 thousand to audit firm and network, of which SEK 572 thousand to audit firm)
• Other statutory audit work (SEK 255 thousand to audit firm and network, of which SEK 242 thousand to audit firm)
• Tax consultancy (SEK 71 thousand to audit firm and network, of which SEK 33 thousand to audit firm)
• Valuation services (nil to audit firm and network, of which nil to audit firm)
Other services (SEK 217 thousand to audit firm and network, of which SEK 70 thousand to audit firm)
Note 10 Employee benefits, etc.Group 2017 2016
Salaries and other benefits 46,510 41,263Social fees 11,044 9,895Pension expenses – defined contribution plans 4,640 4,181Pension expenses – defined benefit plans 555 806Group total 62,749 56,145
Salaries, other benefits and payroll overhead
2017 2017 2016 2016
Salaries and other benefits
(of which, bonuses)
Social fees (of which,
pension costs)
Salaries and other benefits
(of which, bonuses)
Social fees (of which,
pension costs)
Board members, CEO and other senior executives
9,443 (-)
3,960 (1,695)
8,536 (623)
3,470 (1,590)
Other employees 37,067 (-)
12,279 (3,500)
32,727 (42)
11,412 (3,397)
Group total 46,510 (-)
16,239 (5,195)
41,263 (666)
14,882 (4,987)
No share options were distributed to board members or employees during this or the previous financial year.
Gender distribution – board members and other senior executives, Group (including subsidiaries)
2017 2017 2016 2016
No. on balance sheet date
Of which, women
No. on balance sheet date
Of which, women
Board members 6 1 7 1CEO and other senior executives 7 1 6 1Group total 13 2 13 2
Parent Company 2017 2016
Salaries and other benefits 684 687Social fees 135 125Parent Company total 820 811

SCANDINAVIAN BIOGAS FUELS INTERNATIONAL AB (publ) ANNUAL REPORT 2017 54
Salaries, other benefits and social fees
2017 2017 2016 2016
Salaries and other benefits
(of which, bonuses)
Social fees (of which, pension
costs)
Salaries and other benefits (of
which, bonuses)
Social fees (of which, pension
costs)
Board members, CEO and other senior executives
684 (-)
135 (-)
687 (-)
125 (-)
Other employees - - - -Parent Company total
684 (-)
135 (-)
687 (-)
125 (-)
Remuneration and other benefits, 2017Basic salary/director's fee
Variable remuneration Other benefits Pension costs
Other remuneration Total
Chairman Göran Persson 350 - - - - 350Board member Anders Bengtsson 75 - - - - 75Board member Andreas Ahlström 50 - - - - 50Board member Hans Hansson 65 - - - - 65Board member Sara Anderson 65 - - - - 65Board member Raif Nisametdin (17 Jan-17 Apr) 17 - - - - 17Board member David Schelin (17 May-17 Dec) 33 - - - - 33Board member Andreas Berg (17 Jan-17 Jul) 29 - - - - 29CEO Matti Vikkula 3,001 - 98 586 - 3,684Other senior executives (6 persons) 5,759 - 88 1,109 - 6,956Total 9,443 - 186 1,695 - 11,325
Remuneration and other benefits, 2016Basic salary/director's fee
Variable remuneration Other benefits Pension costs
Other remuneration Total
Chairman Göran Persson 350 - - - - 350Board member Anders Bengtsson 67 - - - - 67Board member Andreas Ahlström 50 - - - - 50Board member Hans Hansson 60 - - - - 60Board member Sara Anderson 60 - - - - 60Board member Peter Lönnblad (16 Jan-16 Apr) 17 - - - - 17Board member Raif Nisametdin (16 May-16 Dec) 33 - - - - 33Board member Andreas Berg 50 - - - - 50CEO Matti Vikkula 3,089 289 111 662 - 4,150Other senior executives (5 persons) 4,706 180 108 903 - 5,897Total 8,481 469 219 1,565 - 10,734
In the table above, salaries and other short -term benefits for the 2017 financial year include expensed bonuses to the CEO and other senior management of SEK 0 thousand (469).
The chairman, board members and members of the Audit Committee receive remuneration as determined by the Annual General Meeting. No specific payment is made for other committee work. With regard to Parent Company salaries and compensation, board -related expenses totalled SEK 820 thousand (811), while the subsidiaries’ other external expenses, totalling SEK 312 thousand (482), relate to consultancy fees to the employer of a board member.
Remuneration to senior executives Remuneration to the CEO and other senior executives is comprised of basic salary, variable remuneration, other benefits and financial instru-ments, etc. 'Other senior executives' are the individuals who, together with the CEO, comprise Group management. For management structure, see the Corporate Governance section of the Board of Directors' Report.
The CEO is entitled to 12 months’ salary in the event his employment is terminated by the Company. There are no other termination benefit agreements.
Board members and senior executives received the following remuneration:

SCANDINAVIAN BIOGAS FUELS INTERNATIONAL AB (publ) ANNUAL REPORT 2017 55
Average number of employees, by country
2017 2017 2016 2016
Average number of employees
Of which, women
Average number of employees
Of which, women
Sweden - - - -Parent Company total - - - -
Subsidiaries
Sweden 42.8 11.4 41.8 10.5South Korea 21.3 0.3 21.4 1.2Norway 9.6 1.4 5.0 1.0Total subsidiaries 73.7 13.1 68.2 12.7Group total 73.7 13.1 68.2 12.7
Gender distribution – board members and other senior executives, Parent Company
2017 2017 2016 2016
No. at balance sheet date
Of which, women
No. at balance sheet date
Of which, women
Board members 6 1 7 1CEO and other senior executives 1 - 1 -Parent Company total 7 1 8 1
Pension plans
Group 31 Dec 2017 31 Dec 2016
Obligations on the balance sheet for:Defined benefit pension plans -2,584 -3,342
Recognition in the income statement for:Costs for defined benefit pension plans 389 927
Costs for defined contribution pension plans 4,640 4,181Amounts reported in other comprehensive income
167 -121
Group 31 Dec 2017 31 Dec 2016
Present value of funded obligation -2,584 -3,342Unrecorded actuarial gains - - Net liability of funded obligations -2,584 -3,342
Change in the defined benefit obligation for the year:
Group 31 Dec 2017 31 Dec 2016
At beginning of the year 3,342 2,704Costs for employee service during the current year
476 742
Interest expense 79 65Actuarial losses(+)/gains( -) -167 121Exchange differences 45 178Benefits paid -1,191 -467At year-end 2,584 3,342
Amounts recognised in the income statement for defined benefit plans:
Group 31 Dec 2017 31 Dec 2016
Costs for employee service during the current year
476 742
Interest expense 79 65Actuarial gains/losses reported during the year -167 121Total 389 927
Principal actuarial assumptions:
Group 31 Dec 2017 31 Dec 2016
Discount rate 3.08% 2.35%Future salary increases 3% 3% Plan assets are comprised of:
Group 31 Dec 2017 31 Dec 2016
Other - -Total - -
Present value of defined benefit obligation -2,584 -3,342Fair value of plan assets - -Deficit -2,584 -3,342
Note 11 Other operating income and other operating expense
Group Parent Company
Other operating income 2017 2016 2017 2016
Exchange gains 881 560 - -Grants received 4,788 4,031 - -Non -business -related re -invoicing 8,589 2,827 592 846Other 869 21 2 -Total other operating income 15,127 7,439 594 846
Group Parent Company
Other operating expenses 2017 2016 2017 2016
Exchange losses 944 573 2 1Total other operating expenses 944 573 2 1
Note 12 Financial income and expense/Interest income and expense
Financial income/Interest income
Group Parent Company
2017 2016 2017 2016
Interest income on bank deposits 95 162 - -Interest income from Group companies - - 21,721 19,122Exchange gains 1,920 7,141 - 307Other financial income 21 32 - -Total financial income/ interest income
2,036 7,335 21,721 19,429
Financial expense/Interest expense
Group Parent Company
2017 2016 2017 2016
Impairment of participa-tions in Group companies - - 27,067 -Interest expense on borrowings 32,958 28,570 21,819 17,477Intra- group interest expense - - 2,274 2,087Exchange losses 870 - 749 -Other financial expense 3,724 2,920 3,502 1,571Total financial expense/ interest expense 37,552 31,490 55,411 21,135Total net financial items -35,516 -24,155 -33,690 -1,706
The Parent Company's impairment of participations in Group companies for the year are primarily due to the penalty fee in Ulsan.

SCANDINAVIAN BIOGAS FUELS INTERNATIONAL AB (publ) ANNUAL REPORT 2017 56
Note 13 Income tax/Tax on profit for the year
Group Parent Company
2017 2016 2017 2016
Current tax:Current tax on profit for the year - - - -Adjustments related to previous years
- - - -
Total current tax - - - -
Deferred tax (see Note 18):Accrual and reversal of temporary differences
2,628 1,039 - -
Total deferred tax 2,628 1,039 - -Income tax 2,628 1,039 - -
Income tax on profit differs from the theoretical amount that would have arisen if the weighted average tax rate on profit were applied to profits for the consolidated companies, as follows:
Group Parent Company
2017 2016 2017 2016
Profit/loss before tax -77,675 -48,735 -87,120 -17,671Tax calculated pursuant to appli-cable national tax rates on profit/loss before tax in each country 13,304 10,442 19,166 3,888Tax effects of:
Non -taxable income 68 1 340 -Non -deductible expense -45 -654 -5,955 -Tax losses for which no defer-red tax asset is recognised -10,699 -8,750 -13,551 -3,888
Tax revenue/expense 2,628 1,039 - -
The weighted average tax rate is 17.1% (21.4) for the Group and 22.0% (22.0) for the Parent Company.
Group Parent Company
Income tax recognised in equity during the year: 2017 2016 2017 2016
Current tax:Issue expenses - - - -
Deferred tax: Issue expenses 340 - 340 -
Total income tax recognised in equity
340 - 340 -
Note 14 Exchange differencesExchange differences are recognised in the income statement as follows:
Group Parent Company
2017 2016 2017 2016
Exchange differences in operating profit/loss -63 -13 -2 -1Exchanges differences in net financial items 1,050 7,141 -749 307Total exchange differences in the income statement
987 7 128 -751 306
Amounts reported in other compre-hensive income
-2,394 3,325 - -
Note 15 Intangible assets
Group Goodwill
Capitalised development
costs
Concessions and similar
rightsPatents and
licences Total
At 1 January 2016 Cost of acquisition - 9,136 187,406 4,724 201,266
Accumulated amortisa-tion and impairment - -1,897 -78,587 -4,558 -85,042
Closing carrying amount - 7,239 108,819 166 116,224
Financial year 2016
Opening carrying amount - 7,239 108,819 166 116,224
Purchases/ reprocessing - 2,100 73 - 2,173
Reclassifications - 5,221 - - 5,221
Acquisition of subsidiaries 6,420 - - - 6,420
Translation differences 387 - 6,298 - 6,685
Amortisation - -1,088 -11,476 -40 -12,604
Closing carrying amount 6,807 13,472 103,714 126 124,119
At 31 December 2016
Cost of acquisition 6,807 16,457 197,422 4,724 225,410
Accumulated amortisa-tion and impairment - -2,985 -93,708 -4,598 -101,291
Closing carrying amount 6,807 13,472 103,714 126 124,119
Financial year 2017
Opening carrying amount 6,807 13,472 103,714 126 124,119
Purchases/ reprocessing - 2,216 - - 2,216
Reclassifications - - - 22 22
Translation differences -341 - 5,488 - 5,147
Amortisation - -1,409 -11,724 -44 -13,177
Impairment - - -11,992 - -11,992
Closing carrying amount 6,466 14,279 85,486 104 106,335
At 31 December 2017
Cost of acquisition 6,466 18,673 208,655 4,747 238,541
Accumulated amortisa-tion and impairment - -4,394 -123,169 -4,643 -132,206
Closing carrying amount 6,466 14,279 85,486 104 106,335
The total amount for research and development expensed during the period was SEK 3,098 thousand (2,170).
Based on the results of an impairment test of goodwill, it was deemed that there was no write -down requirements during the financial year. The Group conducted a sensitivity analysis against changes in the impairment test. If the cost of capital had been 0.5 percentage point higher and profitability (EBITDA margin) one percentage point lower, with all other variables held constant, there would nonetheless have been no write- down requirement for goodwill. The cost of capital, produced by an external party, is based on assessments of weighted return requirements for interest-bearing liabilities and equity in proportion to estimated percentage in an optimal industrial capital structure. A 2 per cent long -term growth rate and a 10.5 per cent cost of capital were used in this year’s impairment testing of goodwill. The Group's goodwill is attributable to Business Area Norway.

SCANDINAVIAN BIOGAS FUELS INTERNATIONAL AB (publ) ANNUAL REPORT 2017 57
Based on the results of an impariment test of the concession right, it was deemed that there was a write- down requirement during the financial year; see also Note 4, Significant Estimates and Assessments. The Group conducted a sensitivity analysis against changes in the impairment test. If the cost of capital had been 0.5 percentage point higher and profitability (EBITDA margin) one percentage point lower, with all other variables held constant, the write-down requirement for the concession right would have been SEK 2 million higher. The year’s write -down for the concession right is mainly attributable to the penalty fee in Ulsan; see also Note 28, Provisions. The cost of capital, produced by an external party, is based on assessments of weighted return requirements for interest-bearing liabilities and equity in proportion to estimated percentage in an optimal industrial capital structure. A 2.5 per cent long-term growth rate and a 19.23 per cent cost of capital were used in this year’s impairment testing of the concession right. The latter includes a risk component corresponding to 5.93 percentage points, due to uncertainties surrounding the penalty fee and disputed service costs. Based on legal opinions from two leading South Korean law firms, which maintain that the contractual penalty fee amount is unreasonably high, the assessment of future cash flow includes payment of the full penalty fee for the coming 18 months and thereafter 30 per cent of the penalty fee. Based on the legal opinion of a leading South Korean law firm, payment to Ulsan City for the disputed service costs is not included. Pursuant to court decision, the service costs do not need to be paid prior to resolution of the dispute. The write-down would be SEK 33.2 million higher in the event the Company does not prevail in either lawsuit. The concession right is attributable to Business Area South Korea.
Note 16 Tangible assets
Group Buildings and land
Plant and machinery
Equipment, tools,
fixtures and fittings
Construc-tion work in
progress Total
At 1 January 2016 Cost of acquisition 176,019 277,734 16,460 161,416 631,630Accumulated depreci-ation and impairment -19,010 -31,613 -12,350 -37,383 -100,356Carrying amount 157,009 246,121 4,111 124,033 531,274 Financial year 2016Opening carrying amount 157,009 246,121 4,111 124,033 531,274Acquisition - 5,159 1,681 256,712 263,552Capitalisation 48,480 37,899 9,820 -96,199 -Advances paid - - - -57,425 -57,425Capitalised interest - - - 10,249 10,249Acquisition of subsidiaries - - 12 7,339 7,351Reclassifications - - - -5,221 -5,221Translation differences - - 8 - 8Depreciation -8,665 -22,027 -2,681 - -33,373Closing carrying amount 196,824 267,152 12,951 239,488 716,415 At 31 December 2016Cost of acquisition 224,499 320,792 27,958 277,129 850,378Accumulated depreci-ation and impairment -27,675 -53,640 -15,007 -37,641 -133,962Carrying amount 196,824 267,152 12,951 239,488 716,415
Financial year 2017Opening carrying amount 196,824 267,152 12,951 239,488 716,415Acquisition 2,952 13,809 1,492 171,829 190,083Capitalisation 4,092 31,683 - -35,775 -Advances received - - - -25,487 -25,487Capitalised interest - - - 16,444 16,444Late penalty - - - -10,566 -10,566Sale and disposal - - -465 - -465Reclassifications - - -22 - -22Translation differences - - 3 -8,744 -8,741Depreciation -9,196 -25,276 -3,163 - -37,635Closing carrying amount 194,672 287,368 10,797 347,189 840,026 At 31 December 2017Cost of acquisition 231,543 366,284 28,284 384,911 1,011,023Accumulated depreci-ation and impairment -36,871 -78,916 -17,487 -37,722 -170,997Carrying amount 194,672 287,368 10,797 347,189 840,026
Construction work in progress as at 31 December 2017 is mainly compri-sed of investments in the plant in Norway.
During the year the Group capitalised borrowing fees of SEK 16,444 thousand (10,249) on qualifying assets in the form of construction work in progress.
Based on the results of impairment tests, it was deemed that there was no write -down requirement for tangible assets during the financial year; see also Note 4, Significant Estimates and Assessments. The Group conducted a sensitivity analysis against changes in the impairment test. If the cost of capital had been 0.5 percentage point higher and profitability (EBITDA margin) one percentage point lower, with all other variables held constant, the year’s write- down would have been SEK 15.4 million for the ongoing project in Norway and SEK 11.1 million for the plant at Södertörn. There would have been no write- down requirement for the plants at Henriksdal or Bromma.
A cost of capital of 10.5 per cent for Sweden and Norway and of 13.3 per cent for South Korea was used in this year’s assessment. The cost of capital is based on assessments of weighted return requirements for interest-bearing liabilities and equity in proportion to estimated percentage in an optimal industrial capital structure.
Tangible assets include objects leased by the Group through finance lease agreements at the following amounts:
2017 2016
Buildings and land 114,515 116,685
Plant and machinery 116,356 113,148
Equipment, tools, fixtures and fittings 7,878 10,588
Construction work in progress 6,974 6,971Carrying amount 245,723 247,392

SCANDINAVIAN BIOGAS FUELS INTERNATIONAL AB (publ) ANNUAL REPORT 2017 58
Note 17 Participations in Group companies
Parent Company 31 Dec 2017 31 Dec 2016
Accumulated cost
Opening cost of acquisition 591,304 532,885
Acquisitions during the year 15,156 58,419606,460 591,304
Accumulated impairmentOpening balance -403,494 -403,494
Impairment for the year -27,067 --430,561 -403,494
Closing carrying amount at year-end 175,899 187,810
Acquisitions during the year pertain to a share issue conducted by a Nor-wegian subsidiary, which contributed SEK 15.1 million from non-controlling interests. Impairment for the year pertains mainly to the penalty fee in Ulsan; see Note 28, Provisions.
The Parent Company holds shares in the following subsidiaries:
Name Corp. reg. no. DomicileShare of equity/
Share of votes No. of shares Carrying amount 31 Dec 2017 31 Dec 2016
Direct holdingsScandinavian Biogas Fuels AB 556691-9196 Stockholm 100 % 166,667 274 27,341Scandinavian Biogas Sweden AB 556807-2986 Stockholm 100 % 50,000 102,050 102,050Biokraft Holding AS 916683405 Trondheim (Norway) 50.03 % 38,214,996 73,575 58,419
Indirect holdingsBiogas Uppland AB 556636-0227 Uppsala 50 %Scandinavian Biogas Södertörn AB 556712-1735 Stockholm 100 %Scandinavian Biogas Fuels i Varberg AB 556748-8357 Varberg 100 %Scandinavian Biogas Korea Co., Ltd. 610-84-00961 Ulsan (South Korea) 82.17 %Scandinavian Biogas Korea Co., Ltd. 285011-0174239 Seoul (South Korea) 90 %Scandinavian Biogas Stockholm AB 556489-7899 Stockholm 100 %Scandinavian Biogas Recycling AB 556934-4384 Stockholm 60 %Biokraft AS 894625902 Trondheim (Norway) 50.03 %Total 175,899 187,810
Significant subsidiaries and their activitiesScandinavian Biogas Fuels AB designs biogas facilities, with a major focus on optimising production and conducting research in the biogas field. Scandina-vian Biogas Fuels AB also has a branch office in Norway with the same name, corporate ID number 917 357 420.
Scandinavian Biogas Korea Co., Ltd. operates a plant in Ulsan, South Korea that produces raw gas, primarily from food waste. Revenues are generated by gate fees (i.e., payment for receiving waste) and from gas sales.
Scandinavian Biogas Stockholm AB’s operations comprise the production and trade of upgraded biogas.
Scandinavian Biogas Södertörn AB (SBSö) and Scandinavian Biogas Recycling AB (SBR) work in close collaboration, with their overall business encompas-sing the entire biogas production process. SBR is responsible for pre treatment and SBSö for the digestion, upgrading and management of digestate.
In early 2016, 50.03 per cent of the shares were acquired in Norwegian company Biokraft Holding AS, which owns 100 per cent of the shares in Biokraft AS. Biokraft AS has initiated an investment in an LBG production facility in Skogn, Norway, which will have an estimated production capacity of 120 GWh at full capacity.
All subsidiaries are consolidated in the Group. The share of voting power in subsidiaries directly owned by the Parent Company does not differ from the share of ordinary shares owned.
Biogas Uppland AB is consolidated, given that Scandinavian Biogas Fuels AB is entitled to appoint the chairman who in turn holds the casting vote. Accor-dingly, Scandinavian Biogas Fuels is deemed to have control over Biogas Uppland.
The total ownership of non- controlling interests for the period amounted to SEK 59,544 thousand (53,962), of which SEK 61,970 thousand (52,957) is attributable to the Biokraft Group in Norway. Holdings of non -controlling interests in the remaining subsidiaries with minority shareholders are insignificant.
Significant constraintsThere are no significant constraints within the Group other than certain restrictions in moving capital between subsidiaries due to loan agreement regulations, etc.
Summary of financial information on subsidiaries with significant non-controlling interests A summary of financial information for each subsidiary with significant non- controlling interests is presented below. Amounts are presented before intra- group eliminations.

SCANDINAVIAN BIOGAS FUELS INTERNATIONAL AB (publ) ANNUAL REPORT 2017 59
Summary from the balance sheet
Biokraft Group 2017 2016
Non -current assets 319,713 202,926Current assets 59,515 50,580Total assets 379,228 253,506Non -current liabilities 239,813 94,681Current liabilities 15,400 52,846Total liabilities 255,213 147,527Net assets 124,015 105,979
Summary of information on earnings and comprehensive income
Biokraft Group 2017 2016
Revenue 12,784 19,475Profit/loss for the year -6,892 -2,550Total comprehensive income for the year -9,923 3,605Total comprehensive income attributable to non-controlling interests -4,959 1,801
Summary of cash flow statement
Biokraft Group 2017 2016
Cash flow from operating activities
Cash flow from operations -7,276 -3,534Interest paid 52 46Total change in working capital -3,335 23,605Cash flow from operating activities -10,559 20,117Cash flow from investing activities -151,578 -181,940Cash flow from financing activities 165,024 77,482Decrease/increase in cash and cash equivalents 2,887 -84,341Cash and cash equivalents at beginning of the year
23,172 101,393
Exchange rate difference in cash and cash equivalents
-1,162 6,120
Cash and cash equivalents at year-end 24,897 23,172
Note 18 Deferred taxGroup Parent Company
2017 2016 2017 2016
Deferred tax expense, temporary differences
-133 -404 - -
Deferred tax revenue, temporary differences
2,761 1,443 - -
Total deferred tax in the income statement
2,628 1,039 - -
Deferred tax assets 31 Dec 2017 31 Dec 2016
Deferred tax assets to be utilised after 12 months 9,930 7,601Deferred tax assets to be utilised within 12 months
- -
Total deferred tax assets 9,930 7,601
Deferred tax liabilities 31 Dec 2017 31 Dec 2016
Deferred tax liabilities to be utilised after 12 months
2,101 1,968
Deferred tax liabilities to be utilised within 12 months
- -
Total deferred tax liabilities 2,101 1,968
Deferred tax liabilities/assets (net) 7,829 5,633
Changes in deferred tax assets and liabilities during the year as reported in the income statement, without taking into account set -offs made in the same fiscal jurisdiction, are presented below.
Deferred tax liabilities 31 Dec 2017 31 Dec 2016
At 1 January 1,968 1,564
Development costs 104 404Finance leases 29 -At 31 December 2,101 1,968
Deferred tax assets 31 Dec 2017 31 Dec 2016
At 1 January 7,601 -
Acquisition of subsidiaries - 5,765Deferred tax on net results for the year in Norwegian subsidiaries
1,650 1,415
Intra- group profit in non- current assets 17 28Finance leases 1,093 -Translation difference -431 393At 31 December 9,930 7,601
Deferred tax assets are reported for tax loss carry -forwards to the extent it is likely they can be utilised against future taxable profit. Loss carry- forwards do not expire at any given date, with the exception of the South Korean loss carry -forward which expires after 10 years
Deferred tax assets are mainly attributable to the Norwegian subsidiaries. An assessment has been made that operations in Norway will generate a taxable surplus in the foreseeable future, while within other operations there remain significant deficits that are not expected with any reasonable certainty to be covered by surpluses in the foreseeable future. Loss carry-forwards for which deferred tax assets have not been capitalised total SEK 390 million (352).
Note 19 Other non-current receivables
Group 31 Dec 2017 31 Dec 2016
Restricted bank balances 32,462 21,094Other 3,487 1,470Group total 35,949 22,564
Parent Company 31 Dec 2017 31 Dec 2016
Restricted bank balances 12,078 -
Parent Company total 12,078 -
Note 20 Other non-current assets
Group 31 Dec 2017 31 Dec 2016
Accumulated cost:
At beginning of the year 2,667 3,111 Deductible portion -445 -444Carrying amount at year-end 2,222 2,667
Non -current prepaid expenses pertain to a renegotiation fee expensed over the term of the agreement (9 years).
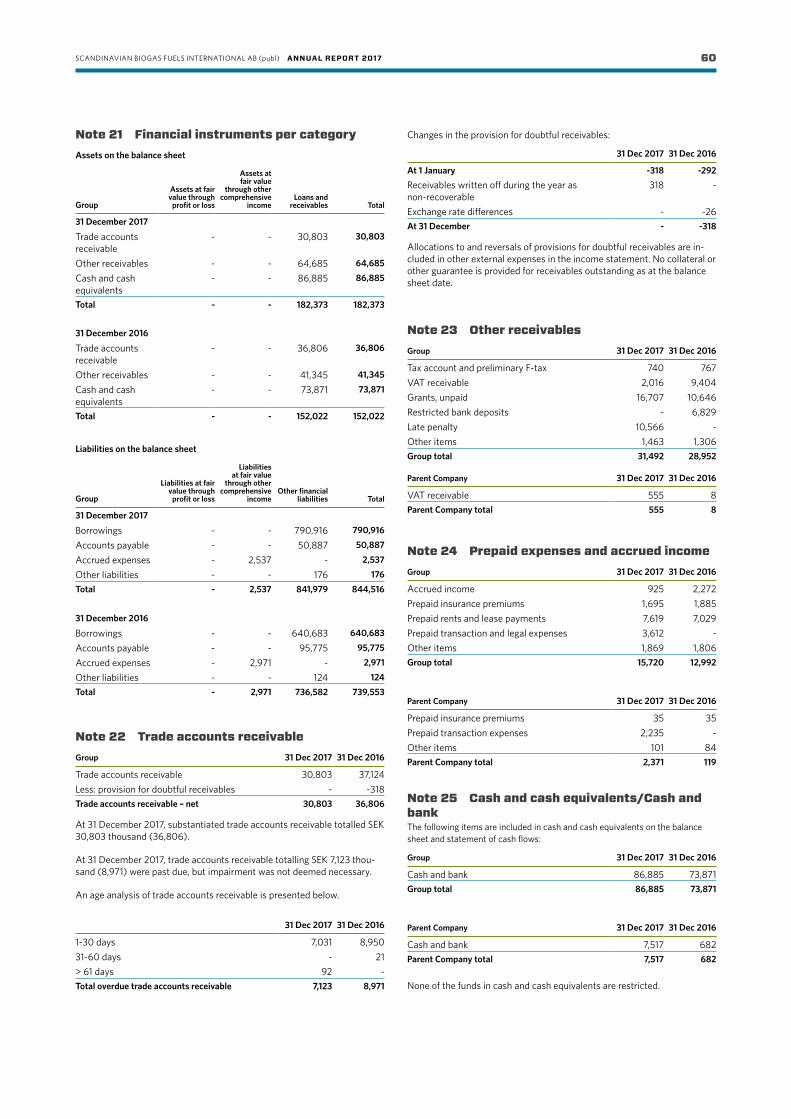
SCANDINAVIAN BIOGAS FUELS INTERNATIONAL AB (publ) ANNUAL REPORT 2017 60
Note 21 Financial instruments per categoryAssets on the balance sheet
Group
Assets at fair value through
profit or loss
Assets at fair value
through other comprehensive
incomeLoans and
receivables Total
31 December 2017
Trade accounts receivable
- - 30,803 30,803
Other receivables - - 64,685 64,685
Cash and cash equivalents
- - 86,885 86,885
Total - - 182,373 182,373
31 December 2016
Trade accounts receivable
- - 36,806 36,806
Other receivables - - 41,345 41,345
Cash and cash equivalents
- - 73,871 73,871
Total - - 152,022 152,022
Liabilities on the balance sheet
Group
Liabilities at fair value through
profit or loss
Liabilities at fair value
through other comprehensive
incomeOther financial
liabilities Total
31 December 2017
Borrowings - - 790,916 790,916
Accounts payable - - 50,887 50,887
Accrued expenses - 2,537 - 2,537
Other liabilities - - 176 176Total - 2,537 841,979 844,516
31 December 2016
Borrowings - - 640,683 640,683
Accounts payable - - 95,775 95,775
Accrued expenses - 2,971 - 2,971
Other liabilities - - 124 124Total - 2,971 736,582 739,553
Note 22 Trade accounts receivableGroup 31 Dec 2017 31 Dec 2016
Trade accounts receivable 30,803 37,124Less: provision for doubtful receivables - -318Trade accounts receivable – net 30,803 36,806
At 31 December 2017, substantiated trade accounts receivable totalled SEK 30,803 thousand (36,806).
At 31 December 2017, trade accounts receivable totalling SEK 7,123 thou-sand (8,971) were past due, but impairment was not deemed necessary.
An age analysis of trade accounts receivable is presented below.
31 Dec 2017 31 Dec 2016
1-30 days 7,031 8,95031-60 days - 21> 61 days 92 -Total overdue trade accounts receivable 7,123 8,971
Changes in the provision for doubtful receivables:
31 Dec 2017 31 Dec 2016
At 1 January -318 -292Receivables written off during the year as non-recoverable
318 -
Exchange rate differences - -26At 31 December - -318
Allocations to and reversals of provisions for doubtful receivables are in-cluded in other external expenses in the income statement. No collateral or other guarantee is provided for receivables outstanding as at the balance sheet date.
Note 23 Other receivablesGroup 31 Dec 2017 31 Dec 2016
Tax account and preliminary F -tax 740 767VAT receivable 2,016 9,404Grants, unpaid 16,707 10,646Restricted bank deposits - 6,829Late penalty 10,566 -Other items 1,463 1,306Group total 31,492 28,952
Parent Company 31 Dec 2017 31 Dec 2016
VAT receivable 555 8Parent Company total 555 8
Note 24 Prepaid expenses and accrued incomeGroup 31 Dec 2017 31 Dec 2016
Accrued income 925 2,272Prepaid insurance premiums 1,695 1,885Prepaid rents and lease payments 7,619 7,029Prepaid transaction and legal expenses 3,612 -Other items 1,869 1,806Group total 15,720 12,992
Parent Company 31 Dec 2017 31 Dec 2016
Prepaid insurance premiums 35 35Prepaid transaction expenses 2,235 -Other items 101 84Parent Company total 2,371 119
Note 25 Cash and cash equivalents/Cash and bankThe following items are included in cash and cash equivalents on the balance sheet and statement of cash flows:
Group 31 Dec 2017 31 Dec 2016
Cash and bank 86,885 73,871Group total 86,885 73,871
Parent Company 31 Dec 2017 31 Dec 2016
Cash and bank 7,517 682Parent Company total 7,517 682
None of the funds in cash and cash equivalents are restricted.

SCANDINAVIAN BIOGAS FUELS INTERNATIONAL AB (publ) ANNUAL REPORT 2017 61
Note 26 Share capital, other paid-in capital and proposed appropriation of profits
Number of shares
(thousand) Share capitalOther paid-in
capital Total
At 31 December 2016 90,093 18,019 693,305 711,324New share issues 17,006 3,401 62,923 66,324Issue expenses -1,543 -1,543At 31 December 2017 107,099 21,420 754,685 776,105
Share capital is comprised of 107,098,839 shares. Each share carries one vote. All shares issued by the Parent Company are paid in full.
A directed share issue of SEK 42.9 million was conducted in April 2017. Wipunen varainhallinta Oy subscribed for 11 million shares, representing an approximate 10 per cent dilution for existing shareholders. The subscrip-tion price was SEK 3.90 per share.
A preferential rights issue of approximately SEK 23.4 million was con ducted in May 2017. The subscription price was SEK 3.90 per share. The loans taken out early in the year were offset in conjunction with the preferential rights issue. The offset loans, including interest, totalled SEK 16.8 million.
The Board of Directors proposes that unappropriated earnings, SEK 232,242,542, be distributed as follows:
Amount in SEKAccumulated profit/loss -294,140,354Share premium reserve 613,502,704Profit/loss for the year -87,119,808Total 232,242,542
Carried forward 232,242,542Total 232,242,542
WarrantsThe Parent Company issued 2,500,000 warrants to subsidiary Scandina-vian Biogas Fuels AB in 2014, as authorised by the 2013 AGM. Of these, a total of 565,000 warrants were allocated to the CEO and employees. The warrants were valued at SEK 0.95 per warrant using the Black & Scholes option pricing model. The warrants were issued free of charge and employ-ees were taxed for the benefit. Warrant holders are entitled to subscribe for one share per warrant at a subscription price of SEK 4.67 per share during the subscription period 1 April 2017 through 1 April 2018. The war-rants carry a pre emption clause. The recalculation of the warrants during spring 2017, conducted due to the preferential rights issue, produced no effect. No subscriptions had been made as at the balance sheet date.
Note 27 BorrowiingsGroup 31 Dec 2017 31 Dec 2016
Non-current
Loans from credit institutions 231,699 170,257Bond loans 225,418 194,921Liabilities related to finance leases 242,949 241,996Other non- current borrowings 18,300 5,562Total non-current borrowing 718,366 612,736
Current
Loans from credit institutions 57,800 15,350Liabilities related to finance leases 14,750 12,597Total current borrowings 72,550 27,947Total borrowings 790,916 640,683
Parent Company 31 Dec 2017 31 Dec 2016
Non-current
Bond loans 225,418 194,921Intra- group loans 23,000 23,000Total non-current borrowings 248,418 217,921
Current
Loans from shareholders 19 19Total current borrowings 19 19Total borrowings 248,437 217,940
Loans from credit institutionsLoans from credit institutions mature through 2027 and finance leases run through 2039. Interest- bearing loans carry an average annual interest rate of 6.9 per cent (7.3). Group borrowings are in SEK and NOK.
Total borrowings include bank loans and other secured borrowings of SEK 806,646 thousand (448,613). Security for loans from credit institutions is comprised of liens on assets as well as pledged intra- group loans, assets and shares in subsidiaries.
The carrying amount and fair value of non -current borrowings is presented below.
Carrying amount Fair value
31 Dec 2017 31 Dec 2016 31 Dec 2017 31 Dec 2016
Loans from lenders 231,699 170,257 231,699 170,257Corporate bond 225,418 194,921 231,605 194,921Liabilities related to finance leases 242,949 241,996 242,949 241,996Other non- current borrowings 18,300 5,562 18,300 5,562
The fair value of non- current financial liabilities is calculated based on future cash flows of principal and interest discounted at the current market rate on the balance sheet date.
The fair value of current borrowings corresponds to the carrying amount, as the discount rate is not significant.
Note 28 ProvisionsGroup 2017 2016
At 1 January 9,375 7,097Provision for the year, penalty fee risk 15,377 1,841Translation difference 173 437At 31 December 24,925 9,375
There is a risk that subsidiary Scandinavian Biogas Korea Co., Ltd. in Ulsan, South Korea will need to pay a penalty to Ulsan City for not upgrading gas. As per agreement, an investment in an upgrading plant in Ulsan was to be made by December 2017. As there is currently no interest in upgraded gas in South Korea, the Company deems the contractual obligation to be unreasonable and has therefore not made the investment. Ulsan City is therefore entitled under the terms of the contract to charge a penalty fee equivalent to a portion of gas sales. This penalty fee applies retroactively from November 2012 (the Company has already paid through October 2012). The nominal value of the provision for the entire contractual penalty fee was approximately SEK 55 million at the balance sheet date. The Company deems the penalty fee level to be unreasonable. The Group has retained two leading South Korean law firms, who maintain that a significantly lower penalty fee is more reasonable. Nonetheless, the provision at the close of the financial year corresponds to the present value of the entire contractual penalty fee amount, payable within eight years. A discount rate of 25.48 per cent was applied in calculating present value, which takes into account disputed-related risks.
The Parent Company has no Provisions.

SCANDINAVIAN BIOGAS FUELS INTERNATIONAL AB (publ) ANNUAL REPORT 2017 62
Note 29 Pledged assets
Group 31 Dec 2017 31 Dec 2016
Liens on assets 48,000 66,454Pledged assets 368,272 239,416Assets financed through finance leases 238,751 240,421Shares in Scandinavian Biogas Fuels AB 23,064 -Shares in Scandinavian Biogas Stockholm AB 58,227 52,909Shares in Scandinavian Biogas Korea Co., Ltd. - 1,237Shares in Scandinavian Biogas Sweden AB - 17,540Shares in Scandinavian Biogas Södertörn AB 8,209 17,956Shares in Scandinavian Biogas Fuels i Varberg AB 78 79Shares in Biokraft Holding AS 62,045 53,022Group total 806,646 689,034
Parent Company 31 Dec 2017 31 Dec 2016
Shares in Scandinavian Biogas Sweden AB 102,050 102,050Shares in Scandinavian Biogas Fuels AB 274 27,341Shares in Biokraft Holding AS 73,575 58,419Pledged intra -group loan to Scandinavian Biogas Sweden AB 229,111 196,265Parent Company total 405,010 384,075
Note 30 Contingent liabilities Group 31 Dec 2017 31 Dec 2016
Contingent liability – subsidiary penalty fee - 37,501Contingent liability – subsidiary payment guarantees to suppliers - 4,197Contingent liability – subsidiary investment grants 10,869 5,363Contingent liability – Parent Company corporate bond 230,000 200,000Group total 240,869 247,062
Parent Company 31 Dec 2017 31 Dec 2016
Contingent liability – subsidiary loans from credit institutions 32,500 35,500Contingent liability – subsidiary payment guarantees to suppliers - 4,197Contingent liability – subsidiary investment grants 10,869 5,363Parent Company total 43,369 45,060
Contingent liabilities for subsidiary loans from credit institutions pertain to general guarantee commitments. Subsidiary Scandinavian Biogas Fuels AB has guaranteed the Parent Company's corporate bond.
Note 31 Other liabilitiesGroup 31 Dec 2017 31 Dec 2016
VAT liability 528 1,121Tax at source 1,217 1,183Public funding 16,199 10,585Other 176 124Group total 18,120 13,013
Parent Company 31 Dec 2017 31 Dec 2016
VAT liability 45 95Tax at source 10 -Other 1 -Parent Company total 56 95
Note 32 Accrued expenses and deferred income
Group 31 Dec 2017 31 Dec 2016
Accrued interest 10,154 3,501Accrued payroll- related expenses 9,357 9,356Accrued expenses – gas and electricity 5,474 5,104Accrued board fees 526 555Construction work in progress 7,805 13,899Accrued lease and rental expenses 1,857 200Accrued operation and maintenance expenses 2,876 767Other items 7,316 6,173Group total 45,365 39,555
Parent Company 31 Dec 2017 31 Dec 2016
Accrued interest 3,250 2,837Accrued board fees 526 555Other items 858 289Parent Company total 4,634 3,681
Note 33 Business combinationsBusiness combinationsOn 11 February 2016 the Group acquired 50.03 per cent of the shares in Biokraft Holding AS, a company registered in Norway that owns all shares in Biokraft AS. The purchase price totalled NOK 57,999,147.66. A small portion of the acquisition was conducted directly with the owners, with the major portion conducted in conjunction with a new share issue. The surplus value of the acquisition has been estimated at SEK 6.4 million. Acquisition costs for lawyers, etc. totalled SEK 0.8 million and were reported in the income statement as other external costs.
Information on acquired net assets and goodwill:
At acquisition date
Purchase price:
- funds paid via direct acquisition 2,981- funds paid via new share issue 54,670Total purchase price 57,651Fair value of acquired assets (see below) -51,231Surplus value/Goodwil 6,420
Assets and liabilities included in the acquisition, according to preliminary assessment:
Fair value
Cash and cash equivalents 101,393Tangible assets 6,933Deferred tax assets 5,765Trade accounts receivable and other receivables 4,935Accounts payable and other liabilities -6,688Borrowings -9,940Identifiable assets acquired 102,398Non -controlling interests -51,167Surplus value/Goodwill 6,420Acquired net assets 57,651
Surplus value is classified as goodwill and is attributable to increased mar-ket shares in the Nordic region, establishment in the Norwegian market, and future liquid biogas production at the biogas facility in Skogn, Norway. All of the Group’s existing plants currently produce compressed biogas. No part of recognised goodwill is expected to be tax deductible.
Fair value of non- controlling interest in Biokraft Holding AS, an unlisted company, was calculated by multiplying non -controlling interest (49.97 per cent) by the value of the identified assets acquired.
Sales for full -year 2016 (i.e., including the period prior to the acquisition) totalled SEK 15.1 million. Profit/loss for the year was SEK -2.9 million.

SCANDINAVIAN BIOGAS FUELS INTERNATIONAL AB (publ) ANNUAL REPORT 2017 63
Note 34 Lease agreements Operating leasesThe Group’s operating leases pertain mainly to office space, land, storage tanks and cars. No subleasing is conducted. Cars are leased under three- year contracts after which i) the car is returned at no charge, or ii) the lease may be extended on one -year basis, or iii) the car may be purchased at contractual residual value. The land at Henriksdal and Södertörn is leased for a 25- year period and the land at Bromma until the closure of Stockholm Vatten och Avfall’s wastewater treatment plant, which is expected in 2025. Land leases are classified as operating leases, as no risks are transferred to the lessee and as depreciation/amortisation is not considered necessary for land. The storage tank lease agreement runs for five years with a five- year extension option for the lessee. If the agreement is not cancelled or extended by five years, it is automatically extended for consecutive two -year periods. At the end of the leasing period, the lessee’s only responsibility is to clean the tank thoroughly.
Future minimum lease payments under non-cancellable operating leases effective at the reporting date are payable as follows:
Group 31 Dec 2017 31 Dec 2016
Within 1 year 10,405 6,8951 to 5 years 22,437 19,7336 to 10 years 14,145 14,038More than 10 years 25,799 28,436Group total 72,786 69,102
The Group’s costs for operating leases during the financial year totalled SEK 10,093 thousand (7,037).
Finance leasesThe Group’s finance lease agreements comprise the lease of biogas/ pre -treatment plants as well as other tangible assets located mainly at Henriksdal, Bromma and Södertörn.
A 25 -year lease agreement covering land and facilities at Henriksdal and Bromma was signed in 2014. Rent for the land and facilities at Henriksdal is calculated at book value at time of sale spread over 20 years, with a rent rebate the first and last 30 months, and a variable rate corresponding to two -year government bonds plus a market -rate margin. Rent for land and facilities at Bromma is calculated in the same way, without a rent rebate. This agreement applies as long as the facility at Bromma remains. The City of Stockholm has decided to phase out the facility, with a preliminary date set for 2025. The effect of the phase- out of the treatment plant at Bromma is not expected to be significant, as redirection of biogas production to Henriksdal is planned.
Land and assets were broken down based on the carrying amount of assets sold at time of sale. The Group reports the portion related to other assets as tangible assets and the debt is recorded to Stockholm Vatten och Avfall AB. Land is classified as an operating lease; see above.
Subsidiary Scandinavian Biogas Recycling AB leases land and facilities from SRV Återvinning AB under a 25- year lease agreement. Rent for the land is classified as an operating lease, while rent for the other facilities is classified as a finance lease. Rent is calculated at carrying acquisition value at commencement of the rental period divided over 20, 15 and 7 years using a variable rate corresponding to three months STIBOR plus a market -rate margin.
Finance lease liabilities Lease liabilities are effectively secured, as rights to the leased assets revert to the lessor in the event of non payment.
Gross finance lease liabilities – minimum lease payments: 31 Dec 2017 31 Dec 2016
Within 1 year 21,168 20,5581 to 5 years 80,075 82,5616 to 10 years 87,946 92,472More than 10 years 119,854 153,039Total 309,043 348,631
Present value of finance lease liabilities: 31 Dec 2017 31 Dec 2016
Within 1 year 14,750 13,5961 to 5 years 57,398 57,5916 to 10 years 66,074 68,656More than 10 years 97,385 129,131Total 235,608 268,974
The tables above also include future minimum lease payments pertaining to contracted leases, which at 31 December 2017 are not on the balance sheet.
The Group’s finance lease expenses totalled SEK 19,319 thousand (15,641) for the financial year.
No lease agreements are held by the Parent Company.
Note 35 Other non-cash items Group 31 Dec 2017 31 Dec 2016
Other provisions 15,550 2,278Accrued late penalty 10,566 -Actuarial results on post -employment benefits 167 -121Unallocated translation difference 426 4,929Other -2,816 -2,035Group total 23,893 5,051
Parent Company 31 Dec 2017 31 Dec 2016
Unrealised exchange difference -749 306Parent Company total -749 306
Note 36 Net indebtednessGroup 31 Dec 2017 31 Dec 2016
Cash and cash equivalents 86,885 73,871Finance leases – payable within 1 year -14,750 -12,597Other loans – payable within 1 year -57,800 -15,350Finance leases – payable after 1 year -242,949 -241,996Other loans – payable after 1 year -475,417 -370,740Net debt -704,031 -566,812
Cash and cash equivalents 86,885 73,871Gross debt – fixed interest rates -226,197 -108,525Gross debt – variable interest rates -564,719 -532,158Net debt -704,031 -566,812

SCANDINAVIAN BIOGAS FUELS INTERNATIONAL AB (publ) ANNUAL REPORT 2017 64
GroupCash and cash
equivalentsFinance leases
< 1 yrFinance leases
> 1 yr Loans < 1 yr Loans > 1 yr Total
Net debt at 1 January 2017 73,871 -12,597 -241,996 -15,350 -370,740 -566,812Cash flow 13,935 13,547 -16,300 -123,530 -112,348Exchange rate adjustments -921 -208 4,422 3,293Other non-cash items -2,153 -14,500 -25,942 14,431 -28,164Net debt at 31 December 2017 86,885 -14,750 -242,949 -57,800 -475,417 -704,031
Note 37 Share-based benefits2014 warrant programme The Parent Company issued 2,500,000 warrants to subsidiary Scandina-vian Biogas Fuels AB in 2014, as authorised by the 2013 AGM. Of these, a total of 565,000 warrants were allocated to the CEO and employees. The warrants were valued at SEK 0.95 per warrant using the Black & Scholes option pricing model. The warrants were issued free of charge and employees were taxed for the benefit. Warrant holders are entitled to subscribe for one share per warrant at a subscription price of SEK 4.67 per share during the subscription period 1 April 2017 through 1 April 2018. No subscriptions were made as at the balance sheet date. The warrants carry a pre emption clause.
Group – number of warrants 31 Dec 2017 31 Dec 2016
CEO 400,000 400,000Other senior executives 130,000 130,000Other employees 35,000 35,000Group total 565,000 565,000 All options were vested at date of issue and the entire expense charged to 2014 profit/loss.
The recalculation of the warrants during spring 2017, conducted due to the preferential rights issue, produced no effect.
Note 38 Related-party transactions AC Cleantech Growthfund 1 Holding AB (and related parties) owns 29.3 per cent and Bengtssons Tidnings AB (and related parties) owns 28.8 per cent of the shares in Scandinavian Biogas Fuels International AB (publ), and are deemed to have significant influence over the Group. Of the remain ing 41.9 per cent of the shares, no single owner holds more than 15 per cent. Other related parties are Group subsidiaries and senior executives (i.e., board members and management) and their families.
The following transactions were conducted with related parties:
Purchase of goods and services 2017 2016
Purchase of services: - Key management personnel (consultancy services)
312 482
Total 312 482
The purchase of services in the above table pertains to consulting fees paid to the employer of one board member. No sales were made to related parties outside the Group during this or the previous financial year.
Goods and services are purchased from and sold to subsidiaries on normal market terms. Services purchased from related parties are based on normal market terms and purchases are conducted on a commercial basis.
Loans from companies with significant influence over the company: 2017 2016
At beginning of the year - -Loans raised during the year 14,000 -Interest 419 -Amount offset via new share issue -14,419 - At year-end - -
Note 39 Definition of key ratiosDebt/Equity ratioThe Group evaluates capital on the basis of the debt/equity ratio. This key ratio is calculated as net debt divided by total capital. Net debt is calculated as total borrowings (including consolidated balance sheet items current borrowings and non-current borrowings) less cash and cash equivalents. Equity is calculated as equity in the consolidated balance sheet. Total capital is calculated as net debt plus equity.
31 Dec 2017 31 Dec 2016
Total borrowings (Note 27) 790,916 640,683
Less: cash and cash equivalent (Note 25) -86,885 -73,871Net debt 704,031 566,812Equity 228,924 226,279
Total capital 932,955 793,091
Debt/Equity ratio 75.5% 71.5%
Operating results (EBIT) Operating results (EBIT – Earnings Before Interest and Tax) provide an overview of the Group’s total earnings generation and are calculated as operating results before financial items and tax.
EBITDAEBITDA is a profitability measure considered by the Group as relevant for investors interested in earnings generation before investments in assets. The Group defines EBITDA (Earnings Before Interest, Tax, Depreciation and Amortisation) as operating results exclusive of other operating expenses and amortisation/depreciation and impairment of tangible and intangible assets. The EBITDA margin is calculated by dividing EBITDA by total revenues.
2017 2016
Operating results -42,159 -24,580- Amortisation/depreciation and impairment of tangible and intangible assets 62,802 45,979- Other operating expenses 944 573EBITDA 21,587 21,972
Operational EBITDAOperational EBITDA is EBITDA adjusted for significant one-off costs and is used to show the profitability of operating activities.
2017 2016
EBITDA 21,587 21,972- Adjustment for significant one-off items 13,583 -Operational EBITDA 35,170 21,972
The adjustment for significant one-off items in 2017 is attributable to the difference in the amount of the penalty fee in Ulsan as calculated, as com-pared with previous assessments. See Significant Events During the Year.
Gross profit/lossGross profit/loss is a profitability measure showing the Company’s revenues less variable production costs
2017 2016
Total revenues 289,331 266,178-Raw materials and consumables -137,890 -136,343Gross profit/loss 151,441 129,835
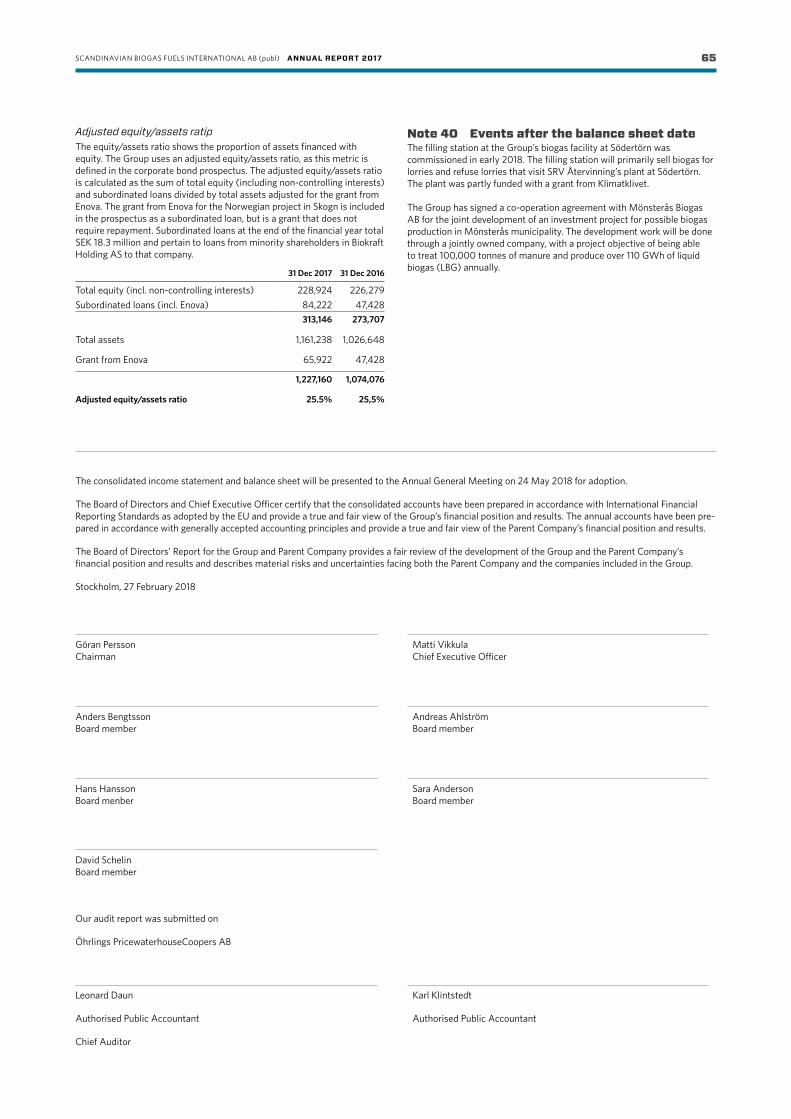
SCANDINAVIAN BIOGAS FUELS INTERNATIONAL AB (publ) ANNUAL REPORT 2017 65
Adjusted equity/assets ratipThe equity/assets ratio shows the proportion of assets financed with equity. The Group uses an adjusted equity/assets ratio, as this metric is defined in the corporate bond prospectus. The adjusted equity/assets ratio is calculated as the sum of total equity (including non -controlling interests) and subordinated loans divided by total assets adjusted for the grant from Enova. The grant from Enova for the Norwegian project in Skogn is included in the prospectus as a subordinated loan, but is a grant that does not require repayment. Subordinated loans at the end of the financial year total SEK 18.3 million and pertain to loans from minority shareholders in Biokraft Holding AS to that company.
31 Dec 2017 31 Dec 2016
Total equity (incl. non -controlling interests) 228,924 226,279Subordinated loans (incl. Enova) 84,222 47,428
313,146 273,707
Total assets 1,161,238 1,026,648
Grant from Enova 65,922 47,428
1,227,160 1,074,076
Adjusted equity/assets ratio 25.5% 25,5%
Note 40 Events after the balance sheet dateThe filling station at the Group’s biogas facility at Södertörn was commissioned in early 2018. The filling station will primarily sell biogas for lorries and refuse lorries that visit SRV Återvinning’s plant at Södertörn. The plant was partly funded with a grant from Klimatklivet.
The Group has signed a co-operation agreement with Mönsterås Biogas AB for the joint development of an investment project for possible biogas production in Mönsterås municipality. The development work will be done through a jointly owned company, with a project objective of being able to treat 100,000 tonnes of manure and produce over 110 GWh of liquid biogas (LBG) annually.
The consolidated income statement and balance sheet will be presented to the Annual General Meeting on 24 May 2018 for adoption.
The Board of Directors and Chief Executive Officer certify that the consolidated accounts have been prepared in accordance with International Financial Reporting Standards as adopted by the EU and provide a true and fair view of the Group’s financial position and results. The annual accounts have been pre-pared in accordance with generally accepted accounting principles and provide a true and fair view of the Parent Company’s financial position and results.
The Board of Directors’ Report for the Group and Parent Company provides a fair review of the development of the Group and the Parent Company’s financial position and results and describes material risks and uncertainties facing both the Parent Company and the companies included in the Group.
Stockholm, 27 February 2018
Göran Persson Chairman
Matti Vikkula Chief Executive Officer
Anders Bengtsson Board member
Andreas Ahlström Board member
Hans Hansson Board menber
Sara Anderson Board member
David Schelin Board member
Our audit report was submitted on
Öhrlings PricewaterhouseCoopers AB
Leonard Daun
Authorised Public Accountant
Chief Auditor
Karl Klintstedt
Authorised Public Accountant
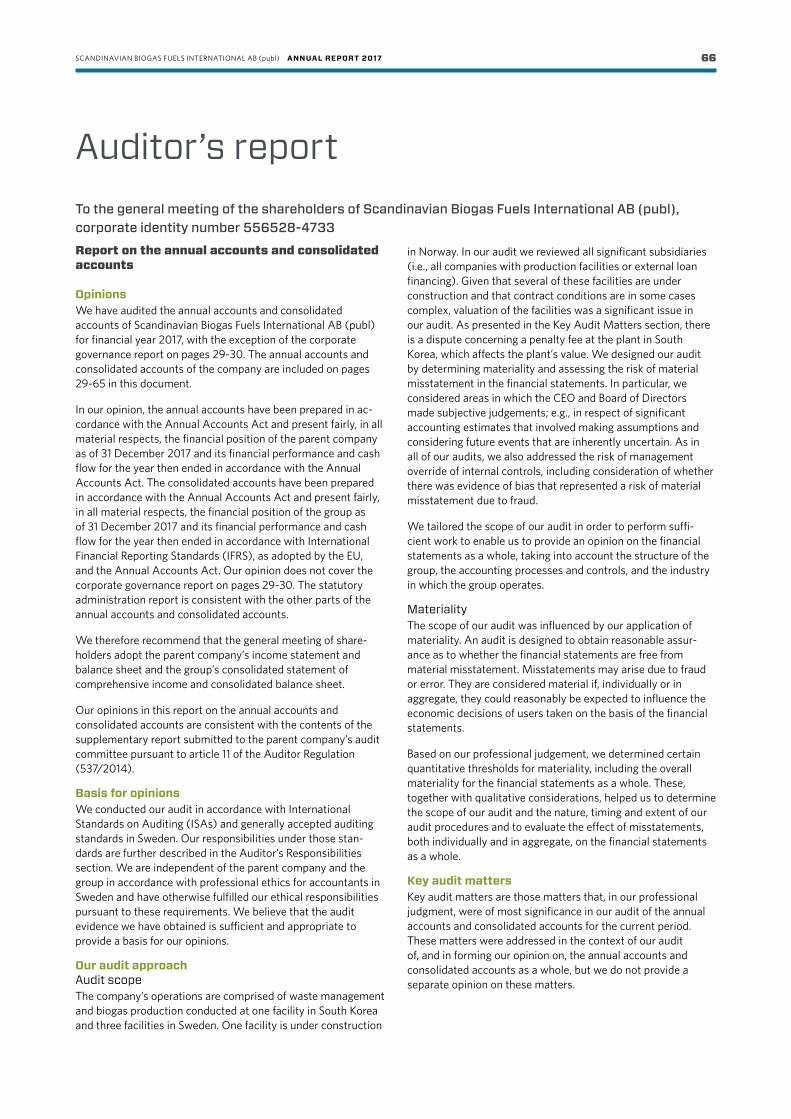
SCANDINAVIAN BIOGAS FUELS INTERNATIONAL AB (publ) ANNUAL REPORT 2017 66
Auditor’s reportTo the general meeting of the shareholders of Scandinavian Biogas Fuels International AB (publ), corporate identity number 556528-4733
Report on the annual accounts and consolidated accounts Opinions We have audited the annual accounts and consolidated accounts of Scandinavian Biogas Fuels International AB (publ) for financial year 2017, with the exception of the corporate governance report on pages 29-30. The annual accounts and consolidated accounts of the company are included on pages 29-65 in this document.
In our opinion, the annual accounts have been prepared in ac-cordance with the Annual Accounts Act and present fairly, in all material respects, the financial position of the parent company as of 31 December 2017 and its financial performance and cash flow for the year then ended in accordance with the Annual Accounts Act. The consolidated accounts have been prepared in accordance with the Annual Accounts Act and present fairly, in all material respects, the financial position of the group as of 31 December 2017 and its financial performance and cash flow for the year then ended in accordance with International Financial Reporting Standards (IFRS), as adopted by the EU, and the Annual Accounts Act. Our opinion does not cover the corporate governance report on pages 29-30. The statutory administration report is consistent with the other parts of the annual accounts and consolidated accounts.
We therefore recommend that the general meeting of share-holders adopt the parent company’s income statement and balance sheet and the group’s consolidated statement of comprehensive income and consolidated balance sheet.
Our opinions in this report on the annual accounts and consolidated accounts are consistent with the contents of the supplementary report submitted to the parent company’s audit committee pursuant to article 11 of the Auditor Regulation (537/2014).
Basis for opinions We conducted our audit in accordance with International Standards on Auditing (ISAs) and generally accepted auditing standards in Sweden. Our responsibilities under those stan-dards are further described in the Auditor’s Responsibilities section. We are independent of the parent company and the group in accordance with professional ethics for accountants in Sweden and have otherwise fulfilled our ethical responsibilities pursuant to these requirements. We believe that the audit evidence we have obtained is sufficient and appropriate to provide a basis for our opinions.
Our audit approachAudit scopeThe company’s operations are comprised of waste management and biogas production conducted at one facility in South Korea and three facilities in Sweden. One facility is under construction
in Norway. In our audit we reviewed all significant subsidiaries (i.e., all companies with production facilities or external loan financing). Given that several of these facilities are under construction and that contract conditions are in some cases complex, valuation of the facilities was a significant issue in our audit. As presented in the Key Audit Matters section, there is a dispute concerning a penalty fee at the plant in South Korea, which affects the plant’s value. We designed our audit by determining materiality and assessing the risk of material misstatement in the financial statements. In particular, we considered areas in which the CEO and Board of Directors made subjective judgements; e.g., in respect of significant accounting estimates that involved making assumptions and considering future events that are inherently uncertain. As in all of our audits, we also addressed the risk of management override of internal controls, including consideration of whether there was evidence of bias that represented a risk of material misstatement due to fraud.
We tailored the scope of our audit in order to perform suffi-cient work to enable us to provide an opinion on the financial statements as a whole, taking into account the structure of the group, the accounting processes and controls, and the industry in which the group operates.
MaterialityThe scope of our audit was influenced by our application of materiality. An audit is designed to obtain reasonable assur-ance as to whether the financial statements are free from material misstatement. Misstatements may arise due to fraud or error. They are considered material if, individually or in aggregate, they could reasonably be expected to influence the economic decisions of users taken on the basis of the financial statements.
Based on our professional judgement, we determined certain quantitative thresholds for materiality, including the overall materiality for the financial statements as a whole. These, together with qualitative considerations, helped us to determine the scope of our audit and the nature, timing and extent of our audit procedures and to evaluate the effect of misstatements, both individually and in aggregate, on the financial statements as a whole.
Key audit mattersKey audit matters are those matters that, in our professional judgment, were of most significance in our audit of the annual accounts and consolidated accounts for the current period. These matters were addressed in the context of our audit of, and in forming our opinion on, the annual accounts and consolidated accounts as a whole, but we do not provide a separate opinion on these matters.

SCANDINAVIAN BIOGAS FUELS INTERNATIONAL AB (publ) ANNUAL REPORT 2017 67
Valuation of the concession for the right to charge under service concession arrangements and the provision for the dispute regarding the penalty fee Note 2:18 specifies that the group, through its South Korean subsidiary, is entitled to charge for service concession arrange-ments associated with the biogas plant in Ulsan, for which the carrying amount is SEK 85.5 million.
It is stated in the board of directors' report, Note 4, Note 28 and elsewhere in the annual accounts that there is a dispute with the South Korean company’s partner, Ulsan City. The South Korean subsidiary has undertaken a contractual obliga-tion to ensure the plant’s capacity to produce upgraded gas as of 1 January 2018. Under the terms of the contract, the South Korean subsidiary is obliged to pay a penalty fee, retroactive to November 2012, in the event it fails to fulfil this obligation. The annual accounts state that the company has elected not to make the investment required to fulfil its contractual obli-gation, and is therefore unable to produce upgraded gas. The annual accounts also state that this decision was taken based on the company’s assessment that the contractual terms are unreasonable and, supported by two legal opinions from two South Korean law firms, its assessment that it is probable that the penalty fee will be adjudged to be significantly lower than the contractual penalty amount and will instead be approx-imately 30 per cent of the contractual penalty amount.
The dispute affects the accounts in two ways.
• The contractual penalty fee amount for the South Korean concession right for the period November 2012 through 31 December 2017 is, pursuant to the contract, amortised interest-free over an eight-year period. This provision is valued at fair value as at 31 December 2017, and the cost of capital takes into account the risks associated with the dispute. The board of directors' report, Note 4 and Note 28 specify that the provision totals SEK 24.9 million and provide details on how it was valued and the assessments made by the group.
• Future cash flows for the concession right are based on, among other things, the estimated amount of future penalty fees. This consequently affects the impairment test for the concession right as prepared by the company. Note 4 and Note 15 specify how the concession right was valued, the assessments made by the group, and the write-down taken in 2017. In assessing the size of the write-down, the group was required to evaluate a number of factors, with the most signi-ficant being the cost of capital, the future price of biogas, the plant’s operating costs and, in this case, the outcome of the dispute (in terms of the penalty fee amount) deemed most reasonable, as well as the fact that the forecast is not charged with any disputed payments concerning service costs. Note 15 states that, in its impairment testing and based on legal opinions, the company calculated the impairment test based on a cash flow charged with the full penalty fee for an 18-month period, and subsequently based on an assumption of prevailing in the dispute, rather than basing the forecast on a cash flow corresponding to 30 per cent of the contractual penalty fee amount.
Due to the degree of assessment concerning several assump-tions, including assessment of the outcome of the penalty fee dispute, we consider this to be a key audit matter.
How our audit addressed the key audit matter Our review of the penalty fee dispute included a review and examination of the legal opinions obtained by the group. We also reviewed the cost of capital calculations obtained by the group from third parties and used for fair value valuation for the provision and for discounting cash flows in the impairment test conducted by the group on the concession right. We verified significant assumptions in the cost of capital calculation against external market data and we examined, evaluated and chal-lenged the way in which the valuation firm viewed the dispute in the company-specific risk premium. We also examined and evaluated the group’s application of applicable accounting standards for the provision and the impairment test.
It order to assess the residual carrying amount of non-current assets, we examined the group’s impairment test of the conces-sion right for an entitlement to charge for service concession arrangements at the plant in Ulsan (South Korea), to use forecasts, and to assess the underlying assumptions regarding financial information. We also evaluated the accuracy of the company’s previous assumptions and prognoses.
Finally, we evaluated the completeness of the information provided by the company in Note 15 and Note 28.
Valuation of tangible assetsThe carrying value of the group’s production facilities totals SEK 829.3 million. Note 4, Significant Estimates and Assessments, specifies the estimates and assessments made by the group re-garding the value of these tangible assets. The same note states that the group needs to assess whether there in an indication of a write-down requirement and, if so, to conduct an impairment test. Note 16 specifies that the group conducted impairment tests for all its facilities. In assessing write-down requirements, the group needed to consider a number of factors, with the most significant being what constitutes a cash flow-generating unit (i.e., whether a plant is therefore valued as a stand-alone unit, or valued collectively with one or more other plants), cost of capital, future price of biogas, and the plants’ operating costs. Due to the degree of assessment, we consider the valuation of tangible assets to be a key audit matter.
How our audit addressed the key audit matter Note 16 specifies that the group conducted impairment tests on all facilities. Our review included evaluation of the company’s classification of cash flow-generating units, the cost of capital applied and forecasts used, and assessment of the underlying assumptions regarding the financial information. We also evaluated the accuracy of the company’s previous assumptions and prognoses. Finally, we evaluated the completeness of the information provided by the company in Note 16.
Information other than the annual accounts and consolidated accountsThis document also contains, on pages 1-28, information other than the annual accounts and consolidated accounts. The Board of Directors and the Chief Executive Officer are responsible for this other information.
Our opinion on the annual accounts and consolidated accounts does not cover this other information and we do not express any form of assurance regarding this other information.

SCANDINAVIAN BIOGAS FUELS INTERNATIONAL AB (publ) ANNUAL REPORT 2017 68
In connection with our audit of the annual accounts and conso-lidated accounts, our responsibility is to read the information identified above and consider whether the information is materially inconsistent with the annual accounts and consoli-dated accounts. In this procedure we also take into account our knowledge otherwise obtained in the audit and assess whether the information otherwise appears to be materially misstated.
If, based on the work performed concerning this information, we conclude that there is a material misstatement of this other information, we are required to report that fact. We have nothing to report in this regard.
Responsibilities of the Board of Directors and the Chief Executive Officer The Board of Directors and the Chief Executive Officer are responsible for the preparation of the annual accounts and consolidated accounts and for ensuring that these provide a fair presentation in accordance with the Annual Accounts Act and, with respect to the consolidated accounts, in accordance with IFRS as adopted by the EU. The Board of Directors and the Chief Executive Officer are also responsible for such internal control as they deem necessary to enable the preparation of annual accounts and consolidated accounts that are free from material misstatement, whether due to fraud or error.
In preparing the annual accounts and consolidated accounts, the Board of Directors and the Chief Executive Officer are responsible for assessment of the company’s and the group’s ability to continue as a going concern. They disclose, as applicable, matters related to continuance as a going concern and application of the going concern basis of accounting. The going concern basis of accounting is not applied, however, if the Board of Directors and the Chief Executive Officer intend to liquidate the company, to cease operations, or have no realistic alternative but to do so.
The Audit Committee’s duties include overseeing the com-pany’s financial reporting process, without prejudice to the Board of Director’s responsibilities and tasks in general.
Auditor’s responsibilityOur objectives are to obtain reasonable assurance about whether the annual accounts and consolidated accounts as a whole are free from material misstatement, whether due to fraud or error, and to issue an auditor’s report that includes our opinions. Reasonable assurance is a high level of assurance, but is not a guarantee that an audit conducted in accordance with ISAs and generally accepted auditing standards in Sweden will always detect a material misstatement when it exists. Mis-statements may arise from fraud or error and are considered material if, individually or in the aggregate, they can reasonably be expected to influence the economic decisions of users taken on the basis of these annual accounts and consolidated accounts.
A further description of our responsibility for the audit of the annual accounts and consolidated accounts is available on the Supervisory Board of Public Accountants website: www.revisorsinspektionen.se/rn/showdocument/documents/rev_dok/revisors_ansvar.pdf. This description is part of the auditor´s report.
Report on other legal and regulatory requirements OpinionsIn addition to our audit of the annual accounts and consolidated accounts, we have also audited the administration of the Board of Directors and the Chief Executive Officer of Scandinavian Biogas Fuels International AB (publ) for financial year 2017 and the proposed appropriation of the company’s profit or loss.
We recommend to the general meeting of shareholders that the profit be appropriated in accordance with the proposal in the board of directors' report and that the members of the Board of Directors and the Chief Executive Officer be dis charged from liability for the financial year.
Basis for opinionsWe conducted the audit in accordance with generally accepted auditing standards in Sweden. Our responsibilities under those standards are further described in the Auditor’s Responsibilities section. We are independent of the parent company and the group in accordance with professional ethics for accountants in Sweden and have otherwise fulfilled our ethical responsibilities in accordance with these requirements.
We believe that the audit evidence we have obtained is suffi-cient and appropriate to provide a basis for our opinions.
Responsibilities of the Board of Directors and the Chief Executive Officer The Board of Directors is responsible for the proposal for app-ropriations of the company’s profit or loss. At the proposal of a dividend, this includes an assessment of whether the dividend is justifiable considering the requirements which the company's and the group’s type of operations, size and risks place on the size of the parent company's and the group’s equity, consolida-tion requirements, liquidity and position in general.
The Board of Directors is responsible for the company’s organisation and the administration of the company’s affairs. This includes continuous assessment of the company’s and the group’s financial situation and ensuring that the company's organisation is designed to ensure prudent control of account-ing, management of assets and the company’s financial affairs. The Chief Executive Officer manages ongoing administration in accordance with the Board of Directors’ guidelines and instruc-tions and takes measures necessary to ensure, among other things, that the company’s accounting is in accordance with law and that assets are managed in a prudent manner.
Auditor’s responsibility Our objective concerning the audit of the administration, and thus our opinion on discharge from liability, is to obtain audit evidence to assess with a reasonable degree of assurance whether any member of the Board of Directors or the Chief Executive Officer in any material respect:
• has undertaken any action or been guilty of any omission which may give rise to liability for the company, or
• has in any other way acted in contravention of the Companies Act, the Annual Accounts Act or the Articles of Association.

SCANDINAVIAN BIOGAS FUELS INTERNATIONAL AB (publ) ANNUAL REPORT 2017 69
Our objective concerning the audit of the proposed appropri-ation of the company’s profit or loss, and thus our opinion on this, is to assess with a reasonable degree of assurance whether the proposal is in accordance with the Companies Act.
Reasonable assurance is a high level of assurance, but is not a guarantee that an audit conducted in accordance with generally accepted auditing standards in Sweden will always detect ac-tions or omissions that can give rise to liability for the company, or that the proposed appropriation of the company’s profit or loss is not in accordance with the Companies Act.
A further description of our responsibility for the audit of the administration is available on the Supervisory Board of Public Accountants website: www.revisorsinspektionen.se/revisorsan-svar. This description is part of the auditor´s report.
The auditor’s examination of the corporate governance reportThe Board of Directors is responsible for ensuring that the cor-porate governance report on pages 29-30 has been prepared in accordance with the Annual Accounts Act.
Our examination of the corporate governance report was conducted in accordance with FAR´s auditing standard RevU 16, ‘The auditor´s examination of the corporate governance report’. Accordingly, our examination of the corporate gover-nance report is different and substantially less in scope than an audit conducted in accordance with International Standards on Auditing and generally accepted auditing standards in Sweden. We believe that the examination has provided us with sufficient basis for our opinions.
A corporate governance report has been prepared. Disclosures in accordance with chapter 6, §6, second paragraph, points 2-6 of the Annual Accounts Act and chapter 7, §31, second paragraph of the same law are consistent with the other parts of the annual accounts and consolidated accounts and are in accordance with the Annual Accounts Act.
Öhrlings PricewaterhouseCoopers AB, Torsgatan 21, 113 97 Stockholm, was appointed Scandinavian Biogas Fuels Interna-tional AB’s auditor by the general meeting of shareholders on 11 May 2017, and has served as the company’s auditor since 18 June 2007.
Stockholm, 27 February 2018
Öhrlings PricewaterhouseCoopers AB
____________________ ____________________
Leonard Daun Karl Klintstedt
Authorised Public Authorised Public Accountant Accountant
Chief Auditor

SCANDINAVIAN BIOGAS FUELS INTERNATIONAL AB (publ) ANNUAL REPORT 2017 70
Digestate is the part of the organic material / substrate that has not been converted to biogas but remains in solid / liquid form.
Digester / Digestion tank: Gas tight container for the anaerobic digestion of organic material.
Energy carrier: Substance or a physical process that is used to store or transport energy. Examples include electricity, hydrogen, ethanol, gasoline and methane.
Energy sources: Natural resources or natural phenomena that can be converted into energy forms such as light, move-ment and heat. A distinction is made between stored (fossil) and abundant (renewable) energy sources. Examples of stored energy include oil, natural gas and coal; examples of renewable energy sources are biomass, hydropower and wind and solar energy.
Gas cleaning: Process for purifying raw gas from water vapour, sulphur compounds and particulates. The gas may then be further processed to separate methane and carbon dioxide. Vehicle fuel -quality biogas contains 97±1% methane.
Greenhouse gases: Gases that have the ability to absorb infrared radiation reflected from the Earth into the atmosphere (greenhouse effect). The greenhouse effect is essential for life on earth (without it the Earth’s average temperature would be around 18°C). However, due to human activity the concentra-tion of greenhouse gases is increasing. Examples of greenhouse gases are carbon dioxide, methane, water vapour and nitrogen oxides.
Methane: Odourless gas with high energy content (~10 kWh per normal cubic metre). Methane (CH4) is the simplest hydrocarbon and is composed of one carbon atom and four hydrogen atoms.
Natural gas: A stored (fossil) gas mixture compromised of approximately 90 per cent methane.
Normal cubic metre relative to one litre: A normal cubic metre of biogas upgraded to vehicle fuel (97% methane and 3% CO2) contains as much energy as 1.1 litres of petrol.
Organic waste: Waste from plants and animals.
Pre-treatment in biogas production: Organic material used in the production of biogas needs in some cases to be pre-treated prior to the digestion process. The purpose of pre-treatment is to increase the material’s total biogas potential (i.e., the quantity of biogas that can be extracted from the mate-rial) and/or to increase the speed of digestion. Pre- treatment may be thermal, chemical or mechanical, and combinations of one or more methods may be used. The treatment opens up/breaks down complex organic molecules, making them more accessible to digestion microorganisms.
Raw gas: Gas formed in a biogas process. Raw gas mainly contains methane and carbon dioxide but also sulphur com-pounds, water vapour, particulates, etc.
Substrate: Organic material digested in a biogas process.
Vehicle fuel: Energy source used as fuel in vehicles. Raw gas produced in the biogas process must be cleaned and upgraded to 97±1% methane in order to be defined and sold as vehicle fuel.
Glossary