anthropogenic climate change and impacts. human’s influence on climate urban heat centers...
TRANSCRIPT
Anthropogenic Climate Change and Impacts

Human’s influence on climate
• Urban heat centers• Deforestation• Increased greenhouse concentrations.
– Especially Carbon Dioxide.
• And more.• How else have we changed the Earth?

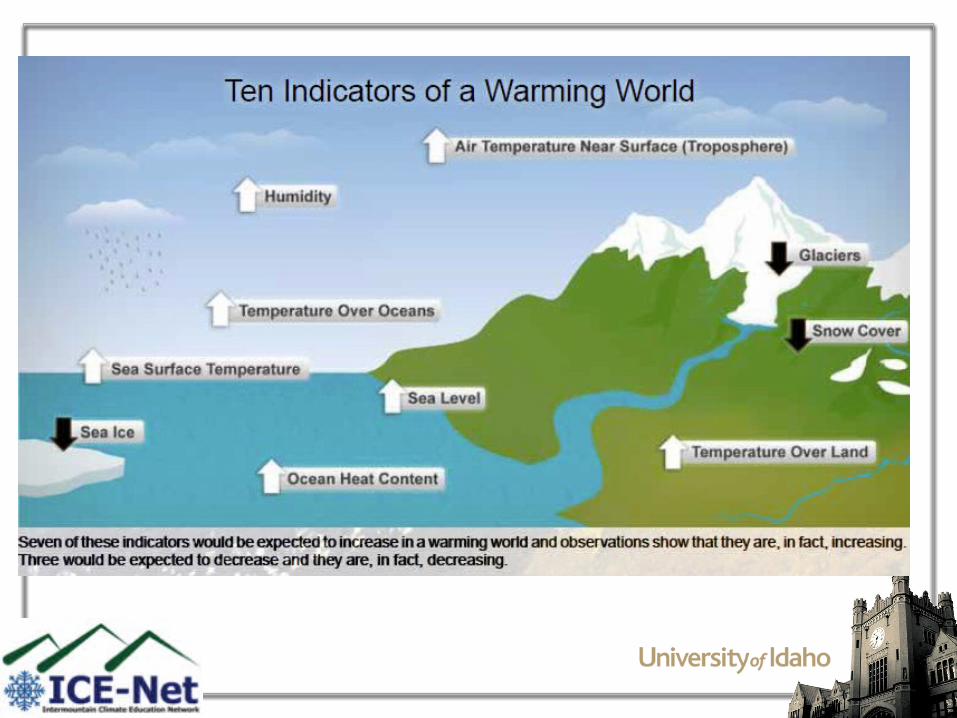
Evidence of current climate change
• 11 of 12 warmest years on record occurred between 1995–2006
• Global temperature increasing at 0.13 °C per decade• Sea level rise caused by thermal expansion.
1.8mm/year• Temperatures in Arctic increasing at twice global rate• Ice caps and glacier melt leading to sea level rise• Temperatures on top of a permafrost layer have
increased by 5.4 °F• Amount of water vapor in atmosphere increased

WELL? ARE THOSE NATURAL CHANGES OR NOT?

Most likely not natural:
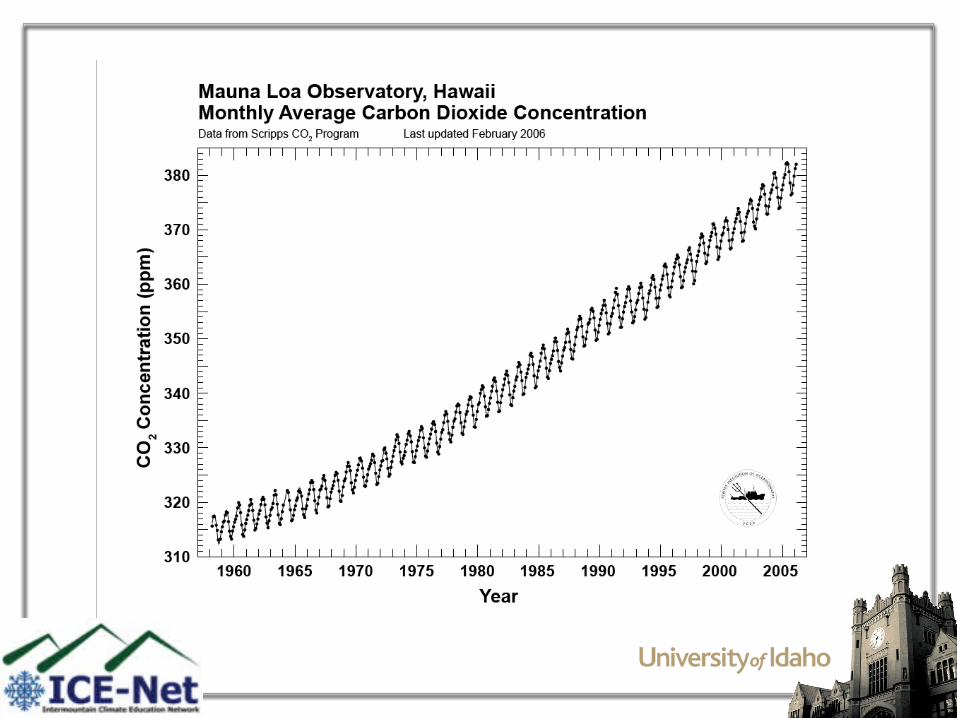
• Concentrations of Carbon Dioxide in the atmosphere have increased at rates faster than in the last 800,000 years. – Fastest in the last 100 years, since the
Industrial Revolution. – Mauna Loa: since 1959 increased from 315.98
ppm to 377.38 in 2004. Jan. 2012: 393.09ppm
• It is difficult for models to explain the warming without human interference (anthropogenic causes)

Anthropogenic Causes of Climate change
• Increased levels of greenhouse gasses like carbon dioxide and methane in the atmosphere from the combustion of fossil fuels. – Electricity production (Coal and natural gas plants)– Transportation– Industry
• Deforestation: less uptake of carbon dioxide• Mining: releases methane• Food production: very carbon and energy
intensive• And more!
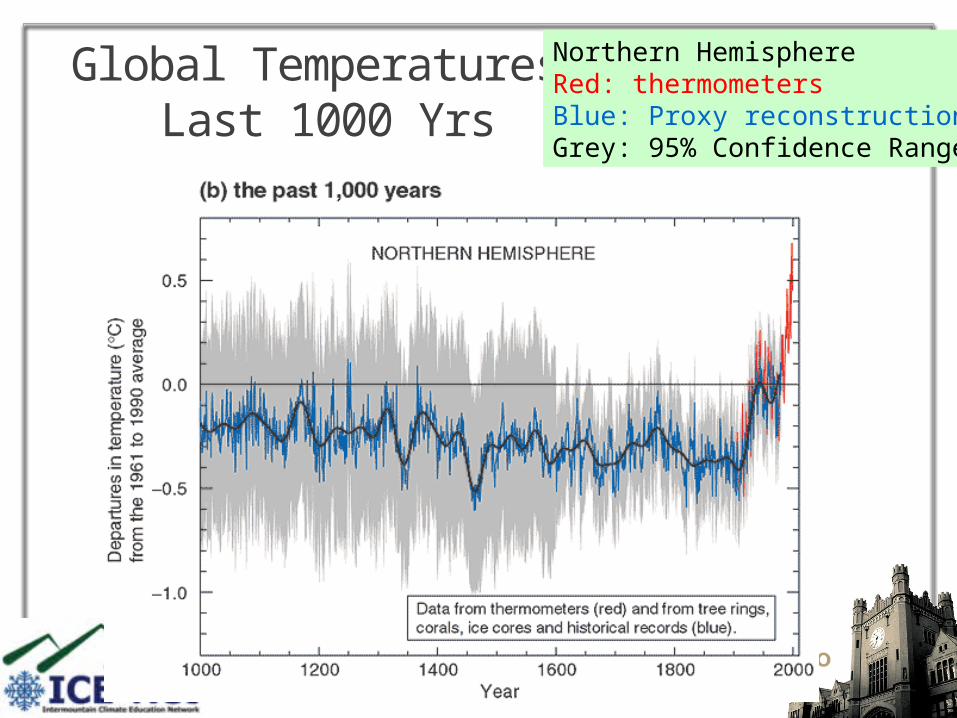
Global Temperatures: Last 1000 Yrs
Northern HemisphereRed: thermometersBlue: Proxy reconstructionGrey: 95% Confidence Range

What Changed Around 1850?
• Industrial Revolution– Increased burning of fossil fuels
• Also, extensive changes in land use began– the clearing and removal of forests
These are the two main anthropogenic contributions of atmospheric carbon (Carbon Cycle, next week)
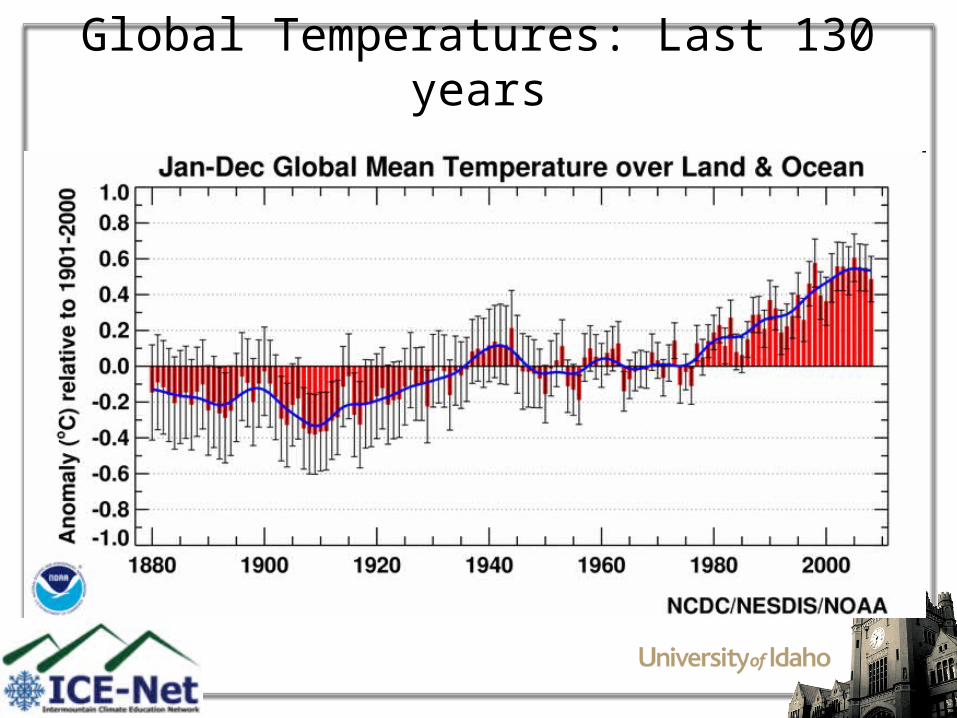
Global Temperatures: Last 130 years

11
Rate of Temperature Increase has accelerated in recent decades

Spatial View of Recent Warming
• Warming has been disproportionately affected land areas (2x)• And higher latitude regions (4x), particularly in winter-spring
1979-2005

Spring: +1.5˚C
Autumn: +0.3˚C
Seasonal Differences in Warming Trends

Changes in Precipitation
Less Rain
More Rain
Precipitation has generally increased over land north of30°N over the period 1900 to 2005 but downward trendsdominate the tropics since the 1970s.
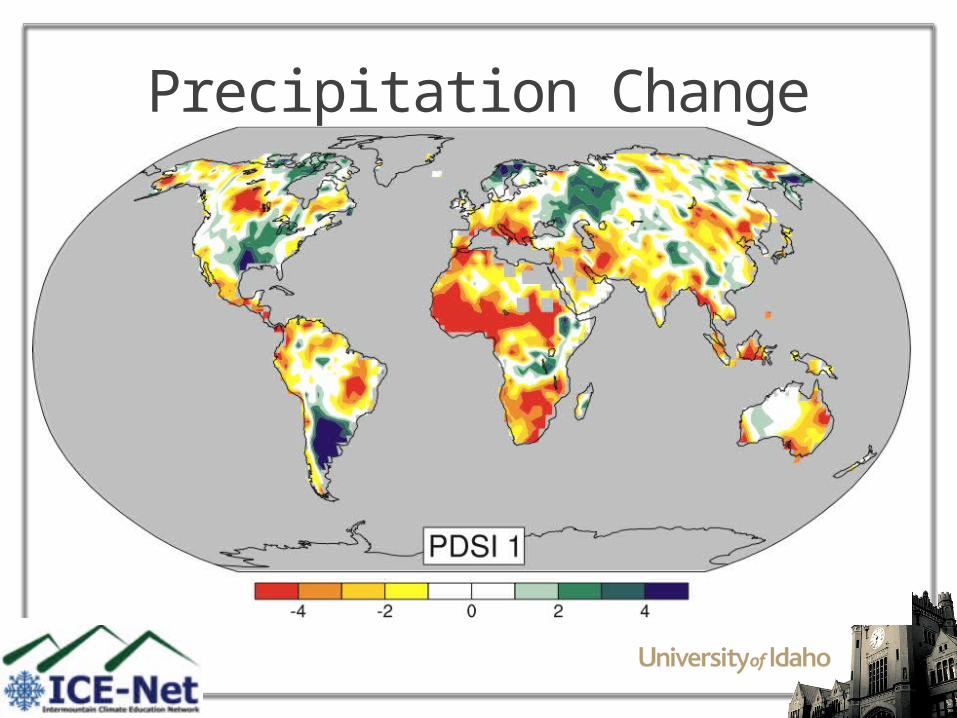
Precipitation Change


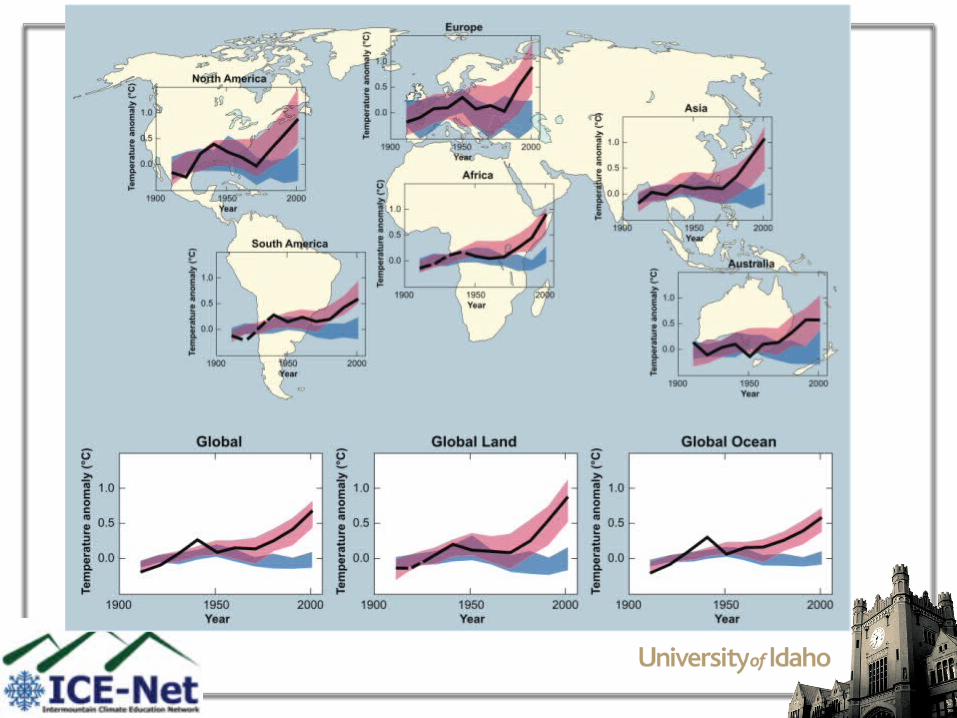
Temperature Change


SO WHAT DOES THIS MEAN?
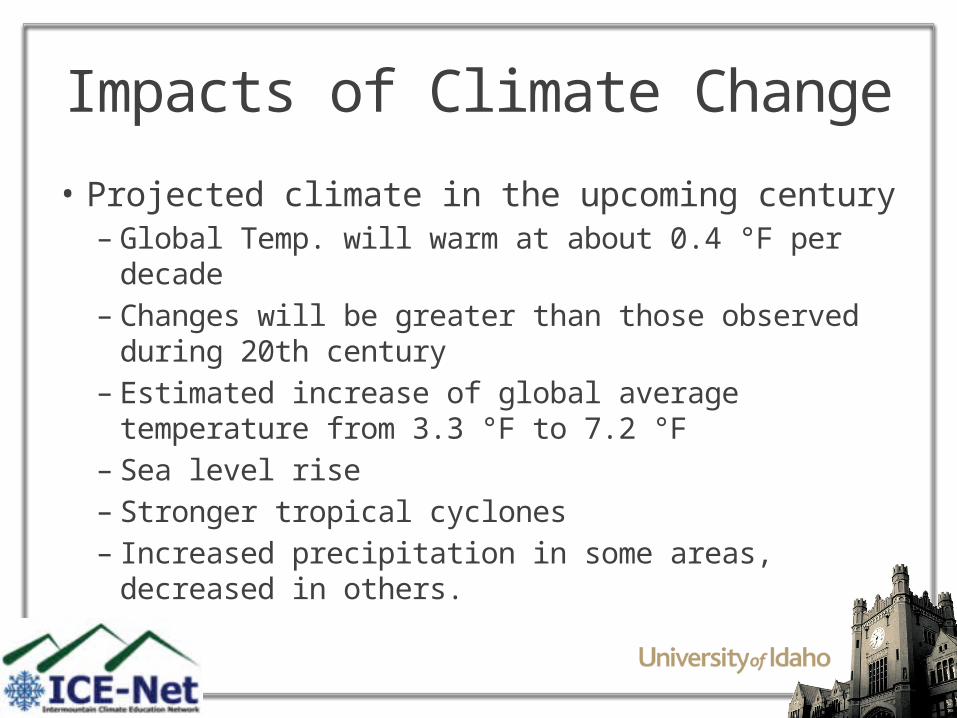
Impacts of Climate Change
• Projected climate in the upcoming century– Global Temp. will warm at about 0.4 °F per
decade– Changes will be greater than those observed
during 20th century– Estimated increase of global average
temperature from 3.3 °F to 7.2 °F– Sea level rise– Stronger tropical cyclones– Increased precipitation in some areas,
decreased in others.
More Impacts:
• Different/more extreme weather patterns
• Changes in wildlife habitats
• Elk/deer moving up in elevation.
• More bark beetles in the Western United States.
• Animals/plants moving towards the poles.
• Less freshwater available because of melting glaciers and early snowmelt.
• Melting permafrost in Arctic regions – releases Methane a greenhouse gas.

Decline in Western US Snowpack
April 1 snow water equivalent“how much water is in the snowpack”
Linear Trend 1958-2005 (cm/decade)
Timing of peak spring runoff
25
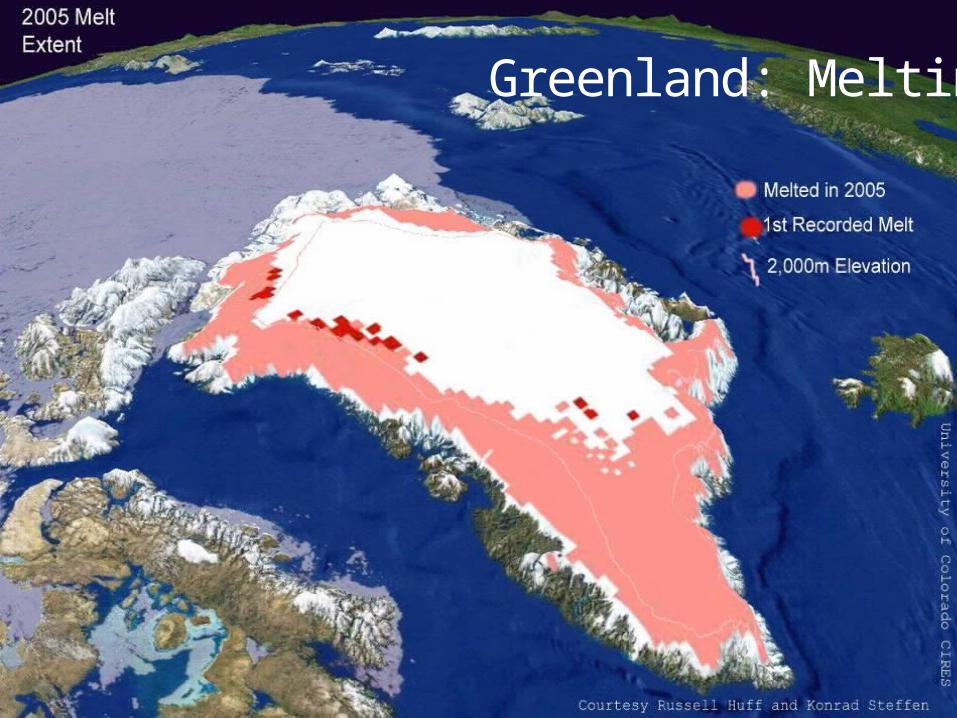
Greenland: Melting

Arctic Sea Ice Coverage

Antarctic Sea Ice Coverage

28MET 112 Global Climate Change
Antarctica: Melting and Thickening
Thickeningdue to increasedPrecipitationGrowing in East
Melting aroundthe edges, shrinking in West

Cryosphere
• Sea ice is projected to shrink in both the Arctic and Antarctic under all SRES scenarios.
• In some projections, arctic late-summer sea ice disappears almost entirely by the latter part of the 21st century…
• Continual warming post 21st century may lead to a total melting of the Greenland Ice sheet – This would raise sea levels by 7 meters!
• Scientists believe that IPCC projections on sea level rise and sea-ice dynamics are far too conservative.

Faster Than Expected

Good News: New Shipping Routes
2007: 2/3 of usual sea-ice north of Bering Strait gone2008: Northwest Passage and Northern Sea Route opens up! IPCC reports maybe Arctic will have ice-free summers by 2080

Predictions of future Sea Level
Sea level will continue to rise, between 0.2-0.6 m by 2100
Most of this increase (75%) is due to thermal expansion
IPCC did not include ALL relevant information on glacial meltwater

Sea Level Rise: Thoughts
• A sea level rise of 40cm would displace 11% of Indian’s residents ~ climate refugees
• Means that Pacific Island nations may be underwater
• Sea level rise + stronger storms = higher storm surge and flooding potential
Deep thoughts…• Melting of Greenland (4x size of California) would
lead to 7 m increase in sea level• 700 million + people live within 9 meters of sea
level
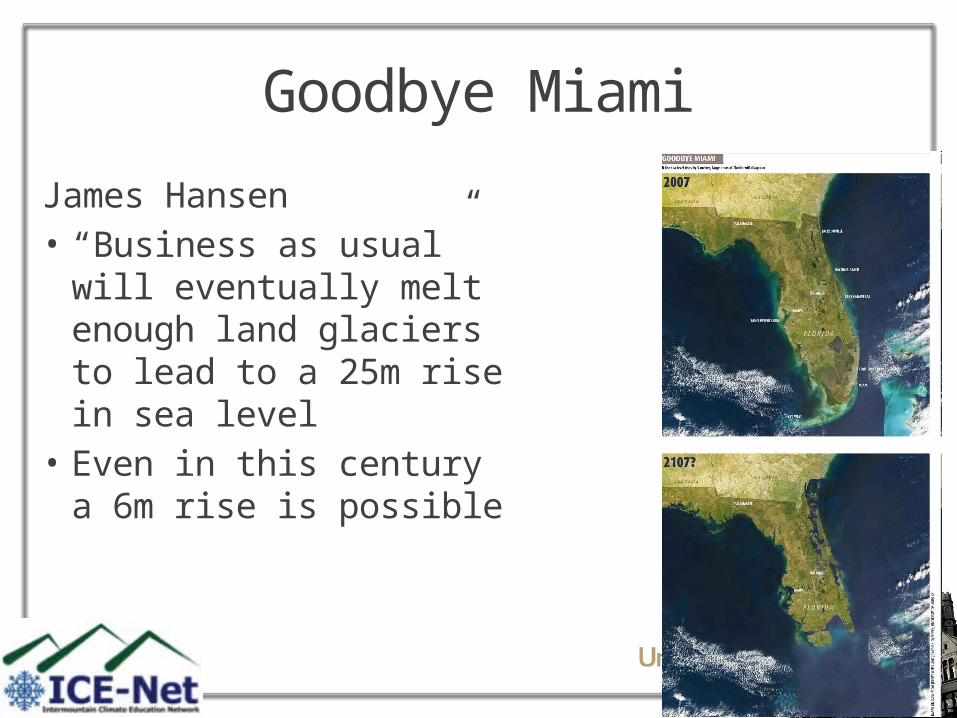
Goodbye Miami
James Hansen• “Business as usual” will
eventually melt enough land glaciers to lead to a 25m rise in sea level
• Even in this century a 6m rise is possible

Permafrost: annually frozen soil (below 0C)
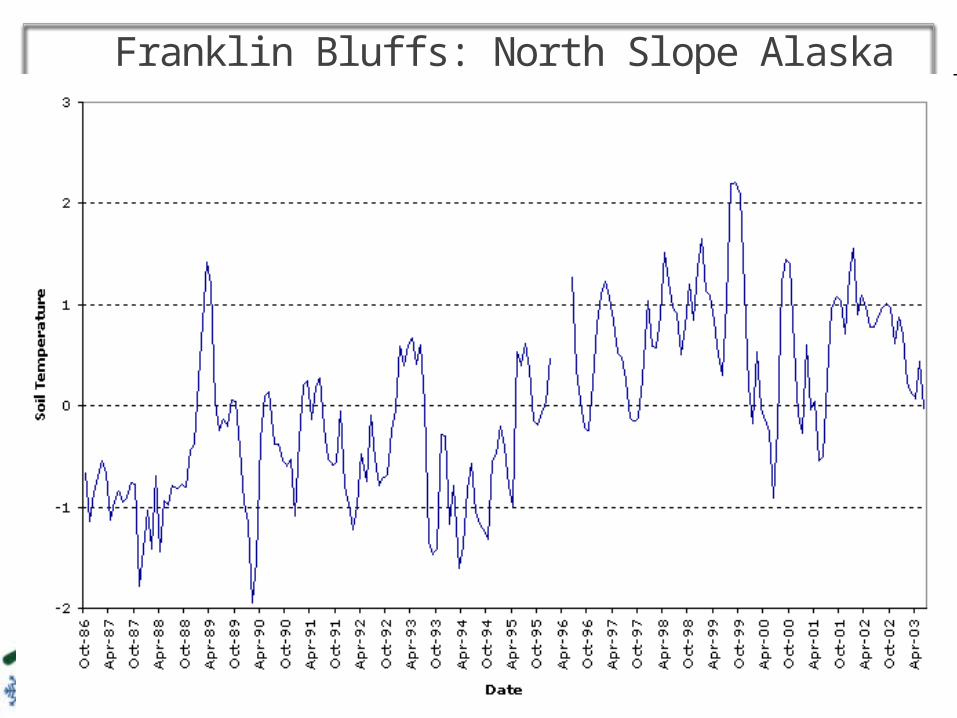
37 MET 112 Global Climate Change
Franklin Bluffs: North Slope AlaskaPermafrost temperature has increased by up to 2°C to 3°C in northern
Alaska since the 1980s

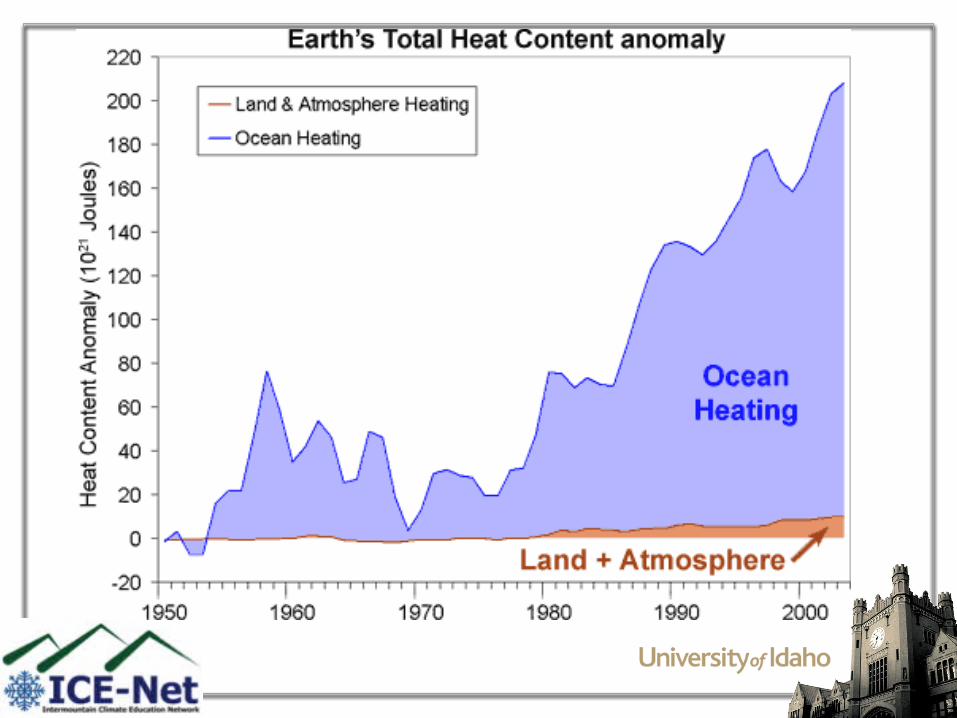
Oceanic Heat Content
• Heat content of upper 3000m of ocean has increased• Oceans, the ultimate buffer, have absorbed 80% of
heat added to climate system since industrial revolution

Sea-Level at San Francisco
Sea Level rise of 1-2mm/year

Rising atmospheric temperature
Rising sea level
Reductions in NH snow cover
And oceans..
And upper atmosphere….
Warming is Unequivocal

How the West Has Warmed
…and overachieved…
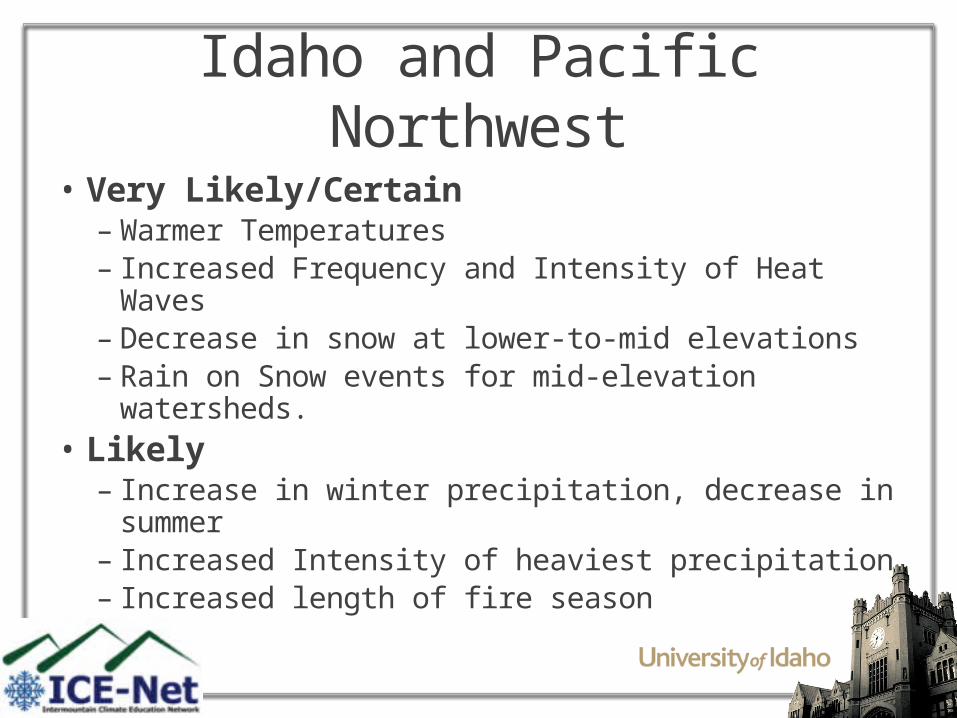
Idaho and Pacific Northwest
• Very Likely/Certain– Warmer Temperatures– Increased Frequency and Intensity of Heat Waves– Decrease in snow at lower-to-mid elevations– Rain on Snow events for mid-elevation
watersheds.• Likely
– Increase in winter precipitation, decrease in summer
– Increased Intensity of heaviest precipitation– Increased length of fire season

Precipitation
LikelyIncrease in winter precipitation Decrease in summer precipitationIncrease in Intensity of heaviest precipitation
Highly LikelyDecrease in snowfallRain on Snow events for mid-elevation watersheds
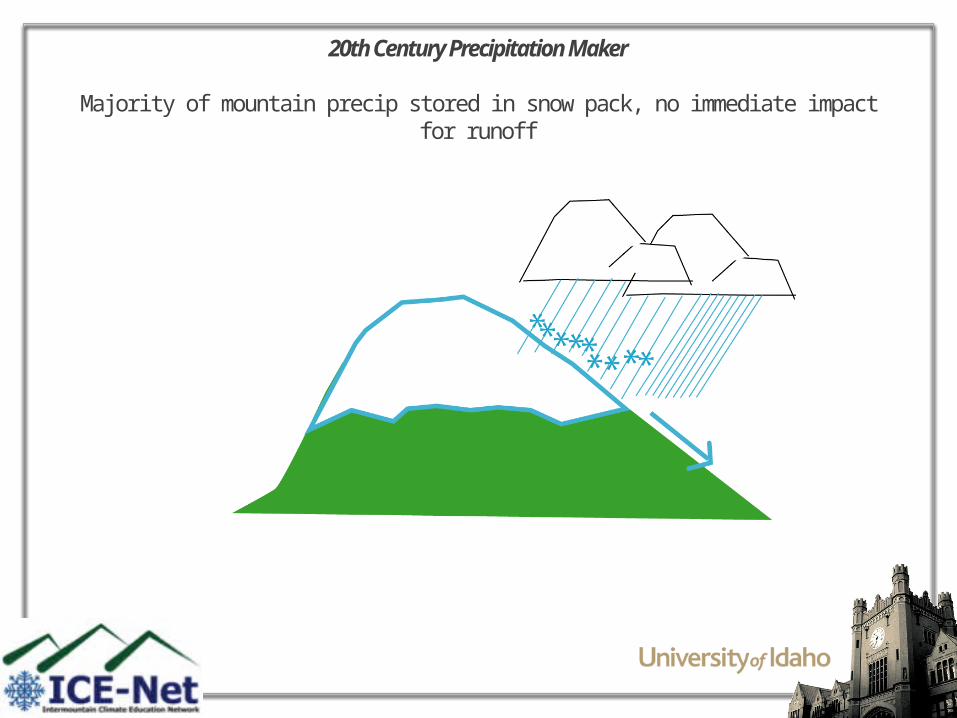
20th Century Precipitation Maker
Majority of mountain precip stored in snow pack, no immediate impact for runoff

runoff
21st Century Precipitation Maker
Significant reduction in precip stored in snow pack, immediate impact for runoff
“Climate Change” FloodAverage Snow level increase of 1-2k ft
Increased atmospheric H2O = increased heavy events

0
2000
4000
6000
8000
10000
12000
oct nov dec jan feb mar apr may jun jul aug sep
Sim
ula
ted
Nat
ura
l F
low
s (c
fs)
historical
2020A1b
2040A1b
2080A1b
Historical and Projected 21st Century Flows for the A1b Scenario
Yakima River
Increased Winter Flows
Decreased Spring/Summer Flows

Hydropower Production
Hamlet et al. 2009
• Winter production is projected to increase slightly • Summer energy production is projected to decline by 10-40%. Summer cooling demands may increase by 400%
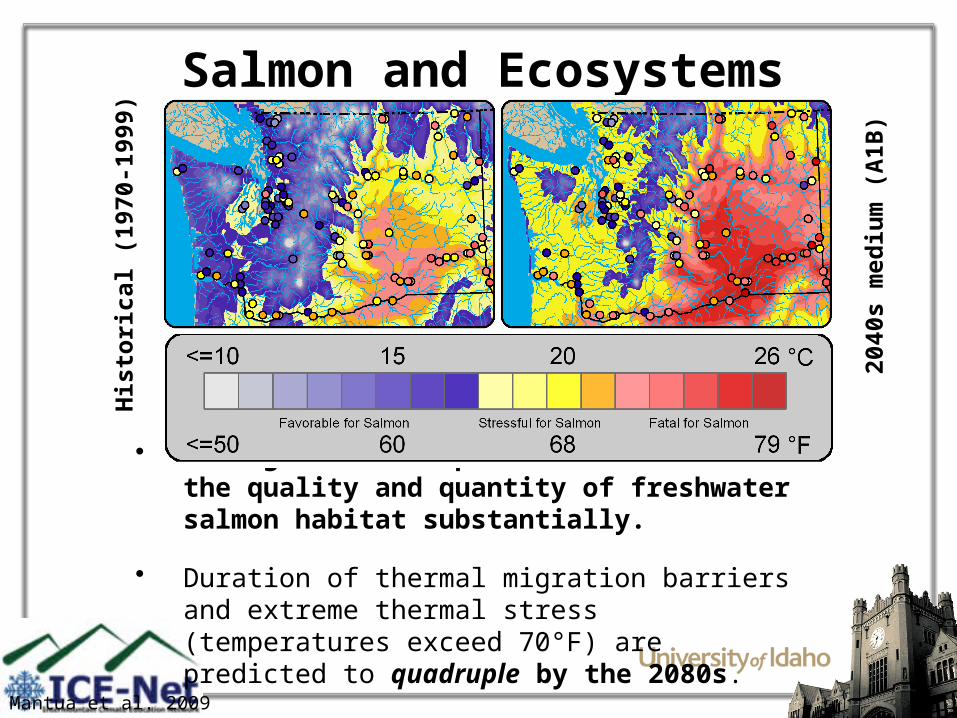
Salmon and Ecosystems
• Rising stream temperature will reduce the quality and quantity of freshwater salmon habitat substantially.
• Duration of thermal migration barriers and extreme thermal stress (temperatures exceed 70°F) are predicted to quadruple by the 2080s.
Mantua et al. 2009
His
tori
cal (1
970-1
999)
2040s m
ed
ium
(A
1B
)
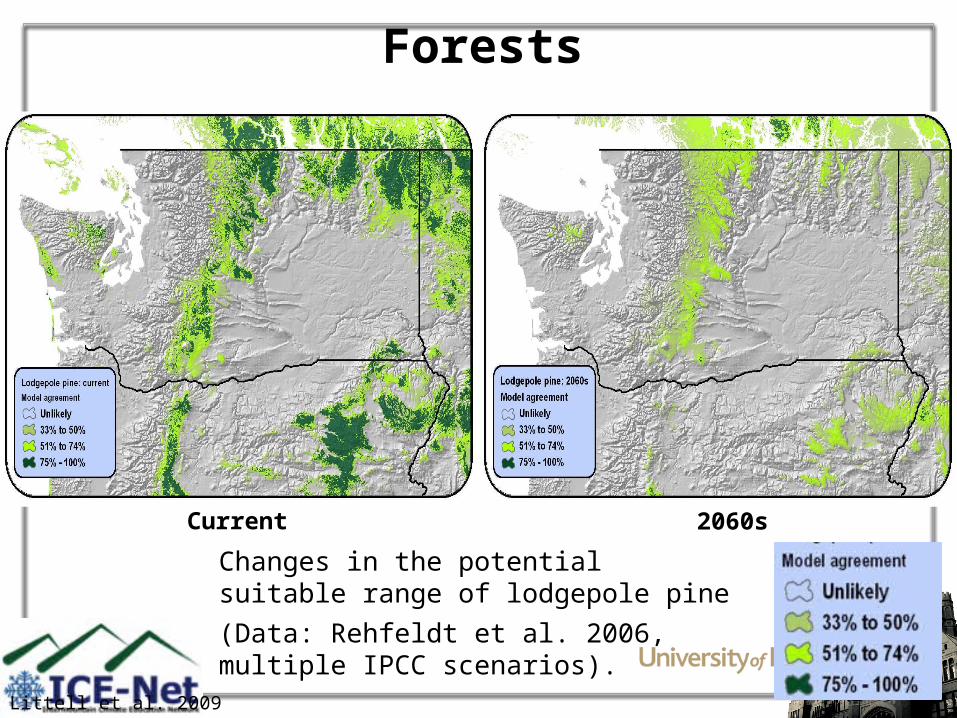
Forests
Changes in the potential suitable range of lodgepole pine
(Data: Rehfeldt et al. 2006, multiple IPCC scenarios).
Current 2060s
Littell et al. 2009

3+ billion dollar business, vast majority relies of heavy irrigation
Pros (for some crops)• Higher CO2 stimulate plant growth/water efficiency• Increased growing season length • New crops (vineyards)
Cons• Increased irrigation demands• Extreme temperatures endanger state “fruit” suitability• Increases in summer temperatures impact dairy industry
This means that agriculture will be more expensive
Agricultural Impacts

Economic ImpactsWater:
Decreased supply + Increased demands = classic formula for increased prices and shortages.
Energy:
Dramatic increase in summer cooling costs (far exceeding winter heating costs) + Decreased hydroelectric output
Food:
Agricultural losses + water losses + energy
Infrastructure:
Increase Large Fire + Increased extreme events
Things to Remember
• Observational evidence shows irrefutable warming of the climate system over the past century.
• The rate of global temperature increase has increased in recent decades
• Distribution of temperature increases are NOT uniform spatially: where is it warmest fastest? And Why?
• Cryospheric evidence supports numerous lines of observational evidence to support the warming signal
• Precipitation shows some signs of increases in high latitudes, decreases in subtropical regions.

Sources
• Dr. Crystal Kolden• Dr. John Abatzoglou
(http://webpages.uidaho.edu/jabatzoglou/)
More information:• www.westernclimateinitiative.org/• Icenetmatrix.com• http://www.atmos.washington.edu/mm5rt/• http://www.wrcc.dri.edu/research/jtwrcc/idaho-mon/• http://www.wrcc.dri.edu/monitor/WWDT/• http://www.cefa.dri.edu/Westmap/• http://www.cpc.ncep.noaa.gov/products/predictions/90day/