appendix d preliminary energy model report...preliminary energy model report for qualcomm stadium...
TRANSCRIPT
Stadium Reconstruction EIR Appendices
APPENDIX D
PRELIMINARY ENERGY MODEL REPORT


Preliminary Energy Model Report for Qualcomm Stadium and New Stadium
AECOM LA Metro 999 W Town and Country Road Orange, California 92868 USA

Prepared by: .................................................................... Victoria Watson Rui Zhu Senior Sustainability Engineer High Performance Designer High Performance Buildings & Communities High Performance Buildings & Communities Approved by: .................................................................... Alistair Macgregor Vice President High Performance Buildings Preliminary Energy Model Report for Qualcomm Stadium and New Stadium
Rev No Comments Checked by Approved by Date 0 First issue 07/15/15 1 Gas Consumption Calibration Added 07/23/15 2 Update for floor area and event updates 08/04/15 3 Second issue 08/05/15 4 Final issue 08/07/15

AECOM i
Table of Contents
List of Acronyms and Abbreviations .................................................................................................................... ii
Executive Summary ............................................................................................................................................ iii
Introduction ........................................................................................................................................................ 1 Environmental Setting ...................................................................................................................................... 1
Electricity ................................................................................................................................................. 1 Natural Gas.............................................................................................................................................. 1 Gasoline................................................................................................................................................... 2
Regulatory Setting ............................................................................................................................................ 2 California Public Utilities Commission (CPUC) and the California Energy Commission (CEC) ................. 2 Assembly and Senate Bills ....................................................................................................................... 2 Executive Orders ..................................................................................................................................... 2 Mission Valley Community Plan ............................................................................................................. 2
Energy Analysis ................................................................................................................................................... 3 Energy Model Methodology ............................................................................................................................ 3 Results ............................................................................................................................................................ 4 Discussion and Conclusion ............................................................................................................................... 5
Appendices ......................................................................................................................................................... 9
List of Figures
Figure 1: Qualcomm Stadium Photo and Dynamic Thermal Block Model for Existing Stadium .................................... 3 Figure 2: Total Energy and Energy End Use Splits .......................................................................................................... 5
List of Tables Table ES-1: Full Equivalent Event Calculations ............................................................................................................. iv Table 1: Estimated Electricity and Gas ........................................................................................................................... 4 Table 2: Full Equivalent Event Calculations ................................................................................................................... 6 Table 3: Thermal Template Areas .................................................................................................................................. 9 Table 4: Constructions ................................................................................................................................................... 9 Table 5: Thermal Template Lighting, People, Misc Values .......................................................................................... 10 Table 6: Thermal Template Usage Profile .................................................................................................................... 10 Table 7: Summary of Qualcomm Stadium and New Stadium HVAC Inputs ................................................................ 11 Table 8: Exterior Lighting Assumptions ....................................................................................................................... 11 Table 9: Catering/Laundry Assumptions ...................................................................................................................... 12 Table 10: Domestic Hot Water Energy Use ................................................................................................................. 12 Table 11: AV/COMMS/Data loads (including Cooling) ................................................................................................ 12 Table 12: Summary of Events at Qualcomm Stadium and Anticipated Events at the New Stadium .......................... 13

AECOM ii
List of Acronyms and Abbreviations
AB Assembly Bill CaRFG California Reformulated Gasoline CEC California Energy Commission CEQA California Environmental Quality Act CPUC California Public Utilities Commission ECM Energy Conservation Measure EIR Environmental Impact Report GHG greenhouse gas HVAC heating, ventilation and air conditioning IES Integrated Environment Solutions Ltd. kg/kWh kilograms per kilowatt hours kWh kilowatt-hour(s) LED light-emitting diode LEED Leadership in Energy and Environmental Design MWh megawatt hour(s) PV photovoltaics SB Senate Bill SDG&E San Diego Gas & Electric SSIMe Sustainable Systems Integrated Model for Energy

AECOM iii
Executive Summary
This technical report has been created in to support the content of Section 4.3 Energy 4 of the Stadium Reconstruction Environmental Impact Report (EIR). California Environmental Quality Act (CEQA) 15126.4(a)(1)(c) and Appendix F, Energy Conservation, of the CEQA Guidelines require that EIRs should include a discussion of the potential energy impacts of proposed projects with particular emphasis on avoiding or reducing inefficient, wasteful, and unnecessary consumption of energy.
Energy analysis has been undertaken using Dynamic Thermal Modeling to estimate annual operational energy use. Four cases have been considered: Qualcomm Stadium, Qualcomm Stadium (with increased floor area and events representing current proposals), the new stadium, and the new stadium (with existing floor area and events representing current proposals). The reason Qualcomm Stadium has been modeled with the current proposals for increased square footage and events is to understand the effect of this in isolation and the effect of the new stadium if the floor area did not increase. The Qualcomm Stadium energy model was calibrated using electricity data meter readings from Qualcomm Stadium between February 2014 and January 2015 and annual gas consumption readings. The electricity usage of Qualcomm Stadium during this time (1 year) was 5,839 megawatt hours (MWh) and the gas consumption was 44,000 therms.
The 48-year-old Qualcomm Stadium is proposed to be replaced with a sustainable, Green building that would achieve a Leadership in Energy and Environmental Design (LEED) Rating and meet the most stringent of current Title 24 (including any City of San Diego amendments) and CAL Green requirements. The new stadium would likely include more back-of-house and support areas and therefore this increase in square footage has the potential to increase the energy demand of the development. A large proportion of this additional energy should be offset by building to exceed current code, and further savings are expected by applying energy conservation measures and building square footage optimization (e.g., can the brief be met in less than 1,750,000 square feet).
It should be noted that the results of this analysis are highly dependent on model inputs such as number of annual events, timing of events, level of data/AV operations on event days and 24/7 data center loads, as well as other inputs detailed in this report.
Below is a list of energy-related recommendations:
The new stadium should be designed to achieve a high level of energy efficiency to supplement the projects LEED Gold Strategy.
The new stadium should not use any more energy than the existing Qualcomm Stadium per full stadium equivalent event. This requirement should be met using Energy Conservation Measures (ECM) where possible and then use renewable energy to further reduce the energy consumption. This avoids inefficient, wasteful, and unnecessary energy demand only to be offset by renewables.

AECOM iv
Table ES-1: Full Equivalent Event Calculations
Stadium Events ≥50,000 Full equivalent event ≥15,000 50% of full equivalent event ≤15,000 25% of full equivalent event Miscellaneous events ≥5,000 25% of full equivalent event with 50% diversity (e.g., 12.5% equivalent full event ≥500 25% of full equivalent event with 20% diversity (e.g., 5% equivalent full event) ≤500 10% of full equivalent event with 10% diversity (e.g., 1% equivalent full event) *The diversifications shown represent that certain events do not use as much representative energy as full stadium events (e.g., stadium pitch lighting not in operation).
Additional energy targets that could be included are:
ECMs that go beyond code that should be considered to meet the project targets (but are not limited to) include:
o Use of highly energy-efficient lighting including light-emitting diodes (LEDs) in back of house areas, attendee spaces, stadium lighting, and exterior parking lot.
o Installing a comprehensive lighting control system utilizing motion sensors and photocells to ensure lighting is only in operation when required and at the minimum required illuminance levels (avoid over lighting).
o Use of an LED scoreboard– An LED scoreboard can reduce energy consumption by 90% (from 1.2million kilowatt-hours (kWh) for incandescent to 130,000 kWh for LED1). Use LED Field signs.
o Use of ultra-low flow fixtures in the restrooms such as low flow faucets with aerators, dual flush toilets, and waterless urinals.
o Energy-efficient escalators with multimode operation (e.g., sleep mode).
o Optimization of kitchen use/facilities together with high efficiency (e.g., Energy Star) appliances.
o Energy-efficient heating and cooling systems.
The new stadium should not use more energy than the existing stadium using a combination of energy efficiency measures and renewable energy.
Solar photovoltaics (PV) should be implemented to provide local electricity generation on-site with a minimum installation size of 100 kW. The capacity should be increased as required to help meet the Project’s energy targets. San Diego receives and average of 5.77 kWh per square meter per day, which relates to a PV output of approximately 1,500 kWh.2 The large car parking area is an ideal candidate for overhead canopies to shade cars and provide a roof for PV to be mounted on at optimum tilt, together with the large area available on the stadium roof.
Additional “stretch “energy targets that design team may choose to pursue include:
The new stadium should comply with and exceed current Title 24 requirements, CAL Green requirements, including City amendments (whichever is most stringent). As a minimum, the Project should exceed Title 24 (2013) by 15%.
1 Game Changer – How the Sports Industry is Saving the Environment – NRDC – September 2012 2 NREL's PVWatts® Calculator

AECOM v
The new stadium should be designed to achieve Net Zero Electricity for National Football League season home games through the use of renewable energy.
Based on Appendix F of the CEQA Guidelines, a project would result in significant impacts related to energy if operation of the proposed facilities would result in the wasteful, unnecessary, or inefficient use of energy resources. Based on the analysis and guidelines provided in this report, the Project would not result in any significant and unavoidable adverse impacts in terms of building energy during operation if the guidance listed in this report is followed.

AECOM vi
This page intentionally left blank.

AECOM 1
Introduction
This technical report has been created to support the content of Section 4.3 Energy 4 of the Stadium Reconstruction Environmental Impact Report (EIR). California Environmental Quality Act (CEQA) 15126.4(a)(1)(c) and Appendix F, Energy Conservation, of the CEQA Guidelines require that EIRs should include a discussion of the potential energy impacts of proposed projects with particular emphasis on avoiding or reducing inefficient, wasteful, and unnecessary consumption of energy.
Environmental Setting
In 2012, total energy usage of the State of California was 7,641 trillion Btu. This energy use can be broken down by sector with the largest user being transportation at 37.9%, followed by Industrial at 23.1%, Residential at 19.4%, and Commercial at 19.5%.3
Electricity
Because California consumes more electricity than it generates, about one-fourth of its electricity comes from outside the state. States in the Pacific Northwest deliver power to California markets that is generated at hydroelectric power plants, and states in the Southwest have, in the past, delivered power primarily generated at coal-fired power plants3.
In 2008, California consumed an average of over 61,000 kilowatt-hours (kWh) of electricity per month. In-state natural gas-fired power plants account for more than half of California's electricity generation. Until 2012, California's two nuclear power plants typically provided almost one-fifth of the state's total generation. However, the two reactors were permanently shut down in mid-2013 cutting the amount of electricity generation from nuclear power in half. With adequate snowpack, hydroelectric power typically accounts for between one-tenth and one-fourth of California's total net generation. The recent California drought has led to less hydropower and increased natural gas generation. During the first half of 2014, hydropower accounted for only 10% of California’s total electricity generation. On average, hydropower accounted for 20% of California’s in-state generation during the first 6 months of each year from 2004 to 20133.
In 2013, 2,145 megawatts (MW) of utility-scale solar capacity entered service in California, of which more than 500 MW came from large-scale solar thermal plants. California accounted for more than 75% of U.S. utility-scale solar capacity installed in 2013.4
Qualcomm Stadium receives its electricity from San Diego Gas & Electricity (SDG&E), a natural gas and electric utility. In 2010, 42% of its electricity came from carbon-free resources; 20% from renewables and 22% from nuclear5. As of 2013 the SDG&E electricity emission factor was 0.39 kilograms per kilowatt hours (kg/kWh), compared to California at 0.28 kg/kWh and the U.S. average of 0.56 kg/kWh.6
Natural Gas
In 2013, California consumed 2,414,518 million cubic feet of natural gas while producing 252,310 million cubic feet. California natural gas production has been on the decline over the past 2 decades. Reserves and production are located primarily in geologic basins in the Central Valley, the coastal basins onshore in Northern California, and offshore along the Southern California coast. California production accounts for a very small percentage of total U.S. natural gas production and satisfies about one-tenth of state demand3.
3 US Energy Information Administration – DOE – California State Energy Profile 4 US Energy Information Administration – DOE – California 2014 EIA reports and Publications 5 San Diego gas & Electricity (SDGE) - http://www.sdge.com/renewable-energy 6 California and US Average for 2014 - Emission Factors for Greenhouse Gas Inventories – EPA. SDG&E – CRIS: Climate Registry Information System

AECOM 2
Qualcomm Stadium receives its gas from SDG&E, a natural gas and electric utility. Upon completion, natural gas would likely be used for hot water, cooking, and space heating.
Gasoline
While gasoline consumption has been declining since 2008 7 it is still by far the dominant fuel used in transportation.8 More motor vehicles are registered in California than in any other state, and commute times in California are among the longest in the country.9 Nearly 18 billion gallons of on-highway fuel are burned each year, including 14.5 billion gallons of gasoline8. However California leads the nation in registered alternatively fueled vehicles and requires that all California motorists use, at a minimum, a specific blend of gasoline called California Reformulated Gasoline (CaRFG). In ozone nonattainment areas motorists face even stricter requirements and must use CaRFG. As a result, California also leads the nation in retail sales of reformulated gasoline. In addition in 2013, California was home to almost half of all of the nation’s 104,000 plug-in hybrid electric vehicles.
Regulatory Setting
California Public Utilities Commission (CPUC) and the California Energy Commission (CEC)
CPUC regulates privately owned electric, natural gas, telecommunications, water, railroad, rail transit, and passenger transportation companies. CEC is the California’s energy policy and planning agency. The agency was established by the Warren-Alquist Act in 1974 in response to the energy crisis of the early 1970s and the state’s unsustainable growing demand for energy resources CEC is committed to reducing energy costs and environmental impacts of energy use—such as greenhouse gas emissions (GHGs)—while ensuring a safe, resilient, and reliable supply of energy. Title 24 of the California Building Code includes energy efficiency standards.
Assembly and Senate Bills
Assembly Bill (AB) 32 (Senate Bill [SB] 32) – The California Global Warming Solutions Act was signed into law in 2006 and requires California to cap its GHG emissions at 1990 levels by 2010 and was landmark climate change legislation for California.10 SB 375, California’s Regional Transportation and Land Use Planning Efforts was enacted to support the efforts of AB 32 by controlling indirect gas emissions through land use and transportation processes.11
Executive Orders
Executive Order S-3-05412 sets a state goal of reducing GHG emissions to 80% below 1990 levels by 2050. This is further reflected in Governor Brown’s Executive Order B-16-2012.13 Executive Order B-16-2012 also calls for infrastructure to support 1 million electric vehicles on the road by 2020 and 1.5 million electric vehicles on the road by 202513. Executive order S-14-08 raises California’s renewable energy goals, where all retailers of electricity shall serve 33% of their loads with renewable energy projects by 2020 and simplifies the licenses process for renewable energy projects.14
Mission Valley Community Plan
The purpose of the Mission Valley Community Plan is to provide recommendations to guide development in Mission Valley through the horizon year. It was adopted in 1985 and last amended in May 2013. It sets out measures to encourage new developments to make the best use of available energy. 7 California Energy Commission. 2013. 2013 Integrated Energy Policy Report. Publication Number: CEC-100-2013-001-CMF, http://www.energy.ca.gov/2013publications/CEC-100-2013-001/CEC-100-2013-001-CMF.pdf. 8 California Energy Commission. 2014 Integrated Policy Report - http://www.energy.ca.gov/2014publications/CEC-100-2014-001/CEC-100-2014-001-CMF.pdf 9 US Energy Information Administration – DOE - http://www.eia.gov/state/analysis.cfm?sid=CA 10 Assembly Bill 32 (SB 32) - The California Global Warming Solutions Act - http://www.leginfo.ca.gov/pub/05-06/bill/asm/ab_0001-0050/ab_32_bill_20060927_chaptered.pdf 11 Senate Bill 375 (SB 375) - California’s Regional Transportation and Land Use Planning Efforts - http://rtpscs.scag.ca.gov/Documents/scs/sb_375_bill_20080930_chaptered.pdf 12 Executive Order S-3-054 - http://gov.ca.gov/news.php?id=1861. 13 Executive order B-16-2012 - http://www.gov.ca.gov/news.php?id=17463. 14 Executive order S-14-08 - http://gov.ca.gov/news.php?id=11072

AECOM 3
Energy Analysis
As part of the City of San Diego Climate Action Plan (CAP),15 the City is in the process of creating a CAP CEQA consistency checklist for New Development for CEQA Tiering to be completed during Project review. In the absence of this document, this report includes analysis that can be used to help determine the potential energy impact of the new stadium operation with a particular emphasis on avoiding or reducing inefficient, wasteful, and unnecessary consumption of energy in line with CEQA requirements.
Energy Model Methodology
To carry out the dynamic thermal simulations, AECOM utilizes the industry standard Virtual Environment Pro version 2014 software suite from Integrated Environment Solutions Ltd. The IES<VE> is an integrated suite of applications based around one three-dimensional geometric computer model. The modules used for the Project include “Suncast,” for solar shading analysis and “Apache,” for thermal simulation calculations
The hourly 8760 building load profile (heating and cooling) was then input into AECOM’s Sustainable Systems Integrated Model for Energy (SSIMe). The SSIMe (SSIM Energy) tool is a conceptual energy assessment tool developed by AECOM to provide to provide holistic, high-level energy analysis for new residential and nonresidential buildings.
The images below show the existing Qualcomm Stadium and the IES <VE> block energy model.
Figure 1: Qualcomm Stadium Photo and Dynamic Thermal Block Model for Existing Stadium
The inputs for both the Qualcomm Stadium model and the new stadium models are listed in the Appendices. The Qualcomm Stadium energy model was calibrated using electricity data meter readings from Qualcomm Stadium between February 2014 and January 2015 and annual gas consumption readings. The electricity usage of Qualcomm Stadium during this time was 5,839 MWh. The annual gas consumption of the Stadium is 44,000 therms. Four cases have been considered, which are described below.
Case 1: Qualcomm Stadium (existing) Qualcomm Stadium floor area – 1,350,400ft2 total Existing events (see Table 12) Existing building envelope, heating, ventilation and air conditioning (HVAC) efficiencies and lighting
power density
15 City of San Diego Climate Action Plan – Draft March 2015

AECOM 4
Case 2: Qualcomm Stadium (with increased floor area and increased events) Expanded to include new stadium Floor Area – 1,700,000 ft2 total Proposed events (see Table 12) Existing building envelope, HVAC efficiencies and lighting power density
Case 3: New Stadium
New Stadium Floor Area – 1,700,000 ft2 total Proposed events (see Table 12) Title 24 building envelope, HVAC efficiencies and lighting power density
Case 4 New Stadium (with existing floor area and events)
Qualcomm Stadium floor area – 1,350,400ft2 total Proposed events (see Table 12) Title 24 building envelope, HVAC efficiencies and lighting power density
Results
The baseline energy model currently uses 5,768 MWh of electricity, which is within a 5% calibration tolerance of the existing annual electricity consumption taken from metered readings over a yearly time period. It is therefore deemed a reasonable representation of the existing facility. It should be noted that gas is relatively high considering the building type and climate; therefore, it has been assumed that the majority of the gas consumption is from catering. However, at this stage, until a detailed energy audit is done it is not possible to determine if any of the gas consumption is due to inefficiencies in the existing building operation/systems.
Table 1: Estimated Electricity and Gas
Case 1: Qualcomm
Stadium (existing)
Case 2: Qualcomm Stadium
(with increased floor area and
increased events)
Case 3: New Stadium
Case 4: New Stadium (with existing floor area
and increased events)
Gas (therms) 44,758 67,035 56,259 55,975
Electricity (kWh) 5,768,086 7,175,216 6,322,344 5,108,017
The energy splits modeled for both Qualcomm Stadium, Qualcomm Stadium with increased events and floor area, and the new stadium are shown below

AECOM 5
Figure 2: Total Energy and Energy End Use Splits
Discussion and Conclusion
The 48-year-old Qualcomm Stadium is proposed to be replaced with a sustainable, Green building that would achieve a Leadership in Energy and Environmental Design (LEED) Rating and meet and exceed current Title 24 (including any City amendments) and CAL Green requirements. The new stadium would likely include more back-of-house and support areas and therefore an increase in square footage (see Appendices). However, this increase in square footage should be offset by an increase in building efficiency due to the requirement to exceed current code and the level of energy efficiency features that would be required to meet the Project’s LEED aspirations. Figure 2 shows the energy use of the Qualcomm Stadium, next to the energy use of the existing stadium if the square footage and number of events were increased to that proposed for the new stadium, the energy use of the new stadium when built to current code, and finally the energy use of the new stadium if the existing square footage remained.
The results show that it is estimated the proposed increase in floor area and number of events for the new stadium would result in a 29% increase in energy use. The new stadium would be built to exceed current code, which requires higher levels of energy efficiencies resulting is improved building envelope, HVAC efficiencies, and lighting efficiencies. Once minimum code requirements are integrated into the energy model, the energy reduces by 16% showing a 13% increase over the Qualcomm Stadium current annual energy use. Additional energy savings are required either through further application of energy conservation measures, building square footage optimization or a combination, and the installation of renewable technologies to ensure that the new stadium meets its energy targets as listed in this report. The final case shows the effect of a reduction in square footage to the existing square footage to show the benefit that square footage optimization can have on energy use.
It should be noted that the results of this analysis are highly dependent on model inputs such as number of annual events, timing of events, level of data/AV operations on event days, and 24/7 data center loads, as well as other inputs detailed in this report.
AECOM 6
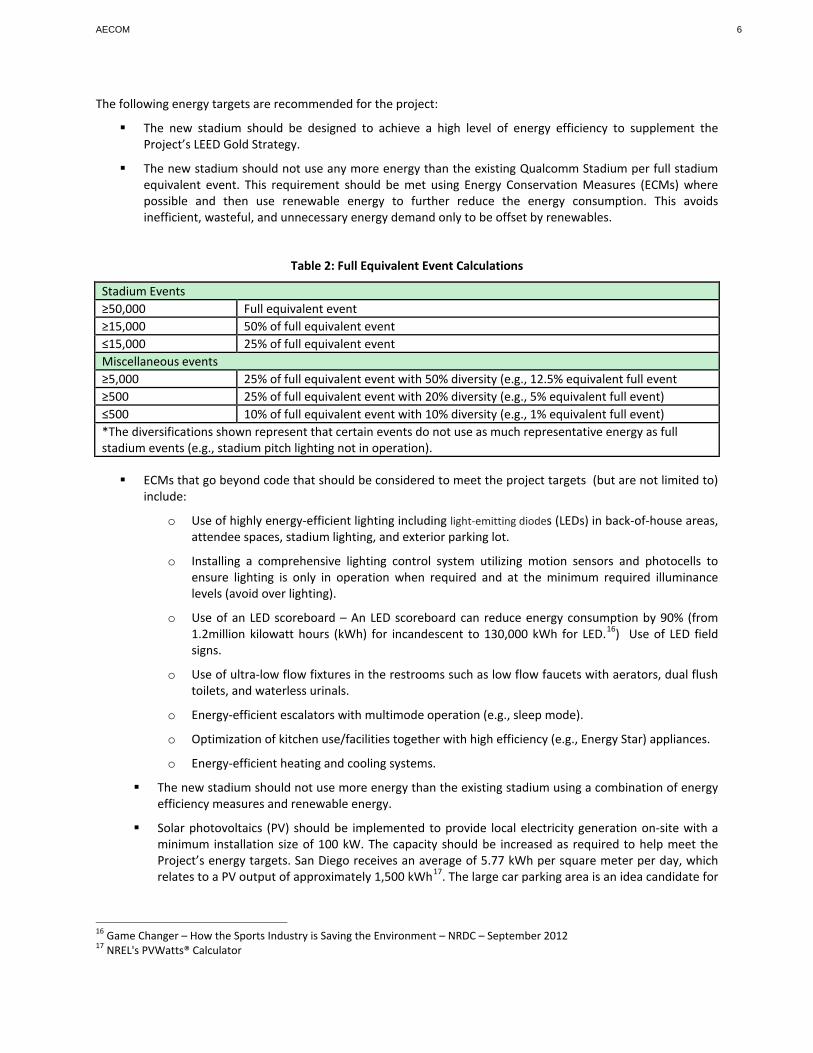
The following energy targets are recommended for the project:
The new stadium should be designed to achieve a high level of energy efficiency to supplement the Project’s LEED Gold Strategy.
The new stadium should not use any more energy than the existing Qualcomm Stadium per full stadium equivalent event. This requirement should be met using Energy Conservation Measures (ECMs) where possible and then use renewable energy to further reduce the energy consumption. This avoids inefficient, wasteful, and unnecessary energy demand only to be offset by renewables.
Table 2: Full Equivalent Event Calculations
Stadium Events ≥50,000 Full equivalent event ≥15,000 50% of full equivalent event ≤15,000 25% of full equivalent event Miscellaneous events ≥5,000 25% of full equivalent event with 50% diversity (e.g., 12.5% equivalent full event ≥500 25% of full equivalent event with 20% diversity (e.g., 5% equivalent full event) ≤500 10% of full equivalent event with 10% diversity (e.g., 1% equivalent full event) *The diversifications shown represent that certain events do not use as much representative energy as full stadium events (e.g., stadium pitch lighting not in operation).
ECMs that go beyond code that should be considered to meet the project targets (but are not limited to)
include:
o Use of highly energy-efficient lighting including light-emitting diodes (LEDs) in back-of-house areas, attendee spaces, stadium lighting, and exterior parking lot.
o Installing a comprehensive lighting control system utilizing motion sensors and photocells to ensure lighting is only in operation when required and at the minimum required illuminance levels (avoid over lighting).
o Use of an LED scoreboard – An LED scoreboard can reduce energy consumption by 90% (from 1.2million kilowatt hours (kWh) for incandescent to 130,000 kWh for LED.16) Use of LED field signs.
o Use of ultra-low flow fixtures in the restrooms such as low flow faucets with aerators, dual flush toilets, and waterless urinals.
o Energy-efficient escalators with multimode operation (e.g., sleep mode).
o Optimization of kitchen use/facilities together with high efficiency (e.g., Energy Star) appliances.
o Energy-efficient heating and cooling systems.
The new stadium should not use more energy than the existing stadium using a combination of energy efficiency measures and renewable energy.
Solar photovoltaics (PV) should be implemented to provide local electricity generation on-site with a minimum installation size of 100 kW. The capacity should be increased as required to help meet the Project’s energy targets. San Diego receives an average of 5.77 kWh per square meter per day, which relates to a PV output of approximately 1,500 kWh17. The large car parking area is an idea candidate for
16 Game Changer – How the Sports Industry is Saving the Environment – NRDC – September 2012 17 NREL's PVWatts® Calculator

AECOM 7
overhead canopies to shade cars and provide a roof for PV to be mounted on at optimum tilt together with the large area available on the stadium roof.
Additional “stretch “energy targets that the Project design team may choose to pursue include:
The new stadium should comply with and exceed current Title 24 requirements and CAL Green requirements including City amendments (whichever is most stringent). At a minimum, the Project should exceed Title 24 (2013) by 15%.
The new stadium should be designed to achieve Net Zero Electricity for NFL season home games through the use of renewable energy.
Based on Appendix F, Energy Conservation, of the CEQA Guidelines, a project would result in significant impacts related to energy if operation of the proposed facilities would result in the wasteful, unnecessary, or inefficient use of energy resources. Based on the analysis and guidelines provided in this report, the Project would not result in any significant and unavoidable adverse impacts in terms of building energy during operation if the guidance listed in this report is followed.

AECOM 8
This page intentionally left blank.

AECOM 9
Appendices
Thermal Model Inputs:
Table 3: Thermal Template Areas
Stadium Uses Area (sf) Estimated
Size
(Proposed)
Estimated Size
(Existing)
Energy Model Thermal Template
Breakdown Size (ft2)
(Proposed)
Breakdown Size (ft2) (Existing)
Attendee Facilities
730,000 760,000 Seating 340,000 360,000
Restrooms 60,000 30,000 Guest services 330,000 370,000
Circulation
530,000 288,000 Concourses 330,000 72,000 Ramps 160,000 192,000 Elevator/Escalators 40,000 24,000
Stadium Operations
300,000 240,000 Elec/Mech 150,000 120,000 Data 150,000 120,000
Food Services and Merchandise Facilities
100,000 24,000 Food Prep 50,000 12,000
Retail 50,000 12,000 Teams Locker Facilities 50,000 24,000 Locker room 50,000 24,000 Media Facilities 30,000 12,000 Media 30,000 12,000
Administrative Facilities 10,000 2,400 Office 10,000 2,400
Total 1,750,000 1,350,400 1,750,000 1,350,400
Table 4: Constructions
Constructions [U-value (kBtu/h ft2 F)] Reference Source Wall Roof Floor Glazing SHGC
Qualcomm Stadium ASHRAE 90.1 1989 0.37 0.1 0.17 0.81 0.43
New Stadium Title 24 2013 0.098 0.065 0.071 0.36 0.25

AECOM 10
Table 5: Thermal Template Lighting, People, Misc Values
Existing Stadium (ASHRAE 90.1 1989) Room types Lighting (W/sf) People (sf/person) Misc (W/sf)
Attendee Facilities
Seating 6.2 0
Restrooms 1.2 100 0 Guest services 2 30 2
Circulation
Concourses 1.4 100 0.5 Ramps 1.3 100 0 Elevator/Escalators 1.3 100 0.1
Stadium Operations
Elec/Mech 1.2 333 2 Storage 0.6 333 0.1
Food Services and Merchandise Facilities
Food Prep 1.34 200 5
Retail 2.83 25 2 Teams Locker Facilities Locker room 1.2 50 2 Media Facilities Media 1.9 15 10.75
Administrative Facilities Office 1.9 100 2
Table 6: Thermal Template Usage Profile
Stadium Uses Breakdown Event Day Profiles
Attendee Facilities
Seating Event-5:30pm to 8:30pm 100%, with 1 hour before and after for 50%
Restrooms Event-5:30pm to 8:30pm 10%, with 1 hour before and after for 20% Guest services Event-5:30pm to 8:30pm 5%, with 1 hour before and after for 50%
Circulation
Concourses Event-5:30pm to 8:30pm 5%, with 1 hour before and after for 50% Ramps Event-5:30pm to 8:30pm 5%, with 1 hour before and after for 50% Elevator/ Escalators Event-5:30pm to 8:30pm 5%, with 1 hour before and after for 50%
Stadium Operations
Elec/Mech Event-5:30pm to 8:30pm 100%, with 3 hour before and 1 hour after for 50%
Storage Event-5:30pm to 8:30pm 10%, with 1 hour before and after for 20% Food Services and Merchandise Facilities
Food Prep Event-5:30pm to 8:30pm 5%, with 1 hour before and after for 50%
Retail Event-5:30pm to 8:30pm 5%, with 1 hour before and after for 50%
Teams Locker Facilities Locker room Event-5:30pm to 8:30pm 5%, with 1 hour before and after for 100%
Media Facilities Media Event-5:30pm to 8:30pm 100%, with 1 hour before and after for 50% Administrative Facilities Office Event-5:30pm to 8:30pm 100%, with 1 hour before and after for 50%
1. For existing stadium, event is once a week from August 1 to Jan 31 (See Table 12 for summary of stadium events) 2. For proposed stadium, event is once a week from June 15 to March 31 (See Table 12 for summary of stadium events) 3. Remain 10% lighting and misc for rest of the time 4. The event profiles are created based on the adjustments of events summary table (see Table 12) with size of events and number of attendees taken into consideration to provide an approximation of the number of events.

AECOM 11
SSIME Model Inputs:
Table 7: Summary of Qualcomm Stadium and New Stadium HVAC Inputs
HVAC SYSTEM
Qualcomm Stadium (Existing) New Stadium System Type System 3: PSZ-AC System 7: VAV with reheat AHU Fan control System 3 – Constant System 7- Variable AHU Fan Power 3W/l/s 2W/l/s Economizer 75oF high limit shutoff 75oF high limit shutoff Chiller Type DX Cooling Water cooled - Variable speed Chiller COP 2.5 6.0 Computer/Data room Cooling COP 2.5 4.0
Chilled Water Pumps NA 22 W/gpm Condenser pumps NA 19W/gpm Heating Type Fossil fuel furnace Fossil fuel boiler Heating efficiency 70% 90% Hot water Pumps NA 22 W/gpm Domestic Hot water efficiency 80% 92%
Domestic Hot water fixtures Lavatory = 0.25 GPM
Kitchen sink = 2.2 GPM Shower = 2.5 GPM
Lavatory = 0.1 GPM Kitchen sink = 2.5 GPM
Shower = 2.5 GPM Other Model Inputs:
Table 8: Exterior Lighting Assumptions
Exterior lighting values assumed Fixture (W) No. kW
Events per year
Annual Hrs of
operation
Annual Energy (MWh)
Qualcomm Stadium Parking lot 94 612 58 NA 5110 294 685
Qualcomm Stadium Lighting 1500 1550 2,325 24 168 391 New Stadium Parking lot 94 348 33 NA 5110 167
769 New Stadium Stadium Lighting 1500 1550 2,325 37 259 602 Qualcomm Stadium Parking lot (more events) 94 612 58 NA 5110 294
896 Qualcomm Stadium Lighting (more events) 1500 1550 2,325 37 259 602

AECOM 12
Table 9: Catering/Laundry Assumptions
Catering / Laundry Electricity (kWh) Gas (kBTU)
Qualcomm Stadium 178,600 4,156,797 Qualcomm Stadium (more events) 275,342 6,408,396 New Stadium 265,578 5,374,911 1. Estimates based on past project experience and current Qualcomm gas load.
Table 10: Domestic Hot Water Energy Use
Domestic Hot Water Gas (kBTU)
Qualcomm Stadium 107,317 Qualcomm Stadium (more events) 165,447 New Stadium 107,163 1. Estimates based on other sporting venue projects scaled based on number of attendees and events per annum. Qualcomm Stadium based on EPA fixture flow rates and new stadium based on Low flow fixtures. See Table 6 for fixture flow rates and DHW generator efficiencies assumed in calculations.
Table 11: AV/COMMS/Data loads (including Cooling)
AV/COMMS/Data loads (including Cooling) Electricity (kW)
Control Room/Data room (internal) 24/7 loads 190 Control Room/Data room (internal) Event Day loads 127 Telecomm Spaces 24/7 loads 59 Exterior data/AV (scoreboard, speakers etc.) Event Day loads 50 1. Estimates based on other sporting venue projects. It should be noted that the annual energy use is highly dependent on the level of data/AV operations on event days and 24/7 data center loads.

AECOM 13
Table 12: Summary of Events at Qualcomm Stadium and Anticipated Events at the New Stadium
Event Qualcomm Event Days
Qualcomm Event Attendance
Projected New Stadium Event
Days
Projected Attendance
STADIUM EVENTS NFL Football
NFL Pre- & Regular Season 10 home games 65,432 10 home
games 68,000
NFL Post-Season 0 – 2 games 72,000
Super Bowl 0 – 1 game per 5 yrs 72,000
Collegiate Football San Diego State University 6 games 15,500 6 games 30,000
Poinsettia Bowl 1 game 33,000 1 game 40,000 Holiday Bowl 1 game 50,000 1 game 60,000 Mountain West Championship – – 1 game 37,000
Other Events High School Football 3 games 4,000 3 games 18,000 Soccer Games 2 20,000–50,000 5 60,000 Concerts 01 – 2 60,000 Monster Trucks 1 50,000 1 60,000 Supercross 1 50,000 1 65,000 MISCELLANEOUS EVENTS
Large Events 4 15,001–20,000 10 15,001–20,000 Medium Events 4 5,001–15,000 52 5,001–15,000 Small Events 30 501–5,000 55 501–5,000 Minor Events 170 Less than 500 195 Less than 500
1 The recent One Direction concert was the first in the past 12 years and does not present statistical significance for characterizing the baseline. This concert had 13,456 cars enter the site with a disproportionately high level of drop-offs/pick-ups due to the crowd pre-teen/teen demographic.

AECOM 14
This page intentionally left blank.