april 2010 rff dp 10-20 discussion paper … · · 2010-04-16april 2010 rff dp 10-20 options for...
TRANSCRIPT
1616 P St. NW Washington, DC 20036 202-328-5000 www.rff.org
Apri l 2010 RFF DP 10-20
Options for Energy Efficiency in India and Barriers to Their Adoption
A Scoping Study
Soma Bh a t tacharya and Maureen L . Croppe r
DIS
CU
SSIO
N P
APE
R

© 2010 Resources for the Future. All rights reserved. No portion of this paper may be reproduced without permission of the authors.
Discussion papers are research materials circulated by their authors for purposes of information and discussion. They have not necessarily undergone formal peer review.
Options for Energy Efficiency in India and Barriers to Their Adoption: A Scoping Study
Soma Bhattacharya and Maureen L. Cropper
Abstract We review the economics literature on energy efficiency in India, as a guide for further research
in the area. The empirical literature has focused on four questions: How does energy efficiency in India compare with energy efficiency in other countries? What would be the energy savings (and cost savings) from adopting certain energy-efficient technologies? Why are these technologies being—or not being—adopted? What policies should be implemented to encourage their adoption? Most of the literature focuses on answers to the first two questions. Studies are needed that quantify factors affecting the rate of diffusion of energy-efficient technologies and rigorously evaluate reforms implemented by the Government of India, beginning in the 1990s, that could affect energy efficiency.
Key Words: energy efficiency, energy use, India
JEL Classification Numbers: O33, Q4
Contents
1. Introduction ......................................................................................................................... 1
2. Industrial Energy Usage .................................................................................................... 3
Energy Efficiency in Indian Industry, 1973–94 .................................................................. 4
Government Policies Affecting Energy Efficiency in Indian Industry ............................... 7
3. Energy Efficiency in the Power Sector.............................................................................. 8
The Indian Power Sector: Background ............................................................................... 8
The Efficiency of Existing Thermal Plants ....................................................................... 10
4. Household Energy Usage .................................................................................................. 14
Consumption of Cooking Fuels in the Household ............................................................ 15
Adoption of Energy-Efficient Lighting ............................................................................ 18
Adoption of Energy-Efficient Household Appliances ...................................................... 19
5. Conclusions—Barriers to Energy Efficiency and Research Needs .............................. 22
Research Needs ................................................................................................................. 23
References .............................................................................................................................. 25
Appendix A: An Overview of Energy Consumption and Production in India ............... 30
Appendix B: Specific Energy Consumption (SEC) Compared with Best Practice in Selected Indian Industries ............................................................................................................. 33
Aluminum ......................................................................................................................... 33
Cement .............................................................................................................................. 34
Iron and Steel .................................................................................................................... 34
Fertilizer ............................................................................................................................ 35
Pulp and Paper .................................................................................................................. 35

Resources for the Future Bhattacharya and Cropper
1
Options for Energy Efficiency in India and Barriers to Their Adoption: A Scoping Study
Soma Bhattacharya and Maureen L. Cropper∗
1. Introduction
This study examines the economics literature on options for energy efficiency in India and barriers to their adoption. Interest in the topic reflects the importance of energy both in the development of the Indian economy and in India’s growing emissions of carbon dioxide. Although carbon emissions in India remain low in per capita terms, total emissions are growing and will continue to grow with industrialization and increases in electricity supply. Improvements in energy efficiency (i.e., reductions in energy per unit of output) are often suggested as a means of reducing carbon emissions. In many cases, improvements in energy efficiency will pay for themselves through reductions in fuel costs and would, therefore, be desirable even if climate change were not a concern.
The present study focuses on the empirical literature on energy efficiency opportunities and barriers in India, as a guide for further research in the area. The empirical literature has focused on four questions:
1. How does energy efficiency in India compare with energy efficiency in other countries?
2. What would be the energy savings (and cost savings) from adopting certain energy-efficient technologies?
3. Why are these technologies being—or not being—adopted?
4. What policies should be implemented to encourage their adoption, and if policies have been implemented, how have they performed?
∗ Bhattacharya, Associate Research Scientist, Pacific Institute for Research and Evaluation; Cropper, Professor, University of Maryland and Senior Fellow, Resources for the Future. We thank the KCP Trust Fund of the World Bank for Funding and Mike Toman for helpful comments. The findings and conclusions in this paper are entirely those of the authors. They do not necessarily represent the views of the World Bank and its affiliated organizations, or those of the Executive Directors of the World Bank or the governments they represent.
Resources for the Future Bhattacharya and Cropper
2
Most of the literature focuses on answers to the first two questions. Many studies calculate energy per unit of output in various sectors (e.g., heat input per kWh or specific energy consumed per unit of output for various industrial processes) and compare these with levels attained in other countries or with “best practice.” Clearly, attaining best practice may not be economically efficient in India, given current prices and interest rates. It is therefore important to ask what would be the cost as well as the energy savings from adopting more energy-efficient technologies.
Other studies discuss qualitatively the reasons for not adopting energy-efficient technologies in India. These include energy pricing policies (e.g., low electricity prices for households and agriculture), other government policies (e.g., tariffs), high start-up costs, scarce opportunities for funding investments, uncertainties about the benefits of investments, and lack of information and awareness (Reddy and Amulya 1991; Ghosh et al. 2002; Reddy and Assenza 2007; Chandrasekhar and Kandpal 2007; Beck and Martinot 2004; USAID 2006). These studies are very useful for identifying the range of potential barriers. However, we find few studies that rigorously quantify the impacts of these barriers or the impact of policies to promote energy efficiency.
The gaps in the literature include studies that would quantify factors affecting the rate of diffusion of energy-efficient technologies. Such studies would provide useful information about the impact of changes in energy prices (as might occur, for example, through electricity tariff reforms), changes in capital costs, energy efficiency standards, or technology adoption subsidies. All of these changes in energy markets and policies will continue to have an important influence on energy costs in India and the country’s CO2 emissions.
Also needed are studies that rigorously evaluate the impact of policies implemented since the 1990s by the Government of India that could affect energy efficiency. These include reforms in the electricity sector (both legislative reforms and the removal of tariffs on imported coal), the relaxing of price and output regulations on certain energy-intensive industries, and energy efficiency labeling requirements for appliances. Since there have been no rigorous econometric studies of these policies, many research questions remain unanswered: Have reforms increased efficiency in electricity generation? Has technical change in energy-intensive industries since the early 1990s been energy saving or energy using? Has labeling promoted the purchase of more efficient appliances, holding other factors constant? What would be the likely impact of a major restructuring of electricity tariffs?

Resources for the Future Bhattacharya and Cropper
3
The rest of the paper is organized as follows. Sections 2 and 3 address energy efficiency in the industrial and power sectors. As in other modern economies, these are two of the most important sectors because of their extensive use of fossil-based commercial energy and opportunities for changes in technology and practice to improve efficiency. Transportation is not addressed in this review because improved energy efficiency in the sector involves a number of other considerations related to vehicle technology and urban transportation policies.1 Section 4 discusses the efficiency of energy consumption and adoption of energy-efficient technologies in the household sector. In this sector, concerns over energy efficiency are much more interwoven with the transition to modern fossil fuels from traditional renewable fuels, and with various questions related to household well-being as well as energy expenditures. In section 5 we summarize our findings for these sectors and discuss research needs. Appendix A provides an overview of energy consumption and energy supply in the India economy. Appendix B presents information on five industries—aluminum, iron and steel, fertilizer, cement, and pulp and paper—for various years in the 1990s.
2. Industrial Energy Usage
After the power sector, industry is the largest consumer of primary commercial energy in India (see Appendix A). The top six industries in India in terms of energy consumption are aluminum, cement, fertilizer, iron and steel, paper, and glass, which together account for about 40 percent of total industrial fuel consumption. An extensive engineering literature examines the energy efficiency of industries in India, most of which focuses on physical measures of energy intensity (i.e., energy per unit of output) and compares India with other countries. This literature, summarized below, generally indicates that India’s industrial sector is less energy efficient (i.e., more energy intensive) than that in developed countries, although energy efficiency has improved in some industries over time. There is also considerable heterogeneity in energy efficiency across firms.
Sathaye et al. (2005) and Schumacher and Sathaye (1998, 1999a, 1999b, 1999c, 1999d) estimate the payback period required for energy efficiency improvements in the aluminum, cement, fertilizer, iron and steel, and paper industries and the number of plants that have adopted these technologies. Schumacher and Sathaye, as well as Sanstad et al. (2006), estimate cost
1 A study in progress by one of the authors examines influences on energy efficiency in the Indian passenger vehicle sector.

Resources for the Future Bhattacharya and Cropper
4
functions and share equations for energy-intensive industries in India using aggregate data for 1973–93. The results are used to estimate the rate of technical progress in each industry and to determine whether technical progress was energy saving or energy using. We summarize this literature below. To our knowledge, however, there are no econometric studies that explain which Indian firms have adopted energy-efficient technologies and which have not.
Energy Efficiency in Indian Industry, 1973–1994
Energy intensity is measured in physical terms as specific energy consumed per unit of output (SEC).2 In most cases SEC is compared with best practice to determine the percentage reduction in energy per unit of output that could be achieved by adopting best practices. When available, SECs for India are compared with values from other countries. All five industries addressed in Appendix B (aluminum, iron and steel, fertilizer, cement, and pulp and paper) were below world best practice in terms of energy efficiency during the 1973–94 period. The greatest opportunities for gains existed in iron and steel and pulp and paper, where reductions in energy per unit of output achievable (based on 1990s technology) were on the order of 40 to 50 percent. The percentage reduction in energy per unit of output possible in the cement and fertilizer industries was much smaller—on the order of 20 percent or less. In the aluminum industry, the most efficient plants in the mid-1990s compared well with international practice.
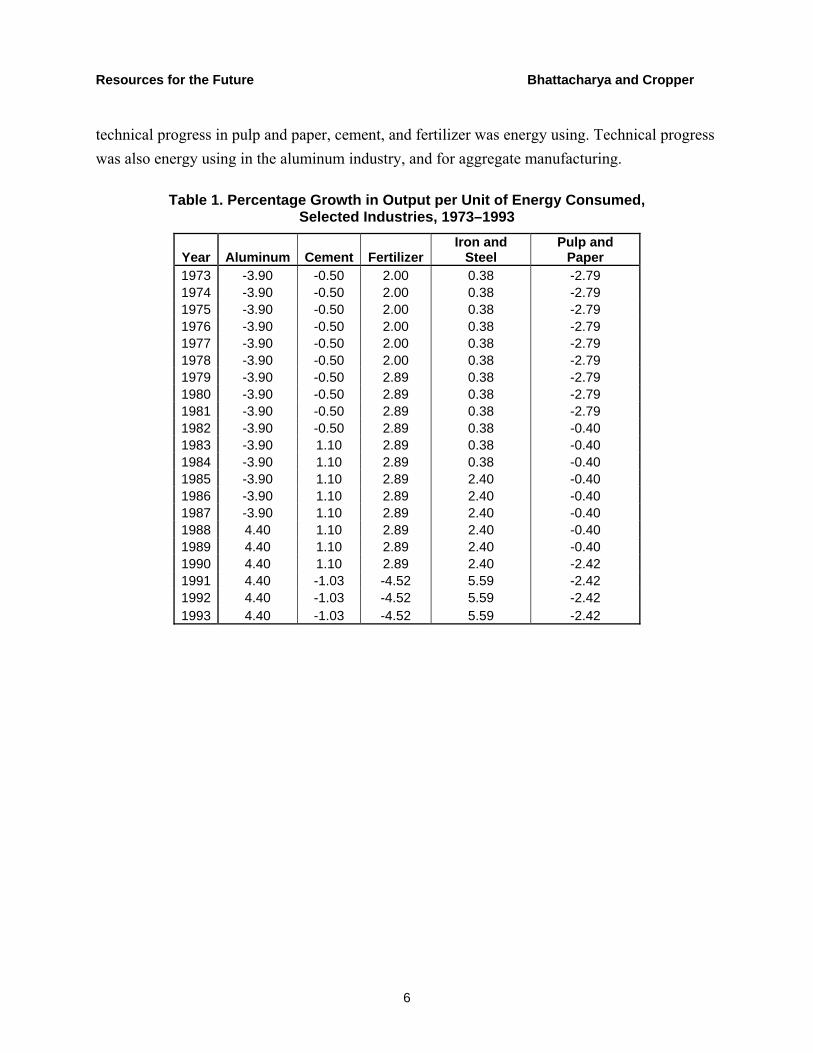
How has energy intensity in Indian industry changed over time? It is difficult to obtain a time series on SEC for each of the five industries. To see how energy intensity has changed over time, Table 1 presents the rate of change in output per unit of energy (measured in constant prices) for each industry, for the period 1973–74 to 1993–94. Output per unit of energy showed a clear downward trend in the pulp and paper industry (implying that energy intensity has increased) but an upward trend in iron and steel, especially after 1985,3 and an upward trend in the fertilizer industry, until the end of the period. Energy intensity in cement exhibited little change over the period as a whole. Output per unit of energy fell in the case of aluminum industry, until 1988.
2 For example, gigajoules (Gj) of energy per ton of crude steel or Gj per ton of paper. 3 These figures agree with Persson et al. (2007), who present trends in CO2 per unit of output in 12 selected countries (7 developed and 5 developing) between 1980 and 1998, assuming that CO2 is proportional to SEC over the time period.

Resources for the Future Bhattacharya and Cropper
5
A key question is what explains the rates of change in energy intensity. Energy per unit of output may be falling (i.e., output per unit of energy rising) in the iron and steel industry as a result of changes in factor prices (e.g., because the price of energy is rising) or because of energy-saving technical progress. The trend in autonomous energy efficiency (τE) can be measured by the percentage change in the ratio of energy (E) to (Y) output over time, holding prices constant:
(1) τE(t) = -∂ln(E/Y)/∂t.
If the firm is a cost minimizer, then by Shephard’s Lemma,
(2) E = ∂C/∂pE = Y∂c/∂pE
or
(3) E/Y = ∂c/∂pE ,
where c( ) denotes the unit cost function, C total costs, and pE the price of energy. By substitution,
(4) τE(t) = -∂ln(∂c/∂pE)/∂t.
The trend in autonomous energy efficiency can therefore be estimated from the parameters of a cost function.
Sanstad et al. (2006) estimate a translog cost function and share equations for seven Indian industries using data for the period 1973–74 through 1993–94. The coefficients are used to estimate autonomous energy efficiency and total factor productivity, υ(t),
(5) υ(t) = -∂c/∂t.
The results are reproduced in Table 2. Total factor productivity declined over the period in both iron and steel and pulp and paper, although it increased in both fertilizer and cement. There was a small amount of energy-saving technical progress in the iron and steel industry, but
Resources for the Future Bhattacharya and Cropper
6
technical progress in pulp and paper, cement, and fertilizer was energy using. Technical progress was also energy using in the aluminum industry, and for aggregate manufacturing.
Table 1. Percentage Growth in Output per Unit of Energy Consumed, Selected Industries, 1973–1993
Year Aluminum Cement FertilizerIron and
Steel Pulp and
Paper 1973 -3.90 -0.50 2.00 0.38 -2.79 1974 -3.90 -0.50 2.00 0.38 -2.79 1975 -3.90 -0.50 2.00 0.38 -2.79 1976 -3.90 -0.50 2.00 0.38 -2.79 1977 -3.90 -0.50 2.00 0.38 -2.79 1978 -3.90 -0.50 2.00 0.38 -2.79 1979 -3.90 -0.50 2.89 0.38 -2.79 1980 -3.90 -0.50 2.89 0.38 -2.79 1981 -3.90 -0.50 2.89 0.38 -2.79 1982 -3.90 -0.50 2.89 0.38 -0.40 1983 -3.90 1.10 2.89 0.38 -0.40 1984 -3.90 1.10 2.89 0.38 -0.40 1985 -3.90 1.10 2.89 2.40 -0.40 1986 -3.90 1.10 2.89 2.40 -0.40 1987 -3.90 1.10 2.89 2.40 -0.40 1988 4.40 1.10 2.89 2.40 -0.40 1989 4.40 1.10 2.89 2.40 -0.40 1990 4.40 1.10 2.89 2.40 -2.42 1991 4.40 -1.03 -4.52 5.59 -2.42 1992 4.40 -1.03 -4.52 5.59 -2.42 1993 4.40 -1.03 -4.52 5.59 -2.42

Resources for the Future Bhattacharya and Cropper
7
Table 2. Technological Change in Indian Industries, 1973–1994 Industry Energy Price Bias
(Standard Error) Time Averages (percent) of Sectoral Productivity and
Autonomous Energy Efficiency Prices and Energy Cost Share
Fixed at Base Year Prices and Energy Cost Share
Fixed at Mid Point Year
Productivity Autonomous
Trend Productivity Autonomous
Trend Aggregate Manufacturing 0.00064 (0.0002) 0.21 -1.18 -1.17 -1.96
Aluminum 0.00966 (0.0020) -0.71 -7.90 -1.12 -4.30
cement 0.00749 (0.0004) 0.98 -2.44 1.47 -1.18
Fertilizer 0.0068 (0.0010) 2.84 -4.27 0.94 -2.89
Glass 0.00192 (0.0007) 2.13 1.09 2.79 2.15
Iron and Steel -0.00196 (0.0006) -1.49 0.36 -1.13 0.10
Pulp and Paper 0.00328 (0.0004) -0.23 -3.38 -0.81 -2.70
Source: Sanstad et al. (2006).
Whether the trends in autonomous energy efficiency based on data from the 1973–74 to 1993–94 period have continued is clearly of interest. It is unfortunate that there are not more recent studies of energy efficiency in Indian industry. Beginning in the early 1990s, the Indian economy underwent a series of reforms that removed price and distribution controls on output (e.g., in the aluminum and iron and steel industries), and import duties that had been set to protect infant industries. An update of the econometric analysis in Sanstad et al. (2006) to cover the period since these reforms would clearly be worthwhile.
Government Policies Affecting Energy Efficiency in Indian Industry
Yang (2006) reviews industrial energy efficiency policies in India from 1980 to 2005. Six major policies were implemented during this period: (1) disclosure of company-level energy efficiency information; (2) accelerated depreciation for energy efficiency and pollution control equipment; (3) establishment of the Energy Management Center under the Ministry of Energy; (4) removal of price and output controls to promote industrial competitiveness; (5) energy price reforms to guide energy efficiency initiatives and encourage international competitiveness; and (6) passage of the Energy Conservation Act of 2001 and the Electricity Act of 2003. The Energy Conservation Act resulted in the creation of the Bureau of Energy Efficiency (BEE), a statutory body under the Ministry of Power. BEE actively promotes, manages, finances, and monitors energy conservation efforts in the economy through energy audits. It also has the statutory authority to implement mandatory energy efficiency standards but has not yet done so. To the
Resources for the Future Bhattacharya and Cropper
8
best of our knowledge, there have been no attempts to evaluate statistically the impacts of these policies.
3. Energy Efficiency in the Power Sector
The power sector in India consumes approximately 43 percent of commercial primary energy (see Appendix A) and generates 40 percent of India’s CO2 emissions. Energy efficiency in the power sector is therefore of critical importance. Thermal power plants currently produce 71 percent of India’s commercial electricity and are projected to account for 78 percent of electricity generation in 2031, according to the Indian Planning Commission (GOI 2006). Part of the large literature on Indian power plants examines the thermal efficiency of existing plants, comparing them with international performance and explaining variation in efficiency across plants. Other studies focus on possibilities for energy-efficient investment in future plants. Before summarizing this literature, we present a brief history of the Indian power sector.
The Indian Power Sector: Background
In 1990, 63 percent of installed capacity in the electricity sector in India was owned by state electricity boards (SEBs), 33 percent by the central government, and 4 percent by private companies. This was the result of the 1948 Electricity Supply Act, which created SEBs and gave them responsibility for the generation, transmission, and distribution of power, as well as the authority to set tariffs. SEBs were connected in grids to enhance system reliability. By 1960, the power system was organized into five regional grids, with regional electricity boards and dispatch centers (Tongia 2003).4 SEBs operated on soft budgets, with revenue shortfalls made up by state governments. Electricity tariffs set by SEBs failed to cover costs, generating capacity expanded slowly in the 1960s and 1970s, and blackouts were common. To increase generating capacity, the Government of India in 1975 established the National Hydroelectric Power Corporation and the National Thermal Power Corporation, which built generating capacity and transmission lines that fed into the SEB systems. The latter, which is the world’s sixth-largest power producer, operates at a profit.
Beginning in 1991, the Government of India instituted reforms to increase investment in power generation, reform the electricity tariff structure, and improve the distribution network.
4 Some SEBs allowed private companies to operate under license, as in the case of Ahmedabad Electric Power in the state of Gujarat.

Resources for the Future Bhattacharya and Cropper
9
Under the Electricity Laws Act of 1991, independent power producers were allowed to invest in generating capacity. They were guaranteed a fair rate of return on their investment, with tariffs regulated by the Central Electricity Authority. The Electricity Reform Act of 1998 made it possible for the states to create state electricity regulatory commissions to set electricity tariffs. The goal was to reform the existing tariff structure, which sold electricity cheaply to households and farmers, and compensated by charging higher prices to industry. This had prompted firms to generate their own power rather than purchasing it from the grid, an outcome that further reduced the revenues of SEBs. The result was that most SEBs failed to cover the costs of electricity production. Reform of the distribution network was necessary because of the extremely large power losses associated with transmission and distribution of electric power, both technical losses and losses due to theft.
Of the three goals of reform in the electricity sector, the most successful has been attracting private investors. Table 3 shows the ownership of generating capacity by fuel source in 2006. Thirteen percent of generating capacity (and more than a third of gas-fired capacity) was privately owned. Unfortunately, in the aggregate, SEBs continue to operate at a financial loss (amounting to about 2 cents per kWh of electricity produced) and have not significantly reformed the tariff structure (Tongia 2003). Transmission and distribution losses continue to be high (equal in 2001 to about 30 percent of electricity generated).
Table 3. Generation Capacity by Source and Ownership in MW, March 2006
Ownership Hvdro Coal Gas Diesel Nuclear Renewable Total
State 25248 38305 3500 605 0 68 67725Central 6172 25973 4419 0 3360 0 39924Private 906 4241 4771 597 0 6123 16639Total 32326 68519 12690 1202 3360 6191 124287
Share (percent) 26.01 55.13 10.21 0.97 2.7 4.98 100
Note: Additional captive generating capacity = 19485 MW. Source: CEA (2006).

Resources for the Future Bhattacharya and Cropper
10
The Efficiency of Existing Thermal Plants
Coal-Fired Power Plants
As noted above, 84 percent of commercial electricity in India is generated by thermal plants, and 75 percent by coal-fired plants. Several studies compare the energy efficiency of thermal plants in India with that of plants in other countries. Persson et al. (2007) report an average thermal efficiency of 29 percent for coal-fired Indian plants in 1998.5 This is lower than the average efficiency reported for South Korea and more than 10 percentage points lower than Japan, the most efficient country examined. According to Persson et al. (2007), average thermal efficiency was approximately 29 percent between 1990 and 1998. This agrees with Khanna and Zilberman (1999), who report that 60 percent of generating capacity had a thermal efficiency of 25 percent or higher in 1991; however, 5 percent of plants had an efficiency below 20 percent.
Ninety percent of the coal-fired generating units in India are subcritical, with a maximum thermal efficiency of 35 to 38 percent. The fact that the average thermal efficiency of these plants is below 30 percent is due in part to technical factors—the high ash content and low heat content of Indian coal—and in part to inefficiencies in management. The use of coal with low heat content or high ash content raises the heat input needed to produce electricity. The heat content of coal used in Indian plants in 1990 averaged 4,000 kcal/kg, down from 6,000 kcal/kg in 1960, with ash content between 25 and 45 percent. This was domestic coal, transported from mines in central and east India. Imports of coal with a higher heat and lower ash content were effectively prohibited by high tariffs (the tariff on imported coal in 1993 was 85 percent). Facilities to wash coal to reduce its ash content (and also transportation costs) were not widely available in the early 1990s.
Khanna and Zilberman (1999) investigate the sources and magnitude of energy inefficiency in the electricity generating sector in India and its implications for carbon emissions. They use data from the Central Electricity Authority of India for 205 boiler-turbine-generator units belonging to 63 coal-based power plants for 1987–1991, which together represent 75 percent of total coal-based installed capacity in 1991.6 They explain the heat input required to
5 Thermal efficiency is proportional to the power output of the plant, divided by the heating value of the fuel. It measures the proportion of energy contained in the fuel that winds up as electrical energy.
6 The age of the boiler-turbine-generator units varied from 1 to 42 years, with an average age of 13.4 years. Installed capacity varied from 30 to 500 MW. Data on energy efficiency were available only at the level of the power plant.

Resources for the Future Bhattacharya and Cropper
11
produce a net kWh of electricity7 as a function of ownership of the plant, boiler manufacturer, coal quality, age of boiler turbine, and capacity utilization. Khanna and Zilberman (1999) find that energy efficiency increased with the use of coal with higher heat content and was lower at plants operated by SEBs, holding factors such as plant age and capacity utilization constant. Specifically, they find that improving management practices to those in the private sector could raise average thermal efficiency from 25.66 to 26.93 percent; use of high-quality coal could raise it further, to 29.2 percent.
Khanna and Zilberman’s study suggests that inefficient operating procedures, lack of coal-washing facilities, and high tariffs were, in 1991, barriers to higher thermal efficiency in coal-fired power plants. In a subsequent study Khanna and Zilberman (2001) examine whether plants would choose to use washed domestic coal if coal-washing facilities were available, or would import coal if the tariff on imported coal were lowered. Assuming that all plants maximize profits, they estimate that, when the tariff on imported coal is reduced to 35 percent and washed coal is available, 68 percent of units use washed coal, and 18 percent, imported coal. These proportions change to 52 percent and 34 percent when the tariff on imported coal is reduced to zero. This suggests that 86 percent of coal-fired plants in 1991 would have found it profitable to increase their energy efficiency by improving coal quality. The barriers to doing so were the high tariff on imported coal and lack of coal-washing facilities.
Since the studies by Khanna and Zilberman, the Indian government has gradually reduced the tariff on imported coal and has also mandated the use of washed coal under certain circumstances. The current duty on imported noncoking coal is 5 percent, reduced from 85 percent in 1993. Beginning in 2001, the use of coal with ash content exceeding 34 per cent is prohibited in any thermal power plant located more than 1,000 km from the pithead and in urban or sensitive or critically polluted areas. Clearly, it would be of interest to examine the impact of these regulations on the behavior of coal-fired power plants.
To our knowledge, there are no statistical studies testing the impact of removing tariffs on imported coal or of coal-washing regulations on the quality of coal used in thermal power plants in India, although more recent studies document existing inefficiencies in the Indian power sector. Mathur et al. (2003) analyze opportunities for cost savings through coal washing
7 This is the heat input (in kcal) required to produce a kWh, allowing for the fact that some electricity (in the form of auxiliary consumption) is used by the plant itself. The higher the heat input per net kWh, the less efficient the plant.

Resources for the Future Bhattacharya and Cropper
12
and by rerouting coal supplies from mines to power plants. Shanmugam and Kulshrestha (2005) estimate a stochastic production function for electricity generation to estimate indices of technical efficiency for various plants.
Case studies have examined the impact of the reforms of the 1990s on power plant ownership. Shukla et al. (2004) assess the impact of reforms on the electricity generation industry in the states of Andhra Pradesh and Gujarat. The study finds a steady improvement in the efficiency of generation from coal and gas in Andhra Pradesh. However, generation from cleaner sources like hydro has been declining. This changing generation mix has led to a steady increase in CO2 emission intensities in the state. In Gujarat, on the other hand, reforms have led to the emergence of various ownership structures with associated changes in fuel mix and technology. There has been a steady improvement in the efficiency of generation with reduction in carbon intensities.
It is also possible to ask whether coal-fired power plants are efficient in terms of their use of all inputs. Thakur et al. (2006) evaluate how far various SEB-owned plants are within the production possibility frontier, using data envelopment analysis. They find that bigger utilities displayed greater inefficiencies and exhibited distinct scale inefficiencies. They conclude that exploiting scale efficiencies by suitable restructuring and unbundling of SEBs could promote greater efficiency.
Gas-Fired Power Plants
Since the reforms of the 1990s, gas-fired thermal plants have accounted for an increasing share of newly constructed thermal plants. Most of these are combined-cycle gas turbine (CCGT) plants, which can, in theory, achieve thermal efficiencies up to 60 percent. Persson et al. (2007) report an average thermal efficiency of 46 percent for gas-fired plants in India in 1998. This compares favorably with other countries: only South Korea and the United Kingdom are estimated to have higher thermal efficiencies (50 percent and 48 percent, respectively). The average thermal efficiency of gas plants in India has increased steadily since 1980 because of the construction of CCGT plants and the use of gas plants to supply base rather than peak electricity demand.
Whether CCGT plants will continue to be built in India depends on how the cost of these plants compares with the cost of coal-fired power plants that would likely be built in India in the near future. This is discussed in the next section.
Resources for the Future Bhattacharya and Cropper
13
The Potential Efficiency of Future Power Plants
With a planned sixfold expansion in electricity production by the year 2030 (GOI 2006), 78 percent of which is targeted to be produced by thermal power plants,8 the energy efficiency of future investments is important. What plants are economically efficient depends on the capital, operating and maintenance, and fuel costs of alterative technologies, as well as on international options for carbon finance. Among the more energy-efficient options for thermal plants in the near term are supercritical coal-fired plants and combined-cycle gas turbine plants.
Sathaye and Phadke (2006) compare the cost per kWh of four combined-cycle gas plants and four coal plants proposed to be constructed in India. Because the CCGT plants produce lower carbon emissions, the comparison allows the authors to calculate the cost per ton of CO2 avoided by building combined-cycle gas rather than coal plants. The cost is then compared with similar costs in developed countries. From an energy efficiency perspective, the article is useful in estimating the cost of increased energy efficiency in thermal power plants in India. The authors find that the cost per kWh averaged over the CCGT plants is 5.48 cents, versus 3.10 cents per kWh for the coal plants. This suggests that, at least at present, more energy-efficient gas plants would require a considerable carbon premium to compete economically with coal-fired plants.
Singh et al. (2006) analyze the barriers to adoption of cleaner and more efficient technologies in the Indian power sector. They consider the adoption of three cleaner and more efficient alternatives: integrated gasification combined-cycle coal technology, pulverized fluidized bed combustion, and biomass integrated gasification combined-cycle technology. Using a survey of major stakeholders in the Indian power sector, they identify and rank the barriers to adoption of each technology in an analytic hierarchy process. High initial capital costs and lack of proven reliability for the technology in India are the main factors cited as barriers to adoption of these advanced technologies.
8 GOI (2006) estimates that coal-fired installed capacity will be 270 GW by 2030, compared with 70 GW today.
Resources for the Future Bhattacharya and Cropper
14
4. Household Energy Usage
India’s residential sector is a major consumer of energy whose energy demand will grow with prosperity and population growth. Residential energy end use in India is sourced both from commercial (electricity, kerosene, and liquefied petroleum gas, LPG) and noncommercial sources (direct use of biomass). Households in 2003–2004 consumed 8 percent of commercial energy and 85 percent of noncommercial energy in the Indian economy (GOI 2005; see Appendix A).
Currently, more than 80 percent of the energy consumed by households takes the form of biomass, which is used for cooking by 70 percent of all households (see Table 4). Most biomass is burned in inefficient stoves, which are also a source of indoor air pollution. Two sources of energy efficiency are cleaner fuels (kerosene and LPG) and more efficient stoves. Although households often transition to more efficient, cleaner commercial fuels as their incomes rise, another important source of energy efficiency is replacing inefficient wood and kerosene stoves with more thermally efficient ones.
Note that in considering these efficiency options, various trade-offs among commercial and noncommercial fuels figure prominently, and greenhouse gas emissions are more uncertain than in industrial or power sector energy demand. Emissions could rise from a shift toward commercial fossil-based fuels, but concerns over this impact would tend to be dominated by the benefits of cleaner fuels for household health from reduced indoor air pollution. Given the continued reliance on biomass for cooking and the health problems associated with indoor air pollution, increased penetration of more energy-efficient wood-fired stoves also has an important role. As discussed below, the impact on household time and money costs of switching to modern fuels involves several conflicting influences; more efficient biomass stoves, for their part, reduce either collection time or cost for purchased fuelwood.
Resources for the Future Bhattacharya and Cropper
15
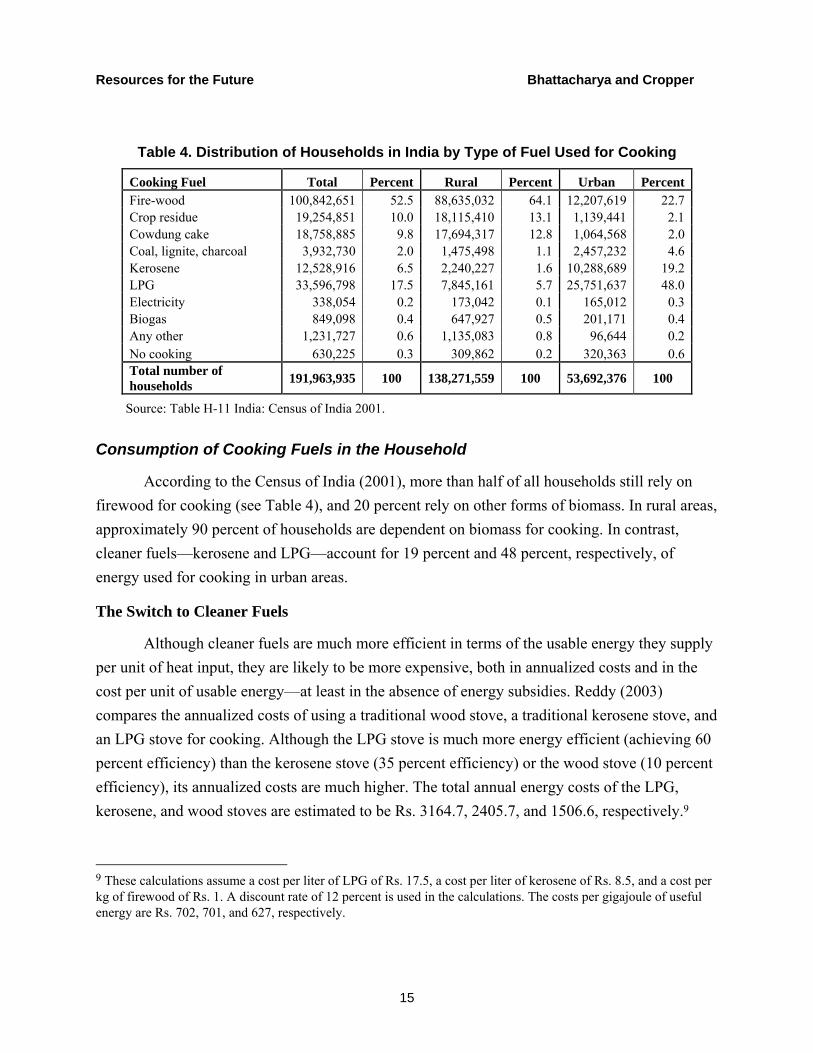
Table 4. Distribution of Households in India by Type of Fuel Used for Cooking
Cooking Fuel Total Percent Rural Percent Urban PercentFire-wood 100,842,651 52.5 88,635,032 64.1 12,207,619 22.7Crop residue 19,254,851 10.0 18,115,410 13.1 1,139,441 2.1Cowdung cake 18,758,885 9.8 17,694,317 12.8 1,064,568 2.0Coal, lignite, charcoal 3,932,730 2.0 1,475,498 1.1 2,457,232 4.6Kerosene 12,528,916 6.5 2,240,227 1.6 10,288,689 19.2LPG 33,596,798 17.5 7,845,161 5.7 25,751,637 48.0Electricity 338,054 0.2 173,042 0.1 165,012 0.3Biogas 849,098 0.4 647,927 0.5 201,171 0.4Any other 1,231,727 0.6 1,135,083 0.8 96,644 0.2No cooking 630,225 0.3 309,862 0.2 320,363 0.6Total number of households 191,963,935 100 138,271,559 100 53,692,376 100
Source: Table H-11 India: Census of India 2001.
Consumption of Cooking Fuels in the Household
According to the Census of India (2001), more than half of all households still rely on firewood for cooking (see Table 4), and 20 percent rely on other forms of biomass. In rural areas, approximately 90 percent of households are dependent on biomass for cooking. In contrast, cleaner fuels—kerosene and LPG—account for 19 percent and 48 percent, respectively, of energy used for cooking in urban areas.
The Switch to Cleaner Fuels
Although cleaner fuels are much more efficient in terms of the usable energy they supply per unit of heat input, they are likely to be more expensive, both in annualized costs and in the cost per unit of usable energy—at least in the absence of energy subsidies. Reddy (2003) compares the annualized costs of using a traditional wood stove, a traditional kerosene stove, and an LPG stove for cooking. Although the LPG stove is much more energy efficient (achieving 60 percent efficiency) than the kerosene stove (35 percent efficiency) or the wood stove (10 percent efficiency), its annualized costs are much higher. The total annual energy costs of the LPG, kerosene, and wood stoves are estimated to be Rs. 3164.7, 2405.7, and 1506.6, respectively.9
9 These calculations assume a cost per liter of LPG of Rs. 17.5, a cost per liter of kerosene of Rs. 8.5, and a cost per kg of firewood of Rs. 1. A discount rate of 12 percent is used in the calculations. The costs per gigajoule of useful energy are Rs. 702, 701, and 627, respectively.
Resources for the Future Bhattacharya and Cropper
16
Although this comparison is dependent on fuel prices and capital costs, it suggests that more energy-efficient cooking fuels do not pay for themselves. The main reason for switching to cleaner fuels is that they are more convenient. Many studies suggest that with rising income levels and urbanization, households in developing countries switch their primary cooking fuel from biomass, including dung, crop residues, and wood, to transition fossil fuels such as coal and kerosene, and finally to LPG, natural gas, or electricity (Heltberg 2004). Using National Sample Survey (NSS) data, Viswanathan and Kavi Kumar (2005), Pohekar et al. (2005), and Reddy and Balachandra (2006) look at changing patterns of fuel use from traditional woodstoves to kerosene and then from kerosene to LPG and electricity. All three studies note that the shift from biomass as a source of fuel to relatively cleaner fuels, like kerosene, LPG, or electricity, is primarily driven by income. Reddy and Balachandra (2006) project the shares of fuelwood, kerosene, electricity, and LPG used for cooking in rural and urban areas for 2010 based on certain assumptions10 and NSS (1999–2000) consumption patterns.
Those studies should not be interpreted as implying that prices do not matter; the capital costs of an LPG or kerosene stove and the cost per liter of fuel do matter, and the Indian government subsidizes both LPG and kerosene for domestic use. Kerosene is sold through the government’s public distribution system (PDS) as well as by private suppliers. PDS kerosene is subsidized (and also rationed), whereas private supply is not.11 Similarly, LPG is sold by private firms as well as through the public sector (Ministry of Petroleum 2007).12 The subsidy to consumers in 2005–2006 for kerosene and LPG was Rs.12.96/liter and Rs.170.32/cylinder (14.2 kg), respectively (GOI 2006), implying that the subsidized price for kerosene is about 40 percent of the market price and 60 percent of the market price for LPG.13
The annual cost of LPG and kerosene subsidies in India is high (more than US$500 million annually), and the subsidies have been widely criticized for their poor targeting (especially in the case of LPG) and leakage (in the case of kerosene) (Barnes et al. 2005; Heltberg 2004). Subsidies for LPG often go to middle- and upper-income households. Kerosene
10 The assumptions about the growth rates of GDP, population and other factors taken into consideration are not specified in the article. 11 Until 1993, the public distribution system was the only source of kerosene in India. 12 At most two cylinders of LPG can be purchased at a time. 13 At the time of this writing, the PDS price of kerosene was approximately Rs. 11 per liter, compared with a market price of Rs. 30 per liter. The subsidized price of LPG (Delhi) was approximately Rs. 13 per liter.
Resources for the Future Bhattacharya and Cropper
17
subsidies are better targeted toward the poor, but kerosene sold for fuel is often redirected to automotive uses—it is a close substitute for diesel, and diversion occurs whenever kerosene is priced below diesel. Past kerosene subsidy schemes using coupons and ration cards have failed as a tool for household fuel switching, even though among all the modern cooking fuels, kerosene competes best with firewood.
Use of More Energy-Efficient Wood Stoves
Reddy (2003) and Reddy and Balachandra (2006) suggest that more efficient wood or kerosene stoves will pay for themselves in fuel savings. Reddy (2003) calculates that purchasing a wood stove of 30 percent thermal efficiency, compared with one of 10 percent efficiency, will yield a return on investment of 64 percent per year and will pay for itself through fuel savings in a few months. The additional cost of a kerosene stove of 50 percent efficiency, compared with one of 30 percent efficiency, will likewise pay for itself in energy savings in a few months. More efficient wood stoves will also reduce indoor air pollution by reducing wood consumption and achieving more complete combustion.
Improved cook stoves have, however, been slow to penetrate the market in India (Glow Asia Cookstove Programme 2000; Greenglass and Smith 2006). The National Program for Improved Chulhas (NPIC), introduced by the Government of India in 1983, provided a minimum subsidy of 50 percent to households that purchased the improved cook stove. From 1983 to 2000, approximately 35 million improved stoves of various types were distributed. In 2002 the NPIC was deemed a failure and the program was discontinued. Only a few state governments and NGOs have continued this and related projects.
The shortcomings of India’s NPIC system stemmed partly from its top-down, subsidized approach to dissemination of improved cook stoves (Greenglass and Smith 2006). The central government subsidy was applied directly to stove producers, who therefore did not consider consumers’ preferences when constructing and marketing stoves. Improved stove dissemination was therefore relatively slow, and stoves that were distributed often did not significantly improve upon the efficiency of their traditional counterparts. Additionally, the large government subsidy inhibited efforts in the private sector to develop and produce other types of improved stoves.
Kishore and Ramana (2002) estimate that the net benefits of the NPIC program were lower than the government had projected. If the health benefits of using the improved cook stoves are included, however, they contend that the program should not be deemed a complete failure. The failure of the NPIC scheme to target resource-poor regions was another reason for the lack of popularity among poor households (Sinha 2002).
Resources for the Future Bhattacharya and Cropper
18
Renewable energy cooking options such as solar cookers have also been introduced in some states. Subsidies were provided to producers, to be passed on to the consumer. Pohekar and Ramachandran (2006) find that solar cookers are the third most preferred alternative in India after LPG and kerosene cook stoves. However, the same problems that arose with the NPIC scheme led to failure here, too. Producer subsidies failed to stimulate changes in the technical design of these stoves to meet the requirements of households.
Greenglass and Smith (2006) describe new efforts to market improved cook stoves in India. Factors affecting adoption of such stoves have been studied by Viswanathan and Kumar (2005). The work is important, given that a significant portion of households in India will continue to rely on biomass for fuel. The Indian Planning Commission estimates that if per capita GDP grows at annual rate of 8 percent, the quantity of fuelwood consumed by household will increase by 20 percent between 2006 and 2031 (GOI 2006).
Adoption of Energy-Efficient Lighting
Although electricity currently accounts for a small share of total household energy consumption, it is the main source of energy for lighting and, as noted above, is predicted to grow sixfold by 2031 (GOI 2006). Introducing energy efficient lighting and appliances in the household sector is an important alternative to increasing generating capacity while also reducing the growth of carbon dioxide emissions.
Lighting constitutes another major category of household energy use, accounting for roughly 36 percent of total commercial energy consumption. Indian households rely mainly on kerosene lamps or electricity for lighting. In urban areas, electricity is the primary source (89 percent) for lighting. In rural areas, kerosene lamps account for half (50 percent) and electricity another half (48 percent) of energy for lighting. The quality of illumination from electric lighting is much superior to light from kerosene lamps, and the cost per lumen can be lower for electric lighting. On the other hand, battery-operated electric lighting is more expensive than kerosene, given the cost of the batteries as a source of energy.
Compact fluorescent lamps (CFLs) are an efficient alternative to traditional incandescent lamps for provision of high-quality lighting services. Even though CFLs are usually more expensive than incandescent lamps, Reddy (2003) estimates the payback period to be 1.2 years,
Resources for the Future Bhattacharya and Cropper
19
which is cost-effective, given the longer life of these lamps.14 He also estimates that the switch from a kerosene lamp to a 13-watt CFL would pay for itself in less than 1 year.
Currently, many CFLs are commercially available; however, their sales are low. Based on survey data, Reddy and Shrestha (1998) find that lack of awareness, uncertainty, and high initial costs are major factors leading to lower rates of adoption of more efficient lighting systems. Kumar et al. (2003), using a survey administered to 900 households in Delhi, find that awareness of CFLs among consumers, especially those with monthly family incomes lower than Rs. 10,000, is very low. CFL use was low even among consumers who were aware of them. The high price and lack of warranty appear to explain the low acceptability of CFLs. No study to date has statistically estimated and tested the factors that lead to the adoption of energy-efficient lighting.
Adoption of Energy-Efficient Household Appliances
Apart from cooking and lighting, electrical appliances are a major source of household energy consumption, especially in higher-income urban households. The share of electrical appliances in household energy consumption is likely to increase significantly in the future because of growth in per capita incomes.
McNeil et al. (2005) estimate the impacts of energy saving for two appliances used in Indian households—refrigerators and air-conditioners. The switch from existing models to high-efficiency models of refrigerators between 2010 and 2020 would result in a 45 percent per unit energy savings, or a total of 77 million tons of oil equivalent (MTOE) saved, implying a net present value of consumer savings equaling US$1.3 billion. More efficient direct-cool refrigerators have a payback period of less than 3 years; more efficient frost-free refrigerators have a payback period less than 2 years.15 For air-conditioners, models with energy efficiency ratings (EERs) of 10.2 or lower have payback periods of less than 3 years, compared with models with an EER of 9.0; however, the switch from the latter to models with an EER of 12.8 has a payback period of 20 years. Adoption of higher-efficiency models between 2010 and 2020 is predicted to result in a 6 percent per unit energy savings, or a total of 23 MTOE saved, implying a net present value of consumer savings equaling US$1.2 billion.
14 This assumes an electricity cost of Rs. 3 per kWh, and an additional investment cost of Rs. 175 for the CFL over the cost of an incandescent light. 15 These calculations assume a discount rate of 15 percent and a marginal cost of electricity of Rs. 5.9/kWh.

Resources for the Future Bhattacharya and Cropper
20
McNeil et al. (2005), Reddy (2003), and Reddy and Balachandra (2006) provide ex ante studies of the implied potential savings from the usage of more efficient appliances. There is some debate over the size of energy savings from energy efficiency improvements because of the rebound effect; that is, by reducing the cost of energy use, increased energy efficiency leads to increased consumption of energy (Khazzoom 1980). Thus, for example, a lower cost of energy for highly efficient refrigeration could induce some increased purchase of larger refrigerators, offsetting some of the potential energy savings. There appears to be no statistically significant evidence that efficiency improvements in appliances in the United States have led to a rebound effect (Nadel 1993; Dumagan and Mount 1993; Stoft 1993). The situation may be different in a developing country, but to date there is only one study of the rebound effect in India (Roy 2000).
Factors Affecting the Rate of Diffusion of Energy-Efficient Appliances
The rate of diffusion of energy-efficient technologies has been widely studied in the international literature. One explanation for the slow initial rate of technology penetration is that heterogeneous consumers receive different benefits from a technology. As the cost of the technology falls, more consumers receive positive net benefits and adopt the technology. If benefits are normally distributed across consumers, the rate of adoption will follow an S-shaped curve (Jaffee et al. 2003). This suggests that higher energy prices or lower capital costs should increase the rate of technology adoption. Empirical evidence from the United States suggests that higher energy prices have encouraged the adoption of energy-efficient room air-conditioners, central air-conditioners, and gas water heaters (Newell et al. 1999). There is, however, evidence that decreases in capital costs have had a larger effect on adoption than corresponding increases in operating costs (Jaffe and Stavins 1994; Hassett and Metcalf 1999). This suggests that either myopia (i.e., high discount rates) or capital market constraints have played a role in technology adoption by consumers.
An alternative theory of technology diffusion posits that the limiting factor in technology diffusion is information, and that the most important source of information is people who have already adopted the technology.16 This implies that adoption itself generates information externalities. These externalities and the fact that information is a public good provide a rationale for government provision of information about energy efficiency. This has led to appliance
16 This is often referred to as the “epidemic” theory of technology diffusion, in which the rate of change in adopters is proportional to the number of nonadopters “infected” by an adopter (Griliches 1957).

Resources for the Future Bhattacharya and Cropper
21
labeling requirements, which Newell et al. (1999) find to have encouraged the adoption of energy-efficient air-conditioners and water heaters in the United States.
Related to lack of information are agency problems: if landlords make decisions regarding refrigerator and air-conditioner purchases, but tenants play electricity costs, energy costs will not necessarily be internalized in the purchasing decision (Sathaye et al. 2005). Agency problems and lack of knowledge of the life-cycle benefits of energy-efficient technologies are often cited as a rationale for energy efficiency standards. In the United States, minimum energy efficiency standards for appliances were implemented by some states in the 1970s. In 1987 federal standards were issued for 15 categories of household appliances. The U.S. evidence suggests that between 1990 and 1997, appliance standards saved U.S. consumers 1.9 quads of energy and $17 billion in energy costs (Gillingham et al. 2006).
Factors that are likely to prove important in affecting the diffusion of energy-efficient appliances in India include appliance labeling schemes, energy efficiency standards, opportunities for financing energy-efficient appliances, and electricity prices. We discuss labeling requirements, efficiency standards, and electricity pricing below.
In response to the worldwide popularity of ecolabeling schemes, the Government of India launched a voluntary appliance labeling scheme known as Eco-Mark in 1991. The aim was to increase consumers’ awareness about environmentally friendly products in the market. However, the scheme did not succeed in attracting participation from most manufacturers. Two major reasons cited for the failure of manufacturers to participate were the cost of participation and lack of consumers’ awareness (Mehta 2007).
A decade later the scheme was relaunched as the Standards and Labeling Program (S&L), to be monitored under the newly created Bureau of Energy Efficiency. Thus far, S&L covers agricultural pump sets, distribution transformers, motors, lighting products, refrigerators, air-conditioners, and televisions. The labeling requirement is still voluntary, except for frost-free refrigerators (beginning in 2007).17 Unlike the previous scheme, S&L uses a star rating system to rate appliances. There is so far very limited analysis of the effectiveness and diffusion of energy efficiency technologies through the S&L program in India.
17 In contrast, China, a late entrant to the labeling process, has had mandatory labeling for refrigerators and air-conditioners since 2005 and for clothes washers since 2007.

Resources for the Future Bhattacharya and Cropper
22
The literature in the United States suggests that rising energy prices have contributed to the development and adoption of energy-efficient technologies. As noted above (see also Figure A.1), households in India generally pay an electricity tariff that is below the cost of electricity generation. To predict the effect of tariff reform in the electricity sector on appliance purchases requires econometric analyses of appliance purchases, which, to our knowledge, have not been conducted in India. There is, however, qualitative evidence that consumers consider electricity prices when purchasing major appliances.
Tathagat (2004) finds that more than half the respondents of a survey who resided in urban areas were likely to consider refrigerators’ electricity consumption as a factor in their purchasing decisions. However, only 29 percent of respondents in periurban areas considered electricity prices when purchasing refrigerators. For all respondents, the refrigerator’s price was as important a factor as electricity consumption. However, electricity consumption was the most important factor that consumers considered when purchasing air-conditioners.
5. Conclusions—Barriers to Energy Efficiency and Research Needs
Greater use of more energy-efficient technologies in India would in many but not all cases pay for themselves in the form of energy savings. This prompts the following questions: (1) What influences some firms and households to adopt more energy-efficient technologies? and (2) Is this rate of adoption efficient? With answers to these questions, one could help design policies to improve the economic efficiency of energy use and explore opportunities for international cooperation and cofinancing to further improve energy efficiency as a measure for reducing global CO2 emissions.
The diffusion of energy-efficient technologies is usually a slow process, whether in developing or developed countries. The speed of diffusion can be retarded by a variety of factors. A fundamental barrier is government policies that distort prices. One example of induced energy inefficiency is the high electricity prices charged to industry, which stimulates self-generation using inefficient diesel-powered generators. Sathaye et al. (2005) provide another example in a sector not reviewed in this study, agriculture. They report that the energy efficiency of agricultural pump sets in India is extremely low, which coincides with policies that heavily subsidize electricity use for farmers.18 Replacing most pump sets would be fully cost-effective if
18 A side effect has been the overexploitation of groundwater resources.

Resources for the Future Bhattacharya and Cropper
23
electricity were priced at marginal cost; however, the subsidies to electricity have prevented their replacement.
Lack of information is another barrier. Since there are information externalities in this case—adoption by one person conveys information to nonadopters—governments can provide information about energy efficiency by requiring that appliances and machinery be labeled to show their energy usage and that efficiency claims be certified. This is beginning to be done in India, through the Bureau of Energy Efficiency, but some labeling programs are still not mandatory.
A case also can be made for energy efficiency standards—requirements that all appliances meet a minimum level of efficiency. Agency problems often arise in rental markets, since landlords may not purchase energy-efficient appliances or make buildings energy efficient if they do not bear operating costs. Currently, most commercial buildings in India have an energy performance index (EPI) of 200 to 400 kWh/m2/year. This is worse than buildings in North America and Europe, where the EPI is less than 150 kWh/m2/year. Improved building designs from environmentally sensitive companies illustrate that an EPI of 100 to 150 kWh/m2/year is achievable in India. However, Mathur (2007) alleges that large-scale, energy-efficient building standards are limited because of split incentives—builders fear that they would bear the costs, while tenants would enjoy benefits.
Research Needs
There is a large international literature that examines factors affecting the rate of diffusion of energy-efficient technologies (see Jaffee et al. 2003 for a summary). There are virtually no such studies for India. Such studies would provide useful information about the impact of changes in energy prices (as might occur, for example, through electricity tariff reforms), changes in capital costs, energy efficiency standards, or technology adoption subsidies. All of these changes in energy markets and policies will continue to have an important influence on energy costs in India and the country’s CO2 emissions.
The Government of India has implemented a variety of policies beginning in the early 1990s that could positively affect energy efficiency. These include reforms in the electricity sector (both legislative reforms and the removal of tariffs on imported coal), the relaxing of price and output regulations on certain energy intensive industries, and energy efficiency labeling requirements for appliances. Since there have been no rigorous econometric studies of these policies, many research questions remain unanswered: Have reforms increased efficiency in

Resources for the Future Bhattacharya and Cropper
24
electricity generation? Has technical change in energy-intensive industries been energy saving or energy using since the early 1990s? Has labeling promoted the purchase of more efficient appliances, holding other factors constant? What would be the likely impact of a major restructuring of electricity tariffs?
These are all positive, rather than normative, questions. Their answers, however, should help policymakers understand consumers’ and firms’ behavior in the adoption of energy-efficient technologies and thus inform government policy in this area.
Resources for the Future Bhattacharya and Cropper
25
References
Barnes, D.F., K. Krutilla, and W.F. Hyde. 2005. “The urban household energy transition: social and environmental impacts in the developing world.” Washington, DC: Resources for the Future; Energy Sector Management Assistance Program, World Bank.
Beck, F., and E. Martinot, Global Environment Facility. 2004. “Renewable energy policies and barriers.” In C.J. Cleveland (ed.), Encyclopedia of Energy. Academic Press/Elsevier Science.
CCAP. 2006. “Greenhouse gas mitigation in India: Scenarios and opportunities through 2031.” Center for Clean Air Policy (CCAP) Report, TERI, November.
Central Electricity Authority (CEA). 2006. All India Electricity Statistics, Central Electricity Authority, Government of India.
Chandrasekar, B., and T.C. Kandpal. 2007. “An opinion survey based assessment of renewable energy technology development in India.” Renewable and Sustainable Energy Reviews 11(4): 688–701.
Dumagan, J.C., and T.D. Mount. 1993. “Welfare effects of improving end-use efficiency: Theory and application to residential electricity demand.” Resource and Energy Economics 15(2): 175–201.
Ghosh, D., P.R. Shukla, A. Garg, and P.V. Ramana. 2002. “Renewable energy technologies for Indian power sector: Mitigation potential and operational strategies.” Renewable and Sustainable Energy Reviews 6(6): 481–512.
Gillingham, K., R. Newell, and K. Palmer. 2006. “Energy efficiency policies: A retrospective examination.” Annual Review of Environment and Resources 31: 161–92.
Glow Asia Cookstove Programme. 2000. “Improved stove and climate change.” Glow: The Asia Regional Cookstove Programme 22, November.
Government of India (GOI). 1999. Annual Report 1999–00 on the Working of State Electricity Boards and Electricity Departments, Planning Commission, Government of India.
———. 2002. Annual Report 2001–02 on the Working of State Electricity Boards and Electricity Departments. Planning Commission, Government of India.
———. 2005. Integrated Energy Policy Report—Draft Report. Planning Commission, Government of India, December.
Resources for the Future Bhattacharya and Cropper
26
———. 2006. Integrated Energy Policy Report. Planning Commission, Government of India.
Greenglass, N., and K.R. Smith. 2006. “Current improved cookstove (ICS) activities in South Asia: A web-based survey.” WHRC/IIMB Project Report for Clean Energy Technologies: Sustainable Development and Climate Co-Benefits in India (CETSCO). Woods Hole Research Center, September.
Griliches, Zvi. 1957. "Hybrid corn: an exploration in the economics of technical change." Econometrica 25(4): 501-522.
Hassett, K.A., and G.E. Metcalf. 1999. “Investment with uncertain tax policy: Does random tax policy discourage investment?” Economic Journal 109(457): 372–.93
Heltberg, R. 2004. “Fuel switching: Evidence from eight developing countries.” Energy Economics 26(5): 869–87.
Jaffe, A.B., and R.N. Stavins. 1994. “The energy paradox and the diffusion of conservation technology.” Resource and Energy Economics 16(2): 91–122.
Jaffe, A.B., R.G. Newell, and R.N. Stavins. 2003. “Technological change and the environment.” In K.-G. Mäler and J.R. Vincent (eds.), Handbook of Environmental Economics, Volume 1. Elsevier Science B.V.
Khanna, M., and D. Zilberman. 1999. “Barriers to energy efficiency in electricity generation in India.” Energy Journal 20(1): 25–41.
———. 2001. “Adoption of energy efficient technologies and carbon abatement: The electricity generating sector in India.” Energy Economics 23(6): 637–58.
Khazzoom, J.D. 1980. “Economic implications of mandated efficiency standards for household appliances.” Energy Journal 11: 21–40.
Kishore, V.V.N., and P.V. Ramana. 2002. “Improved cookstoves in rural India: How improved are they? A critique of the perceived benefits from the National Programme on Improved Chulhas (NPIC).” Energy 27(1): 47–63.
Kumar, A., S.K. Jain, and N.K. Bansal. 2003. “Disseminating energy-efficient technologies: A case study of compact fluorescent lamps (CFLs) in India.” Energy Policy 31(3): 259–72.
Mathur, A. 2007. “Energy efficiency in buildings in India: An overview.” Presentation at 2nd Meeting of the Indo-German Energy Forum, December.
Resources for the Future Bhattacharya and Cropper
27
Mathur, R., C. Chand and T. Tezuka. 2003."Optimal use of coal for power generation in India." Energy Policy 31(4): 319-331.
McNeil, M., M. Iyer, S. Meyers, V. Letschert, and J.E. McMahon. 2005. “Potential benefits from improved energy efficiency of key electrical products: The case of India.” LBNL-58254. Lawrence Berkeley National Laboratory.
Mehta, P.S. 2007. “Why was India’s Ecomark scheme unsuccessful?” Research Report. International Consumer Unity & Trust Society (CUTS), India.
Ministry of Petroleum. 2007. Annual Report 2006–07. Ministry of Petroleum and Natural Gas, Government of India.
Nadel, S.M. 1993. “The takeback effect: Fact or fiction?” Proceedings of the 1993 Energy Program Evaluation Conference, Chicago.
Newell, R.G., A.B. Jaffe, and R.N. Stavins. 1999. “The induced innovation hypothesis and energy-saving technological change.” Quarterly Journal of Economics 114(3): 941–75.
Persson, T.A., C. Colpier, and U. Azar. 2007. “Adoption of carbon dioxide efficient technologies and practices: An analysis of sector-specific convergence trends among 12 nations.” Energy Policy 35(5): 2869–78.
Phadke, A.A., A.S. Jayant, and S. Padmanabhan. 2005. “Economic benefits of reducing maharashtra’s electricity shortage through end-use efficiency improvement.” LBNL 57053. Lawrence Berkeley National Laboratory.
Pohekar, S.D., and M. Ramachandran. 2006. “Multi-criteria evaluation of cooking devices with special reference to utility of parabolic solar cooker (PSC) in India.” Energy 31: 1215–27.
Pohekar, S.D., D. Kumar, and M. Ramachandran. 2005. “Dissemination of cooking energy alternatives in India—A review.” Renewable and Sustainable Energy Reviews 9(4): 401–15.
Reddy, B.S. 2003. “Overcoming the energy efficiency gap in India's household sector.” Energy Policy 31(11): 1117–27.
Reddy, B.S., and K.N. Amulya. 1991. “Barriers to improvements in energy efficiency.” Energy Policy 19(10): 953–61.
Reddy, B.S., and G. Assenza. 2007. “Barriers and drivers to energy efficiency.” WP2007-003. IGIDR Working Paper Series.
Resources for the Future Bhattacharya and Cropper
28
Reddy, B.S., and P. Balachandra. 2006. “Dynamics of technological shifts in the household sector—Implications for Clean Development Mechanism.” Energy Policy 34(16): 2586–99.
Reddy, B.S., and R.M. Shrestha. 1998. “Barriers to the adoption of efficient electricity technologies: A case study of India.” International Journal of Energy Research 22(3): 257–70.
Roy, J. 2000. “The rebound effect: Some empirical evidence from India.” Energy Policy 28(6-7): 433–38.
Sanstad, A.H., J. Roy, and J.A. Sathaye. 2006. “Estimating energy-augmenting technological change in developing country industries.” Energy Economics 28(5-6): 535–38.
Sathaye, J., and A. Phadke. 2006. “Cost of electric power sector carbon mitigation in India: international implications.” Energy Policy 34(4): 1619–29.
Sathaye, J., L. Price, S. de la Rue du Can, and D. Fridley. 2005. “Assessment of energy use and energy savings potential in selected industrial sectors in India.” LBNL-57293, Energy Analysis Department Environmental Energy Technologies Division, Lawrence Berkeley National Laboratory, August.
Schumacher, K., and J. Sathaye. 1998. “India’s iron and steel industry: Productivity, energy efficiency and carbon emissions.” LBNL-41844, Lawrence Berkeley National Laboratory.
———. 1999a. “India’s aluminum industry: productivity, energy efficiency and carbon emissions.” LBNL-41845. Lawrence Berkeley National Laboratory.
———. 1999b. “India’s cement industry: Productivity, energy efficiency and carbon emissions.” LBNL-41842, Lawrence Berkeley National Laboratory,.
———. 1999c. “India’s fertilizer industry: Productivity and energy efficiency.” LBNL-41846, Lawrence Berkeley National Laboratory.
———. 1999d. “India’s Pulp and Paper Industry: Productivity and Energy Efficiency.” LBNL-41843, Lawrence Berkeley National Laboratory.
Shanmugam, K.R., and Praveen Kulshrestha. 2005. “Efficiency analysis of coal-based thermal power generation in India during post-reform era.” International Journal of Global Energy Issues 23(1): 15–28.

Resources for the Future Bhattacharya and Cropper
29
Shukla, P.R., D. Biswas, T. Nag, A. Yajnik, T. Heller, and D.G. Victor. 2004. “Impact of power sector reforms on technology, efficiency and emissions: Case study of Gujarat, India.” Program on Energy and Sustainable Development Working Paper 21, Stanford University, March.
Singh, A., S.C. Srivastava, and R.M. Shrestha. 2006. “Barriers to adoption of clean and efficient technologies in the Indian power sector: An analysis using AHP.” Presented at Better Air Quality Workshop, Jakarta, December.
Sinha, B. 2002. “The Indian stove programme: An insider’s view—The role of society, politics, economics and education.” Boiling Point 48: 23–26.
Stoft S. 1993. “Appliance standards and the welfare of poor families.” Energy Journal 14(4): 123–28.
Tongia, R. 2003. “The political economy of Indian power sector reforms.” Program on Energy and Sustainable Development Working Paper 4, Stanford University, December.
Tathagat, T. 2004. “India energy efficiency standards and labeling program status.” Presentation at the International Workshop on Standards and Labeling, Bangalore, October 13–14.
Thakur, T., S.G. Deshmukh, and S.C. Kaushik. 2006. “Efficiency evaluation of the state owned electric utilities in India.” Energy Policy 34(17): 2788–804.
USAID. 2006. “Opportunities and barriers for the scale-up of clean energy options.” In From Ideas to Action: Clean Energy Solutions for Asia to Address Climate Change, USAID Eco-Asia, Section 4.
Viswanathan, B., and K.S. Kavi Kumar. 2005. “Cooking fuel use patterns in India: 1983–2000.” Energy Policy 33(8): 1021–36.
Yang, M. 2006. “Energy efficiency policy impact in India: Case study of investment in industrial energy efficiency.” Energy Policy 34(17): 3104–114.\

Resources for the Future Bhattacharya and Cropper
30
Appendix A: An Overview of Energy Consumption and Production in India
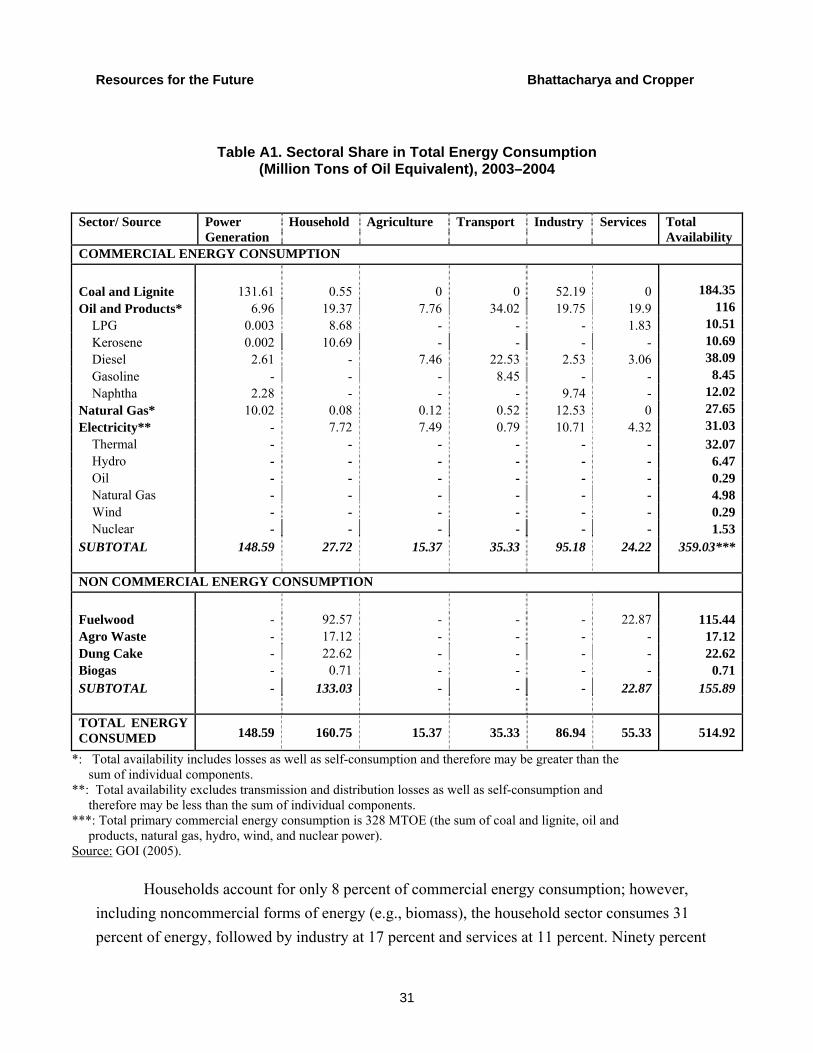
Table A.1 shows the sectoral shares of energy consumption in India, by end user, for the year 2003–2004, as well as energy consumption by the power sector. The power sector consumes 71 percent of the coal, 6 percent of the oil, and 36 percent of the natural gas in India and is thus the largest primary consumer of commercial energy. Industry is the largest end user of commercial energy in the economy. Most of this is in the form of coal, which is used directly in production (e.g., coking coal in steel production) but also to generate electricity. Oil consumed by industry is also used for power generation: much captive power is provided by diesel generators, especially for small and medium-sized enterprises.19 The share of commercial electricity consumed by industry has declined steadily since 1950 (Tongia 2003),20 partly as a result of pricing policies: industry pays a cost per kWh that is twice what households pay (see Figure A.1).
19 The consumption of electricity in Table A.1 refers to the consumption of commercially generated electricity from the power grid. 20 In 1950, industry accounted for 62.2 percent of commercial energy consumption (Tongia 2003), compared with 34.5 percent in 2003–2004 (see Table A.1).
Resources for the Future Bhattacharya and Cropper
31
Table A1. Sectoral Share in Total Energy Consumption (Million Tons of Oil Equivalent), 2003–2004
Sector/ Source Power Generation
Household Agriculture Transport Industry Services Total Availability
COMMERCIAL ENERGY CONSUMPTION
Coal and Lignite 131.61 0.55 0 0 52.19 0 184.35Oil and Products* 6.96 19.37 7.76 34.02 19.75 19.9 116
LPG 0.003 8.68 - - - 1.83 10.51Kerosene 0.002 10.69 - - - - 10.69Diesel 2.61 - 7.46 22.53 2.53 3.06 38.09Gasoline - - - 8.45 - - 8.45Naphtha 2.28 - - - 9.74 - 12.02
Natural Gas* 10.02 0.08 0.12 0.52 12.53 0 27.65Electricity** - 7.72 7.49 0.79 10.71 4.32 31.03
Thermal - - - - - - 32.07Hydro - - - - - - 6.47Oil - - - - - - 0.29Natural Gas - - - - - - 4.98Wind - - - - - - 0.29Nuclear - - - - - - 1.53
SUBTOTAL 148.59 27.72 15.37 35.33 95.18 24.22 359.03***
NON COMMERCIAL ENERGY CONSUMPTION
Fuelwood - 92.57 - - - 22.87 115.44Agro Waste - 17.12 - - - - 17.12Dung Cake - 22.62 - - - - 22.62Biogas - 0.71 - - - - 0.71SUBTOTAL - 133.03 - - - 22.87 155.89
TOTAL ENERGY CONSUMED 148.59 160.75 15.37 35.33 86.94 55.33 514.92
*: Total availability includes losses as well as self-consumption and therefore may be greater than the sum of individual components. **: Total availability excludes transmission and distribution losses as well as self-consumption and therefore may be less than the sum of individual components. ***: Total primary commercial energy consumption is 328 MTOE (the sum of coal and lignite, oil and products, natural gas, hydro, wind, and nuclear power). Source: GOI (2005).
Households account for only 8 percent of commercial energy consumption; however, including noncommercial forms of energy (e.g., biomass), the household sector consumes 31 percent of energy, followed by industry at 17 percent and services at 11 percent. Ninety percent

Resources for the Future Bhattacharya and Cropper
32
of rural households and 27 percent of urban households use biomass for cooking (see Table A.2, below). In contrast, only 43.5 percent of rural households and 70 percent of urban households have access to electricity (Tongia 2003).
Figure A1. Average Production Cost and Tariff for Electricity
0.0
0.5
1.0
1.5
2.0
2.5
3.0
3.5
4.0
4.5
5.0
1992-93 1993-94 1994-95 1995-96 1996-97 1997-98 1998-99 1999-00 2000-01 2001-02
Ave
rage
Tar
iff (R
s./k
wh)
Average cost of electricity production (distribution and transmission costs not included)ResidentialCommercialAgricultureIndustryRailway tractionOutside stateAverage tariff across all sectors
Source: GOI (1999, 2002).
Agriculture and transport currently consume smaller shares of energy but are no less important in terms of energy efficiency. Agriculture accounts for 20 percent of total diesel consumption in the country. The share of electricity consumed by agriculture is likely understated by Table A.1. As Figure A.1 indicates, electricity is heavily subsidized for farmers, and usage is often not metered. The share of energy consumed by transport, which includes household consumption of gasoline and diesel, is rapidly growing.
In setting priorities for energy efficiency, it is important to consider future as well as current energy consumption. The Indian Planning Commission predicts that electricity production will increase by a factor of 6 by 2031. Although households currently consume only

Resources for the Future Bhattacharya and Cropper
33
25 percent of electricity, their share of electricity consumption is projected to increase by a factor of 8 by 2031 (GOI 2006). Electricity consumption by industry is predicted to grow by a factor of 5 (CCAP 2006). For this reason we have focused in our literature review on the household sector, the power sector, and selected industries (aluminum, iron and steel, cement, fertilizer, and pulp and paper).
Appendix B: Specific Energy Consumption (SEC) Compared with Best Practice in Selected Indian Industries
Aluminum
(GJ/tonne aluminum)
India
(NALCO) India
(Other Plants) Best Practice
(Das et al. 1998) Best Practice
(Phylipsen et al. 1998)
Alumina production Final Energy 25.1 32.3 24.3 20.2 16.2 Aluminum production Thermal energy 4 0.8-2.5 Electricity 52.2-56.0 55-65 46.8 45 Total Thermal energy 18.3 35 Electricity 46.9 46.9Final energy 87 86-100 65.2 81.9 Energy Savings Potential (percent) 5-35

Resources for the Future Bhattacharya and Cropper
34
Cement
(GJ/tonne cement)
India
(Dry Process Plants) India
(Average of all Plants) Best Practice
(Worrell et al. 1995)
1993 Electricity SEC 0.40 0.42 0.35 Fuel SEC 3.00 3.58 2.71 Total SEC (Final) 3.40 4.00 3.06 Savings Potential (percent) Electricity SEC 14.30 17.70 Fuel SEC 9.50 24.20 Total SEC (Final) 10.10 23.50
Iron and Steel
(GJ/tonne steel)
India Best Practice (IEA 1998)
1994 Electricity SEC 1.98 1.18 Fuel SEC 33.49 17.94 Total SEC (Final) 35.47 19.12 Savings Potential (percent) Electricity SEC 40.00 Fuel SEC 46.00 Total SEC (Final) 46.00

Resources for the Future Bhattacharya and Cropper
35
Fertilizer
(Gcal/tonne ammonia)
Year of Installation Plants Operating on
Natural Gas/ Associated Gas Naphtha
Fuel Oil/ LSHS Coal
Specific Energy Consumption in 1993-94
Pre 1980 10.00 12.00 15.00 38.00 1981-1990 9.70 10.60 11.80 48.00 1991-1998 8.70 Average 9.36 11.53 14.17 39.70
Average Achievable Specific Energy Consumption (Gcal/tonne ammonia)
8.80 9.80 11.80 38.00
Average Energy Savings Potential (percent) 6 15 17 4
Pulp and Paper
(GJ/tonne paper) India Abroad Fuel Electricity Final Energy Fuel Electricity Final Energy Chipper 0.40-0.46 0.40-0.46 0.33-0.35 0.33-0.35 Digester 12.5-18.0 0.21-0.22 12.67-18.22 8.1-9.9 0.15-0.17 8.3-10.02 Evaporator 11.5-18.5 11.54-18.46 7.7-9.4 7.71-9.43 Washing and Screening 0.52-0.56 0.52-0.56 0.42-0.44 0.42-0.44 Bleaching 1.6-1.8 0.32-0.33 1.93-2.18 0.9-1.1 0.24-0.25 1.09-1.32 Soda Recovery 2.3-5.1 0.61-0.68 2.92-5.76 1.3-2.1 0.46-0.49 1.74-2.63 Stock Preparation 0.99-1.03 0.99-1.03 0.59-0.62 0.59-0.62 Paper Machine 13.8-18.5 1.67-1.71 15.52-20.17 7.7-9.2 1.48-1.49 9.19-10.72 Deaerator 3.7-5.5 3.69-5.54 1.9-3.0 1.93-3.00 Utilities and Others 0.89-0.91 0.89-0.91 0.58-0.59 0.58-0.59 Total 46.2-73.8 5.40-6.12 51.55-79.97 27.9-36.4 4.14-4.50 32.00-40.93
Source: Schumacher and Sathaye (1998, 1999a, 1999b, 1999c, 1999d).