arcgis server provides a scalable enterprise wastewater ... · this service area encompasses the...
TRANSCRIPT
ArcGIS Server Provides a Scalable Enterprise Wastewater Utility GIS 2006 ESRI International User Conference
Authors: Jeffrey Duke (NEORSD), Mark Kramer (CH2M HILL), David Cox (CH2M HILL), Tyler Huehmer (CH2M HILL)
2 COPYRIGHT 2006 BY NEORSD • COMPANY CONFIDENTIAL
ABSTRACT
The Northeast Ohio Regional Sewer District (NEORSD or District) has been using two separate systems to accommodate its staff’s GIS needs. The current systems, which have been in place for 5 years, consist of a desktop application and an ArcIMS application with limited functionality. The challenge facing NEORSD was migration of existing applications into a single intranet-based solution, which included all existing features of the old systems, while providing a sustainable path forward. After thorough evaluation and planning, the NEORSD chose ArcGIS Server as the foundation for their enterprise-wide GIS application. Using ASP.NET, an intranet application was developed that provides NEORSD with an innovative and flexible framework for its evolving business needs. The user interface was designed to be intuitive and require little training. The application provides end users the ability to work with a map customized to their departmental and individual needs. Available tools range from simple reporting to complex analysis.
BACKGROUND
In 1972, the Northeast Ohio Regional Sewer District (NEORSD or District) was created as a regional agency responsible for wastewater treatment facilities and interceptor sewers in the greater Cleveland Metropolitan Area. This service area encompasses the City of Cleveland and all or portions of 60 suburban municipalities in Cuyahoga, Summit, and Lorain Counties. The District owns and operates three major wastewater treatment plants: Easterly WWTP, Southerly WWTC, and Westerly WWTP. Through the operation of these plants, the District minimizes the amount of pollution entering Lake Erie and the Cuyahoga River. In addition, the District is responsible for a variety of related wastewater treatment infrastructure and projects designed to convey wastewater from the local sewers to the treatment plants. Regionally, there are more than 4,800 miles of sewers tributary to the District. The District maintains more than 200 miles of large interceptor sewers. The City of Cleveland and some nearby suburbs have combined sewers, in which one pipe conveys both stormwater and sanitary sewage. The District maintains combined sewer overflows throughout the Greater Cleveland area. Furthermore, the District conducts investigations to identify pollutants within the sewage collection system that have the potential to be reduced through pollution prevention. NEORSD works with industrial customers to achieve pollution prevention goals. Other District activities include watershed protection and planning, working with local communities to ensure that small streams and tributaries are properly maintained.
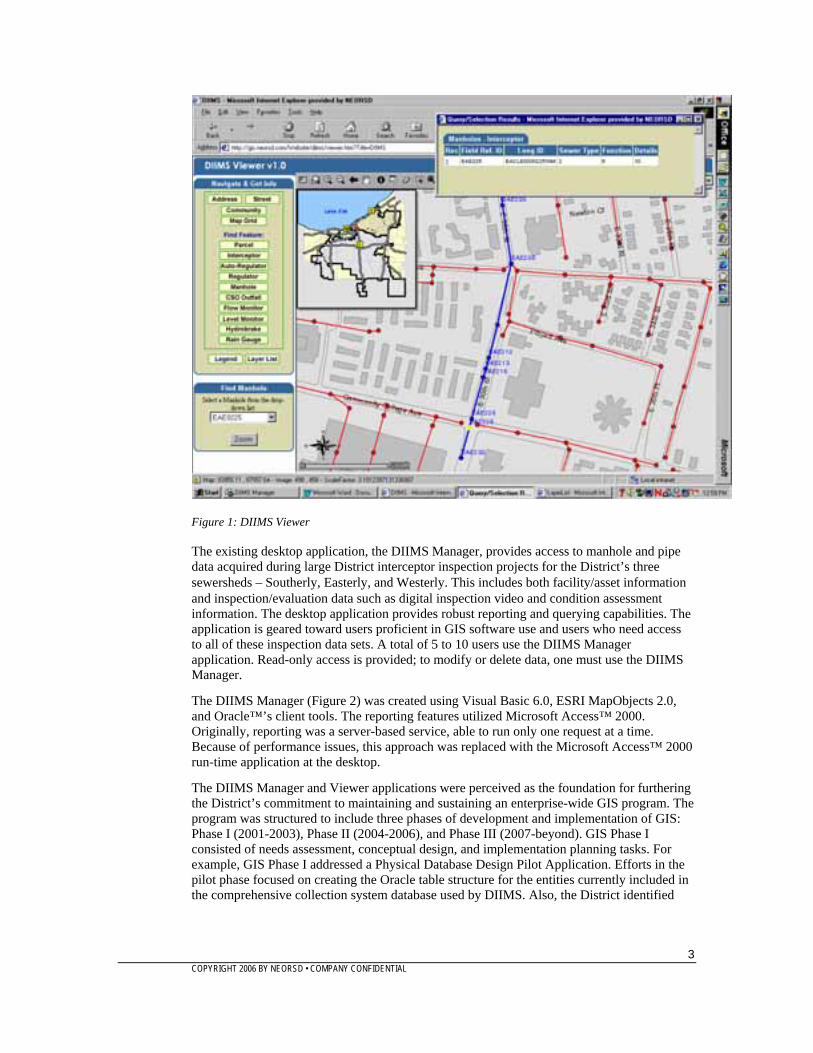
The District has been using GIS in its daily business since 2001 when both an enterprise ArcIMS application and desktop-based ArcGIS application were deployed. The District Infrastructure Information System (or DIIMS) Viewer enables District staff through-out the enterprise to graphically access and view the comprehensive collection system database on the District’s intranet. The DIIMS Viewer is a browser-based data viewer designed for general queries by District-wide users with limited GIS knowledge or background. The functionality includes access to District facility data, map query, and map generation using standard templates. Users can turn map layers on and off; navigate using various spatial references, pan and zoom; and access tabular data for a selected object as shown in Figure 1.
The DIIMS Viewer was created using ESRI ArcIMS™3.1, Cold Fusion™ 4.5.1, and Servlet Exec. These are compliant with the District’s technology standards. Servlet Exec provides up to 10 users with concurrent access. The data are stored in Oracle™ 8i with ArcSDE 8.1. There is one server that functions as both the Oracle™/SDE server and the Web Server (NT Server Version 4 SP6a, IIS 4).
3 COPYRIGHT 2006 BY NEORSD • COMPANY CONFIDENTIAL
Figure 1: DIIMS Viewer
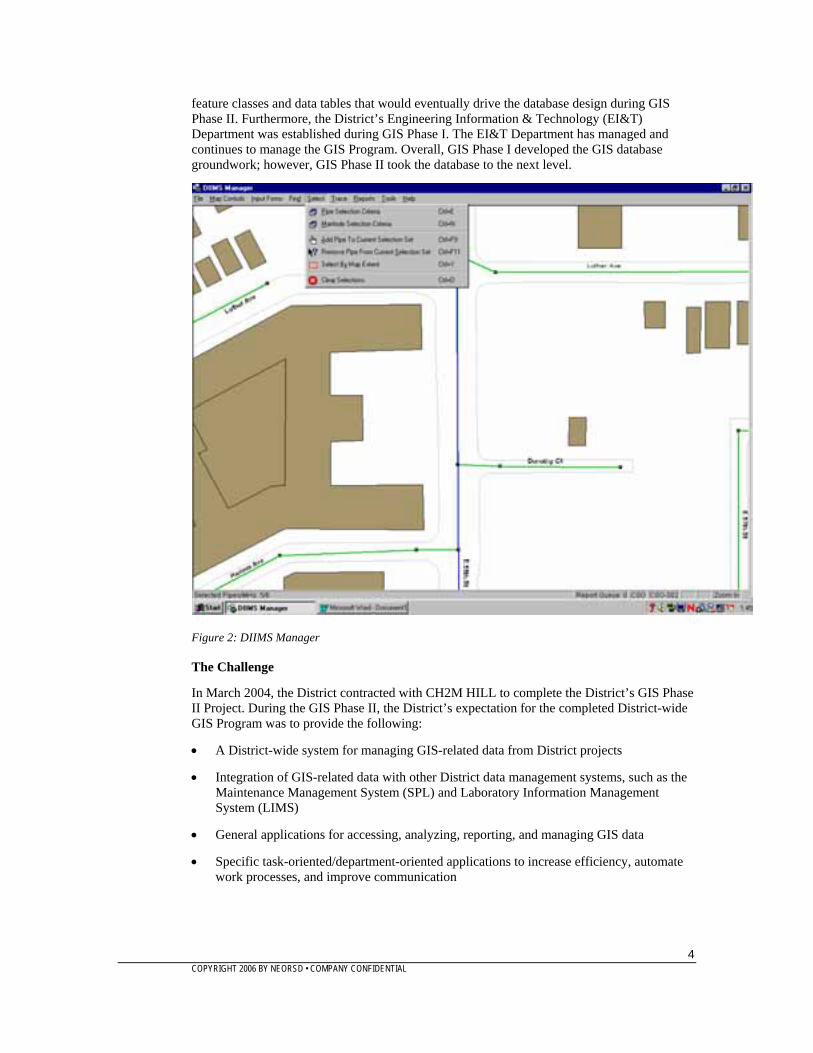
The existing desktop application, the DIIMS Manager, provides access to manhole and pipe data acquired during large District interceptor inspection projects for the District’s three sewersheds – Southerly, Easterly, and Westerly. This includes both facility/asset information and inspection/evaluation data such as digital inspection video and condition assessment information. The desktop application provides robust reporting and querying capabilities. The application is geared toward users proficient in GIS software use and users who need access to all of these inspection data sets. A total of 5 to 10 users use the DIIMS Manager application. Read-only access is provided; to modify or delete data, one must use the DIIMS Manager.
The DIIMS Manager (Figure 2) was created using Visual Basic 6.0, ESRI MapObjects 2.0, and Oracle™’s client tools. The reporting features utilized Microsoft Access™ 2000. Originally, reporting was a server-based service, able to run only one request at a time. Because of performance issues, this approach was replaced with the Microsoft Access™ 2000 run-time application at the desktop.
The DIIMS Manager and Viewer applications were perceived as the foundation for furthering the District’s commitment to maintaining and sustaining an enterprise-wide GIS program. The program was structured to include three phases of development and implementation of GIS: Phase I (2001-2003), Phase II (2004-2006), and Phase III (2007-beyond). GIS Phase I consisted of needs assessment, conceptual design, and implementation planning tasks. For example, GIS Phase I addressed a Physical Database Design Pilot Application. Efforts in the pilot phase focused on creating the Oracle table structure for the entities currently included in the comprehensive collection system database used by DIIMS. Also, the District identified
4 COPYRIGHT 2006 BY NEORSD • COMPANY CONFIDENTIAL
feature classes and data tables that would eventually drive the database design during GIS Phase II. Furthermore, the District’s Engineering Information & Technology (EI&T) Department was established during GIS Phase I. The EI&T Department has managed and continues to manage the GIS Program. Overall, GIS Phase I developed the GIS database groundwork; however, GIS Phase II took the database to the next level.
Figure 2: DIIMS Manager
The Challenge
In March 2004, the District contracted with CH2M HILL to complete the District’s GIS Phase II Project. During the GIS Phase II, the District’s expectation for the completed District-wide GIS Program was to provide the following:
• A District-wide system for managing GIS-related data from District projects
• Integration of GIS-related data with other District data management systems, such as the Maintenance Management System (SPL) and Laboratory Information Management System (LIMS)
• General applications for accessing, analyzing, reporting, and managing GIS data
• Specific task-oriented/department-oriented applications to increase efficiency, automate work processes, and improve communication
5 COPYRIGHT 2006 BY NEORSD • COMPANY CONFIDENTIAL
During GIS Phase II, the District has, or is in the process of, achieving the following objectives: District-wide ESRI SDE Geodatabase, an enhanced intranet portal (DV2), integration of other District database applications (SPL and Lablynx), and the overall GIS work flows and data management practices and standards. Once GIS Phase II is complete, the District will initiate the GIS Phase III project of the GIS Program.
In 2007 or 2008, the District will initiate the GIS Phase III project. Goals and objectives for this project consist of operational evaluation and additional development, as driven by other District initiatives. Some of these District initiatives would include compiling the District’s Stormwater Network, integrating with other District data management systems such as Operations Data Management System, and further enhancements to DV2.
The subject of this paper – a GIS solution using ArcGIS Server technology – was created in fulfillment of the GIS Phase II project. The District’s primary objective for the Phase II application development was to develop, test, and implement applications to provide access, analysis, maintenance, and reporting tools to support the business needs of the District. The work plan for the project included a validation and update of the GIS Phase I Project Results (Needs Assessment, Conceptual Design and Implementation Plan), which involved revisiting data and database requirements and setting the priorities for application requirements. The following highlights specific needs of the GIS program and steered the development work:
• Provide a new “DIIMS Viewer” application implemented as DIIMS Viewer Version 2 or “DV2” – A new web-based application that allows users to access data, including all the functionality of the existing DIIMS Viewer, and address ability for remote viewing capabilities
• Deploy Advanced Query/Search/Export Functionality – This functionality would allow users to perform certain analyses on datasets and support the exporting of data into new or sub-datasets for project or data sharing purposes
• Provide for an inventory of GIS data and metadata viewing – An application or function that allows users to access standardized metadata on all applicable GIS data layers, and document and file viewing (i.e., link to project reports, sewer plans, photos, videos, and other images);
• Allow Network Tracing – Users would perform network tracing (upstream and downstream) on the collection system, taking into consideration the multiple possible routes during dry and wet weather flow conditions of overflows
• Make Standard Maps and Reports – Users would have the ability to print maps incorporating any standards (e.g., disclaimers, policies for use) as well as standard enterprise tabular reports
• Provide Grid or Batch Printing of Map Books – This provides the capability to print various “map books” or individual pages of each map book of the collection system/outlying facilities (different formats, sizes, as necessary)
• Deploy a Mark-up or Redlining Function – Users that do not have access to data maintenance tools could highlight areas and input comments related to data issues.
The application(s) would also address the various user classes needed for maintaining the enterprise dataset as well as be a vehicle for promoting standardization for data collection and maintenance across the enterprise to sustain an “official” comprehensive collection system dataset.
6 COPYRIGHT 2006 BY NEORSD • COMPANY CONFIDENTIAL
TECHNOLOGY EVALUATION AND SELECTION
The Vision
Ideally, the District envisioned a single, intranet-based solution for the tools that would allow organization, maintenance, analysis, and reporting of geographic data as described in the above Background section. The project team’s strategy was to establish first and foremost which products would be used to deliver the solution. The Project Team's overall approach to the evaluation of appropriate technology to implement included the review of the following:
• Current enterprise DIIMS applications (both web and desktop) functions, look and feel
• Current and upcoming ESRI products for “out of the box” solutions (e.g., ArcGIS Server, ArcIMS, etc.) to provide data viewing tools for a browser-based environment
• The ability to develop custom, enhanced viewing tools or functions for use in a web browser that could be deployed over the District's intranet
• Accommodation of multiple user classes that make up the District’s departments and culture
• Ease of system and application maintenance and standardization
• Implementation and maintenance of the database (e.g., tuning, software upgrades, data model, QA/QC issues, incorporating new data, updating existing data)
• Cost and which hardware, software, and development environment would meet the budget, schedule, rollout, and training needs constraints of the project
The Criteria
Addressing the points described in the vision above presented a significant challenge in the beginning phases of the project. Consensus would be needed from two groups within the organization for a successful implementation – the District’s IT group comprises the hardware and software maintainers, and the Engineering Information and Technology (EI&T) group are the data maintainers. EI&T had made a significant investment in ArcIMS and a custom solution that was in place and well liked and used throughout the organization. However, limitations encountered in the ArcIMS platform meant that NEORSD was also using a custom desktop application built using MapObjects. The MapObjects application allowed end users to query sewer inspection data, reports, and other media related to the GIS data. The following criteria for selecting an appropriate technology were identified by the two groups:
• EI&T preferences and guidelines for application development within the organization, were as follows:
o Both desktop and server-based solutions will be needed. Functions would have to be prioritized for web and desktop deployment. The main reason for deploying the application via the Intranet was the number of anticipated end users. Custom Desktop solutions were developed for the data maintainers to facilitate their daily mapping and editing tasks
o Ideally, some form of consistent framework could be used in the application development process, software, hardware, training, and maintenance for the desktop and Intranet solutions
o The solution should leverage the District investment in ESRI technology to date
7 COPYRIGHT 2006 BY NEORSD • COMPANY CONFIDENTIAL
o The selected software and application framework would meet the user requirements by allowing District staff to view, analyze, maintain, and create reports for their GIS data
• IT preferences and guidelines for application development within the organization, were as follows:
o Novell Servers for File-based storage and Windows servers for applications
o Use of open source development tools
o Get the maximum benefit from “out of the box” solutions
o Creating applications that are supportable by in-house staff
• Other criteria:
o Anticipated solution should fit within allocated budget and schedule for implementation
o A cautious approach to “leading edge” technology (i.e., use of proven, reliable tools (not “bleeding” edge)
The Results
Using the above considerations, a detailed analysis of available technology, including integrated development environments for customization, was completed and resulted in the following recommendations:
• ArcGIS Server and the .NET framework were selected as the appropriate technology for this solution. The reasons for selecting these two technologies were:
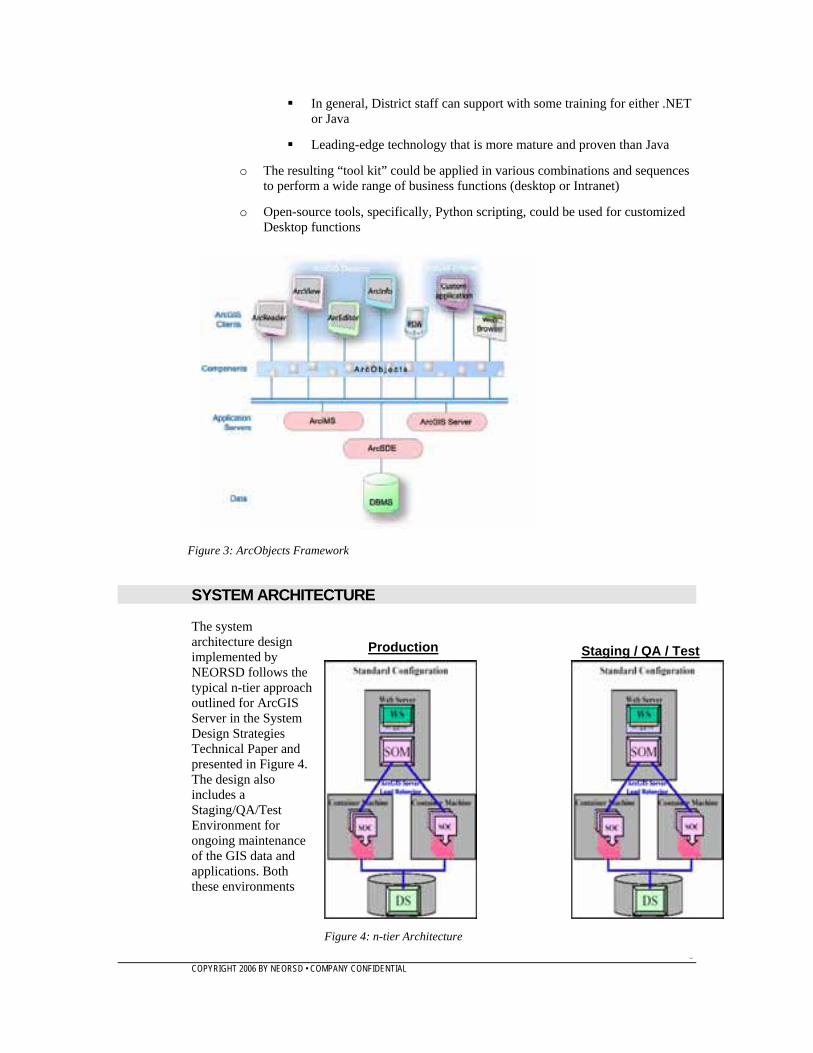
o The ArcObjects Framework (Figure 3) allows for the most consistent base from which to deploy multiple end-user applications on a variety of hardware platforms
o The ArcGIS Server .NET ADF tools for customizations were available and proven since the 2003 Beta release; Java or other open source tools were not yet available
o Using ArcGIS Server and the .NET Framework, all existing functions and the look and feel of the separate (ArcIMS and MapObjects) applications could be replicated easily
o The scalable architecture of ArcGIS Server provided the consistent framework for desktop and web development
o Access to expert development resources (ArcObjects and .NET Framework) is more readily available
o For customizations, the .NET option provides for:
Consistent development environment for desktop and server applications
More cost-effective environment and faster production environment
8 COPYRIGHT 2006 BY NEORSD • COMPANY CONFIDENTIAL
In general, District staff can support with some training for either .NET or Java
Leading-edge technology that is more mature and proven than Java
o The resulting “tool kit” could be applied in various combinations and sequences to perform a wide range of business functions (desktop or Intranet)
o Open-source tools, specifically, Python scripting, could be used for customized Desktop functions
SYSTEM ARCHITECTURE
The system architecture design implemented by NEORSD follows the typical n-tier approach outlined for ArcGIS Server in the System Design Strategies Technical Paper and presented in Figure 4. The design also includes a Staging/QA/Test Environment for ongoing maintenance of the GIS data and applications. Both these environments
Production Staging / QA / Test
Figure 4: n-tier Architecture
Figure 3: ArcObjects Framework
9 COPYRIGHT 2006 BY NEORSD • COMPANY CONFIDENTIAL
are mirror images in configuration to ensure that development and administration activities (e.g., upgrades, patches, code development, testing) can be performed in a common environment and allows for a more secure and stable production environment. The development environment also provides for a “fail over” system in the event part of or the entire production environment service is interrupted. The architecture also provides a balanced and flexible system with the following features:
• Enhanced application performance, reliability, security, and scalability. This configuration can be scaled as needed to balance future loads or high-availability should the need arise in the future by adding servers to the “Spatial” (or middle) layer of the configuration.
• Increased storage capacity for GIS-related documents and media.
• Separate business logic and processes from interface programming.
Also note that additional equipment for load balancing was not considered a need at this time; therefore, only one “Spatial” server was recommended and configured.
For each environment, server specifications and functions are described below:
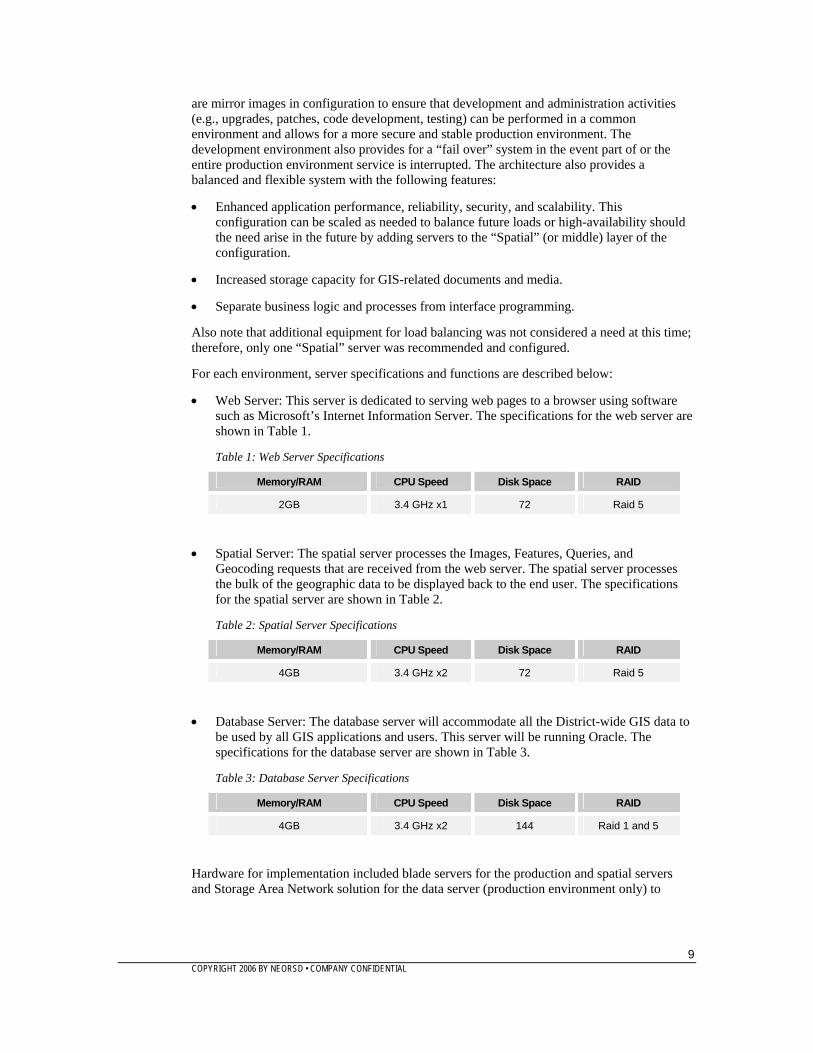
• Web Server: This server is dedicated to serving web pages to a browser using software such as Microsoft’s Internet Information Server. The specifications for the web server are shown in Table 1.
Table 1: Web Server Specifications
Memory/RAM CPU Speed Disk Space RAID
2GB 3.4 GHz x1 72 Raid 5
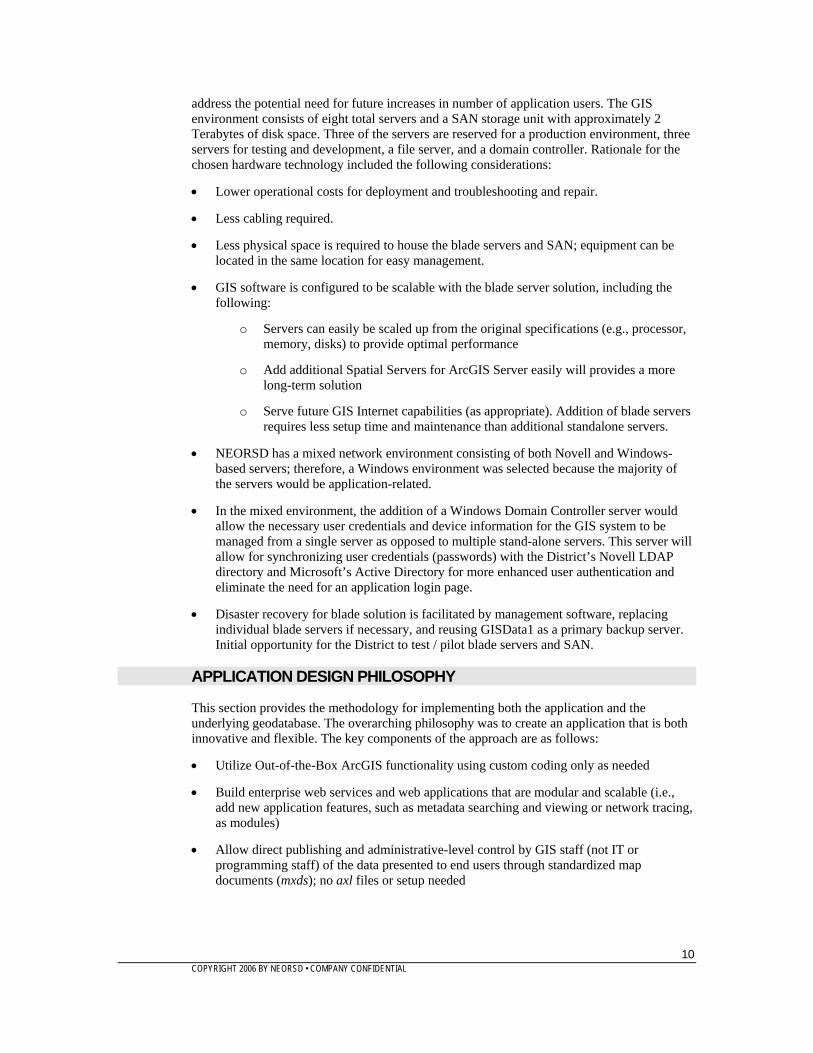
• Spatial Server: The spatial server processes the Images, Features, Queries, and Geocoding requests that are received from the web server. The spatial server processes the bulk of the geographic data to be displayed back to the end user. The specifications for the spatial server are shown in Table 2.
Table 2: Spatial Server Specifications
Memory/RAM CPU Speed Disk Space RAID
4GB 3.4 GHz x2 72 Raid 5
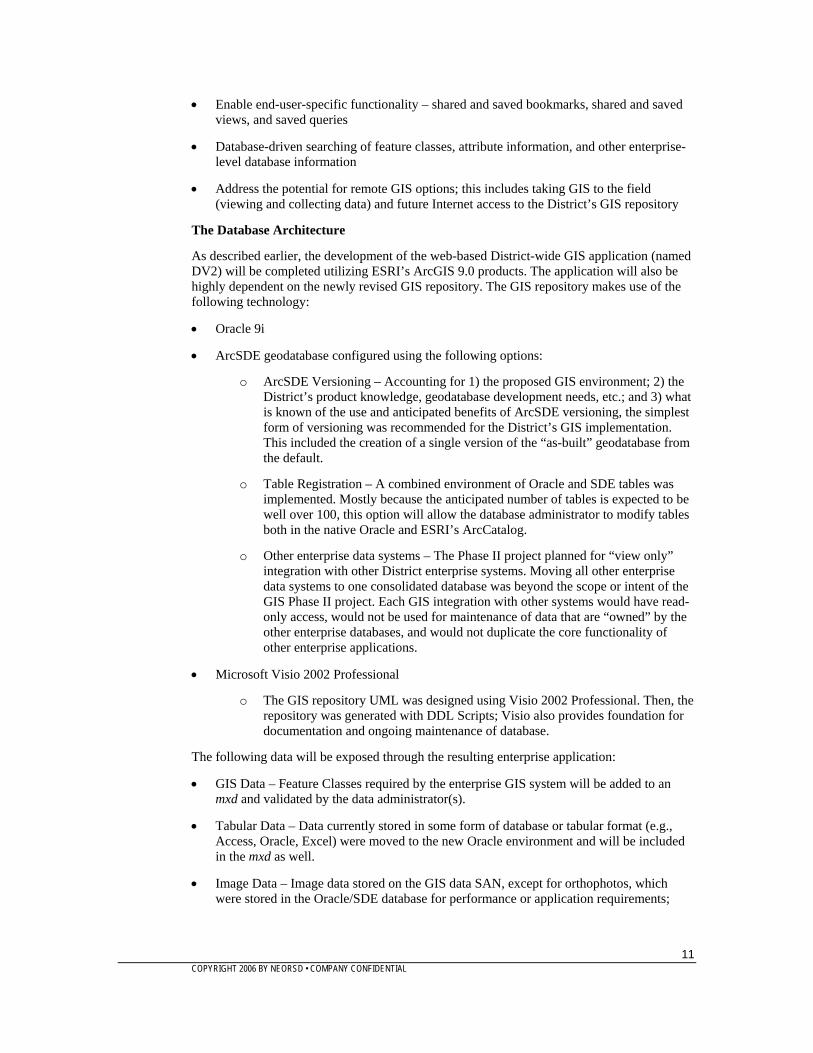
• Database Server: The database server will accommodate all the District-wide GIS data to be used by all GIS applications and users. This server will be running Oracle. The specifications for the database server are shown in Table 3.
Table 3: Database Server Specifications
Memory/RAM CPU Speed Disk Space RAID
4GB 3.4 GHz x2 144 Raid 1 and 5
Hardware for implementation included blade servers for the production and spatial servers and Storage Area Network solution for the data server (production environment only) to
10 COPYRIGHT 2006 BY NEORSD • COMPANY CONFIDENTIAL
address the potential need for future increases in number of application users. The GIS environment consists of eight total servers and a SAN storage unit with approximately 2 Terabytes of disk space. Three of the servers are reserved for a production environment, three servers for testing and development, a file server, and a domain controller. Rationale for the chosen hardware technology included the following considerations:
• Lower operational costs for deployment and troubleshooting and repair.
• Less cabling required.
• Less physical space is required to house the blade servers and SAN; equipment can be located in the same location for easy management.
• GIS software is configured to be scalable with the blade server solution, including the following:
o Servers can easily be scaled up from the original specifications (e.g., processor, memory, disks) to provide optimal performance
o Add additional Spatial Servers for ArcGIS Server easily will provides a more long-term solution
o Serve future GIS Internet capabilities (as appropriate). Addition of blade servers requires less setup time and maintenance than additional standalone servers.
• NEORSD has a mixed network environment consisting of both Novell and Windows-based servers; therefore, a Windows environment was selected because the majority of the servers would be application-related.
• In the mixed environment, the addition of a Windows Domain Controller server would allow the necessary user credentials and device information for the GIS system to be managed from a single server as opposed to multiple stand-alone servers. This server will allow for synchronizing user credentials (passwords) with the District’s Novell LDAP directory and Microsoft’s Active Directory for more enhanced user authentication and eliminate the need for an application login page.
• Disaster recovery for blade solution is facilitated by management software, replacing individual blade servers if necessary, and reusing GISData1 as a primary backup server. Initial opportunity for the District to test / pilot blade servers and SAN.
APPLICATION DESIGN PHILOSOPHY
This section provides the methodology for implementing both the application and the underlying geodatabase. The overarching philosophy was to create an application that is both innovative and flexible. The key components of the approach are as follows:
• Utilize Out-of-the-Box ArcGIS functionality using custom coding only as needed
• Build enterprise web services and web applications that are modular and scalable (i.e., add new application features, such as metadata searching and viewing or network tracing, as modules)
• Allow direct publishing and administrative-level control by GIS staff (not IT or programming staff) of the data presented to end users through standardized map documents (mxds); no axl files or setup needed
11 COPYRIGHT 2006 BY NEORSD • COMPANY CONFIDENTIAL
• Enable end-user-specific functionality – shared and saved bookmarks, shared and saved views, and saved queries
• Database-driven searching of feature classes, attribute information, and other enterprise-level database information
• Address the potential for remote GIS options; this includes taking GIS to the field (viewing and collecting data) and future Internet access to the District’s GIS repository
The Database Architecture
As described earlier, the development of the web-based District-wide GIS application (named DV2) will be completed utilizing ESRI’s ArcGIS 9.0 products. The application will also be highly dependent on the newly revised GIS repository. The GIS repository makes use of the following technology:
• Oracle 9i
• ArcSDE geodatabase configured using the following options:
o ArcSDE Versioning – Accounting for 1) the proposed GIS environment; 2) the District’s product knowledge, geodatabase development needs, etc.; and 3) what is known of the use and anticipated benefits of ArcSDE versioning, the simplest form of versioning was recommended for the District’s GIS implementation. This included the creation of a single version of the “as-built” geodatabase from the default.
o Table Registration – A combined environment of Oracle and SDE tables was implemented. Mostly because the anticipated number of tables is expected to be well over 100, this option will allow the database administrator to modify tables both in the native Oracle and ESRI’s ArcCatalog.
o Other enterprise data systems – The Phase II project planned for “view only” integration with other District enterprise systems. Moving all other enterprise data systems to one consolidated database was beyond the scope or intent of the GIS Phase II project. Each GIS integration with other systems would have read-only access, would not be used for maintenance of data that are “owned” by the other enterprise databases, and would not duplicate the core functionality of other enterprise applications.
• Microsoft Visio 2002 Professional
o The GIS repository UML was designed using Visio 2002 Professional. Then, the repository was generated with DDL Scripts; Visio also provides foundation for documentation and ongoing maintenance of database.
The following data will be exposed through the resulting enterprise application:
• GIS Data – Feature Classes required by the enterprise GIS system will be added to an mxd and validated by the data administrator(s).
• Tabular Data – Data currently stored in some form of database or tabular format (e.g., Access, Oracle, Excel) were moved to the new Oracle environment and will be included in the mxd as well.
• Image Data – Image data stored on the GIS data SAN, except for orthophotos, which were stored in the Oracle/SDE database for performance or application requirements;
12 COPYRIGHT 2006 BY NEORSD • COMPANY CONFIDENTIAL
other data such as videos, historical orthophotos, raster images, etc. are all available on the SAN.
The Application Architecture
The future vision of the District includes additional functionality to accommodate integration of data from other enterprise systems. As mentioned above, the .NET Framework was chosen to deliver an application that met all District requirements. Some additional specifics related to the application architecture are as follows:
• The DV2 application was written in C#, using Visual Studio 2003 as the development environment
• Frames and tabs were used in the interface to give flexibility and control to the end user over the size of different areas of the interface
• Crystal Reports Templates and XML Schema Definition (XSD) files were created for the reports that are generated from the application
• Cascading Style Sheets and XML Configuration files were used to enable control of the GUI and other settings on the fly
• Each functional area of the application is created as a separate web page or pages and loaded dynamically into the frames or tabs
• The Map and Toolbar controls were the only Web controls from the ArcGIS Server ADF for .NET used in the application
• Pooled server objects are included for exclusive use by each application session
DV2 APPLICATION
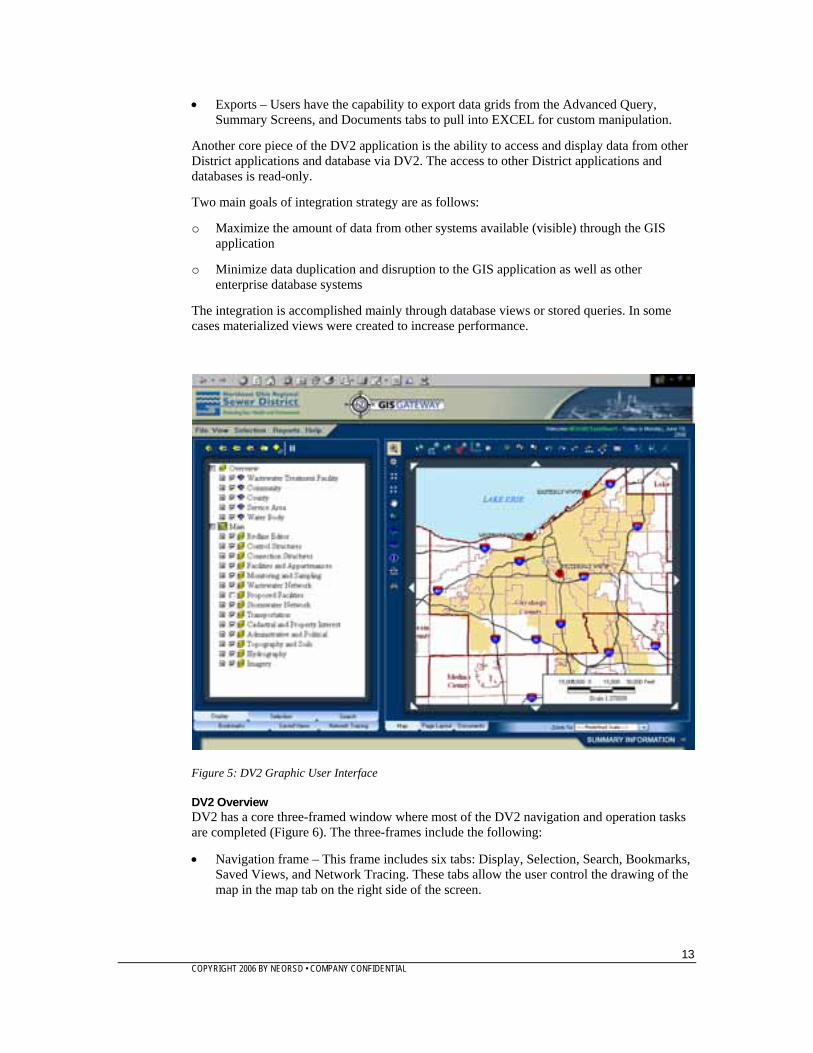
The DV2 Application was deployed as a web-based application using ArcGIS Server to access District datasets stored in an Oracle DBMS via ArcSDE and Microsoft® ActiveX® Data Objects (ADO). The underlying database centralizes GIS and other related asset and enterprise data. Functionally, DV2 will replace and enhance the legacy DIIMS Viewer and DIIMS Manager applications. Users will be able to navigate, analyze (query), report, and perform limited maintenance on District-owned datasets and maps in a WYSIWYG environment. The user experience for DV2 is comparable to the legacy DIIMS Viewer. Wherever possible, controls were used to keep the graphic user interface (GUI) simple, while exposing the maximum level of detail as described by the District. The resulting GUI, which is very similar to ArcMap, is presented in Figure 5.
A key measurement of a successful DV2 application is beyond just accessing data. The application also needs to allow the users to dynamically create reports by retrieving data from the GIS repository. The following reporting methods are available to users:
• Custom Maps – the Page Layout tab provides standard layouts and batch printing for standard grids, allowing users to create maps of areas of interest for them as well as standard District grid maps.
• Reports – Several avenues for pulling records from the collected data are available to users. Access to .pdfs, scans, and/or images is available through Documents tab, Detail Screens (More Info), and DV2 Main Menus.
13 COPYRIGHT 2006 BY NEORSD • COMPANY CONFIDENTIAL
• Exports – Users have the capability to export data grids from the Advanced Query, Summary Screens, and Documents tabs to pull into EXCEL for custom manipulation.
Another core piece of the DV2 application is the ability to access and display data from other District applications and database via DV2. The access to other District applications and databases is read-only.
Two main goals of integration strategy are as follows:
o Maximize the amount of data from other systems available (visible) through the GIS application
o Minimize data duplication and disruption to the GIS application as well as other enterprise database systems
The integration is accomplished mainly through database views or stored queries. In some cases materialized views were created to increase performance.
Figure 5: DV2 Graphic User Interface
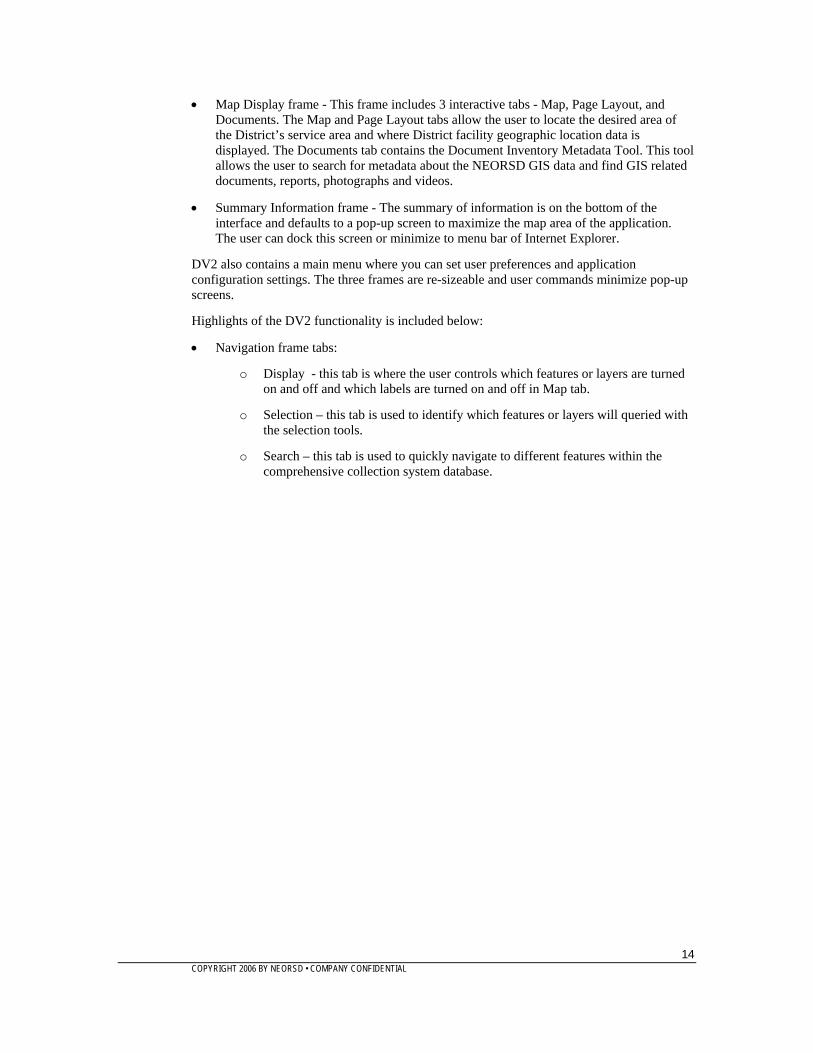
DV2 Overview DV2 has a core three-framed window where most of the DV2 navigation and operation tasks are completed (Figure 6). The three-frames include the following:
• Navigation frame – This frame includes six tabs: Display, Selection, Search, Bookmarks, Saved Views, and Network Tracing. These tabs allow the user control the drawing of the map in the map tab on the right side of the screen.
14 COPYRIGHT 2006 BY NEORSD • COMPANY CONFIDENTIAL
• Map Display frame - This frame includes 3 interactive tabs - Map, Page Layout, and Documents. The Map and Page Layout tabs allow the user to locate the desired area of the District’s service area and where District facility geographic location data is displayed. The Documents tab contains the Document Inventory Metadata Tool. This tool allows the user to search for metadata about the NEORSD GIS data and find GIS related documents, reports, photographs and videos.
• Summary Information frame - The summary of information is on the bottom of the interface and defaults to a pop-up screen to maximize the map area of the application. The user can dock this screen or minimize to menu bar of Internet Explorer.
DV2 also contains a main menu where you can set user preferences and application configuration settings. The three frames are re-sizeable and user commands minimize pop-up screens.
Highlights of the DV2 functionality is included below:
• Navigation frame tabs:
o Display - this tab is where the user controls which features or layers are turned on and off and which labels are turned on and off in Map tab.
o Selection – this tab is used to identify which features or layers will queried with the selection tools.
o Search – this tab is used to quickly navigate to different features within the comprehensive collection system database.
15 COPYRIGHT 2006 BY NEORSD • COMPANY CONFIDENTIAL
Figure 6: DV2 Navigation Tools
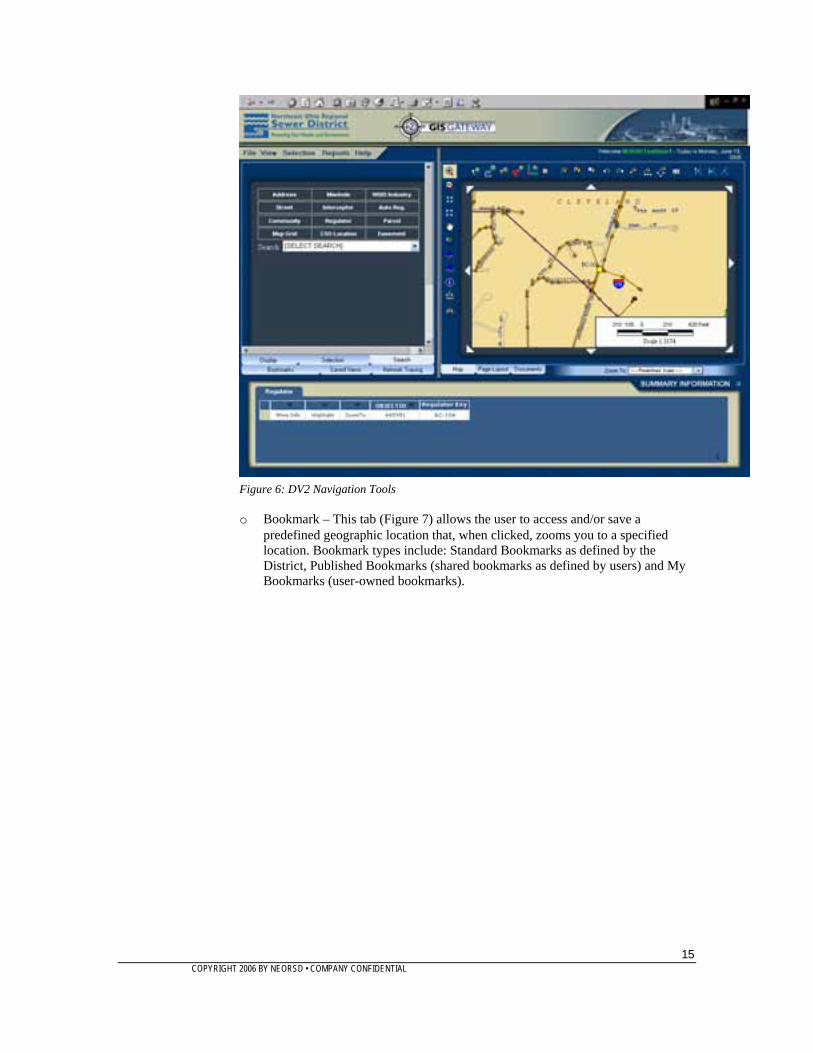
o Bookmark – This tab (Figure 7) allows the user to access and/or save a predefined geographic location that, when clicked, zooms you to a specified location. Bookmark types include: Standard Bookmarks as defined by the District, Published Bookmarks (shared bookmarks as defined by users) and My Bookmarks (user-owned bookmarks).
16 COPYRIGHT 2006 BY NEORSD • COMPANY CONFIDENTIAL
Figure 7: Bookmark Tab
o Saved Views – This tab allows users to bookmark locations as well as map views (layers and/or selection sets turned on or off). Saved Views types are similar to Bookmark types and include: District Standard Views, Published Views, and My Views.
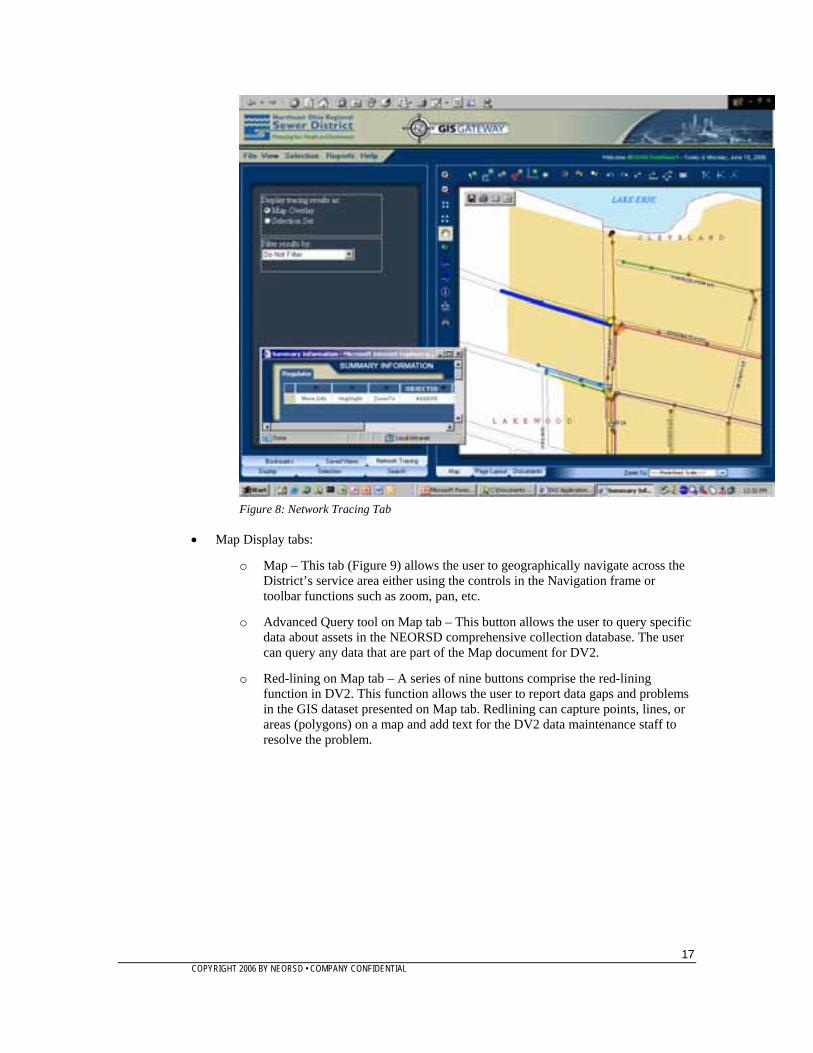
o Network Tracing – This tab (Figure 8) is used with the Network Tracing tools on the Map Display frame. This functionality allows the users to trace the network that runs either upstream or downstream from a point on the map or to find the map that runs between two points. The user can also select a filter for dry or wet weather traces and choose whether the result will be presented as a map overlay or selection set.
17 COPYRIGHT 2006 BY NEORSD • COMPANY CONFIDENTIAL
Figure 8: Network Tracing Tab
• Map Display tabs:
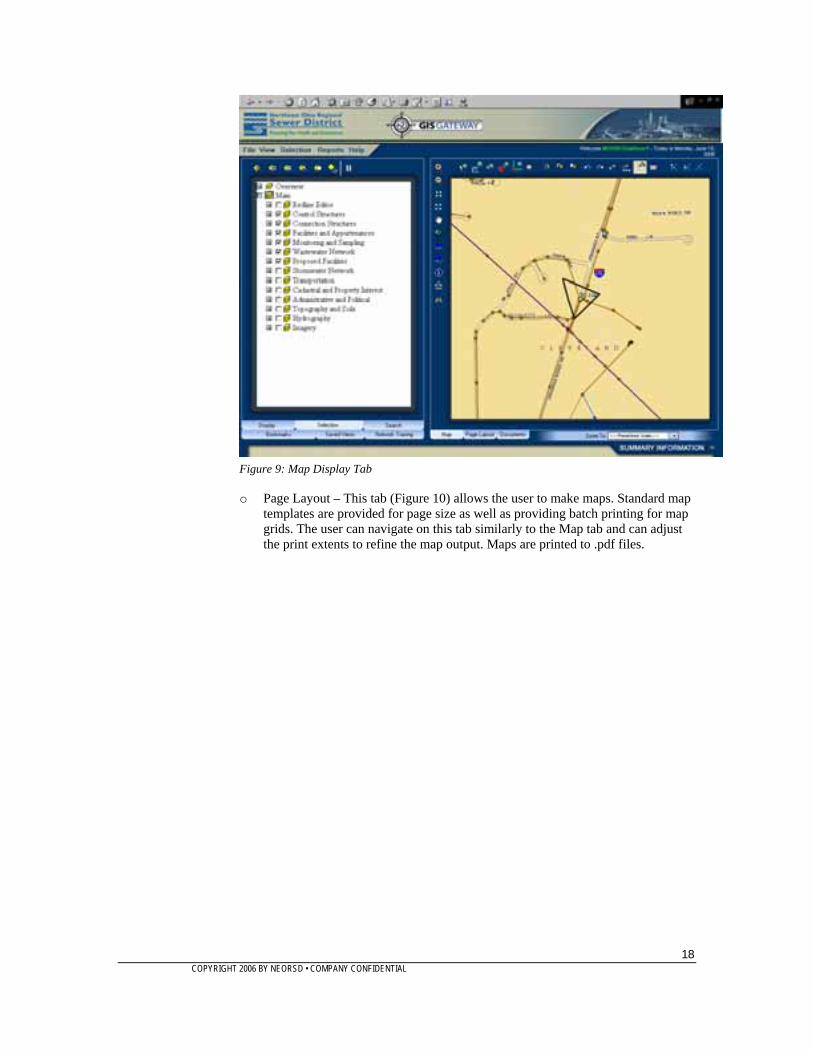
o Map – This tab (Figure 9) allows the user to geographically navigate across the District’s service area either using the controls in the Navigation frame or toolbar functions such as zoom, pan, etc.
o Advanced Query tool on Map tab – This button allows the user to query specific data about assets in the NEORSD comprehensive collection database. The user can query any data that are part of the Map document for DV2.
o Red-lining on Map tab – A series of nine buttons comprise the red-lining function in DV2. This function allows the user to report data gaps and problems in the GIS dataset presented on Map tab. Redlining can capture points, lines, or areas (polygons) on a map and add text for the DV2 data maintenance staff to resolve the problem.
18 COPYRIGHT 2006 BY NEORSD • COMPANY CONFIDENTIAL
Figure 9: Map Display Tab
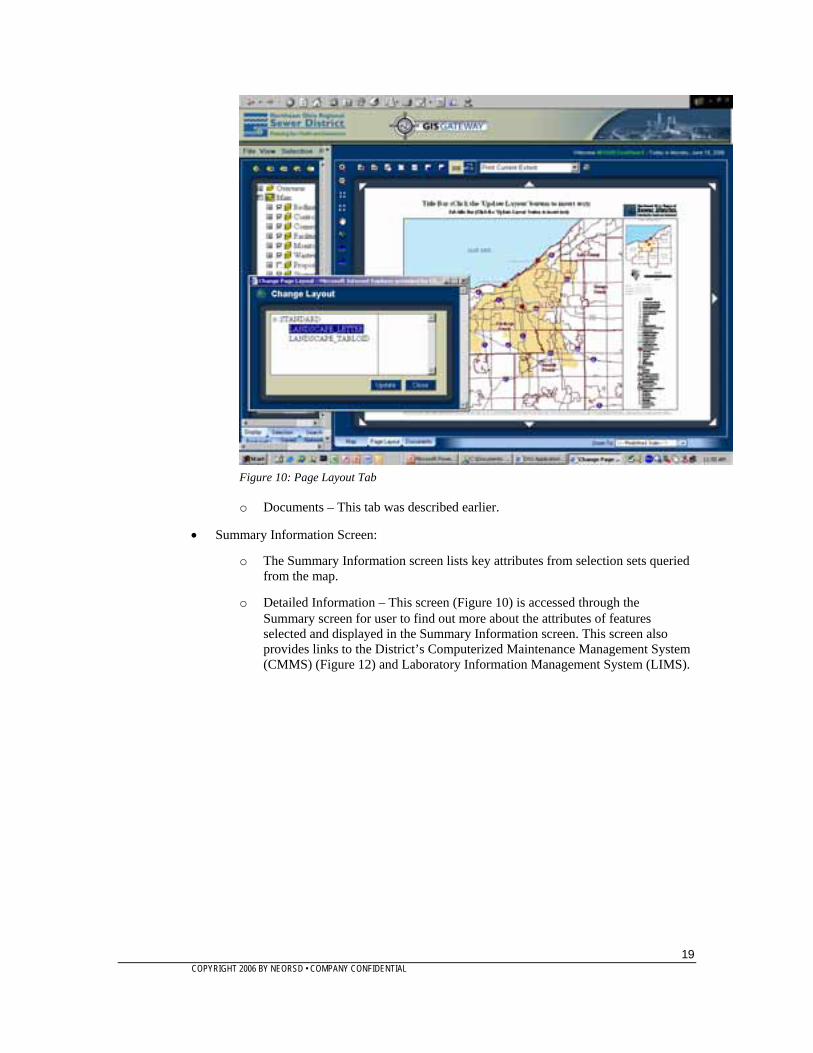
o Page Layout – This tab (Figure 10) allows the user to make maps. Standard map templates are provided for page size as well as providing batch printing for map grids. The user can navigate on this tab similarly to the Map tab and can adjust the print extents to refine the map output. Maps are printed to .pdf files.
19 COPYRIGHT 2006 BY NEORSD • COMPANY CONFIDENTIAL
Figure 10: Page Layout Tab
o Documents – This tab was described earlier.
• Summary Information Screen:
o The Summary Information screen lists key attributes from selection sets queried from the map.
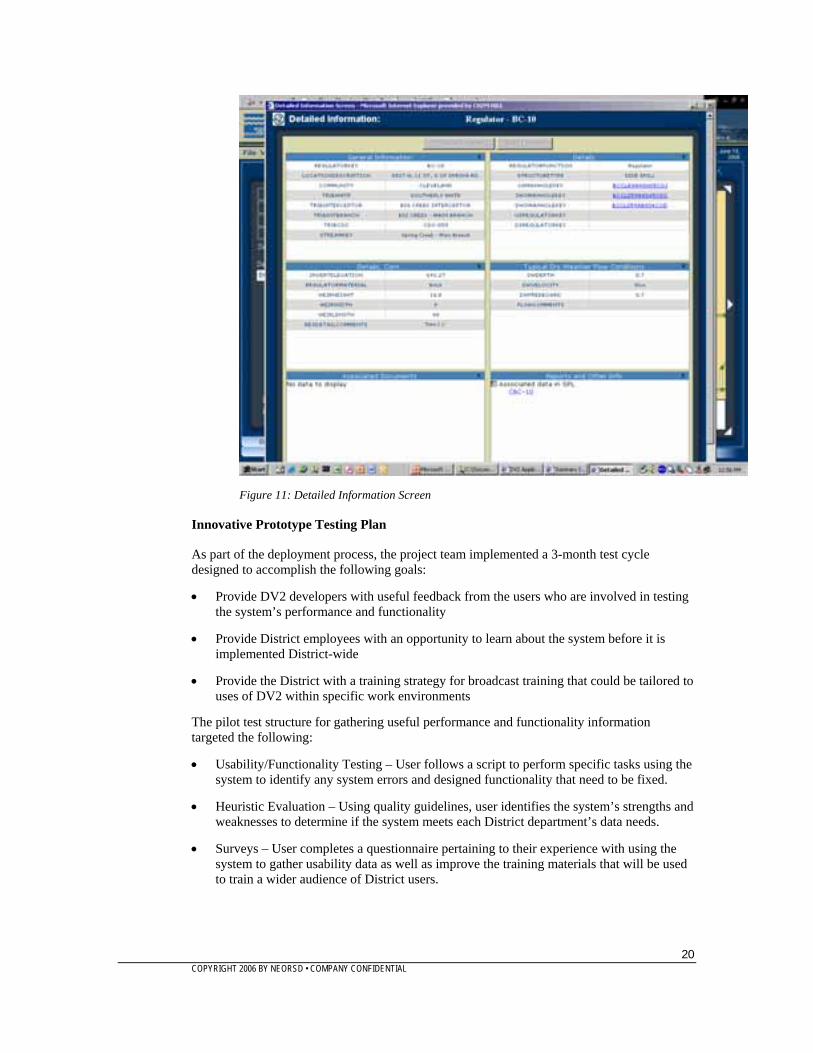
o Detailed Information – This screen (Figure 10) is accessed through the Summary screen for user to find out more about the attributes of features selected and displayed in the Summary Information screen. This screen also provides links to the District’s Computerized Maintenance Management System (CMMS) (Figure 12) and Laboratory Information Management System (LIMS).
20 COPYRIGHT 2006 BY NEORSD • COMPANY CONFIDENTIAL
Figure 11: Detailed Information Screen
Innovative Prototype Testing Plan
As part of the deployment process, the project team implemented a 3-month test cycle designed to accomplish the following goals:
• Provide DV2 developers with useful feedback from the users who are involved in testing the system’s performance and functionality
• Provide District employees with an opportunity to learn about the system before it is implemented District-wide
• Provide the District with a training strategy for broadcast training that could be tailored to uses of DV2 within specific work environments
The pilot test structure for gathering useful performance and functionality information targeted the following:
• Usability/Functionality Testing – User follows a script to perform specific tasks using the system to identify any system errors and designed functionality that need to be fixed.
• Heuristic Evaluation – Using quality guidelines, user identifies the system’s strengths and weaknesses to determine if the system meets each District department’s data needs.
• Surveys – User completes a questionnaire pertaining to their experience with using the system to gather usability data as well as improve the training materials that will be used to train a wider audience of District users.
21 COPYRIGHT 2006 BY NEORSD • COMPANY CONFIDENTIAL
Test observers were also used to capture the “user experience” with DV2. The test observers recorded the user’s reactions while he or she attempts to use DV2 to perform specific tasks provided during each test session. The type of information collected included the user’s verbal comments, questions, and the user’s interactions with the keyboard and mouse. Where appropriate, the user was asked to explain what he or she was attempting to do. Members of the Pilot Test Team represented five District departments and were encouraged to “think aloud” as they tested the application so that an understanding could be gained on how users might think about using the product.
The Pilot Test program resulted in identifying more than 250 technical, usability, or other improvements to the application. Some of the key issues identified were to improve application speed, improve the user interface, and eliminate the number of clicks for some functionality. Some of the items were addressed prior to the completion of the testing cycle so users could again test some of the improvements.
CONCLUSION
The GOOD, BAD, and UGLY
Overall, the implementation of the District’s enterprise DV2 application is successful. To qualify and quantifying the success, data, database, and application, highlights are described below.
Enterprise Data
• The Good – The District had an extreme amount of existing information. This enterprise effort required the District to make decisions on how handle both historical and day forward data. These discussions resulted in the District adopting a standard NASSCO database format for sewer pipe inspection data, standardizing data collection needs, and implementing standards for the data itself.
• The Bad and Ugly – The DV2 application has provided the District a powerful enterprise tool that allows users to access and query the information about the collection system. With this, many more data integrity issues and questions have arisen, thus increasing the need for data maintenance activities. The District will need to continue, and in some cases, increase the data cleanup efforts to improve the data quality so that quality issues will not discourage use of the new system.
Enterprise Geodatabase
• The Good – The resulting enterprise database has helped establish a common knowledge base of what data should be tracked in the enterprise GIS, what data are shared in other enterprise systems, and who the data owners really are. Also, the database is highly scalable and has established a process for integration with other systems.
• The Bad and Ugly – There are several database-level difficulties, including the following:
o The “Good” Geodatabase practices of using domains meant additional coding to extract the domain description values when displaying the attribute information and reports to the end users.
o The use of Feature Datasets in the Geodatabase has limited the over-the-web editing in DV2, except for redlining. The District does not want to allow editing of all Feature Classes within the Feature Datasets to all users with editing privileges.
22 COPYRIGHT 2006 BY NEORSD • COMPANY CONFIDENTIAL
ArcGIS Server/Application Development
DV2 has a powerful and extensible interface, but it was discovered that there is a balance to be struck between the amount of data included in the mxd and presented to the end user versus the performance of the application, without adding additional hardware.
• The Good - The benefits of the ArcGIS Server implementation include the following:
o The ability to customize the application for department-specific use with no programming involved
o The consistent foundation/platform of ArcGIS Server will allow for reduced development time on other custom applications within the District (Desktop or server-based)
o Undocumented capability to use the Maplex labeling engine
o Modular and configurable development meets the District’s overall needs and expectations for in-house support and future development
o The application modules can be added or removed to create an Internet application for public consumption, a mobile application that can be used by field staff, or a more streamlined (DV2 lite) version
• The Bad and Ugly – The majority of the challenges encountered during the development and implementation of the DV2 application revolved around networking and ArcGIS Server/DV2 performance. Some of the performance issues were traced back to the Map Document (mxd), and the project team was able to make modifications within the map document to increase performance. Other issues included the following:
o The District’s mixed networking environment. Implementation of a Windows domain within the Novell environment caused some issues with machine name resolution and end-user authentication when accessing the DV2 application.
o Undocumented capability to use Maplex labeling engine.
o Understanding the limits of the Map Document control for the application. Although the benefits led to implementing the technology over the web, the documentation and clarity of what the Map Document controls is difficult to grasp.
o Setting up a user-friendly legend is difficult without additional custom coding to control the legend.
o ArcGIS Server limitations for providing “Page Layout” functionality – The creation of multiple mxd files and server objects to support printing functionality.
People
• The Good
o The District has internally built its knowledge of the data it maintains, the application platform, and procedures to maintain and sustain the application and enterprise data for the long haul;
23 COPYRIGHT 2006 BY NEORSD • COMPANY CONFIDENTIAL
o Background and experience with technology. Had to leverage knowledge and capabilities of ESRI products; iterative approach for path forward – familiarity with products focused team on what’s an issues and what’s a “real” issue
o Use of a diverse group for Beta testing allowed modification of the application to determine entry level for users
o Using function-by-function review for training materials
• The Bad and Ugly
o 20- versus 200-person user base; difficult to test performance beyond the 20-person user level at this time
o Creating an application with an intuitive GUI for end users with such a diverse set of skills and understanding of technology and GIS
o Developer pool and resources are limited when compared to ArcIMS and other products
Summary
The District has built a powerful application that will leverage geographic information across the enterprise. District staff have already begun to use the application as part of their daily workflow. The enterprise DV2 application developed during the phase II project is the GIS “Gateway” to other District enterprise data. The processes and procedures for integration with the CMMS and LIMS data systems are positioning the District for possible integration with other enterprise systems and initiatives that will better support a common knowledge base.
The truly scalable, flexible structure for the critical components of the Districts GIS program will move the District towards supporting more current business functions and towards new business opportunities that ultimately will serve the community and increase the value of the District's organization and core business of improving water quality in the seven county northeastern Ohio area.
24 COPYRIGHT 2006 BY NEORSD • COMPANY CONFIDENTIAL
ACKNOWLEDGEMENTS
Application Development
Kevin Gonzago, CH2M HILL
Ryan Pulis, Brown and Caldwell
Brett Cummings, Ralph Tyler Companies
ArcMap Support
Monica Day, NEORSD
Michael Zapior, NEORSD
Database Development and Support
Michael Adornetto, CH2M HILL
Michael McGing, NEORSD
Project Team
Barbara Schmitz, CH2M HILL
David Cox, CH2M HILL
APPENDIXES
None
END NOTES
None
REFERENCES
1. Peters, Dave. System Design Strategies, An ESRI Technical Reference Documents. March 2006. http://www.esri.com/library/whitepapers/pdfs/sysdesig.pdf
25 COPYRIGHT 2006 BY NEORSD • COMPANY CONFIDENTIAL
AUTHOR INFORMATION
Jeffrey E. Duke, P.E.
Engineering Information & Technology Department
Northeast Ohio Regional Sewer District
3900 Euclid Avenue
Cleveland, Ohio 44115-2506
216.881.6600 x 6456
216.881.7703 Fax
Mark A. Kramer
Application Development Practice Manager
CH2M HILL
1001 Lakeside Ave, 990 North Point Tower
Cleveland, OH 44114
216.623.0402 x 22
216.623.1624 Fax
Tyler Huehmer
GIS and Database Specialist
CH2M HILL
2525 Airpark Drive
Redding, CA 96001
530.229.3285
530.339.3285