archives of biochemistry and biophysics - welcome | prum … · vibrational and electronic...
TRANSCRIPT

Archives of Biochemistry and Biophysics 539 (2013) 142–155
Contents lists available at ScienceDirect
Archives of Biochemistry and Biophysics
journal homepage: www.elsevier .com/ locate /yabbi
Vibrational and electronic spectroscopy of the retro-carotenoidrhodoxanthin in avian plumage, solid-state films, and solution
0003-9861/$ - see front matter � 2013 Elsevier Inc. All rights reserved.http://dx.doi.org/10.1016/j.abb.2013.09.009
⇑ Corresponding author.E-mail address: [email protected] (M.J. Tauber).
Christopher J. Berg a, Amy M. LaFountain b, Richard O. Prum c, Harry A. Frank b, Michael J. Tauber a,⇑a Department of Chemistry and Biochemistry, University of California at San Diego, 9500 Gilman Drive MC 0314, La Jolla, CA 92093, USAb Department of Chemistry, University of Connecticut, 55 North Eagleville Road, Storrs, CT 06269, USAc Department of Ecology and Evolutionary Biology, Peabody Museum of Natural History, Yale University, 21 Sachem Street, New Haven, CT 06511, USA
a r t i c l e i n f o
Article history:Available online 19 September 2013
Keywords:CarotenoidRetro-carotenoidRhodoxanthinResonance Raman spectroscopyAvian plumageBird feathers
a b s t r a c t
Rhodoxanthin is one of few retro-carotenoids in nature. These chromophores are defined by a pattern ofsingle and double bond alternation that is reversed relative to most carotenoids. Rhodoxanthin is foundin the plumage of several families of birds, including fruit doves (Ptilinopus, Columbidae) and the red cot-ingas (Phoenicircus, Cotingidae). The coloration associated with the rhodoxanthin-containing plumage ofthese fruit dove and cotinga species ranges from brilliant red to magenta or purple. In the present study,rhodoxanthin is characterized in situ by UV–Vis reflectance and resonance Raman spectroscopy to gaininsights into the mechanisms of color-tuning. The spectra are compared with those of the isolated pig-ment in solution and in thin solid films. Key vibrational signatures are identified for three isomers of rho-doxanthin, primarily in the fingerprint region. Electronic structure (DFT) calculations are employed todescribe the normal modes of vibration, and determine characteristic modes of retro-carotenoids. Theseresults are discussed in the context of various mechanisms that change the electronic absorption, includ-ing structural distortion of the chromophore or enhanced delocalization of p-electrons in the ground-state. From the spectroscopic evidence, we suggest that the shift in absorption is likely a consequenceof perturbations that primarily affect the excited state of the chromophore.
� 2013 Elsevier Inc. All rights reserved.
Introduction
Some of the most vibrant colors of feathers are derived fromcarotenoids. Colors such as yellow, red, or purple in feathers canbe partly attributed to unique carotenoids that are formed meta-bolically from a small number of dietary carotenoids. The absorp-tion characteristics of these molecules depend in large part uponthe length of double-bond conjugation, which can vary substan-tially. In one remarkable example, 16 different carotenoids wererecently identified in the plumage of cotingas, and their double-bond conjugation lengths were found to span all values from 9 to15, inclusive [1].
Apart from the expected effect that different carotenoids haveon coloration, there are also intriguing examples of feathers withthe same composition of chromophore(s), yet varied coloration.These cases have long been of interest [2–5] and there are severalpossible explanations for the variation. First, structural colorationcan influence or even dominate the overall color of a feather, inde-pendent of the pigments [6–8]. Second, other non-carotenoid pig-ments, particularly melanin, contribute to the coloration of some
bird feathers [9,10]. Third, the electronic absorption of carotenoidscan be tuned by polarizing influences (e.g. hydrogen bonding, ornearby charges) in the keratin environment. These types of specificinteractions between the carotenoids and surrounding protein areconsidered likely causes for substantial color-tuning in various car-otenoproteins, e.g. within crustaceans [11,12].
An additional mechanism of color-shifts is based upon elec-tronic interaction between neighboring carotenoid molecules.The mechanism has been considered a possibility for protein-bound astaxanthin in crustaceans [13,14] as well as ketocarote-noids within avian plumage [5]. Electronic interactions betweenchromophores are of exceptional interest, because several photo-physical processes that are not possible for a monomer becomeavailable for two or more coupled chromophores. In particular,the process of singlet exciton fission, whereby a singlet excitonforms two triplet excitons on neighboring chromophores, becomespossible for carotenoids [15–20]. Despite the evidence for singletfission in biological systems with carotenoids, no functional rolefor the mechanism has been determined. We recently proposedthat intermolecular singlet fission may provide a photoprotectiveadvantage for carotenoids, via the partitioning of absorbedphotonic energy over two chromophores, rather than a singlechromophore [18]. Evidence supporting this idea has yet to befound; nevertheless, our interest in the topic has led us to

Fig. 2. Chemical structures of (A) (6E,60E)-rhodoxanthin, (B) (6Z,60E)-rhodoxanthin,(C) (6Z,60Z)-rhodoxanthin, (D) (3R,30R)-zeaxanthin, (E) b-carotene, and (F) (6E,60E)-isocarotene.
C.J. Berg et al. / Archives of Biochemistry and Biophysics 539 (2013) 142–155 143
investigate natural systems where electronic interaction betweencarotenoids could play a role in their excited-state dynamics.
The five birds that are the focus of the present study (Fig. 1) allhave the carotenoid rhodoxanthin as the principle chromophore inportions of their plumage. The pattern of single/double bond alter-nation of rhodoxanthin, a retro-carotenoid, is reversed from thatfound for the vast majority of carotenoids, such as zeaxanthin orb-carotene (Fig. 2). Despite the shared chromophore, the colorationof the feathers probed here varies from crimson red to burgundy,pink, or purple. We considered exciton coupling to be among thepossible reasons for the variation. Four of the birds are fruit dovesin the genus Ptilinopus within the Columbidae family: Wompoo Pi-geon (Ptilinopus magnificus), Beautiful Fruit Dove (Ptilinopus pul-chellus), Yellow-bibbed Fruit Dove (Ptilinopus solomonensis), andJambu Fruit Dove (Ptilinopus jambu). The presence of rhodoxanthinin this genus has been known for decades [2]. One cotinga species,Phoenicircus carnifex (Cotingidae), was also included in our studybecause the bright red plumage of this bird is also known to con-tain rhodoxanthin [1,21]. Our principle aim was to gain an under-standing of rhodoxanthin in situ, both from vibrational andelectronic spectroscopy. The combined approach of in situ reso-nance Raman and electronic spectroscopy has been a powerfulone for identifying various causes of coloration in carotenoid/pro-tein systems, including structural distortion, p-electron delocaliza-tion, and exciton coupling [4,5,11,22,23].
At the outset, the lack of resonance Raman spectra of retro-carotenoids in the literature hampered our exploration of the chro-mophores in the feathers. One reason for the dearth of spectra isthat retro-carotenoids are far less common in nature than carote-noids having the normal pattern of single/double bond alternation[24]. Rhodoxanthin occurs in various plants [25–34], lichens [35],and animals including birds [1–3,21,36–39], and fish [40]. Onecan infer that vibrational resonance Raman spectra of rhodoxan-thin may have been acquired previously [41–43]. However, the
Fig. 1. Photos of bird species with rhodoxanthin in portions of their plumage: (A)Black-necked Cotinga, Phoenicircus nigricollis (close relative of Ph. carnifex), (B)Jambu fruit dove, Ptilinopus jambu, (C) Beautiful fruit dove, Ptilinopus pulchellus (D)Wompoo pigeon, Ptilinopus magnificus (E) Yellow-bibbed fruit-dove, Ptilinopussolomonensis. Photo credits: (A) Wim de Groot; (B and C) T. Friedel/VIREO; (D) W.Peckover/VIREO; (E) Mehd Halaouate.
prior reports did not make a clear connection between spectra(or peak positions) and the carotenoid. Infrared spectra or bandpositions of retro-carotenoids have been reported as part of syn-thetic efforts [44–47]. However, the analyses of IR spectra of ret-ro-carotenoids are sparse and tend to focus on a small portion ofthe spectrum [48–50]. To our knowledge, there is only a singleexample in the literature where a full IR spectrum of rhodoxanthinis illustrated [51].
Given the lack of any comprehensive report or analysis of vibra-tional spectra of retro-carotenoids, we have explored the reso-nance Raman spectroscopy of rhodoxanthin within feathers(in situ), and as an isolated chromophore, in solution and in thin so-lid films. The spectra of three isomers of rhodoxanthin are com-pared with (3R,30R)-zeaxanthin, which has a well-understoodvibrational spectrum [52]. Assignments of the bands of the retro-carotenoid were aided by the results from density functional the-ory (DFT1) calculations. The vibrational spectra of the carotenoidsin the feathers, as well as their absorption spectra, are evaluatedwith the aim of assessing various mechanisms for the different col-ors of these feathers.
Methods and materials
Pigment extraction and analysis
The feathers of this study were obtained from the University ofKansas Natural History Museum (Lawrence, KS, USA) and the YalePeabody Museum of Natural History (Yale University, New Haven,CT, USA). The five feather types are described as follows: (1) red
1 Abbreviations used: DFT, density functional theory; MTBE, methyl-tert-butyl ether.

144 C.J. Berg et al. / Archives of Biochemistry and Biophysics 539 (2013) 142–155
body feathers of a male Phoenicircus carnifex (KU 88704, collectedMarch 1997); (2) burgundy breast feathers of a male Ptilinopusmagnificus septentrionalis (YPM 74482, collected October 1960);(3) crimson breast feathers of a male Ptilinopus pulchellus pulchellus(YPM 73164, collected 1955); (4) purple breast feathers of a malePtilinopus solomonensis speciosus (YPM 41523, collected November1937); and (5) pink breast feathers of a male Ptilinopus jambu (YPM62797, collected October 1952).
The carotenoids were extracted from the feathers via proce-dures described previously [53,54]. The pigmented sections ofcleaned feathers were trimmed, and placed in a glass test tube un-der acidified pyridine at 90 �C for several hours. The Pt. solomonen-sis, Pt. magnificus and Pt. pulchellus feathers were each treated inthe acidified pyridine for 3 h, after which the Pt. solomonensisfeathers were white, whereas the feathers of Pt. magnificus andPt. pulchellus were dark brown. The treatment of Pt. jambu featherswas stopped after 2 h, and they were white at that time. Ph. carni-fex feathers were pale orange post-extraction. Next, methyl-tert-butyl ether (MTBE)/water (3:1 v/v) was added to the test tubesto partition carotenoid pigments from water-soluble lipids. Theaqueous phase was removed by pipette, and the MTBE phase waswashed twice with additional water. The carotenoid pigments inthe MTBE layer were collected and dried, and later analyzed byHPLC and absorption spectroscopy as described previously [1,53].Briefly, the HPLC protocol utilized a multi-solvent delivery system(Waters 600), a 5 lm silica column (Phenomenex Luna,250 � 4.6 mm) and a photodiode array detector (Waters 2996).The mobile phase consisted of a linear gradient that began with10% acetone in hexane and reached 20% acetone in hexane over40 min. The flow rate was 1.0 mL/min.
Pigments eluting from the HPLC were collected and their absorp-tion spectra recorded in the mobile phase. The pigments from Pt.magnificus were sufficiently concentrated for mass spectrometry,which was performed in the APCI mode (Applied Biosystems API2000). The samples were dissolved in methanol and introduced intothe mass spectrometer by direct infusion at a rate of 20 lL/min.
Preparation of rhodoxanthin isomers
Synthetic rhodoxanthin was dissolved in acidified pyridine andheated to a temperature of 90 �C. The sample was analyzed withnormal-phase HPLC as described above, and three bands were col-lected with elution times that were separated by �1 min intervals.The absorption spectra of the isolated pigments in the mobilephase (not shown) were consistent with their identification as(6E,60E)-, (6E,60Z)-, and (6Z,60Z)-isomers of rhodoxanthin (see be-low) [29].
Preparation of thin-films
Three thin-films of (6E,60E)-, (6E,60Z)-, and (6Z,60Z)-rhodoxan-thin were prepared from the synthetic rhodoxanthin treated withacidified pyridine. The dried rhodoxanthin was dissolved in ace-tone and added drop-wise to a glass microscope slide, with suffi-cient time between each drop to allow the solvent to evaporate.
Optical microscopy
Images of the five rhodoxanthin-containing feathers were ac-quired with a CCD camera (AVT Stingray F-201B/C) attached toan upright microscope (Zeiss Axio Imager). The feathers wereepi-illuminated with light from a quartz tungsten halogen lamp.The objective was a NA = 0.25 plan semi-apochromat (Zeiss Epi-plan-Neofluar 10�). A diffuse white reflector (Spectralon) was usedto perform a color balance calibration. After the calibration, eachfeather was placed on the Spectralon block for acquiring an image.
Spectroscopy
Absorption spectroscopyUV–Vis absorption spectra of the chromophores in solution
were measured with a scanning spectrometer (Shimadzu UV-3600). Solutions were held in a quartz cuvette with 1 cm pathlength, unless otherwise noted.
Diffuse reflectance and forward-scattering spectroscopyBack-scattered and forward scattered light from the five plum-
age samples were recorded in configurations that are the same asthose normally employed for measurement of diffuse reflectanceand diffuse transmittance spectra (See Fig. S1). A UV–Vis spectro-photometer with integrating sphere attachment (Shimadzu UV-3600, ISR-3100) was employed. Prior to measurements of the sam-ples, a baseline correction was performed with a barium sulfatewhite-light reflector positioned at an appropriate port of the inte-grating sphere. Each feather was positioned in the beam, and cov-ered by a mask with 3.0 mm open diameter so that the mostcolorful region was probed. We note that the feathers have �50%open area between barbs or barbules, thus considerable lightpasses through the feathers unimpeded and is also not capturedby the integrating sphere. Also, forward scattering and glancingreflection from the barbs are expected to dominate in the (nomi-nally) transmittance measurement.
Macro-Raman spectroscopy514.5 and 568.2 nm excitation beams were generated by an ar-
gon/krypton ion laser (Laser Innovations, Innova-70C). The beamwas directed through a narrow-band interference filter (Semrock)that matched the wavelength of the laser line.
For the solid-state samples (feathers, thin films), Raman scat-tered light was collected in a 180-degree back-scattering geome-try. A 75 mm cylindrical lens was used to focus the laser beamalong one axis. At the sample, the beam had an elliptical profile,with axis lengths 2.50 � 0.040 mm. The low excitation power(<1.5 mW and �3.3 mW) kept the irradiance at the sample to2 W/cm2 (for feathers) and 4 W/cm2 (for thin films) or less. Forsolution-phase experiments, the sample was held in a 10 � 4 mmseptum-capped quartz cuvette with clear bottom window. Therhodoxanthin solution was purged and agitated during the Ramancollection with a slow stream of nitrogen gas. The rhodoxanthinisomers were each dissolved in dimethyl sulfoxide (DMSO). DMSOwas selected in part because the solvent has a relatively high boil-ing point (189 �C), therefore purging resulted in little evaporationduring the course of the experiment. A 75 mm cylindrical lenswas used to focus the beam along one axis, and the dimensionsat the sample were approximately 1.25 � 0.040 mm. The excita-tion power was approximately 4.5 mW, and the irradiance was�10 W/cm2. Raman scattered light was collected at 90� relativeto the propagation of the excitation beam.
The detection setup for the macro-Raman experiments em-ployed an F/1.2 collection lens (Canon FD, focal length 85 mm).An F/4 achromatic lens was used to focus the scattered light ontothe entrance slit of a 320 mm focal length spectrograph (Horiba Jo-bin–Yvon, iHr-320). The scattered light also passed through apolarization scrambler and an edge filter (cutoff either 514.5 or568.2 nm; Semrock, Razoredge) prior to the entrance slit. The spec-trograph was equipped with 1200 and 2400 groove/mm holo-graphic gratings, and an open-electrode CCD detector (HoribaJobin–Yvon Synapse).
Micro-Raman spectroscopyThe same laser source, filters, and spectrograph were utilized as
for the macro-Raman experiments. The beam was directed into aZeiss Axio-Imager upright microscope modified with beamsplitters
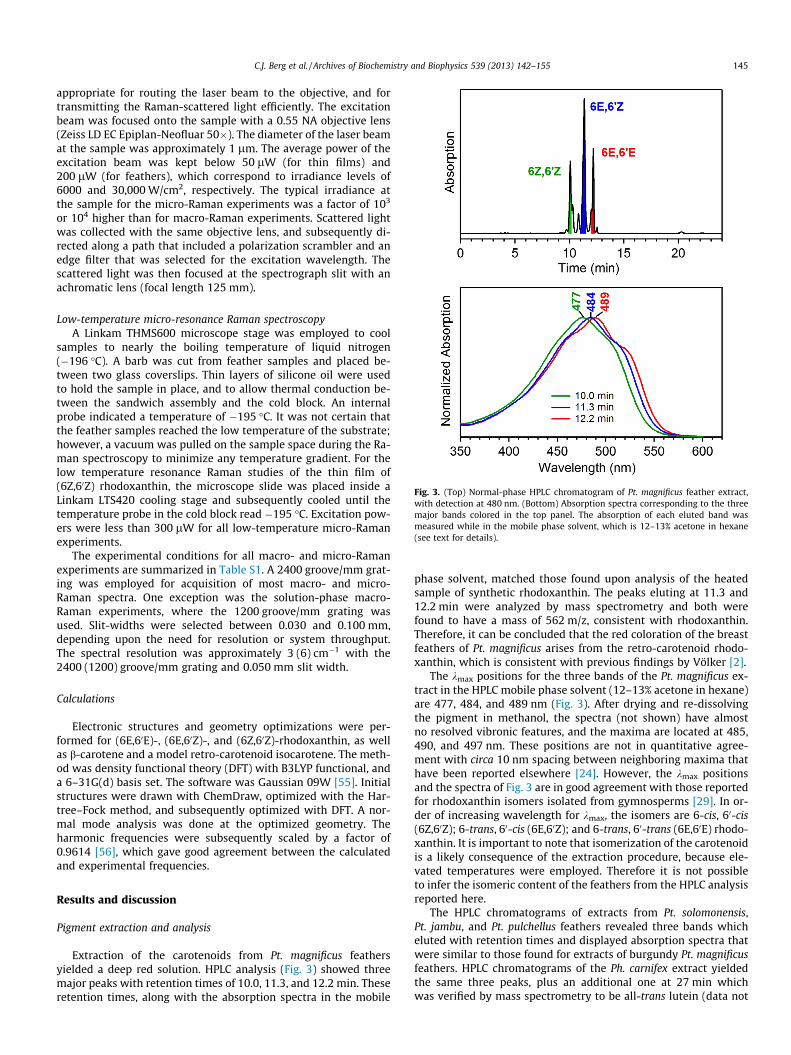
Fig. 3. (Top) Normal-phase HPLC chromatogram of Pt. magnificus feather extract,with detection at 480 nm. (Bottom) Absorption spectra corresponding to the threemajor bands colored in the top panel. The absorption of each eluted band wasmeasured while in the mobile phase solvent, which is 12–13% acetone in hexane(see text for details).
C.J. Berg et al. / Archives of Biochemistry and Biophysics 539 (2013) 142–155 145
appropriate for routing the laser beam to the objective, and fortransmitting the Raman-scattered light efficiently. The excitationbeam was focused onto the sample with a 0.55 NA objective lens(Zeiss LD EC Epiplan-Neofluar 50�). The diameter of the laser beamat the sample was approximately 1 lm. The average power of theexcitation beam was kept below 50 lW (for thin films) and200 lW (for feathers), which correspond to irradiance levels of6000 and 30,000 W/cm2, respectively. The typical irradiance atthe sample for the micro-Raman experiments was a factor of 103
or 104 higher than for macro-Raman experiments. Scattered lightwas collected with the same objective lens, and subsequently di-rected along a path that included a polarization scrambler and anedge filter that was selected for the excitation wavelength. Thescattered light was then focused at the spectrograph slit with anachromatic lens (focal length 125 mm).
Low-temperature micro-resonance Raman spectroscopyA Linkam THMS600 microscope stage was employed to cool
samples to nearly the boiling temperature of liquid nitrogen(�196 �C). A barb was cut from feather samples and placed be-tween two glass coverslips. Thin layers of silicone oil were usedto hold the sample in place, and to allow thermal conduction be-tween the sandwich assembly and the cold block. An internalprobe indicated a temperature of �195 �C. It was not certain thatthe feather samples reached the low temperature of the substrate;however, a vacuum was pulled on the sample space during the Ra-man spectroscopy to minimize any temperature gradient. For thelow temperature resonance Raman studies of the thin film of(6Z,60Z) rhodoxanthin, the microscope slide was placed inside aLinkam LTS420 cooling stage and subsequently cooled until thetemperature probe in the cold block read �195 �C. Excitation pow-ers were less than 300 lW for all low-temperature micro-Ramanexperiments.
The experimental conditions for all macro- and micro-Ramanexperiments are summarized in Table S1. A 2400 groove/mm grat-ing was employed for acquisition of most macro- and micro-Raman spectra. One exception was the solution-phase macro-Raman experiments, where the 1200 groove/mm grating wasused. Slit-widths were selected between 0.030 and 0.100 mm,depending upon the need for resolution or system throughput.The spectral resolution was approximately 3 (6) cm�1 with the2400 (1200) groove/mm grating and 0.050 mm slit width.
Calculations
Electronic structures and geometry optimizations were per-formed for (6E,60E)-, (6E,60Z)-, and (6Z,60Z)-rhodoxanthin, as wellas b-carotene and a model retro-carotenoid isocarotene. The meth-od was density functional theory (DFT) with B3LYP functional, anda 6–31G(d) basis set. The software was Gaussian 09W [55]. Initialstructures were drawn with ChemDraw, optimized with the Har-tree–Fock method, and subsequently optimized with DFT. A nor-mal mode analysis was done at the optimized geometry. Theharmonic frequencies were subsequently scaled by a factor of0.9614 [56], which gave good agreement between the calculatedand experimental frequencies.
Results and discussion
Pigment extraction and analysis
Extraction of the carotenoids from Pt. magnificus feathersyielded a deep red solution. HPLC analysis (Fig. 3) showed threemajor peaks with retention times of 10.0, 11.3, and 12.2 min. Theseretention times, along with the absorption spectra in the mobile
phase solvent, matched those found upon analysis of the heatedsample of synthetic rhodoxanthin. The peaks eluting at 11.3 and12.2 min were analyzed by mass spectrometry and both werefound to have a mass of 562 m/z, consistent with rhodoxanthin.Therefore, it can be concluded that the red coloration of the breastfeathers of Pt. magnificus arises from the retro-carotenoid rhodo-xanthin, which is consistent with previous findings by Völker [2].
The kmax positions for the three bands of the Pt. magnificus ex-tract in the HPLC mobile phase solvent (12–13% acetone in hexane)are 477, 484, and 489 nm (Fig. 3). After drying and re-dissolvingthe pigment in methanol, the spectra (not shown) have almostno resolved vibronic features, and the maxima are located at 485,490, and 497 nm. These positions are not in quantitative agree-ment with circa 10 nm spacing between neighboring maxima thathave been reported elsewhere [24]. However, the kmax positionsand the spectra of Fig. 3 are in good agreement with those reportedfor rhodoxanthin isomers isolated from gymnosperms [29]. In or-der of increasing wavelength for kmax, the isomers are 6-cis, 60-cis(6Z,60Z); 6-trans, 60-cis (6E,60Z); and 6-trans, 60-trans (6E,60E) rhodo-xanthin. It is important to note that isomerization of the carotenoidis a likely consequence of the extraction procedure, because ele-vated temperatures were employed. Therefore it is not possibleto infer the isomeric content of the feathers from the HPLC analysisreported here.
The HPLC chromatograms of extracts from Pt. solomonensis,Pt. jambu, and Pt. pulchellus feathers revealed three bands whicheluted with retention times and displayed absorption spectra thatwere similar to those found for extracts of burgundy Pt. magnificusfeathers. HPLC chromatograms of the Ph. carnifex extract yieldedthe same three peaks, plus an additional one at 27 min whichwas verified by mass spectrometry to be all-trans lutein (data not

146 C.J. Berg et al. / Archives of Biochemistry and Biophysics 539 (2013) 142–155
shown). However, the amount of lutein is estimated to be less than5% of total carotenoid in the feather [1]. Therefore, we concludethat the dominant pigment in all of these feathers is rhodoxanthin.
While the above focuses on the extracted chromophores, ourprocedure did not extract a brown pigment that remained inthe feathers of Pt. magnificus and Pt. pulchellus. Based on prior re-ports, it is likely that the brown color is caused by eumelanin[9,10]. Additionally, Ph. carnifex feathers remained a pale orangeafter the extraction, which may indicate the presence of pheomel-anin [9,10]. The purple feathers of Pt. solomonensis and the pinkfeathers of Pt. jambu both appeared colorless following extraction,and we conclude that the melanin content in these feathers isinsignificant.
Optical microscopy
The ranking of the feather barbs from the strongest red tostrongest purple coloration in the optical images (Fig. 4) werePt. magnificus = Ph. carnifex, Pt. pulchellus, Pt. jambu, Pt. solomonen-sis. The regions of the feather barbs with the strongest red or pur-ple coloration were probed by Raman spectroscopy. The probedregions were generally the barbules, except in the case of Ph. car-nifex, which has significant concentration of carotenoids in thecentral shafts (rami) of its barbs. The images of Fig. 4 also showseveral characteristics that were not investigated in depth. First,the rami of Pt. pulchellus and Pt. magnificus are dark; thus melaninmay be more concentrated in this region than in the barbules.Second, several feather types have some iridescence. The effectgives the barbs of Pt. magnificus a green or purple hue. Some bar-bules of Pt. solomonensis and of Pt. pulchellus appear to be weaklyiridescent as well. The iridescent regions of the feathers in thepresent study were avoided in the Raman measurements. Third,the breast feathers of several birds exhibit a color gradient fromthe base of the ramus to the tip. For Pt. magnificus, the color var-ies from iridescent green to red; for Pt. pulchellus, yellow to brightcrimson. Only the reddest regions of these feathers were probedin the present study.
Fig. 4. Images of feather barbs by optical microscopy. Circles indicate theapproximate areas probed with resonance Raman spectroscopy. These regionswere selected for the deepest coloration and least iridescence. (A) Pt. pulchellus; theinset shows a section of feather barb where a gradient of yellow-to-red color isapparent. (B) Pt. magnificus; the inset illustrates that some barbules (not probed)have very little rhodoxanthin, and these were also relatively iridescent. (C) Pt.solomonensis (D) Pt. jambu; approximately half of each barbule is pigmented withrhodoxanthin (E) Ph. carnifex; the ramus of this barb was probed because its color isdarker than that of the barbule.
Scattering spectroscopy
The diffuse back-scattering (or diffuse back-reflectance) spectraof the five rhodoxanthin-containing feathers were acquired (Fig. 5).These spectra were compared with diffuse transmittance measure-ments, which are expected to be dominated by light from glancingreflections and scattering off the various structures of the barbs,rather than transmission through the material structure itself.The same portion of each feather was probed in both measure-ments. The diffuse back-reflectance and forward-scattering spectrafor each sample are similar, although there are differences such asthe amount of attenuation in the UV region relative to the visible. Itis not fully understood what causes the differences between mea-surement types.
Absorption by rhodoxanthin causes the diffuse reflectance todrop in the range 400–650 nm. The onset of visible absorption onthe low-energy (long-wavelength) side is commonly characterizedby a reflectance midpoint, k(Rmid). The k(Rmid) value is the wave-length position where the reflectance is midway between a maxi-mum value Rmax (typically located in the red), and a minimumvalue Rmin (in the present case, Rmin can be found in the region450–600 nm):
kðRmidÞ ¼ kððRmin þ RmaxÞ=2Þ ð1Þ
We note that the reflectance spectra of Pt. magnificus and Pt.pulchellus feathers increase monotonically in the red region. Thischaracteristic prevents an accurate selection of Rmax in Eq. (1),and the reflectance value at 725 nm is used for these feathers.The k(Rmid) values for both back- and forward- scattering measure-ments are listed in Table 1.
The characterization of feather pigments by a single parameterk(Rmid) has general shortcomings, aside from the specific ambiguity
Fig. 5. (Top) Diffuse back-scattering (or diffuse back-reflectance) spectra. (Bottom)Diffuse forward-scattering spectra of the five feathers.

Table 1Summary of wavelengths that characterize the diffuse back- and forward-scattering spectra, and derived absorption spectra (see text). k(Rmid) is the wavelength for which thereflectance is midway between a maximum and minimum value. k(Ahm)avg is the average of the two half-maxima positions k(Ahm1) and k(Ahm2) of the derived absorption spectra.
Feather Back-scattering/back-reflectance Forward-scatteringa
k(Rmid) (nm) k(Ahm1) (nm) k(Ahm2) (nm) k(Ahm)avg (nm) k(Rmid) (nm) k(Ahm1) (nm) k(Ahm2) (nm) k(Ahm)avg (nm)
Pt. magnificus 584 411 571 491 577 430 565 498Ph. carnifex 583 452 567 510 580 436 575 506Pt. pulchellus 611 446 602 524 602 453 590 522Pt. jambu 594 464 587 526 593 457 592 526Pt. solomonensis 614 474 608 541 615 465 607 536
a Forward scattering includes light that is scattered and reflected off of the edges of barbs/barbules, and likely only a small proportion is transmitted through the materialstructure of the feathers.
Fig. 6. (Inset) Attenuation coefficient spectra of the five feathers, determined fromdiffuse forward-scattering data (lower panel of Fig. 5) and Eq. (2) of the text. Thespectra are offset for clarity, and no baselines are removed. (Main panel) Derivedabsorption spectra of rhodoxanthin in the visible region, isolated from theattenuation coefficient spectra of the inset by subtracting a baseline. Spectra arenormalized and offset for clarity. The wavelength corresponding to the average ofthe two half-maxima of each spectrum, k(Ahm)avg, is indicated.
C.J. Berg et al. / Archives of Biochemistry and Biophysics 539 (2013) 142–155 147
noted above for Pt. magnificus and Pt. pulchellus. For example, it isexpected that as pigments reach concentration levels where thereflection approaches low values (i.e., saturation), k(Rmid) valuescan shift significantly as a function of concentration. The saturationeffect has been discussed previously [57,58]. An improved methodof characterizing a pigment within a feather would be the acquisi-tion of its full absorption spectrum in situ. We attempted to derivean absorption spectrum of each feather by using the Kubelka–Munk approach with a pile of plates model [59]. The approachwas unsuccessful, likely because of significant open spaces in thefeathers, edge effects, as well as the opacity of the barbs and bar-bules. Instead, an attenuation coefficient profile was calculatedfrom the negative log of diffuse reflectance or forward-scatteringspectra using:
AðkÞ ¼ � logðRðkÞÞ ð2Þ
where A(k) is the attenuation coefficient, and R(k) is the fraction ofdiffuse scattering or reflectance (Fig. 6 and Table 1).
The attenuation coefficient profiles (inset of Fig. 6) show a clearband in the spectral region 400–650 nm that is attributed toabsorption by rhodoxanthin. The absorption maximum at�280 nm can be attributed to the keratin matrix that is the mainconstituent of the feathers [60]. Carotenoids also absorb in theUV region, as a result of an S0 ? Sn transition. However, the molarabsorption coefficient of the �280 nm band for a carotenoid is typ-ically �5-fold smaller than its primary visible (S0 ? S2) absorptionband. Therefore, the absorption at 280 nm caused by the caroten-oid is expected to be much smaller than that of keratin. Melaninmay also contribute to the absorption of Pt. magnificus and Pt. pul-chellus. The absorption of melanin is strongest in the UV region,and the cross section declines monotonically as wavelength in-creases [61].
The calculated attenuation profiles yield some insights into therelative concentrations of carotenoid within the feathers. We as-sume equal concentration of keratin and amplitude of the280 nm band for all five feathers. A comparison of the relativeamplitude of the carotenoid and keratin absorption bands acrossthe five spectra suggests that Pt. pulchellus, Ph. carnifex, and Pt.magnificus have 2–3 times greater concentration of carotenoidsthan Pt. solomonensis or Pt. jambu. This result is consistent withthe muted appearance of Pt. solomonensis and Pt. jambu.
The carotenoid absorption in the visible region is isolated fromthe overall attenuation spectrum by fitting a polynomial to spectralregions where that absorption is expected to be at or near baseline.The function is subtracted to remove contributions from scatteringor absorption by keratin and melanin. The baseline-subtractedabsorption spectra are shown in Fig. 6. The wavelength positionof the primary visible absorption is quantified by the average ofthe wavelength positions for the two half-maxima, k(Ahm1) andk(Ahm2) that characterize this band, or k(Ahm)avg. Specifically,
kðAhmÞavg ¼kðAhm1Þ þ kðAhm2Þ
2
� �ð3Þ
The relevant wavelength positions for each feather are indi-cated in Table 1. The k(Ahm)avg values increase in the order Pt. mag-nificus, Ph. carnifex, Pt. pulchellus, Pt. jambu, and Pt. solomonensis.The difference between the k(Ahm)avg values determined fromback-scattering and forward scattering spectra are less than 4 nmon average, with a maximum 7 nm difference for Pt. magnificus.The relatively small differences found between each pair of mea-surements provide some assurance that the absorption is assessedreliably with the integrating sphere.
Relationship between UV–Vis absorption and perceived color
The positions of average half-absorption, k(Ahm)avg, span a38 nm range (�1400 cm�1). The feathers with the strongest redappearance (Ph. carnifex and Pt. magnificus) have their average

Fig. 7. (Upper panel) Experimental resonance Raman spectra of (6E, 60E)-rhodo-xanthin in DMSO (568.2 nm excitation) and (3R,30R)-zeaxanthin in ethanol(488.0 nm excitation). (Middle panel) Calculated Raman spectrum of (6E,60E)-rhodoxanthin. (Lower panel) Calculated Raman spectrum of (3R,30R)-zeaxanthin.The frequency axes of the calculated spectra are scaled by 0.9614. The 800–980 cm�1 region is magnified by 50�. The intensities of the calculated spectra donot take into account any mechanism for resonance enhancement, and aretherefore not expected to match the intensities of experimental resonance Ramanspectra.
148 C.J. Berg et al. / Archives of Biochemistry and Biophysics 539 (2013) 142–155
half-absorption located closest to 500 nm. The relatively pure redreflection may occur because absorption by rhodoxanthin in thesefeathers covers both blue and green spectral regions. In contrast,the feathers with strongest purple or magenta coloration havetheir average half-absorption centered between 520 and 540 nm.It is well known that when pure green light is subtracted fromthe white-light sum of red, green and blue, the result is the (non-spectral) color magenta (blue and red). Thus, it is possible thatthe distinct purple/magenta appearance of Pt. pulchellus, Pt. jambu,and Pt. solomonensis is caused by substantial blue reflection (weak-er blue absorption), which in turn results from the relatively bath-ochromic absorption by rhodoxanthin in these feathers.
It is tempting to attribute the main cause of color variation tothe tuning of the absorption band of rhodoxanthin, but other fac-tors could significantly influence the perceived color. First, eumel-anin in the plumage of Pt. magnificus and Pt. pulchellus, orpheomelanin in Ph. carnifex, could contribute to the absorption(low reflectance) in the violet-blue spectral region �380–500 nm(Fig. 5). The effect would be similar to a blue-shifted absorptionby rhodoxanthin. In contrast, the relatively strong violet–bluereflectance of the feathers without melanin, Pt. solomonensis andPt. jambu, could contribute to the magenta color of these species.We were unable to assess the relative importance of melanin, ver-sus shifts in the absorption band of rhodoxanthin, to the overallred/purple coloration. Second, as noted above, iridescence wasapparent in the microscope images of Pt. magnificus, P. puchellus,and Pt. solomonensis feathers, and could influence their color. Pre-vious studies have shown that while the green coloration of Ptilin-opus plumage has a structural basis, the distinct red or purplecoloration does not [62,63]. The prior work suggests that irides-cence does not play an important role in the feathers of our study.Third, the effect of pigment concentration on the plumage colora-tion was not explored in the present work, although it is clear thatthere is substantial variation in concentration within the feathers.
Resonance Raman spectrum of (6E,60E)-rhodoxanthin versus (3R,30R)-zeaxanthin
Experimental Resonance Raman spectra of (6E,60E)-rhodoxan-thin in DMSO, (3R,30R)-zeaxanthin in ethanol, and calculated Ra-man spectra are compared in Fig. 7. The comparison of thisparticular pair of xanthophylls by experiment and computation isuseful because the resonance Raman spectrum of zeaxanthin [52]is nearly identical to that of b-carotene, and is therefore well-understood from extensive prior studies [64–67]. The spectra ofrhodoxanthin and zeaxanthin are generally similar. The strongestband of zeaxanthin is denoted m1, with maximum near1525 cm�1. The band results from symmetric linear combinationsof several C@C stretches. The m1 band of (6E,60E)-rhodoxanthin isdownshifted �5 cm�1 relative to that of zeaxanthin. Normal modeanalysis reveals that the m1 mode of retro-carotenoids is unusuallyextended along the polyene chain, with contributions from all dou-ble bonds between C8@C9 and C80@C90, inclusive (Table 2,Table S2A and B). By contrast, the m1 mode of b-carotene and zea-xanthin is much more localized, with contributions primarily fromthe double bonds C13@C14 and C130@C140.
The fingerprint region (1100–1400 cm�1) of the experimentalspectra is dominated by the m2 band, with nearly coincident max-ima located at 1157–1158 cm�1 for both molecules. Despite thematching frequencies, the carbons with the most motion are differ-ent: in the case of zeaxanthin, most of the C–C motion is localized toC10–C11, C100–C110, C14–C15, and C140–C150. For (6E,60E)-rhodo-xanthin the motion is largely with C11–C12, C110–C120 and C15–C150 (Table 2, Table S2A and B). There are a greater number of res-onantly enhanced bands in the fingerprint region for rhodoxanthin,including ones centered at �1135 cm�1 (shoulder), 1283 cm�1, and
1342 cm�1. The computed normal modes indicate that their motionconsists largely of C–C single bond stretches, in combination withC–H rocking (in-plane bending) motions. The calculation of(6E,60E)-rhodoxanthin also predicts bands at or near the frequen-cies of experimental ones, e.g. with bands centered at 1143, 1281,and 1335 cm�1. It should be noted that the calculations do not takeinto account any mechanisms for resonance enhancement, there-fore a match with experimental intensities is not expected. Anotherstrong band in the experimental spectra is m3, which results largelyfrom methyl rocking motions. The 1009 cm�1 frequency for rhodo-xanthin is slightly upshifted relative to 1004 cm�1 for zeaxanthin.The DFT calculations predict that (6E,60E)-rhodoxanthin has onemain methyl rocking mode, and therefore a simpler band patternin the m3 region, than zeaxanthin. Next, the bands assigned tohydrogen-out-of-plane (HOOP) wagging modes are found in the re-gion 800–1000 cm�1. These bands gain intensity upon loss of pla-narity of the carotenoid [68,69]. One band near 965 cm�1 appearsto be centered at nearly the same frequency for both molecules.However another band at �887 cm�1 for rhodoxanthin is signifi-cantly shifted relative to the nearest band of zeaxanthin, which iscentered at 872 cm�1. The differences in HOOP wag frequencies

Table 2Calculated frequencies of select normal modes of (3R,30R)-zeaxanthin and three isomers of rhodoxanthin.
Frequency of mode (cm�1) Assignmenta
Zea (6E,60E)-rhodo (6E,60Z)-rhodo (6Z,60Z)-rhodo
1520 Symmetric C@C stretches, primarily C13@C141511 1513 1516 Symmetric C@C stretches, extending from C8@C9 to C80@C90
1390, 1401 1387, 1395 1386, 1395 Methyl bends + CH rock1335b 1334 1334 C13–C14 stretch + CH rocks1323b 1324 – CH rocks (including ring C4H) for E configuration– 1300 1300 CH rocks (including ring C4H) for Z configuration1281b 1281 1281 CH rocks C14H, C15H1270b 1270 1270 CH rocks C11H, C14H, C15H
1269b CH rocks C10H, C11H CH(ring)1215 C14–C15 stretch + CH rocks
1209 1209 1209 C15–C150 stretch + CH rocks– 1194 1194 (w) C7–C8 stretch + ring methylene rock + CH rocks
1187 C8–C9 stretches + CH rocks1181 1182, 1181, 1177 1178 C7–C8, C11–C12 stretches + CH rocks
1161 C10–C11, C14–C15 stretches + CH rocks1158 1152, 1157, 1160 1155 C11–C12, C15–C150 stretches + CH rocks1143b 1141 1138 (w) C15–C150 stretch + CH rocks
995 995 996, 997 998 Methyl rocks971 C7H, C8H, C10H, C11H, C12H HOOP wags960 C7H, C8H, C10H, C11H, C12H HOOP wags
966 967 (w) 968 (w) C10H, C11H, C12H HOOP wags899b 902, 897 902 C7H, C8H and other HOOP wags; ring torsion
889b C10H, C11H, C12H HOOP wags884 885, 883 885 C7H, C8H HOOP wags876 877 – C7H and ring CH HOOP wags
838 838 832 833 (w) C8H, C10H, C11H, C14H, and C15H HOOP wags
Abbreviations: Zea = (3R,30R)-zeaxanthin; rhodo = rhodoxanthin; HOOP = Hydrogen-out-of-plane; (w) = weak.a A majority of the modes in this list include motion of the unlisted primed carbons on the opposite side of the molecule, e.g. a C13–C14 stretch also implies C130–C140.b These modes appear to be the most prominent ones that distinguish the experimental Raman spectra of (6E,60E)-rhodoxanthin and zeaxanthin.
C.J. Berg et al. / Archives of Biochemistry and Biophysics 539 (2013) 142–155 149
between the two molecules may be caused by CH out-of-plane mo-tion at the conjugated C4/C40 carbons of rhodoxanthin. Descriptionsand frequencies of the calculated modes that distinguish (3R,30R)-zeaxanthin and (6E,60E)-rhodoxanthin are highlighted in Table 2(see also Table S2A and B).
Differences between computed spectra of (6E,60E)-isocarotene, and b-carotene
Additional DFT/normal mode calculations of the retro-caroten-oid, (6E,60E)-isocarotene, and b-carotene (Fig. S2, Tables S3 andS4) suggest that the differences described above between rhodo-xanthin and zeaxanthin are not limited to these xanthophylls. Inbrief, the main ethylenic vibration of isocarotene is calculated tobe much more delocalized, and the frequency is downshifted8 cm�1, relative to that of b-carotene. The calculations also showconsiderably more activity in the fingerprint region of isocarotene,including a band at 1143 cm�1, as well as pairs of bands at 1270/1280 cm�1 and 1325/1333 cm�1. These results match those of(6E,60E)-rhodoxanthin. The calculated spectrum of isocarotene re-veals the simplified structure in the m3 region, as seen for rhodo-xanthin. In the HOOP region, the comparison of isocarotene withb-carotene reflects the same differences as for rhodoxanthin vs.zeaxanthin. The comparisons of the two carotenes and the twoxanthophylls indicate that the retro-configuration, rather thanany other factor, cause the primary spectral differences in the res-onance Raman spectra.
Resonance Raman spectra of rhodoxanthin isomers in solution
The spectra of the three rhodoxanthin isomers in DMSO with568.2 nm excitation are compared in Fig. 8. Absorption spectra(Fig. S3) were taken before and after exposure to the laser, and noshifts in the absorption maxima for any of the 3 isomers were ob-served. This result indicates that the majority of each rhodoxanthin
isomer remains in its starting configuration. The position of the m1
band maximum is slightly lower in frequency for the trans (E) con-figuration, relative to the cis (Z): (6Z,60Z), 1526 cm�1; (6E,60Z),1524 cm�1; and (6E,60E), 1520 cm�1. The maximum for m2 is withinthe range 1158–1160 cm�1 for all isomers, and the variation is nei-ther significant nor systematic among the isomers. In terms ofintensities of various bands relative to the m1 ethylenic, those cen-tered at 1010 (m3), 1195, 1285, and 1343 cm�1 increase for the ser-ies (6Z,60Z) ? (6E,60E). For the same series, intensities decrease forbands centered at 825, 1205, 1312, and 1392 cm�1. Peak positionsof the m1, m2, and m3 modes for the three isomers in DMSO are listedin Table S5.
The results from normal mode calculations of the three rhodo-xanthin isomers are shown in Fig. 9 and Table 2. The DFT calcu-lations agree with experimentally observed downshift of the m1
frequency for the trans (E) configuration, with calculated m1 fre-quencies of 1516, 1513, and 1511 cm�1 for the 6Z60Z, 6E60Z, and6E60E isomers, respectively. The downshift correlates with en-hanced planarity of the polyene backbone including the conju-gated rings of rhodoxanthin. With the E-configuration, thedimethyl substituents attached to C1/C10 straddle the polyenehydrogen attached to the C8/C80 position, and thus keep the con-jugated double bonds of the rings relatively coplanar with thepolyene backbone. Conversely, for the Z-configuration there issteric hindrance between the single methyl group attached toC5/C50, and the hydrogen at the C8/C80 position. Therefore onewould expect a greater dihedral angle between the C@C doublebond of each ring and polyene backbone in the Z-configurationversus the E-configuration. The DFT-optimized structure (Table 3)of the (6Z,60Z) isomer has dihedral angles with magnitude 160.1�;the (6E,60Z) isomer has dihedral angles 160.1� (Z) and 176.8� (E);and the (6E,60E) isomer has dihedral angles of 179.9�. Comparedto normal carotenoids, the ring end groups of retro-carotenoidsare generally more planar relative to the polyene backbone[70,71].

Fig. 8. Raman spectra of rhodoxanthin isomers (6Z,60Z), (6E,60Z), and (6E,60E) inDMSO, and in solid state (thin film). The 800–950 cm�1 region is magnified 5�, andthe spectra are normalized for equal amplitude of the m1 band. Raman spectra ofrhodoxanthin in DMSO are acquired with excitation wavelength 568.2 nm. Theasterisks (�) denote regions where the solvent subtraction was imperfect. The thinfilm consists of (6E,60E)-rhodoxanthin deposited on a glass substrate. The excitationwavelength was 514.5 nm, and the spectrum was acquired at relatively highirradiance levels with a Raman microscope. The spectra of thin films of the otherisomers were nearly identical to the one shown here (see text and SupportingInformation).
Fig. 9. Computed Raman spectra of three rhodoxanthin isomers, from DFT andnormal-mode calculations. The frequency axis is scaled by 0.9614. The 800–980 cm�1 region is magnified by 50�. The intensities of the calculated spectra donot take into account any mechanism for resonance enhancement, and aretherefore not expected to match the intensities of experimental resonance Ramanspectra.
150 C.J. Berg et al. / Archives of Biochemistry and Biophysics 539 (2013) 142–155
Some of the patterns in the intensities of the DFT calculations ofthe three isomers reflect trends seen in experiment. The agreementis perhaps fortuitous, given that the calculations only reflect themagnitude of the polarizability derivatives with respect to normalcoordinate, whereas intensities in the experimental spectra de-pend upon mechanisms for resonance enhancement that are notconsidered in the calculations. For example, the intensities of adoublet in the 1385–1400 cm�1 region of the calculations can becompared with the experimental 1392 cm�1 band (strongest forthe 6Z,60Z isomer). The 1334/1335 cm�1 band in the calculations,which consists primarily of C13–C14 (C130–C140) stretches withCH rocks, may reflect the experimental trend for the 1343 cm�1
band (strongest for 6E,60E). A pair of bands in the calculations thatare centered at 1181 cm�1 and 1194 cm�1 (strongest for 6E,60E and6Z,60Z, respectively) can be compared with the relative intensitiesof the experimental bands at 1195 and 1205 cm�1 (strongest for6E,60E and 6Z,60Z, respectively).
A number of other bands appear in the experimental spectra ofrhodoxanthin, but are not in complete agreement with the off-reso-nance calculations. First and foremost, a band at �1135 cm�1 is aclear shoulder in the experimental spectra of all three rhodoxanthinisomers in solution, but is not apparent in the experimental spec-trum of all-trans zeaxanthin. The calculations of rhodoxanthin reveala normal mode with frequency in the range of 1137–1143 cm�1,depending upon the isomer. The motion consists mainly of a local-ized C15–C150 stretch and accompanying CH rocks. Given that C15and C150 are joined by a single bond for the retro-carotenoids, butdouble for the normal carotenoids, it is reasonable that a normal
mode consisting primarily of this stretch could be a unique signatureof the retro-carotenoids. The calculations suggest that the intensityof this band strongly depends on the isomer, in contradiction withthe experimental spectra. A likely reason is that the polarizabilitychanges computed in the off-resonance calculations include signifi-cant C–H rocking motion on the rings, and the net magnitude of thepolarizability derivative (Raman intensity) is therefore sensitive tothe isomeric form. In contrast, the resonance enhancement of theexperimental band is likely derived from an A-term mechanism,i.e. Franck–Condon displacement along the C15–C150 stretchingcoordinate. Thus the actual mechanism for resonance enhancementis not expected to depend significantly upon local motions of therings, or upon the configuration around the distant C6@C7 bond.
Second, the calculations predict a splitting of modes in the m2 re-gion, corresponding to vibrations of both C–C single bond stretch-ing and C–H rocking motions. A single strong band at 1155 cm�1
(6Z,60Z) correlates with at least two bands centered at 1143 and1158 cm�1 (for 6E,60E). There is a hint of this trend in the experi-ment, because the m2 band in solution-phase spectra appears tobe narrowest for (6Z,60Z) and shows significant broadening forthe (6E,60E) isomer. Furthermore, the splitting seen in the calcula-tions is similar to the splitting noted in the spectra of rhodoxanthinembedded in feathers (see below). However, the experimentalsolution-phase spectra of the reference samples were not suffi-ciently resolved to discern individual bands, thus it is not clearhow the splitting or relative intensities of these two bands dependsupon the isomer.

Table 3Results from DFT calculations.
Molecule Ea (cm�1) Dihedral angleb (degrees) Bond length (Å) m1 (cm�1)
D D0 C6–C7 C60–C70
(6E,60E)-rhodoxanthin +341 �179.9 �179.9 1.374 1.374 1511(6E,60Z)-rhodoxanthin +177 176.8 160.1 1.374 1.370 1513(6Z,60Z)-rhodoxanthin 0 �160.1 160.1 1.370 1.370 1516b-carotene – �48.9 48.9 1.475 1.475 1520(6E,60E)-isocarotene – �168.0 168.0 1.372 1.372 1518
a Optimized energy relative to (6Z,60Z)-rhodoxanthin.b The dihedral angles are C5@C6–C7@C8 for b-carotene, and C4@C5–C6@C7 for the retro-carotenoids.
C.J. Berg et al. / Archives of Biochemistry and Biophysics 539 (2013) 142–155 151
Third, a small band at �825 cm�1 in the solution phase spectraof rhodoxanthin gains intensity in the series (6E,60E) ? (6Z,60Z). Alikely assignment for this band is HOOP wags of hydrogens C8H,C11H (and C80H, C110H) which move in opposition to wags C10H,C12H (and C100H, C120H). The calculations predict the frequencyof this normal mode to be in the range 832–838 cm�1, dependingupon isomer, which is very close to the experimental value. Addi-tionally, it is reasonable that a HOOP motion that is close to theC6@C7 or C60@C70 ends of the chromophore should be sensitiveto the configuration at each end. However, the DFT results predictthat the relative intensity of this mode is opposite the trend ob-served in the solution-phase spectra. Once again, the mismatch be-tween the experimental and calculated relative intensities of thisband likely results from the fact that resonance enhancement isnot factored into the calculations and therefore they are generallynot good predictors of the experimental intensities. To enhancesupport for the assignment it would be useful to include mecha-nisms for resonance enhancement in the calculations.
Resonance Raman spectra of rhodoxanthin thin films
A resonance Raman spectrum of a thin film of rhodoxanthin ac-quired with 514.5 nm excitation (high irradiance) is shown inFig. 8. This film was formed from the (6E, 60E) isomer, howeverfilms of the other isomers have band positions that are nearlyindistinguishable from each other (see Figs. S4 and S5; Table S6).Specifically, the peak positions of all three isomers are m1 (1520–1521 cm�1), m2 (1158 cm�1), and m3 (1007 cm�1). In addition, theHOOP region (800–980 cm�1) shows no differentiation among iso-mers. Interestingly, the HOOP doublets at 955 and 978 cm�1 aremore resolved than in the solution-phase spectra. As shown inFig. S5, low temperature spectroscopy of the (6Z,60Z) isomer exhib-ited the same spectra as at room temperature, although the m2 andm1 frequencies shifted 2–3 cm�1 higher. All bands were more re-solved at low-temperature than room temperature, especially inthe low-frequency and HOOP regions.
Given the nearly identical bands for the three thin films, it ispossible that the same photoproduct or distribution of photoprod-ucts forms by isomerization, regardless of the starting configura-tion. In support of this proposal, we note that a photolysisexperiment of rhodoxanthin in solution reveals significant isomer-ization of a sample of pure (6E,60Z)-rhodoxanthin into both (6E,60E)and (6Z,60Z) isomers upon irradiance with 488.0 nm laser excita-tion over the course of an hour (see Supporting Information andFig. S6). More generally, a prior report showed that isomerizationaround the C6@C7 bond can take place at room temperature, par-ticularly for the (6E,60E) isomer, even in the absence of photolysis[72]. Despite what appears to be facile change in configuration, itshould be noted that during the micro-Raman measurements ofthin films, there were no qualitative changes in either the peakpositions or in bandwidths at any point during the 15 min integra-tion period. Therefore, if isomerization takes place upon excitationof the films, the equilibrium must be reached within the exposure
time of the first acquisition (30 s). Furthermore, even when theirradiance was decreased to levels at least 1000-fold lower thanemployed to acquire the spectrum of Fig. 8, there was no observa-ble difference between the m1 peak positions of the (6E,6’E) and(6E,6’Z) isomers. It is possible that the quantum yield for isomeri-zation is sufficiently high so that either level of irradiance causesthe rhodoxanthin at the laser focus to reach isomeric equilibriumwithin the exposure time of the first acquisition. A less probableexplanation is that the vibrational signatures of the three isomers,although significantly different in solution, are indistinguishable inthin films. There was insufficient rhodoxanthin to perform a HPLC/UV–Vis analysis following photolysis of the thin films of purerhodoxanthin.
Raman spectra were previously reported for three red carote-noids extracted from Potamogeton crispus [42]. The three carote-noids were identified in a separate study as isomers ofrhodoxanthin [43]. The authors indicated a peak maximum forthe main ethylenic band at 1527 cm�1 for all three red carotenoids;this value is nearly identical to 1526 cm�1 that we find for the(6Z,60Z) isomer. Furthermore, a weak band centered at �1395–1398 cm�1 was reported in the spectra of the unknown isomersof the red carotenoids [42]. This band nearly coincides with a min-or one centered at �1392 cm�1 that is most distinct in our solu-tion-phase spectrum of (6Z,60Z)-rhodoxanthin. In consideringboth of these points, we conclude that isomerization affected theprevious resonance Raman spectra [42] in a similar way that itprobably affected the thin film results of the present study.
Resonance Raman spectra of rhodoxanthin-containing feathers
The room and low temperature resonance Raman spectra of thefeathers are shown in Fig. 10. The 8 cm�1 variation in the peakmaxima of m1 in the room temperature spectra of the feathers isslightly greater than the variation caused by various isomers ofrhodoxanthin in solution. In the fingerprint region, there generallyis a larger number of well-defined bands for the feathers than forthe solution-phase spectra. For example, in the m2 region the feath-ers have significant Raman scattering in two main bands that arenear 1159 and 1146 cm�1, as well as a shoulder at �1132 cm�1.The m2 region of rhodoxanthin in solution exhibits a single broadpeak at �1159 cm�1, with a shoulder at �1135 cm�1. Like the solu-tion phase spectra, the feathers have two small bands with peaksnear 1195 and 1205 cm�1, a pair of bands that are found at approx-imately 1275–1285 cm�1, and there is a small band centered at�1342 cm�1.
A comparison of the Raman spectra of the feathers at room tem-perature, with the solution-phase results suggests that the iso-meric content of rhodoxanthin in the feathers is mixed. On onehand the intensity of the 1342 cm�1 band in the spectra of thefeathers is most consistent with a predominantly (6E,60E) or(6E,60Z) configuration. Similarly, the overall shape of the bandsnear 1195 cm�1 most closely resemble the (6E,60E) or (6E,60Z) con-figurations in solution. However, the 1392 cm�1 band, which is

Fig. 10. Resonance Raman spectra of avian feathers acquired with 514.5 nmexcitation and a microscope setup. The solid lines are spectra acquired atapproximately �195 �C, and the dotted lines are those acquired at room temper-ature. The 800–930 cm�1 region is magnified by a factor of 5.
152 C.J. Berg et al. / Archives of Biochemistry and Biophysics 539 (2013) 142–155
most clearly observed in the (6Z,60Z) isomer, is observed in all fivesamples. The prominent Raman signals at �830 cm�1, also ob-served in each of the feather spectra, could support the presenceof the Z configuration. Based on these comparisons, it is possiblethat the feathers contain a majority of molecules with the(6E,60Z) configuration. However an inhomogeneous mixture of(6E,60E) and (6Z,60Z) isomers could also yield spectra that have asimilar appearance. As noted for the thin films and in solution, itis possible that photoisomerization about the C6@C7 (C60@C70)bond of rhodoxanthin occurs in the feathers, and that a steady-state equilibrium of configurations is reached shortly after laserexcitation begins. One way to assess whether an isomeric mixtureis native in the feathers, or an artifact of excitation, would involveextraction of the chromophore without heat [4,39] (to preserve thenative distribution of isomers), followed by HPLC analysis of thepigments.
Differences in the isomeric content among the feathers cannotbe the sole cause of the variation in their absorption spectra. Theshift of the absorption maxima between (6Z,60Z)- and (6E,60E)-rho-doxanthin is less than 500 cm�1, whereas the estimated differencesin the absorption spectra of the five feathers is �1400 cm�1.
In general, band frequencies increase slightly upon lowering thesample temperature. The bands clustered in the region of m2 arebetter resolved at low-temperature. Additionally, the relative
amplitudes of the low-frequency bands, as well as m2 and m3, tendto increase at low temperature, as compared with the m1 band.The peak positions of the feather spectra at low-temperature androom temperature are summarized in Table S7.
Description of Raman spectra of individual feather samples
Pt. magnificusThis feather is characterized by the highest frequency for m1 at
1525 (1523) cm�1 at low (room) temperature. The band is some-what broadened relative to other samples, and only Pt. jambu hasgreater breadth. The m2 region of Pt. magnificus is also broadenedrelative to others. The HOOP bands have the lowest intensitiesand are the least well resolved among all feathers. Most of theintensity in the HOOP region is found in the 875 and 892 cm�1
bands.
Ph. carnifexThis spectrum is most similar to Pt. magnificus. At low temper-
ature, the m1 band has its peak at 1524 cm�1, only one wavenumberlower than the corresponding peak of Pt. magnificus. The maxima ofthe bands in the fingerprint region for both samples have frequen-cies that match one another within several wavenumbers. How-ever, the spectra of Ph. carnifex appear to be the most well-resolved, with narrower m2 and m3 bands relative to spectra of Pt.magnificus and other species. Other bands in the fingerprint region,e.g. at 1273 and 1285 cm�1 are distinguishable even at room tem-perature. Likewise, the bands in the HOOP region are more re-solved and numerous than for other feathers at low temperature.Unique to the Raman spectra of Ph. carnifex is a sharp mode at863 cm�1, and the intensity of the 953 cm�1 band is considerablygreater than corresponding modes in the 950–960 cm�1 region ofany other sample.
Pt. pulchellus and Pt. solomonensisThe low-temperature resonance Raman spectra of these feath-
ers appear to have no significant differences. The m1 frequencymaxima (1519 cm�1) are identical at low temperature. The finger-print region reveals a band-for-band match for the two species,with at most a �3 cm�1 difference in the position of correspondingmaxima. Both show clear doublet character to m2, with significantintensity of one band centered at 1148–1149 cm�1, and anothercentered at 1159 cm�1. A clear shoulder has a maximum at1132–1133 cm�1. Finally, the methyl rock and six HOOP modesmatch with at most 1 cm�1 difference in the positions of the max-ima. The intensities of the HOOP modes are very similar in thespectra of the two feathers.
Pt. jambuThe �7 cm�1 upshift in m1 upon cooling (from 1515 to
1522 cm�1) is a considerably greater change than seen for anyother feather. The reason for the shift, as well as the overall greaterbreadth of this band is clear from the low-temperature spectrum,where it is obvious that the intensity in the m1 region is due totwo overlapping bands. A fit of the spectra to two Voigt profilesyields peak positions at 1510 cm�1 (small) and 1524 cm�1 (large).Another unusual aspect of the Pt. jambu resonance Raman spec-trum is the anomalously large HOOP band at 827 cm�1. The rela-tive intensity in the HOOP mode region is greatest for Pt. jambuamong all the samples.
Effect of irradiance on the resonance Raman spectra
A comparison of the low and high irradiance Raman spectra ofthe feathers is illustrated in Fig. S7. The high-irradiance experi-ments employed a tightly focused �1 lm diameter beam that
C.J. Berg et al. / Archives of Biochemistry and Biophysics 539 (2013) 142–155 153
could probe a specific area of a single barbule, whereas similarspecificity was not possible for the 2.50 mm by 0.040 mm sizedspot of the low-irradiance experiments. The irradiance levels ofthe micro-Raman experiments were 103–104 times higher thanthe macro-Raman experiments. Despite the differing areas andirradiance levels, the spectra are nearly identical. In some casesthere are differences in peak positions of �2 cm�1. It is not clearwhether these shifts are a consequence of the irradiance, or uncer-tainties in the wavelength calibration for the different experi-ments. The near-identical Raman spectra of carotenoids infeathers at high and low irradiance is consistent with a previous re-port [41].
Connections between electronic and vibrational spectroscopy
The origins of the vibrational and electronic changes of carote-noids in different environments have been addressed extensivelyfor the caroteno-proteins of lobsters and other invertebrates[23,73] and carotenoid-containing feathers of birds [4,5,41]. Wewill discuss the results described above in the context of threemechanisms: (1) extent of conjugation, particularly the effects ofdistortion; (2) polarization of the chromophore via interactionwith its environment; and (3) electronic coupling betweencarotenoids.
It is well known that an increase in the extent of conjugation(increase in p-electron delocalization) in a polyene system de-creases both the energy of the HOMO–LUMO transition as wellas the frequency of the m1 mode [74,75]. Is a change in the extentof conjugation, as reflected by the frequency of the m1 mode of rho-doxanthin in the feathers, consistent with the shifts in electronicabsorption of the chromophore? The positions of the averagehalf-maxima in the absorption are 20,100, 19,800, 19,200, and18,700 cm�1 for Pt. magnificus, Ph. carnifex, Pt. pulchellus, andPt. solomonensis, respectively. Resonance Raman spectra acquired atthe same (room) temperature as the absorption spectra have peakmaxima for the ethylenic frequencies at 1523, 1520, 1518, and1515 cm�1. (Pt. jambu is not considered in this analysis becauseof the complicating factor of two bands observed in the low-tem-perature Raman spectra.) A plot of the electronic energy versusethylenic vibrational frequency yields a slope of nearly 200 cm�1
(change in electronic energy) per 1 cm�1 (change in vibrational fre-quency). By comparison, reports of the same correlation as a func-tion of polyene length reveal a slope of �95–120 cm�1 (electronic)per 1 cm�1 (vibrational) [74–76]. The electronic spectrum of rho-doxanthin changes more than one would expect from the variationin the m1 ground-state frequency. Additionally, changes in conjuga-tion length are expected to affect both m1 and m2 frequencies[41,74,75]. The near-invariant frequency positions of strong bandsin the m2 region of the feather spectra are one argument against dif-ferences in ground-state delocalization. Taken together, the pre-ceding observations lead to the conclusion that changes in theabsorption band of rhodoxanthin within the environment of thefive feather samples are primarily a consequence of shifts in the ex-cited-state energy level of the carotenoid, and secondarily a resultof delocalization in the ground state.
The effective conjugation length of a polyene depends upon itsplanarity. One measure of loss in planarity is the enhanced Ramanscattering from HOOP wags. These normal modes become fullysymmetric, and therefore gain Raman intensity via the A-term,when the polyene is twisted [68,77]. For rhodoxanthin in the fivefeathers, the HOOP bands of the room-temperature spectra areslightly more intense when the m1 frequency is lowest. We wouldexpect the opposite behavior: a low intensity of a HOOP band (signof a flattened chromophore) should be connected to a down-shifted ethylenic frequency (indicator of delocalization). Our viewagrees with others [74,78]. However, there have been contrary
claims that twisting around single or double bonds of the chromo-phore would cause a decrease in m1 ethylenic frequency [23].Although we question the basis of the latter correlation, neverthe-less, it matches the trend of our experimental spectra.
A polarization mechanism, e.g. one resulting from a hydrogenbond to a keto group, or the interaction of a nearby charge withthe conjugated double bond network, can alter the electronicstructure of the carotenoid in two ways. First, the presence of acharged residue near the polyene chain or conjugated carbonylcould decrease the extent of double- and single-bond alternation,effectively extending the conjugation. This mechanism shouldhave a significant effect on the ground state, as well as the energyof the electronic transition [79]. Second, a nearby charged residuecould perturb the excited state, while leaving the ground state lar-gely unmodified. This alternative scenario is reasonable, in part be-cause the carotenoid in its S2 excited state is more polarizable thanin the ground state [80]. Furthermore, particularly for a keto-carot-enoid, any asymmetry in the interactions at either end of the chro-mophore can be expected to induce significant charge-transfer,and therefore a dipole moment, upon excitation. Charge transferis one mechanism whereby the environment could shift the energylevel of the excited state substantially, while the ground state isleft relatively unperturbed. A similar model of excited-state pertur-bation was invoked to explain the green-to-red opsin shift of thevisual pigment rhodopsin, which contains the chromophore 11-cis retinal [81].
Some degree of polarization of the ground-state rhodoxanthinin the feathers may be indicated by C@O stretching frequenciesthat are lower (�10 cm�1) versus in the solution phase (Fig. S7).The decreased frequency could be caused by hydrogen bondingof an amino acid residue to a carbonyl. However, the decrease infrequency is significantly smaller than the typical 40–60 cm�1
downshifts for other hydrogen-bonded carbonyls [82]. The minordecrease in carbonyl frequency seen in our experimental spectradoes not support strong hydrogen-bonding as the primary mecha-nism for polarization in the feathers. Again, we conclude that theevidence points to minimal perturbation of the ground-state chro-mophore, as part of the shift in the electronic transition.
Electronic coupling between neighboring carotenoid moleculesmay also perturb their excited-state energy levels. Exciton-cou-pling between astaxanthin molecules in crustacyanin was hypoth-esized to cause shifts in the absorption profile [13,14,22,83].Although exciton-coupling shifts the excited state of the caroten-oid, the ground state is unperturbed, thus leaving the vibrationalfrequencies the same [52,84]. In the case of the feathers, changesin the absorption profile, with only modest changes in the m1 fre-quency, may be indirect indicators that exciton coupling plays arole in the electronic transition of rhodoxanthin. Specifically, thedownshifted electronic absorption of Pt. pulchellus, Pt. solomonen-sis, and Pt. jambu could be partially caused by chromophore–chro-mophore interaction. If this proposal is correct, the mechanism forbringing the chromophores close to one another must overcomethe relatively low concentrations of rhodoxanthin in the featherswith the most red-shifted absorption bands (Pt. solomonensis andPt. jambu).
Conclusions
In the present study, we have explored the variation of color inbird feathers that contain the retro-carotenoid rhodoxanthin. Theplumage originates from four species of fruit doves (Ptilinopus)and a cotinga (Cotingidae). We analyzed the vibrational spectraof the retro-carotenoid, and identified bands and normal modesthat distinguish it from more common carotenoids that have theusual pattern of single/double bond alternation.

154 C.J. Berg et al. / Archives of Biochemistry and Biophysics 539 (2013) 142–155
Within the feathers of the five species, the shifts in ethylenic(m1) band positions are inconsistent with the trend in HOOP wagintensities, and also cannot be reconciled with the �40 nm shiftin the UV–Vis transition energy. Therefore, we propose that apolarization mechanism, or possibly exciton coupling betweenchromophores, exerts a particularly strong influence on the ex-cited-state chromophore within the keratin environment. Shiftsin the absorption of rhodoxanthin may be the primary cause of col-or variation, but other factors are not excluded. Eumelanin andpheomelanin in Pt. magnificus, Pt. pulchellus, Ph. carnifex could con-tribute to blue light absorption and enhance the feathers’ overallred appearance, relative to those of Pt. jambu and Pt. solomonensis.It is also possible that structural coloration, or perhaps differencesin carotenoid concentration, could affect the range of colors ob-served in the plumage of these birds.
Acknowledgments
This research was supported in part by the National ScienceFoundation (CHE-1057198), UCSD start-up support, and the W.M.Keck Foundation (through computing resources at the W.M. KeckLaboratory for Integrated Biology II). Work in the laboratory ofH.A.F. was supported by the University of Connecticut ResearchFoundation. Work by R.O.P was supported by the W.R. Coe Fundof Yale University. We thank T. Polívka for samples of syntheticrhodoxanthin, McCrone Microscopes (A. Vitous and J. McGinn)for extended trials of the Linkam cold stages, as well as Wim deGroot, T. Friedel, W. Peckover, Mehd Halaouate, and VIREO (VisualResources in Ornithology) for permission to reproduce their photo-graphs (Fig. 1).
Appendix A. Supplementary data
Supplementary data associated with this article can be found, inthe online version, at http://dx.doi.org/10.1016/j.abb.2013.09.009.
References
[1] R.O. Prum, A.M. LaFountain, J. Berro, M.C. Stoddard, H.A. Frank, J. Comp.Physiol. B 182 (2012) 1095–1116.
[2] O. Völker, J. Ornithol. 94 (1953) 263–273.[3] O. Völker, J. Ornithol. 102 (1961) 430–438.[4] R. Stradi, G. Celentano, E. Rossi, G. Rovati, M. Pastore, Comp. Biochem. Physiol.
B Biochem. Mol. Biol. 110B (1995) 131–143.[5] M. Mendes-Pinto, A.M. LaFountain, M.C. Stoddard, R.O. Prum, H.A. Frank, B.
Robert, J. R. Soc. Interface (2012) 3338–3350.[6] H.W. Yin, L. Shi, J. Sha, Y.Z. Li, Y.H. Qin, B.Q. Dong, S. Meyer, X.H. Liu, L. Zhao, J.
Zi, Phys. Rev. E 74 (2006).[7] L. D’Alba, V. Saranathan, J.A. Clarke, J.A. Vinther, R.O. Prum, M.D. Shawkey, Biol.
Lett. 7 (2011) 543–546.[8] V. Saranathan, J.D. Forster, H. Noh, S.F. Liew, S.G.J. Mochrie, H. Cao, E.R.
Dufresne, R.O. Prum, J. R. Soc. Interface 9 (2012) 2563–2580.[9] K.J. McGraw, R.J. Safran, K. Wakamatsu, Funct. Ecol. 19 (2005) 816–821.
[10] K.J. McGraw, Mechanics of melanin-based coloration, in: G.E. Hill, K.J. McGraw(Eds.), Bird Coloration: Mechanisms and Measurements, vol. I, HarvardUniversity Press, Cambridge, MA, 2006, pp. 243–294.
[11] G. Britton, R.J. Weesie, D. Askin, J.D. Warburton, L. Gallardo-Guerrero, F.J.Jansen, H.J.M. de Groot, J. Lugtenburg, J.-P. Cornard, J.-C. Merlin, Pure Appl.Chem. 69 (1997) 2075–2084.
[12] P.F. Zagalsky, Acta Crystallogr. Sect. D Biol. Crystallogr. 59 (2003) 1529–1531.[13] R.P. Ilagan, R.L. Christensen, T.W. Chapp, G.N. Gibson, T. Pascher, T. Polívka,
H.A. Frank, J. Phys. Chem. A 109 (2005) 3120–3127.[14] A.A.C. van Wijk, A. Spaans, N. Uzunbajakava, C. Otto, H.J.M. de Groot, J.
Lugtenburg, F. Buda, J. Am. Chem. Soc. 127 (2005) 1438–1445.[15] H. Rademaker, A.J. Hoff, R. van Grondelle, L.N.M. Duysens, Biochim. Biophys.
Acta 592 (1980) 240–257.[16] W.J. McGann, H.A. Frank, Biochim. Biophys. Acta 725 (1983) 178–189.[17] C. Wang, M.J. Tauber, J. Am. Chem. Soc. 132 (2010) 13988–13991.[18] C. Wang, D.E. Schlamadinger, V. Desai, M.J. Tauber, ChemPhysChem 12 (2011)
2891–2894.[19] M.B. Smith, J. Michl, Chem. Rev. 110 (2010) 6891–6936.[20] M.B. Smith, J. Michl, Annu. Rev. Phys. Chem. 64 (2013) 361–386.[21] O. Völker, J. Ornithol. 93 (1952) 122–129.
[22] G. Britton, J.R. Helliwell, Carotenoid–protein interactions, in: G. Britton, S.Liaaen-Jensen, H. Pfander (Eds.), Carotenoids, vol. 4, Birkhäuser Verlag, Basel,2008, pp. 99–117.
[23] P.F. Zagalsky, E.E. Eliopoulos, J.B.C. Findlay, Comp. Biochem. Physiol. BBiochem. Mol. Biol. 97 (1990) 1–18.
[24] G. Britton, S. Liaaen-Jensen, H. Pfander, Carotenoids Handbook, BirkhäuserVerlag, Basel, Boston, Berlin, 2004.
[25] R. Kuhn, H. Brockmann, Dtsch. Chem. Ges. 66 (1933) 828–841.[26] P. Karrer, E. Jucker, Carotenoids, Elsevier, Amsterdam, 1950.[27] P.J. Peterson, J. Exp. Bot. 14 (1963) 1–9.[28] M. Cyronak, G. Britton, K.L. Simpson, Phytochemistry 16 (1977) 612–613.[29] K. Ida, F. Saito, S. Takeda, Bot. Mag. Tokyo 104 (1991) 157–169.[30] H.G. Weger, S.N. Silim, R.D. Guy, Plant Cell Environ. 16 (1993) 711–717.[31] Q. Han, K. Shinohara, Y. Kakubari, Y. Mukai, Plant Cell Environ. 26 (2003) 715–
723.[32] M. Merzlyak, A. Solovchenko, S. Pogosyan, Photochem. Photobiol. Sci. 4 (2005)
333–340.[33] K. Hormaetxe, J.M. Becerril, I. Fleck, M. Pintó, J.I. García-Plazaola, J. Exp. Bot. 56
(2005) 2629–2636.[34] A. Solovchenko, Stress-induced buildup of screening pigments, in:
Photoprotection in: Plants, Springer-Verlag, Berlin Heidelberg, 2010.[35] B. Czeczuga, B.D. Ryan, R.W. Spjut, J.-A.W. Flock, C.W. Beasley, R.E. Showman,
R.D. Worthington, V.L. Boucher, Feddes Repertor. 108 (1997) 401–417.[36] O. Völker, Naturwissenschaften 38 (1951). 565–565.[37] J. Hudon, Can. J. Zool. Rev. Can. Zool. 69 (1991) 2311–2320.[38] J. Hudon, M. Anciães, V. Bertacche, R. Stradi, Comp. Biochem. Physiol. B
Biochem. Mol. Biol. 147 (2007) 402–411.[39] J. Hudon, A. Storni, E. Pini, M. Anciães, R. Stradi, Auk 129 (2012) 491–499.[40] M.M. Katsuyama, B. Jpn. Soc. Sci. Fish. 45 (1979) 1045.[41] M. Veronelli, G. Zerbi, R. Stradi, J. Raman Spectrosc. 26 (1995) 683–692.[42] H.-B. Wang, D.-D. Ren, L.-Z. Liu, J.-Y. Shi, Acta Hydrobiol. Sin. 28 (2004) 380–
384.[43] H. Wang, D. Ren, L. Liu, G. Peng, M. Zhang, S. Zhang, Sci. Agri. Sin. 37 (2004)
1363–1368.[44] O. Isler, M. Montavon, R. Rüegg, P. Zeller, Helv. Chim. Acta 39 (1956) 454–462.[45] H. Mayer, M. Montavon, R. Rüegg, O. Isler, Helv. Chim. Acta 50 (1967) 1606–
1617.[46] J.D. Surmatis, A. Walser, J. Gibas, Helv. Chim. Acta 53 (1970) 974–990.[47] E. Widmer, R. Zell, H. Grass, R. Marbet, Helv. Chim. Acta 65 (1982) 958–967.[48] E. Nicoara, V. Tamas�, G. Neamt�u, C. Bodea, Liebigs Ann. Chem. 697 (1966) 201–
203.[49] H.H. Strain, M.R. Thomas, J.J. Katz, J. Org. Chem. 26 (1961) 5061–5064.[50] B.C.L. Weedon, Spectroscopic methods for elucidating structures of
carotenoids, in: L. Zechmeister (Ed.), Fortschritte der Chemie OrganischerNaturstoffe, vol. 27, Springer-Verlag, Wien, 1969, pp. 81–130.
[51] T. Matsuno, M. Katsuyama, B. Jpn. Soc. Sci. Fish. 45 (1979) 1533–1538.[52] C. Wang, C.J. Berg, C.-C. Hsu, B.A. Merrill, M.J. Tauber, J. Phys. Chem. B 116
(2012) 10617–10630.[53] A.M. LaFountain, S. Kaligotla, S. Cawley, K.M. Riedl, S.J. Schwartz, H.A. Frank,
R.O. Prum, Arch. Biochem. Biophys. 504 (2010) 142–153.[54] K.J. McGraw, J. Hudon, G.E. Hill, R.S. Parker, Behav. Ecol. Sociobiol. 57 (2005)
391–397.[55] M.J.T. Frisch, G.W. Schlegel, H.B. Scuseria, G.E. Robb, M.A. Cheeseman, J.R.
Scalmani, G. Barone, V. Mennucci, B. Petersson, G.A. Nakatsuji, H. Caricato, M.Li, X. Hratchian, H.P. Izmaylov, A.F. Bloino, J. Zheng, G. Sonnenberg, J.L. Hada,M. Ehara, M. Toyota, K. Fukuda, R. Hasegawa, J. Ishida, M. Nakajima, T. Honda,Y. Kitao, O. Nakai, H. Vreven, T. Montgomery Jr., J.A. Peralta, J.E. Ogliaro, F.Bearpark, M. Heyd, J.J. Brothers, E. Kudin, K.N. Staroverov, V.N. Kobayashi, R.Normand, J. Raghavachari, K. Rendell, A. Burant, J.C. Iyengar, S.S. Tomasi, J.Cossi, M. Rega, N. Millam, J.M. Klene, M. Knox, J.E. Cross, J.B. Bakken, V. Adamo,C. Jaramillo, J. Gomperts, R. Stratmann, R.E. Yazyev, O. Austin, A.J. Cammi, R.Pomelli, C. Ochterski, J.W. Martin, R.L. Morokuma, K. Zakrzewski, V.G. Voth,G.A. Salvador, P. Dannenberg, J.J. Dapprich, S. Daniels, A.D. Farkas, Ö. Foresman,J.B. Ortiz, J.V. Cioslowski, D.J. Fox, Gaussian 09, Gaussian, Inc., Wallingford, CT,2009.
[56] C.J. Cramer, Essentials of Computational Chemistry: Theories and Models, JohnWiley & Sons Ltd., West Sussex, 2002.
[57] S. Andersson, M. Prager, E.I.A. Johansson, Funct. Ecol. 21 (2007) 272–281.[58] J. Hudon, G.F. Grether, D.F. Millie, Physiol. Biochem. Zool. 76 (2003) 776–790.[59] G.B. Cordon, M. Gabriela Lagorio, J. Chem. Ed. 84 (2007) 1167–1170.[60] K.R. Millington, Amino Acids 43 (2012) 1277–1285.[61] P. Meredith, T. Sarna, Pigm. Cell Res. 19 (2006) 572–594.[62] J. Dyck, Structure and light reflection of green feathers of fruit doves (Ptilinopus
spp.) and an Imperial Pigeon (Ducula concinna), in: Biologiske Skrifter,Copenhagen, Royal Danish Academy of Sciences and Letters, 1987, pp. 2–43.
[63] R.O. Prum, Anatomy, physics, and evolution of avian structural colors, in: G.E.Hill, K.J. McGraw (Eds.), Bird Coloration: Mechanisms and Measurements, vol.1, Harvard University Press, Cambridge, MA, 2006.
[64] S. Saito, M. Tasumi, J. Raman Spectrosc. 14 (1983) 310–321.[65] Y. Koyama, Resonance Raman spectroscopy, in: G. Britton, S. Liaaen-Jensen, H.
Pfander (Eds.), Carotenoids: Spectroscopy, vol. 1B, Birkhäuser Verlag, Basel,Boston, Berlin, 1995.
[66] B. Robert, The electronic structure, stereochemistry and resonance Ramanspectroscopy of carotenoids, in: H.A. Frank, A.J. Young, G. Britton, R.J. Cogdell(Eds.), Advances in Photosynthesis, Photochemistry of Carotenoids, vol. 8,Springer, 1999, pp. 189–201.

C.J. Berg et al. / Archives of Biochemistry and Biophysics 539 (2013) 142–155 155
[67] N. Tschirner, M. Schenderlein, K. Brose, E. Schlodder, M.A. Mroginski, P.Hildebrandt, C. Thomsen, Status Solidi. B Basic Solid State Phys. 245 (2008)2225–2228.
[68] G. Eyring, B. Curry, A. Broek, J. Lugtenburg, R. Mathies, Biochemistry 21 (1982)384–393.
[69] I. Palings, E.M.M. van den Berg, J. Lugtenburg, R.A. Mathies, Biochemistry 28(1989) 1498–1507.
[70] L. Zechmeister, Cis-Trans Isomeric Carotenoids Vitamins A and Arylpolyenes,Springer-Verlag, Vienna, 1962.
[71] J. Dale, Acta Chem. Scand. 8 (1954) 1235–1256.[72] G. Englert, M. Vecchi, J. Chromatogr. 235 (1982) 197–203.[73] M. Buchwald, W.P. Jencks, Biochemistry 7 (1968) 844.[74] J.C. Merlin, J. Raman Spectrosc. 18 (1987) 519–523.[75] L. Rimai, M.E. Heyde, D. Gill, J. Am. Chem. Soc. 95 (1973) 4493–4501.
[76] H.E. Schaffer, R.R. Chance, R.J. Silbey, K. Knoll, R.R. Schrock, J. Chem. Phys. 94(1991) 4161–4170.
[77] B. Robert, Photosynth. Res. 101 (2009) 147–155.[78] V.R. Salares, N.M. Young, H.J. Bernstein, P.R. Carey, Biochim. Biophys. Acta 576
(1979) 176–191.[79] B. Durbeej, L.A. Eriksson, Chem. Phys. Lett. 375 (2003) 30–38.[80] S. Krawczyk, G. Britton, Biochim. Biophys. Acta Protein Struct. Mol. Enzy. 1544
(2001) 301–310.[81] G.G. Kochendoerfer, S.W. Lin, T.P. Sakmar, R.A. Mathies, TIBS 24 (1999) 300–305.[82] G. Socrates, Infrared and Raman Characteristic Group Frequencies: Tables and
Charts, Wiley Chichester, UK, 2001.[83] A. Strambi, B. Durbeej, J. Phys. Chem. B 113 (2009) 5311–5317.[84] V.R. Salares, N.M. Young, P.R. Carey, H.J. Bernstein, J. Raman Spectrosc. 6 (1977)
282–288.