asir - home - springer · the geneva papers on risk and insurance, 19 (april 1981) 85-96 asir the...
TRANSCRIPT

The Geneva Papers on Risk and insurance, 19 (April 1981) 85-96
ASIRThe Advanced Simulation Model
of Insurance & Re-insurance Operations : An Introduction
by Lawrence Ga!itz and Margaret Brown *
Background to the projectAll research starts with an initial conception, and here the impetus to develop an
advanced insurance model really originated in two stages.The first stimulus came from the insurance market itself. There is often a significant
time lag between the inception of research and the availability of results. With thespeed of change that now characterises the insurance environment, the delay in carryingout certain types of research study was seen as undermining its direct utility to theinsurance industry. It has not been uncommon to find that by the time a researcharea had been identified, a proposal formulated and approved, the research carriedout, and the results published, the research topic was no longer of current interest.Recognition of this problem led to the idea of using a modelling system capable ofexamining many different aspects of the insurance market rather than isolated areas.
Once the need for a versatile insurance model had been established, a look atcurrently available model (GIM and SOFI i) soon revealed that nothing in existencecould meet the necessary requirements. For example, the GIM model had only thelimited application to motor insurance, it could not deal with re-insurance, it permittedonly a limited description of the external operating environment, and so on. Thegeneral purpose simulation model of financial institution, SOFI, whilst more advancedthan the GIM model, also had its limitations (for example, SOFI is a single currencymodel). Furthermore, apart from a number of specific restrictions, existing models hadone major drawback: a fixed structure. A central requirement for an advanced modelwas the need for flexibility.
AIm of the projectWith this background, the aims of this research project, sponsored by the Geneva
Association, emerged:to create a powerful and flexible system whereby investigations into areas oftopical interest in insurance and re-insurance could readily be carried out, andto apply the model to areas of theoretical and practical interest.
* Institute of European Finance, Bangor, North Wales, U.K.1 GIM (Geneva Insurance Model) developed at the Battelle Institute, Geneva. SOFI
(Simulation Of Financial Institutions) developed at the Institute of European Finance, Bangor.For more details on the ASIR model see: "Users' Manual" - Etudes & Dossiers No. 43,Geneva Association.
85
The remainder of the report describes the way in which the work to date haspursued these goals.
3. Initial design conceptsThe project commenced in January 1979 with some careful planning Some impor-
tant design considerations had to be analysed and assessed, and these are described inthe following paragraphs.
3.1. Type of modelThe existing models mentioned earlier, GIM and SOFI, were both deterministic.
This meant that they would always produce the same set of results for a given set ofinput data. The essence of the insurance business, however, is uncertainty, and in reallife, a given set of circumstances can lead to a wide range of outcomes. In pursuit ofrealism, there was a temptation to make the model purely stochastic. However, it wasrecognised that there are drawbacks with stochastic models. The most significant disad-vantage concerns the provision of probabilistic data to the model. The data must notonly describe the probability distributions of the input variables, but must also fullydescribe their interactions and correlations. This data requirement could be a formidableone in many cases, to the extent that potential users of the model might be discouragedfrom actually making use of it. A secondary consideration, though not unimportant,was that of computer resources, with stochastic models being several orders of magni-tude more expensive to run than their deterministic counterparts.
With these thoughts in mind, and the need to embody flexibility, it was decidedto give users several options
running the model once with a given set of data - the "single shot" mode. Thisenables the user to obtain a single set of results from the model and is analogousto having a deterministic model;running the model several times, changing the input data slightly between succes-sive runs - the "sensitivity analysis" mode. This enables the user to obtain aspread of results from the model to show how sensitive the results are to changesin the input data. The important thing to note here is that the uncertain elementswithin the model (for example, the outcomes of claims) are held constant betweensuccessive runs by ensuring that each run starts with the same random numberseed (RNS)running the model many times, changing the random number seed between succes-sive runs - the "stochastic" mode. By performing a series of, say, 1000 runs inthe stochastic mode, the user can obtain a spread of results which indicates theextent of risk or uncertainty within the insurance business.Thus, the user can select whichever mode is appropriate for the particular situation
under investigation.
3.2. Programming language and techniquesThe first decision under this heading was the choice between a general purpose
language like FORTRAN, and a specific simulation language like DYNAMO. As stated
86

in a first progress report, after a careful survey, FORTRAN was chosen as the mostappropriate language to use. The advantages of FORTRAN which stood out were:- FORTRAN is widely available on all makes of computer;- it is a general purpose language allowing the maximum flexibility;- program modification is easy to carry out.
With the language question decided, the type of program structure was the nextdecision to be made. It was felt that the type of model envisaged was best dealt withas a large number of small program modules rather than as one large program. Thiswould enable the complex structure of an insurance market to be assembled from anumber of simpler components or "building bricks ". An additional advantage is thatmodifications can be made to an isolated module without necessitating the entire modelbeing rebuilt.
Following on from the concept of a series of "building bricks" came the idea ofhaving a number of alternative "plug-in" modules for certain functions within themodel. For example, different countries have different taxation systems, and the ideawas to make available a series of alternative taxation modules, one for each country.To assemble a French insurance company, one would include the French taxationmodule within the overall structure, and so on. Whilst this seemed like a commendableidea at first, a better solution emerged.
Instead of physically changing the model's structure to simulate different insurancecompanies the user can establish the model's internal structure simply by supplying theappropriate data. One obvious advantage of this method is that it enables the user toevaluate the effects of different regulatory regimes merely by changing a few items ofdata between successive runs rather than having to build a whole series of models.This feature, whereby the input data specify the structure of the model, ranges fromlow level changes in the details of individual insurance policies right up to high levelrelationships between simulated companies in the insurance market.
3.3. Planning the overall structure
The previous section has discussed why a modular approach to the design of themodel was chosen. Before detailed programming could take place, it was necessaryto devise the overall structure of the model. This was done in two stages.
The first stage was to identify the force which would drive the model through asimulation. There were two broad choices: stock-driven models as opposed to flow-driven models. Fig. 1 shows the distinction between the two. In a stock-driven model,the calculations are based on the level of variables at different points in time. Thederived quantity is the rate of flow that must follow given the levels of stocks at thebeginning of a time period and at the end. An example of a stock-driven model infinance would be SOFI, where the levels of deposits at the beginning and end of anaccounting period define the interest paid thereon. In a flow-driven model, on the otherhand, the calculations are based on the level at the beginning of a period and theflow-rate. The derived quantity is the level of stocks at the end of the period, which inturn can become the initial level of stocks for the next period.
87

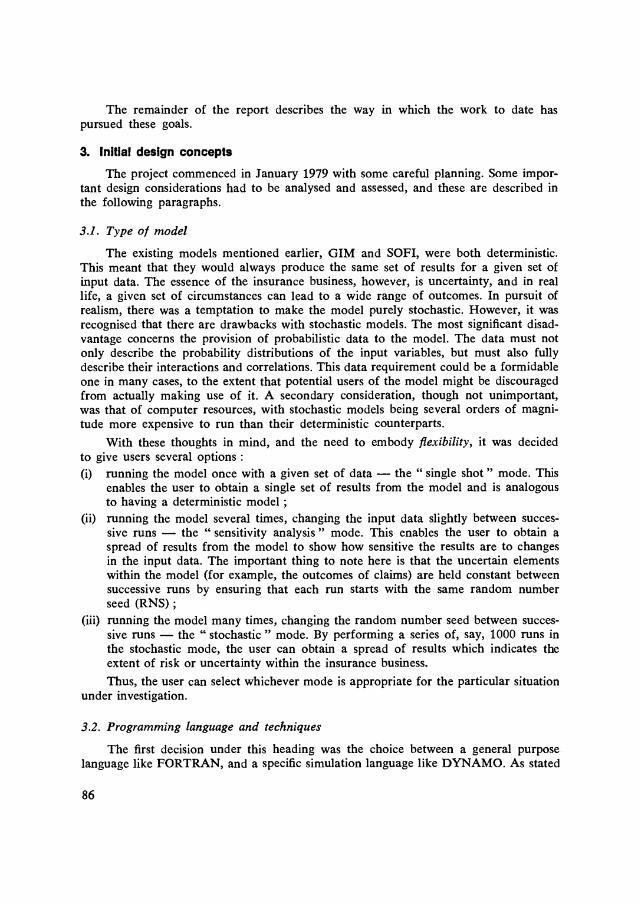
In the insurance context, premiums, claims, commissions and expenses are allflows, whilst premium reserves, loss reserves and investments are all stocks. In insuranceit is the magnitude of premium and claims which determines the level of reserves, andnot the other way round. For this reason, the flow-driven model was selected as theappropriate choice, and the schematic representation as depicted in Fig. 2 was drawnup to identify the main driving flows and derived levels within the model. Thus, theoverall structure from the financial viewpoint had been designed.
Fig. 1: Models: the driving forcea) Stock driven models
b) Flow driven models
88
St1
St1
In a STOCK driven model, the level ofstocks at two points in time determinesthe rate fo flow
dSFtat
In a FLOW driven model, the level ofstock at a future time is determinedby the initial level and a flow rate
The second stage was to produce a second structural plan, this time from theprogramming viewpoint. It was at this stage that the modules or building bricksdescribed in the previous section began to emerge as distinct entities. Fig. 3 shows thefour main program modules that form the model. These modules are: risks, investments,integrated finance and updating. Within each of these main modules are many lower-level modules, and Fig. 4 shows the principal modules within the main risks modules.These lower-level modules in turn contain various sub-modules, and a distinct hierarchyof structure within the model can be clearly identified.
The initial research proposal described the programming of the model from theblock structure as probably being a "straightforward stage ". What was thought to be asimple transformation from the block diagram to program code was, however, fraughtwith difficulties. The most significant hindrance to rapid progress was recognition of thefact that insurance is a complex business. It was considered of paramount importance tomodel the intricacies involved as realistically as possible. Another consideration wasto ensure that the model was mathematically and statistically sound, and this involvedthe use of advanced probability distribution and random number generators. A furtherconstraint was the need to keep within the limitations imposed by the computer systemitself, for example, size of array storage and speed of execution.
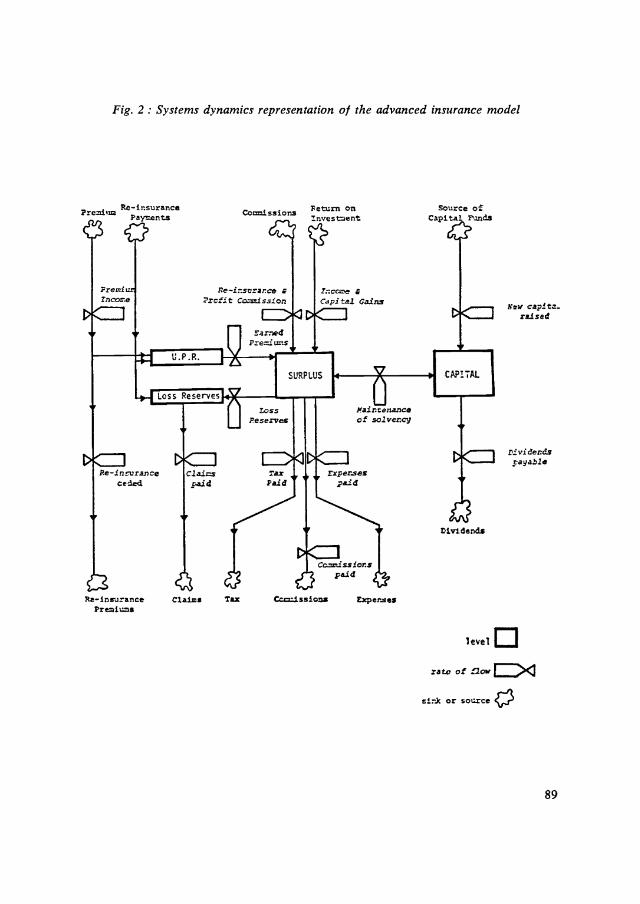
Fig. 2: Systems dynamics representation of the advanced insurance model
Petrn onR-1nsurnnce:nvestentPremius Panents
cZ? £:'
Premi isThcooevJ
V I
V
V
U.P.R.
Loss Reserves
v-iPe-nturanoe Cl sins
cee4 paid
Ra-Snrurance Ci.a4.s! TaxPresiuna
Re-isoraj-ce aProfit Cosrdssie
5eredPreni uns I, 'V
LOSSReserves
SURPLUS
.axPaid
V
aCapi tel Cams
)faintensjceof solver.oj
CcissiOr.3
Q paid
Coi.issioos Expenses
Soorce ofCapita FoodS
_-, ZeW capino-I.S____J raised
V
CPPLTAL
V
i'.'iCer4spayable
1eve
rate of flow
sir.k or soorce
89
Exper.sespaid V

90
Fig. 3: The main program modules
Initialization
Set cnpany counterto zero
Increment Period N.
I ncrentConpanyCounter
FRisksPdule
I nvesnentSModu'e
Integrated FinanceModule
'I,Updating
Module
Output Module

( START
CHANGES IN POLICIESIN FORCE
PREMIUMCALCULATIONS
GENERATES CLAIMSMJMBERS
ISMALLI CLAIMS:CLAIMS TIMING
AND AMOUNT
NSHAILN CLAIMS:RE-INSURANCE
VLR CLAIMS:CLAIMS TIMING
AND AMOUNTS
VLR CLAIMS:RE-I NSURANCE
OUTPUT
( FINISH)
Fig. 4: Principal modules within the risks module
deals with new policies,renewals and cancellationsdeals with premium income,re-insurance premium,commissions, expensesUPR, reserve depositsdeals with the generationof claims numbers for "small"claims and for VLRsdeals with amounts incurredand settled, and updatesloss reserves accordinglydeals with small claims transactionsbetween direct company and re-insurerand updates loss reserves ofboth companies accordinglydeals with amounts incurredand settled, and updatesloss reserves accordinglydeals with VLR transactionsbetween direct company andre-insurer, and updates lossreserves of both companiesaccordinglyprints period results ifrequired; if at year-end,assembles results and convertsto home currency for company'sfinancial statements
91

It is believed that these problems have now been surmounted, and there existsa complete working version of the model. The main features of this first version areset out in the following section.
4. Capabflities of the modelA full description of the model's capabilities is given in the User's Manual 1
however a good idea of the model's potential can also be obtained by examining themain features set out in the following paragraphs.
4.1. Type of market structureUp to nine active companies can be studied in the simulated market, and each
active company may be linked by way of parent-subsidiary relationship to any othercompany. Some examples of alternative relationships between simulated companies aregiven in Fig. 5.
Fig. 5: Alternative relationships between companies
92
U)
1 See note page 85.
©
C2 and C3 are eachsubsidiaries of Ci
a more complex set ofrelationships betweenparent companies andsubsidiaries
Beyond these links at corporate level, there is also much flexibility in specifyingre-insurance relationships within the model. Each active company can cede or receivere-insurance business with any other active company. Thus, a simulated company maybe a pure direct insurer, a pure re-insurer, or a direct insurer also handling re-insurancebusiness. Furthermore, it is also possible to specify re-insurance links with companiesoutside the model. Treaties may be established between active companies within themodel and a "shadow company ", which can cede or accept re-insurance business.Provision of this last feature is extremely useful because it allows a user to concentrateon one company, or one side of the insurance industry, without having to model in
detail the links to other companies. Examples of alternative insurance and re-insurancearrangements are shown in Fig. 6.
Fig. 6: Alternative insurance & reinsurance arrangements
ii) C0
Shadow Company as Re-insurer
Direct Company
Shadow Company as Direct Insurer
Re-insurance Company
Each company undertakes bothdirect and re-insurance business
C,
4.2. Handling of risksUp to forty direct insurance risk classes may be handled and each risk class can
either be a GROUP of risks or a single VLR (very large risk). The idea here is todistinguish between a class of homogeneous risks, for example, part of a motor portolio,and instances of low-probability high value risks, such as an oil platform. This distinc-tion is important from the modelling viewpoint because different statistical processesand procedures are necessary to handle the two main types of risk class. In fact, toobtain more realistic treatment of the claims behaviour of GROUP risks, it has beenfound necessary to split these further into "small" claims and "large" claims, whichare modelled by separate but overlapping statistical distributions.
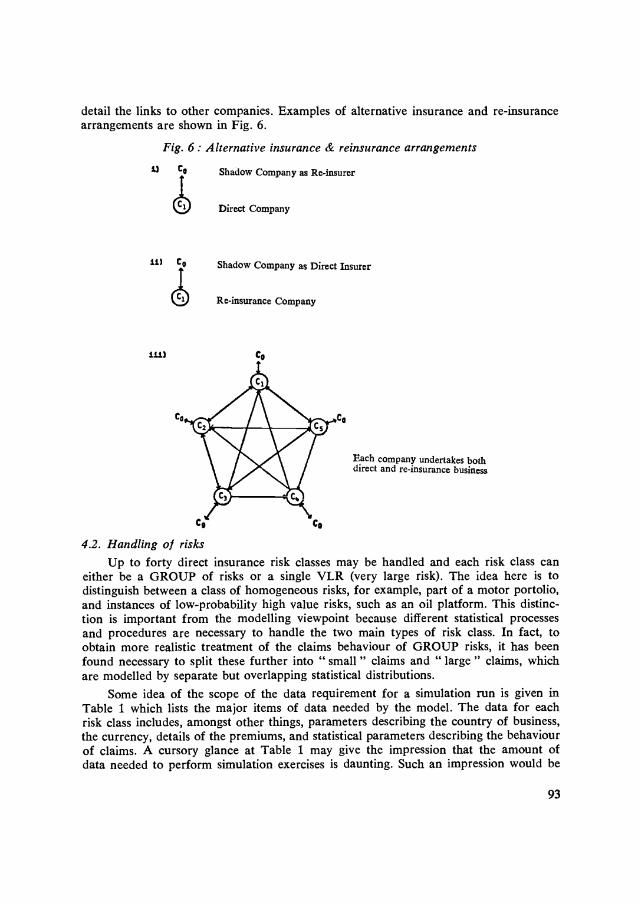
Some idea of the scope of the data requirement for a simulation run is given inTable 1 which lists the major items of data needed by the model. The data for eachrisk class includes, amongst other things, parameters describing the country of business,the currency, details of the premiums, and statistical parameters describing the behaviourof claims. A cursory glance at Table 1 may give the impression that the amount ofdata needed to perform simulation exercises is daunting. Such an impression would be
93
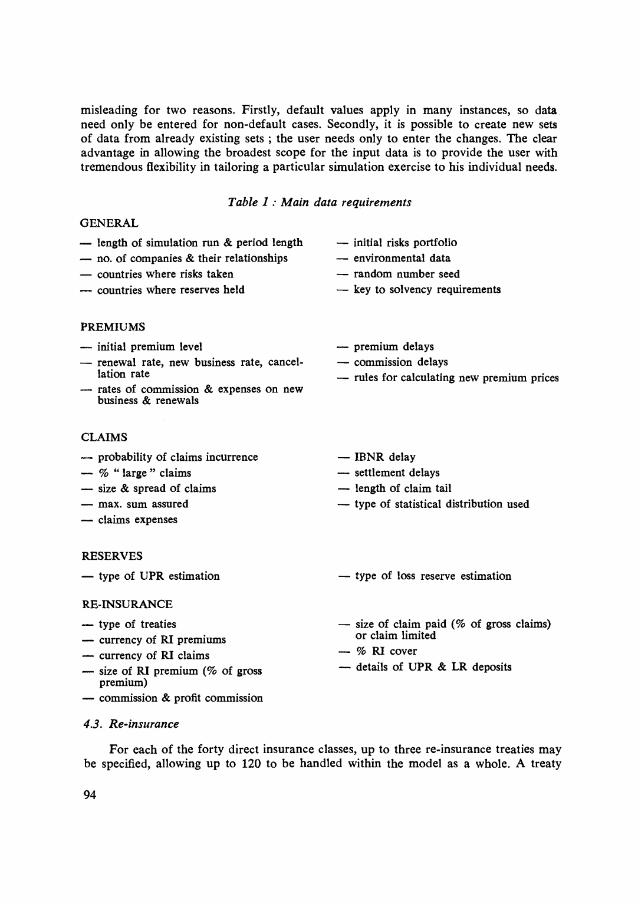
misleading for two reasons. Firstly, default values apply in many instances, so dataneed only be entered for non-default cases. Secondly, it is possible to create new setsof data from already existing sets; the user needs only to enter the changes. The clearadvantage in allowing the broadest scope for the input data is to provide the user withtremendous flexibility in tailoring a particular simulation exercise to his individual needs.
Table I Main data requirementsGENERAL- length of simulation run & period length- no. of companies & their relationships- countries where risks taken- countries where reserves held
PREMIUMS- initial premium level- renewal rate, new business rate, cancel-
lation rate- rates of commission & expenses on new
business & renewals
CLAIMS
- probability of claims incurrence- % "large" claims- size & spread of claims- max. sum assured
claims expenses
RESERVES
- type of UPR estimation
RE-INSURANCE- type of treaties- currency of RI premiums- currency of RI claims- size of RI premium (% of gross
premium)- commission & profit commission
4.3. Re-insurance
94
- initial risks portfolio- environmental data- random number seed- key to solvency requirements
- premium delays- commission delays- rules for calculating new premium prices
- IBNR delay- settlement delays- length of claim tail- type of statistical distribution used
- type of loss reserve estimation
- size of claim paid (% of gross claims)or claim limited
- % RI cover- details of UPR & LR deposits
For each of the forty direct insurance classes, up to three re-insurance treaties maybe specified, allowing up to 120 to be handled within the model as a whole. A treaty

may be quota share, surplus, or excess of loss (with or without stability clauses).Table 1 again indicates the wide range of input data options available to the user formodelling re-insurance operations.
4.4. Countries and currenciesThe model can handle up to twenty countries of operations, and up to twenty
currencies. Moreover, it is not necessary for countries and currencies to match upwhen dealing with the insurance or re-insurance operations. It would be quite feasiblefor dollar business to be written by a UK company, with any claims that result beingpaid in Swiss francs.
4.5. Operating environment
The user can describe fully the operating environment for each country of opera-tion, and does this by entering data on interest rates, inflation, exchange rates, shareprices, taxes, transaction costs, growth rates, and so on. An attractive feature of themodel is the INTERPOLATOR system used to interpret environmental data. Thissystem, which is depicted in Fig. 7, greatly simplifies the task faced by the user ofdescribing a particular scenario. For a given environmental variable, for example, aninterest rate, the user need only enter data for the points in simulation time wherethe slope of that variable changes ; the interpolator will calculate all the intermediatevalues automatically. Fig. 7 a shows the case where a variable stays constant at 10 %throughout the eight time periods of a simulation. In this case the user only enterstwo figures, each 10, indicating the value at the beginning and at the end of the simula-tion. Fig. 7 b shows an example where the variable stays at 10 % for the first three
Fig. 7: The interpolating system used for environmental data
a) No Interpolation pointsDATA INFLT/0,0,.../,EINFLT/10,10,.../
20
0
t...95
IInflation
rate 10 K
0 1. 2 3 4 5 6 7 8

b) One Interpolation pointDATA INFLT/1,3,0,.../,EINFLT/10,10,20,.../
IInflationxa te
20
10
96
1. 2 3 4 5 6 7 8t-,..
Here, the data specifies 1 interpolation point at period 3 to givean intermediate figure between the beginning and end figures.
periods, and then moves through 12 %, 14 %, 16 %, 18 % before finally reaching 20 %at the end of the simulation. Despite this more complex pattern, the user need onlyenter two extra numbers to fix an interpolation point at period 3 ; the computer willcalculate the remaining figures. The great advantage conferred by the interpolatorsystem is that it eases the data requirement, especially for simulation exercises coveringan extensive time span.
4.6. Simulation time
It is possible to specify any fixed length of simulation run, or alternatively to runa simulation until some specified contingency occurs, for example, a company becominginsolvent. Thus, fixed span simulation exercises can be carried out, or a company ormarket can be "tested to destruction ". Although the basic time unit within the modelis one year, it is possible to carry out simulations with a semi-annual or quarterlytime-step.
Printed reports from the model cover claim settlement analyses, detailed under-writing performance, balance sheets, key ratios, summary financial statistics, and timeseries listings.
With the features that have been described in the preceding paragraphs it ispossible to carry out a wide range of simulations ranging from a "quick and dirty"summary exercise to detailed "in-depth" studies. Above all, the scope of the modelensures flexibility at all times.