assessing changes in ecosystem functioning and services...
TRANSCRIPT

2016
UNIVERSIDADE DE LISBOA
FACULDADE DE CIÊNCIAS
DEPARTAMENTO DE BIOLOGIA ANIMAL
Assessing changes in ecosystem functioning and services via
functional traits of an estuarine fish assemblage
Mestrado em Ecologia Marinha
Margarida Avillez Ataíde Oliveira Monteiro
Dissertação orientada por:
Doutora Rita Vasconcelos
Doutora Sofia Henriques

ii
“Look deep into nature, and then you will understand everything better.”
Albert Einstein

ACKNOWLEDGEMENTS
iii
Acknowledgements
I couldn’t have finished this master thesis without thanking all the people that made it possible and
were present through my path, particularly: Doutora Rita Vasconcelos for accepting me as a master student, for all the support during this study, all
the patience and suggestions, and availability to clarify my questions;
Doutora Sofia Henriques for accepting me as a master student, for all the support during this study, all
the advices and sincerity, and availability to clarify my questions;
Doutor Filipe Martinho for showing me the Mondego estuary, providing important data to my analysis,
and all the help through this study;
Doutora Marina Dolbeth for all the support, suggestions and for clarifying my doubts;
Fábio Monteiro for sharing this road through master thesis, for being my colleague, all the support and
amusement, and all the help;
Irina Duarte, for all the advices and companionship;
All the teachers who inspired me and opened my eyes during my times in college;
My friends, for all the support and for keeping my head up;
My family, especially my parents and my grandmother, who gave me support during all this work;
And last but not the least, my dog Shot, who was there for me every time, being the best friend in the
world.
Research was funded with project PTDC/MAR/117119/2010, MARE with project
UID/MAR/04292/2013, S. Henriques and Marina Dolbeth with Post-Doc grant (respectively
SFRH/BPD/94320/2013 and SFRH/BPD/110441/2015), R.P. Vasconcelos and Filipe Martinho with
Investigador FCT Programme through funds from the European Social Fund and the Portuguese
Operational Human Potential Program (respectively IF/00058/2013 and IF/01410/2012), all from
Fundação para a Ciência e a Tecnologia.


ABSTRACT AND KEYWORDS
v
Abstract
Biodiversity loss is a pressing global issue. Yet, there is limited knowledge on the consequences of
species loss for ecosystem functioning and services. The main objective of this study was to assess the
potential influence on the provision of ecosystem services exerted by an estuarine fish assemblage via
functional traits, and possible temporal and spatial variations.
To explore links between fish biodiversity and ecosystem functioning and services we reviewed the
literature for evidence on relationships between fish functional traits (e.g. body size, diet) and ecosystem
service provision to humankind (e.g. nutrient cycling and biological control). Additionally, we used a
time-series data on an estuarine fish assemblage (Mondego estuary, Portugal, sampled between 2003 and
2013) as a practical case-study for further developing our approach. For each fish species we assembled
data on five functional traits and identified functional groups of species (e.g. through hierarchical cluster
analysis). We characterized the potential contribution of the Mondego fish assemblage to the functioning
of the ecosystem and its service provision. In addition, we determined the degree of functional redundancy
in the fish assemblage, towards an evaluation of the degree of resilience of this assemblage in contributing
to ecosystem functioning and service provision.
The most important functional traits identified in the literature review to regulating services were
feeding mode, diet and body size and their effects depended on both service and ecosystem. We identified
seven functional groups in the fish assemblage, with potential to contribute to all regulating services
analysed, except air purification, namely: nutrient cycling, coastal protection and disturbance prevention,
maintenance of sediment processes and sediment redistribution, biological control, climate regulation,
waste treatment and assimilation and regulation of linkages between ecosystems. However, this
contribution was not equal for all groups, as each one was linked to specific services and differently
represented in the fish assemblage. Also, fish functional groups showed spatial and inter-annual variation,
which is probably associated with environmental conditions. The majority of fish functional traits
measures were significantly correlated with salinity, temperature and oxygen and showed strong spatial
and annual variation, despite a weak seasonal variation. Functional redundancy of the fish assemblage
showed spatial and seasonal variations, which may be related with differences in abundance of species
between stations, probably due to different environmental conditions, and seasons, which influence
recruitment periods of some species. The annual functional redundancy differed between groups, with
group 7 showing null values, possibly being the most vulnerable group to disturbance, and groups 5 and 6
showing the highest values, which may mean they contribute in a more resilient manner to the the
provision of ecosystem services such as waste treatment and assimilation and climate regulation.
This study is the first one to assess the provision of ecosystem services by the fish assemblage of the
Mondego estuary through their functional traits and estimate their resilience. Future studies should
develop the quantification of ecosystem services provided by fish in ecological and economical
perspectives, assess the impacts of anthropogenic pressures in functional composition of fish assemblages
and thus in the ecosystem services they can provide, and also estimate the resilience of those fish
assemblages, which is essential to prioritize conservation efforts of fish assemblages and safeguard the
services they provide.

ABSTRACT AND KEYWORDS
vi
Keywords: fish assemblage; estuaries; ecosystem services; functional traits; resilience

RESUMO E PALAVRAS-CHAVE
vii
Resumo
A perda de biodiversidade é um problema urgente à escala global. Contudo, o conhecimento sobre as
consequências da perda de espécies para o funcionamento e serviços dos ecossistemas é limitado. O
principal objectivo deste estudo foi avaliar a potencial influência na provisão de serviços de ecossistema
exercida por uma associação de peixes estuarinos através das características funcionais, e as suas possíveis
variações temporais e espaciais.
Para explorar as ligações entre a biodiversidade de peixes e o funcionamento e serviços de ecossistema,
fizemos uma revisão da literatura para encontrar evidências de relações entre características funcionais de
peixes (e.g. tamanho do corpo, dieta) e o funcionamento de ecossistemas/provisão de serviços à
humanidade (e. g. reciclagem de nutrientes e controlo biológico). Adicionalmente, usámos uma série
cronológica da composição taxonómica de uma associação de peixes estuarina (estuário do Mondego,
Portugal, amostrada entre 2003 e 2013) como caso prático de estudo para desenvolver a nossa abordagem.
Para cada espécie de peixe, reunimos dados acerca de cinco características funcionais e identificámos
grupos funcionais de espécies (e.g. através de análise hierárquica de agrupamento). Caracterizámos a
contribuição da associação de peixes do Mondego para o funcionamento do ecossistema e a sua provisão
de serviços. Além disso, determinámos o nível de redundância funcional da associação de peixes, para
uma avaliação do grau de resiliência desta associação ao contribuir para o funcionamento do ecossistema e
provisão de serviços.
As características funcionais mais importantes identificadas na revisão de literatura para os serviços de
regulação foram o modo de alimentação, a dieta e o tamanho do corpo e os seus efeitos dependem do
serviço e do ecossistema. Identificámos sete grupos funcionais na associação de peixes, com potencial
para contribuir para todos os serviços reguladores de ecossistema, excepto purificação do ar,
nomeadamente: reciclagem de nutrientes, protecção da costa e prevenção de perturbações, manutenção de
processos sedimentares e de redistribuição sedimentar, controlo biológico, regulação do clima, tratamento
e assimilação de desperdícios e regulação de ligações entre ecossistemas. No entanto, esta contribuição
não foi igual para todos os grupos, já que cada um está ligado a serviços específicos e diferentemente
representado na associação de peixes. Além disso, os grupos funcionais de peixes mostraram variação
espacial e inter-anual, o que está provavelmente associado a condições ambientais. A maioria das medidas
de características funcionais das espécies foram significativamente correlacionadas com a salinidade,
temperatura e oxigénio e mostraram uma forte variação espacial e anual, apesar de uma fraca variação
sazonal. A redundância funcional da associação de peixes mostrou variação espacial e sazonal, o que pode
estar relacionado com diferenças na abundância de espécies entre estações de amostragem, provavelmente
devido a diferentes condições ambientais e estações do ano, que influenciam os períodos de recrutamento
de algumas espécies. A redundância funcional média anual variou entre grupos, com o grupo 7 a mostrar
valores nulos, sendo possivelmente o grupo mais vulnerável a perturbações e os grupos 5 e 6 a mostrar os
valores mais altos, o que pode significar que eles contribuem de uma maneira mais resiliente para a
provisão de serviços de ecossistema como o tratamento e assimilação de desperdícios e a regulação do
clima.
Este estudo foi o primeiro a avaliar a provisão de serviços de ecossistema relacionados com a
associação de peixes do estuário do Mondego através das suas características funcionais e a estimar a sua
resiliência. Estudos futuros deverão desenvolver a quantificação de serviços de ecossistema fornecidos por

RESUMO E PALAVRAS-CHAVE
viii
peixes do ponto de vista ecológico e económico, avaliar os impactos das pressões antropogénicas na
composição funcional de associações de peixes e nos serviços de ecossistema que elas conseguem
fornecer, e também estimar a resiliência dessas associações de peixes, a qual é essencial para prioritizar
esforços de conservação em associações de peixes e salvaguardar os serviços que elas fornecem.
Palavras-chave: associação de peixes; estuários; serviços de ecossistema; características funcionais;
resiliência

RESUMO ALARGADO E PALAVRAS-CHAVE
ix
Resumo alargado
A biodiversidade de organismos a todos os níveis (taxonómico, funcional e genético) é essencial para o
ser humano, fornecendo recursos naturais e afectando processos ecológicos importantes (e.g. produção de
biomassa e fotossíntese), que controlam os fluxos de nutrientes, energia e matéria orgânica pelo ambiente,
além de mediarem o fornecimento de serviços de ecossistema. Os serviços de ecossistema são as
contribuições directas e indirectas dos ecossistemas para o bem-estar humano e podem ser de vários tipos,
conforme a classificação usada – de acordo com a Economia dos Ecossistemas e Biodiversidade são:
provisão, regulação, cultural e de habitat. A biodiversidade tem um papel fundamental no fornecimento de
serviços de ecossistema, e especialmente as características funcionais dos organismos, isto é, as que
influenciam directamente o seu desempenho e são mensuráveis ao nível individual (e.g. tamanho do corpo
e mobilidade) são muito úteis para descrever a contribuição das espécies para o funcionamento dos
ecossistemas e para a entrega de serviços de ecossistema.
A sobre-exploração de recursos naturais pelo ser humano, bem como outras actividades
antropogénicas, tem levado à degradação dos ecossistemas e a alterações na estrutura e composição das
comunidades biológicas, o que afecta o funcionamento dos ecossistemas e diminui a sua capacidade de
fornecimento de serviços. Assim, torna-se necessário compreender até que ponto é que os ecossistemas
podem absorver perturbações e conseguir manter as suas características essenciais, capacidade esta a que
se dá o nome de resiliência.
Os estuários são sistemas de transição entre água doce e salgada, que constituem importantes habitats
para espécies de peixes, oferecendo refúgio de predadores, áreas de viveiro e pontos de passagem para
migrações, além de zonas de reprodução e alimentação. Em geral, os sistemas estuarinos apresentam
flutuações nas suas condições ambientais, o que leva a que as comunidades que neles habitam apresentem
uma certa capacidade de adaptação. Contudo, por apresentarem elevada produtividade, são também
intensamente explorados pelas populações humanas, o que tem vindo a comprometer a sua integridade e a
alterar as suas comunidades biológicas.
Este estudo pretendeu avaliar a influência na provisão de serviços de ecossistema exercida por uma
associação de peixes de um estuário através das suas características funcionais, bem como a sua variação
espacial e temporal. Como caso de estudo, considerou-se a associação de peixes do estuário do Mondego,
a qual tem sido monitorizada há mais de uma década. Especificamente, os objectivos foram: obter
informação sobre ligações entre características funcionais de peixes e a provisão de serviços de
ecossistema (com base numa revisão de literatura); identificar grupos funcionais de peixes dentro do
estuário do Mondego (grupos de espécies com características funcionais semelhantes) e a sua possível
contribuição para a provisão de serviços reguladores de ecossistema; investigar padrões de variação das
características funcionais dos peixes e dos grupos funcionais e sua relação com os factores ambientais
subjacentes; explorar a resiliência dos serviços de ecossistema fornecidos pela associação de peixes
através do cálculo da redundância funcional (número de espécies que desempenham funções semelhantes).
A revisão de literatura permitiu identificar ligações entre características funcionais de peixes e a
provisão de serviços reguladores de ecossistema, embora a maioria das ligações fosse indirecta. As
características funcionais com maior número de ligações a este tipo de serviços foram o modo de
alimentação, a dieta e o tamanho do corpo. Os serviços reguladores de ecossistema com maior número de
ligações a características funcionais foram a reciclagem de nutrientes, a protecção costeira e prevenção de
perturbações, o controlo biológico e a regulação de ligações entre ecossistemas. Após a caracterização

RESUMO ALARGADO E PALAVRAS-CHAVE
x
funcional da associação de peixes em estudo, tendo em conta cinco características funcionais (mobilidade,
tamanho do corpo, dieta, modo de aquisição do alimento e preferência de salinidade), bem como uma
análise hierárquica de agrupamento, foram identificados sete grupos funcionais de peixes no estuário do
Mondego, com capacidade para fornecer diferentes serviços reguladores de ecossistema: reciclagem de
nutrientes, controlo biológico, manutenção de processos sedimentares e de redistribuição de sedimentos,
protecção costeira e prevenção de perturbações, regulação do clima, tratamento e assimilação de
desperdícios e regulação de ligações entre ecossistemas. No estuário do Mondego, a comunidade de peixes
parece influenciar de forma mais importante os seguintes serviços de ecossistema: a reciclagem de
nutrientes, o controlo biológico, a regulação do clima e o tratamento e assimilação de desperdícios. Para
todas as análises relativas à associação de peixes e grupos funcionais, foram consideradas três medidas:
biomassa, densidade e número de espécies. As variações dos grupos funcionais observadas na análise
foram sobretudo temporais e espaciais, o que estará provavelmente relacionado com alterações nos
padrões climatéricos ao longo do período de amostragem (no primeiro caso) e com diferentes condições
ambientais nos locais de amostragem, sobretudo em relação à salinidade, temperatura e oxigénio (no
segundo caso). No entanto, também foram observadas variações sazonais para alguns grupos funcionais,
ainda que menores, que podem estar relacionadas com a temperatura e períodos de recrutamento, já que
estes grupos contêm espécies marinhas migradoras e que utilizam o estuário como zona de viveiro.
A relação entre as características funcionais e as variáveis ambientais (salinidade, temperatura,
percentagem de oxigénio dissolvido, precipitação, escoamento e índice NAO) foi explorada através de
modelos lineares generalizados e modelos de partição hierárquica de variância. Estas análises
evidenciaram uma pequena influência significativa da salinidade, temperatura e oxigénio e especialmente
uma elevada percentagem de variação explicada sobretudo pelo local e ano. Para a maioria das
características funcionais, o ano de 2003 foi o ano com valores mais elevados e o ano de 2006 foi o ano
em que se registaram valores mais baixos - o que poderá estar relacionado com a baixa salinidade (devida
a forte precipitação) e com o facto de a maioria das espécies do estuário do Mondego serem marinhas.
Finalmente, foi avaliada a redundância funcional desta associação de peixes com o objectivo de avaliar
a resiliência da influência desta comunidade no fornecimento de serviços reguladores de ecossistema. A
redundância funcional da associação de peixes em estudo variou sazonal e espacialmente, com valores
mais elevados na primavera e no local de amostragem mais a montante. Em relação aos sete grupos
funcionais desta associação, a redundância funcional (média anual) foi mais elevada para os grupos 5 e 6
(os que apresentam maior densidade, biomassa e riqueza) e mais baixa para os grupos 1 e 4, com o grupo
7 a mostrar valores nulos, o que poderá significar que é o grupo menos resiliente e cuja provisão de
serviços será mais afectada com a perturbação e perda de espécies. Assim, os serviços de ecossistema mais
resilientes nesta associação de peixes serão os fornecidos pelos grupos 5 e 6, nomeadamente: tratamento e
assimilação de desperdícios, regulação do clima, reciclagem de nutrientes e controlo biológico. No
entanto, o grupo 6 também tem capacidade para fornecer outros serviços de ecossistema, como a protecção
costeira e prevenção de perturbações, manutenção de processos sedimentares e redistribuição de
sedimentos e regulação de ligações entre ecossistemas, o que pode aumentar a resiliência destes serviços.
No entanto, isto depende do funcionamento do ecossistema, o qual é condicionado por múltiplas variáveis,
incluindo a resposta das espécies à perturbação e as interacções entre espécies, aspectos estes que deverão
ser investigados em estudos futuros.
Este estudo constitui uma abordagem ao estudo da relação entre as características funcionais de uma
comunidade de peixes estuarinos e o fornecimento dos serviços de ecossistema que poderá ser facilmente
aplicada a outros estuários e constitui um passo importante para a compreensão da influência da

RESUMO ALARGADO E PALAVRAS-CHAVE
xi
biodiversidade sobre o bem-estar humano. Além disso, ao avaliar a redundância funcional para esta
associação de peixes, este estudo permitiu estimar o seu grau de resiliência, o que é importante para a sua
conservação e para a manutenção do funcionamento deste ecossistema. A estimativa do grau de resiliência
distinguiu os serviços de ecossistema mais importantes no estuário e a capacidade de manutenção de
serviços pelos grupos funcionais da associação de peixes estudada. Os grupos funcionais com maiores
valores de biomassa, densidade e número de espécies mostraram ser os mais resilientes na provisão de
serviços de ecossistema, o que mostra a influência da quantidade de espécies para a redundância funcional
e consequentemente para a resiliência de serviços de ecossistema.
No futuro, deverão ser realizados mais estudos sobre ligações entre peixes e serviços de ecossistema
(especialmente porque este grupo biológico é muito afectado pela pesca e por alterações ambientais)
nomeadamente para o desenvolvimento de outras formas de quantificação directa de serviços de
ecossistema fornecidos por peixes. É ainda importante investigar directamente os efeitos de pressões
antropogénicas na composição funcional das comunidades de peixes e consequentemente no
funcionamento dos ecossistemas.
Palavras-chave: associação de peixes; estuários; serviços de ecossistema; características funcionais;
resiliência


TABLE OF CONTENTS
xiii
TABLE OF CONTENTS
ACKNOWLEDGEMENTS iii
ABSTRACT AND KEYWORDS v
RESUMO E PALAVRAS-CHAVE vii
RESUMO ALARGADO E PALAVRAS-CHAVE ix
CHAPTER 1 1
General introduction
CHAPTER 2 11
Assessing temporal variation on ecosystem functioning and services via functional traits of an
estuarine fish assemblage
CHAPTER 3 61
Final Remarks
APPENDIX I 71
APPENDIX II 75
APPENDIX III 83


LIST OF FIGURES
xv
LIST OF FIGURES
Figure 2.1 - The Mondego estuary, with the location of the five sampling sites. 17
Figure 2.2 - Illustration of fish traits and ecosystem services general relationships. Green arrows indicate
positive relationships and red arrows indicate negative relationships between each trait and ecosystem
service. 21
Figure 2.3 – Variation of salinity in the Mondego estuary. 26
Figure 2.4 – Variation of temperature in the Mondego estuary. 26
Figure 2.5 - Variation of oxygen in the Mondego estuary. 27
Figure 2.6 – Variation of precipitation and runoff in the Mondego estuary. 27
Figure 2.7 - Dendrogram produced by cluster analysis of the fish assemblage of the Mondego estuary
based on five traits (mobility, body size, diet, feeding mode and salinity preference). 28
Figure 2.8 - Variation of fish functional groups (quantified by the sum of cumulative biomass of a group in
all samples) in the Mondego estuary. A – Spatial variation. B – Seasonal variation. C – Temporal
variation. 30
Figure 2.9 – Variation of fish functional groups (quantified by the sum of cumulative density of a group in
all samples) in the Mondego estuary. A – Spatial variation. B – Seasonal variation. C – Temporal
variation. 30
Figure 2.10 – Variation of fish functional groups (quantified by the sum of the cumulative number of
species of a group in all samples) in the Mondego estuary. A – Spatial variation. B – Seasonal variation.
C – Temporal variation. 31
Figure 2.11 – Principal Coordinates Analysis comparing the fish assemblage of the Mondego estuary
based on five traits: mobility, body size, diet, feeding mode and salinity preference (Mobility categories:
Mobhigh – high; MobMed – medium; Mobterrit – territorial; Mobsedent – sedentary. Body size
categories: BodsizLarge – large; BodsizMed – medium; BodsizSmall – small; BodsizVsmall – very small.
Diet categories: DietPla – planktivorous; DietInv – invertebrate feeders; DietOmn – omnivorous;
DietMac – macrocarnivorous; DietDet – detritivorous. Feeding mode categories: FmodeBro – browsers;
FmodeFil – filterers; FmodeHun – hunters). Salinity preference categories are represented by Marine,
Brackish and Freshwater (0 – no; 1 – yes). Species names are abbreviated. See full species names in
Figure 2.7 (the abbreviation includes the first three letters of both genus and species). 32

LIST OF TABLES
xvi
LIST OF TABLES
Table 2.1 - List of the fish functional traits compiled for all species. 19
Table 2.2 - Summary of fish traits and ecosystem services relationships. Response trend is given
within parentheses (+ for positive or – for negative). The classification of ecosystem services was
adapted from Holmlund and Hammer (1999), de Groot et al. (2010) and Hattam et al. (2015). 23
Table 2.3 - PERMANOVA results for the differences in biomass of each functional group
concerning factors season, station and year. For each test the mean, standard deviation (SD) and p-
value - P(perm) - are represented (* for p-value < 0.05, NS for non-significant p-value). 34
Table 2.4 - PERMANOVA results for the differences in density of each functional group
concerning factors season, station and year. For each test the mean, standard deviation (SD) and p-
value - P(perm) - are represented (* for p-value < 0.05, NS for non-significant p-value). 35
Table 2.5 - PERMANOVA results for the differences in species number of each functional group
concerning factors season, station and year. For each test the mean, standard deviation (SD) and p-
value - P(perm) - are represented (* for p-value < 0.05, NS for non-significant p-value). 36
Table 2.6 - Generalized Linear Model (GLM) fitted to the response of traits (in biomass) to
environmental variables. The table presents for each variable: Sig - the significance of the variable
in a full Generalized Linear Model (* p-value < 0.05), % - percentage of variance explained by the
variable and C - coefficient signal (+ or -) estimated in Hierarchical Partition of Variance. Two
alternative models were fitted for each trait: with and without factors (season, station, year),
represented by A and B, respectively. 38
Table 2.7 - Generalized Linear Model (GLM) fitted to the response of traits (in density) to
environmental variables. The table presents for each variable: Sig - the significance of the variable
in a full Generalized Linear Model (* p-value < 0.05), % - percentage of variance explained by the
variable and C - coefficient signal (+ or -) estimated in Hierarchical Partition of Variance. Two
alternative models were fitted for each trait: with and without factors (season, station, year),
represented by A and B, respectively. 39
Table 2.8 - Generalized Linear Model (GLM) fitted to the response of traits (in number of species)
to environmental variables. The table presents for each variable: Sig - the significance of the
variable in a full Generalized Linear Model (* p-value < 0.05), % - percentage of variance
explained by the variable and C - coefficient signal (+ or -) estimated in Hierarchical Partition of
Variance. Two alternative models were fitted for each trait: with and without factors (season,
station, year), represented by A and B, respectively. 40
Table 2.9 - Functional redundancy (FR) by season, station and year for total biomass of species and
for each functional group, represented by mean, standard-deviation (SD) and p-value from
PERMANOVA (* for p-value < 0.05, NS for non-significant p-value. 42

LIST OF TABLES
xvii
Table 2.10 - Functional redundancy (FR) by season, station and year for total density of species and
for each functional group, represented by mean, standard-deviation (SD) and p-value from
PERMANOVA (* for p-value < 0.05, NS for non-significant p-value). 43


1
CHAPTER 1 General introduction


CHAPTER 1
3
General introduction
Biodiversity is currently understood as the “variability among living organisms and their habitats from
all sources, including diversity within species, between species and within entire ecosystems” (Pinto et al.
2014) and considering all components – taxonomic, functional and phylogenetic diversity (Purschke et al.
2013). It is crucial to human welfare, both directly and indirectly, as it provides natural resources (e.g.
food and drinkable water) and also affects important ecosystem functions (i. e. ecological processes that
control the fluxes of energy, nutrients and organic matter through the environment; Cardinale et al. 2012),
such as biomass production and soil formation, which mediate the provision of ecosystem services (Daily
1997; Díaz et al. 2006).
Ecosystem services (ES) constitute “the direct and indirect contributions of ecosystems to human well-
being” (de Groot et al. 2010) and are essential to human survival (Kremen 2005). It is therefore necessary
to classify them in a comprehensive way (Atkins et al. 2011). According to the Millennium Ecosystem
Assessment (2005), there are four types of ecosystem services: provisioning (e.g. food and drinkable
water), regulating (e.g. climate regulation and water purification), cultural (e.g. aesthetic and recreational
values) and supporting (e.g. nutrient cycling and primary production). However, this classification has
been challenged, for example, for considering supporting services as directly beneficial to humans, when
they actually constitute a basic support to the provision of other services (Böhnke-Henrichs et al. 2013).
Since then, other classifications have been developed (Beaumont et al. 2007; Fisher et al. 2009; de Groot
et al. 2010; Atkins et al. 2011; Böhnke-Henrichs et al. 2013; Liquete et al. 2013; Hattam et al. 2015),
which have gained more consensus, including the one from de Groot et al. (2010), which classifies
ecosystem services in four categories: provisioning, regulating, cultural and habitat. This last category
includes the services of life cycle maintenance of migratory species and gene pool protection, which are
dependent of the state of the habitat (de Groot et al. 2010). There has been an evolution of knowledge
about ecosystem services in recent decades (Farber et al. 2006; Worm et al. 2006; Boyd & Banzhaf 2007;
Wallace 2007; Liquete et al. 2013), which is important for conservation and management purposes
(Costanza et al. 1997).
Several approaches have been developed to clarify the relationship between biodiversity and ecosystem
services, exploring the contribution of habitats (Chan et al. 2006) and the roles of individual species and
groups of species in ecosystem functioning (Hooper et al. 2005; Díaz et al. 2007; Luck et al. 2009;
Harrison et al. 2014). Moreover, according to Luck et al. (2009), it is necessary to identify the organisms
and their characteristics that are linked with the provision of services and also determine how changes in
these organisms affect those services. In this sense, functional traits (i.e. characteristics of organisms
directly influencing the organism's performance, for example body size and mobility; Mouillot et al.
2012) are useful predictors to describe links between species, ecosystem functioning and ecosystem
service delivery (Lavorel & Garnier 2002; Díaz et al. 2004; Hooper et al. 2005; de Bello et al. 2010;
Harrison et al. 2014; Gagic et al. 2015). These linkages have been predominantly studied for some groups
of organisms such as plants, for which there is abundant evidence of associations between traits and
services (de Bello et al. 2010).
There has been a considerable increase in the number of studies investigating the complex role of
biodiversity (chiefly species richness) on ecosystem functioning (Worm et al. 2006; Lefcheck et al. 2015),
as well as regarding the influence of species traits in the functional structure of ecosystems (de Bello et al.

CHAPTER 1
4
2010; Cardinale et al. 2012; Gagic et al. 2015) and on ecosystem functioning and the provision of
ecosystem services (Balvanera et al. 2006; Harrison et al. 2014). Some studies developed the concept of
functional groups – groups of species with similar functional traits – which is useful in the context of
evaluating the provision of ecosystem services since groups can be defined based on functional traits that
are important to services of interest (Lavorel et al. 1997; McGrady-Steed et al. 1997; Gerino et al. 2003;
Luck et al. 2009; García-Llorente et al. 2011). For example, García-Llorente et al. (2011) showed the
potential contribution of each functional group of aquatic plants to the delivery of ecosystem services such
as provisioning of medicine resources, aesthetic values, consumption by livestock, and water filtration.
Also, Gerino et al. (2003) assigned macro-invertebrates into functional groups considering different types
of aquatic sediments, which contributed to a better understanding of ecological processes such as
bioturbation (i.e. “reworking and mixing of sediment at the sediment-water interface, accomplished by
activities of benthic organisms, which alter the structure and properties of sediment and influence the
transport of solutes and particulate matter"; Adámek & Maršálek 2013) which mediates the maintenance
of sediment processes, according to Holmlund and Hammer (1999).
The increasing degradation of ecosystems due to anthropogenic activities and over-exploitation of
natural resources lead to alterations in the structure and composition of biological communities (Kremen
2005; Díaz et al. 2006). Moreover, these human-induced alterations can originate loss of key species that
perform particular functions on which important ecosystem processes such as bioturbation and primary
productivity (Solan et al. 2004) depend, which can decrease the capacity of ecosystems to provide
essential services (Mouillot et al. 2013; Pratchett et al. 2014). Thus, it is necessary to estimate the capacity
of ecosystems to absorb disturbance and retain their essential characteristics - meaning estimating their
ecological resilience (Holling 1973). Elmqvist et al. (2003) emphasizes the role of biodiversity for
ecosystem resilience in the face of undergoing change, as also referred by Walker (1992) and Norberg et
al. (2001). Moreover, it is currently widely accepted that, in addition to taxonomic-based diversity indices,
functional and phylogenetic diversity should be studied in order to assess ecosystem resilience (Meynard
et al. 2011; Gagic et al. 2015). In this context, different approaches have been developed, for example,
suggesting that resilience of ecosystems depends on the variety and distribution of functional groups
(Peterson et al. 1998; Gunderson 2000) and on diversity of species within these groups (Luck et al. 2003).
Furthermore, Mouillot et al. (2014) highlighted the role of functional redundancy (i.e. the number of
different species that perform similar ecological functions; Micheli & Halpern 2005) in preserving
ecosystem functioning after decrease of species diversity. Also, the response of species with similar
functions to environmental variation – called “response diversity” - is also crucial to ecosystem resilience
(Elmqvist et al. 2003; Folke et al. 2004), because if all these species are equally vulnerable to disturbance,
functional redundancy is not sufficient to maintain ecosystem functioning (Hughes et al. 2005; Muntadas
et al. 2016). For instance, rare species may have an important role in this process, since they can share
similar functional traits with common species but may respond differently to stress (Boero 1994; Walker
et al. 1999; Lyons et al. 2005; Mouillot et al. 2013). Although it is still difficult to measure resilience,
certain indicators can be used to estimate it, such as functional diversity (Peterson et al. 1998; Elmqvist et
al. 2003), functional redundancy (de Bello et al. 2007; van der Linden et al. 2012; Mouillot et al. 2014;
Muntadas et al. 2016) and functional vulnerability (i.e. potential decrease of functional diversity after
species loss; Mouillot et al. 2014). Moreover, it is important to consider the capacity of adaptation by
species, which can change their functional roles in different environmental contexts (Wellnitz & Poff
2001).

CHAPTER 1
5
Estuaries are transitional systems that are extremely productive and valuable for human society, being
highly explored (Costanza et al. 1997; Kennish 2002; Barbier et al. 2011). Also, they are significantly
important for fish communities, since they provide reproduction habitats, nursery grounds, migratory
routes and protection from predators (Beck et al. 2001; Martinho et al. 2008; Baptista et al. 2013; Fonseca
et al. 2013) being essential to the maintenance and regeneration of numerous fishery resources (Nicolas et
al. 2007; Vasconcelos et al. 2011). However, these systems are subject to high anthropogenic pressure and
environmental alterations, which are increasingly deteriorating their integrity and also affecting important
ecological processes, such as biogeochemical cycling and flux regulation of water and pollutants (Kennish
2002; Borja et al. 2010; Barbier et al. 2011). The loss of large predators and herbivorous species, habitats
for reproduction and filtering capacity are some of the changes in structure and functioning that result
from over-exploitation and degradation of estuarine systems (Lotze et al. 2006), and that affect the
delivery of critical ecosystem services, such as sustainable fisheries, provision of nursery habitats,
cleansing processes and shoreline protection (Worm et al. 2006; Barbier et al. 2011; Rodrigues & Pardal
2015). Therefore, the conservation of these habitats is critical in ecosystem management (Beck et al. 2001;
Nicolas et al. 2007).
Fishes are a key component of biodiversity in estuaries. They display a wide range of functional traits
and behaviors, being involved in numerous ecological processes (Villéger et al. 2012). Besides, fishes can
be considered relevant ecological indicators of estuarine conditions at various scales (Whitfield & Elliott
2002; Nicolas et al. 2010). In these systems, fish communities include estuarine resident species, marine
and freshwater species that come into estuaries adventitiously or as migrants, and also diadromous and
amphidromous species (Elliott et al. 2007; Vasconcelos et al. 2015). The structure of fish communities
can be considered as being shaped by geographical localization as well as by a set of environmental
variables including salinity and temperature (Whitfield & Elliott 2002; Vasconcelos et al. 2015; Henriques
et al. 2016), but the main driver influencing the assemblages´s structure within estuaries is their
longitudinal salinity gradient (Whitfield et al. 2012; Vasconcelos et al. 2015).
The main goal of this study is to assess the potential provision of ecosystem services by an estuarine
fish assemblage (by characterizing its functional traits) and also possible temporal variations using the
Mondego estuary as a case study since it has been monitored systematically throughout the last decade.
This approach should improve the understanding about the importance of fish in regulating ecosystem
functions and in generating ecosystem services derived from these transitional systems. The study
ultimately aims to contribute to enable the protection and sustainable management of estuaries in a world
increasingly impacted by Humans especially in coastal areas.
Literature cited
Adámek Z. & Maršálek B. (2013). Bioturbation of sediments by benthic macroinvertebrates and fish
and its implication for pond ecosystems: a review. Aquaculture International, 21: 1-17.
Atkins J.P., Burdon D., Elliott M. & Gregory A.J. (2011). Management of the marine environment:
integrating ecosystem services and societal benefits with the DPSIR framework in a systems approach.
Marine Pollution Bulletin, 62: 215-226.
Balvanera P., Pfisterer A.B., Buchmann N., He J.S., Nakashizuka T., Raffaelli D. & Schmid B. (2006).
Quantifying the evidence for biodiversity effects on ecosystem functioning and services. Ecology Letters,
9: 1146-1156.

CHAPTER 1
6
Baptista J., Pato P., Pereira E., Duarte A.C. & Pardal M.A. (2013). PCBs in the fish assemblage of a
southern European estuary. Journal of Sea Research, 76: 22-30.
Barbier E.B., Hacker S.D., Kennedy C., Koch E.W., Stier A.C. & Silliman B.R. (2011). The value of
estuarine and coastal ecosystem services. Ecological Monographs, 81: 169-193.
Beaumont N.J., Austen M.C., Atkins J.P., Burdon D., Degraer S., Dentinho T.P., Derous S., Holm P.,
Horton T., van Ierland E., Marboe A.H., Starkey D.J., Townsend M. & Zarzycki T. (2007). Identification,
definition and quantification of goods and services provided by marine biodiversity: implications for the
ecosystem approach. Marine Pollution Bulletin, 54: 253-265.
Beck M.W., Heck K.L., Able K.W., Childers D.L., Eggleston D.B., Gillanders B., Halpern B., Hays
C.G., Hoshino K., Minello T.J., Orth R.J., Sheridan P.F. & Weinstein M. (2001). The identification,
conservation, and management of estuarine and marine nurseries for fish and invertebrates. BioScience,
51: 633-641.
Boero F. (1994). Fluctuations and variations in coastal marine environments. Marine Ecology-
Pubblicazioni Della Stazione Zoologica Di Napoli I, 15: 3-25.
Böhnke-Henrichs A., Baulcomb C., Koss R., Hussain S.S. & de Groot R.S. (2013). Typology and
indicators of ecosystem services for marine spatial planning and management. Journal of Environmental
Management, 130: 135-145.
Borja A., Dauer D.M., Elliott M. & Simenstad C.A. (2010). Medium- and long-term recovery of
estuarine and coastal ecosystems: patterns, rates and restoration effectiveness. Estuaries and Coasts, 33:
1249-1260.
Boyd J. & Banzhaf S. (2007). What are ecosystem services? The need for standardized environmental
accounting units. Ecological Economics, 63: 616-626.
Cardinale B.J., Duffy J.E., Gonzalez A., Hooper D.U., Perrings C., Venail P., Narwani A., Mace G.M.,
Tilman D., Wardle D.A., Kinzig A.P., Daily G.C., Loreau M., Grace J.B., Larigauderie A., Srivastava D.S.
& Naeem S. (2012). Biodiversity loss and its impact on humanity. Nature, 486: 59-67.
Chan K.M., Shaw M.R., Cameron D.R., Underwood E.C. & Daily G.C. (2006). Conservation planning
for ecosystem services. PLoS Biology, 4: 2138-2152.
Costanza R., dArge R., deGroot R., Farber S., Grasso M., Hannon B., Limburg K., Naeem S., ONeill
R.V., Paruelo J., Raskin R.G., Sutton P. & vandenBelt M. (1997). The value of the world's ecosystem
services and natural capital. Nature, 387: 253-260.
Daily G.C. (1997). Nature's services: societal dependence on natural ecosystems, Washington.
de Bello F., Lavorel S., Díaz S., Harrington R., Cornelissen J.H.C., Bardgett R.D., Berg M.P., Cipriotti
P., Feld C.K., Hering D., Martins da Silva P., Potts S.G., Sandin L., Sousa J.P., Storkey J., Wardle D.A. &
Harrison P.A. (2010). Towards an assessment of multiple ecosystem processes and services via functional
traits. Biodiversity and Conservation, 19: 2873-2893.
de Bello F., Leps J., Lavorel S. & Moretti M. (2007). Importance of species abundance for assessment
of trait composition: an example based on pollinator communities. Community Ecology, 8: 163-170.
de Groot R., Fisher B. & Christie M. (2010). Integrating the ecological and economic dimensions in
biodiversity and ecosystem service valuation. In: The Economics of Ecosystems and Biodiversity: The
Ecological and Economic Foundations (ed. Kadekodi GK), pp. 2 - 40.
Díaz S., Fargione J., Chapin F.S., 3rd & Tilman D. (2006). Biodiversity loss threatens human well-
being. PLoS Biology, 4: 1300-1305.
Díaz S., Hodgson J.G., Thompson K., Cabido M., Cornelissen J.H.C., Jalili A., Montserrat-Marti G.,
Grime J.P., Zarrinkamar F., Asri Y., Band S.R., Basconcelo S., Castro-Diez P., Funes G., Hamzehee B.,

CHAPTER 1
7
Khoshnevi M., Perez-Harguindeguy N., Perez-Rontome M.C., Shirvany F.A., Vendramini F., Yazdani S.,
Abbas-Azimi R., Bogaard A., Boustani S., Charles M., Dehghan M., de Torres-Espuny L., Falczuk V.,
Guerrero-Campo J., Hynd A., Jones G., Kowsary E., Kazemi-Saeed F., Maestro-Martinez M., Romo-Diez
A., Shaw S., Siavash B., Villar-Salvador P. & Zak M.R. (2004). The plant traits that drive ecosystems:
Evidence from three continents. Journal of Vegetation Science, 15: 295-304.
Díaz S., Lavorel S., de Bello F., Quetier F., Grigulis K. & Robson T.M. (2007). Incorporating plant
functional diversity effects in ecosystem service assessments. Proceedings of the National Academy of
Sciences of the United States of America, 104: 20684-20689.
Elliott M., Whitfield A.K., Potter I.C., Blaber J.M., Cyrus D.P., Nordlie F.G. & Harrison T.D. (2007).
The guild approach to categorizing estuarine fish assemblages: a global review. Fish and Fisheries, 8:
241-268.
Elmqvist T., Folke C., Nyström M., Peterson G., Bengtsson J., Walker B. & Norberg J. (2003).
Response diversity, ecosystem change, and resilience. Frontiers in Ecology and the Environment, 1: 488-
494.
Farber S., Costanza R., Childers D.L., Erickson J., Gross K., Grove M., Hopkinson C.S., Kahn J.,
Pincetl S., Troy A., Warren P. & Wilson M. (2006). Linking ecology and economics for ecosystem
management. BioScience, 56: 121-133.
Fisher B., Turner R.K. & Morling P. (2009). Defining and classifying ecosystem services for decision
making. Ecological Economics, 68: 643-653.
Folke C., Carpenter S., Walker B., Scheffer M., Elmqvist T., Gunderson L. & Holling C.S. (2004).
Regime shifts, resilience, and biodiversity in ecosystem management. Annual Review of Ecology,
Evolution, and Systematics, 35: 557-581.
Fonseca V.F., Vasconcelos R.P., Gamito R., Pasquaud S., Gonçalves C.I., Costa J.L., Costa M.J. &
Cabral H.N. (2013). Fish community-based measures of estuarine ecological quality and pressure–impact
relationships. Estuarine, Coastal and Shelf Science, 134: 128-137.
Gagic V., Bartomeus I., Jonsson T., Taylor A., Winqvist C., Fischer C., Slade E.M., Steffan-Dewenter
I., Emmerson M., Potts S.G., Tscharntke T., Weisser W. & Bommarco R. (2015). Functional identity and
diversity of animals predict ecosystem functioning better than species-based indices. Proceedings of the
Royal Society B: Biological Sciences, 282: 1-28.
García-Llorente M., Martín-López B., Díaz S. & Montes C. (2011). Can ecosystem properties be fully
translated into service values? An economic valuation of aquatic plant services. Ecological Applications,
21: 3083 - 3103.
Gerino M., Stora G., François-Carcaillet F., Gilbert F., Poggiale J.-C., Mermillod-Blondin F.,
Desrosiers G. & Vervier P. (2003). Macro-invertebrates functional groups in freshwater and marine
sediments: a commun mechanistic classification. Vie et Milieu: 221-231.
Gunderson L. (2000). Ecological resilience - in theory and application. Annual Review of Ecology,
Evolution, and Systematics: 425-439.
Harrison P.A., Berry P.M., Simpson G., Haslett J.R., Blicharska M., Bucur M., Dunford R., Egoh B.,
Garcia-Llorente M., Geamana N., Geertsema W., Lommelen E., Meiresonne L. & Turkelboom F. (2014).
Linkages between biodiversity attributes and ecosystem services: A systematic review. Ecosystem
Services, 9: 191-203.
Hattam C., Atkins J.P., Beaumont N., Borger T., Bohnke-Henrichs A., Burdon D., de Groot R.,
Hoefnagel E., Nunes P.A.L.D., Piwowarczyk J., Sastre S. & Austen M.C. (2015). Marine ecosystem
services: Linking indicators to their classification. Ecological Indicators, 49: 61-75.

CHAPTER 1
8
Henriques S., Cardoso P., Cardoso I., Laborde M., Cabral H.N. & Vasconcelos R.P. (2016). Processes
underpinning fish species composition patterns in estuarine ecosystems worldwide. Journal of
Biogeography, In press.
Holling C.S. (1973). Resilience and stability of ecological systems. Annual Review of Ecology,
Evolution, and Systematics, 4: 1-23.
Holmlund C.M. & Hammer M. (1999). Ecosystem services generated by fish populations. Ecological
Economics, 29: 253-268.
Hooper D.U., Chapin F.S., Ewel J.J., Hector A., Inchausti P., Lavorel S., Lawton J.H., Lodge D.M.,
Loreau M., Naeem S., Schmid B., Setala H., Symstad A.J., Vandermeer J. & Wardle D.A. (2005). Effects
of biodiversity on ecosystem functioning: A consensus of current knowledge. Ecological Monographs, 75:
3-35.
Hughes T.P., Bellwood D.R., Folke C., Steneck R.S. & Wilson J. (2005). New paradigms for
supporting the resilience of marine ecosystems. Trends in Ecology and Evolution, 20: 380-386.
Kennish M.J. (2002). Environmental threats and environmental future of estuaries. Environmental
Conservation, 29: 78-107.
Kremen C. (2005). Managing ecosystem services: what do we need to know about their ecology?
Ecology Letters, 8: 468-479.
Lavorel S. & Garnier E. (2002). Predicting changes in community composition and ecosystem
functioning from plant traits: revisiting the Holy Grail. Functional Ecology, 16: 545-556.
Lavorel S., McIntyre S., Landsberg J. & Forbes T.D.A. (1997). Plant functional classifications: from
general groups to specific groups based on response to disturbance. Trends in Ecology and Evolution, 12:
474-478.
Lefcheck J.S., Byrnes J.E., Isbell F., Gamfeldt L., Griffin J.N., Eisenhauer N., Hensel M.J., Hector A.,
Cardinale B.J. & Duffy J.E. (2015). Biodiversity enhances ecosystem multifunctionality across trophic
levels and habitats. Nature Communications, 6: 1-7.
Liquete C., Piroddi C., Drakou E.G., Gurney L., Katsanevakis S., Charef A. & Egoh B. (2013). Current
status and future prospects for the assessment of marine and coastal ecosystem services: a systematic
review. PLoS One, 8: 1-15.
Lotze H.K., Lenihan H.S., Bourque B.J., Bradbury R.H., Cooke R.G., Kay M.C., Kidwell S.M., Kirby
M.X., Peterson C.H. & Jackson J.B. (2006). Depletion, degradation, and recovery potential of estuaries
and coastal seas. Science, 312: 1806-1809.
Luck G.W., Daily G.C. & Ehrlich P.R. (2003). Population diversity and ecosystem services. Trends in
Ecology and Evolution, 18: 331-336.
Luck G.W., Harrington R., Harrison P.A., Kremen C., Berry P.M., Bugter R., Dawson T.P., de Bello
F., Diaz S., Feld C.K., Haslett J.R., Hering D., Kontogianni A., Lavorel S., Rounsevell M., Samways M.J.,
Sandin L., Settele J., Sykes M.T., van den Hove S., Vandewalle M. & Zobel M. (2009). Quantifying the
Contribution of Organisms to the Provision of Ecosystem Services. BioScience, 59: 223-235.
Lyons K.G., Brigham C.A., Traut B.H. & Schwartz M.W. (2005). Rare species and ecosystem
functioning. Conservation Biology, 19: 1019-1024.
Martinho F., Viegas I., Dolbeth M., Leitão R., Cabral H.N. & Pardal M.A. (2008). Assessing estuarine
environmental quality using fish-based indices: performance evaluation under climatic instability. Marine
Pollution Bulletin, 56: 1834-1843.
McGrady-Steed J., Harris P.M. & Morin P.J. (1997). Biodiversity regulates ecosystem predictability.
Nature, 390: 162-165.

CHAPTER 1
9
Meynard C.N., Devictor V., Mouillot D., Thuiller W., Jiguet F. & Mouquet N. (2011). Beyond
taxonomic diversity patterns: how do a, b and g components of bird functional and phylogenetic diversity
respond to environmental gradients across France? Global Ecology and Biogeography, 20: 893-903.
Micheli F. & Halpern B.S. (2005). Low functional redundancy in coastal marine assemblages. Ecology
Letters, 8: 391-400.
Mouillot D., Bellwood D.R., Baraloto C., Chave J., Galzin R., Harmelin-Vivien M., Kulbicki M.,
Lavergne S., Lavorel S., Mouquet N., Paine C.E., Renaud J. & Thuiller W. (2013). Rare species support
vulnerable functions in high-diversity ecosystems. PLoS Biology, 11: 1-11.
Mouillot D., Graham N.A., Villeger S., Mason N.W. & Bellwood D.R. (2012). A functional approach
reveals community responses to disturbances. Trends in Ecology and Evolution, 28: 167-177.
Mouillot D., Villeger S., Parravicini V., Kulbicki M., Arias-Gonzalez J.E., Bender M., Chabanet P.,
Floeter S.R., Friedlander A., Vigliola L. & Bellwood D.R. (2014). Functional over-redundancy and high
functional vulnerability in global fish faunas on tropical reefs. Proceedings of the National Academy of
Sciences of the United States of America, 111: 13757-13762.
Muntadas A., de Juan S. & Demestre M. (2016). Assessing functional redundancy in chronically
trawled benthic communities. Ecological Indicators, 61: 882-892.
Nicolas D., Le Loc'h F., Désaunay Y., Hamon D., Blanchet A. & Le Pape O. (2007). Relationships
between benthic macrofauna and habitat suitability for juvenile common sole (Solea solea, L.) in the
Vilaine estuary (Bay of Biscay, France) nursery ground. Estuarine, Coastal and Shelf Science, 73: 639-
650.
Nicolas D., Lobry J., Le Pape O. & Boët P. (2010). Functional diversity in European estuaries:
Relating the composition of fish assemblages to the abiotic environment. Estuarine, Coastal and Shelf
Science, 88: 329-338.
Norberg J., Swaney D.P., Dushoff J., Lin J., Casagrandi R. & Levin S.A. (2001). Phenotypic diversity
and ecosystem functioning in changing environments: a theoretical framework. Proceedings of the
National Academy of Sciences of the United States of America, 98: 11376-11381.
Peterson G., Allen C. & Holling C.S. (1998). Ecological resilience, biodiversity, and scale. Ecosystems,
1: 6-18.
Pinto R., de Jonge V.N. & Marques J.C. (2014). Linking biodiversity indicators, ecosystem
functioning, provision of services and human well-being in estuarine systems: application of a conceptual
framework. Ecological Indicators, 36: 644-655.
Pratchett M.S., Hoey A.S. & Wilson S.K. (2014). Reef degradation and the loss of critical ecosystem
goods and services provided by coral reef fishes. Current Opinion in Environmental Sustainability, 7: 37-
43.
Purschke O., Schmid B.C., Sykes M.T., Poschlod P., Michalski S.G., Durka W., Kühn I., Winter M.,
Prentice H.C. & Fridley J. (2013). Contrasting changes in taxonomic, phylogenetic and functional
diversity during a long-term succession: insights into assembly processes. Journal of Ecology, 101: 857-
866.
Rodrigues E.T. & Pardal M.Â. (2015). Primary productivity temporal fluctuations in a nutrient-rich
estuary due to climate-driven events. Estuaries and Coasts, 38: 1-12.
Solan M., Cardinale B.J., Downing A.L., Engelhardt K.A., Ruesink J.L. & Srivastava D.S. (2004).
Extinction and ecosystem function in the marine benthos. Science, 306: 1177-1180.

CHAPTER 1
10
van der Linden P., Patrício J., Marchini A., Cid N., Neto J.M. & Marques J.C. (2012). A biological trait
approach to assess the functional composition of subtidal benthic communities in an estuarine ecosystem.
Ecological Indicators, 20: 121-133.
Vasconcelos R.P., Henriques S., França S., Pasquaud S., Cardoso I., Laborde M. & Cabral H.N.
(2015). Global patterns and predictors of fish species richness in estuaries. Journal of Animal Ecology, 84:
1331-1341.
Vasconcelos R.P., Reis-Santos P., Costa M.J. & Cabral H.N. (2011). Connectivity between estuaries
and marine environment: Integrating metrics to assess estuarine nursery function. Ecological Indicators,
11: 1123-1133.
Villéger S., Ramos Miranda J., Flores Hernandez D. & Mouillot D. (2012). Low functional beta-
diversity despite high taxonomic beta-diversity among tropical estuarine fish communities. PLoS One, 7:
1-10.
Walker B., Kinzig A. & Langridge J. (1999). Plant attribute diversity, resilience, and ecosystem
function: the nature and significance of dominant and minor species. Ecosystems, 2: 95-113.
Walker B.H. (1992). Biodiversity and ecological redundancy. Conservation Biology, 6: 18-23.
Wallace K.J. (2007). Classification of ecosystem services: Problems and solutions. Biological
Conservation, 139: 235-246.
Wellnitz T. & Poff N.L. (2001). Functional redundancy in heterogeneous environments: implications
for conservation. Ecology Letters, 4: 177-179.
Whitfield A. & Elliott M. (2002). Fishes as indicators of environmental and ecological changes within
estuaries: a review of progress and some suggestions for the future. Journal of Fish Biology, 61: 229-250.
Whitfield A.K., Elliott M., Basset A., Blaber S.J.M. & West R.J. (2012). Paradigms in estuarine
ecology – A review of the Remane diagram with a suggested revised model for estuaries. Estuarine,
Coastal and Shelf Science, 97: 78-90.
Worm B., Barbier E.B., Beaumont N., Duffy J.E., Folke C., Halpern B.S., Jackson J.B., Lotze H.K.,
Micheli F., Palumbi S.R., Sala E., Selkoe K.A., Stachowicz J.J. & Watson R. (2006). Impacts of
biodiversity loss on ocean ecosystem services. Science, 314: 787-790.

11
CHAPTER 2
Assessing changes in ecosystem functioning and services
via functional traits of an estuarine fish assemblage


CHAPTER 2
13
Assessing temporal variation in ecosystem functioning and services via functional traits of an
estuarine fish assemblage
Margarida Monteiroa, Fábio Monteiro
a, Marina Dolbeth
b,c, Miguel Pardal
c, Filipe Martinho
c, Rita
Vasconcelosa,d,e
, Sofia Henriquesa,e
aMARE – Marine and Environmental Sciences Centre & FCUL – Faculdade de Ciências da Universidade
de Lisboa. Campo Grande, 1749-016 Lisboa, Portugal; bBiology Department of the University of Aveiro & CESAM – Centre for Environmental and Marine
Studies. Campus Universitário de Santiago, 3810-193 Aveiro, Portugal; cCentre for Functional Ecology – CFE, Department of Life Sciences, University of Coimbra. Calçada
Martim de Freitas, 3000-456 Coimbra, Portugal. dcorresponding author
eco-last author
Abstract
Biodiversity affects ecosystem functioning and hence influences the delivery of ecosystem services.
This study aimed to assess, via functional traits, the role of an estuarine fish assemblage in the provision of
ecosystem services (links established based on literature) and investigate the possible temporal and spatial
variations. Fish were sampled in the Mondego estuary throughout a decade (2003-2013) and characterized
according to five traits (mobility, maximum body size, diet, feeding mode and salinity preference). Results
suggest that the fish assemblage of the Mondego estuary has the potential to contribute to all regulating
ecosystem services (except air purification), although not equally, as the seven functional groups of fish
are linked with specific services, they were not equally represented in the assemblage and varied through
space and time. Feeding mode, diet and body size were the most important functional traits to regulating
services and their effects depended on both service and ecosystem. Trait variation was strong, spatially
and inter-annually, with a weak seasonal effect. Despite the overall temporal and spatial variability in
functional redundancy, results suggest that nutrient cycling, biological control, waste treatment and
assimilation and climate regulation are likely the services to which the fish assemblage of Mondego
estuary contributes in a more resilient manner. This study highlighted the importance of fish in the
delivery of regulating ecosystem services in estuaries and the influence of environmental variables in fish
functional traits, which needs to be taken into account, as well as the resilience of the ecosystem services
provided, to establish conservation efforts.
Keywords: fish assemblage, estuaries, ecosystem functioning and services, functional traits, functional
redundancy, resilience
Introduction
Ecosystems contribute greatly to human welfare, being strongly connected to human societies
(Costanza et al. 1997; Kremen 2005; Luck et al. 2009; García-Llorente et al. 2011). The concept of
ecosystem services – “the direct and indirect contributions of ecosystems to human well-being” (de Groot
et al. 2010) – has become increasingly used because it highlights the value of ecosystems to humans,
which is not fully perceived, despite its extreme importance (Boyd & Banzhaf 2007). Humans depend on

CHAPTER 2
14
ecosystems for a variety of purposes, from the production of food and medicine to the provision of natural
services such as cleansing, recycling and maintenance of a suitable climate, which are essential to human
survival (Daily 1997; Kremen 2005). As such, ecosystem services are of vital importance and need to be
taken into account in ecosystem conservation and management strategies (Costanza et al. 1997; Daily
1997). In addition to the intrinsic value of biodiversity (of taxonomic, functional and phylogenetic
diversity) it is fundamental to human well-being (Díaz et al. 2011) because it affects ecosystem
functioning - i.e. “ecological processes that control the fluxes of energy, nutrients and organic matter
through the environment” (Cardinale et al. 2012) - and hence it influences the provision of ecosystem
services such as biomass production, nutrient cycling and soil formation (Díaz et al. 2006; Cardinale et al.
2012; Harrison et al. 2014). Therefore, through ecosystem functioning, humans can obtain ecosystem
services.
Several typologies of ecosystem services have been proposed (Millennium Ecosystem Assessment
2005; Beaumont et al. 2007; Fisher et al. 2009; Böhnke-Henrichs et al. 2013; Liquete et al. 2013). We
selected the widely accepted classification from de Groot et al. (2010) for this study, according to which
there are four types of ecosystem services: provisioning (e.g. food and raw materials), regulating (e.g.
climate regulation and biological control), habitat (e.g. maintenance of life cycles of migratory species and
gene pool protection) and cultural (e.g. aesthetic values and information for cognitive development). In the
last two decades, there was a marked increase of investigation related to ecosystem services (Fisher et al.
2009; Liquete et al. 2013), although this field is relatively recent and needs more research, especially
concerning services mediated by several biological groups such as fish. For the latter, existing information
is scarce and needs updating. As such, it is urgent to gain knowledge and new perspectives of the role of
fish in ecosystem functioning and ultimately in generating ecosystem services, which could be useful in
management of fisheries and potential programs of biodiversity conservation. Furthermore, loss of
biodiversity is closely associated with loss of ecosystem services (Worm et al. 2006). Thus, it is
paramount to measure and estimate the effects of disturbance on biodiversity patterns to conduct
conservation efforts and management of natural resources (Mouillot et al. 2012).
Human activities for subsistence have led to over-exploitation of natural resources and habitat loss and
changes, leading to alterations in taxonomic and functional structure of biological assemblages (Mouillot
et al. 2012; Henriques et al. 2013; Muntadas et al. 2016), and thus affecting ecosystem functioning and
mostly limiting their capacity to provide essential services (Kremen 2005; Cardinale et al. 2012). For
example, larger fish species are most affected by size-selective fisheries, which can have implications such
as trophic cascades and a consequent decline of biological control (Genner et al. 2010). Furthermore,
multiple trade-offs between human actions and ecosystem services may occur (Hattam et al. 2015), for
example destruction of habitats by deforestation to obtain timber in turn leads to loss of other ecosystem
services such as climate regulation through carbon sequestration by plant species (Cardinale et al. 2012;
Mouillot et al. 2012). In fact, the increasing demand for provisioning services over the last century has
caused a decrease in regulating services (Millennium Ecosystem Assessment 2005; Carpenter et al. 2009;
Pinto et al. 2014), thus it is crucial to develop research about this type of services, which is essential to
regulate environmental quality (TEEB 2010).
The identification of specific components of biodiversity providing a given ecosystem service is an
important step in ecosystem services assessment (Luck et al. 2009; García-Llorente et al. 2011). Several
studies have identified functional traits as good indicators of ecosystem processes and therefore, useful
tools to ecosystem services assessment (Hooper et al. 2005; Díaz et al. 2007; de Bello et al. 2010).
Functional traits are the characteristics of organisms that are measurable at the individual level and have

CHAPTER 2
15
direct influence on organisms’ performance (Mouillot et al. 2012) and as such, they influence organisms’
fitness in the environment (response trait) and its effects on ecosystem processes or services (effect trait)
(Violle et al. 2007; de Bello et al. 2010). And functional trait composition of an ecosystem can have a
notable effect on its ecosystem functioning (de Bello et al. 2007; Díaz et al. 2007; Díaz et al. 2011;
García-Llorente et al. 2011). Hence, linkages between biodiversity and ecosystem services become more
explicit by describing biodiversity through the traits of organisms than through species number or
abundance only (Díaz et al. 2007; de Bello et al. 2010; Laliberté et al. 2010; Díaz et al. 2011). Therefore,
functional traits are strong candidates to quantify ecosystem service delivery (Hooper et al. 2005; Kremen
2005; de Bello et al. 2010; Díaz et al. 2011; Lavorel & Grigulis 2012). Most evidence of links between
functional traits and ecosystem services has been reported for plant communities (de Bello et al. 2010).
However, for animals, numerous connections between behavioral traits (e.g. feeding mode, mobility) and
morphological traits (e.g. body size and mandibular structure) and the provision of ecosystem services
have also been documented (Carpenter et al. 1985; Deegan 1993; Hall et al. 2007; de Bello et al. 2010).
There is a need for further research about evidence for trait-service relationships, especially concerning
fish.
Although functional trait composition of a community presents an undeniable connection to provision
of ecosystem services, it is necessary to know which functional traits are represented by the species in a
community, because it influences the ecosystem services being provided (Muntadas et al. 2016). For
example, in coral reefs, biodiversity and functional complexity is generally high, but a major ecosystem
process, such as bioerosion, may depend on the activity of a single group of species such as parrotfishes
(i.e. grazer species that remove carbonate from the reef matrix while feeding on coral tissue), which makes
this process more vulnerable to disturbance (Bellwood et al. 2003). Functional redundancy, i.e. different
species sustaining similar functional roles, may insure the maintenance of ecosystem functioning in a
situation of stress with subsequent degradation of biodiversity (Walker 1992; Fonseca & Ganade 2001;
Bellwood et al. 2004; Mouillot et al. 2013; Mouillot et al. 2014). Functional redundancy has been related
to ecosystem resilience – “the capacity of an ecosystem to absorb a given amount of disturbance without
compromising its stability and to retain essentially its characteristics” (Holling 1973; Walker et al. 1999;
Gunderson 2000; Folke et al. 2004). Nevertheless, if a set of species sustains similar functions but is
equally affected by disturbance, functional redundancy does not ensure the resilience of those functions
(Hughes et al. 2005; Muntadas et al. 2016). Moreover, it has been noted that rare species can have a
significant effect in the maintenance of functions in disturbed ecosystems (Boero 1994; Walker et al.
1999; Lyons et al. 2005), because they may show different responses to stress and sustain ecosystem
functioning under changing environmental conditions, where the abundance of common species with
equivalent functions has decreased (Walker et al. 1999; Mouillot et al. 2013).
Estuarine and coastal systems are extremely productive and valuable (Costanza et al. 1997). For
example, estuaries are important habitats for several fish, including commercial species that use them for
shelter, feeding, nursery and migratory purposes (Elliott et al. 2007; Baptista et al. 2015a). Yet human-
induced alterations in estuaries and environmental changes may have significant effects in the structure
and composition of their fish assemblages (Vasconcelos et al. 2007; Baptista et al. 2010). Notably,
alterations of environmental variables such as salinity, temperature and precipitation can lead to functional
changes in estuarine fish assemblages (Smolders et al. 2000; Garcia et al. 2001; Martinho et al. 2007). In
fact, estuaries are among the most exploited natural systems worldwide (Worm et al. 2006; Barbier et al.
2011) and their degradation is affecting their ecological integrity and the provision of critical ecosystem
services, such as the number of viable fisheries, the provision of nursery habitats and natural cleansing

CHAPTER 2
16
processes of water (Kennish 2002; Worm et al. 2006; Borja et al. 2010; Barbier et al. 2011; Dolbeth et al.
2011).
The main aim of this study was to assess the potential influence of an estuarine fish assemblage on the
provision of ecosystem services exerted via functional traits, and possible temporal variations. The first
objective of the study was to obtain information on links between fish functional traits and service
provision based on a literature review. Moreover, we used the fish assemblage of the Mondego estuary
(Northeast Atlantic) as a case study since it has been monitored for over 10-years. Furthermore, additional
objectives were explored for this case study, namely: (1) to develop a functional characterization of the
fish assemblage in order to identify fish functional groups within the estuary, and their possible
contribution to the provision of regulating ecosystem services; (2) to investigate patterns of fish functional
traits and functional groups and their underlying environmental drivers; and (3) to explore the resilience of
ecosystem services provided by the fish assemblage through functional redundancy (sensu de Bello et al.
2007).
Materials and methods
Study area
The Mondego estuary is a mesotidal system influenced by a warm-temperate climate, located on the
North East Atlantic - Portugal (40°08’N, 8°50’W) (Verdelhos et al. 2014; Alves et al. 2015). This estuary
shows a typical longitudinal estuarine gradient, with depth, dissolved oxygen and salinity increasing from
upstream to downstream and reaching the highest values near the mouth (Leitão et al. 2007). This small
estuary of 8.6 km2 (Verdelhos et al. 2014; Baptista et al. 2015b) has a length of 21 km (Alves et al. 2015)
and comprises two arms, separated at 7 km from the shore by the Morraceira Island (Verdelhos et al.
2014), that join again near the mouth (Baptista et al. 2015b). The two arms present different hydrological
characteristics: (1) the south arm is shallower (2-4 m during high tide), presenting about 75% of intertidal
mudflats; (2) the north arm is deeper, 5-6 m at high tide (Baptista et al. 2013; Alves et al. 2015). The
lower portion of the north arm is dredged frequently to maintain its depth, since it is the main navigation
channel of the Figueira da Foz harbour (Baptista et al. 2015b).
The Mondego estuary has an important economical value, supporting industrial activities such as salt
work, agricultural areas, mercantile and fishing harbours, which make it vulnerable to numerous physical
impacts and high loadings of nutrients (Veríssimo et al. 2013). The estuary has suffered several
anthropogenic pressures and hydromorphological transformations over the last decades (Neto et al. 2010;
Veríssimo et al. 2013). From 1993 to 1997, there was an interruption of the connection between the two
arms (Baptista et al. 2015b). As a result, the river flowed mainly through the north arm, and water
circulation in the south arm was mostly dependent of tides as well as on the reduced freshwater input from
the Pranto River (Verdelhos et al. 2014). In 1998, the communication between the two arms was re-
established after a restoration plan (Baptista et al. 2015b), leading to a gradual ecosystem recovery
(Verdelhos et al. 2014). In addition, several extreme climatic events have been observed in the last 15
years, including floods in 2000-2001 and droughts in 2004-2005 (Martinho et al. 2007; Baptista et al.
2010; Baptista et al. 2015b). These events affected some characteristics of the estuary, such as salinity and
water temperature, and consequently changing the structure of the fish assemblage (Baptista et al. 2015b).
Within the Mondego estuary, the main types of estuarine habitats are intertidal soft substratum
(composed of sediments such as silt and sand), salt marsh (macrophyte-dominated and saline-influenced
habitats) and subtidal soft substratum (permanently subtidal unvegetated habitats, composed of sediments)

CHAPTER 2
17
(França et al. 2009). The downstream areas of the south arm have important seagrass beds (Dolbeth et al.
2008). These seagrass habitats show higher diversity, productivity and functional organization of benthic
organisms, as well as longer and more complex food webs, than the sandflat habitats (Cardoso et al. 2004;
Verdelhos et al. 2005; Dolbeth et al. 2008; Dolbeth et al. 2015). In the Mondego estuary, primary
production is mostly performed by phytoplankton (Rodrigues & Pardal 2015), with Zostera noltii leaves
and Gracilaria gracilis contributing equally to the productivity of the estuary, followed by Z. noltii
belowground and finally by Ulva spp (Rodrigues & Pardal 2015). In the fish assemblage, the most
abundant species are the estuarine residents such as Pomatoschistus microps and Pomatoschistus minutus,
species that use the estuary as nursery grounds such as Dicentrarchus labrax, Solea solea and Platichthys
flesus, and marine migrant species like Diplodus vulgaris (Martinho et al. 2007). This estuary supports
many fish species with high socio-economic importance (e.g., Anguilla anguilla, Chelon labrosus, D.
labrax, D. vulgaris, Liza ramada, P. flesus, S. solea) (Vasconcelos et al. 2009; Baptista et al. 2013).
Several studies provided evidence of changes in this fish assemblage due to anthropogenic impacts. For
instance, Leitão et al. (2007) observed a lower taxonomic diversity of fish species in 2003-2004 than in
1988-1992, which may be a result of dredging activities and bank reclamation in the north arm and
eutrophication in the south arm. More recently, other changes in fish assemblage composition, structure
and production were related to several hydrology changes due to shifts in precipitation and river flow
(which affect salinity) and temperature (Dolbeth et al. 2008; Martinho et al. 2010; Baptista et al. 2015b).
Figure 2.1 - The Mondego estuary, with the location of the five sampling stations.
Sampling procedures
The fish assemblage of the Mondego estuary was sampled monthly, during high water of spring tides,
from June 2003 to November 2013 (every two months between January 2007 and March 2010). There
were no sampling campaigns in September and October 2004 and in May, July, October, November and
December 2008, due to technical constraints or bad weather.
Fish surveys were carried out at five stations (M, S1, S2, N1, N2; Figure 2.1), following a salinity
gradient, starting downstream with station M showing higher salinity due to its proximity to the estuary
mouth and stations S and N presenting lower salinities, since they are located more upstream. Stations N1
and N2 (lowest salinity), in the north arm, are deep and characterized by high runoff from the Mondego
river. Stations S1 and S2, located in the south arm, are shallower and their runoff depends on inputs from
the Pranto river, a small tributary of the Mondego river.

CHAPTER 2
18
Fishing was performed during the night, using a 2-m beam trawl with one tickler chain and 5-mm
stretched mesh size in the cod end. At each station, three replicate trawls were made, each for an average
of 3 min, covering a minimum area of 500 m2. After the collection, fish were kept on ice, transported to
the laboratory and preserved frozen until processing, when they were identified, counted, measured (total
length to nearest 1 mm) and weighted (wet weight to the nearest 0.01 g).
Environmental variables of stations were determined before each tow, namely: water temperature (°C),
salinity and dissolved oxygen (%), all measured from bottom water. Monthly precipitation values (mm)
were acquired for the Soure 13F/01G monitoring station, from INAG – Portuguese Water Institute.
Monthly freshwater runoff (dam3) was obtained from INAG station Açude Ponte Coimbra, 12G/01A, near
the city of Coimbra (located 40 km upstream). North Atlantic Oscillation index (NAO) was obtained from
the National Oceanic and Atmospheric Administration (NOAA) webstation (http://www.noaa.gov/).
Functional characterization of the fish assemblage
To characterize the fish assemblage of the Mondego estuary, we first classified each species captured
in the study period according to its taxonomy, namely: class, order and family. Second, we classified each
species according to its functional traits: mobility (adapted from Henriques et al. 2013), maximum body
size (adapted from Baptista et al. 2015b), diet (adapted from Elliott et al. 2007), feeding mode (adapted
from Costello et al. 2015) and salinity preference (adapted from Whitfield et al. 2012). This set of traits
has been previously used in other studies concerning functional diversity (Elliott et al. 2007; Nyitrai et al.
2012; Baptista et al. 2015b), although salinity preference is not considered a trait in itself, according to
Verberk et al. (2013), since it rather reflects an interaction of a trait with environmental conditions. All
traits were considered as qualitative, except salinity preference, in which the categories were considered as
binary (Table 2.1). To characterize the functional traits related with habitat use and ecology (i.e. diet and
feeding mode) we took into account the life stages and ecology of each fish species within the estuary.
Information was collected from published literature and publicly available databases such as FishBase
(Froese and Pauly 2015), Marine Species Identification Portal and International Union for Conservation of
Nature (IUCN).
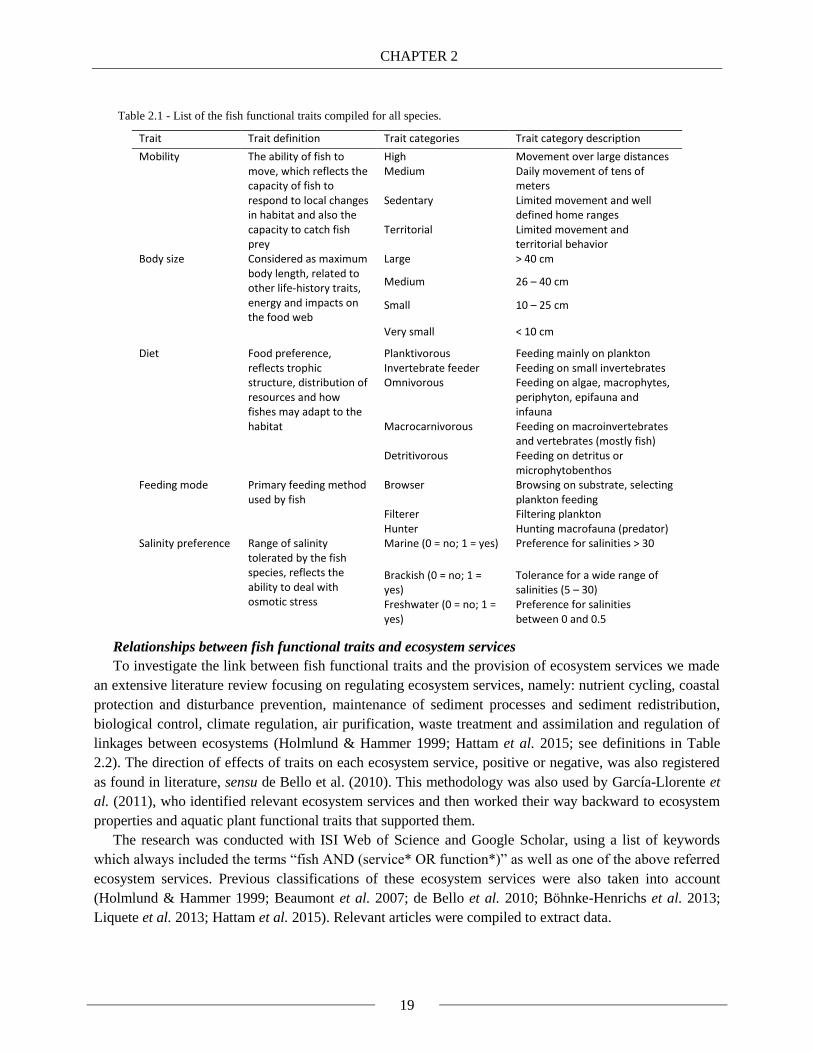
CHAPTER 2
19
Table 2.1 - List of the fish functional traits compiled for all species.
Relationships between fish functional traits and ecosystem services
To investigate the link between fish functional traits and the provision of ecosystem services we made
an extensive literature review focusing on regulating ecosystem services, namely: nutrient cycling, coastal
protection and disturbance prevention, maintenance of sediment processes and sediment redistribution,
biological control, climate regulation, air purification, waste treatment and assimilation and regulation of
linkages between ecosystems (Holmlund & Hammer 1999; Hattam et al. 2015; see definitions in Table
2.2). The direction of effects of traits on each ecosystem service, positive or negative, was also registered
as found in literature, sensu de Bello et al. (2010). This methodology was also used by García-Llorente et
al. (2011), who identified relevant ecosystem services and then worked their way backward to ecosystem
properties and aquatic plant functional traits that supported them.
The research was conducted with ISI Web of Science and Google Scholar, using a list of keywords
which always included the terms “fish AND (service* OR function*)” as well as one of the above referred
ecosystem services. Previous classifications of these ecosystem services were also taken into account
(Holmlund & Hammer 1999; Beaumont et al. 2007; de Bello et al. 2010; Böhnke-Henrichs et al. 2013;
Liquete et al. 2013; Hattam et al. 2015). Relevant articles were compiled to extract data.
Trait Trait definition Trait categories Trait category description
Mobility The ability of fish to move, which reflects the capacity of fish to respond to local changes in habitat and also the capacity to catch fish prey
High Movement over large distances Medium Daily movement of tens of
meters Sedentary Limited movement and well
defined home ranges Territorial Limited movement and
territorial behavior Body size Considered as maximum
body length, related to other life-history traits, energy and impacts on the food web
Large > 40 cm
Medium 26 – 40 cm
Small 10 – 25 cm
Very small < 10 cm
Diet Food preference, reflects trophic structure, distribution of resources and how fishes may adapt to the habitat
Planktivorous Feeding mainly on plankton Invertebrate feeder Feeding on small invertebrates Omnivorous Feeding on algae, macrophytes,
periphyton, epifauna and infauna
Macrocarnivorous Feeding on macroinvertebrates and vertebrates (mostly fish)
Detritivorous Feeding on detritus or microphytobenthos
Feeding mode Primary feeding method used by fish
Browser Browsing on substrate, selecting plankton feeding
Filterer Filtering plankton Hunter Hunting macrofauna (predator)
Salinity preference Range of salinity tolerated by the fish species, reflects the ability to deal with osmotic stress
Marine (0 = no; 1 = yes) Preference for salinities > 30
Brackish (0 = no; 1 = yes)
Tolerance for a wide range of salinities (5 – 30)
Freshwater (0 = no; 1 = yes)
Preference for salinities between 0 and 0.5

CHAPTER 2
20
Data analysis
A hierarchical cluster analysis was used to identify functional groups within the Mondego estuary fish
assemblage, based on their functional traits (matrix of 43 species x 5 traits). We used Ward’s
agglomerative method (Ward 1963) and Gower distance, also known as Gower’s coefficient (1971), which
is expressed as a dissimilarity that can be calculated between different types of variables, applying a
standardization to each variable (Maechler et al. 2015; R Development Core Team, 2015).
A Principal Coordinates Analysis (PCO) was also conducted to investigate the similarity of species
traits within the fish assemblage (Roberts 2016; R Development Core Team, 2016). This ordination
technique applies a projection of the points into axes minimizing residual variation in the space of the
dissimilarity measure chosen (Anderson et al. 2008). It is similar to Principal Components Analysis (PCA)
but it allows the use of a broader range of distances and dissimilarity coefficients being better suited to
ecological datasets, as proposed by Gower (1966).
Fish trait categories were quantified in three ways, with: the density, biomass and number of species
representing each trait category in a sample, where each sample is the mean assemblage sampled in a
given station and date.
To statistically test spatial and temporal differences of each of the functional groups previously
identified in the cluster analysis, we used multivariate analysis of variance using permutations
(PERMANOVA) in PRIMER 6 package with PERMANOVA + (Clarke & Gorley 2006; Anderson et al.
2008). To this end we considered three fixed factors: season (autumn, winter, spring, summer), station (M,
N1, N2, S1, S2) and year (from 2003 to 2013). PERMANOVA uses permutation methods for testing the
simultaneous response of one or more variables to one or more factors in an analysis of variance
experimental design on the basis of a resemblance measure (Anderson et al. 2008). It assumes only that
the samples are independent and identically distributed under a true null hypothesis. Post-hoc pair-wise
tests were performed when main tests were significant.
To investigate the relationship of each functional trait in the assemblage with environmental variables
(measured in density, biomass and number of species representing each trait category in each sample) we
performed generalized linear models (GLM) (R Development Core Team, 2005). For each trait category,
two GLM were produced: one considering only the continuous environmental variables (salinity,
temperature, dissolved oxygen, precipitation and NAO) and another also considering the factors season,
station and year. Several plots were then used to help visualize the effects of significant variables and
factors on each trait as fitted in the GLM (Breheny & Burchett 2016; R Development Core Team, 2016).
Hierarchical Partition of Variance was also performed to assess the relative importance of each variable to
trait variation (Nally 1996; Grömping 2006; R Development Core Team, 2006).
In all the above-mentioned analyses, density and biomass data were square root transformed to reduce
right skewness and the effect of outliers (Anderson et al. 2008). Resemblance matrices for biomass and
density were based on Bray-Curtis dissimilarity while for the species number the Euclidean distance was
used.
Finally, to assess the resilience of the ecosystem services supported by the Mondego estuary’s fish
assemblage, the functional redundancy of each sample was calculated based on trait density and biomass
data. Functional redundancy (FR) was determined as the difference between Gini-Simpson index of
species diversity (SD) and functional diversity (FD) of the sample considered as Rao’s quadratic entropy
based on their functional dissimilarity (de Bello et al. 2007; Debastiani & Pillar 2012; R Development
Core Team, 2015), expressed as:

CHAPTER 2
21
𝐹𝑅 = 𝑆𝐷 – 𝐹𝐷 (2.1)
Functional redundancy is zero if all species are functionally different and equal to Gini-Simpson index
if all species are functionally identical (de Bello et al. 2007).
Results
Literature review of trait – ecosystem service relationships
The literature review allowed identifying connections between fish functional traits and regulating
ecosystem services, namely reported as a mechanistic link or a concomitant measurable change in a given
functional trait category in an assemblage and a given ecosystem service (qualitative relationships in
Figure 2.2 and Table 2.2).
Figure 2.2 - Illustration of fish traits and ecosystem services general relationships. Green arrows indicate positive
relationships and red arrows indicate negative relationships between each trait and ecosystem service.
The two traits with more evidence of links with ecosystem services were diet and feeding mode. The
regulating ecosystem services with more connections to fish traits were nutrient cycling, coastal protection
and disturbance prevention, biological control and regulation of linkages between ecosystems. It is
important to refer that four of the traits represented in Figure 2.2 and Table 2.2 were not analyzed in our
case study of the Mondego estuary, namely: habitat association, trophic level, ecological group and
reproductive mode. Actually, from these, only the latter is considered a trait, according to Costello et al.

CHAPTER 2
22
(2015), with the other ones being the result of a combination of traits (Elliott et al. 2007). Also, some trait
categories from feeding mode (grazer) and diet (herbivorous, larvivorous, insectivorous and corallivorous)
were not considered in the analysis of our case study of the Mondego estuary because they were not
present in the fish assemblage. These trait categories were only considered for the literature review, which
was conducted for general relationships between fish traits and ecosystem services, in all aquatic habitats.
Some single trait categories showed different effects on ecosystem services depending on the
context/ecosystem. For instance, herbivorous fish could have a positive effect on protection of the
shoreline by controlling macroalgal blooms in coral reefs (Nyström et al. 2000; Hoey & Bellwood 2011;
D'Agata et al. 2014; Pratchett et al. 2014), but could have a negative effect on the same service by
consuming large amounts of seagrass in vegetation habitats in lower latitudes, therefore reducing these
natural barriers (Heck & Valentine 2006).

CHAPTER 2
23
Table 2.2 – Summary of fish traits and ecosystem services relationships. Response trend is given within parentheses (+ for positive or – for negative). The classification of ecosystem services was
adapted from Holmlund and Hammer (1999), de Groot et al. (2010) and Hattam et al. (2015).
Ecosystem service
Fish traits with reported effect on ecosystem service
Trait categories and response trend
Examples
Nutrient cycling: Natural cycling processes that allow the presence of nutrients in the water, for example: decomposition and mineralization, nutrient mobilization and availability, biogeochemical activity and biological productivity
Feeding mode, diet, habitat association, body size
Browser (+), grazer (-), herbivorous (-), planktivorous (+), omnivorous (+); benthic (+); small body size (+)
Planktivorous and benthivorous fish (like the common carp) have an important influence on nutrient regeneration and concentration, either by browsing feeding activity (Qin & Threlkeld 1990) or by digestive activity (Andersson et al. 1978). Grazer fishes may modulate the nature of nutrient cycling by primary producers, limiting significantly N concentrations on substrates they feed on, compared to substrates inaccessible to macroherbivores, as observed by Flecker et al. (2002). The gizzard shad (Dorosoma cepedianum) is an omnivorous fish that can be important to nutrient cycling, translocating nutrients from sediments to water and thus providing a subsidy of "new" nutrients into the water column to phytoplankton (Vanni et al. 2008). Because of the inverse relationship between body size and metabolic rates, small fish have the potential to excrete at higher rates than larger fish. In one case, a fish assemblage dominated by small-bodied planktivores recycled more P than an assemblage of large-bodied piscivores of equivalent biomass (Carpenter et al. 1992).
Coastal protection and disturbance prevention: Contribution of ecosystem structures to protect the coastal zone from erosion and attenuate the intensity of environmental disturbances (such as storm floods, tsunamis and hurricanes), through the production and maintenance of biogenic living structure (salt marshes, mangroves, seagrass beds, coral reefs)
Diet, feeding mode Biogenic habitats: herbivorous (+), omnivorous (+), detritivorous (+), corallivorous (-), grazer(+); Vegetated habitats: omnivorous (+), detritivorous (+), herbivorous (-), small grazer (+)
Biogenic habitat: Herbivorous reef fishes (primarily grazing species) support a large range of critical functional roles and services, such as the control of macroalgal establishment, removal and transport of sediments to provide a hard and clean substratum for coral recruitment and the bioerosion of dead corals which facilitates resilience to disturbances such as bleaching events (Nyström et al. 2000; Burkepile & Hay 2008; Hoey & Bellwood 2011; D'Agata et al. 2014; Pratchett et al. 2014). Detritivorous fishes are also involved in reef resilience (Cheal et al. 2010). Omnivorous fishes such as Diplodus spp. are also characterized by high species diversity and a high degree of specialization (browser, grazer, scraper, crusher), having the greatest impact on the structure and dynamics of coral reefs, where they directly control algal communities (Ruitton et al. 2000). Corallivorous fishes directly affect the coral condition by mechanical damage and tissue removal, which also facilitates algal competition and spreading of disease pathogens (Rotjan & Lewis 2008; Raymundo et al. 2009). Chronic predation by corallivores may also exacerbate effects of coral disturbance (e.g. climate-induced coral bleaching), impeding reef recovery and causing further coral loss (Cole et al. 2008). Vegetated habitat: Small grazers (mesograzers), as well as the omnivorous pinfish, have a dominant role in controlling the biomass of algae growing epiphytically on seagrass leaves (Heck et al. 2000; Heck & Valentine 2006). Studies over the last two decades have shown that a number of herbivorous fish species in lower latitudes ingest large amounts of aboveground seagrass biomass (Heck & Valentine 2006).
Maintenance of sediment processes and sediment redistribution: Processes involved in the structuring of bottom conditions and availability of sediments, such as soil formation, sedimentation, bioturbation and activity of benthic organisms
Habitat association, feeding mode, diet
Benthic (+), browser (+), grazer (+), detritivorous (+),
Fish activity induces mixing and resuspension of the soil (Avnimelech et al. 1999). Gelwick et al. (1997) describe how benthic algivorous fishes resuspend silt, detritus, and other particulate organic matter from the bottom into the current, as previously described by Flecker (1992) for a diverse fauna of grazing fishes (Holmlund & Hammer 1999). Bioturbation, accomplished by benthivorous fish, alters the structure and properties of the sediment and thereby influences diffusive and/or advective transport of both solutes and particulate matters. It also affects the underlying sediment layers (Adámek & Maršálek 2013). Adult carp (Cyprinus carpio) forage predominantly on benthic macroinvertebrates and, when doing so, they induce severe bioturbation of the pond bottom (Adámek & Maršálek 2013). Katz et al. (2002) concluded that while foraging for food and swimming near the sediment surface, mullets resuspend detritus, increase the oxygen supply to the benthos and oxygenate buried organic matter, thereby dramatically improving the status of organically enriched, reduced sediments within a relatively short period of time.

CHAPTER 2
24
Table 2.2 (continued).
Ecosystem service Fish traits with reported effect on ecosystem service
Trait categories and response trend
Examples
Biological control: Maintenance of natural healthy population dynamics, regulation of food web dynamics and control of invasive species, pest regulation, storage and transfer of minerals and energy in food chains, maintenance of resilient and robust community structure
Body size, diet, feeding mode, trophic level
Bottom-up control: low TL(+), planktivorous (+). Wasp-waist control: small planktivorous fish (+). Top-down control: High TL (+), large fish (+), macrocarnivorous (+), hunter (+). Control of diseases: Larvivorous (+), insectivores (feed on larvae/eggs of insects) (+). Control of invasions: Omnivorous (+), macrocarnivorous (+). Control of algal blooms: grazer(+), filterer(+)
Bottom-up control: The peak landings of piscivores (high trophic level) later in the time series than for zooplanktivores (low trophic level), appears consistent with an overall bottom-up response to the earlier increase in abundance of forage fish (Caddy & Garibaldi 2000). Wasp-waist control: In eastern boundary current systems such as the California Current and the Humboldt Current, zooplankton biomass has been observed to have decreased over the past few decades. These long-term declines in zooplankton may also be related to major changes in the abundance of small pelagic fishes(Verheye & Richardson 1998). Top-down control: The strongest evidence for a key role of predators in controlling subtidal reef communities in the southern hemisphere is from two New Zealand marine reserves where there has been a decline in urchin densities and an associated change from urchin barrens to kelp over a 20-year period (Shears & Babcock 2002) because of the density and size of urchin predators (two of them are fish species). A rise in piscivore biomass brings decreased planktivore biomass, increased herbivore biomass, and decreased phytoplankton biomass (Carpenter et al. 1985). Large fish species eat the smaller ones, being between one or three orders of magnitude larger than their prey in terms of body mass (Strange et al. 1999; Woodward et al. 2005). Control of diseases: Larvivorous fishes (Gambusia holbrooki, Aphaniusdispar dispar and Aphanius sp.) are used as biological agents in malaria control (Shahi et al. 2015). Gambusia affinis can be an effective biological control agent in rice fields, feeding on mosquitoes (Culex tarsalis and Anopheles freeborni) and thus preventing diseases such as arboviruses and malaria (Hoy et al. 1972). Control of invasions: There are fish species that control invasive fish species, either on their adult phase, having a macrocarnivorous diet - for example the Caribbean grouper is a natural biocontrol of the invasive lionfish in coral reefs (Mumby et al. 2011)- or on initial phases of development, having an omnivorous diet - for example the Japanese dace consumes smallmouth bass eggs, an exotic species in Japan which is a threat to native biodiversity (Iguchi & Yodo 2004). Control of algal blooms: Removal of grazers from shallow-water environments may prompt increases in macroalgal standing crops that could be considered to be blooms (Valiela et al. 1997). Silver and bighead carp, both filter-feeding, are highly effective in controlling noxious blooms of algae (Xie & Liu 2001).
Climate regulation: Contribution of the biotic elements of an ecosystem to the conservation of a favourable climate through hydrological processes, regulation of climate-influencing substances, biogeochemical processes and heat exchange
Diet Macrocarnivorous (-), herbivorous (-), planktivorous (+), detritivorous (+)
Experiments comparing two nutrient-enriched lakes in USA have linked the composition of fish communities with ecosystem carbon fixation. One of the lakes, with zooplanktivorous fish became a carbon sink (because zooplankton were suppressed, and primary producers - carbon fixers - were released from grazing pressure) and the other lake, with piscivores, became a carbon source (because the piscivores supressed the abundance of zooplanktivores, allowing the zooplankton community to exert a high grazing pressure on phytoplankton), thus indirectly mediating the flux of carbon between the lake and the atmosphere (Schindler et al. 1997). Herbivorous fishes have a negative influence on carbon fixation because they feed on primary producers (Holmlund & Hammer 1999). The flannelmouth characin (Prochilodus mariae), a detritivorous fish, regulates fundamental ecosystem processes, synthesis and degradation of organic carbon. Removing Prochilodus altered multiple components of organic carbon flow. This fish changed the composition of microbial biofilms to attached nitrogen-fixing cyanobacteria. By removing particles that reduce light essential for N fixers, they may facilitate a source of primary production that is independent of N limitation (Taylor et al. 2006).

CHAPTER 2
25
Table 2.2 (continued).
Ecosystem service Fish traits with reported effect on ecosystem service
Trait categories and response trend
Examples
Air purification: Regulation of the concentration of air pollutants in the atmosphere by the ecosystem components through absorption
Diet Herbivorous (+) The herbivorous damselfishes enhance several reef processes such as primary production (Hixon & Brostoff 1996), recovery of reef corals (Done et al. 1991) and nitrogen fixation since cyanobacteria are more common within their territories than outside (Hixon & Brostoff 1996). Damselfish territoriality influences the dynamics of some reefs by increasing the biomass of the algal turf and thus increasing reef productivity, since blue-green algae, potential nitrogen fixers, occur in these algal turfs (Brawley & Adey 1977).
Waste treatment and assimilation: Removal of contaminants and organic nutrients added to the environment by humans through ecosystem processes, such as: degradation, mineralization, transformation and conversion of toxicants to less toxic substances; burial of toxicants through bioturbation; sequestration of toxicants by living organisms; dilution and dispersal of toxicants through hydrodynamics; oxygen regulation in water
Trophic level, feeding mode, diet
High trophic level (+); filterer (+); herbivorous (+), macrocarnivorous (+)
Yellowfin tuna can record high mercury concentrations in their tissues due to biomagnification of this metal in the trophic chain and to the high position tuna occupy in the trophic chain (Ordiano-Flores et al. 2011). Silver and big-head carp, both filter-feeding, can accumulate PCBs (Zhou et al. 1999). One of the purification processes of Lake Taihu is nutrient feeding by fish (by eating aquatic plants), which accounts for 2039 to 2234 ton nitrogen and 140 to 150 ton phosphorus removal in water body per year (Han et al. 2015). The Baltic Sea fish community is a large sink for PCBs, with the most abundant species being sprat, herring and cod. Adult cods are predators of herring and sprat, and their livers have a much higher concentration of lipids and thus PCBs (which are highly lipophilic) (Mackenzie et al. 2004).
Regulation of linkages between ecosystems: Transportation and distribution of energy, nutrients and genetic material within and between different aquatic ecosystems (lakes, rivers, oceans, estuaries), ensuring the maintenance of migratory and nursery habitats
Ecological group, body size, mobility, reproductive mode
Catadromous (+), anadromous (+), marine-estuarine dependent(+) and marine-estuarine opportunist (+), large body size (+); high mobility (+); oviparous with pelagic eggs(+)
Several species of anadromous salmonid fishes migrate from marine environments where they spend most of their lives, to natal rivers to spawn and then die, and thereby transfer nutrients and carbon (Bilby et al. 1996). Catadromous European eels (Anguilla anguilla) in the Baltic Sea are one example of long-distant migrating fish species that transport nutrients, carbon and other substances from one part of the world’s seas to another, spending most of their life in fresh or brackish waters where they feed and grow before they return to their spawning grounds in the Sargasso Sea, over 8000 km away, where they reproduce and then die (Holmlund & Hammer 1999). Connectivity between estuaries and adjacent coastal ocean is very important for a great number of marine migrant fish species, like Solea solea and Diplodus vulgaris, which use these sheltered estuarine areas as juveniles (Koutsikopoulos et al. 1989; Cabral & Costa 1999; Vasconcelos et al. 2008; Abecasis et al. 2009). These fish species spawn at sea where their pelagic eggs hatch, and ocean currents carry the larvae into estuaries, where they develop into juveniles and then move offshore after attaining a large proportion of their adult size (Deegan 1993). Home range or territory size tends to increase with body size (Woodward et al. 2005).

CHAPTER 2
26
Case study – Mondego estuary
The environmental variables in the Mondego estuary showed seasonal, spatial and temporal variation
(Figures 2.3-2.6). Salinity was higher in stations M and S1 and lower in station N2. Generally, lower
salinities were registered in winter and higher salinities were registered in summer, with the highest
salinity in 2007. Temperature was higher in station S2 and lower in station M, where oxygen values were
generally higher. Oxygen was lower in station S2. The highest precipitation level was registered in autumn
of 2006 and the highest runoff value was in winter of 2010. Temperature was higher in summer and lower
in winter, and oxygen was generally lower in summer and higher in spring and winter.
Figure 2.3 – Variation of salinity in the Mondego estuary.
Figure 2.4 – Variation of temperature in the Mondego estuary.
0
5
10
15
20
25
30
35
40
sum
mer
autu
mn
win
ter
spri
ng
sum
mer
win
ter
spri
ng
sum
mer
autu
mn
win
ter
spri
ng
sum
mer
autu
mn
win
ter
spri
ng
sum
mer
autu
mn
win
ter
spri
ng
sum
mer
win
ter
spri
ng
sum
mer
autu
mn
win
ter
spri
ng
sum
mer
autu
mn
win
ter
spri
ng
sum
mer
autu
mn
win
ter
spri
ng
sum
mer
autu
mn
win
ter
spri
ng
sum
mer
autu
mn
win
ter
2003 2004 2005 2006 2007 2008 2009 2010 2011 2012 2013
Ave
rage
sal
init
y
Year and season
M
N1
N2
S1
S2
Station
0
5
10
15
20
25
30
sum
mer
autu
mn
win
ter
spri
ng
sum
mer
win
ter
spri
ng
sum
mer
autu
mn
win
ter
spri
ng
sum
mer
autu
mn
win
ter
spri
ng
sum
mer
autu
mn
win
ter
spri
ng
sum
mer
win
ter
spri
ng
sum
mer
autu
mn
win
ter
spri
ng
sum
mer
autu
mn
win
ter
spri
ng
sum
mer
autu
mn
win
ter
spri
ng
sum
mer
autu
mn
win
ter
spri
ng
sum
mer
autu
mn
win
ter
2003 2004 2005 2006 2007 2008 2009 2010 2011 2012 2013
Ave
rage
tem
per
atu
re (
C)
Year and season
M
N1
N2
S1
S2
Station

CHAPTER 2
27
Figure 2.5 – Variation of oxygen in the Mondego estuary.
50
60
70
80
90
100
110
120su
mm
erau
tum
nw
inte
rsp
rin
gsu
mm
erw
inte
rsp
rin
gsu
mm
erau
tum
nw
inte
rsp
rin
gsu
mm
erau
tum
nw
inte
rsp
rin
gsu
mm
erau
tum
nw
inte
rsp
rin
gsu
mm
erw
inte
rsp
rin
gsu
mm
erau
tum
nw
inte
rsp
rin
gsu
mm
erau
tum
nw
inte
rsp
rin
gsu
mm
erau
tum
nw
inte
rsp
rin
gsu
mm
erau
tum
nw
inte
rsp
rin
gsu
mm
erau
tum
nw
inte
r
2003 2004 2005 2006 2007 2008 2009 2010 2011 2012 2013
Ave
rage
oxy
gen
(%
)
Year and season
M
N1
N2
S1
S2
Station
0
100000
200000
300000
400000
500000
600000
700000
800000
900000
0
20
40
60
80
100
120
140
160
sum
mer
autu
mn
win
ter
spri
ng
sum
mer
win
ter
spri
ng
sum
mer
autu
mn
win
ter
spri
ng
sum
mer
autu
mn
win
ter
spri
ng
sum
mer
autu
mn
win
ter
spri
ng
sum
mer
win
ter
spri
ng
sum
mer
autu
mn
win
ter
spri
ng
sum
mer
autu
mn
win
ter
spri
ng
sum
mer
autu
mn
win
ter
spri
ng
sum
mer
autu
mn
win
ter
spri
ng
sum
mer
autu
mn
win
ter
2003 2004 2005 2006 2007 2008 2009 2010 2011 2012 2013
Ave
rage
ru
no
ff (
dam
3 )
Ave
rage
pre
cip
itat
ion
(m
m)
Year and season
Average of Precipitation Average of Runoff
Figure 2.6 – Variation of precipitation and runoff in the Mondego estuary.

CHAPTER 2
28
The hierarchical cluster analysis identified seven functional groups (FG) in the Mondego estuary fish
assemblage which differ in their traits (Figure 2.7; Tables 1-3 - Appendix I). These FG may be able to
provide different ecosystem services, as follows:
Figure 2.7 – Dendrogram produced by cluster analysis of the fish assemblage of the Mondego estuary based on five traits
(mobility, body size, diet, feeding mode and salinity preference).
Group 1 Group 2 Group 3 Group 4 Group 5 Group 6 Group 7

CHAPTER 2
29
Group 1 – Fish species that feed by hunting other organisms. In general, fishes of this group are
macrocarnivorous, prefer marine environments and are sedentary. Their feeding mode and diet make them
very important for biological control, specifically top-down control and control of invasive species (Table
2.2). Two species have very small body size, which could mean they have an important role in nutrient
cycling, because their excretion rates are higher than larger species (Table 2.2). However, the potential
role of these very small fish species in the delivery of this ecosystem service depends on their abundance.
Group 2 – Marine fish species with high mobility, with an important role in linking the estuary and
other ecosystems, reinforced by the fact that half of the species have large body size (Table 2.2). There are
browsers in this group, which may mean they influence provision of services like nutrient cycling,
maintenance of sediment processes and sediment redistribution (Table 2.2).
Group 3 – Invertebrate feeders with a salinity preference for marine environments. Most have small
body size, which means they possibly contribute to nutrient cycling, and browsing feeding mode, which
can be indicative of an important role in the maintenance of sediment processes and sediment
redistribution (Table 2.2). Two species have high mobility, which could contribute to the regulation of
linkages between the estuary and other aquatic systems, although that would depend on the abundance of
these species.
Group 4 – Hunter fish species with small body size, also invertebrate feeders and omnivorous fishes.
These fish species may have a substantial influence in nutrient cycling due to small size and omnivorous
diet, although this depends on their abundance. This type of diet can also contribute indirectly to the
provision of services like coastal protection and disturbance prevention, by controlling the growth of
epiphytes in seagrass beds and therefore protecting these structures (Table 2.2). Also, omnivorous diet
contributes to biological control, which is also provided by the hunters in the group. All members are
marine and brackish species, although two can also tolerate freshwater.
Group 5 – Heterogeneous in terms of functional traits, although most members have small body size - a
characteristic usually connected to nutrient cycling. Includes filter feeding species, which could provide
ecosystem services like biological control and waste treatment and assimilation, and all planktivorous
species, which may be linked to services such as nutrient cycling, biological control and climate regulation
(Table 2.2).
Group 6 – Browser fishes with various diets, most with medium body size. All members tolerate all
types of salinities (marine, brackish and freshwater) and most have high mobility, which suggests they can
live in different aquatic environments and migrate between them, potentially contributing for the
regulation of linkages between ecosystems. Their feeding mode and wide diet possibilities can also be
indicators of their role in nutrient cycling, maintenance of sediment processes and redistribution,
biological control (specifically, control of invasions), coastal protection and disturbance prevention, the
latter service provided by omnivorous fish who protect biogenic structures by controlling algal
communities (Table 2.2). Two species have a detritivorous diet, which could contribute indirectly to
climate regulation, because they may remove particles that reduce light for primary producers, therefore
facilitating carbon fixation (Table 2.2).
Group 7 – Freshwater omnivorous species, which can contribute to nutrient cycling, coastal protection
and disturbance prevention and biological control (Table 2.2). Two browser species possibly contribute to
maintain sediment processes and redistribution.
Functional groups 5 and 6 were the most represented in the Mondego estuary fish assemblage (in terms
of biomass, density and number of species; see Figure 2.8-2.10). Group 7 had lower number of species and
density, while group 4 showed the lowest biomass.

CHAPTER 2
30
Figure 2.8 – Variation of fish functional groups (quantified by the sum of cumulative biomass of a group in all samples) in
the Mondego estuary. A – Spatial variation. B – Seasonal variation. C – Temporal variation.
Figure 2.9 – Variation of fish functional groups (quantified by the sum of cumulative density of a group in all samples) in the
Mondego estuary. A – Spatial variation. B – Seasonal variation. C – Temporal variation.
0
50000
100000
150000
M N1 N2 S1 S2
Bio
mas
s (g
)
Station A
0
20000
40000
60000
80000
autumn winter spring summer
Bio
mas
s (g
)
Season B
0
10000
20000
30000
40000
50000
2003 2004 2005 2006 2007 2008 2009 2010 2011 2012 2013
Bio
mas
s (g
)
Year
G7
G6
G5
G4
G3
G2
G1
C
Group
0
2000
4000
6000
M N1 N2 S1 S2Den
sity
(in
d/m
2)
Station A
0
2000
4000
6000
autumn winter spring summerDen
sity
(in
d/m
2)
Season B
0
500
1000
1500
2000
2500
3000
2003 2004 2005 2006 2007 2008 2009 2010 2011 2012 2013
Den
sity
(in
d/m
2)
Year
G7
G6
G5
G4
G3
G2
G1
Group
C

CHAPTER 2
31
Figure 2.10 – Variation of fish functional groups (quantified by the sum of the cumulative number of species of a group in all
samples) in the Mondego estuary. A – Spatial variation. B – Seasonal variation. C – Temporal variation.
Traits biomass, density and also number of species varied among functional groups, with group 6
presenting the highest percentage for high mobility and group 7 being the only group without marine
species (Tables 1-3 - Appendix I). In terms of diet, invertebrate feeders were the most represented within
the fish assemblage, especially concerning groups 3, 5 and 6. Omnivorous and macrocarnivorous were
also well represented in the fish assemblage. Planktivorous were only present in group 5 and detritivorous
were only present in group 6. The majority of the fish assemblage (by number of species) is characterized
by high mobility (49%), small body size (42%), browsing feeding mode (60%), and salinity preference for
marine water (51%; see Table 3 - Appendix I).
The ordination of fish species in the Mondego estuary considering their functional traits using Principal
Coordinates Analysis (PCO) revealed patterns that complement and are in agreement with the information
provided by the cluster analysis of traits alone (Figure 2.11). There is a clear separation between
freshwater species and remaining species, although Gambusia holbrooki is closer to the rest of species
because of its brackish salinity preference. Species from groups 4 and 5 are closer together in the PCO,
probably because of their small body size and marine and brackish salinity preference. Group 2 shows the
highest dispersion of species, with Spondyliosoma cantharus and Diplodus vulgaris being closer to other
omnivorous species and Conger conger and Scophthalmus rhombus closer to other macrocarnivorous
species. These four species also differ in their feeding modes, which could explain the differences in
distribution in the plot. Two species of group 3, Arnoglossus laterna and Mullus surmuletus, are farther
from the remaining species in their group because they are hunters, with the rest being browsers. Sardina
pilchardus seems closer to species of group 6, despite belonging to group 5.
0
200
400
600
800
M N1 N2 S1 S2
Num
ber
of
spec
ies
Station A
0
200
400
600
800
autumn winter spring summer
Num
ber
of
spec
ies
Season B
0
100
200
300
400
2003 2004 2005 2006 2007 2008 2009 2010 2011 2012 2013
Num
ber
of
spec
ies
Year
G7
G6
G5
G4
G3
G2
G1
Group
C

CHAPTER 2
32
Figure 2.11 – Principal Coordinates Analysis comparing the fish assemblage of the Mondego estuary based on five traits:
mobility, body size, diet, feeding mode and salinity preference (Mobility categories: Mobhigh – high; MobMed – medium;
Mobterrit – territorial; Mobsedent – sedentary. Body size categories: BodsizLarge – large; BodsizMed – medium; BodsizSmall –
small; BodsizVsmall – very small. Diet categories: DietPla – planktivorous; DietInv – invertebrate feeders; DietOmn –
omnivorous; DietMac – macrocarnivorous; DietDet – detritivorous. Feeding mode categories: FmodeBro – browsers; FmodeFil –
filterers; FmodeHun – hunters). Salinity preference categories are represented by Marine, Brackish and Freshwater (0 – no; 1 –
yes). Species names are abbreviated. See full species names in Figure 2.7 (the abbreviation includes the first three letters of both
genus and species).
PERMANOVA results showed that fish density, biomass and species richness of each functional group
differed between stations (Tables 2.3-2.5), except for group 7 (in all measures) and group 4 (in species
richness). Seasonal differences were only found for fish biomass and species richness of the functional
groups, in spite of total density of species also showing differences among seasons. Inter-annual
differences were found for all the measures, but not for all functional groups. Pair-wise comparisons
(Tables 1-3 - Appendix II) for factor station revealed differences in fish metrics, but not between stations
N1 and N2. Only species richness in group 5 and biomass in group 6 showed significant differences
between these two stations. Pair-wise tests among seasons for biomass of species in each functional group
were always significant, except between summer and spring, and autumn and winter for groups 2, 3 and 4.

CHAPTER 2
33
Total biomass showed no differences between summer and autumn, summer and spring and autumn and
spring. Seasonal differences were detected in pair-wise comparisons for total density of species between
summer and autumn, summer and winter and summer and spring. Species richness showed no differences
between seasons, except for groups 3, 4 and 5. For factor year, pair-wise tests showed differences for
groups 5 and 6 for all measures.

CHAPTER 2
34
Table 2.3 - PERMANOVA results for the differences in biomass of each functional group concerning factors season, station and year. For each test the mean, standard deviation
(SD) and p-value - P(perm) - are represented (* for p-value < 0.05, NS for non-significant p-value).

CHAPTER 2
35
Table 2.4 - PERMANOVA results for the differences in density of each functional group concerning factors season, station and year. For each test the mean, standard deviation
(SD) and p-value - P(perm) - are represented (* for p-value < 0.05, NS for non-significant p-value).

CHAPTER 2
36
Table 2.5 - PERMANOVA results for the differences in species number of each functional group concerning factors season, station and year. For each test the mean, standard
deviation (SD) and p-value - P(perm) - are represented (* for p-value < 0.05, NS for non-significant p-value).

CHAPTER 2
37
The results of the GLM showed that biomass, density and number of species of the several trait
categories were slightly related to the analyzed continuous environmental variables (Tables 2.6-2.8 and
Appendix III). Many of the traits were positively linked with temperature (but negatively for detritivorous
and hunters) and salinity (but negatively for detritivorous and freshwater species), and were negatively
linked with oxygen (positively for territorial species and filterers). Smaller and larger species seem to
respond differently to environmental variables: smaller increasing with salinity and decreasing with
temperature, and the opposite for the larger. However, both respond negatively to oxygen. Relationships
with runoff, precipitation and NAO index were very poor.
In contrast, the variation of fishes’ traits was strongly related to station and also, though less, to year
and showed a small relationship with season for all the measures used (i.e. biomass, density and number of
species) (Tables 2.6-2.8 and Appendix III). Generally, station M (with higher oxygen values) and S2 (with
higher temperature) showed higher density of traits, as well as number of species with those traits. The
biomass of traits varied between stations, with higher values generally present at stations M and N1 and
lower values at station S1. Mobility was the most responding trait to season, with sedentary species
richness and density decreasing in autumn (with lower temperature) and medium mobility species number
and biomass increasing in autumn (with lower oxygen and higher salinity). Species with very small body
size (for density and biomass), hunters (for density and number of species) and freshwater species (for
density and number of species) were generally more important in spring and summer and lower in autumn.
Hunter species respond positively to salinity, which shows higher values in summer. As for factor year,
2003 was by far the year with the highest biomass, density and number of species, followed by 2009 and
2011. The years of 2006, 2007 and 2008 generally showed the lowest values for traits measures (see
Appendix III).
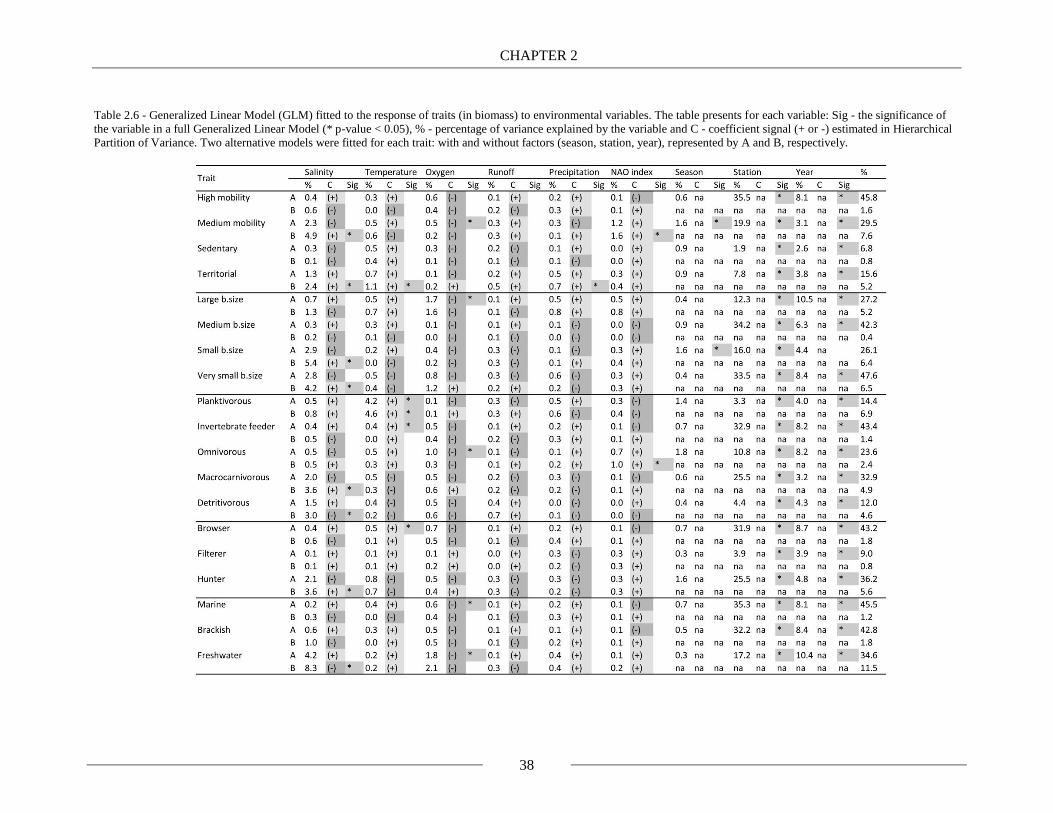
CHAPTER 2
38
Table 2.6 - Generalized Linear Model (GLM) fitted to the response of traits (in biomass) to environmental variables. The table presents for each variable: Sig - the significance of
the variable in a full Generalized Linear Model (* p-value < 0.05), % - percentage of variance explained by the variable and C - coefficient signal (+ or -) estimated in Hierarchical
Partition of Variance. Two alternative models were fitted for each trait: with and without factors (season, station, year), represented by A and B, respectively.

CHAPTER 2
39
Table 2.7 - Generalized Linear Model (GLM) fitted to the response of traits (in density) to environmental variables. The table presents for each variable: Sig - the significance of the
variable in a full Generalized Linear Model (* p-value < 0.05), % - percentage of variance explained by the variable and C - coefficient signal (+ or -) estimated in Hierarchical
Partition of Variance. Two alternative models were fitted for each trait: with and without factors (season, station, year), represented by A and B, respectively.

CHAPTER 2
40
Table 2.8 - Generalized Linear Model (GLM) fitted to the response of traits (in number of species) to environmental variables. The table presents for each variable: Sig - the
significance of the variable in a full Generalized Linear Model (* p-value < 0.05), % - percentage of variance explained by the variable and C - coefficient signal (+ or -) estimated
in Hierarchical Partition of Variance. Two alternative models were fitted for each trait: with and without factors (season, station, year), represented by A and B, respectively.

CHAPTER 2
41
Functional redundancy of the total assemblage differed between stations (for both biomass and density,
with higher redundancy in stations N1 and N2 and lower in M and S1) and also between seasons (in
density, with higher redundancy in spring and autumn), but not years (Tables 2.9-2.10). Functional
redundancy was null for functional group 7 whilst for functional groups 2, 3, 5 and 6 it varied with the
tested factors, but differently and not necessarily for same measures (density and biomass): spatial
variation was found for groups 5 (showing higher functional redundancy in stations M and S2) and 6
(presenting higher functional redundancy in stations N1 and N2); seasonal variation for groups 3 (with
higher functional redundancy in autumn and winter) and 5 (with higher functional redundancy in autumn
and spring); and inter-annual variation for groups 2, 5 and 6. The years showing higher functional
redundancy were 2011 (for biomass of group 5), 2007 (for density of group 2) and 2009 (for density of
group 6).

CHAPTER 2
42
Table 2.9 - Functional redundancy (FR) by season, station and year for total biomass of species and for each functional group, represented by mean, standard-deviation (SD) and p-
value from PERMANOVA (* for p-value < 0.05, NS for non-significant p-value).

CHAPTER 2
43
Table 2.10 - Functional redundancy (FR) by season, station and year for total density of species and for each functional group, represented by mean, standard-deviation (SD) and p-
value from PERMANOVA (* for p-value < 0.05, NS for non-significant p-value).

CHAPTER 2
44
Discussion
In this study, the fish assemblage of the Mondego estuary was characterized in terms of its functional
traits in order to assess its role in ecosystem functioning and services. This was accomplished with the
identification of functional groups within the fish assemblage and a literature review of the links between
functional traits of fish and ecosystem functioning and regulating ecosystem services. In our innovative
approach we assessed how the studied fish assemblage potentially influences ecosystem functioning and
services, its degree of resilience (i.e. measured through functional redundancy) and how it is regulated by
environmental variables.
Literature review of links between fish functional traits and ecosystem functioning and services
The literature review allowed the identification of several links between fish traits and ecosystem
services, and especially highlighted links for traits such as feeding mode and diet. It should be noted that
the links of traits with two of the studied regulating ecosystem services were context-specific. Specifically,
coastal protection and disturbance prevention showed different links with fish traits depending on habitat:
biogenic habitats such as coral reefs (Cheal et al. 2010) or vegetated habitats like seagrass beds (Heck &
Valentine 2006). Also, links with biological control were divided in food web control (separating bottom-
up control, wasp-waist control from top-down control), control of diseases, control of invasions and
control of algal blooms (Valiela et al. 1997; Caddy & Garibaldi 2000; Cury et al. 2003; Iguchi & Yodo
2004; Shahi et al. 2015).
The majority of evidence found in the literature was for indirect relationships between functional traits
and the provision of ecosystem services. For example, herbivorous fish contribute to the control of
establishment of macroalgae in coral reefs, thus enhancing the resilience of these natural barriers, which is
essential for the service of coastal protection and disturbance prevention (Nyström et al. 2000; Hoey &
Bellwood 2011; Pratchett et al. 2014). Nevertheless, direct connections were found, for example, between
migrating fish species (with high mobility) and the regulation of linkages between ecosystems, such as
estuaries and coastal zones (Deegan 1993; Holmlund & Hammer 1999).
Several traits (e.g. feeding modes such as browsing, grazing and filtering) can influence more than one
ecosystem service (Andersson et al. 1978; Holmlund & Hammer 1999; Zhou et al. 1999; Xie & Liu 2001;
Adámek & Maršálek 2013; Pratchett et al. 2014). Dietary traits generally influenced more than one
ecosystem service, although showing different effects depending on the service, for example:
macrocarnivorous fish showed a positive effect (enhancement) on top-down control (Carpenter et al.
1985) but a negative effect (diminution) on climate regulation (Schindler et al. 1997); while herbivorous
fish enhanced waste treatment and assimilation (Han et al. 2015) but decreased nutrient cycling (Flecker et
al. 2002). In contrast, omnivorous, detritivorous and planktivorous fish showed a positive effect in the
provision of several ecosystem services, such as nutrient cycling, coastal protection and disturbance
prevention and biological control (Andersson et al. 1978; Ruitton et al. 2000; Taylor et al. 2006; Vanni et
al. 2008). Body size also had noteworthy connections to the provision of ecosystem services, showing
different effects: for example smaller fish contribute highly to nutrient cycling because they have higher
metabolic and excretion rates than larger fish, thus increasing nutrient concentrations in the water
(Carpenter et al. 1992); meanwhile larger fish are effective in controlling smaller fish populations
(biological control), (Strange et al. 1999; Woodward et al. 2005) and in the regulation of linkages between
ecosystems since larger fish usually have wider home ranges and territories, thus being able to move over
larger distances than smaller fish (Woodward et al. 2005). Overall, since these traits (i.e. feeding mode,
diet and body size) show connections to ecosystem functioning and have also been used in several

CHAPTER 2
45
functional characterization studies of fish and invertebrates (Bremner et al. 2003; Gerino et al. 2003;
Auster & Link 2009; Baptista et al. 2015b; Costello et al. 2015), they apparently have significant potential
in research about ecosystem functioning and services.
Functional groups of the fish assemblage in the Mondego estuary
Based on five functional traits (i.e. mobility, body size, diet, feeding mode and salinity preference), the
fish assemblage of the Mondego estuary was characterized in seven functional groups (through cluster
analysis). Considering that the seven functional groups in the fish assemblage display different
combinations of traits, they can also have a different potential to contribute to specific ecosystem services,
as shown by García-Llorente et al. (2011) for aquatic plant communities. Considering our literature review
of links between functional traits and ecosystem functioning and services, the Mondego estuary fish
assemblage includes a high number of functional groups that can enhance nutrient cycling, biological
control and maintenance of sediment processes and sediment redistribution. Moreover, although waste
treatment and assimilation and also climate regulation services seem to be less enhanced by this fish
assemblage (since they are only promoted by group 5 and groups 5 and 6, respectively) the high number of
species, abundance and biomass that represent functional groups 5 and 6 might be indicative of the high
importance of this fish assemblage to these services. However, further research should quantify the
contribution of fish assemblages to services in order to establish which are the most important and may
require conservation efforts. The only regulating service not especially influenced by the Mondego estuary
fish assemblage was air purification, because none of the species is herbivorous.
Variation and drivers of fish functional traits and groups in the Mondego estuary
Spatial differences of three measures (biomass, density and species richness) of each functional group
(except group 7) among stations within the Mondego estuary are probably associated with environmental
conditions. Higher values of these three measures for the majority of the functional groups at station M
could be due to higher salinity and oxygen in this station (near the mouth of the estuary), given that this
fish assemblage is mostly composed by marine species (Nyitrai et al. 2012; Baptista et al. 2015b). In
contrast, station N2 - the most upstream and with lower salinities - showed the lowest values for groups 1,
2 and 3 (in all three measures) because these groups (particularly 2 and 3) are composed by markedly
marine species. The lower biomass and density of groups 5 and 6 at station S1 may be explained by: lower
temperature at this station for group 5, because it contains planktivorous species that are positively
correlated to temperature (according to the GLM) and therefore may decrease at this station, with lower
temperature; and higher salinity at this station for group 6, because it is an environmental variable
negatively correlated to detritivorous species (present in group 6), according to the GLM, which may lead
to their decrease at this station, presenting higher salinity. Also, Whitfield et al. (2006) showed that long-
term effects of hyperhaline conditions (i.e. above 40) in estuaries are negative for detritivorous fish.
However, this trend may need further investigation. Group 7 was the only group without significant
differences between stations, probably because it is the smallest group regarding species number (with
only three freshwater species), that showed the lowest biomass, density and species richness in the
sampling period (2003-2013). This could have contributed to the absence of significant differences
between stations. Moreover, there has been evidence of a progressive decrease of freshwater species
within the section of the estuary covered by this monitoring program, due to an increase of salinity, mostly
because of anthropogenic interventions, such as dredging activities (Leitão et al. 2007; Nyitrai et al.
2012).

CHAPTER 2
46
In addition, the fish functional groups also showed seasonal variations. Seasonal differences in species
richness for group 5 could be related to temperature, as the highest values were registered in spring and the
lowest values in winter. Moreover, GLM showed a positive correlation between number of planktivorous
species (present only in group 5) and temperature. However, differences in biomass of groups 2, 3 and 4
between seasons may have different reasons, such as recruitment dynamics (Akin et al. 2003), because
these groups contain marine species which colonize estuaries as stragglers or frequently as migrants - in
this case using the estuary as juveniles and usually showing preference for areas with lower salinity
(Leitão et al. 2007). These groups showed higher biomass in winter and autumn, possibly reflecting the
growth and production of the species after recruitment earlier in the year (Rosecchi & Crivelli 1992; Dinis
et al. 1999; Gonçalves et al. 2003), as suggested by a higher species richness of group 4 observed in
summer. Higher temperatures could also increase the number of omnivorous species (present in group 4)
as shown in GLM, since it has been shown that omnivorous species benefit from drought conditions,
where temperature is higher, because they have the capacity to adapt their diet from wet to dry periods,
being therefore more tolerant to drought conditions than invertebrate feeders (Chessman 2013; Baptista et
al. 2015b).
PERMANOVA revealed inter-annual differences in groups 5 and 6 for all functional group measures
(biomass, density and species richness) which may be related to changes in climate patterns, especially
regarding precipitation and runoff which varied greatly (Nyitrai et al. 2012). Consistently with our results,
several drought and non-drought years were identified between 2003 to 2010 by Baptista et al. (2010)
which also reported higher mean density of some species of our group 5 in non-drought years (namely
Gobius niger, Pomatoschistus minutus, Solea solea and Aphia minuta) and of the majority of species in
our group 6 (Anguilla Anguilla, Dicentrarchus labrax, Platichthys flesus, Pomatoschistus microps and
Liza ramada). Inter-annual differences in biomass of group 2 and 4, density of groups 1, 2 and 3 and
number of species of group 1 could also be related to precipitation, since the highest values were
registered for 2003, considered a regular hydrologic year in terms of precipitation by Nyitrai et al. (2012).
Generalized Linear Models revealed significant connections between salinity, temperature and oxygen
and fish functional trait measures, which is consistent with other studies carried out in estuaries which
observed effects of these environmental variables in the structure of estuarine assemblages (Marshall &
Elliott 1998; Araújo et al. 1999; Akin et al. 2003). For example, França et al. (2011) reported that
upstream-downstream temperature and salinity gradient within the Mondego estuary were significant
predictors of species richness, although this was shown only for May and July 2006. In our study, the
majority of traits were positively correlated with salinity and temperature and negatively for dissolved
oxygen. However, relationships between traits and environmental conditions seem to be complex since,
for example, density and species richness of groups 1, 2, 3 and 5 is higher at station M (at the mouth of the
estuary) which presents higher dissolved oxygen, but oxygen showed a negative (but very weak, with 0.5
to 7.2% of variance explained by the GLM) correlation with most of the traits. This likely reflects a
mixture of spatial, seasonal and inter-annual interactive effects of these environmental variables on the
fish assemblage. The lower values of trait metrics for stations S1 and N2 can be related to lower salinities
in N2, as observed by Leitão et al. (2007), and lower temperatures in S1. Also, there are inter-annual
differences related to salinity, since in 2006, when lower values of most traits were registered, salinity
decreased in the estuary, possibly because of higher precipitation (Nyitrai et al. 2012).
Mobility traits varied with temperature, which is probably related to increased occasional migrations of
marine species and of juvenile life stages (Akin et al. 2003), with sedentary species responding positively
to higher temperature and salinity, which is reinforced by the observed increase in density and species

CHAPTER 2
47
richness of these species in spring and summer and an evident decrease in autumn. This was also observed
for species with very small body size and freshwater species, which respond positively to temperature (but
negatively to salinity, in the case of freshwater species). However, the predominant variations in trait
measures were spatial and not seasonal, for all traits, which reflects differences in environmental variables
between stations, as was also observed by Leitão et al. (2007) and Baptista et al. (2010). Additionally,
hunters respond positively and strongly to salinity (and negatively to temperature), as well as species with
a macrocarnivorous diet, because all species presenting these traits are marine species (better adapted to
polyhaline and euhaline conditions) (Whitfield et al. 2012). Invertebrate feeders responded positively to
temperature and salinity, constituting the majority of the fish assemblage in the Mondego (Nyitrai et al.
2012). These results are consistent with general patterns in temperate regions, where the abundance of
benthic invertebrates decreases in autumn and winter and increases in summer, after spring recruitment,
which is primarily driven by environmental conditions (Chainho et al. 2007). Thus, the positive response
of invertebrate feeders to these variables may be related to food availability. This type of diet is very
common in European estuaries, benefiting from the high productivity of estuarine systems (Franco et al.
2006; França et al. 2009).
In contrast with most traits, biomass and species richness of detritivores were negatively correlated
with salinity, and their density was negatively correlated with temperature. The detritivorous feeders in the
Mondego estuary fish assemblage (i.e. Mugil cephalus and Liza ramada) belong to group 6, which showed
higher biomass and number of species for station N2, with lower salinities (Dolbeth et al. 2008). This
could be explained by higher amount of detritus available in lower saline conditions, where decomposition
of macroalgae occurs, producing detritus and inorganic nutrients (Martins et al. 1999; Whitfield et al.
2006). The general response of traits to oxygen was negative, but as oxygen varied between 62-120%, this
result can hardly be attributed to excessive levels of dissolved oxygen, which might affect the rate of
oxygen uptake by fish (Fry 1971; Kramer 1987). Still, filtering and territorial species, such as Ammodytes
tobianus, showed positive response to oxygen due to its capacity to regulate oxygen uptake, lowering its
metabolism (Behrens & Steffensen 2006) and improving filter feeding opportunity in agitated waters.
All traits showed temporal responses, revealing a strong effect of factor year in the functional
composition of the fish assemblage despite a smaller seasonal effect. This latter result is different from
other studies such as Shimadzu et al. (2013), which observed significant seasonal effects in an estuarine
fish community, and Akin et al. (2003) which underlined the role of seasonally resident marine species in
estuarine fish assemblages. 2003 was generally the year with higher values in traits for all measures,
probably because it showed regular precipitation (Nyitrai et al. 2012) and high temperature (positively
correlated to most traits) (Martinho et al. 2010). After 2004, anthropogenic activities (regulation by dams
and deepening of the main navigation channel), together with the occurrence of drought events, led to
higher incursion of seawater and lower freshwater runoff, thus increasing the salinity in the estuary and the
number of marine species (Baptista et al. 2015b). In 2006, precipitation was considerably higher than in
the other years, thus leading to a decrease in salinity in the estuary (Nyitrai et al. 2012), which probably
explains the lower values in most traits for this year.
Functional redundancy of the Mondego estuary fish assemblage
Generally, estuarine systems are naturally faced with highly dynamic environmental conditions and
their communities present high natural resilience to change, compared with other aquatic ecosystems,
because organisms living in estuaries have the capacity of tolerating diverse environmental variations and
adjust to stressful conditions, which increases the ability of estuaries to absorb disturbance (Elliott &

CHAPTER 2
48
Whitfield 2011). Functional redundancy of the fish assemblage in the Mondego estuary showed seasonal
and spatial variation, which is consistent with differences in functional composition previously discussed.
Higher functional redundancy in station N2 (p-value < 0.05) indicates that a hypothetical loss of species in
this station is likely to have a minor effect in ecosystem functioning (Ricotta et al. In press) and in the
resilience of ecosystem services (Walker et al. 1999; Folke et al. 2004). The opposite could be expected
for station S1 where the fish assemblage showed lower functional redundancy (p-value < 0.05). Seasonal
variations in functional redundancy for density of species may be related to recruitment of juveniles of
several marine species to the estuary (Vasconcelos et al. 2010), since spring (the main recruitment period)
is the season with higher functional redundancy.
Looking at the annual functional redundancy within each functional group, functional group 7 showed
null values, possibly being the group most vulnerable to disturbance, since it is composed by only three
freshwater species which have been decreasing in the estuary (Leitão et al. 2007; Baptista et al. 2010;
Dolbeth et al. 2013). Functional groups 1 and 4 showed lower values of functional redundancy comparing
to the remaining groups, which might possibly mean the functions they perform would become more
vulnerable to the loss of species (Gunderson 2000). Also, that would probably affect the ecosystem
services that these groups can provide (nutrient cycling, biological control and coastal protection),
possibly decreasing their resilience (Micheli & Halpern 2005; Muntadas et al. 2016). However, ecosystem
functioning is a product of multiple variables (Murray et al. 2014) and as such, it results from a complex
interaction of different components in the ecosystem, including distinct groups of organisms (besides fish),
which should be considered when accounting the provision of ecosystem services. Functional groups 5
and 6 showed the highest functional redundancies, which may implicate the ecosystem services they are
capable to provide are perhaps more likely to be maintained (Yachi & Loreau 1999; Fonseca & Ganade
2001; Ricotta et al. In press). Spatial variation in redundancy of groups 5 and 6 may be related with
differences in their distribution between stations, with higher redundancies in stations M and N2 (for
groups 5 and 6, respectively) where they also showed higher biomass. Furthermore, environmental
variables may also be connected to these patterns, since salinity is negatively correlated to detritivores and
species with tolerance to freshwater, which are both present in group 6, and N2 is the station with the
lowest salinities. Seasonal variation in functional redundancy for groups 3 and 5 may be related with
differences in temperature, with lower values of functional redundancy observed in summer, thus
indicating higher functional diversity (de Bello et al. 2007). Temperature affects fish reproduction and
therefore is related with recruitment dynamics, which is often related to seasonal changes in the
composition of fish assemblages (Potter et al. 2001; Attrill & Power 2002; Akin et al. 2003; Vinagre et al.
2009; Nyitrai et al. 2013). This may explain why functional redundancy is higher in winter for group 3
and higher in autumn for group 5. Moreover, with higher temperatures, salinity tends to increase, which
would allow marine species such as Arnoglossus laterna, Buglossidium luteum and Pegusa lascaris to
enter the estuary, probably explaining the differences in functional redundancy for group 3.
Changes in precipitation could have influenced inter-annual variation of functional redundancy for
density of group 6. Although group 6 is comprised by species that tolerate a wide range of salinities
(marine, brackish and freshwater), it is also composed by estuarine residents (Pomatoschistus microps)
and species that use the estuary as a nursery area (Dicentrarchus labrax and Platichthys flesus), which
were affected by changes in precipitation and river runoff showing higher abundances in non-drought
years i.e. with higher freshwater flow (Martinho et al. 2007; Martinho et al. 2009; Baptista et al. 2010).
For density of group 2, inter-annual differences in functional redundancy may be explained by variations
in salinity (Baptista et al. 2015b), since this group is comprised by marine species which varied inter-

CHAPTER 2
49
annually in density. One of the most abundant species in the estuary, Solea solea (group 5) is marine and
depends on the estuary as a sheltered habitat for juveniles. It showed higher densities and production in
non-drought years (Dolbeth et al. 2008; Baptista et al. 2010) which could be an explanation for inter-
annual differences in functional redundancy for biomass of group 5, since S. solea contributes
significantly to biomass of this group. Furthermore, another species in group 5, Pegusa lascaris, only
appeared in the estuary in 2005 (Martinho et al. 2007) which could have influenced the functional
redundancy of this group (which was lower in 2005 than in 2004) by increasing species richness
(Rosenfeld 2002) and also by affecting functional diversity, calculated with Rao’s quadratic entropy (Rao
1982), which in turn is influenced by abundance of species (Botta-Dukát 2005; de Bello et al. 2007).
Assessing functional redundancy in the Mondego estuary is important for conservation, since a lower
variation in ecosystem functioning is expected in more functionally redundant communities (Naeem
1998), which means that the loss of species is less likely to impact ecosystem functions in these situations
(Sasaki et al. 2009; Mouillot et al. 2013). Additionally, as functional redundancy has been related to
ecosystem resilience, it could be an important tool to predict changes in functions under threatening
conditions (Walker 1992; Yachi & Loreau 1999; Lavorel & Garnier 2002; Muntadas et al. 2016).
However, this depends on the vulnerability of species to disturbance (Hughes et al. 2005) and also on their
interactions with the environment, which influence their functional role (Wellnitz & Poff 2001; Murray et
al. 2014). Additionally, rare species can contribute significantly to maintain ecosystem functioning
(Mouillot et al. 2013), because they may respond differently to stress (Boero 1994; Walker et al. 1999)
and thus may have the potential to sustain important ecosystem functions under changing environmental
conditions (Flöder et al. 2010). Moreover, they increase functional diversity (Richardson et al. 2012) and
may be able to perform functions complementary to those delivered by common species, as a result of
their different functional attributes (Lavergne et al. 2003; Mouillot et al. 2013). This seems to be for
example the case of Sparus aurata, the only omnivorous species in group 1 and the only possible
contributor to the service of coastal protection and disturbance prevention in this group (three of the
remaining species are macrocarnivorous and one is an invertebrate feeder). Such species assume a key
functional role. Although the Mondego estuary is not the most threatened in the Portuguese coast, it is
constantly under anthropogenic pressure, therefore it is important to consider the effects of human
activities on biodiversity of this transitional system, which can have significant impacts in ecosystem
functioning and thus in the provision of ecosystem services (Elmqvist et al. 2003; Pinto et al. 2014).
Finally, knowledge of the functional redundancy of each functional group is important to understand its
resilience to disturbance and its influence in ecosystem functioning and services (Fonseca & Ganade 2001;
Bellwood et al. 2004; Mouillot et al. 2013). Higher values of annual functional redundancy were observed
for groups 5 and 6, suggesting that these groups are potentially more likely to preserve the same functions,
even with loss of species following disturbance (Walker et al. 1999; Folke et al. 2004). Also, these groups
are the most represented in the fish assemblage (in terms of biomass, density and number of species),
which reinforces their resilience. Group 5 is unique because it contains filterer and planktivorous species,
which may influence the provision of ecosystem services such as waste treatment and assimilation (Zhou
et al. 1999) and climate regulation (Schindler et al. 1997). Therefore, these services are possibly the more
resilient to disturbance. On the other hand, the lower annual functional redundancy observed for groups 1
and 4 may implicate they are more vulnerable to species loss (Mouillot et al. 2014), which may decrease
the resilience of the ecosystem services they can provide (nutrient cycling, biological control and coastal
protection and disturbance prevention).

CHAPTER 2
50
Functional redundancy must be taken into account, as it may allow for some species in an ecosystem to
compensate for the loss of others, maintaining important functions in the estuary (Biggs et al. 2012). There
are, however, other ways to quantify functional redundancy, for example, van der Linden et al. (2016)
divides functional diversity (quantified as Rao’s quadratic entropy) for species diversity (quantified as
Simpson’s diversity index), explaining that functional redundancy measures the amount of trait similarity
between species in a community. There is still a need for satisfactory methods to quantify functional
redundancy, according to Carmona et al. (2016), despite its recognized importance for resilience.
Conclusions
Considering the evidence of connections between traits and ecosystem functions, and also the wide
variety of traits in fishes (Villéger et al. 2012), there is great potential in exploring these links for human
well-being. This study is the first one to assess the provision of ecosystem services by the fish assemblage
of the Mondego estuary and estimate their resilience, which is an important step towards ecosystem-based
management and conservation efforts (Pinto et al. 2014). Also, it constitutes a development of knowledge
about the role of fish in the performance of important functions within the estuary, which is affected by
fisheries, similarly to other estuaries worldwide (Blaber 2000). Nevertheless, it is important to consider the
limitations of this study, especially concerning the subjectivity of the functional groups approach (Murray
et al. 2014) and the uncertainty about calculation of functional redundancy (Rosenfeld 2002). Besides,
other types of services could be studied within this estuary, such as provisioning and habitat services.
Overall, there is a long way ahead in ecosystem service assessment in estuarine systems in general, but
this study highlighted the importance of fishes in regulating ecosystem services and the need for more
functional composition studies, especially investigating the contribution of fish and other groups of
organisms in estuaries towards the delivery of ecosystem services.
Literature cited
Abecasis D., Bentes L. & Erzini K. (2009). Home range, residency and movements of Diplodus sargus
and Diplodus vulgaris in a coastal lagoon: Connectivity between nursery and adult habitats. Estuarine,
Coastal and Shelf Science, 85: 525-529.
Adámek Z. & Maršálek B. (2013). Bioturbation of sediments by benthic macroinvertebrates and fish
and its implication for pond ecosystems: a review. Aquaculture International, 21: 1-17.
Akin S., Winemiller K.O. & Gelwick F.P. (2003). Seasonal and spatial variations in fish and
macrocrustacean assemblage structure in Mad Island Marsh estuary, Texas. Estuarine, Coastal and Shelf
Science, 57: 269-282.
Alves A.S., Caetano A., Costa J.L., Costa M.J. & Marques J.C. (2015). Estuarine intertidal meiofauna
and nematode communities as indicator of ecosystem's recovery following mitigation measures.
Ecological Indicators, 54: 184-196.
Anderson M.J., Gorley R.N. & Clarke K.R. (2008). PERMANOVA + for PRIMER: Guide to Software
and Statistical Methods PRIMER-E Plymouth, UK.
Andersson G., Berggren H., Cronberg G. & Gelin C. (1978). Effects of planktivorous and benthivorous
fish on organisms and water chemistry in eutrophic lakes. Hydrobiologia, 59: 9-15.
Araújo F.G., Bailey R.G. & Williams W.P. (1999). Spatial and temporal variations in fish populations
in the upper Thames estuary. Journal of Fish Biology, 55: 836-853.
Assessment M.E. (2005). Ecosystems and human well-being: synthesis. Island Press, Washington D. C.
Attrill M.J. & Power M. (2002). Climatic influence on a marine fish assemblage. Nature, 417: 275-278.
Auster P.J. & Link J.S. (2009). Compensation and recovery of feeding guilds in a northwest Atlantic
shelf fish community. Marine Ecology Progress Series, 382: 163-172.

CHAPTER 2
51
Avnimelech Y., Kochva M. & Hargreaves J.A. (1999). Sedimentation and resuspension in earthen fish
ponds. Journal of the World Aquaculture Society, 30: 401-409.
Baptista J., Martinho F., Dolbeth M., Viegas I., Cabral H. & Pardal M. (2010). Effects of freshwater
flow on the fish assemblage of the Mondego estuary (Portugal): comparison between drought and non-
drought years. Marine and Freshwater Research, 61: 490-501.
Baptista J., Martinho F., Nyitrai D., Pardal M.A. & Dolbeth M. (2015a). Long-term functional changes
in an estuarine fish assemblage. Mar Pollut Bull, 97: 125-134.
Baptista J., Martinho F., Nyitrai D., Pardal M.A. & Dolbeth M. (2015b). Long-term functional changes
in an estuarine fish assemblage. Marine Pollution Bulletin, 97: 125-134.
Baptista J., Pato P., Pereira E., Duarte A.C. & Pardal M.A. (2013). PCBs in the fish assemblage of a
southern European estuary. Journal of Sea Research, 76: 22-30.
Barbier E.B., Hacker S.D., Kennedy C., Koch E.W., Stier A.C. & Silliman B.R. (2011). The value of
estuarine and coastal ecosystem services. Ecological Monographs, 81: 169-193.
Beaumont N.J., Austen M.C., Atkins J.P., Burdon D., Degraer S., Dentinho T.P., Derous S., Holm P.,
Horton T., van Ierland E., Marboe A.H., Starkey D.J., Townsend M. & Zarzycki T. (2007). Identification,
definition and quantification of goods and services provided by marine biodiversity: implications for the
ecosystem approach. Marine Pollution Bulletin, 54: 253-265.
Behrens J.W. & Steffensen J.F. (2006). The effect of hypoxia on behavioural and physiological aspects
of lesser sandeel, Ammodytes tobianus (Linnaeus, 1785). Marine Biology, 150: 1365-1377.
Bellwood D.R., Hoey A.S. & Choat J.H. (2003). Limited functional redundancy in high diversity
systems: resilience and ecosystem function on coral reefs. Ecology Letters, 6: 281-285.
Bellwood D.R., Hughes T.P., Folke C. & Nystrom M. (2004). Confronting the coral reef crisis. Nature,
429: 827-833.
Biggs R., Schlüter M., Biggs D., Bohensky E.L., BurnSilver S., Cundill G., Dakos V., Daw T.M.,
Evans L.S., Kotschy K., Leitch A.M., Meek C., Quinlan A., Raudsepp-Hearne C., Robards M.D., Schoon
M.L., Schultz L. & West P.C. (2012). Toward principles for enhancing the resilience of ecosystem
services. Annual Review of Environment and Resources, 37: 421-448.
Bilby R.E., Fransen B.R. & Bisson P.A. (1996). Incorporation of nitrogen and carbon from spawning
coho salmon into the trophic system of small streams: evidence from stable isotopes. Canadian Journal of
Fisheries and Aquatic Sciences, 53: 164-173.
Blaber S. (2000). Effects of fishing on the structure and functioning of estuarine and nearshore
ecosystems. ICES Journal of Marine Science, 57: 590-602.
Boero F. (1994). Fluctuations and variations in coastal marine environments. Marine Ecology-
Pubblicazioni Della Stazione Zoologica Di Napoli I, 15: 3-25.
Böhnke-Henrichs A., Baulcomb C., Koss R., Hussain S.S. & de Groot R.S. (2013). Typology and
indicators of ecosystem services for marine spatial planning and management. Journal of Environmental
Management, 130: 135-145.
Borja A., Dauer D.M., Elliott M. & Simenstad C.A. (2010). Medium- and long-term recovery of
estuarine and coastal ecosystems: patterns, rates and restoration effectiveness. Estuaries and Coasts, 33:
1249-1260.
Botta-Dukát Z. (2005). Rao’s quadratic entropy as a measure of functional diversity based on multiple
traits. Journal of Vegetation Science, 16: 533-540.
Boyd J. & Banzhaf S. (2007). What are ecosystem services? The need for standardized environmental
accounting units. Ecological Economics, 63: 616-626.
Brawley S.H. & Adey W.H. (1977). Territorial behavior of threespot damselfish (Eupomacentrus
planifrons) increases reef algal biomass and productivity. Environmental Biology of Fishes, 2: 45-51.
Breheny P. & Burchett W. (2016). Visualization of regression models. R package version 2.2-2.
Bremner J., Rogers S.I. & Frid C.L.J. (2003). Assessing functional diversity in marine benthic
ecosystems: a comparison of approaches. Marine Ecology Progress Series, 254: 11-25.

CHAPTER 2
52
Burkepile D.E. & Hay M.E. (2008). Herbivore species richness and feeding complementarity affect
community structure and function on a coral reef. Proceedings of the National Academy of Sciences of the
United States of America, 105: 16201-16206.
Cabral H. & Costa M.J. (1999). Differential use of nursery areas within the Tagus estuary by sympatric
soles, Solea solea and Solea senegalensis. Environmental Biology of Fishes, 56: 389-397.
Caddy J.F. & Garibaldi L. (2000). Apparent changes in the trophic composition of world marine
harvests: the perspective from the FAO capture database. Ocean & Coastal Management, 43: 615-655.
Cardinale B.J., Duffy J.E., Gonzalez A., Hooper D.U., Perrings C., Venail P., Narwani A., Mace G.M.,
Tilman D., Wardle D.A., Kinzig A.P., Daily G.C., Loreau M., Grace J.B., Larigauderie A., Srivastava D.S.
& Naeem S. (2012). Biodiversity loss and its impact on humanity. Nature, 486: 59-67.
Cardoso P.G., Pardal M.A., Lillebø A.I., Ferreira S.M., Raffaelli D. & Marques J.C. (2004). Dynamic
changes in seagrass assemblages under eutrophication and implications for recovery. Journal of
Experimental Marine Biology and Ecology, 302: 233-248.
Carmona C.P., de Bello F., Mason N.W. & Leps J. (2016). Traits Without Borders: Integrating
Functional Diversity Across Scales. Trends in Ecology and Evolution, 31: 382-394.
Carpenter S.R., Cottingham K.L. & Schindler D.E. (1992). Biotic feedbacks in lake phosphorus cycles.
Trends in Ecology and Evolution, 7: 332-336.
Carpenter S.R., Kitchell J.F. & Hodgson J.R. (1985). Cascading trophic interactions and lake
productivity. BioScience, 35: 634-639.
Carpenter S.R., Mooney H.A., Agard J., Capistrano D., Defries R.S., Diaz S., Dietz T., Duraiappah
A.K., Oteng-Yeboah A., Pereira H.M., Perrings C., Reid W.V., Sarukhan J., Scholes R.J. & Whyte A.
(2009). Science for managing ecosystem services: Beyond the Millennium Ecosystem Assessment.
Proceedings of the National Academy of Sciences of the United States of America, 106: 1305-1312.
Chainho P., Costa J.L., Chaves M.L., Dauer D.M. & Costa M.J. (2007). Influence of seasonal
variability in benthic invertebrate community structure on the use of biotic indices to assess the ecological
status of a Portuguese estuary. Marine Pollution Bulletin, 54: 1586-1597.
Cheal A.J., MacNeil M.A., Cripps E., Emslie M.J., Jonker M., Schaffelke B. & Sweatman H. (2010).
Coral-macroalgal phase shifts or reef resilience: links with diversity and functional roles of herbivorous
fishes on the Great Barrier Reef. Coral Reefs, 29: 1005-1015.
Chessman B.C. (2013). Identifying species at risk from climate change: Traits predict the drought
vulnerability of freshwater fishes. Biological Conservation, 160: 40-49.
Clarke K.R. & Gorley R.N. (2006). PRIMER v6: User manual/tutorial. PRIMER-E, Plymouth UK.
Cole A.J., Pratchett M.S. & Jones G. (2008). Diversity and functional importance of coral-feeding
fishes on tropical coral reefs. Fish and Fisheries, 9: 286-307.
Costanza R., dArge R., deGroot R., Farber S., Grasso M., Hannon B., Limburg K., Naeem S., ONeill
R.V., Paruelo J., Raskin R.G., Sutton P. & vandenBelt M. (1997). The value of the world's ecosystem
services and natural capital. Nature, 387: 253-260.
Costello M.J., Claus S., Dekeyzer S., Vandepitte L., Tuama E.O., Lear D. & Tyler-Walters H. (2015).
Biological and ecological traits of marine species. PeerJ, 3: 1-29.
Cury P., Shannon L. & Shin Y.J. (2003). The functioning of marine ecosystems: a fisheries
perspective. Responsible Fisheries in the Marine Ecosystem: 103-123.
D'Agata S., Mouillot D., Kulbicki M., Andrefouet S., Bellwood D.R., Cinner J.E., Cowman P.F.,
Kronen M., Pinca S. & Vigliola L. (2014). Human-mediated loss of phylogenetic and functional diversity
in coral reef fishes. Current Biology, 24: 555-560.
Daily G.C. (1997). Nature's services: societal dependence on natural ecosystems, Washington.
de Bello F., Lavorel S., Díaz S., Harrington R., Cornelissen J.H.C., Bardgett R.D., Berg M.P., Cipriotti
P., Feld C.K., Hering D., Martins da Silva P., Potts S.G., Sandin L., Sousa J.P., Storkey J., Wardle D.A. &
Harrison P.A. (2010). Towards an assessment of multiple ecosystem processes and services via functional
traits. Biodiversity and Conservation, 19: 2873-2893.

CHAPTER 2
53
de Bello F., Leps J., Lavorel S. & Moretti M. (2007). Importance of species abundance for assessment
of trait composition: an example based on pollinator communities. Community Ecology, 8: 163-170.
de Groot R., Fisher B. & Christie M. (2010). Integrating the ecological and economic dimensions in
biodiversity and ecosystem service valuation. In: The Economics of Ecosystems and Biodiversity: The
Ecological and Economic Foundations (ed. Kadekodi GK), pp. 2 - 40.
Debastiani V.J. & Pillar V.D. (2012). SYNCSA — R tool for analysis of metacommunities based on
functional traits and phylogeny of the community components. Bioinformatics, 28: 2067-2068.
Deegan L.A. (1993). Nutrient and energy transport between estuaries and coastal marine ecosystems by
fish migration. Canadian Journal of Fisheries and Aquatic Sciences, 50: 75-79.
Díaz S., Fargione J., Chapin F.S., 3rd & Tilman D. (2006). Biodiversity loss threatens human well-
being. PLoS Biology, 4: 1300-1305.
Díaz S., Lavorel S., de Bello F., Quetier F., Grigulis K. & Robson T.M. (2007). Incorporating plant
functional diversity effects in ecosystem service assessments. Proceedings of the National Academy of
Sciences of the United States of America, 104: 20684-20689.
Díaz S., Quetier F., Caceres D.M., Trainor S.F., Perez-Harguindeguy N., Bret-Harte M.S., Finegan B.,
Pena-Claros M. & Poorter L. (2011). Linking functional diversity and social actor strategies in a
framework for interdisciplinary analysis of nature's benefits to society. Proceedings of the National
Academy of Sciences of the United States of America, 108: 895-902.
Dinis M.T., Ribeiro L., Soares F. & Sarasquete C. (1999). A review on the cultivation potential of
Solea senegalensis in Spain and in Portugal. Aquaculture, 176: 27-38.
Dolbeth M., Cardoso P., Grilo T., Raffaelli D. & Pardal M.A. (2013). Drivers of estuarine benthic
species distribution patterns following a restoration of a seagrass bed: a functional trait analyses. Marine
Pollution Bulletin, 72: 47-54.
Dolbeth M., Cardoso P.G., Grilo T.F., Bordalo M.D., Raffaelli D. & Pardal M.A. (2011). Long-term
changes in the production by estuarine macrobenthos affected by multiple stressors. Estuarine Coastal and
Shelf Science, 92: 10-18.
Dolbeth M., Dolédec S. & Pardal M. (2015). Relationship between functional diversity and benthic
secondary production in a disturbed estuary. Marine Ecology Progress Series, 539: 33-46.
Dolbeth M., Martinho F., Viegas I., Cabral H. & Pardal M.A. (2008). Estuarine production of resident
and nursery fish species: Conditioning by drought events? Estuarine, Coastal and Shelf Science, 78: 51-
60.
Done T.J., Dayton P.K., Dayton A.E. & Steger R. (1991). Regional and local variability in recovery of
shallow coral communities: Moorea, French Polynesia and central Great Barrier Reef. Coral Reefs, 9: 183-
192.
Elliott M. & Whitfield A.K. (2011). Challenging paradigms in estuarine ecology and management.
Estuarine, Coastal and Shelf Science, 94: 306-314.
Elliott M., Whitfield A.K., Potter I.C., Blaber J.M., Cyrus D.P., Nordlie F.G. & Harrison T.D. (2007).
The guild approach to categorizing estuarine fish assemblages: a global review. Fish and Fisheries, 8:
241-268.
Elmqvist T., Folke C., Nyström M., Peterson G., Bengtsson J., Walker B. & Norberg J. (2003).
Response diversity, ecosystem change, and resilience. Frontiers in Ecology and the Environment, 1: 488-
494.
Fisher B., Turner R.K. & Morling P. (2009). Defining and classifying ecosystem services for decision
making. Ecological Economics, 68: 643-653.
Flecker A.S. (1992). Fish trophic guilds and the structure of a tropical strea: weak direct vs. strong
indirect effects. Ecology, 73: 927-940.
Flecker A.S., Taylor B.W., Bernhardt E.S., Hood J.M., Cornwell W.K., Cassatt S.R., Vanni M.J. &
Altman N.S. (2002). Interactions between herbivorous fishes and limiting nutrients in a tropical stream
ecosystem. Ecology, 83: 1831-1844.

CHAPTER 2
54
Flöder S., Jaschinski S., Wells G. & Burns C.W. (2010). Dominance and compensatory growth in
phytoplankton communities under salinity stress. Journal of Experimental Marine Biology and Ecology,
395: 223-231.
Folke C., Carpenter S., Walker B., Scheffer M., Elmqvist T., Gunderson L. & Holling C.S. (2004).
Regime shifts, resilience, and biodiversity in ecosystem management. Annual Review of Ecology,
Evolution, and Systematics, 35: 557-581.
Fonseca C.R. & Ganade G. (2001). Species functional redundancy, random extinctions and the stability
of ecosystems. Journal of Ecology, 89: 118-125.
França S., Costa M.J. & Cabral H.N. (2009). Assessing habitat specific fish assemblages in estuaries
along the Portuguese coast. Estuarine, Coastal and Shelf Science, 83: 1-12.
França S., Costa M.J. & Cabral H.N. (2011). Inter- and intra-estuarine fish assemblage variability
patterns along the Portuguese coast. Estuarine, Coastal and Shelf Science, 91: 262-271.
Franco A., Franzoi P., Malavasi S., Riccato F., Torricelli P. & Mainardi D. (2006). Use of shallow
water habitats by fish assemblages in a Mediterranean coastal lagoon. Estuarine, Coastal and Shelf
Science, 66: 67-83.
Fry F.E.J. (1971). The effect of environmental factors on the physiology of fish. In: Fish Physiology
(eds. Hoar WS & Randall DJ). Academic Press New York, pp. 1-98.
García-Llorente M., Martín-López B., Díaz S. & Montes C. (2011). Can ecosystem properties be fully
translated into service values? An economic valuation of aquatic plant services. Ecological Applications,
21: 3083 - 3103.
Garcia A., Vieira J.P. & Winemiller K.O. (2001). Dynamics of the shallow-water fish assemblage of
the Patos Lagoon estuary (Brazil) during cold and warm ENSO episodes. Journal of Fish Biology, 59:
1218-1238.
Gelwick F.P., Stock M.S. & Matthews W.J. (1997). Effects of fish, water depth, and predation risk on
patch dynamics in a north-temperate river ecosystem. Oikos, 80: 382-398.
Genner M.J., Sims D.W., Southward A.J., Budd G.C., Masterson P., McHugh M., Rendle P., Southall
E.J., Wearmouth V.J. & Hawkins S.J. (2010). Body size-dependent responses of a marine fish assemblage
to climate change and fishing over a century-long scale. Global Change Biology, 16: 517-527.
Gerino M., Stora G., François-Carcaillet F., Gilbert F., Poggiale J.-C., Mermillod-Blondin F.,
Desrosiers G. & Vervier P. (2003). Macro-invertebrates functional groups in freshwater and marine
sediments: a commun mechanistic classification. Vie et Milieu: 221-231.
Gonçalves J.M.S., Bentes L., Coelho R., Correia C., Lino P.G., Monteiro C.C., Ribeiro J. & Erzini K.
(2003). Age and growth, maturity, mortality and yield-per-recruit for two banded bream (Diplodus
vulgaris Geoffr.) from the south coast of Portugal. Fisheries Research, 62: 349-359.
Gower J.C. (1966). Some Distance Properties of Latent Root and Vector Methods Used in Multivariate
Analysis. Biometrika, 53: 325-338.
Grömping U. (2006). Relative importance for linear regression in R: The package relaimpo. Journal of
Statistical Software, 17: 1-27.
Gunderson L. (2000). Ecological resilience - in theory and application. Annual Review of Ecology,
Evolution, and Systematics: 425-439.
Hall R.O., Jr., Koch B.J., Marshall M.C., Taylor B.W. & Tronstad L.M. (2007). How body size
mediates the role of animals in nutrient cycling in aquatic ecosystems. In: Body size and the structure and
function of aquatic ecosystems (eds. Hildrew AG, Raffaelli DG & Edmonds-Brown R). Cambridge
University Press New York.
Han T., Zhang H., Hu W., Deng J., Li Q. & Zhu G. (2015). Research on self-purification capacity of
Lake Taihu. Environmental Science and Pollution Research, 22: 8201-8215.
Harrison P.A., Berry P.M., Simpson G., Haslett J.R., Blicharska M., Bucur M., Dunford R., Egoh B.,
Garcia-Llorente M., Geamana N., Geertsema W., Lommelen E., Meiresonne L. & Turkelboom F. (2014).
Linkages between biodiversity attributes and ecosystem services: A systematic review. Ecosystem
Services, 9: 191-203.

CHAPTER 2
55
Hattam C., Atkins J.P., Beaumont N., Borger T., Bohnke-Henrichs A., Burdon D., de Groot R.,
Hoefnagel E., Nunes P.A.L.D., Piwowarczyk J., Sastre S. & Austen M.C. (2015). Marine ecosystem
services: Linking indicators to their classification. Ecological Indicators, 49: 61-75.
Heck K.L., Pennock J.R., Valentine J.F., Coen L.D. & Sklenar S.A. (2000). Effects of nutrient
enrichment and small predator density on seagrass ecosystems: An experimental assessment. Limnology
and Oceanography, 45: 1041-1057.
Heck K.L. & Valentine J.F. (2006). Plant–herbivore interactions in seagrass meadows. Journal of
Experimental Marine Biology and Ecology, 330: 420-436.
Henriques S., Pais M.P., Batista M.I., Costa M.J. & Cabral H.N. (2013). Response of fish-based
metrics to anthropogenic pressures in temperate rocky reefs. Ecological Indicators, 25: 65-76.
Hixon M. & Brostoff W. (1996). Sucession and herbivory: effects of differential fish grazing on
hawaiian coral-reef algae. Ecological Monographs, 66: 67-90.
Hoey A.S. & Bellwood D.R. (2011). Suppression of herbivory by macroalgal density: a critical
feedback on coral reefs? Ecology Letters, 14: 267-273.
Holling C.S. (1973). Resilience and stability of ecological systems. Annual Review of Ecology,
Evolution, and Systematics, 4: 1-23.
Holmlund C.M. & Hammer M. (1999). Ecosystem services generated by fish populations. Ecological
Economics, 29: 253-268.
Hooper D.U., Chapin F.S., Ewel J.J., Hector A., Inchausti P., Lavorel S., Lawton J.H., Lodge D.M.,
Loreau M., Naeem S., Schmid B., Setala H., Symstad A.J., Vandermeer J. & Wardle D.A. (2005). Effects
of biodiversity on ecosystem functioning: A consensus of current knowledge. Ecological Monographs, 75:
3-35.
Hoy J.B., Kauffman E.E. & O'Berg A.G. (1972). A large-scale field test og Gambusia affinis and
chlorpyrifos for mosquito control. Mosquito News, 32: 161-171.
Hughes T.P., Bellwood D.R., Folke C., Steneck R.S. & Wilson J. (2005). New paradigms for
supporting the resilience of marine ecosystems. Trends in Ecology and Evolution, 20: 380-386.
Iguchi K. & Yodo T. (2004). Impact of indigenous egg eaters on the early survival of exotic
smallmouth bass. Ecological Research, 19: 469-474.
Katz T., Herut B., Genin A. & Angel D.L. (2002). Gray mullets ameliorate organically enriched
sediments below a fish farm in the oligotrophic Gulf of Aqaba (Red Sea). Marine Ecology Progress
Series, 234: 205-214.
Kennish M.J. (2002). Environmental threats and environmental future of estuaries. Environmental
Conservation, 29: 78-107.
Koutsikopoulos C., Desaunay Y., Dorel D. & Marchand J. (1989). The role of coastal areas in the life
history of sole (Solea solea L.) in the Bay of Biscay. Scientia Marina, 53: 567-575.
Kramer D.L. (1987). Dissolved oxygen and fish behavior. Environmental Biology of Fishes, 18: 81-92.
Kremen C. (2005). Managing ecosystem services: what do we need to know about their ecology?
Ecology Letters, 8: 468-479.
Laliberté E., Wells J.A., Declerck F., Metcalfe D.J., Catterall C.P., Queiroz C., Aubin I., Bonser S.P.,
Ding Y., Fraterrigo J.M., McNamara S., Morgan J.W., Merlos D.S., Vesk P.A. & Mayfield M.M. (2010).
Land-use intensification reduces functional redundancy and response diversity in plant communities.
Ecology Letters, 13: 76-86.
Lavergne S., Garnier E. & Debussche M. (2003). Do rock endemic and widespread plant species differ
under the Leaf–Height–Seed plant ecology strategy scheme? Ecology Letters, 6: 398-404.
Lavorel S. & Garnier E. (2002). Predicting changes in community composition and ecosystem
functioning from plant traits: revisiting the Holy Grail. Functional Ecology, 16: 545-556.
Lavorel S. & Grigulis K. (2012). How fundamental plant functional trait relationships scale-up to
trade-offs and synergies in ecosystem services. Journal of Ecology, 10.1111/j.1365-2745.2011.01914.x.

CHAPTER 2
56
Leitão R., Martinho F., Cabral H.N., Neto J.M., Jorge I. & Pardal M.A. (2007). The fish assemblage of
the Mondego estuary: composition, structure and trends over the past two decades. Hydrobiologia, 587:
269-279.
Liquete C., Piroddi C., Drakou E.G., Gurney L., Katsanevakis S., Charef A. & Egoh B. (2013). Current
status and future prospects for the assessment of marine and coastal ecosystem services: a systematic
review. PLoS One, 8: 1-15.
Luck G.W., Harrington R., Harrison P.A., Kremen C., Berry P.M., Bugter R., Dawson T.P., de Bello
F., Diaz S., Feld C.K., Haslett J.R., Hering D., Kontogianni A., Lavorel S., Rounsevell M., Samways M.J.,
Sandin L., Settele J., Sykes M.T., van den Hove S., Vandewalle M. & Zobel M. (2009). Quantifying the
Contribution of Organisms to the Provision of Ecosystem Services. BioScience, 59: 223-235.
Lyons K.G., Brigham C.A., Traut B.H. & Schwartz M.W. (2005). Rare species and ecosystem
functioning. Conservation Biology, 19: 1019-1024.
Mackenzie B.R., Almesjo L. & Hansson S. (2004). Fish, fishing, and pollutant reduction in the Baltic
Sea. Environ Sci Technol, 38: 1970-1976.
Maechler M., Rousseeuw P., Struyf A., Hubert M. & Hornik K. (2015). Cluster: Cluster Analysis
Basics and Extensions. R package version 2.0.3.
Marshall S. & Elliott M. (1998). Environmental Influences on the fish assemblage of the Humber
Estuary, U.K. Estuarine, Coastal and Shelf Science, 46: 175-184.
Martinho F., Dolbeth M., Viegas I., Baptista J., Cabral H.N. & Pardal M.A. (2010). Does the flatfish
community of the Mondego estuary (Portugal) reflect environmental changes? Journal of Applied
Ichthyology, 26: 843-852.
Martinho F., Dolbeth M., Viegas I., Teixeira C.M., Cabral H.N. & Pardal M.A. (2009). Environmental
effects on the recruitment variability of nursery species. Estuarine, Coastal and Shelf Science, 83: 460-
468.
Martinho F., Leitão R., Viegas I., Dolbeth M., Neto J.M., Cabral H.N. & Pardal M.A. (2007). The
influence of an extreme drought event in the fish community of a southern Europe temperate estuary.
Estuarine, Coastal and Shelf Science, 75: 537-546.
Martins I., Oliveira J.M., Flindt M.R. & Marques J.C. (1999). The effect of salinity on the growth rate
of the macroalgae Enteromorpha intestinalis (Chlorophyta) in the Mondego estuary (west Portugal). Acta
Oecologica, 20: 259-265.
Micheli F. & Halpern B.S. (2005). Low functional redundancy in coastal marine assemblages. Ecology
Letters, 8: 391-400.
Mouillot D., Bellwood D.R., Baraloto C., Chave J., Galzin R., Harmelin-Vivien M., Kulbicki M.,
Lavergne S., Lavorel S., Mouquet N., Paine C.E., Renaud J. & Thuiller W. (2013). Rare species support
vulnerable functions in high-diversity ecosystems. PLoS Biology, 11: 1-11.
Mouillot D., Graham N.A., Villeger S., Mason N.W. & Bellwood D.R. (2012). A functional approach
reveals community responses to disturbances. Trends in Ecology and Evolution, 28: 167-177.
Mouillot D., Villeger S., Parravicini V., Kulbicki M., Arias-Gonzalez J.E., Bender M., Chabanet P.,
Floeter S.R., Friedlander A., Vigliola L. & Bellwood D.R. (2014). Functional over-redundancy and high
functional vulnerability in global fish faunas on tropical reefs. Proceedings of the National Academy of
Sciences of the United States of America, 111: 13757-13762.
Mumby P.J., Harborne A.R. & Brumbaugh D.R. (2011). Grouper as a Natural Biocontrol of Invasive
Lionfish. PLoS One, 6.
Muntadas A., de Juan S. & Demestre M. (2016). Assessing functional redundancy in chronically
trawled benthic communities. Ecological Indicators, 61: 882-892.
Murray F., Douglas A. & Solan M. (2014). Species that share traits do not necessarily form distinct and
universally applicable functional effect groups. Marine Ecology Progress Series, 516: 23-34.
Naeem S. (1998). Species redundancy and ecosystem reliability. Conservation Biology, 12: 39-45.
Nally R.M. (1996). Hierarchical partitioning as an interpretative tool in multivariate inference.
Australian Journal of Ecology, 21: 224-228.

CHAPTER 2
57
Neto J.M., Teixeira H., Patrício J., Baeta A., Veríssimo H., Pinto R. & Marques J.C. (2010). The
Response of Estuarine Macrobenthic Communities to Natural- and Human-Induced Changes: Dynamics
and Ecological Quality. Estuaries and Coasts, 33: 1327-1339.
Nyitrai D., Martinho F., Dolbeth M., Baptista J. & Pardal M.A. (2012). Trends in estuarine fish
assemblages facing different environmental conditions: combining diversity with functional attributes.
Aquatic Ecology, 46: 201-214.
Nyitrai D., Martinho F., Dolbeth M., Rito J. & Pardal M.A. (2013). Effects of local and large-scale
climate patterns on estuarine resident fishes: The example of Pomatoschistus microps and Pomatoschistus
minutus. Estuarine, Coastal and Shelf Science, 135: 260-268.
Nyström M., Folke C. & Moberg F. (2000). Coral reef disturbance and resilience in a human-
dominated environment. Trends in Ecology and Evolution, 15: 413-417.
Ordiano-Flores A., Galvan-Magana F. & Rosiles-Martinez R. (2011). Bioaccumulation of mercury in
muscle tissue of yellowfin tuna, Thunnus albacares, of the eastern Pacific Ocean. Biol Trace Elem Res,
144: 606-620.
Pinto R., de Jonge V.N. & Marques J.C. (2014). Linking biodiversity indicators, ecosystem
functioning, provision of services and human well-being in estuarine systems: application of a conceptual
framework. Ecological Indicators, 36: 644-655.
Potter I.C., Bird D.J., Claridge P.N., Clarke K.R., Hyndes G.A. & Newton L.C. (2001). Fish fauna of
the Severn Estuary. Are there long-term changes in abundance and species composition and are the
recruitment patterns of the main marine species correlated? Journal of Experimental Marine Biology and
Ecology, 258: 15-37.
Pratchett M.S., Hoey A.S. & Wilson S.K. (2014). Reef degradation and the loss of critical ecosystem
goods and services provided by coral reef fishes. Current Opinion in Environmental Sustainability, 7: 37-
43.
Qin J. & Threlkeld S. (1990). Experiental coparison of the effects of benthivorous fish and
planktivorous fish on plankton community structure Archiv für Hydrobiologie, 119: 121-141.
Rao R.C. (1982). Diversity and dissimilarity coefficients: a unified approach. Theroretical Population
Biology, 21: 24-43.
Raymundo L.J., Halford A.R., Maypa A.P. & Kerr A.M. (2009). Functionally diverse reef-fish
communities ameliorate coral disease. Proceedings of the National Academy of Sciences of the United
States of America, 106: 17067-17070.
Richardson S.J., Williams P.A., Mason N.W., Buxton R.P., Courtney S.P., Rance B.D., Clarkson B.R.,
Hoare R.J.B., St. John M.G. & Wiser S.K. (2012). Rare species drive local trait diversity in two
geographically disjunct examples of a naturally rare alpine ecosystem in New Zealand. Journal of
Vegetation Science, 23: 626-639.
Ricotta C., de Bello F., Moretti M., Caccianiga M., Cerabolini B.E.L. & Pavoine S. (In press).
Measuring the functional redundancy of biological communities: A quantitative guide. Methods in
Ecology and Evolution.
Roberts D.L. (2016). Labdsv: Ordination and Multivariate Analysis for Ecology. R package version
1.8.0.
Rodrigues E.T. & Pardal M.Â. (2015). Primary productivity temporal fluctuations in a nutrient-rich
estuary due to climate-driven events. Estuaries and Coasts, 38: 1-12.
Rosecchi E. & Crivelli A.J. (1992). Study of a sand smelt (Atherina boyeri Risso 1810) population
reproducing in fresh water. Ecology of Freshwater Fish, 1: 77-85.
Rosenfeld J.S. (2002). Functional redundancy in ecology and conservation. Oikos, 98: 156-162.
Rotjan R.D. & Lewis S.M. (2008). Impact of coral predators on tropical reefs. Marine Ecology
Progress Series, 367: 73-91.
Ruitton S., Francour P. & Boudouresque C.F. (2000). Relationships between algae, benthic
herbivorous invertebrates and fishes in rocky sublittoral communities of a temperate sea (Mediterranean).
Estuarine, Coastal and Shelf Science, 50: 217-230.

CHAPTER 2
58
Sasaki T., Okubo S., Okayasu T., Jamsran U., Ohkuro T. & Takeuchi K. (2009). Two-phase functional
redundancy in plant communities along a grazing gradient in Mongolian rangelands. Ecology, 90: 2598-
2608.
Schindler D.E., Carpenter S.R., Cole J.J., Kitchell J.F. & Pace M.L. (1997). Influence of food web
structure on carbon exchange between lakes and the atmosphere. Science, 277: 248-251.
Shahi M., Kamrani E., Salehi M., Habibi R. & Hanafi-Bojd A.A. (2015). Native larvivorous fish in an
endemic malarious area of southern Iran, a biological alternative factor for chemical larvicides in malaria
control program. Iranian Journal of Public Health, 44: 1544-1549.
Shears N.T. & Babcock R.C. (2002). Marine reserves demonstrate top-down control of community
structure on temperate reefs. Oecologia, 132: 131-142.
Shimadzu H., Dornelas M., Henderson P.A. & Magurran A.E. (2013). Diversity is maintained by
seasonal variation in species abundance. BMC Biology, 11.
Smolders A.J., van der Velde G., Roelofs J.G. & Guerrero Hiza M.A. (2000). El Nino caused collapse
of the sabalo fishery (Prochilodus lineatus, Pisces: Prochilodontidae) in a South American river.
Naturwissenschaften, 87: 30-32.
Strange E.M., Fausch K.D. & Covich A.P. (1999). Sustaining ecosystem services in human-dominated
watersheds: biohydrology and ecosystem processes in the South Platte river basin. Environmental
Management, 24: 39-54.
Taylor B.W., Flecker A.S. & Hall R.O., Jr. (2006). Loss of a harvested fish species disrupts carbon
flow in a diverse tropical river. Science, 313: 833-836.
TEEB (2010). The Economics of Ecosystems and Biodiversity: Ecological and Economical
Foundations. Earthscan, London and Washington.
Valiela I., McClelland J., Hauxwell J., Behr P.J., Hersh D. & Foreman K. (1997). Macroalgal blooms
in shallow estuaries: controls and ecophysiological and ecosystem consequences. Limnology and
Oceanography, 42: 1105-1118.
van der Linden P., Marchini A., Dolbeth M., Patrício J., Veríssimo H. & Marques J.C. (2016). The
performance of trait-based indices in an estuarine environment. Ecological Indicators, 61: 378-389.
Vanni M.J., Bowling A.M., Dickman E.M., Hale R.S., Higgins K.A., Horgan M.J., Knoll L.B.,
Renwick W.H. & Stein R.A. (2008). Nutrient cycling by fish supports relatively more primary production
as lake productivity increases. Ecology, 87: 1696-1709.
Vasconcelos R.P., Reis-Santos P., Fonseca V., Maia A., Ruano M., Franca S., Vinagre C., Costa M.J.
& Cabral H. (2007). Assessing anthropogenic pressures on estuarine fish nurseries along the Portuguese
coast: a multi-metric index and conceptual approach. Science of the Total Environment, 374: 199-215.
Vasconcelos R.P., Reis-Santos P., Fonseca V., Ruano M., Tanner S., Costa M.J. & Cabral H.N. (2009).
Juvenile fish condition in estuarine nurseries along the Portuguese coast. Estuarine, Coastal and Shelf
Science, 82: 128-138.
Vasconcelos R.P., Reis-Santos P., Maia A., Fonseca V., França S., Wouters N., Costa M.J. & Cabral
H.N. (2010). Nursery use patterns of commercially important marine fish species in estuarine systems
along the Portuguese coast. Estuarine, Coastal and Shelf Science, 86: 613-624.
Vasconcelos R.P., Reis-Santos P., Tanner S., Maia A., Latkoczy C., Günther D., Costa M.J. & Cabral
H. (2008). Evidence of estuarine nursery origin of five coastal fish species along the Portuguese coast
through otolith elemental fingerprints. Estuarine, Coastal and Shelf Science, 79: 317-327.
Verberk W.C.E.P., van Noordwijk C.G.E. & Hildrew A.G. (2013). Delivering on a promise:
integrating species traits to transform descriptive community ecology into a predictive science. Freshwater
Science, 32: 531-547.
Verdelhos T., Cardoso P.G., Dolbeth M. & Pardal M.A. (2014). Recovery trends of Scrobicularia plana
populations after restoration measures, affected by extreme climate events. Marine Environmental
Research, 98: 39-48.
Verdelhos T., Neto J.M., Marques J.C. & Pardal M.A. (2005). The effect of eutrophication abatement
on the bivalve Scrobicularia plana. Estuarine, Coastal and Shelf Science, 63: 261-268.

CHAPTER 2
59
Verheye H.M. & Richardson A.J. (1998). Long-term increase in crustacean zooplankton abundance in
the southern Benguela upwelling region (1951–1996): bottom-up or top-down control? ICES Journal of
Marine Science, 55: 803-807.
Veríssimo H., Lane M., Patrício J., Gamito S. & Marques J.C. (2013). Trends in water quality and
subtidal benthic communities in a temperate estuary: Is the response to restoration efforts hidden by
climate variability and the Estuarine Quality Paradox? Ecological Indicators, 24: 56-67.
Villéger S., Ramos Miranda J., Flores Hernandez D. & Mouillot D. (2012). Low functional beta-
diversity despite high taxonomic beta-diversity among tropical estuarine fish communities. PLoS One, 7:
1-10.
Vinagre C., Santos F.D., Cabral H.N. & Costa M.J. (2009). Impact of climate and hydrology on
juvenile fish recruitment towards estuarine nursery grounds in the context of climate change. Estuarine,
Coastal and Shelf Science, 85: 479-486.
Violle C., Navas M.L., Vile D., Kazakou E., Fortunel C., Hummel I. & Garnier E. (2007). Let the
concept of trait be functional! Oikos, 116: 882-892.
Walker B., Kinzig A. & Langridge J. (1999). Plant attribute diversity, resilience, and ecosystem
function: the nature and significance of dominant and minor species. Ecosystems, 2: 95-113.
Walker B.H. (1992). Biodiversity and ecological redundancy. Conservation Biology, 6: 18-23.
Ward J.H. (1963). Hierarchical Grouping to Optimize an Objective Function. Journal of the American
Statistical Association, 58: 236-244.
Wellnitz T. & Poff N.L. (2001). Functional redundancy in heterogeneous environments: implications
for conservation. Ecology Letters, 4: 177-179.
Whitfield A.K., Elliott M., Basset A., Blaber S.J.M. & West R.J. (2012). Paradigms in estuarine
ecology – A review of the Remane diagram with a suggested revised model for estuaries. Estuarine,
Coastal and Shelf Science, 97: 78-90.
Whitfield A.K., Taylor R.H., Fox C. & Cyrus D.P. (2006). Fishes and salinities in the St Lucia
estuarine system—a review. Reviews in Fish Biology and Fisheries, 16: 1-20.
Woodward G., Ebenman B., Emmerson M., Montoya J.M., Olesen J.M., Valido A. & Warren P.H.
(2005). Body size in ecological networks. Trends in Ecology and Evolution, 20: 402-409.
Worm B., Barbier E.B., Beaumont N., Duffy J.E., Folke C., Halpern B.S., Jackson J.B., Lotze H.K.,
Micheli F., Palumbi S.R., Sala E., Selkoe K.A., Stachowicz J.J. & Watson R. (2006). Impacts of
biodiversity loss on ocean ecosystem services. Science, 314: 787-790.
Xie P. & Liu J. (2001). Practical success of biomanipulation using filter-feeding fish to control
cyanobacteria blooms: a synthesis of decades of research and application in a subtropical hypereutrophic
lake. The Scientific World Journal, 1: 337-356.
Yachi S. & Loreau M. (1999). Biodiversity and ecosystem productivity in a fluctuating environment:
the insurance hypothesis. Proceedings of the National Academy of Sciences of the United States of
America, 96: 1463-1468.
Zhou H.Y., Cheung R.Y.H. & Wong M.H. (1999). Bioaccumulation of organochlorines in freshwater
fish with different feeding modes cultured in treated wastewater. Water Research, 33: 2747-2756.


61
CHAPTER 3
Final Remarks

CHAPTER 3
63
Final Remarks
The results of this study reveal new perspectives on the value of biodiversity to human society, and
also represent an important step towards the quantification of the contribution of fish communities to
ecosystem services, particularly in estuaries, although this goal needs further research. The concept of
ecosystem services is fundamental in this context, since loss of species can cause the disappearance of
essential functions and therefore affect the provision of ecosystem services to human populations
(Elmqvist et al. 2003; Díaz et al. 2006).
This study showed that an estuarine fish assemblage can potentially mediate the provision of regulating
ecosystem services, such as nutrient cycling (which allows the presence of nutrients in the water),
biological control (important for a wide range of aspects, from regulation of food web dynamics to pest
regulation and control of invasive species), maintenance of sediment processes and sediment redistribution
(which influence the structure of the substrate and sediment quality) and regulation of linkages between
ecosystems (relevant to transfer energy, nutrients and genetic material to other regions, especially
considering that estuaries are transitional systems). Also, by estimating functional redundancy of fish
functional groups by season, station and year, this study investigated possible drivers of its variation and
highlighted the need to assess the resilience of ecosystem services, which contributes to create a better
understanding of the relevance of conservation of fish assemblages. Moreover, the maintenance of
functional characteristics within fish assemblages in estuaries is critical to ensure the healthy functioning
of these transitional systems, especially considering the range of pressures which affect them, both from
natural and anthropogenic sources (Borja et al. 2010). Further research on fish communities should be
developed, directly linking their functional traits to contributions to the provision of ecosystem services,
since this group of organisms is poorly studied in this context and also extremely impacted by fisheries
and habitat and environmental alterations. This approach characterized the connection between fish
functional traits and ecosystem functions based on publicly available information referring to all
ecosystems and aquatic habitats, throughout the world. It is necessary to investigate those connections in
estuaries, since available information in these systems is still scarce, concerning links between fish
functional traits and ecosystem functioning (Pinto et al. 2010).
Future studies should develop the quantification of services provided by fish, mainly considering two
perspectives: ecological (Holmlund & Hammer 1999; Pratchett et al. 2014) and economical (Pinto et al.
2010; de Jonge et al. 2012). Furthermore, to measure the contribution of fish to ecosystem services in
estuarine context, other direct and indirect ways should be explored, besides measuring functional traits.
For example, to assess the role of fish in nutrient cycling, Allgeier et al. (2013) estimated the excretion
rate of phosphorus and nitrogen by fish, which increases the availability of nutrients in aquatic
environments and supports primary production (Holmlund & Hammer 1999; McIntyre et al. 2007).
Additionally, Cardinale et al. (2012) suggested that climate regulation by organisms could be quantified
by: 1 - the net influence of biodiversity on photosynthesis (exchange of CO2 for O2); 2 – the accumulation
of carbon in live plant tissue; 3 – herbivory (plant carbon ingested by herbivorous animals); 4 –
decomposition (carbon resulting from death and decomposition of organisms, returning to the
atmosphere). However, this raises several problems, especially concerning the specific role of fish in the
provision of this ecosystem service, since the relationship between fish traits and for example climate
regulation is indirect and the attempts in quantifying it are still poorly developed (Schindler et al. 1997;

CHAPTER 3
64
Holmlund & Hammer 1999). Thus, further research is needed to develop methods of quantification of the
contribution of fish to ecosystem functioning and services, especially in estuaries.
The effects of anthropogenic pressures in fish communities are widely studied (Kennish 2002; Yuksek
et al. 2006; Vasconcelos et al. 2007; Henriques et al. 2013), which is important to recognize the factors
affecting their variation and also to determine what should be done to mitigate negative impacts. However,
it is critical to investigate the effects of anthropogenic pressures in the functional composition of fish
communities and thus in ecosystem functioning (Kennish 2002). For example, Jennings and Lock (1996)
explored the effects of reef fishing in fish communities, reporting changes in size, behavior and
community structure, which have direct influence in functional composition and thus in the performance
of important functions, such as grazing on reef algae by herbivorous fishes, which avoids algae outgrowth
and enables coral settlement (Potts 1977; Brock 1979). Also, Pinnegar et al. (2000) highlighted that one of
the indirect effects of fishing is the occurrence of trophic cascades, describing some examples in the
Mediterranean, such as the depletion of invertebrate-feeding fish that control the populations of sea
urchins (Sala & Zabala 1996), which remove large erect algae (an important structural habitat for
invertebrates), and induce the formation of coralline barrens (Lawrence 1975). For example, in the Gulf of
Maine, large predatory finfish are absent due to overfishing of cod (Gadus morhua), which altered food
webs in this region (Steneck 1997). Therefore, it is essential to develop research about anthropogenic
effects in ecosystem functioning and services, especially in estuaries and concerning fish.
When assessing the provision of ecosystem services, there are several possible approaches and each
presents some disadvantages. The approach of functional groups used in this study was informative
(Dumay et al. 2004) but it has limitations, for instance the definition of groups tends to be site/context
specific and it needs empirical exploration, especially concerning the mechanisms by which species affect
ecosystem functioning (Murray et al. 2014). Also, the assignment of species into functional groups
assumes they are totally equivalent (Carmona et al. 2016), which is not necessarily true, since species can
share traits but interact differently with the environment, as observed by Resetarits and Chalcraft (2007)
for three congeneric fish species. Thus, the interactions between and within species, such as competition
and mutualism, must be taken into account for service provision, especially considering functional groups
(Luck et al. 2009).
In estuaries, different types of habitats are generally present and interconnected (França et al. 2009). In
this study, the Mondego estuary was assessed as a whole, without differentiating between habitats, only
between a salinity gradient. However, that would be an important aspect for research, since it is known
that fish assemblages show variation along different habitat types within estuaries (Pihl et al. 2002; França
et al. 2009), according to food availability, environmental conditions and predator abundance, among
other factors (Blaber & Blaber 1980). For example, salt marsh habitat supports different fish assemblages
than seagrass beds (França et al. 2009) which have lower predator pressure and serve as a nursery for
juvenile marine fish species, such as Diplodus vulgaris (Gray et al. 1998; França et al. 2009). Therefore, it
is important to understand the differences in fish communities, especially in a functional level, among the
range of habitats in estuaries, in order to understand potential differences in ecosystem functioning and
services and predict the effects of habitat degradation (Connolly et al. 2005).
Given that estuaries support fish species from different aquatic ecosystems, assessing the contribution
of fish to ecosystem services in estuaries can help understanding their contribution in other aquatic
systems, transposing the knowledge about the mechanistic links between functional structure and the
provision of services. Additionally, the present study improves understanding of how fish mediate
regulating functions in marine and freshwater ecosystems. However, further research on this issue is still

CHAPTER 3
65
needed as fish assemblages diverge according to environmental and biotic factors (e.g. structure of food
webs, number of species within each functional trait, habitat structure) (Elliott & Dewailly 1995;
Harmelin-Vivien et al. 2001; Jackson et al. 2001a; Magalhães et al. 2002; Martino & Able 2003). Yet,
they can share functional roles and therefore contribute to the same ecosystem services, thus making
research about this subject more interesting.
Considering that estuaries constitute transitional systems that connect marine and freshwater
environments (Beck et al. 2001; Vasconcelos et al. 2015), the healthy functioning of estuarine systems is
essential to maintain the linkages between rivers and oceans, and also support the diversity of fish species
within and between these systems. In this context, it will be important to assess the provision of ecosystem
services in these different aquatic systems and their relationships and interactions (Bennett et al. 2009).
Several studies have already been conducted to assess the delivery of ecosystem services by single types
of aquatic systems, such as freshwater (Jackson et al. 2001b), marine (Beaumont et al. 2007; Liquete et al.
2013; Hattam et al. 2015) and estuarine (Barbier et al. 2011) systems, but it would be interesting to
investigate the relationship between these systems and the services they provide. Also, the creation of a
common framework of ecosystem services by aquatic systems, representing the interactions between
them, would be useful for management and conservation purposes (Costanza et al. 1997).
Although this study focuses on the links between fish functional groups and the delivery of ecosystem
services, there are other groups of organisms involved in mediating this delivery, by performing essential
functions and interacting with fish in aquatic environments. For example, bioturbation is an ecosystem
function that is involved in the maintenance of sediment processes, an important ecosystem service
provided in the Mondego estuary and other aquatic systems (Holmlund & Hammer 1999), which is
accomplished by fish but especially by macroinvertebrates (Gerino et al. 2003; Adámek & Maršálek
2013). Also, primary producers contribute directly and strongly to carbon fixation, which is essential to
climate regulation (de Bello et al. 2010; Lavorel & Grigulis 2012), an ecosystem service also provided by
fish in an indirect way, by suppressing zooplankton in lakes and therefore releasing phytoplankton from
grazing pressure (Schindler et al. 1997). Nutrient cycling is another example of ecosystem services being
mediated by several groups of organisms, such as algae, fish and aquatic insects (Flecker et al. 2002;
Vanni et al. 2008; Macadam & Stockan 2015). As such, interactions between fish and other groups of
organisms are extremely important to be considered in ecosystem services provision (Balvanera et al.
2005) and thus should be further investigated.
The effects of environmental variables in variation of functional traits were explored in this study, as
well as temporal, spatial and seasonal variation of the fish functional groups, but in order to fully
understand the drivers of change in this fish assemblage, it would be also necessary to address the
anthropogenic pressures in the Mondego estuary, such as industrial pollution, eutrophication and
overfishing, and how they affect the environmental conditions in the estuary (Martinho et al. 2008;
Dolbeth et al. 2013). It is already known that anthropogenic impacts on the hydro-morphology of estuaries
can cause changes in fish communities (Baptista et al. 2015), making it crucial to integrate anthropogenic
stressors with natural stressors in these assessments (Pinto et al. 2014).
Overall, this study highlighted the contribution of fish to the delivery of regulating ecosystem services
and estimated the resilience of those services through functional redundancy, which is an important step
towards conservation. It is necessary to consider ecosystem services in decision-making (Daily et al.
2009), especially in estuaries. Also, by assessing functional redundancy, we gained knowledge of the
sensitivity of fish functional groups to disturbance (Muntadas et al. 2016), which is an important tool in
the correct management of fish resources in this estuary. Finally, the results of this study can be transposed

CHAPTER 3
66
to other estuarine systems, although further investigation is needed, especially concerning the ecosystem
services that fish assemblages can provide.
Literature cited
Adámek Z. & Maršálek B. (2013). Bioturbation of sediments by benthic macroinvertebrates and fish
and its implication for pond ecosystems: a review. Aquaculture International, 21: 1-17.
Allgeier J.E., Yeager L.A. & Layman C.A. (2013). Consumers regulate nutrient limitation regimes and
primary production in seagrass ecosystems. Ecology, 94: 521-529.
Balvanera P., Kremen C. & Martínez-Ramos M. (2005). Applying community structure analysis to
ecosystem function: examples from pollination and carbon storage. Ecological Applications, 15: 360-375.
Baptista J., Martinho F., Nyitrai D., Pardal M.A. & Dolbeth M. (2015). Long-term functional changes
in an estuarine fish assemblage. Marine Pollution Bulletin, 97: 125-134.
Barbier E.B., Hacker S.D., Kennedy C., Koch E.W., Stier A.C. & Silliman B.R. (2011). The value of
estuarine and coastal ecosystem services. Ecological Monographs, 81: 169-193.
Beaumont N.J., Austen M.C., Atkins J.P., Burdon D., Degraer S., Dentinho T.P., Derous S., Holm P.,
Horton T., van Ierland E., Marboe A.H., Starkey D.J., Townsend M. & Zarzycki T. (2007). Identification,
definition and quantification of goods and services provided by marine biodiversity: implications for the
ecosystem approach. Marine Pollution Bulletin, 54: 253-265.
Beck M.W., Heck K.L., Able K.W., Childers D.L., Eggleston D.B., Gillanders B., Halpern B., Hays
C.G., Hoshino K., Minello T.J., Orth R.J., Sheridan P.F. & Weinstein M. (2001). The identification,
conservation, and management of estuarine and marine nurseries for fish and invertebrates. BioScience,
51: 633-641.
Bennett E.M., Peterson G.D. & Gordon L.J. (2009). Understanding relationships among multiple
ecosystem services. Ecology Letters, 12: 1394-1404.
Blaber S.J.M. & Blaber T.G. (1980). Factors affecting the distribution of juvenile estuarine and inshore
fish. Journal of Fish Biology, 17: 143-162.
Borja A., Dauer D.M., Elliott M. & Simenstad C.A. (2010). Medium- and long-term recovery of
estuarine and coastal ecosystems: patterns, rates and restoration effectiveness. Estuaries and Coasts, 33:
1249-1260.
Brock R.E. (1979). An experimental study on the effects of grazing by parrotfishes and role of refuges
in benthic community structure. Marine Biology, 51: 381-388.
Cardinale B.J., Duffy J.E., Gonzalez A., Hooper D.U., Perrings C., Venail P., Narwani A., Mace G.M.,
Tilman D., Wardle D.A., Kinzig A.P., Daily G.C., Loreau M., Grace J.B., Larigauderie A., Srivastava D.S.
& Naeem S. (2012). Biodiversity loss and its impact on humanity. Nature, 486: 59-67.
Carmona C.P., de Bello F., Mason N.W. & Leps J. (2016). Traits Without Borders: Integrating
Functional Diversity Across Scales. Trends in Ecology and Evolution, 31: 382-394.
Connolly S.R., Hughes T.P., Bellwood D.R. & Karlson R.H. (2005). Community structure of corals
and reef fishes at multiple scales. Science, 309: 1363-1365.
Costanza R., dArge R., deGroot R., Farber S., Grasso M., Hannon B., Limburg K., Naeem S., ONeill
R.V., Paruelo J., Raskin R.G., Sutton P. & vandenBelt M. (1997). The value of the world's ecosystem
services and natural capital. Nature, 387: 253-260.

CHAPTER 3
67
Daily G.C., Polasky S., Goldstein J., Kareiva P.M., Mooney H.A., Pejchar L., Ricketts T.H., Salzman
J. & Shallenberger R. (2009). Ecosystem services in decision making: time to deliver. Frontiers in
Ecology and the Environment, 7: 21-28.
de Bello F., Lavorel S., Díaz S., Harrington R., Cornelissen J.H.C., Bardgett R.D., Berg M.P., Cipriotti
P., Feld C.K., Hering D., Martins da Silva P., Potts S.G., Sandin L., Sousa J.P., Storkey J., Wardle D.A. &
Harrison P.A. (2010). Towards an assessment of multiple ecosystem processes and services via functional
traits. Biodiversity and Conservation, 19: 2873-2893.
de Jonge V.N., Pinto R. & Turner R.K. (2012). Integrating ecological, economic and social aspects to
generate useful management information under the EU Directives' ‘ecosystem approach’. Ocean &
Coastal Management, 68: 169-188.
Díaz S., Fargione J., Chapin F.S., 3rd & Tilman D. (2006). Biodiversity loss threatens human well-
being. PLoS Biology, 4: 1300-1305.
Dolbeth M., Cardoso P., Grilo T., Raffaelli D. & Pardal M.A. (2013). Drivers of estuarine benthic
species distribution patterns following a restoration of a seagrass bed: a functional trait analyses. Marine
Pollution Bulletin, 72: 47-54.
Dumay O., Tari P.S., Tomasini A. & Mouillot D. (2004). Functional groups of lagoon fish species in
Languedoc Roussillon, southern France. Journal of Fish Biology, 64: 970-983.
Elliott M. & Dewailly F. (1995). The structure and components of european estuarine fish assemblages.
Netherlands Journal of Aquatic Ecology, 29: 397 - 417.
Elmqvist T., Folke C., Nyström M., Peterson G., Bengtsson J., Walker B. & Norberg J. (2003).
Response diversity, ecosystem change, and resilience. Frontiers in Ecology and the Environment, 1: 488-
494.
Flecker A.S., Taylor B.W., Bernhardt E.S., Hood J.M., Cornwell W.K., Cassatt S.R., Vanni M.J. &
Altman N.S. (2002). Interactions between herbivorous fishes and limiting nutrients in a tropical stream
ecosystem. Ecology, 83: 1831-1844.
França S., Costa M.J. & Cabral H.N. (2009). Assessing habitat specific fish assemblages in estuaries
along the Portuguese coast. Estuarine, Coastal and Shelf Science, 83: 1-12.
Gerino M., Stora G., François-Carcaillet F., Gilbert F., Poggiale J.-C., Mermillod-Blondin F.,
Desrosiers G. & Vervier P. (2003). Macro-invertebrates functional groups in freshwater and marine
sediments: a commun mechanistic classification. Vie et Milieu: 221-231.
Gray C.A., Chick R.C. & McElligott D.J. (1998). Diel changes in assemblages of fishes associated
with shallow seagrass and bare sand. Estuarine, Coastal and Shelf Science, 46: 849-859.
Harmelin-Vivien M.L., Harmelin J.-G. & Almeida A.J. (2001). Structure of fish assemblages on
coastal rocky shores of the Azores. Boletim do Museu Municipal do Funchal, 6: 127-138.
Hattam C., Atkins J.P., Beaumont N., Borger T., Bohnke-Henrichs A., Burdon D., de Groot R.,
Hoefnagel E., Nunes P.A.L.D., Piwowarczyk J., Sastre S. & Austen M.C. (2015). Marine ecosystem
services: Linking indicators to their classification. Ecological Indicators, 49: 61-75.
Henriques S., Pais M.P., Batista M.I., Costa M.J. & Cabral H.N. (2013). Response of fish-based
metrics to anthropogenic pressures in temperate rocky reefs. Ecological Indicators, 25: 65-76.
Holmlund C.M. & Hammer M. (1999). Ecosystem services generated by fish populations. Ecological
Economics, 29: 253-268.
Jackson D.A., Peres-Neto P.R. & Olden J.D. (2001a). What controls who is where in freshwater fish
communities - the roles of biotic, abiotic and spatial factors. Canadian Journal of Fisheries and Aquatic
Sciences, 58: 157-170.

CHAPTER 3
68
Jackson R.B., Carpenter S.R., Dahm C.N., McKnight D.M., Naiman R.J., Postel S.L. & Running S.W.
(2001b). Water in a changing world. Ecological Applications, 11: 1027-1045.
Jennings S. & Lock J.M. (1996). Population and ecosystem effects of reef fishing. In: Reef Fisheries
(eds. Polunin NVC & Roberts CM). Chapman and Hall London, U. K. , pp. 193 - 218.
Kennish M.J. (2002). Environmental threats and environmental future of estuaries. Environmental
Conservation, 29: 78-107.
Lavorel S. & Grigulis K. (2012). How fundamental plant functional trait relationships scale-up to
trade-offs and synergies in ecosystem services. Journal of Ecology, 10.1111/j.1365-2745.2011.01914.x.
Lawrence J.M. (1975). On the relationships between marine plants and sea urchins. Oceanography and
Marine Biology: an Annual Review, 13: 213-286.
Liquete C., Piroddi C., Drakou E.G., Gurney L., Katsanevakis S., Charef A. & Egoh B. (2013). Current
status and future prospects for the assessment of marine and coastal ecosystem services: a systematic
review. PLoS One, 8: 1-15.
Luck G.W., Harrington R., Harrison P.A., Kremen C., Berry P.M., Bugter R., Dawson T.P., de Bello
F., Diaz S., Feld C.K., Haslett J.R., Hering D., Kontogianni A., Lavorel S., Rounsevell M., Samways M.J.,
Sandin L., Settele J., Sykes M.T., van den Hove S., Vandewalle M. & Zobel M. (2009). Quantifying the
Contribution of Organisms to the Provision of Ecosystem Services. BioScience, 59: 223-235.
Macadam C.R. & Stockan J.A. (2015). More than just fish food: ecosystem services provided by
freshwater insects. Ecological Entomology, 40: 113-123.
Magalhães M.F., Batalha D.C. & Collares-Pereira M.J. (2002). Gradients in stream fish assemblages
across a Mediterranean landscape: contributions of environmental factors and spatial structure. Freshwater
Biology, 47: 1015-1031.
Martinho F., Viegas I., Dolbeth M., Leitão R., Cabral H.N. & Pardal M.A. (2008). Assessing estuarine
environmental quality using fish-based indices: performance evaluation under climatic instability. Marine
Pollution Bulletin, 56: 1834-1843.
Martino E.J. & Able K.W. (2003). Fish assemblages across the marine to low salinity transition zone of
a temperate estuary. Estuarine, Coastal and Shelf Science, 56: 969-987.
McIntyre P.B., Jones L.E., Flecker A.S. & Vanni M.J. (2007). Fish extinctions alter nutrient recycling
in tropical freshwaters. Proceedings of the National Academy of Sciences of the United States of America,
104: 4461-4466.
Muntadas A., de Juan S. & Demestre M. (2016). Assessing functional redundancy in chronically
trawled benthic communities. Ecological Indicators, 61: 882-892.
Murray F., Douglas A. & Solan M. (2014). Species that share traits do not necessarily form distinct and
universally applicable functional effect groups. Marine Ecology Progress Series, 516: 23-34.
Pihl L., Cattrijsse A., Codling I., Mathieson S., McLusky D.S. & Roberts C. (2002). Habitat use by
fishes in estuaries and other brackish areas. In: Fishes in Estuaries (eds. Elliott M & Hemingway K).
Blackwell Publishing Ltd.
Pinnegar J.K., Polunin N.V.C., Francour P., Badalamenti F., Chemello R., Harmelin-Vivien M., Hereu
B., Milazzo M., Zabala M., D'Anna G. & Pipitone C. (2000). Trophic cascades in benthic marine
ecosystems: lessons for fisheries and protected-area management. Environmental Conservation, 27: 179 -
200.
Pinto R., de Jonge V.N. & Marques J.C. (2014). Linking biodiversity indicators, ecosystem
functioning, provision of services and human well-being in estuarine systems: application of a conceptual
framework. Ecological Indicators, 36: 644-655.

CHAPTER 3
69
Pinto R., Patrício J., Neto J.M., Salas F. & Marques J.C. (2010). Assessing estuarine quality under the
ecosystem services scope: Ecological and socioeconomic aspects. Ecological Complexity, 7: 389-402.
Potts D.C. (1977). Suppression of coral populations by filamentous algae within damselfish territories.
Journal of Experimental Marine Biology and Ecology, 28: 207-216.
Pratchett M.S., Hoey A.S. & Wilson S.K. (2014). Reef degradation and the loss of critical ecosystem
goods and services provided by coral reef fishes. Current Opinion in Environmental Sustainability, 7: 37-
43.
Resetarits W.J. & Chalcraft D.R. (2007). Functional diversity within a morphologically conservative
genus of predators: implications for functional equivalence and redundancy in ecological communities.
Functional Ecology, 21: 793-804.
Sala E. & Zabala M. (1996). Fish predation and the structure of the sea urchin Paracentrotus lividus
populations in the NW Mediterranean. Marine Ecology Progress Series, 140: 71-81.
Schindler D.E., Carpenter S.R., Cole J.J., Kitchell J.F. & Pace M.L. (1997). Influence of food web
structure on carbon exchange between lakes and the atmosphere. Science, 277: 248-251.
Steneck R.S. (1997). Fisheries-induced biological changes to the structure and function of the Gulf of
Maine ecosystem. Plenary paper. In: Proceedings of the Gulf of Maine Ecosystem Dynamics Scientific
Symposium and Workshop (eds. Wallace GT & Braasch EF). Regional Association for Research on the
Gulf of Maine Hanover, NH, pp. 151-165.
Vanni M.J., Bowling A.M., Dickman E.M., Hale R.S., Higgins K.A., Horgan M.J., Knoll L.B.,
Renwick W.H. & Stein R.A. (2008). Nutrient cycling by fish supports relatively more primary production
as lake productivity increases. Ecology, 87: 1696-1709.
Vasconcelos R.P., Henriques S., França S., Pasquaud S., Cardoso I., Laborde M. & Cabral H.N.
(2015). Global patterns and predictors of fish species richness in estuaries. Journal of Animal Ecology, 84:
1331-1341.
Vasconcelos R.P., Reis-Santos P., Fonseca V., Maia A., Ruano M., Franca S., Vinagre C., Costa M.J.
& Cabral H. (2007). Assessing anthropogenic pressures on estuarine fish nurseries along the Portuguese
coast: a multi-metric index and conceptual approach. Science of the Total Environment, 374: 199-215.
Yuksek A., Okus E., Yilmaz I.N., Aslan-Yilmaz A. & Tas S. (2006). Changes in biodiversity of the
extremely polluted Golden Horn Estuary following the improvements in water quality. Marine Pollution
Bulletin, 52: 1209-1218.


APPENDIX I
71
Appendix I
Table 1 – Characterization of the seven fish functional groups generated by hierarchical cluster analysis of the Mondego estuary fish assemblage. Shown is the percentage of each
trait category in each functional group (measured in biomass): the total of one hundred percent is represented by the whole assemblage, i.e. the sum of percentage of all categories
in a given trait across the seven groups.

APPENDIX I
72
Table 2 – Characterization of the seven fish functional groups generated by hierarchical cluster analysis of the Mondego estuary fish assemblage. Shown is the percentage of each
trait category in each functional group (measured in density): the total of one hundred percent is represented by the whole assemblage, i.e. the sum of percentage of all categories in
a given trait across the seven groups.

APPENDIX I
73
Table 3 – Characterization of the seven fish functional groups generated by hierarchical cluster analysis of the Mondego estuary fish assemblage. Shown is the percentage of each
trait category in each functional group (measured in number of species): the total of one hundred percent is represented by the whole assemblage, i.e. the sum of percentage of all
categories in a given trait across the seven groups.


APPENDIX II
75
Appendix II
Table 1 – PERMANOVA results from the pair-wise tests for the differences in biomass of each functional group considering factors season, station and year. Each value
corresponds to the t statistic and the significance is in superscript (* p-value < 0.05, ns - non-significant). Blank cells correspond to non-significant main tests.
Factor Levels Total Biomass Biomass G1 Biomass G2 Biomass G3 Biomass G4 Biomass G5 Biomass G6 Biomass G7
Season summer, autumn 1.173ns
- 3.58* 3.357* 2.794* - - - summer, winter 1.925* - 3.052* 3.107* 2.505* - - - summer, spring 0.752
ns - 1.102
ns 1.225
ns 1.106
ns - - -
autumn, winter 2.975* - 1.554ns
0.873ns
0.539ns
- - - autumn, spring 0.99
ns - 3.002* 1.795* 3.111* - - -
winter, spring 2.33* - 2.397* 1.627ns
2.937* - - - Station M, S1 8.296* 1.498* 0.716* 2.673* 0.593* 7.211* 5.192* - M, S2 5.813* 2.150* 0.786* 1.108* 0.289* 6.012* 2.071* - M, N1 2.269* 5.071
ns 1.020* 1.597* 3.736* 2.410* 1.208
ns -
M, N2 1.873* 1.725* 2.650* 0.527ns
0.667* 3.087* 2.642* - S1, S2 6.037* 0.729* 0.581
ns 2.509
ns 0.391
ns 3.035* 6.701* -
S1, N1 8.536* 2.779ns
1.506ns
3.013ns
2.611ns
6.688* 6.514* - S1, N2 7.278* 1.183
ns 2.678
ns 1.018
ns 0.438
ns 4.771* 8.139* -
S2, N1 4.709* 2.223* 1.519ns
0.991ns
2.199ns
4.671* 1.438ns
- S2, N2 3.877* 1.134
ns 2.382
ns 0.746
ns 0.306
ns 2.773* 4.029* -
N1, N2 0.019ns
1.139ns
2.618ns
1.006ns
3.261ns
1.393ns
2.425* - Year 2003, 2004 1.016
ns - 0.731
ns - 0.939
ns 1.477
ns 1.060
ns -
2003, 2005 1759ns
- 0.599ns
- 2.003* 0.668ns
2.429ns
- 2003, 2006 2.215* - 0.792
ns - 0.979
ns 0.842
ns 1.636* -
2003, 2007 1.627ns
- 0.683ns
- 1.071ns
0.479ns
2.924* - 2003, 2008 0.699
ns - 0.914
ns - 1.237
ns 0.939
ns 1.063
ns -
2003, 2009 0.798ns
- 0.523ns
- 0.509ns
1.217ns
1.623ns
- 2003, 2010 1.408
ns - 1.785
ns - 1.359
ns 0.574
ns 1.980
ns -
2003, 2011 2.336* - 1.124ns
- 1.462ns
0.764ns
0.872* - 2003, 2012 2.577* - 0.767
ns - 0.635
ns 1.452
ns 0.964* -
2003, 2013 1.794* - 2.349* - 0.515ns
3.078* 1.226ns
- 2004, 2005 1.457
ns - 0.370
ns - 1.300
ns 0.962
ns 1.793
ns -
2004, 2006 1.358ns
- 0.683ns
- 1.498ns
0.834ns
1.977ns
- 2004, 2007 1.122
ns - 0.608
ns - 0.522
ns 1.386
ns 2.542* -
2004, 2008 0.816ns
- 1.089ns
- 0.762ns
0.870ns
0.528ns
- 2004, 2009 1.449
ns - 0.709
ns - 0.337
ns 1.596
ns 0.959
ns -
2004, 2010 0.875ns
- 2.012* - 1.586ns
1.148ns
1.542ns
- 2004, 2011 1.771* - 1.261
ns - 2.045
ns 1.010
ns 0.518* -

APPENDIX II
76
Table 1 (continued).
Factor Levels Total Biomass Biomass G1 Biomass G2 Biomass G3 Biomass G4 Biomass G5 Biomass G6 Biomass G7
Year 2004, 2012 1.711ns
- 1.076ns
- 0.343ns
0.939ns
0.133ns
- 2004, 2013 0.921
ns - 2.301* - 1.121
ns 1.433
ns 0.342
ns -
2005, 2006 1.557ns
- 0.724ns
- 2.475* 0.379ns
0.753ns
- 2005, 2007 0.535
ns - 0.568
ns - 0.922
ns 0.789
ns 0.963
ns -
2005, 2008 0.715ns
- 0.882ns
- 0.616ns
0.797ns
0.892ns
- 2005, 2009 2.271* - 0.441
ns - 1.241
ns 1.401
ns 2.601* -
2005, 2010 0.922ns
- 1.609ns
- 1.845* 0.651ns
0.128ns
- 2005, 2011 1.005
ns - 0.904
ns - 3.165* 1.468
ns 2.125
ns -
2005, 2012 1.864* - 0.803ns
- 1.515ns
0.993ns
1.685ns
- 2005, 2013 1.513
ns - 1.923* - 2.257* 2.644* 1.371
ns -
2006, 2007 0.919ns
- 0.481ns
- 1.698ns
1.039ns
1.551ns
- 2006, 2008 1.463
ns - 0.906
ns - 1.447
ns 0.989
ns 0.417
ns -
2006, 2009 2.787* - 0.812ns
- 0.901ns
1.574ns
1.784* - 2006, 2010 0.756
ns - 2.085* - 0.852
ns 0.903
ns 0.706
ns -
2006, 2011 1.068ns
- 1.415ns
- 0.434ns
0.289ns
1.306ns
- 2006, 2012 0.467
ns - 0.957
ns - 1.288
ns 0.578
ns 0.931
ns -
2006, 2013 0.620ns
- 2.491* - 0.984ns
2.235* 0.623ns
- 2007, 2008 0.756
ns - 0.741
ns - 0.642
ns 0.601
ns 1.566
ns -
2007, 2009 2.194* - 0.498ns
- 0.651ns
0.759ns
3.473* - 2007, 2010 0.438
ns - 1.647
ns - 1.629
ns 0.269
ns 0.676
ns -
2007, 2011 0.711ns
- 1.050ns
- 2.287* 1.010ns
2.837ns
- 2007, 2012 1.1725
ns - 0.653
ns - 0.608
ns 1.654
ns 0.710
ns -
2007, 2013 0.911ns
- 2.066* - 1.380ns
2.914* 1.414ns
- 2008, 2009 1.082
ns - 0.682
ns - 0.882
ns 0.624
ns 1.451
ns -
2008, 2010 0.882ns
- 0.953ns
- 1.341ns
0.450ns
0.502ns
- 2008, 2011 1.421
ns - 0.762
ns - 1.87
ns 1.048
ns 1.157
ns -
2008, 2012 1.779* - 0.475ns
- 0.893ns
1.438ns
1.291ns
- 2008, 2013 1.254
ns - 1.341
ns - 1.601
ns 2.050
ns 0.539
ns -
2009, 2010 2.033* - 1.206ns
- 1.154ns
0.813ns
1.620ns
- 2009, 2011 2.931* - 0.615
ns - 1.301
ns 1.529
ns 3.103* -
2009, 2012 3.195* - 0.397ns
- 0.193ns
2.182* 3.316* - 2009, 2013 2.338* - 1.689
ns - 0.631
ns 2.981* 2.249* -
2010, 2011 0.980ns
- 0.649ns
- 0.924ns
0.948ns
1.266ns
- 2010, 2012 1.002
ns - 1.032
ns - 1.449
ns 1.459
ns 1.614
ns -
2010, 2013 0.615ns
- 1.079ns
- 1.462ns
2.579* 1.005ns
-

APPENDIX II
77
Table 1 (continued).
Factor Levels Total Biomass Biomass G1 Biomass G2 Biomass G3 Biomass G4 Biomass G5 Biomass G6 Biomass G7
Year 2011, 2012 1.157ns
- 0.641ns
- 1.826ns
0.761ns
0.618ns
- 2011, 2013 1.351
ns - 1.116
ns - 1.368
ns 2.413* 1.014
ns -
2012, 2013 0.825ns
- 1.669ns
- 0.844ns
2.103* 0.974ns
-
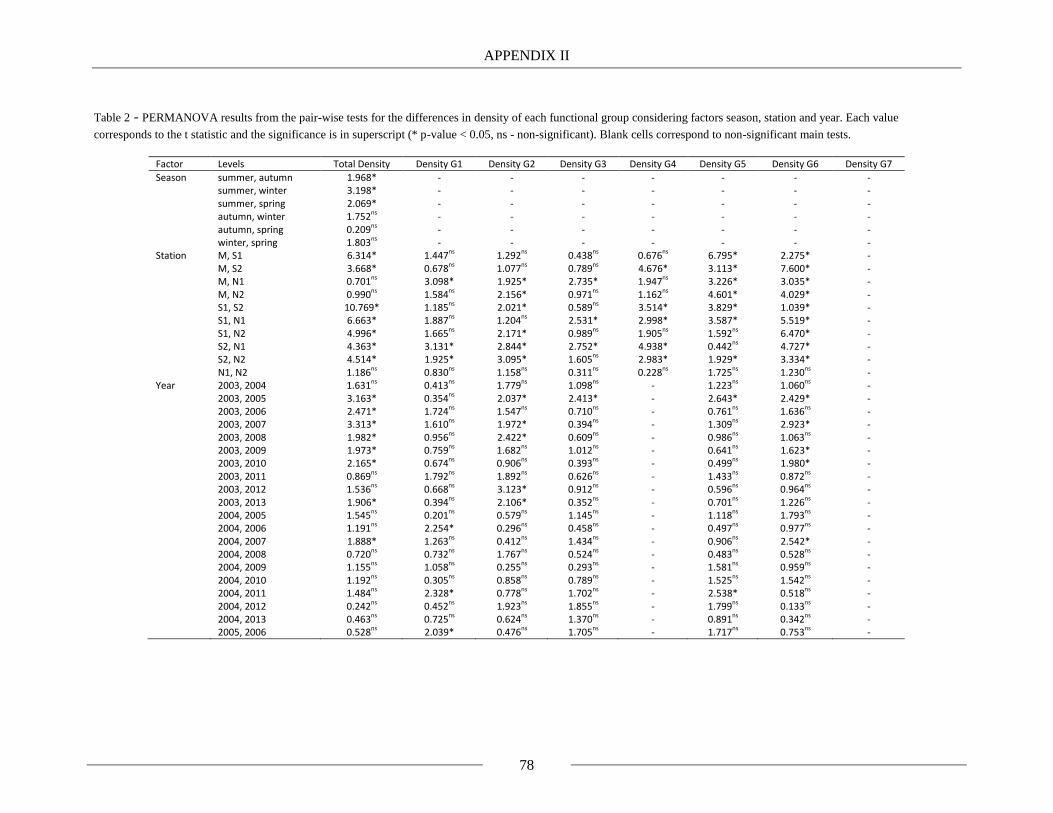
APPENDIX II
78
Table 2 - PERMANOVA results from the pair-wise tests for the differences in density of each functional group considering factors season, station and year. Each value
corresponds to the t statistic and the significance is in superscript (* p-value < 0.05, ns - non-significant). Blank cells correspond to non-significant main tests.
Factor Levels Total Density Density G1 Density G2 Density G3 Density G4 Density G5 Density G6 Density G7
Season summer, autumn 1.968* - - - - - - - summer, winter 3.198* - - - - - - - summer, spring 2.069* - - - - - - - autumn, winter 1.752ns - - - - - - - autumn, spring 0.209ns - - - - - - - winter, spring 1.803ns - - - - - - - Station M, S1 6.314* 1.447ns 1.292ns 0.438ns 0.676ns 6.795* 2.275* - M, S2 3.668* 0.678ns 1.077ns 0.789ns 4.676* 3.113* 7.600* - M, N1 0.701ns 3.098* 1.925* 2.735* 1.947ns 3.226* 3.035* - M, N2 0.990ns 1.584ns 2.156* 0.971ns 1.162ns 4.601* 4.029* - S1, S2 10.769* 1.185ns 2.021* 0.589ns 3.514* 3.829* 1.039* - S1, N1 6.663* 1.887ns 1.204ns 2.531* 2.998* 3.587* 5.519* - S1, N2 4.996* 1.665ns 2.171* 0.989ns 1.905ns 1.592ns 6.470* - S2, N1 4.363* 3.131* 2.844* 2.752* 4.938* 0.442ns 4.727* - S2, N2 4.514* 1.925* 3.095* 1.605ns 2.983* 1.929* 3.334* - N1, N2 1.186ns 0.830ns 1.158ns 0.311ns 0.228ns 1.725ns 1.230ns - Year 2003, 2004 1.631ns 0.413ns 1.779ns 1.098ns - 1.223ns 1.060ns - 2003, 2005 3.163* 0.354ns 2.037* 2.413* - 2.643* 2.429* - 2003, 2006 2.471* 1.724ns 1.547ns 0.710ns - 0.761ns 1.636ns - 2003, 2007 3.313* 1.610ns 1.972* 0.394ns - 1.309ns 2.923* - 2003, 2008 1.982* 0.956ns 2.422* 0.609ns - 0.986ns 1.063ns - 2003, 2009 1.973* 0.759ns 1.682ns 1.012ns - 0.641ns 1.623* - 2003, 2010 2.165* 0.674ns 0.906ns 0.393ns - 0.499ns 1.980* - 2003, 2011 0.869ns 1.792ns 1.892ns 0.626ns - 1.433ns 0.872ns - 2003, 2012 1.536ns 0.668ns 3.123* 0.912ns - 0.596ns 0.964ns - 2003, 2013 1.906* 0.394ns 2.106* 0.352ns - 0.701ns 1.226ns - 2004, 2005 1.545ns 0.201ns 0.579ns 1.145ns - 1.118ns 1.793ns - 2004, 2006 1.191ns 2.254* 0.296ns 0.458ns - 0.497ns 0.977ns - 2004, 2007 1.888* 1.263ns 0.412ns 1.434ns - 0.906ns 2.542* - 2004, 2008 0.720ns 0.732ns 1.767ns 0.524ns - 0.483ns 0.528ns - 2004, 2009 1.155ns 1.058ns 0.255ns 0.293ns - 1.581ns 0.959ns - 2004, 2010 1.192ns 0.305ns 0.858ns 0.789ns - 1.525ns 1.542ns - 2004, 2011 1.484ns 2.328* 0.778ns 1.702ns - 2.538* 0.518ns - 2004, 2012 0.242ns 0.452ns 1.923ns 1.855ns - 1.799ns 0.133ns - 2004, 2013 0.463ns 0.725ns 0.624ns 1.370ns - 0.891ns 0.342ns - 2005, 2006 0.528ns 2.039* 0.476ns 1.705ns - 1.717ns 0.753ns -

APPENDIX II
79
Table 2 (continued)
Factor Levels Total Density Density G1 Density G2 Density G3 Density G4 Density G5 Density G6 Density G7
Year 2005, 2007 0.602ns
1.352ns
0.494ns
2.765* - 1.797ns
0.963ns
- 2005, 2008 0.649
ns 0.756
ns 1.209
ns 1.667
ns - 1.265
ns 0.892
ns -
2005, 2009 2.569* 1.074ns
0.323ns
1.111ns
- 3.046* 2.601* - 2005, 2010 0.740
ns 0.475
ns 1.215
ns 1.972
ns - 2.914* 0.128
ns -
2005, 2011 3.105* 2.278* 0.329ns
3.119* - 4.294* 2.125* - 2005, 2012 1.379
ns 0.435
ns 1.269
ns 3.200* - 3.373* 1.685
ns -
2005, 2013 1.437ns
0.680ns
0.175ns
2.691* - 2.186* 1.371ns
- 2006, 2007 0.981
ns 3.622* 0.562
ns 1.089
ns - 0.763
ns 1.551
ns -
2006, 2008 0.694ns
2.433* 1.573ns
0.116ns
- 0.420ns
0.417ns
- 2006, 2009 2.281* 2.505* 0.232
ns 0.537
ns - 1.068
ns 1.783
ns -
2006, 2010 0.273ns
2.931* 0.780ns
0.388ns
- 1.145ns
0.707ns
- 2006, 2011 2.546* 0.825
ns 0.638
ns 1.349
ns - 2.146* 1.306
ns -
2006, 2012 0.987ns
2.100* 1.716ns
1.559ns
- 1.288ns
0.931ns
- 2006, 2013 1.245
ns 1.377
ns 0.572
ns 0.994
ns - 0.409
ns 0.623
ns -
2007, 2008 0.974ns
0.371ns
1.721ns
0.991ns
- 0.305ns
1.566ns
- 2007, 2009 2.921* 2.733* 0.408
ns 1.283
ns - 1.299
ns 3.473* -
2007, 2010 1.094ns
1.289ns
1.180ns
0.776ns
- 1.727ns
0.676ns
- 2007, 2011 3.405* 4.049* 0.721
ns 0.234
ns - 2.815* 2.837* -
2007, 2012 1.739ns
0.767ns
1.645ns
0.559ns
- 1.691ns
2.411* - 2007, 2013 1.774
ns 1.831
ns 0.500
ns 0.343
ns - 0.684
ns 2.141* -
2008, 2009 1.449ns
1.799ns
1.457ns
0.584ns
- 1.127ns
1.288* - 2008, 2010 0.857
ns 0.813
ns 2.117* 0.278
ns - 1.339
ns 0.846
ns -
2008, 2011 1.941ns
2.726* 1.035ns
1.261ns
- 2.209* 0.894ns
- 2008, 2012 0.715
ns 0.314
ns 0.502
ns 1.536
ns - 1.398
ns 0.467
ns -
2008, 2013 0.559ns
1.145ns
1.192ns
0.898ns
- 0.498ns
0.359ns
- 2009, 2010 2.285* 1.328
ns 0.887
ns 0.779
ns - 0.919
ns 2.338* -
2009, 2011 1.382ns
1.897ns
0.500ns
1.516ns
- 1.812ns
0.816ns
- 2009, 2012 1.348
ns 1.413
ns 1.553
ns 1.625
ns - 0.464
ns 0.997
ns -
2009, 2013 1.001ns
0.495ns
0.362ns
1.252ns
- 0.764ns
1.125ns
- 2010, 2011 2.365* 2.801* 1.198
ns 1.029
ns - 0.812
ns 1.846* -
2010, 2012 0.971ns
0.585ns
2.414* 1.352ns
- 0.620ns
1.461ns
- 2010, 2013 1.321
ns 0.973
ns 1.259
ns 0.639
ns - 1.159
ns 1.221
ns -
2011, 2012 1.515ns
2.386* 1.026ns
0.399ns
- 1.373ns
0.547ns
- 2011, 2013 1.629
ns 1.104
ns 0.296
ns 0.474
ns - 2.219* 0.726
ns -
2012, 2013 0.611ns
0.888ns
1.251ns
0.377ns
- 1.091ns
0.360ns
-

APPENDIX II
80
Table 3 – PERMANOVA results from the pair-wise tests for the differences in number of species (Num. Sp.) of each functional group considering factors season, station and year.
Each value corresponds to the t statistic and the significance is in superscript (* p-value < 0.05, ns - non-significant). Blank cells correspond to non-significant main tests.
Factor Levels Total Num. Sp. Num. Sp. G1 Num. Sp. G2 Num. Sp. G3 Num. Sp. G4 Num. Sp. G5 Num. Sp. G6 Num. Sp. G7
Season summer, autumn - - - 2.863* 0.113ns
0.800ns
- -
summer, winter - - - 3.555* 2.180ns
3.150* - -
summer, spring - - - 1.453ns
1.282ns
0.382ns
- -
autumn, winter - - - 1.111ns
2.042ns
2.663* - -
autumn, spring - - - 1.064ns
1.173ns
1.165ns
- -
winter, spring - - - 1.765ns
3.314* 3.331* - -
Station M, S1 9.436* 2.320* 2.225* 2.135* - 8.799* 6.506* -
M, S2 4.867* 3.294* 4.003* 2.403* - 5.860* 1.894ns
-
M, N1 3.743* 1.630ns
1.241ns
3.342* - 4.312* 2.826* -
M, N2 8.322* 0.618ns
2.346* 1.094ns
- 11.346* 3.961* -
S1, S2 6.904* 1.220ns
2.234* 0.942ns
- 2.738* 10.223* -
S1, N1 6.806* 1.199ns
1.114ns
1.260ns
- 4.907* 10.057* -
S1, N2 1.499ns
0.223ns
1.300ns
0.629ns
- 1.707ns
10.72* -
S2, N1 0.951ns
2.379* 2.962* 0.038ns
- 1.908ns
1.327ns
-
S2, N2 5.422* - - 0.521ns
- 4.623* 2.741* -
N1, N2 5.509* 0.439ns
1.732ns
0.420ns
- 7.301* 1.361ns
-
Year 2003, 2004 - 1.022ns
- - - 1.293ns
0.697ns
-
2003, 2005 - 1.776ns
- - - 1.384ns
2.149* -
2003, 2006 - 0.228ns
- - - 0.652ns
2.493* -
2003, 2007 - 0.369ns
- - - 1.977ns
2.601* -
2003, 2008 - 1ns
- - - 1.283ns
1.126ns
-
2003, 2009 - 2.837* - - - 0.237ns
0.297ns
-
2003, 2010 - 1.030ns
- - - 0.734ns
1.531ns
-
2003, 2011 - 3.159* - - - 1.382ns
0.797ns
-
2003, 2012 - 1.517ns
- - - 0.576ns
2.301* -
2003, 2013 - 1.902ns
- - - 0.467ns
0.753ns
-
2004, 2005 - 2.569* - - - 0.103ns
1.516ns
-
2004, 2006 - 0.824ns
- - - 0.612ns
1.976ns
-
2004, 2007 - 0.409ns
- - - 0.446ns
2.116* -
2004, 2008 - 1.545ns
- - - 0.022ns
0.653ns
-
2004, 2009 - 3.417* - - - 1.125ns
1.119ns
-
2004, 2010 - 1.756ns
- - - 0.539ns
1.058ns
-
2004, 2011 - 3.810* - - - 2.553* 0.160ns
-
2004, 2012 - 2.127ns
- - - 1.867ns
1.794ns
-
APPENDIX II
81
Table 3 (continued)
Factor Levels Total Num. Sp. Num. Sp. G1 Num. Sp. G2 Num. Sp. G3 Num. Sp. G4 Num. Sp. G5 Num. Sp. G6 Num. Sp. G7
Year 2004, 2013 - 2.278ns
- - - 1.846ns
0.051ns
- 2005, 2006 - 0.875
ns - - - 0.609
ns 0.591
ns -
2005, 2007 - 1.637ns
- - - 0.621ns
0.703ns
- 2005, 2008 - 0.292
ns - - - 0.116
ns 0.474
ns -
2005, 2009 - 0.823ns
- - - 1.181ns
2.74* - 2005, 2010 - 0.543
ns - - - 0.517
ns 0.975
ns -
2005, 2011 - 0.915ns
- - - 2.842* 1.243ns
- 2005, 2012 - 0.034
ns - - - 2.039* 0.433
ns -
2005, 2013 - 0.554ns
- - - 1.989ns
1.474ns
- 2006, 2007 - 0.385
ns - - - 1.116
ns 0.109
ns -
2006, 2008 - 0.447ns
- - - 0.575ns
0.894ns
- 2006, 2009 - 1.525
ns - - - 0.457
ns 3.187* -
2006, 2010 - 0.435ns
- - - 0.062ns
0.543ns
- 2006, 2011 - 1.706
ns - - - 1.930
ns 1.698
ns -
2006, 2012 - 0.739ns
- - - 1.207ns
0.133ns
- 2006, 2013 - 1
ns - - - 1.136
ns 1.988
ns -
2007, 2008 - 0.892ns
- - - 0.452ns
1.024ns
- 2007, 2009 - 2.137
ns - - - 1.849
ns 3.409* -
2007, 2010 - 1ns
- - - 1.134ns
0.641ns
- 2007, 2011 - 2.383* - - - 3.411* 1.847
ns -
2007, 2012 - 1.283ns
- - - 2.684* 0.247ns
- 2007, 2013 - 1.421
ns - - - 2.844* 2.189* -
2008, 2009 - 1.525ns
- - - 1.168ns
1.557ns
- 2008, 2010 - 0.154
ns - - - 0.594
ns 0.295
ns -
2008, 2011 - 1.705ns
- - - 2.504* 0.493ns
- 2008, 2012 - 0.289
ns - - - 1.879
ns 0.776
ns -
2008, 2013 - 1ns
- - - 2.037ns
0.646ns
- 2009, 2010 - 1.722
ns - - - 0.551
ns 2.008
ns -
2009, 2011 - - - - - 1.682ns
1.224ns
- 2009, 2012 - 1.215
ns - - - 0.853
ns 2.989* -
2009, 2013 - - - - - 0.770ns
1.218ns
- 2010, 2011 - 1.921
ns - - - 2.035
ns 0.863
ns -
2010, 2012 - 0.505ns
- - - 1.318ns
0.423ns
- 2010, 2013 - 1.145
ns - - - 1.317
ns 1.045
ns -
2011, 2012 - 1.356ns
- - - 0.868ns
1.538ns
- 2011, 2013 - - - - - 1.102
ns 0.118
ns -
2012, 2013 - 0.806ns
- - - 0.168ns
1.820ns
-


APPENDIX III
83
Appendix III - Significant environmental variables and factors in GLM - visualization of regression plots (Stations: 2-M; 5-S1; 9-S2; 12-N1; 19-
N2)
Biomass
Mobility
Figure 1 – Response of high mobility to factors station (a) and year (b)
Figure 2 – Response of medium mobility to factors season (a), station (b) and year (c) and to variable oxygen (d)
Figure 3 – Response of sedentary mobility to factors station (a) and year (b)
Figure 4 – Response of territorial mobility to factors station (a) and year (b) and to variables salinity (c), temperature (d) and precipitation (e)
a)
))
=)
b)
))
=)
a)
))
=)
b)
))
=)
c)
=)
d)
))
=)
a)
))
=)
b)
))
=)
a)
))
=)
b)
))
=)
c)
=)
d)
))
=)
e)
))
=)

APPENDIX III
84
Body size
Figure 5 – Response of large body size to variable oxygen (a) and to factors station (b) and year (c)
Figure 6 – Response of medium body size to factors station (a) and year (b)
Figure 7 – Response of small body size to factors season (a) and station (b) and to variable salinity (c)
Figure 8– Response of very small body size to factors station (a) and year (b) and to variable salinity (c)
a)
))
=)
b)
))
=)
c)
=)
a)
))
=)
b)
))
=)
a)
))
=)
b)
))
=)
c)
=)
a)
))
=)
b)
))
=)
c)
=)

APPENDIX III
85
Diet
Figure 9 – Response of planktivorous to temperature (GLM with factors) (a), to factors station (b) and year (c) and to variable temperature (GLM without factors) (d)
Figure 10 – Response of invertebrate feeders to variable temperature (a) and to factors station (b) and year (c)
Figure 11 – Response of omnivorous to variable oxygen (a), to factors station (b) and year (c) and to variable NAO index (d)
Figure 12 – Response of macrocarnivorous to factors station (a) and year (b) and to variable salinity (c)
Figure 13 – Response of detritivorous to factors station (a) and year (b) and to variable salinity (c)
a)
))
=)
a)
))
=)
a)
))
=)
a)
))
=)
b)
))
=)
b)
))
=)
b)
))
=)
b)
))
=)
b)
=) a)
))
=)
c)
=)
c)
=)
c)
=)
c)
=)
c)
=)
d)
=)
d)
=)

APPENDIX III
86
Feeding mode
Figure 14 – Response of browsers to variable temperature (a) and to factors station (b) and year (c)
Figure 15– Response of filterers to factors station (a) and year (b)
Figure 16 – Response of hunters to factors station (a) and year (b) and to variable salinity (c)
a)
))
=)
a)
))
=)
a)
))
=)
b)
))
=)
b)
))
=)
b)
))
=)
c)
=)
c)
=)

APPENDIX III
87
Salinity preference
Figure 17– Response of marine species to variable oxygen (a) and to factors station (b) and year (c)
Figure 18– Response of brackish species to factors station (a) and year (b)
Figure 19 – Response of freshwater species to variable oxygen (a), to factors station (b) and year (c) and to variable salinity (d)
b)
))
=)
b)
))
=)
b)
))
=)
a)
))
=)
a)
))
=)
a)
))
=)
c)
=)
c)
=)
d)
=)

APPENDIX III
88
Density
Mobility
Figure 20 – Response of high mobility to variable oxygen (GLM with factors) (a), to factors station (b) and year (c) and to variables temperature (d) and oxygen (GLM without
factors) (e)
Figure 21– Response of medium mobility to variable oxygen (a), to factors station (b) and year (c) and to variable salinity (d)
Figure 22 – Response of sedentary mobility to factors season (a), station (b) and year (c) and to variables salinity (d) and temperature (e)
a)
))
)=
)
b)
))
=) c)
=)
d)
=) e)
=)
a)
))
)=
)
a)
))
)=
)
b)
))
=)
b)
))
=)
c)
=)
c)
=)
d)
=)
d)
=)
e)
=)

APPENDIX III
89
Body size
Figure 23 – Response of large body size to variable oxygen (GLM with factors) (a), to factors station (b) and year (c) and to variable temperature (d)
Figure 24– Response of large body size to variable oxygen (GLM without factors) (a) and precipitation (b)
Figure 25 – Response of medium body size to variable temperature (a), to factors station (b) and year (c) and to variable salinity (d)
Figure 26 – Response of medium body size to variable temperature (GLM without factors)
Figure 27 – Response of small body size to factors station (a) and year (b) and to variables salinity (d) and oxygen (d)
a)
))
)=
)
a)
))
)=
)
a)
))
)=
)
b)
))
=)
b)
))
=)
b)
))
=)
c)
=)
c)
=)
d)
=)
d)
=)
a)
))
)=
)
b)
))
=)
c)
=)
d)
=)

APPENDIX III
90
Figure 28 – Response of very small body size to factor season (a), station (b) and year (c) and to variable salinity (d)
Figure 29 – Response of very small body size to variable temperature
a)
))
)=
)
b)
))
=)
c)
=)
d)
=)

APPENDIX III
91
Diet
Figure 30 – Response of planktivorous to variable temperature (GLM with factors) (a), to factors station (b) and to variable temperature (GLM without factors) (c)
Figure 31 – Response of invertebrate feeders to oxygen (GLM with factors) (a), to factors station (b) and year (c) and to variables oxygen (GLM without factors) (d) and
temperature (e)
Figure 32 – Response of omnivorous to variable temperature (GLM with factors) (a), to factors station (b) and year (c) and to variables salinity (d) and temperature (GLM without
factors) (e)
Figures 33 – Response of macrocarnivorous to variable oxygen (a), to factor station (b) and to variable salinity (c)
Figure 34 – Response of detritivorous to variable temperature (a), to factor station (b) and to variable runoff (c)
a)
))
)=
)
a)
))
)=
)
a)
))
)=
)
a)
))
)=
)
a)
))
)=
)
b)
))
=)
b)
))
=)
b)
))
=)
b)
))
=)
b)
))
=)
c)
=)
c)
=)
c)
=)
c)
=)
c)
=)
d)
=)
d)
=)
e)
=)
e)
=)

APPENDIX III
92
Feeding mode
Figure 35 – Response of browsers to factors station (a) and year (b) and to variables temperature (c) and oxygen (d)
Figure 36 – Response of filterers to variable oxygen
Figure 37 – Response of hunters to variables temperature (a) and oxygen (b) and to factors season (c) and station (d)
Figure 38 – Response of hunters to factor year (a) and to variable salinity (b)
a)
))
)=
)
a)
))
)=
)
a)
))
)=
)
b)
))
=)
b)
))
=)
b)
))
=)
c)
=)
c)
=)
d)
=)
d)
=)

APPENDIX III
93
Salinity preference
Figure 39– Response of marine species to variable oxygen (GLM with factors) (a), to factors station (b) and year (c) and to variables temperature (d) and oxygen (GLM without
factors) (e)
Figure 40 – Response of brackish species to variable oxygen (GLM with factors) (a), to factors station (b) and year (c) and to variables temperature (d) and oxygen (GLM without
factors) (e)
Figure 41 – Response of freshwater species to factors season (a) station (b) and year (c) and to variable salinity (d)
Figures 42 – Response of freshwater species to variables temperature (a) and oxygen (b)
a)
))
)=
)
b)
))
=) c)
=)
d)
=)
e)
=)
a)
)))
=)
a)
))
)=
)
a)
))
)=
)
b)
))
=)
b)
))
=)
b)
))
=)
c)
=)
c)
=)
d)
=)
d)
=)
e)
=)

APPENDIX III
94
Number of species
Mobility
Figures 43 – Response of high mobility to variable oxygen (a) and to factors station (b) and year (c)
Figure 44 – Response of medium mobility to factors season (a), station (b) and year (c) and to variables salinity (d) and NAO index (e)
Figure 45 – Response of sedentary mobility to variable temperature (GLM with factors) (a), to factors season (b), station (c) and year (d) and to variable salinity (e)
Figure 46 – Response of sedentary mobility to variable temperature (GLM without factors)
Figure 47 – Response of territorial mobility to factors season (a), station (b) and year (c) and to variables salinity (d) and oxygen (e)
a)
))
)=
)
b)
))
=)
c)
=)
a)
))
)=
)
a)
))
)=
)
a)
))
)=
)
b)
))
=)
b)
))
=)
b)
))
=)
c)
=)
c)
=)
c)
=)
d)
=)
d)
=)
d)
=)
e)
=)
e)
=)
e)
=)

APPENDIX III
95
Figure 48 – Response of territorial mobility to variable precipitation

APPENDIX III
96
Body size
Figure 49 – Response of large body size to oxygen (GLM with factors) (a), to factors station (b) and year (c) and to variables temperature (d) and oxygen (GLM without factors) (e)
Figure 50 – Response of medium body size to factors station (a) and year (b)
Figure 51 – Response of small body size to variable oxygen (a), to factors station (b) and year (c) and to variable salinity (d)
Figure 52 – Response of very small body size to factors station (a) and year (b) and to variable salinity (c)
d)
=)
c)
=) b)
=)
a)
=)
e)
=)
a)
=)
a)
=)
a)
=)
b)
=)
b)
=)
b)
=)
c)
=)
c)
=)
d)
=)

APPENDIX III
97
Diet
Figure 53 – Response of planktivorous to temperature (GLM with factors) (a), to factors season (b), station (c) and year (d) and to variable temperature (GLM without factors)€
Figure 54– Response of invertebrate feeders to variable oxygen (a), to factors station (b) and year (c) and to variable salinity (d)
Figure 55 – Response of omnivorous to variable oxygen (a), to factors station (b) and year (c) and to variables salinity (d) and temperature €
Figure 56– Response of macrocarnivorous to factors station (a) and year (b) and to variable salinity (c)
Figure 57 – Response of detritivorous to factor station (a) and to variable salinity (b)
a)
=)
a)
=)
a)
=)
a)
=)
a)
=)
b)
=)
b)
=)
b)
=)
b)
=)
b)
=)
c)
=)
c)
=)
c)
=)
c)
=)
d)
=)
d)
=)
d)
=)
e)
=)
e)
=)

APPENDIX III
98
Feeding mode
Figure 58 – Response of browsers to variable temperature (GLM with factors) (a) and oxygen (b), to factors station (c) and year (d) and to variable temperature (GLM without factors) (e)
Figure 59 – Response of filterers to factor year
Figure 60 – Response of hunters to variable oxygen (a), to factors season (b), station (c) and year (d) and to variable salinity (e)
a)
=)
a)
=)
b)
=)
b)
=)
c)
=)
c)
=)
d)
=)
d)
=)
e)
=)
e)
=)

APPENDIX III
99
Salinity preference
Figure 61 – Response of marine species to variable oxygen (a), to factors station (b) and year (c) and to variable salinity (d)
Figure 62 – Response of brackish species to variable oxygen (a) and to factors season (b), station (c) and year (d)
Figure 63 – Response of freshwater species to variable oxygen (GLM with factors) (a) and to factors season (b), station (c) and year (d)
Figure 64 – Response of freshwater species to variables salinity (a), oxygen (GLM without factors) (b) and precipitation (c)
a)
=)
a)
=)
a)
=)
a)
=)
b)
=)
b)
=)
b)
=)
b)
=)
d)
=)
d)
=)
d)
=)
c)
=)
c)
=)
c)
=)
c)
=)
