assumptions and methodology for fuel processing facilities
TRANSCRIPT

Assumptions and Methodology for Fuel Processing Facilities Study
Brian GihmHatch Ltd Pty.
TUESDAY, 6 OCTOBER 2015

Presentation Outline
• Objectives• Nuclear Fuel Cycle• Base Case Scenarios• Process Overview & Base Case Scenarios• Financial Modeling• Inputs to Financial Models
• High Level Assumptions• Facility Sizes• CAPEX and OPEX Calculations• Project Cost Calculations
• Infrastructure Assumptions• Contingency Assessment• Other Assumptions, Exclusions and Challenges

Study Objectives
• Objectives: to investigate the potential business case for establishing uranium conversion, enrichment and fuel fabrication facilities in South Australia
• To estimate direct and indirect capital cost, fixed and variable operational costs for uranium processing facilities
• To estimate lifecycle project cost of the facilities: engineering, construction, procurement, commissioning, operation and decommissioning
• To establish investment justification based on possible service revenues

• Fabricated LWR Fuel Cost: $1500 ~ $2000/kg
• 2014 U3O8 export price: $92.8/kg (Requires 8.7 kg of yellowcake for 1 kg of LWR fuel)
• Question (in net present value):
• Fuel sales cost – yellowcake cost ($807.36) – lifecycle processing facility cost = ?
• Study goal: Estimate the levelized cost for uranium further processing
Simplified Study Overview

Focus Area
Nuclear Fuel Cycle

Base Case Scenarios
• Three Basic Cases• Conversion only
• Conversion and enrichment only
• Conversion, Enrichment and Fuel Fabrication
• 2 Types of Conversion Facilities, 3 Different Configurations
• 1 Enrichment Facility
• 2 Fuel Fabrication Facility Configurations
• There are total of 8 possible scenarios (16 base case scenarios when Brownfield and Greenfield assumptions are included)
• All facilities at single location but within separate fences

Processes Overview
U3O8 UO3
UO3 UO2
UO3 UF6
U3O8 UF6
Gas Centrifuge
UF6 UO2
Fuel Fabrication

Case Conversion Enrichment Fabrication Final Products
1 Wet - - NU UF6, NU UO2
2 Wet Centrifuge - LEU UF6, NU UO2
3 Wet Centrifuge 90/10 LWR Fuel, PHWR Fuel
4 Wet Centrifuge 100 LWR LWR Fuel
5 Dry - - NU UF6
6 Dry Centrifuge - LEU UF6
7 Dry Centrifuge 90/10 LWR Fuel, PHWR Fuel
8 Dry Centrifuge 100 LWR LWR Fuel
8 Base Case Scenarios
LEU = Low Enriched Uranium, NU = Natural Uranium

Financial Modeling

• The inputs to the model will be produced in the study
• Fuel Service Revenue
• Production
• Initial Capital Cost (direct and indirect)
• Operating Costs (variable and fixed, plus sustaining capital)
• Closure Cost
Inputs to Financial Model

• Restrictive market• Insignificant quantities
traded on exchanges
• Majority of fuel sales are under long term contracts
• Potential fuel processing facilities do not impact:• Uranium production
(mining)
• Uranium demand
• Conversion, enrichment and fuel fabrication ‘toll’ will be impacted
Sole factor for global uranium
demand
High Level Assumptions

• Toll Service Model is adapted as the base case scenario• The facility is contractually obligated to process customer-
owned uranium
• Conversion, enrichment and fuel fabrication ‘services’ are sold; weak exposure to yellowcake commodity price changes
• These services contracts are typically charged as a fixed price per kgU or per Separative Work Unit (SWU) adjusted for inflation
• Most nuclear fuel service companies operate facilities under toll service model• Cameco• GE• KEPCO NF
Revenue Assumption

Toll Services for Conversion
• USD $67/lb used for the base case• CIBC World Markets Inc. long-term
yellowcake price forecast, January 2015
• However, it is not a factor impacting the business case in toll service model
• Strong correlation exist between global UF6 price and yellowcake price conversion service price is expected to be stable
0
20
40
60
80
100
120
140
160
U3O
8 S
po
t P
ric
e (
$/l
b)
LT
Forecasts
LT U3O8: 67$/lb
y = 2.6723x + 6.5562R² = 0.9993
0
50
100
150
200
250
300
350
400
0 25 50 75 100 125 150
UF
6 P
rice (
$/k
g U
)
U3O8 Price ($/lb U3O8)

• Positive correlation found between spot SWU price and yellowcake price• Enrichment revenue can be
reasonably obtained
• Uncertainties includes secondary market supply and socio-political factors (Fukushima, Russian HEU, etc.)
• Fuel fabrication price not easily correlated to yellowcake prices• Long term private contracts
• Insignificant quantity traded on exchanges
• Strategic plants mostly linked to domestic nuclear power industry
y = 0.3638x + 104.16R² = 0.8922
0
20
40
60
80
100
120
140
160
180
0 25 50 75 100 125 150
Sp
ot
SW
U
U3O8 price ($/lb U3O8)
Toll Service for Enrichment

• Conversion, enrichment and fuel fabrication facilities modeled to process 10,000 tU/year
• Based on average value of high and low IEA global nuclear power generation capacity projection in 2030 (37% increase from 2014) : 376.2 GW(e) 518.6 GW(e)
• Also based on Australia maintaining the current uranium market share: 7,393 tU/year (2004 to 2014 average) approx. 10,000 tU/year
Facility Sizes for Costing

• 2 mass throughput configurations based on global demand • 90%:10% split for LWR and PHWR fuel processing capacity sizing
• 100% LWR fuel fabrication scenario is examined
• Current Installed Capacity (Approx. 93% LWR and 7% PHWR)• LWR: PWR - 257 GW(e), BWR - 75 GW(e)
• PHWR: 25 GW(e)
• Annual natural uranium demand by LWR and PHWR (94% LWR and 6% PHWR)• LWR: 59,000 tU/year (6,500 tU/year finished product)
• PHWR: 3,500 tU/year (3,500 tU/year finished product)
Facility Configuration

• Conversion facility: 10~13% of the global capacity in 2030
• Enrichment facility (7 million SWU): 8~10% of the global capacity in 2030
• Fuel fabrication facility will add 8~9% LWR fuel capacity and 23% PHWR capacity (90/10 case) to the global market
Model Facility Sizes in Global Context
Current Demand
Current Capacity
90/10 Facility 100 LWR Facility
LWR 6,500 tHM 13,600 tHM 1,073 tHM 1,204 tHM
PHWR 3,000 tHM 4,300 tHM 980 tHM 0

Capital Cost Estimates
• The majority of capital cost will incur during procurement and construction stages
• Based on existing commercial facilities for conversion, enrichment, and fuel fabrication and assembly.
• The most capital and operating cost intensive mechanical equipment are identified and costs are individually estimated.
• Small equipments such as pumps and valves are calculated as percentage values of Direct Costs.
• The capital costs for electrical, I&C and civil/structural components are estimated as percentage value of building and site Direct Costs.

• Major consumables and energy costs are individually calculated or scaled from similar facilities.
• Labour costs, including general maintenance and security, are scaled from similar facilities.
• The majority of labour cost will incur during procurement, construction, commissioning and operation phases.
OPEX Estimates

• Project costs (BOM and labour for engineering, construction, commissioning) are estimated from Hatch’s EPCM experience in similar chemical, mechanical and high tech mechanical plants.
• Nuclear cost and productivity factors are applied whenever required
• Regulatory and licensing costs calculation assumes that the requirements will be similar to the Canadian requirement.• South Australia and Saskatchewan in Canada share many similarities:
yellowcake exporter, absence of fuel processing facilities, low population density, etc.
• Decommissioning cost will be based on projected decommissioning costs of similar facilities.
Project Cost Estimates

• Reference plant costs will be calculated in the currency of the country they are presently located in.
• The costs will be adjusted for South Australian local conditions.
• The World Bank purchasing power parity ratios will be applied whenever direct SA costs cannot be obtained for certain plant components and labour.
• Cost estimates are order of magnitude calculations and they are based on several assumptions made in this study.
Other Cost Estimates
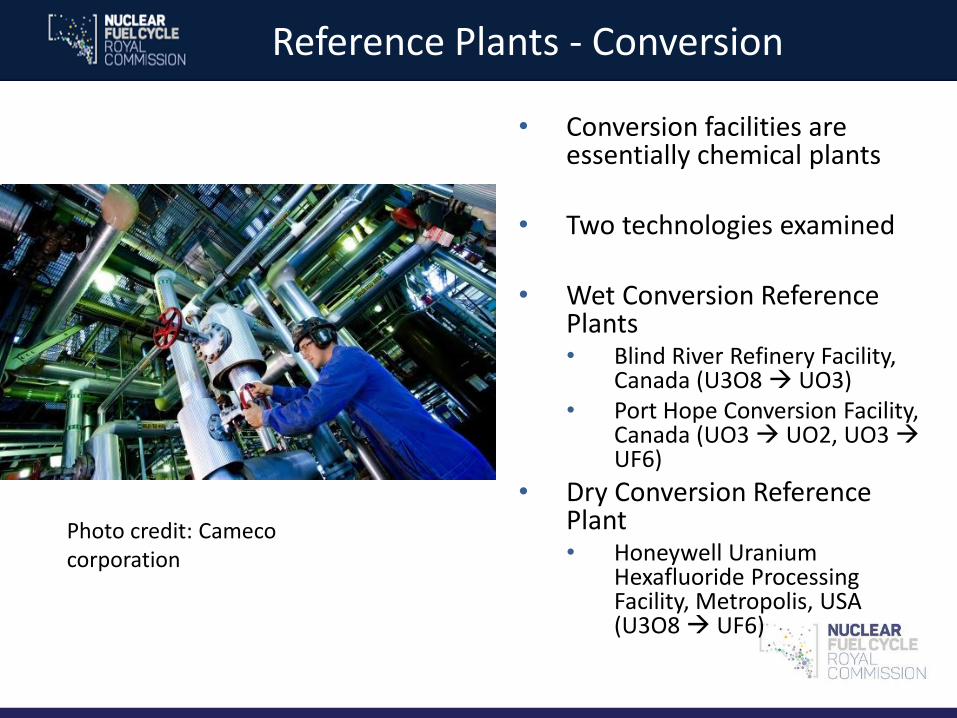
Reference Plants - Conversion
• Conversion facilities are essentially chemical plants
• Two technologies examined
• Wet Conversion Reference Plants• Blind River Refinery Facility,
Canada (U3O8 UO3)• Port Hope Conversion Facility,
Canada (UO3 UO2, UO3 UF6)
• Dry Conversion Reference Plant• Honeywell Uranium
Hexafluoride Processing Facility, Metropolis, USA (U3O8 UF6)
Photo credit: Camecocorporation

• Second generation technology (gas centrifuge) considered• First generation technology
(Gas diffusion process) phased out
• GC plant is essentially a mechanical plant
• Gas Centrifuge Reference Plant• Urenco USA facility, New
Mexico, USA
• Urenco TC-21 centrifuge used as the cost modeling basis
Reference Plants - Enrichment
photo credit: US Department of Energy/Wikimedia Commons

• Conversion, pellet production and assembly examined• UF6 UO2 conversion:
Integrated Dry Route (IDR) process
• Pellet production and fuel assembly for LWR and PHWR fuel• For LWR fuel, AP1000, EPR and GE
BWR assembly considered• For PHWR, CANDU 37 element is
considered
• Reference Plants• Cameco Plant, Canada• Westinghouse Plant, USA• KNF Plant, Republic of Korea
Reference Plants - Fuel Fabrication
Photo credit: KEPCO NF

• Road requirement• Industrial truck access, approximately 40 t per day (based on 10,000tU
per year)• Rail not required
• Power requirement• Approximately 80 MW(e) (10 MW for conversion, 50 MW for enrichment,
20 MW for fuel fabrication)
• Labour requirement• Approx. 2,000 people (500 for conversion, 250 for enrichment, 1200 for
fuel fabrication)
• Water requirement• Approx. 1,550,000 m3/year (900,000 m3 for wet conversion, 250,000 m3
for GC, 400,000 m3 for fuel fabrication facility)
• Site Considerations (Brownfield and Greenfield Estimates)• Access to 275 kV transmission line• Access to nearby port facility• Co-location with other nuclear facilities (NPP, Waste Repository)• Near existing uranium production facility
Site Infrastructure Assumptions

Project Risk Contingency Assessment
• The following methods will be utilized to identify the contingency factors for the facilities
• Identification of project risks affecting CAPEX, OPEX, facility schedule• Risks will be identified and captured in the risk register.
• Examples: construction, licensing/regulatory, availability of skilled labour, infrastructure, technology strategy, contracting strategy (EPC vs. EPCM), etc.
• Cost impact will be quantitatively assessed.
• Impact will be ranged to evaluate the most likely, optimistic and pessimistic scenarios
• Monte Carlo Simulation to determined contingency level for project risks
• Schedule contingency will be qualitatively assessed.

Exclusions
• The study excludes the following considerations:• Cost for regulatory and legal framework setup
• Socio-political factors
• Secondary supply
• Inter government negotiation and treaties
• Cost for marketing and customer relations
• All cost factors that will be incurred outside of the facilities boundary
• Any other classified information
