atd & data presentation
TRANSCRIPT
8/3/2019 AtD & Data Presentation
http://slidepdf.com/reader/full/atd-data-presentation 1/40
Pierce College Leadership Retreat:Achieving the Dream Overview:
August 23, 2011

8/3/2019 AtD & Data Presentation
http://slidepdf.com/reader/full/atd-data-presentation 2/40
What is Achieving the Dream?
Dr. Terri Manning & Dr. John Nixon
8/3/2019 AtD & Data Presentation
http://slidepdf.com/reader/full/atd-data-presentation 3/40
Success is what counts. 3
ATD: A national initiative for student success
ATD defines student success: earning degrees,certificates, or transferring.
ATD focuses on all students but attempts toeliminate gaps for certain cohorts of students wholag.
ATD uses data to study college barriers, ask the―why‖ questions, and develop and implement likelysolutions.
ATD understands that trial and error is necessary in
this process but expects ―ramping up‖ of successful pilots.
8/3/2019 AtD & Data Presentation
http://slidepdf.com/reader/full/atd-data-presentation 4/40
Success is what counts. 4
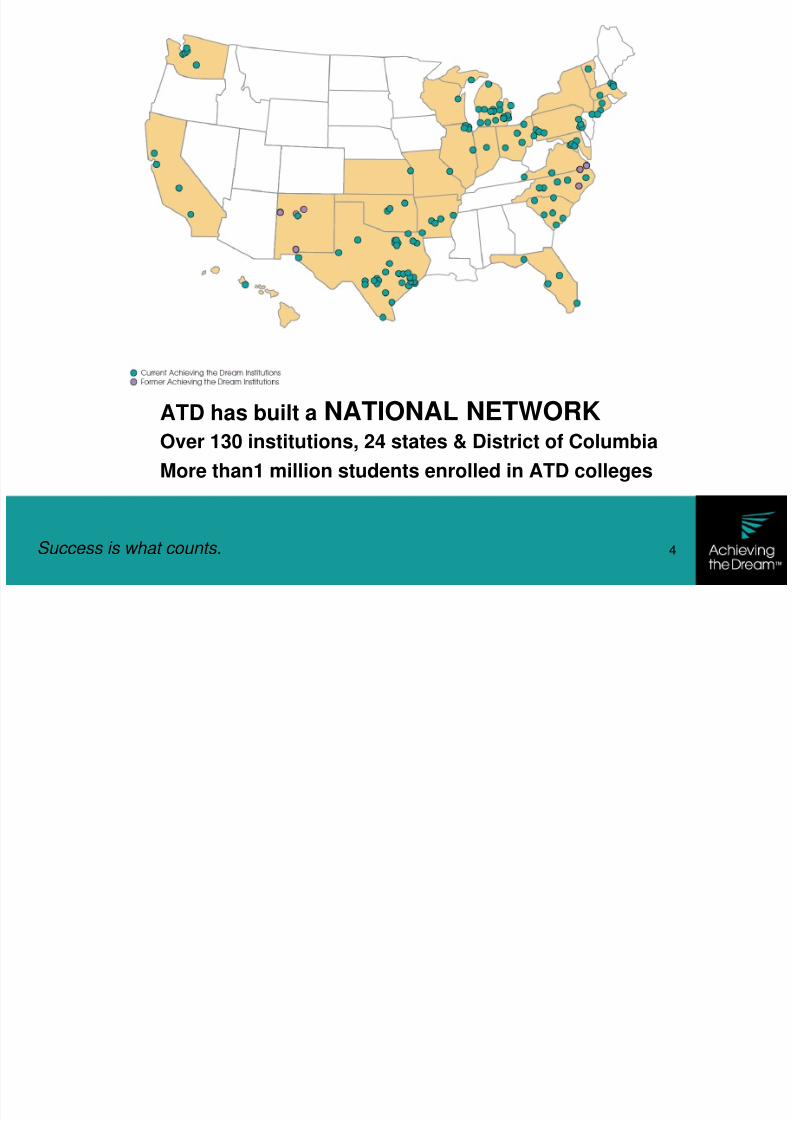
ATD has built a NATIONAL NETWORKOver 130 institutions, 24 states & District of Columbia
More than1 million students enrolled in ATD colleges
8/3/2019 AtD & Data Presentation
http://slidepdf.com/reader/full/atd-data-presentation 5/40
Success is what counts. 5
More students are coming to community collegesregardless of their readiness to learn.
Community colleges are not producing adequatenumbers of graduates or completers.
The national spotlight is on community colleges. The public does not understand our attempts to
―explain away‖ our failures.
The public and funding agencies want to see
results. Increasingly our funding will come from our results.
The Issues

8/3/2019 AtD & Data Presentation
http://slidepdf.com/reader/full/atd-data-presentation 6/40
Success is what counts. 6
Students progressing successfully throughdevelopmental courses
Students advancing from developmental coursesinto and through gateway courses
Students successfully completing college-levelcourses (grade of C or better)
Students re-enrolling from one semester to thenext, and from year to year
Students earning degrees, diplomas andcertificates.
Goals of Achieving the Dream
8/3/2019 AtD & Data Presentation
http://slidepdf.com/reader/full/atd-data-presentation 7/40 Success is what counts. 7
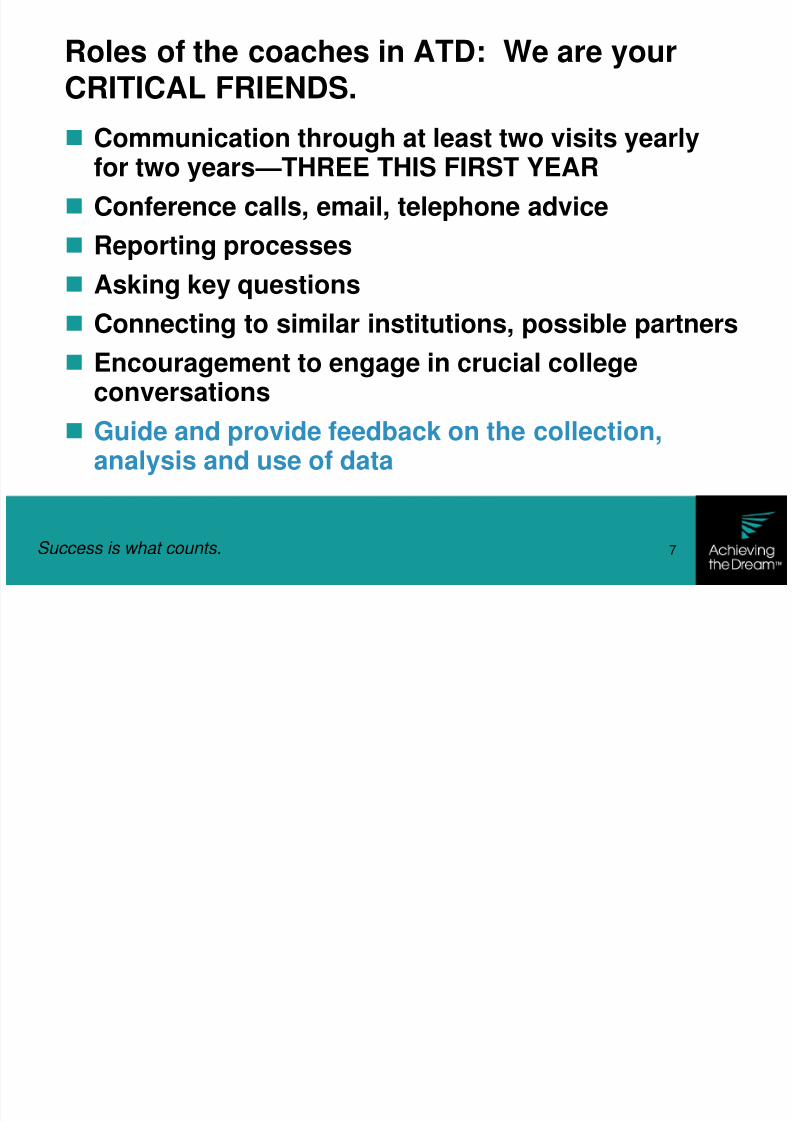
Roles of the coaches in ATD: We are yourCRITICAL FRIENDS.
Communication through at least two visits yearlyfor two years—THREE THIS FIRST YEAR
Conference calls, email, telephone advice
Reporting processes
Asking key questions
Connecting to similar institutions, possible partners
Encouragement to engage in crucial collegeconversations
Guide and provide feedback on the collection,analysis and use of data

8/3/2019 AtD & Data Presentation
http://slidepdf.com/reader/full/atd-data-presentation 8/40
Creating a Culture of Evidence
8/3/2019 AtD & Data Presentation
http://slidepdf.com/reader/full/atd-data-presentation 9/40
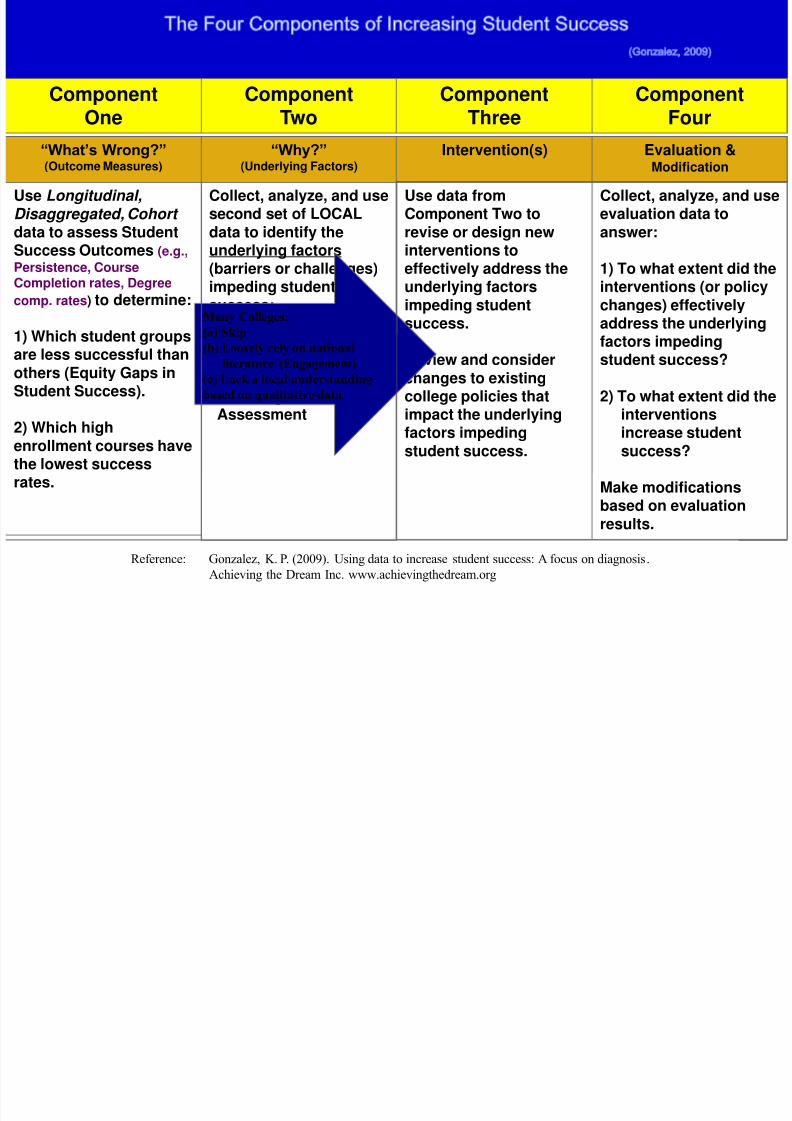
Reference: Gonzalez, K. P. (2009). Using data to increase student success: A focus on diagnosis.
Achieving the Dream Inc. www.achievingthedream.org
ComponentOne
ComponentTwo
ComponentThree
ComponentFour
―What’s Wrong?‖ (Outcome Measures)
―Why?‖ (Underlying Factors)
Intervention(s) Evaluation &Modification
Use Longitudinal,Disaggregated, Cohort data to assess StudentSuccess Outcomes (e.g.,
Persistence, CourseCompletion rates, Degree
comp. rates) to determine:
1) Which student groupsare less successful thanothers (Equity Gaps inStudent Success).
2) Which highenrollment courses havethe lowest successrates.
Collect, analyze, and usesecond set of LOCALdata to identify theunderlying factors
(barriers or challenges)impeding studentsuccess:
• Focus Groups• Surveys• Literature Reviews• Learning Outcome
Assessment
Use data fromComponent Two torevise or design newinterventions to
effectively address theunderlying factorsimpeding studentsuccess.
Review and considerchanges to existingcollege policies that
impact the underlyingfactors impedingstudent success.
Collect, analyze, and useevaluation data toanswer:
1) To what extent did theinterventions (or policychanges) effectivelyaddress the underlyingfactors impedingstudent success?
2) To what extent did the
interventionsincrease studentsuccess?
Make modificationsbased on evaluationresults.
Many Colleges:
(a) Skip
(b) Loosely rely on national
literature (Engagement)
(c) Lack a local understanding
based on qualitative data

8/3/2019 AtD & Data Presentation
http://slidepdf.com/reader/full/atd-data-presentation 10/40
What happens to our students?
8/3/2019 AtD & Data Presentation
http://slidepdf.com/reader/full/atd-data-presentation 11/40
Success is what counts. 11
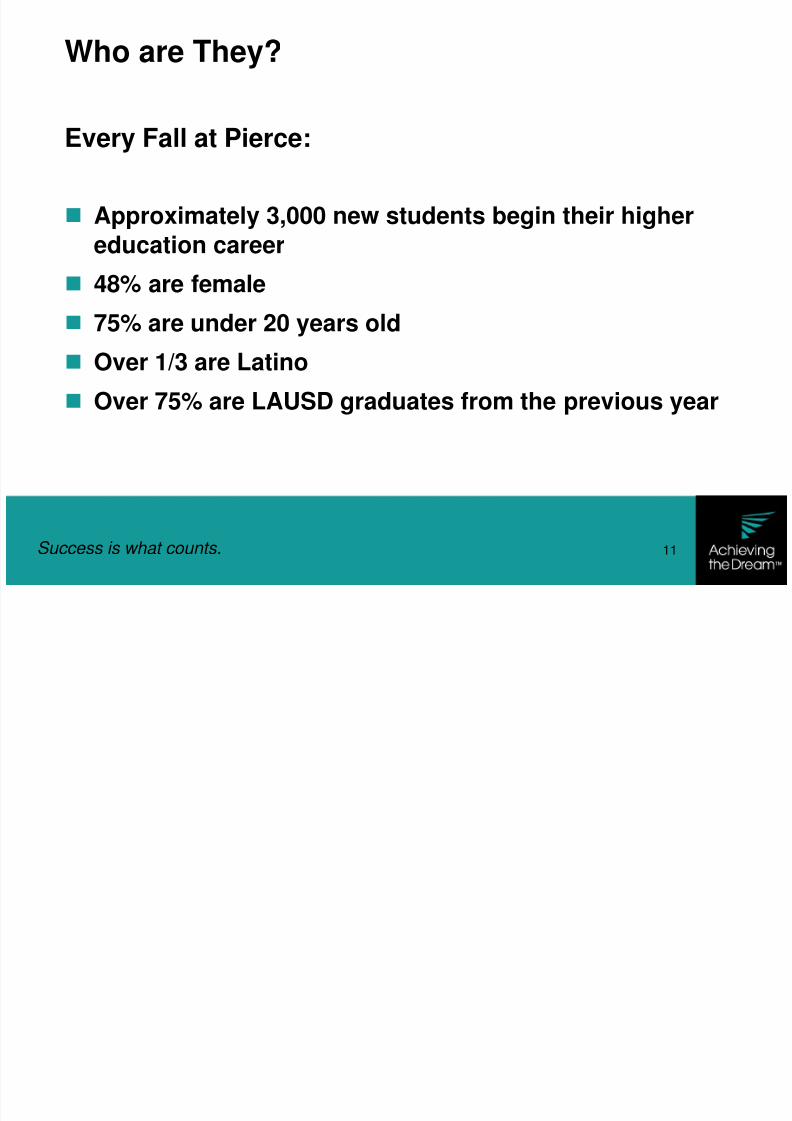
Every Fall at Pierce:
Approximately 3,000 new students begin their higher
education career
48% are female
75% are under 20 years old
Over 1/3 are Latino
Over 75% are LAUSD graduates from the previous year
Who are They?

8/3/2019 AtD & Data Presentation
http://slidepdf.com/reader/full/atd-data-presentation 12/40
Success is what counts. 12
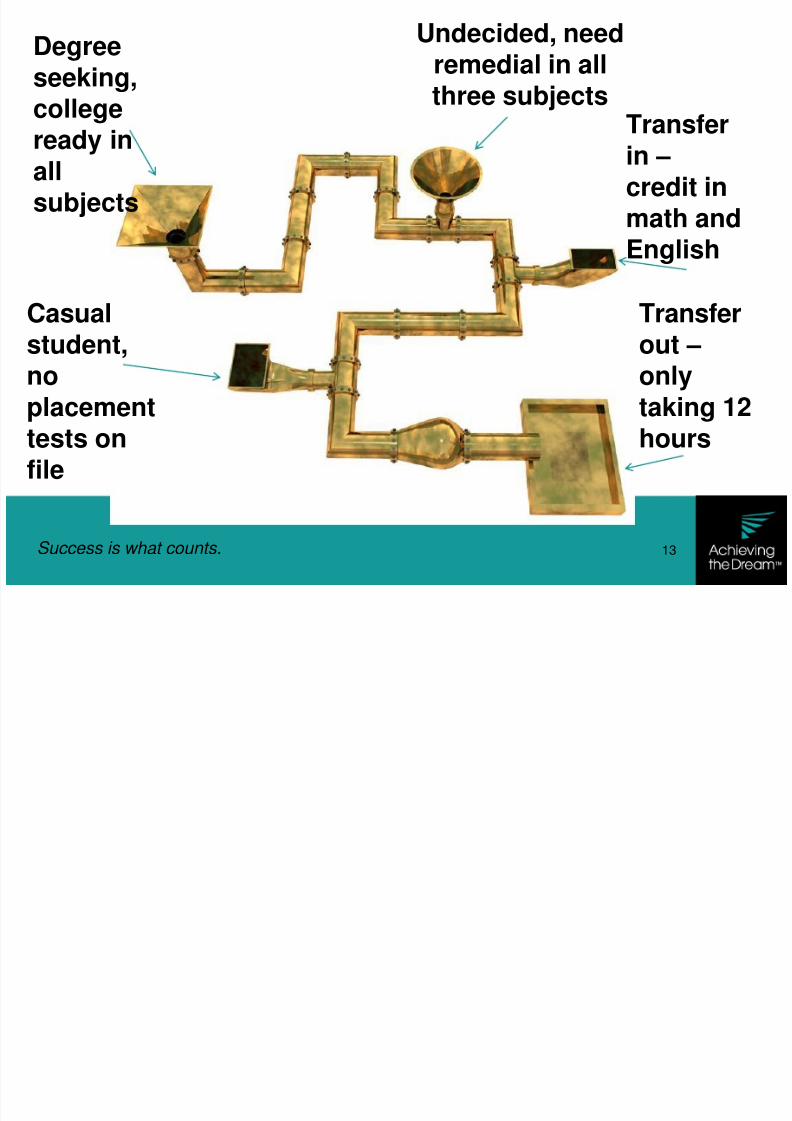
They enter the pipeline
Where they enter and where they go…. depends on
where they have been and what they have done.
8/3/2019 AtD & Data Presentation
http://slidepdf.com/reader/full/atd-data-presentation 13/40
Success is what counts. 13
Degreeseeking,college
ready inallsubjects
Undecided, needremedial in allthree subjects
Casualstudent,no
placementtests onfile
Transferin – credit inmath andEnglish
Transferout – only
taking 12hours
8/3/2019 AtD & Data Presentation
http://slidepdf.com/reader/full/atd-data-presentation 14/40
Success is what counts. 14
In Fall 2007, 2,988 new full and part-timestudents entered Pierce. Here is what
happened to them.
Let’s look at one cohort of students
8/3/2019 AtD & Data Presentation
http://slidepdf.com/reader/full/atd-data-presentation 15/40
Success is what counts. 15
For every 100 new students who enteredPierce (full and part-time)…
8/3/2019 AtD & Data Presentation
http://slidepdf.com/reader/full/atd-data-presentation 16/40
Success is what counts. 16
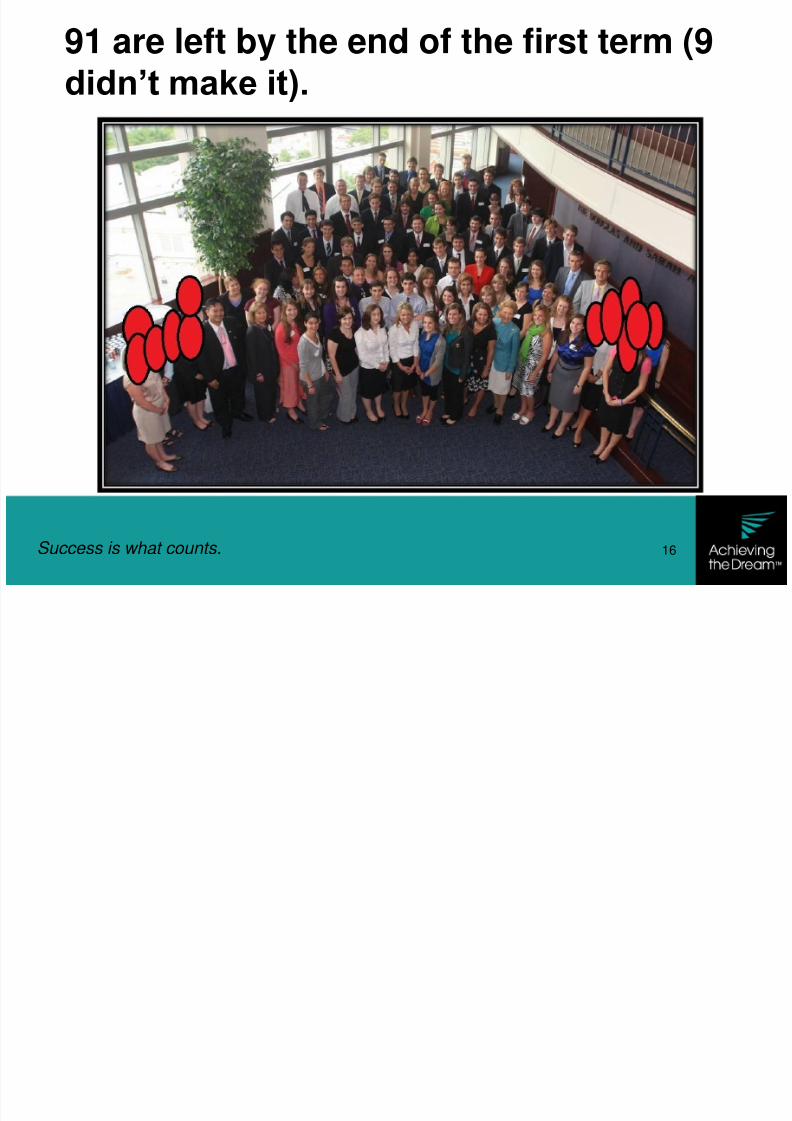
91 are left by the end of the first term (9didn’t make it).
8/3/2019 AtD & Data Presentation
http://slidepdf.com/reader/full/atd-data-presentation 17/40
Success is what counts. 17
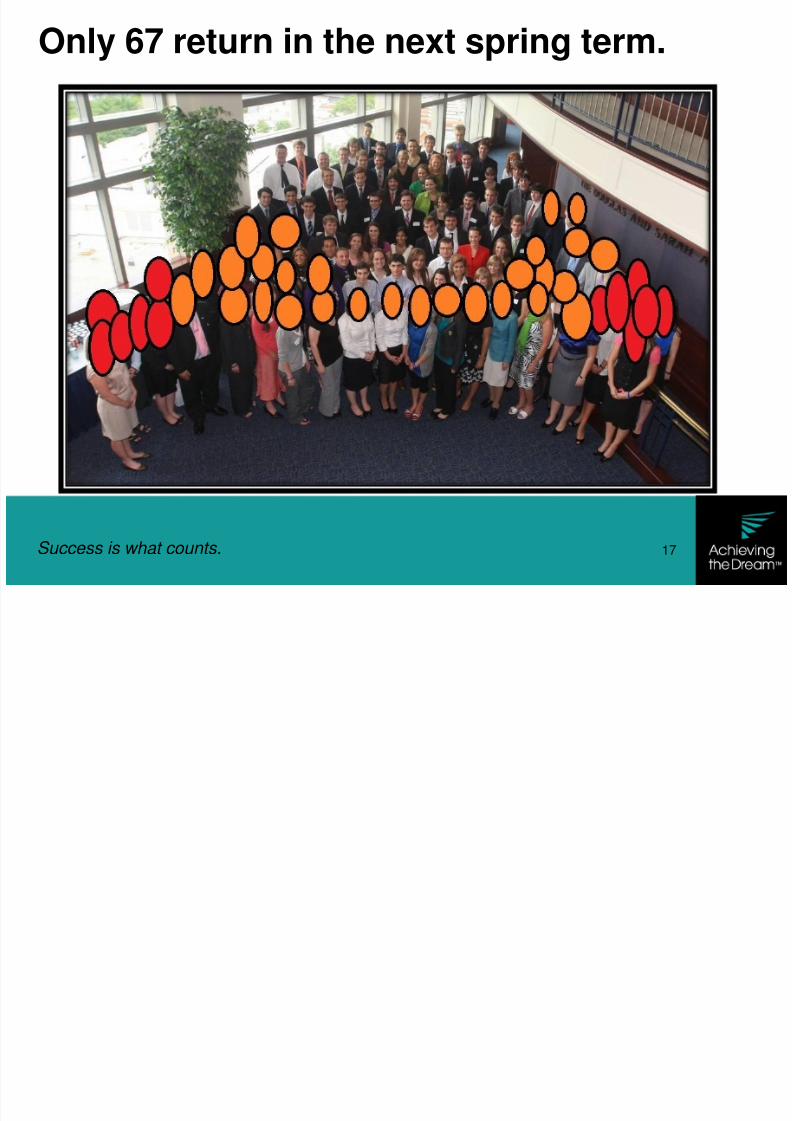
Only 67 return in the next spring term.
8/3/2019 AtD & Data Presentation
http://slidepdf.com/reader/full/atd-data-presentation 18/40
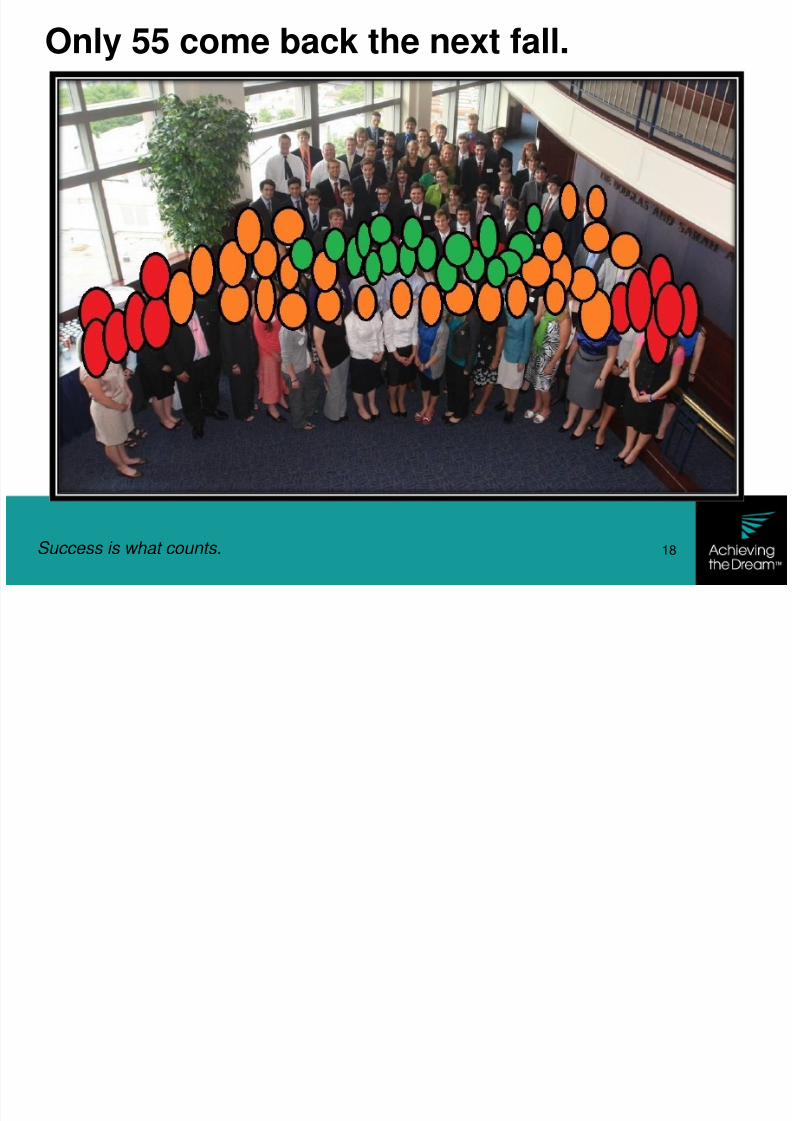
Success is what counts. 18
Only 55 come back the next fall.
8/3/2019 AtD & Data Presentation
http://slidepdf.com/reader/full/atd-data-presentation 19/40
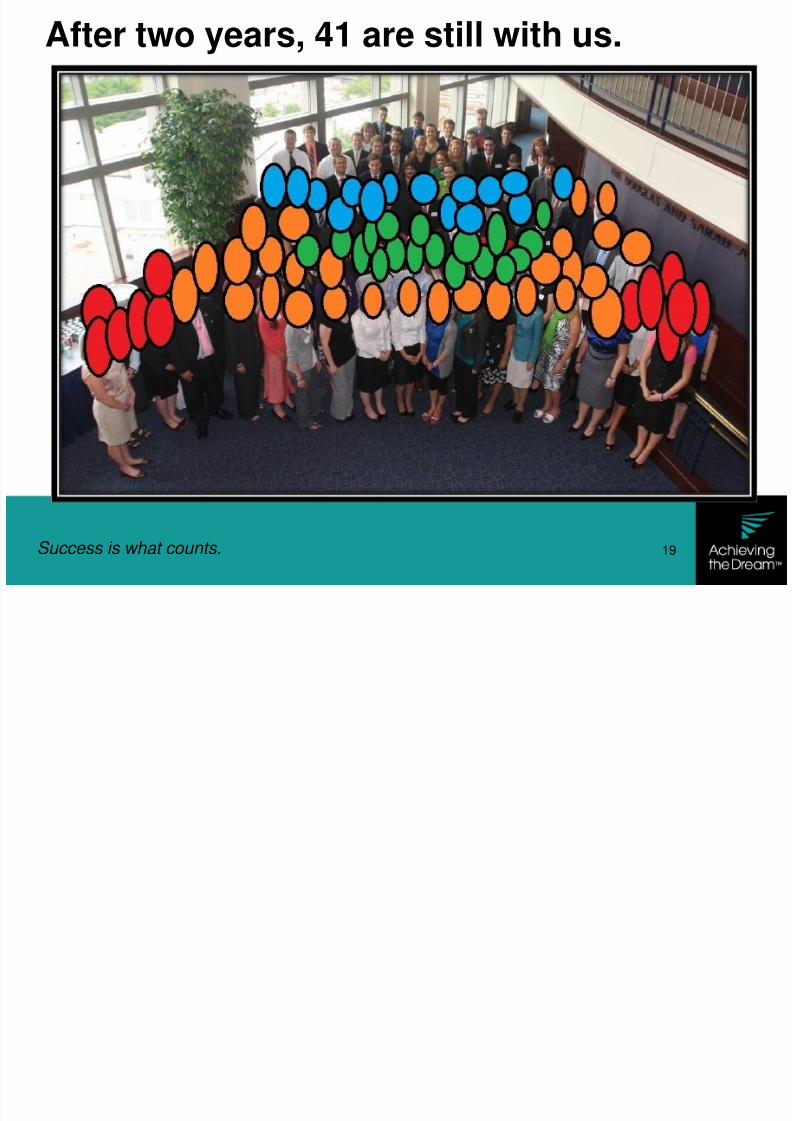
Success is what counts. 19
After two years, 41 are still with us.
Wi hi h h d d
8/3/2019 AtD & Data Presentation
http://slidepdf.com/reader/full/atd-data-presentation 20/40
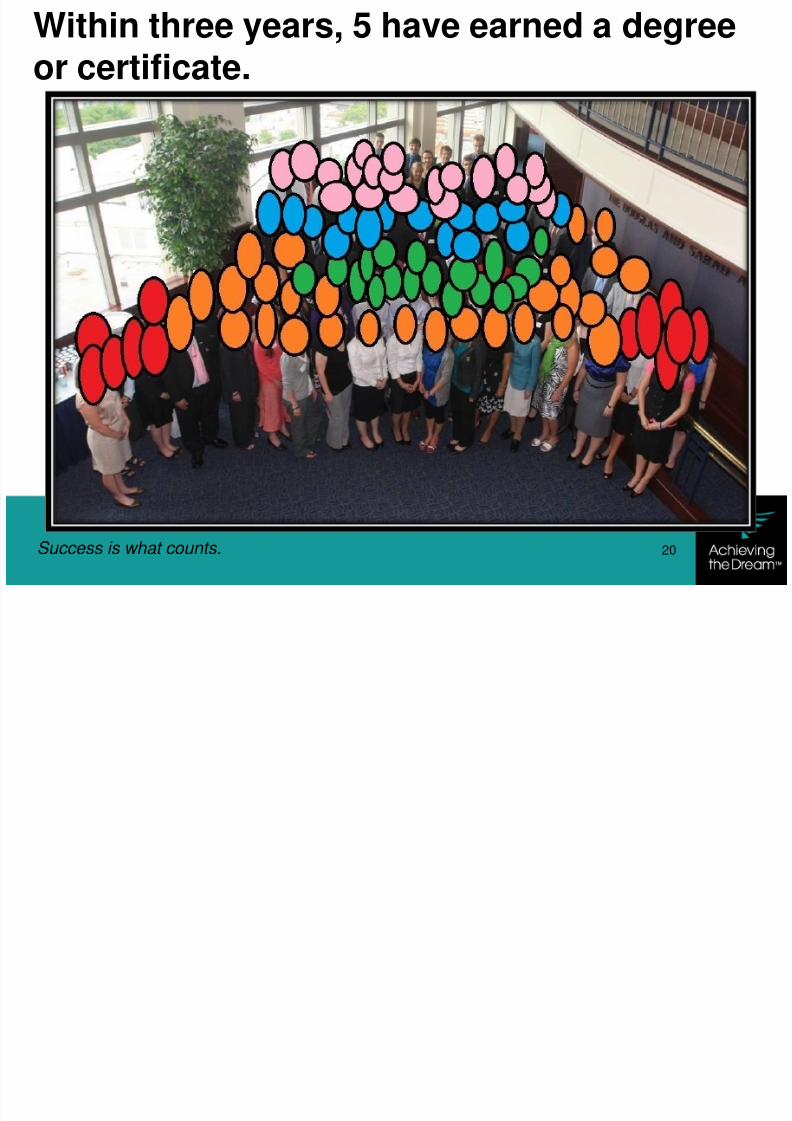
Success is what counts. 20
Within three years, 5 have earned a degreeor certificate.
8/3/2019 AtD & Data Presentation
http://slidepdf.com/reader/full/atd-data-presentation 21/40
Success is what counts. 21
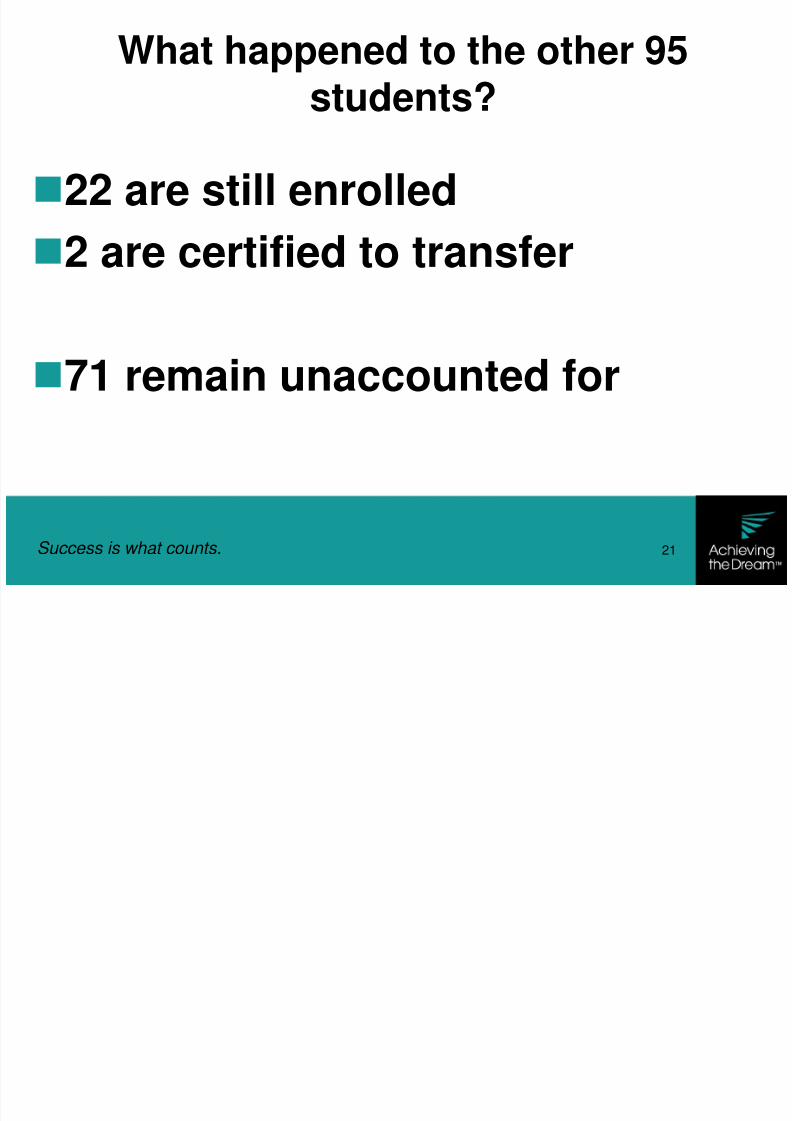
22 are still enrolled
2 are certified to transfer
71 remain unaccounted for
What happened to the other 95students?
8/3/2019 AtD & Data Presentation
http://slidepdf.com/reader/full/atd-data-presentation 22/40
(we are not alone)
Issues Impacting Our Students Are
National Issues Impacting Other Community College Students
8/3/2019 AtD & Data Presentation
http://slidepdf.com/reader/full/atd-data-presentation 23/40
Success is what counts. 23
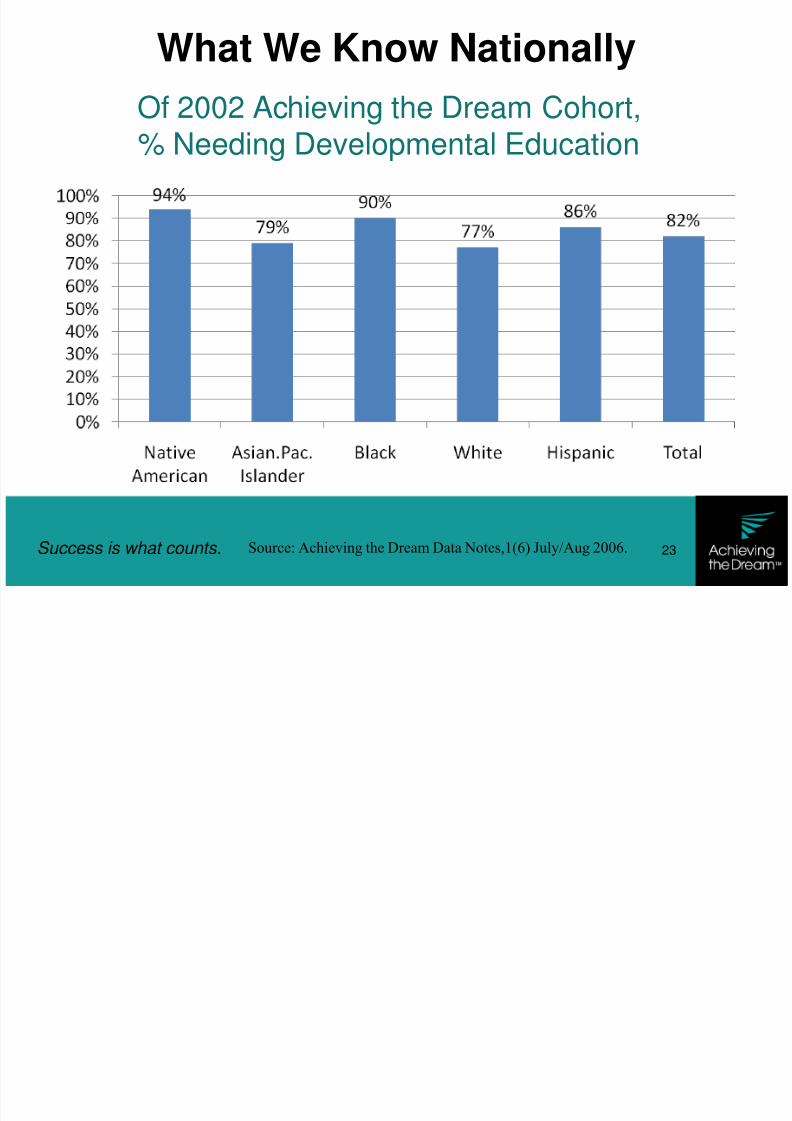
What We Know Nationally
Of 2002 Achieving the Dream Cohort,
% Needing Developmental Education
Source: Achieving the Dream Data Notes,1(6) July/Aug 2006.
8/3/2019 AtD & Data Presentation
http://slidepdf.com/reader/full/atd-data-presentation 24/40
Success is what counts. 24
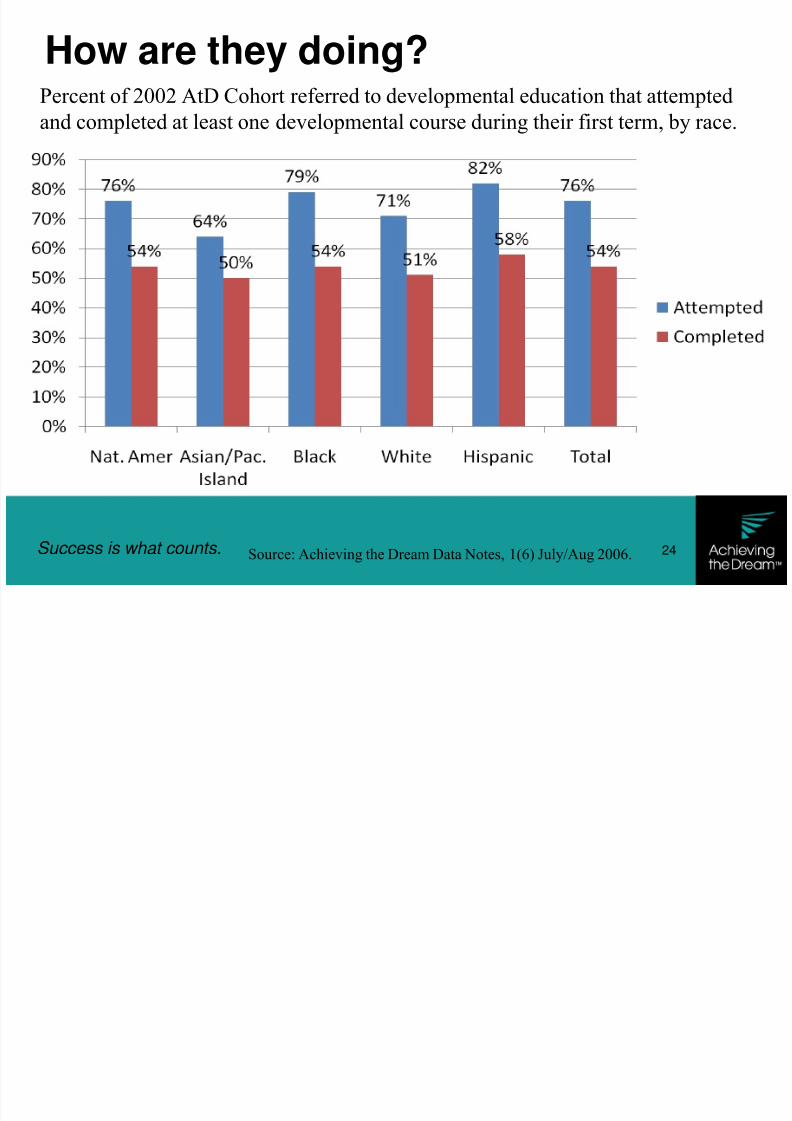
How are they doing?Percent of 2002 AtD Cohort referred to developmental education that attempted
and completed at least one developmental course during their first term, by race.
Source: Achieving the Dream Data Notes, 1(6) July/Aug 2006.
8/3/2019 AtD & Data Presentation
http://slidepdf.com/reader/full/atd-data-presentation 25/40
Success is what counts. 25
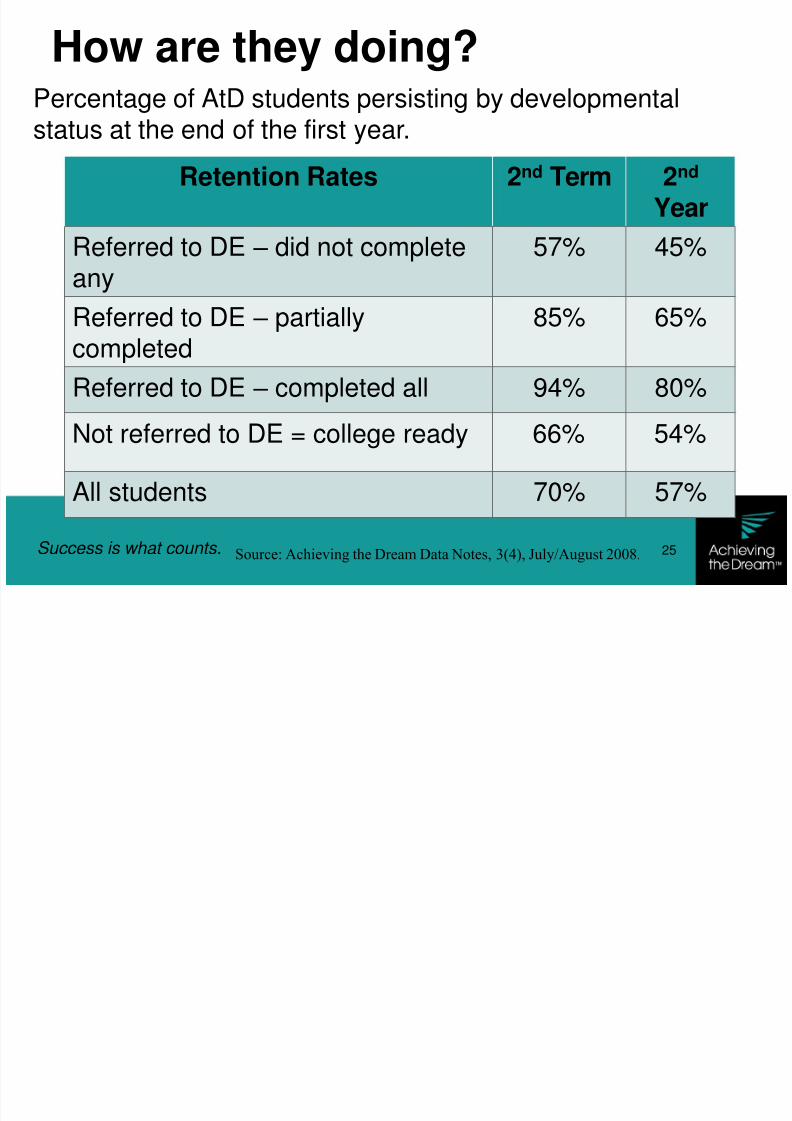
How are they doing?
Retention Rates 2nd Term 2nd Year
Referred to DE – did not complete
any
57% 45%
Referred to DE – partiallycompleted
85% 65%
Referred to DE – completed all 94% 80%
Not referred to DE = college ready 66% 54%
All students 70% 57%
Percentage of AtD students persisting by developmental
status at the end of the first year.
Source: Achieving the Dream Data Notes, 3(4), July/August 2008.
8/3/2019 AtD & Data Presentation
http://slidepdf.com/reader/full/atd-data-presentation 26/40
Success is what counts. 26
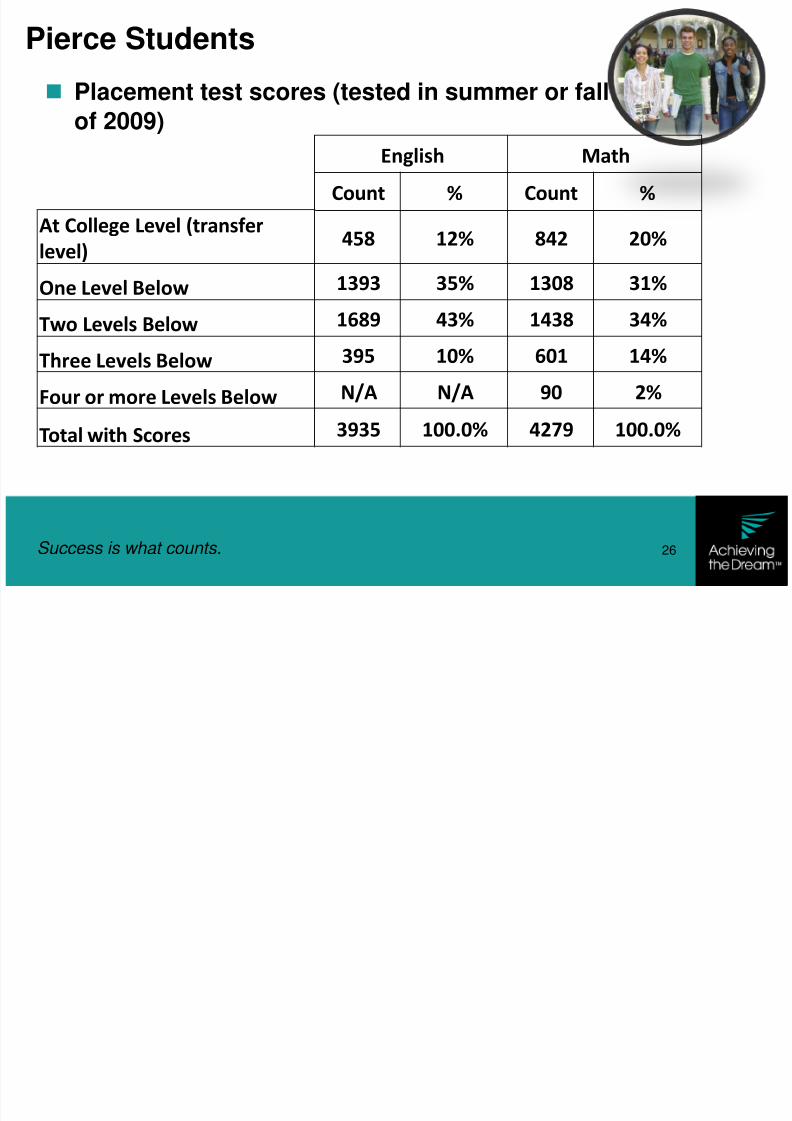
Placement test scores (tested in summer or fall
of 2009)
Pierce Students
English Math
Count % Count %
At College Level (transfer
level)458 12% 842 20%
One Level Below 1393 35% 1308 31%
Two Levels Below 1689 43% 1438 34%
Three Levels Below 395 10% 601 14%
Four or more Levels Below N/A N/A 90 2%
Total with Scores 3935 100.0% 4279 100.0%
8/3/2019 AtD & Data Presentation
http://slidepdf.com/reader/full/atd-data-presentation 27/40
Success is what counts. 27
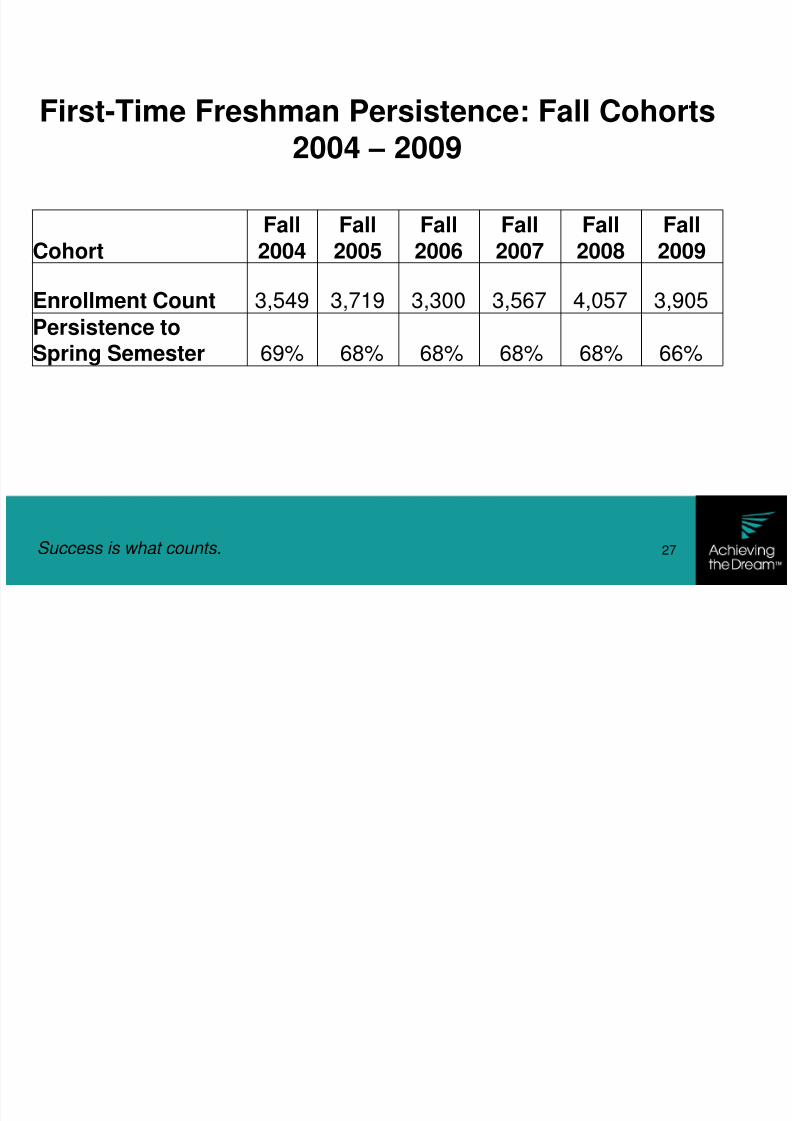
First-Time Freshman Persistence: Fall Cohorts
2004 – 2009
CohortFall2004
Fall2005
Fall2006
Fall2007
Fall2008
Fall2009
Enrollment Count 3,549 3,719 3,300 3,567 4,057 3,905
Persistence toSpring Semester 69% 68% 68% 68% 68% 66%
8/3/2019 AtD & Data Presentation
http://slidepdf.com/reader/full/atd-data-presentation 28/40
An Example of a Data Set

8/3/2019 AtD & Data Presentation
http://slidepdf.com/reader/full/atd-data-presentation 29/40
Success is what counts. 29
We Need to Take a Serious Look at Our Issues
We begin now with today’sactivity.
We want the ―great minds‖ of the college to look at the dataand begin to address the
issues related to studentsuccess.
We are not going to talk about―why‖ our students have
issues until we betterunderstand ―what‖ the issuesare.

8/3/2019 AtD & Data Presentation
http://slidepdf.com/reader/full/atd-data-presentation 30/40
8/3/2019 AtD & Data Presentation
http://slidepdf.com/reader/full/atd-data-presentation 31/40
Success is what counts. 31
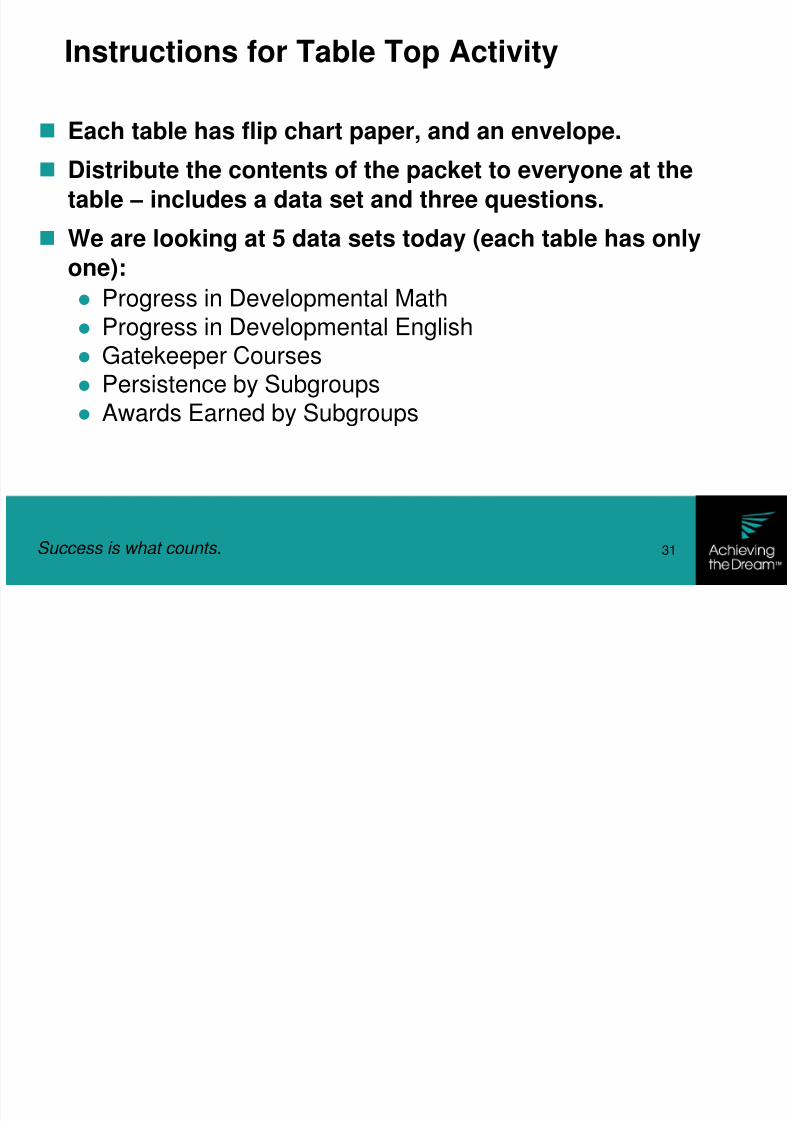
Instructions for Table Top Activity
Each table has flip chart paper, and an envelope. Distribute the contents of the packet to everyone at the
table – includes a data set and three questions.
We are looking at 5 data sets today (each table has only
one): Progress in Developmental Math Progress in Developmental English Gatekeeper Courses Persistence by Subgroups
Awards Earned by Subgroups
8/3/2019 AtD & Data Presentation
http://slidepdf.com/reader/full/atd-data-presentation 32/40
Success is what counts. 32
Table Top Activity
Assign a timekeeper, recorder and reporter
Review your data, discuss it as a group
(30 minutes)
On the flip chart paper, list the following:
1. What’s the story line?
2. What surprised you the most?
3. What additional data/information would you like to see
about this particular data set? We will then report out.

8/3/2019 AtD & Data Presentation
http://slidepdf.com/reader/full/atd-data-presentation 33/40
Roles and Responsibilities
8/3/2019 AtD & Data Presentation
http://slidepdf.com/reader/full/atd-data-presentation 34/40
Success is what counts. 34
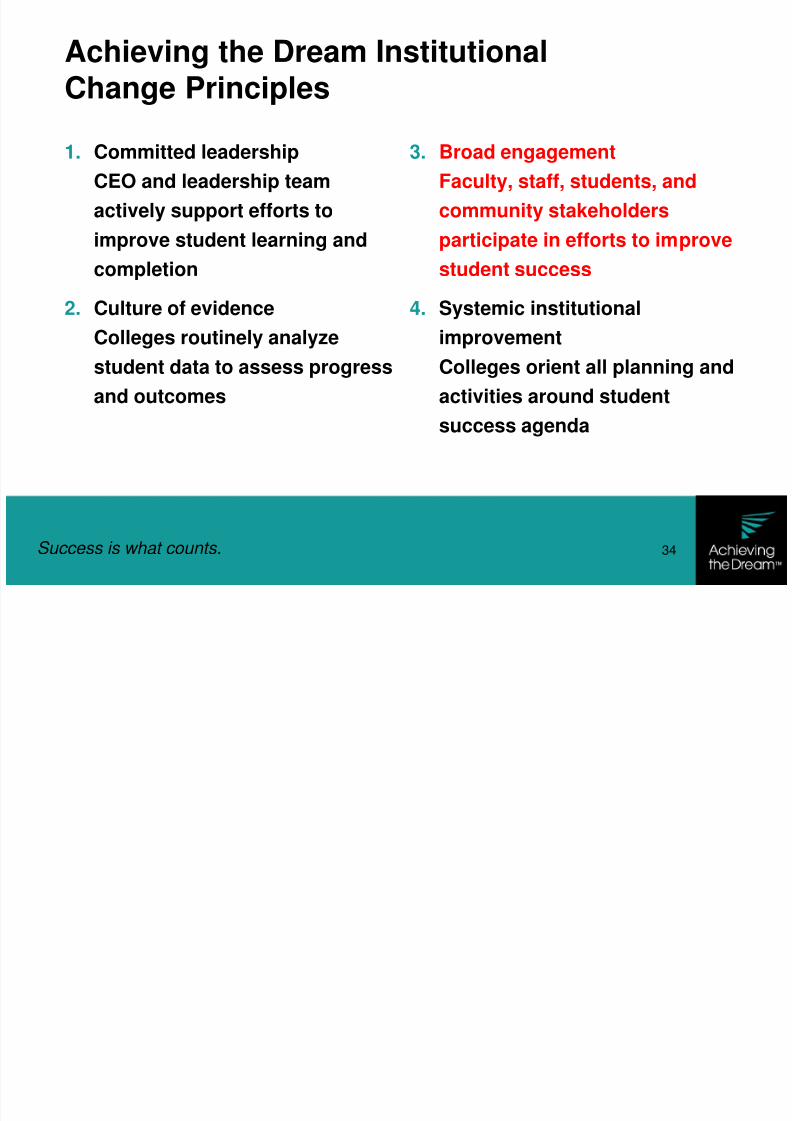
Achieving the Dream InstitutionalChange Principles
1. Committed leadership
CEO and leadership team
actively support efforts to
improve student learning and
completion2. Culture of evidence
Colleges routinely analyze
student data to assess progress
and outcomes
3. Broad engagement
Faculty, staff, students, and
community stakeholders
participate in efforts to improve
student success4. Systemic institutional
improvement
Colleges orient all planning and
activities around student
success agenda
8/3/2019 AtD & Data Presentation
http://slidepdf.com/reader/full/atd-data-presentation 35/40
Success is what counts.
35
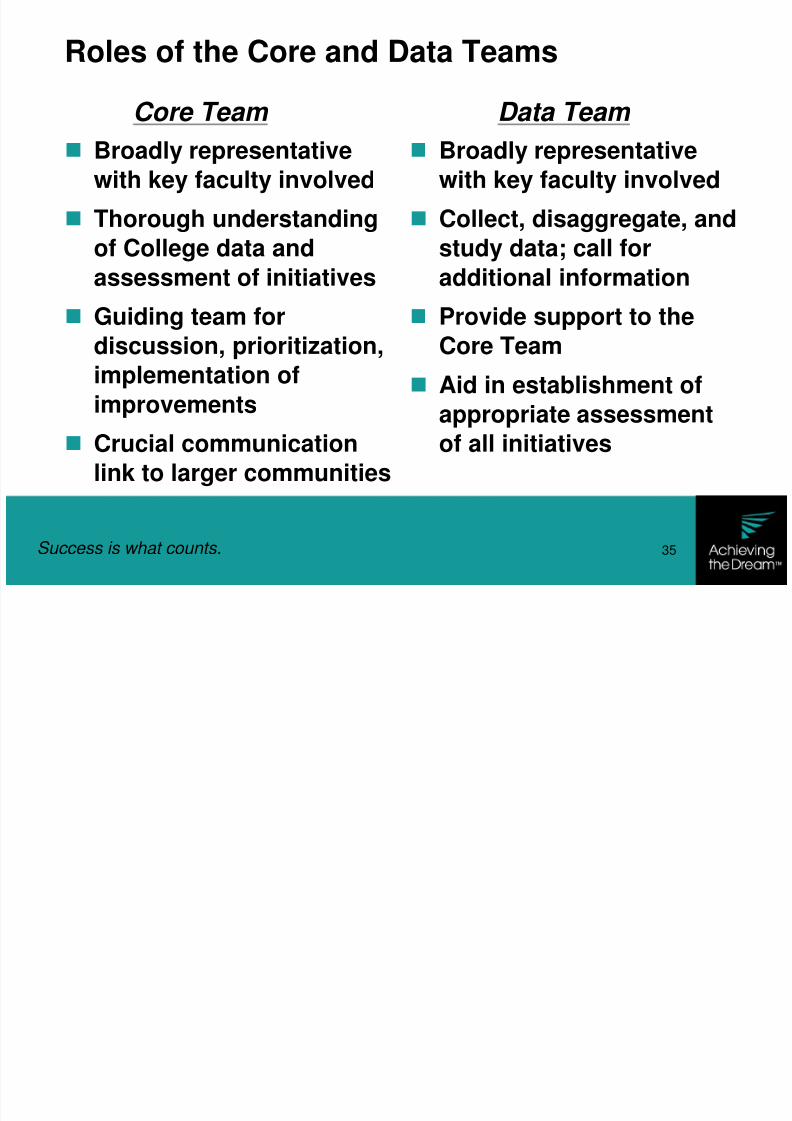
Roles of the Core and Data Teams
Broadly representativewith key faculty involved
Thorough understanding
of College data and
assessment of initiatives Guiding team for
discussion, prioritization,
implementation of
improvements Crucial communication
link to larger communities
Broadly representativewith key faculty involved
Collect, disaggregate, and
study data; call for
additional information Provide support to the
Core Team
Aid in establishment of
appropriate assessmentof all initiatives
Core Team Data Team

8/3/2019 AtD & Data Presentation
http://slidepdf.com/reader/full/atd-data-presentation 36/40
What’s Next?
8/3/2019 AtD & Data Presentation
http://slidepdf.com/reader/full/atd-data-presentation 37/40
Success is what counts.
37
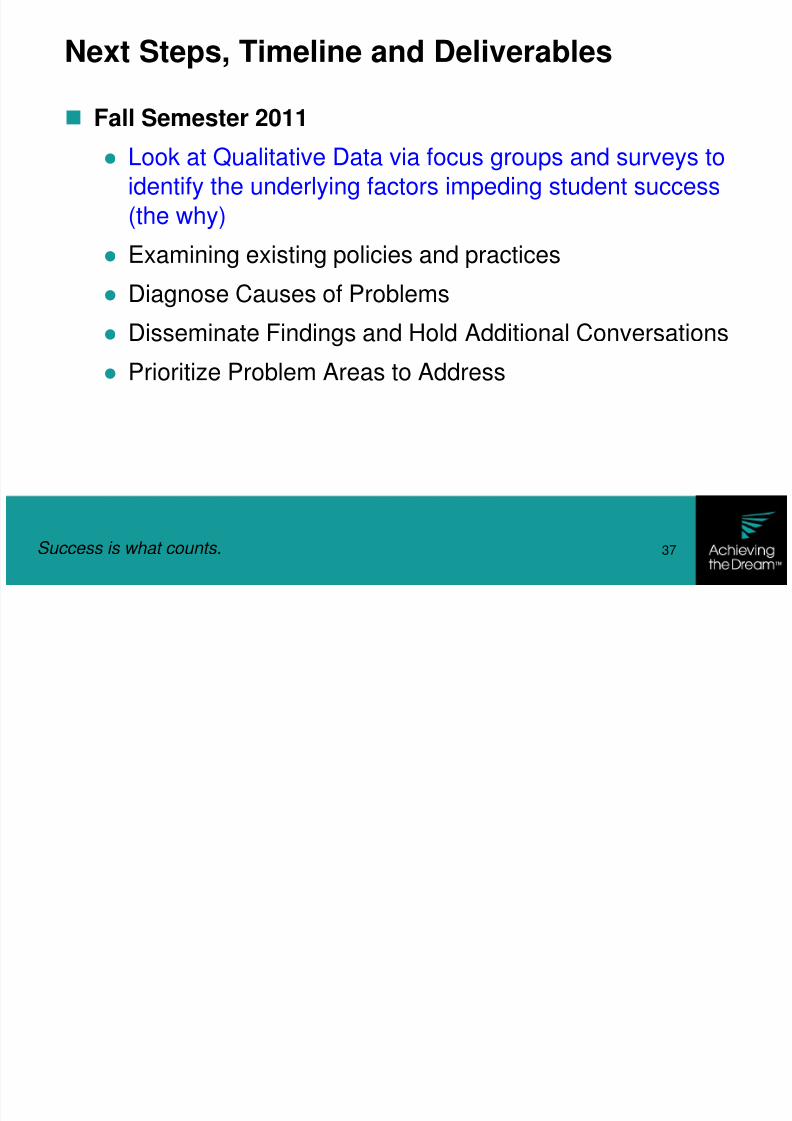
Next Steps, Timeline and Deliverables
Fall Semester 2011
Look at Qualitative Data via focus groups and surveys to
identify the underlying factors impeding student success
(the why)
Examining existing policies and practices
Diagnose Causes of Problems
Disseminate Findings and Hold Additional Conversations
Prioritize Problem Areas to Address
8/3/2019 AtD & Data Presentation
http://slidepdf.com/reader/full/atd-data-presentation 38/40
Success is what counts.
38
Next Steps, Timeline and Deliverables
By August 31:
Establish Core and Data Teams
Fall Semester 2011:
Engage Key Stakeholders Schedule “Courageous Conversations” to reflect on
the Quantitative Data (the what)
Identify Key Issues and Achievement Gaps
8/3/2019 AtD & Data Presentation
http://slidepdf.com/reader/full/atd-data-presentation 39/40

8/3/2019 AtD & Data Presentation
http://slidepdf.com/reader/full/atd-data-presentation 40/40
Q & A