attachment 2 2016 smarter state summary district performance … · 2016-08-26 · attachment 2 –...
TRANSCRIPT
Office of Assessment
Attachment 2 – 2016 Smarter State Summary
District Performance and Participation
Attachment 2 – 2016 Smarter State Summary – District Performance & Participation Office of Assessment
*Indicates no student in this cell
Page | 1
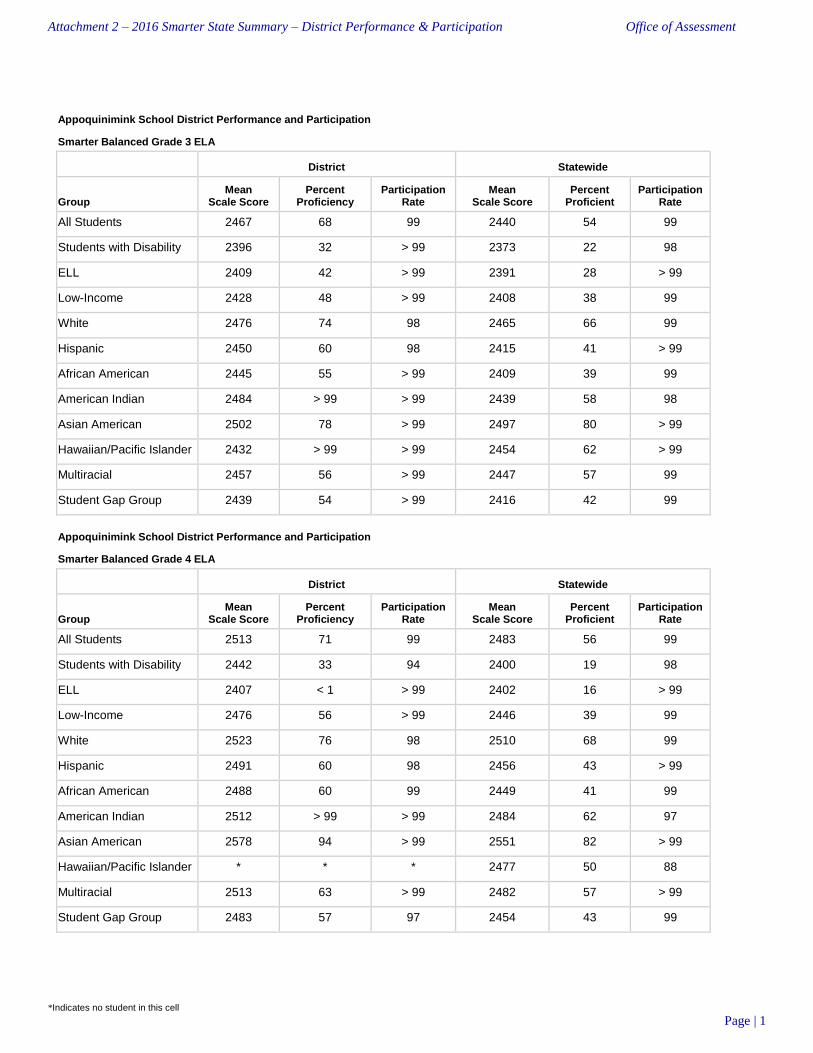
Appoquinimink School District Performance and Participation
Smarter Balanced Grade 3 ELA
District Statewide
Group Mean
Scale Score Percent
Proficiency Participation
Rate Mean
Scale Score Percent
Proficient Participation
Rate
All Students 2467 68 99 2440 54 99
Students with Disability 2396 32 > 99 2373 22 98
ELL 2409 42 > 99 2391 28 > 99
Low-Income 2428 48 > 99 2408 38 99
White 2476 74 98 2465 66 99
Hispanic 2450 60 98 2415 41 > 99
African American 2445 55 > 99 2409 39 99
American Indian 2484 > 99 > 99 2439 58 98
Asian American 2502 78 > 99 2497 80 > 99
Hawaiian/Pacific Islander 2432 > 99 > 99 2454 62 > 99
Multiracial 2457 56 > 99 2447 57 99
Student Gap Group 2439 54 > 99 2416 42 99
Appoquinimink School District Performance and Participation
Smarter Balanced Grade 4 ELA
District Statewide
Group Mean
Scale Score Percent
Proficiency Participation
Rate Mean
Scale Score Percent
Proficient Participation
Rate
All Students 2513 71 99 2483 56 99
Students with Disability 2442 33 94 2400 19 98
ELL 2407 < 1 > 99 2402 16 > 99
Low-Income 2476 56 > 99 2446 39 99
White 2523 76 98 2510 68 99
Hispanic 2491 60 98 2456 43 > 99
African American 2488 60 99 2449 41 99
American Indian 2512 > 99 > 99 2484 62 97
Asian American 2578 94 > 99 2551 82 > 99
Hawaiian/Pacific Islander * * * 2477 50 88
Multiracial 2513 63 > 99 2482 57 > 99
Student Gap Group 2483 57 97 2454 43 99

Attachment 2 – 2016 Smarter State Summary – District Performance & Participation Office of Assessment
*Indicates no student in this cell
Page | 2
Appoquinimink School District Performance and Participation
Smarter Balanced Grade 5 ELA
District Statewide
Group Mean
Scale Score Percent
Proficiency Participation
Rate Mean
Scale Score Percent
Proficient Participation
Rate
All Students 2547 72 99 2519 60 99
Students with Disability 2465 33 94 2431 20 98
ELL 2414 14 > 99 2418 13 99
Low-Income 2495 43 99 2485 44 99
White 2554 75 98 2547 73 98
Hispanic 2527 72 98 2493 49 > 99
African American 2510 56 > 99 2485 44 99
American Indian 2518 50 > 99 2536 67 98
Asian American 2625 96 > 99 2585 85 > 99
Hawaiian/Pacific Islander * * * 2556 83 > 99
Multiracial 2561 83 > 99 2525 64 99
Student Gap Group 2507 54 98 2492 48 99
Appoquinimink School District Performance and Participation
Smarter Balanced Grade 6 ELA
District Statewide
Group Mean
Scale Score Percent
Proficiency Participation
Rate Mean
Scale Score Percent
Proficient Participation
Rate
All Students 2558 66 98 2531 52 98
Students with Disability 2455 19 93 2439 11 96
ELL 2449 20 > 99 2416 7 96
Low-Income 2515 46 97 2493 35 97
White 2566 70 97 2557 65 98
Hispanic 2535 58 > 99 2506 40 98
African American 2536 56 99 2495 35 97
American Indian 2487 < 1 > 99 2526 47 96
Asian American 2608 86 > 99 2604 82 98
Hawaiian/Pacific Islander 2425 < 1 > 99 2534 73 > 99
Multiracial 2587 92 93 2537 51 97
Student Gap Group 2524 50 97 2501 38 97
Attachment 2 – 2016 Smarter State Summary – District Performance & Participation Office of Assessment
*Indicates no student in this cell
Page | 3
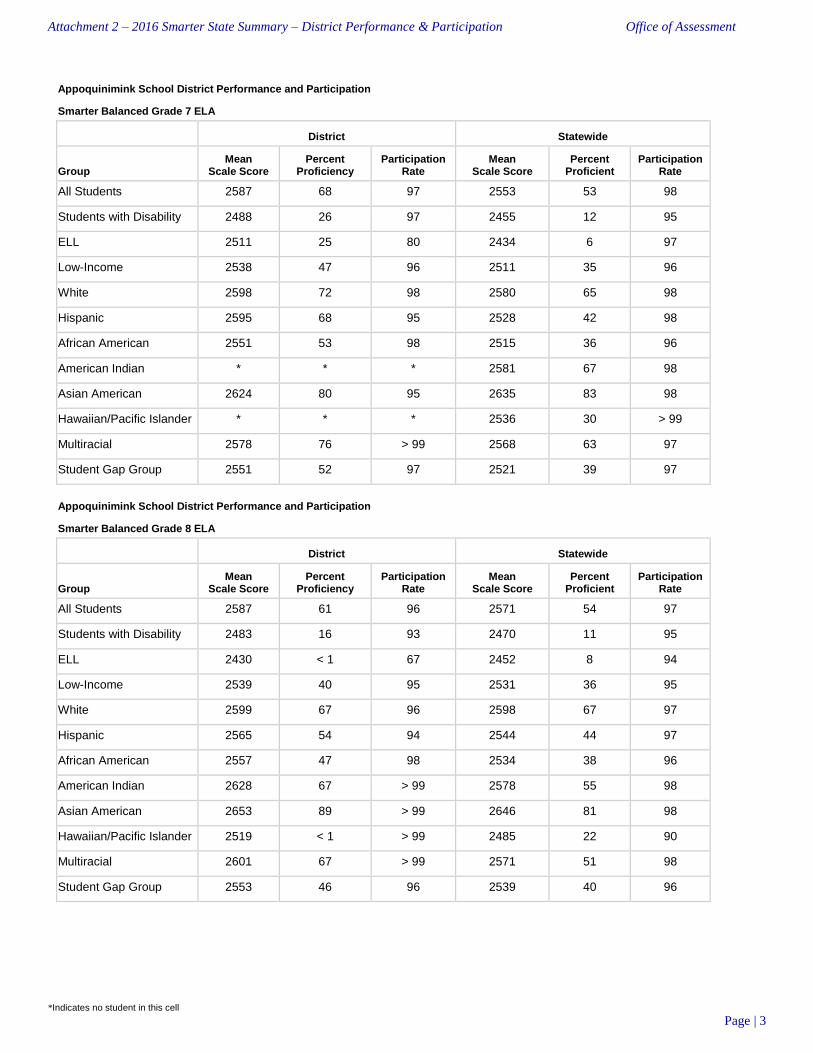
Appoquinimink School District Performance and Participation
Smarter Balanced Grade 7 ELA
District Statewide
Group Mean
Scale Score Percent
Proficiency Participation
Rate Mean
Scale Score Percent
Proficient Participation
Rate
All Students 2587 68 97 2553 53 98
Students with Disability 2488 26 97 2455 12 95
ELL 2511 25 80 2434 6 97
Low-Income 2538 47 96 2511 35 96
White 2598 72 98 2580 65 98
Hispanic 2595 68 95 2528 42 98
African American 2551 53 98 2515 36 96
American Indian * * * 2581 67 98
Asian American 2624 80 95 2635 83 98
Hawaiian/Pacific Islander * * * 2536 30 > 99
Multiracial 2578 76 > 99 2568 63 97
Student Gap Group 2551 52 97 2521 39 97
Appoquinimink School District Performance and Participation
Smarter Balanced Grade 8 ELA
District Statewide
Group Mean
Scale Score Percent
Proficiency Participation
Rate Mean
Scale Score Percent
Proficient Participation
Rate
All Students 2587 61 96 2571 54 97
Students with Disability 2483 16 93 2470 11 95
ELL 2430 < 1 67 2452 8 94
Low-Income 2539 40 95 2531 36 95
White 2599 67 96 2598 67 97
Hispanic 2565 54 94 2544 44 97
African American 2557 47 98 2534 38 96
American Indian 2628 67 > 99 2578 55 98
Asian American 2653 89 > 99 2646 81 98
Hawaiian/Pacific Islander 2519 < 1 > 99 2485 22 90
Multiracial 2601 67 > 99 2571 51 98
Student Gap Group 2553 46 96 2539 40 96
Attachment 2 – 2016 Smarter State Summary – District Performance & Participation Office of Assessment
*Indicates no student in this cell
Page | 4
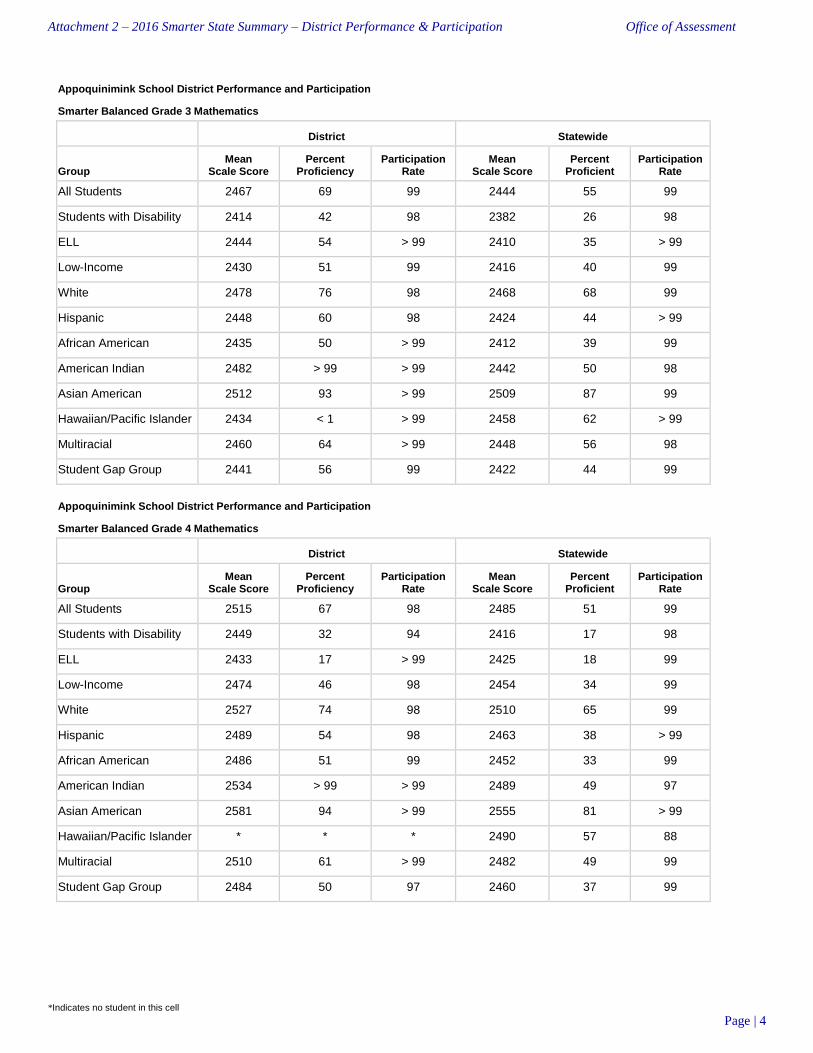
Appoquinimink School District Performance and Participation
Smarter Balanced Grade 3 Mathematics
District Statewide
Group Mean
Scale Score Percent
Proficiency Participation
Rate Mean
Scale Score Percent
Proficient Participation
Rate
All Students 2467 69 99 2444 55 99
Students with Disability 2414 42 98 2382 26 98
ELL 2444 54 > 99 2410 35 > 99
Low-Income 2430 51 99 2416 40 99
White 2478 76 98 2468 68 99
Hispanic 2448 60 98 2424 44 > 99
African American 2435 50 > 99 2412 39 99
American Indian 2482 > 99 > 99 2442 50 98
Asian American 2512 93 > 99 2509 87 99
Hawaiian/Pacific Islander 2434 < 1 > 99 2458 62 > 99
Multiracial 2460 64 > 99 2448 56 98
Student Gap Group 2441 56 99 2422 44 99
Appoquinimink School District Performance and Participation
Smarter Balanced Grade 4 Mathematics
District Statewide
Group Mean
Scale Score Percent
Proficiency Participation
Rate Mean
Scale Score Percent
Proficient Participation
Rate
All Students 2515 67 98 2485 51 99
Students with Disability 2449 32 94 2416 17 98
ELL 2433 17 > 99 2425 18 99
Low-Income 2474 46 98 2454 34 99
White 2527 74 98 2510 65 99
Hispanic 2489 54 98 2463 38 > 99
African American 2486 51 99 2452 33 99
American Indian 2534 > 99 > 99 2489 49 97
Asian American 2581 94 > 99 2555 81 > 99
Hawaiian/Pacific Islander * * * 2490 57 88
Multiracial 2510 61 > 99 2482 49 99
Student Gap Group 2484 50 97 2460 37 99
Attachment 2 – 2016 Smarter State Summary – District Performance & Participation Office of Assessment
*Indicates no student in this cell
Page | 5
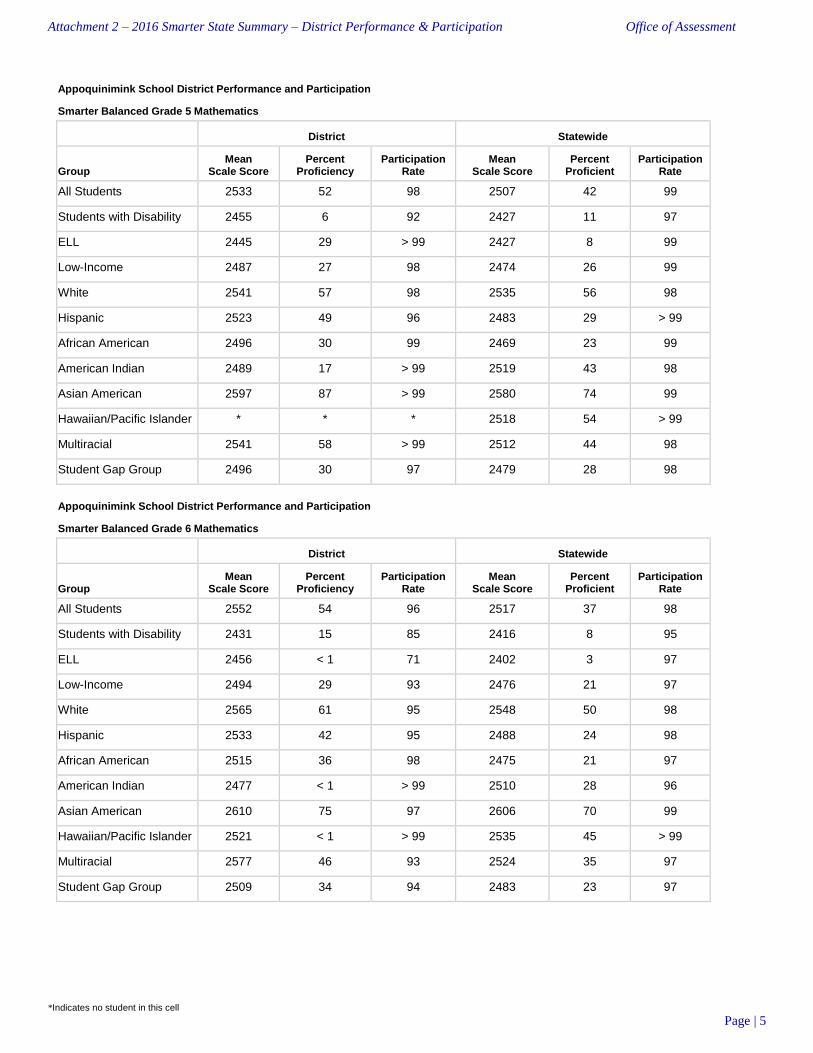
Appoquinimink School District Performance and Participation
Smarter Balanced Grade 5 Mathematics
District Statewide
Group Mean
Scale Score Percent
Proficiency Participation
Rate Mean
Scale Score Percent
Proficient Participation
Rate
All Students 2533 52 98 2507 42 99
Students with Disability 2455 6 92 2427 11 97
ELL 2445 29 > 99 2427 8 99
Low-Income 2487 27 98 2474 26 99
White 2541 57 98 2535 56 98
Hispanic 2523 49 96 2483 29 > 99
African American 2496 30 99 2469 23 99
American Indian 2489 17 > 99 2519 43 98
Asian American 2597 87 > 99 2580 74 99
Hawaiian/Pacific Islander * * * 2518 54 > 99
Multiracial 2541 58 > 99 2512 44 98
Student Gap Group 2496 30 97 2479 28 98
Appoquinimink School District Performance and Participation
Smarter Balanced Grade 6 Mathematics
District Statewide
Group Mean
Scale Score Percent
Proficiency Participation
Rate Mean
Scale Score Percent
Proficient Participation
Rate
All Students 2552 54 96 2517 37 98
Students with Disability 2431 15 85 2416 8 95
ELL 2456 < 1 71 2402 3 97
Low-Income 2494 29 93 2476 21 97
White 2565 61 95 2548 50 98
Hispanic 2533 42 95 2488 24 98
African American 2515 36 98 2475 21 97
American Indian 2477 < 1 > 99 2510 28 96
Asian American 2610 75 97 2606 70 99
Hawaiian/Pacific Islander 2521 < 1 > 99 2535 45 > 99
Multiracial 2577 46 93 2524 35 97
Student Gap Group 2509 34 94 2483 23 97

Attachment 2 – 2016 Smarter State Summary – District Performance & Participation Office of Assessment
*Indicates no student in this cell
Page | 6
Appoquinimink School District Performance and Participation
Smarter Balanced Grade 7 Mathematics
District Statewide
Group Mean
Scale Score Percent
Proficiency Participation
Rate Mean
Scale Score Percent
Proficient Participation
Rate
All Students 2559 49 97 2535 40 98
Students with Disability 2465 13 95 2428 8 95
ELL 2506 20 83 2422 7 97
Low-Income 2496 28 93 2490 22 96
White 2572 53 97 2566 52 98
Hispanic 2561 55 > 99 2506 29 98
African American 2516 32 95 2489 21 96
American Indian 2397 < 1 > 99 2560 55 > 99
Asian American 2631 81 98 2640 77 98
Hawaiian/Pacific Islander * * * 2531 40 > 99
Multiracial 2541 45 95 2545 38 96
Student Gap Group 2519 34 96 2499 26 97
Appoquinimink School District Performance and Participation
Smarter Balanced Grade 8 Mathematics
District Statewide
Group Mean
Scale Score Percent
Proficiency Participation
Rate Mean
Scale Score Percent
Proficient Participation
Rate
All Students 2584 51 95 2549 38 97
Students with Disability 2468 8 91 2437 6 96
ELL 2424 < 1 75 2438 9 96
Low-Income 2532 31 94 2500 20 95
White 2601 60 95 2584 51 97
Hispanic 2546 31 92 2518 25 98
African American 2538 31 97 2501 20 96
American Indian 2675 > 99 67 2547 41 96
Asian American 2671 81 > 99 2659 74 98
Hawaiian/Pacific Islander 2603 > 99 > 99 2470 33 90
Multiracial 2640 73 > 99 2555 40 98
Student Gap Group 2540 32 95 2509 23 96

Attachment 2 – 2016 Smarter State Summary – District Performance & Participation Office of Assessment
*Indicates no student in this cell
Page | 7
Brandywine School District Performance and Participation
Smarter Balanced Grade 3 ELA
District Statewide
Group Mean
Scale Score Percent
Proficiency Participation
Rate Mean
Scale Score Percent
Proficient Participation
Rate
All Students 2438 54 98 2440 54 99
Students with Disability 2363 17 96 2373 22 98
ELL 2388 26 > 99 2391 28 > 99
Low-Income 2396 33 99 2408 38 99
White 2464 66 97 2465 66 99
Hispanic 2406 38 98 2415 41 > 99
African American 2404 38 99 2409 39 99
American Indian 2426 43 88 2439 58 98
Asian American 2482 77 > 99 2497 80 > 99
Hawaiian/Pacific Islander 2437 50 > 99 2454 62 > 99
Multiracial 2442 64 > 99 2447 57 99
Student Gap Group 2407 39 98 2416 42 99
Brandywine School District Performance and Participation
Smarter Balanced Grade 4 ELA
District Statewide
Group Mean
Scale Score Percent
Proficiency Participation
Rate Mean
Scale Score Percent
Proficient Participation
Rate
All Students 2476 52 > 99 2483 56 99
Students with Disability 2386 12 98 2400 19 98
ELL 2415 17 > 99 2402 16 > 99
Low-Income 2431 33 99 2446 39 99
White 2507 67 > 99 2510 68 99
Hispanic 2457 37 98 2456 43 > 99
African American 2433 34 > 99 2449 41 99
American Indian 2427 50 > 99 2484 62 97
Asian American 2535 77 > 99 2551 82 > 99
Hawaiian/Pacific Islander 2568 > 99 > 99 2477 50 88
Multiracial 2423 32 > 99 2482 57 > 99
Student Gap Group 2439 36 > 99 2454 43 99

Attachment 2 – 2016 Smarter State Summary – District Performance & Participation Office of Assessment
*Indicates no student in this cell
Page | 8
Brandywine School District Performance and Participation
Smarter Balanced Grade 5 ELA
District Statewide
Group Mean
Scale Score Percent
Proficiency Participation
Rate Mean
Scale Score Percent
Proficient Participation
Rate
All Students 2528 63 > 99 2519 60 99
Students with Disability 2417 12 > 99 2431 20 98
ELL 2436 17 > 99 2418 13 99
Low-Income 2482 41 > 99 2485 44 99
White 2562 79 > 99 2547 73 98
Hispanic 2501 57 > 99 2493 49 > 99
African American 2483 42 > 99 2485 44 99
American Indian 2473 < 1 > 99 2536 67 98
Asian American 2563 75 98 2585 85 > 99
Hawaiian/Pacific Islander * * * 2556 83 > 99
Multiracial 2527 58 > 99 2525 64 99
Student Gap Group 2488 45 > 99 2492 48 99
Brandywine School District Performance and Participation
Smarter Balanced Grade 6 ELA
District Statewide
Group Mean
Scale Score Percent
Proficiency Participation
Rate Mean
Scale Score Percent
Proficient Participation
Rate
All Students 2537 53 94 2531 52 98
Students with Disability 2435 10 91 2439 11 96
ELL 2421 < 1 80 2416 7 96
Low-Income 2479 28 90 2493 35 97
White 2570 70 98 2557 65 98
Hispanic 2509 43 89 2506 40 98
African American 2487 29 92 2495 35 97
American Indian 2532 50 > 99 2526 47 96
Asian American 2601 78 92 2604 82 98
Hawaiian/Pacific Islander 2406 < 1 > 99 2534 73 > 99
Multiracial 2574 54 87 2537 51 97
Student Gap Group 2493 33 92 2501 38 97

Attachment 2 – 2016 Smarter State Summary – District Performance & Participation Office of Assessment
*Indicates no student in this cell
Page | 9
Brandywine School District Performance and Participation
Smarter Balanced Grade 7 ELA
District Statewide
Group Mean
Scale Score Percent
Proficiency Participation
Rate Mean
Scale Score Percent
Proficient Participation
Rate
All Students 2554 53 97 2553 53 98
Students with Disability 2450 12 95 2455 12 95
ELL 2472 17 > 99 2434 6 97
Low-Income 2497 28 93 2511 35 96
White 2588 69 98 2580 65 98
Hispanic 2530 38 98 2528 42 98
African American 2503 31 96 2515 36 96
American Indian * * * 2581 67 98
Asian American 2611 72 96 2635 83 98
Hawaiian/Pacific Islander 2546 < 1 > 99 2536 30 > 99
Multiracial 2570 57 > 99 2568 63 97
Student Gap Group 2510 34 96 2521 39 97
Brandywine School District Performance and Participation
Smarter Balanced Grade 8 ELA
District Statewide
Group Mean
Scale Score Percent
Proficiency Participation
Rate Mean
Scale Score Percent
Proficient Participation
Rate
All Students 2570 51 93 2571 54 97
Students with Disability 2464 9 90 2470 11 95
ELL 2452 < 1 50 2452 8 94
Low-Income 2510 22 89 2531 36 95
White 2602 65 96 2598 67 97
Hispanic 2583 62 87 2544 44 97
African American 2521 30 91 2534 38 96
American Indian 2482 < 1 67 2578 55 98
Asian American 2626 80 91 2646 81 98
Hawaiian/Pacific Islander * * * 2485 22 90
Multiracial 2539 36 > 99 2571 51 98
Student Gap Group 2526 31 91 2539 40 96

Attachment 2 – 2016 Smarter State Summary – District Performance & Participation Office of Assessment
*Indicates no student in this cell
Page | 10
Brandywine School District Performance and Participation
Smarter Balanced Grade 3 Mathematics
District Statewide
Group Mean
Scale Score Percent
Proficiency Participation
Rate Mean
Scale Score Percent
Proficient Participation
Rate
All Students 2443 56 98 2444 55 99
Students with Disability 2365 20 96 2382 26 98
ELL 2409 33 95 2410 35 > 99
Low-Income 2404 33 98 2416 40 99
White 2471 72 97 2468 68 99
Hispanic 2419 41 96 2424 44 > 99
African American 2404 35 99 2412 39 99
American Indian 2436 57 88 2442 50 98
Asian American 2499 86 > 99 2509 87 99
Hawaiian/Pacific Islander 2412 50 > 99 2458 62 > 99
Multiracial 2437 43 > 99 2448 56 98
Student Gap Group 2412 39 98 2422 44 99
Brandywine School District Performance and Participation
Smarter Balanced Grade 4 Mathematics
District Statewide
Group Mean
Scale Score Percent
Proficiency Participation
Rate Mean
Scale Score Percent
Proficient Participation
Rate
All Students 2483 49 > 99 2485 51 99
Students with Disability 2398 9 98 2416 17 98
ELL 2447 31 97 2425 18 99
Low-Income 2444 30 98 2454 34 99
White 2512 67 99 2510 65 99
Hispanic 2467 38 > 99 2463 38 > 99
African American 2443 27 > 99 2452 33 99
American Indian 2473 25 > 99 2489 49 97
Asian American 2540 74 > 99 2555 81 > 99
Hawaiian/Pacific Islander 2520 > 99 > 99 2490 57 88
Multiracial 2440 22 95 2482 49 99
Student Gap Group 2450 32 99 2460 37 99

Attachment 2 – 2016 Smarter State Summary – District Performance & Participation Office of Assessment
*Indicates no student in this cell
Page | 11
Brandywine School District Performance and Participation
Smarter Balanced Grade 5 Mathematics
District Statewide
Group Mean
Scale Score Percent
Proficiency Participation
Rate Mean
Scale Score Percent
Proficient Participation
Rate
All Students 2521 48 > 99 2507 42 99
Students with Disability 2428 10 > 99 2427 11 97
ELL 2459 5 > 99 2427 8 99
Low-Income 2476 29 99 2474 26 99
White 2552 62 > 99 2535 56 98
Hispanic 2500 34 > 99 2483 29 > 99
African American 2475 29 99 2469 23 99
American Indian 2486 50 > 99 2519 43 98
Asian American 2579 68 98 2580 74 99
Hawaiian/Pacific Islander * * * 2518 54 > 99
Multiracial 2519 42 > 99 2512 44 98
Student Gap Group 2484 32 99 2479 28 98
Brandywine School District Performance and Participation
Smarter Balanced Grade 6 Mathematics
District Statewide
Group Mean
Scale Score Percent
Proficiency Participation
Rate Mean
Scale Score Percent
Proficient Participation
Rate
All Students 2519 36 96 2517 37 98
Students with Disability 2415 5 92 2416 8 95
ELL 2421 10 91 2402 3 97
Low-Income 2458 12 93 2476 21 97
White 2556 50 99 2548 50 98
Hispanic 2495 18 88 2488 24 98
African American 2463 15 94 2475 21 97
American Indian 2527 50 > 99 2510 28 96
Asian American 2578 63 > 99 2606 70 99
Hawaiian/Pacific Islander 2319 < 1 > 99 2535 45 > 99
Multiracial 2565 38 87 2524 35 97
Student Gap Group 2473 16 94 2483 23 97

Attachment 2 – 2016 Smarter State Summary – District Performance & Participation Office of Assessment
*Indicates no student in this cell
Page | 12
Brandywine School District Performance and Participation
Smarter Balanced Grade 7 Mathematics
District Statewide
Group Mean
Scale Score Percent
Proficiency Participation
Rate Mean
Scale Score Percent
Proficient Participation
Rate
All Students 2540 43 97 2535 40 98
Students with Disability 2424 9 92 2428 8 95
ELL 2450 < 1 > 99 2422 7 97
Low-Income 2474 18 93 2490 22 96
White 2579 59 98 2566 52 98
Hispanic 2510 20 > 99 2506 29 98
African American 2476 19 94 2489 21 96
American Indian * * * 2560 55 > 99
Asian American 2629 79 98 2640 77 98
Hawaiian/Pacific Islander 2547 < 1 > 99 2531 40 > 99
Multiracial 2573 54 93 2545 38 96
Student Gap Group 2489 23 95 2499 26 97
Brandywine School District Performance and Participation
Smarter Balanced Grade 8 Mathematics
District Statewide
Group Mean
Scale Score Percent
Proficiency Participation
Rate Mean
Scale Score Percent
Proficient Participation
Rate
All Students 2550 38 96 2549 38 97
Students with Disability 2434 8 93 2437 6 96
ELL 2484 29 78 2438 9 96
Low-Income 2481 10 93 2500 20 95
White 2594 54 97 2584 51 97
Hispanic 2554 31 90 2518 25 98
African American 2487 13 96 2501 20 96
American Indian 2502 < 1 67 2547 41 96
Asian American 2628 83 91 2659 74 98
Hawaiian/Pacific Islander * * * 2470 33 90
Multiracial 2530 36 > 99 2555 40 98
Student Gap Group 2497 16 94 2509 23 96

Attachment 2 – 2016 Smarter State Summary – District Performance & Participation Office of Assessment
*Indicates no student in this cell
Page | 13
Caesar Rodney School District Performance and Participation
Smarter Balanced Grade 3 ELA
District Statewide
Group Mean
Scale Score Percent
Proficiency Participation
Rate Mean
Scale Score Percent
Proficient Participation
Rate
All Students 2462 66 > 99 2440 54 99
Students with Disability 2407 38 99 2373 22 98
ELL 2421 48 96 2391 28 > 99
Low-Income 2432 52 99 2408 38 99
White 2477 74 > 99 2465 66 99
Hispanic 2445 53 98 2415 41 > 99
African American 2428 49 > 99 2409 39 99
American Indian * * * 2439 58 98
Asian American 2466 71 > 99 2497 80 > 99
Hawaiian/Pacific Islander * * * 2454 62 > 99
Multiracial 2471 70 > 99 2447 57 99
Student Gap Group 2438 55 > 99 2416 42 99
Caesar Rodney School District Performance and Participation
Smarter Balanced Grade 4 ELA
District Statewide
Group Mean
Scale Score Percent
Proficiency Participation
Rate Mean
Scale Score Percent
Proficient Participation
Rate
All Students 2513 72 > 99 2483 56 99
Students with Disability 2432 34 > 99 2400 19 98
ELL 2417 29 > 99 2402 16 > 99
Low-Income 2474 57 99 2446 39 99
White 2529 80 99 2510 68 99
Hispanic 2520 79 95 2456 43 > 99
African American 2473 53 > 99 2449 41 99
American Indian 2607 > 99 > 99 2484 62 97
Asian American 2540 75 > 99 2551 82 > 99
Hawaiian/Pacific Islander * * * 2477 50 88
Multiracial 2505 71 > 99 2482 57 > 99
Student Gap Group 2481 59 99 2454 43 99

Attachment 2 – 2016 Smarter State Summary – District Performance & Participation Office of Assessment
*Indicates no student in this cell
Page | 14
Caesar Rodney School District Performance and Participation
Smarter Balanced Grade 5 ELA
District Statewide
Group Mean
Scale Score Percent
Proficiency Participation
Rate Mean
Scale Score Percent
Proficient Participation
Rate
All Students 2551 76 99 2519 60 99
Students with Disability 2471 37 99 2431 20 98
ELL 2479 36 > 99 2418 13 99
Low-Income 2524 66 98 2485 44 99
White 2565 82 99 2547 73 98
Hispanic 2557 85 98 2493 49 > 99
African American 2511 58 99 2485 44 99
American Indian 2624 > 99 > 99 2536 67 98
Asian American 2595 91 > 99 2585 85 > 99
Hawaiian/Pacific Islander * * * 2556 83 > 99
Multiracial 2555 75 > 99 2525 64 99
Student Gap Group 2527 67 98 2492 48 99
Caesar Rodney School District Performance and Participation
Smarter Balanced Grade 6 ELA
District Statewide
Group Mean
Scale Score Percent
Proficiency Participation
Rate Mean
Scale Score Percent
Proficient Participation
Rate
All Students 2560 66 98 2531 52 98
Students with Disability 2460 16 98 2439 11 96
ELL 2446 13 89 2416 7 96
Low-Income 2520 47 97 2493 35 97
White 2577 74 98 2557 65 98
Hispanic 2543 67 98 2506 40 98
African American 2525 49 99 2495 35 97
American Indian 2465 50 > 99 2526 47 96
Asian American 2624 95 > 99 2604 82 98
Hawaiian/Pacific Islander * * * 2534 73 > 99
Multiracial 2550 59 96 2537 51 97
Student Gap Group 2525 50 98 2501 38 97

Attachment 2 – 2016 Smarter State Summary – District Performance & Participation Office of Assessment
*Indicates no student in this cell
Page | 15
Caesar Rodney School District Performance and Participation
Smarter Balanced Grade 7 ELA
District Statewide
Group Mean
Scale Score Percent
Proficiency Participation
Rate Mean
Scale Score Percent
Proficient Participation
Rate
All Students 2574 62 98 2553 53 98
Students with Disability 2472 15 95 2455 12 95
ELL 2388 < 1 91 2434 6 97
Low-Income 2533 43 96 2511 35 96
White 2584 67 99 2580 65 98
Hispanic 2578 63 93 2528 42 98
African American 2545 49 98 2515 36 96
American Indian 2616 > 99 > 99 2581 67 98
Asian American 2645 88 > 99 2635 83 98
Hawaiian/Pacific Islander 2519 < 1 > 99 2536 30 > 99
Multiracial 2621 67 > 99 2568 63 97
Student Gap Group 2546 49 97 2521 39 97
Caesar Rodney School District Performance and Participation
Smarter Balanced Grade 8 ELA
District Statewide
Group Mean
Scale Score Percent
Proficiency Participation
Rate Mean
Scale Score Percent
Proficient Participation
Rate
All Students 2605 71 98 2571 54 97
Students with Disability 2496 10 > 99 2470 11 95
ELL 2579 > 99 33 2452 8 94
Low-Income 2581 59 95 2531 36 95
White 2620 77 98 2598 67 97
Hispanic 2603 75 98 2544 44 97
African American 2572 55 97 2534 38 96
American Indian 2676 > 99 > 99 2578 55 98
Asian American 2655 91 > 99 2646 81 98
Hawaiian/Pacific Islander * * * 2485 22 90
Multiracial 2590 71 > 99 2571 51 98
Student Gap Group 2578 58 97 2539 40 96

Attachment 2 – 2016 Smarter State Summary – District Performance & Participation Office of Assessment
*Indicates no student in this cell
Page | 16
Caesar Rodney School District Performance and Participation
Smarter Balanced Grade 3 Mathematics
District Statewide
Group Mean
Scale Score Percent
Proficiency Participation
Rate Mean
Scale Score Percent
Proficient Participation
Rate
All Students 2466 69 > 99 2444 55 99
Students with Disability 2414 40 99 2382 26 98
ELL 2429 40 96 2410 35 > 99
Low-Income 2437 54 > 99 2416 40 99
White 2481 77 > 99 2468 68 99
Hispanic 2451 56 98 2424 44 > 99
African American 2430 52 99 2412 39 99
American Indian * * * 2442 50 98
Asian American 2491 86 > 99 2509 87 99
Hawaiian/Pacific Islander * * * 2458 62 > 99
Multiracial 2469 68 > 99 2448 56 98
Student Gap Group 2444 57 > 99 2422 44 99
Caesar Rodney School District Performance and Participation
Smarter Balanced Grade 4 Mathematics
District Statewide
Group Mean
Scale Score Percent
Proficiency Participation
Rate Mean
Scale Score Percent
Proficient Participation
Rate
All Students 2512 67 > 99 2485 51 99
Students with Disability 2446 28 > 99 2416 17 98
ELL 2459 29 > 99 2425 18 99
Low-Income 2480 50 99 2454 34 99
White 2529 75 99 2510 65 99
Hispanic 2516 76 95 2463 38 > 99
African American 2475 44 > 99 2452 33 99
American Indian 2605 > 99 > 99 2489 49 97
Asian American 2543 83 > 99 2555 81 > 99
Hawaiian/Pacific Islander * * * 2490 57 88
Multiracial 2490 61 > 99 2482 49 99
Student Gap Group 2483 51 99 2460 37 99
Attachment 2 – 2016 Smarter State Summary – District Performance & Participation Office of Assessment
*Indicates no student in this cell
Page | 17
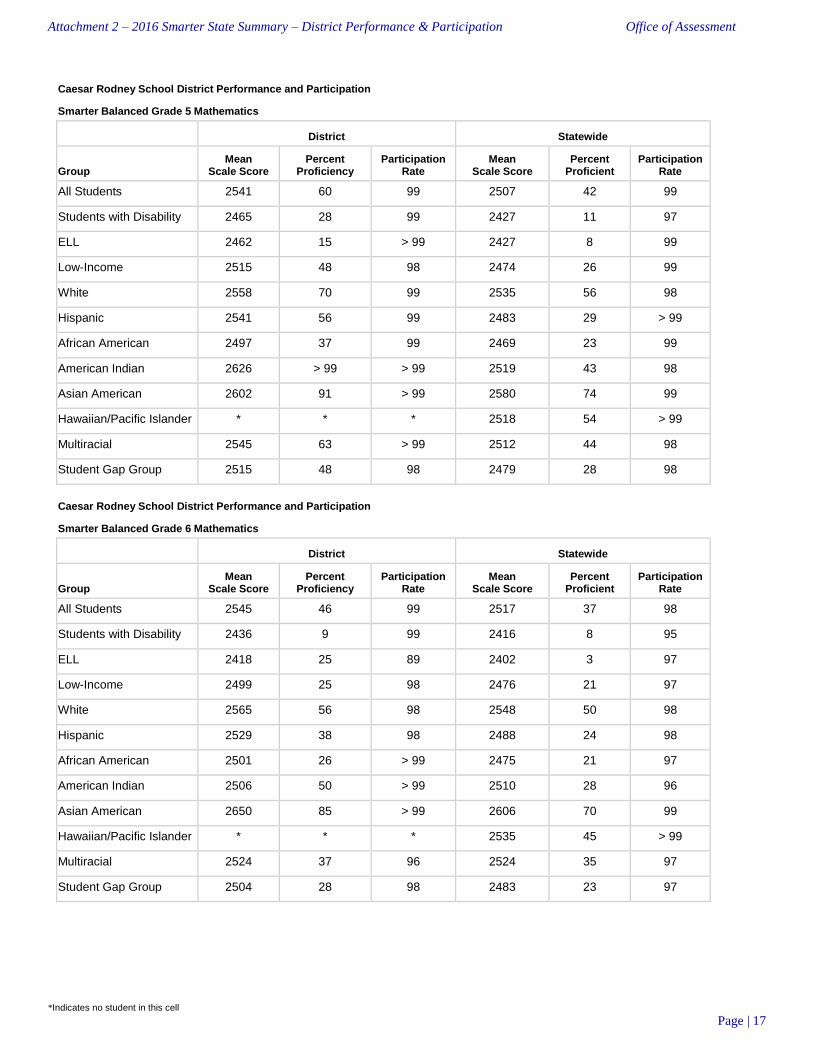
Caesar Rodney School District Performance and Participation
Smarter Balanced Grade 5 Mathematics
District Statewide
Group Mean
Scale Score Percent
Proficiency Participation
Rate Mean
Scale Score Percent
Proficient Participation
Rate
All Students 2541 60 99 2507 42 99
Students with Disability 2465 28 99 2427 11 97
ELL 2462 15 > 99 2427 8 99
Low-Income 2515 48 98 2474 26 99
White 2558 70 99 2535 56 98
Hispanic 2541 56 99 2483 29 > 99
African American 2497 37 99 2469 23 99
American Indian 2626 > 99 > 99 2519 43 98
Asian American 2602 91 > 99 2580 74 99
Hawaiian/Pacific Islander * * * 2518 54 > 99
Multiracial 2545 63 > 99 2512 44 98
Student Gap Group 2515 48 98 2479 28 98
Caesar Rodney School District Performance and Participation
Smarter Balanced Grade 6 Mathematics
District Statewide
Group Mean
Scale Score Percent
Proficiency Participation
Rate Mean
Scale Score Percent
Proficient Participation
Rate
All Students 2545 46 99 2517 37 98
Students with Disability 2436 9 99 2416 8 95
ELL 2418 25 89 2402 3 97
Low-Income 2499 25 98 2476 21 97
White 2565 56 98 2548 50 98
Hispanic 2529 38 98 2488 24 98
African American 2501 26 > 99 2475 21 97
American Indian 2506 50 > 99 2510 28 96
Asian American 2650 85 > 99 2606 70 99
Hawaiian/Pacific Islander * * * 2535 45 > 99
Multiracial 2524 37 96 2524 35 97
Student Gap Group 2504 28 98 2483 23 97
Attachment 2 – 2016 Smarter State Summary – District Performance & Participation Office of Assessment
*Indicates no student in this cell
Page | 18
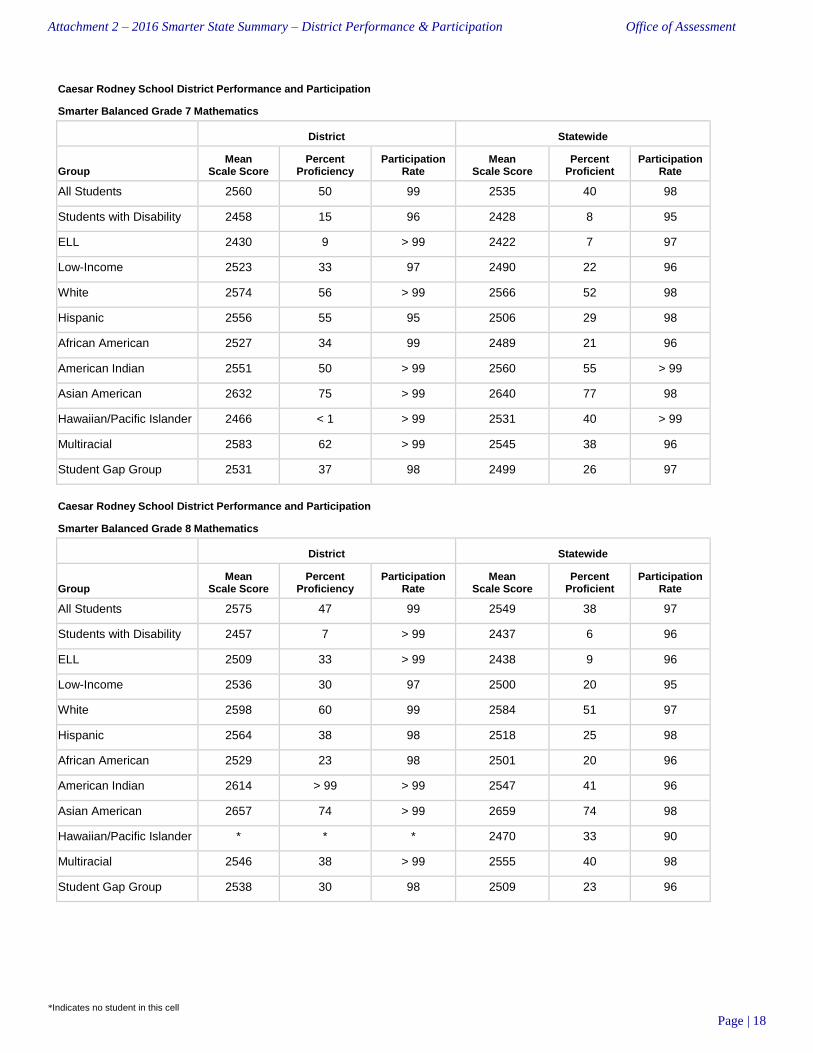
Caesar Rodney School District Performance and Participation
Smarter Balanced Grade 7 Mathematics
District Statewide
Group Mean
Scale Score Percent
Proficiency Participation
Rate Mean
Scale Score Percent
Proficient Participation
Rate
All Students 2560 50 99 2535 40 98
Students with Disability 2458 15 96 2428 8 95
ELL 2430 9 > 99 2422 7 97
Low-Income 2523 33 97 2490 22 96
White 2574 56 > 99 2566 52 98
Hispanic 2556 55 95 2506 29 98
African American 2527 34 99 2489 21 96
American Indian 2551 50 > 99 2560 55 > 99
Asian American 2632 75 > 99 2640 77 98
Hawaiian/Pacific Islander 2466 < 1 > 99 2531 40 > 99
Multiracial 2583 62 > 99 2545 38 96
Student Gap Group 2531 37 98 2499 26 97
Caesar Rodney School District Performance and Participation
Smarter Balanced Grade 8 Mathematics
District Statewide
Group Mean
Scale Score Percent
Proficiency Participation
Rate Mean
Scale Score Percent
Proficient Participation
Rate
All Students 2575 47 99 2549 38 97
Students with Disability 2457 7 > 99 2437 6 96
ELL 2509 33 > 99 2438 9 96
Low-Income 2536 30 97 2500 20 95
White 2598 60 99 2584 51 97
Hispanic 2564 38 98 2518 25 98
African American 2529 23 98 2501 20 96
American Indian 2614 > 99 > 99 2547 41 96
Asian American 2657 74 > 99 2659 74 98
Hawaiian/Pacific Islander * * * 2470 33 90
Multiracial 2546 38 > 99 2555 40 98
Student Gap Group 2538 30 98 2509 23 96

Attachment 2 – 2016 Smarter State Summary – District Performance & Participation Office of Assessment
*Indicates no student in this cell
Page | 19
Cape Henlopen School District Performance and Participation
Smarter Balanced Grade 3 ELA
District Statewide
Group Mean
Scale Score Percent
Proficiency Participation
Rate Mean
Scale Score Percent
Proficient Participation
Rate
All Students 2456 62 99 2440 54 99
Students with Disability 2393 34 97 2373 22 98
ELL 2405 43 > 99 2391 28 > 99
Low-Income 2416 44 98 2408 38 99
White 2473 69 > 99 2465 66 99
Hispanic 2429 55 99 2415 41 > 99
African American 2393 31 98 2409 39 99
American Indian 2472 50 > 99 2439 58 98
Asian American 2534 > 99 75 2497 80 > 99
Hawaiian/Pacific Islander * * * 2454 62 > 99
Multiracial 2456 52 > 99 2447 57 99
Student Gap Group 2421 47 98 2416 42 99
Cape Henlopen School District Performance and Participation
Smarter Balanced Grade 4 ELA
District Statewide
Group Mean
Scale Score Percent
Proficiency Participation
Rate Mean
Scale Score Percent
Proficient Participation
Rate
All Students 2506 63 98 2483 56 99
Students with Disability 2412 13 97 2400 19 98
ELL 2411 9 > 99 2402 16 > 99
Low-Income 2462 39 97 2446 39 99
White 2526 72 99 2510 68 99
Hispanic 2481 50 97 2456 43 > 99
African American 2433 28 > 99 2449 41 99
American Indian * * * 2484 62 97
Asian American 2539 88 > 99 2551 82 > 99
Hawaiian/Pacific Islander * * * 2477 50 88
Multiracial 2492 61 > 99 2482 57 > 99
Student Gap Group 2462 40 98 2454 43 99

Attachment 2 – 2016 Smarter State Summary – District Performance & Participation Office of Assessment
*Indicates no student in this cell
Page | 20
Cape Henlopen School District Performance and Participation
Smarter Balanced Grade 5 ELA
District Statewide
Group Mean
Scale Score Percent
Proficiency Participation
Rate Mean
Scale Score Percent
Proficient Participation
Rate
All Students 2551 74 99 2519 60 99
Students with Disability 2466 28 96 2431 20 98
ELL 2471 33 > 99 2418 13 99
Low-Income 2513 59 99 2485 44 99
White 2572 82 98 2547 73 98
Hispanic 2518 60 > 99 2493 49 > 99
African American 2490 47 98 2485 44 99
American Indian 2579 > 99 > 99 2536 67 98
Asian American 2601 83 > 99 2585 85 > 99
Hawaiian/Pacific Islander 2529 > 99 > 99 2556 83 > 99
Multiracial 2519 64 > 99 2525 64 99
Student Gap Group 2516 60 98 2492 48 99
Cape Henlopen School District Performance and Participation
Smarter Balanced Grade 6 ELA
District Statewide
Group Mean
Scale Score Percent
Proficiency Participation
Rate Mean
Scale Score Percent
Proficient Participation
Rate
All Students 2550 62 97 2531 52 98
Students with Disability 2483 22 96 2439 11 96
ELL 2456 20 > 99 2416 7 96
Low-Income 2529 52 97 2493 35 97
White 2560 67 98 2557 65 98
Hispanic 2523 47 96 2506 40 98
African American 2515 46 95 2495 35 97
American Indian 2701 > 99 > 99 2526 47 96
Asian American 2618 83 > 99 2604 82 98
Hawaiian/Pacific Islander * * * 2534 73 > 99
Multiracial 2575 67 92 2537 51 97
Student Gap Group 2527 50 96 2501 38 97

Attachment 2 – 2016 Smarter State Summary – District Performance & Participation Office of Assessment
*Indicates no student in this cell
Page | 21
Cape Henlopen School District Performance and Participation
Smarter Balanced Grade 7 ELA
District Statewide
Group Mean
Scale Score Percent
Proficiency Participation
Rate Mean
Scale Score Percent
Proficient Participation
Rate
All Students 2586 69 99 2553 53 98
Students with Disability 2497 23 98 2455 12 95
ELL 2412 14 > 99 2434 6 97
Low-Income 2558 56 98 2511 35 96
White 2595 72 99 2580 65 98
Hispanic 2559 64 > 99 2528 42 98
African American 2572 55 98 2515 36 96
American Indian 2685 > 99 > 99 2581 67 98
Asian American 2620 60 > 99 2635 83 98
Hawaiian/Pacific Islander * * * 2536 30 > 99
Multiracial 2576 73 > 99 2568 63 97
Student Gap Group 2555 55 98 2521 39 97
Cape Henlopen School District Performance and Participation
Smarter Balanced Grade 8 ELA
District Statewide
Group Mean
Scale Score Percent
Proficiency Participation
Rate Mean
Scale Score Percent
Proficient Participation
Rate
All Students 2616 74 97 2571 54 97
Students with Disability 2535 29 96 2470 11 95
ELL 2460 < 1 > 99 2452 8 94
Low-Income 2588 58 92 2531 36 95
White 2633 83 97 2598 67 97
Hispanic 2587 57 98 2544 44 97
African American 2569 53 94 2534 38 96
American Indian * * * 2578 55 98
Asian American 2683 > 99 > 99 2646 81 98
Hawaiian/Pacific Islander 2592 > 99 > 99 2485 22 90
Multiracial 2580 45 > 99 2571 51 98
Student Gap Group 2585 58 95 2539 40 96
Attachment 2 – 2016 Smarter State Summary – District Performance & Participation Office of Assessment
*Indicates no student in this cell
Page | 22
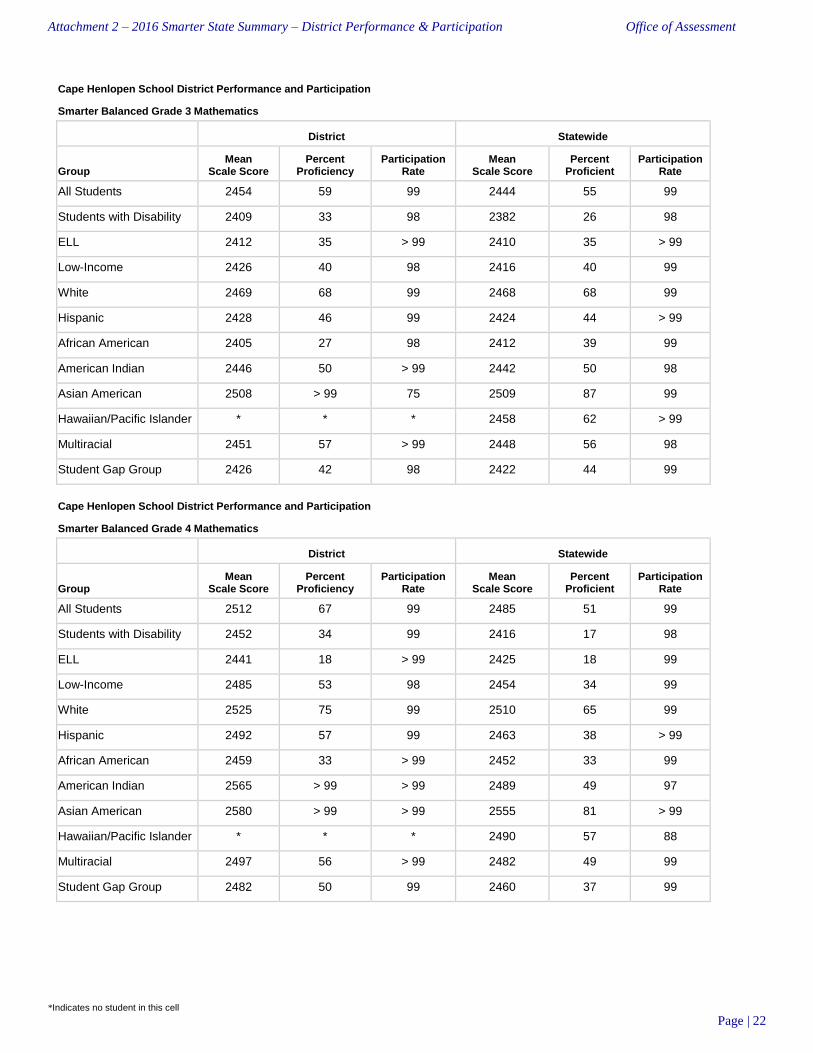
Cape Henlopen School District Performance and Participation
Smarter Balanced Grade 3 Mathematics
District Statewide
Group Mean
Scale Score Percent
Proficiency Participation
Rate Mean
Scale Score Percent
Proficient Participation
Rate
All Students 2454 59 99 2444 55 99
Students with Disability 2409 33 98 2382 26 98
ELL 2412 35 > 99 2410 35 > 99
Low-Income 2426 40 98 2416 40 99
White 2469 68 99 2468 68 99
Hispanic 2428 46 99 2424 44 > 99
African American 2405 27 98 2412 39 99
American Indian 2446 50 > 99 2442 50 98
Asian American 2508 > 99 75 2509 87 99
Hawaiian/Pacific Islander * * * 2458 62 > 99
Multiracial 2451 57 > 99 2448 56 98
Student Gap Group 2426 42 98 2422 44 99
Cape Henlopen School District Performance and Participation
Smarter Balanced Grade 4 Mathematics
District Statewide
Group Mean
Scale Score Percent
Proficiency Participation
Rate Mean
Scale Score Percent
Proficient Participation
Rate
All Students 2512 67 99 2485 51 99
Students with Disability 2452 34 99 2416 17 98
ELL 2441 18 > 99 2425 18 99
Low-Income 2485 53 98 2454 34 99
White 2525 75 99 2510 65 99
Hispanic 2492 57 99 2463 38 > 99
African American 2459 33 > 99 2452 33 99
American Indian 2565 > 99 > 99 2489 49 97
Asian American 2580 > 99 > 99 2555 81 > 99
Hawaiian/Pacific Islander * * * 2490 57 88
Multiracial 2497 56 > 99 2482 49 99
Student Gap Group 2482 50 99 2460 37 99
Attachment 2 – 2016 Smarter State Summary – District Performance & Participation Office of Assessment
*Indicates no student in this cell
Page | 23
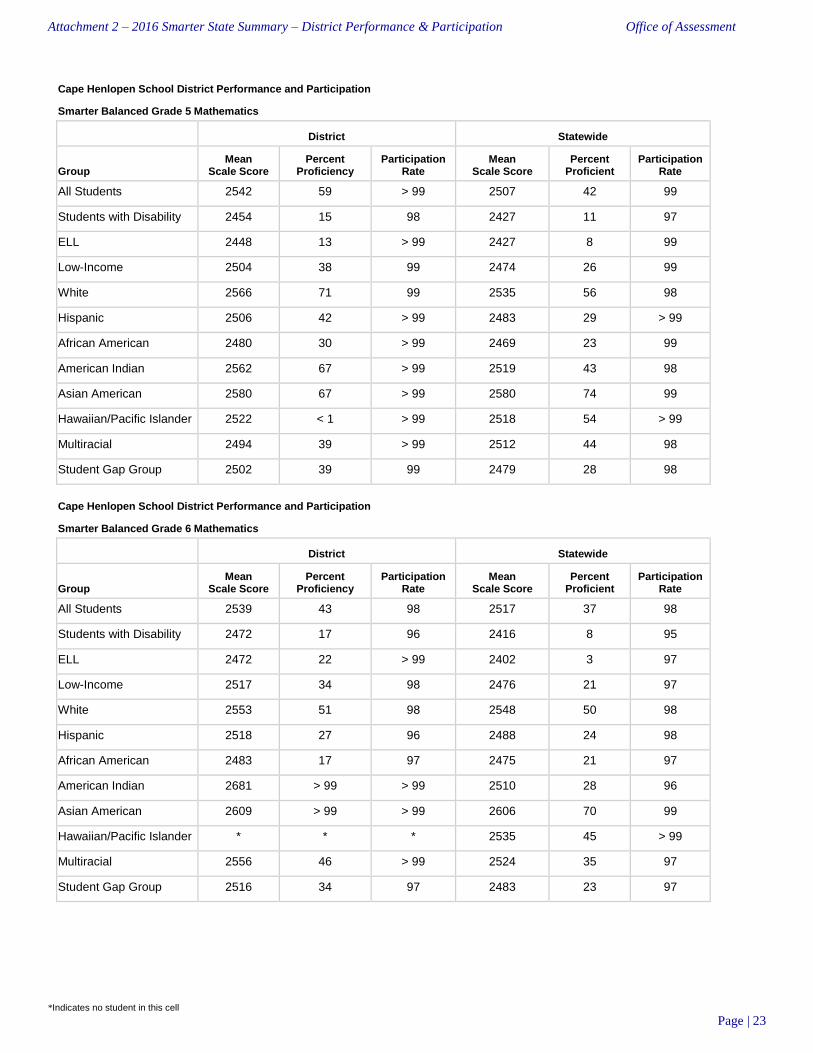
Cape Henlopen School District Performance and Participation
Smarter Balanced Grade 5 Mathematics
District Statewide
Group Mean
Scale Score Percent
Proficiency Participation
Rate Mean
Scale Score Percent
Proficient Participation
Rate
All Students 2542 59 > 99 2507 42 99
Students with Disability 2454 15 98 2427 11 97
ELL 2448 13 > 99 2427 8 99
Low-Income 2504 38 99 2474 26 99
White 2566 71 99 2535 56 98
Hispanic 2506 42 > 99 2483 29 > 99
African American 2480 30 > 99 2469 23 99
American Indian 2562 67 > 99 2519 43 98
Asian American 2580 67 > 99 2580 74 99
Hawaiian/Pacific Islander 2522 < 1 > 99 2518 54 > 99
Multiracial 2494 39 > 99 2512 44 98
Student Gap Group 2502 39 99 2479 28 98
Cape Henlopen School District Performance and Participation
Smarter Balanced Grade 6 Mathematics
District Statewide
Group Mean
Scale Score Percent
Proficiency Participation
Rate Mean
Scale Score Percent
Proficient Participation
Rate
All Students 2539 43 98 2517 37 98
Students with Disability 2472 17 96 2416 8 95
ELL 2472 22 > 99 2402 3 97
Low-Income 2517 34 98 2476 21 97
White 2553 51 98 2548 50 98
Hispanic 2518 27 96 2488 24 98
African American 2483 17 97 2475 21 97
American Indian 2681 > 99 > 99 2510 28 96
Asian American 2609 > 99 > 99 2606 70 99
Hawaiian/Pacific Islander * * * 2535 45 > 99
Multiracial 2556 46 > 99 2524 35 97
Student Gap Group 2516 34 97 2483 23 97

Attachment 2 – 2016 Smarter State Summary – District Performance & Participation Office of Assessment
*Indicates no student in this cell
Page | 24
Cape Henlopen School District Performance and Participation
Smarter Balanced Grade 7 Mathematics
District Statewide
Group Mean
Scale Score Percent
Proficiency Participation
Rate Mean
Scale Score Percent
Proficient Participation
Rate
All Students 2588 63 99 2535 40 98
Students with Disability 2473 15 97 2428 8 95
ELL 2491 20 > 99 2422 7 97
Low-Income 2561 48 > 99 2490 22 96
White 2595 65 98 2566 52 98
Hispanic 2563 50 > 99 2506 29 98
African American 2573 57 98 2489 21 96
American Indian 2692 > 99 > 99 2560 55 > 99
Asian American 2623 83 > 99 2640 77 98
Hawaiian/Pacific Islander * * * 2531 40 > 99
Multiracial 2596 73 > 99 2545 38 96
Student Gap Group 2552 47 99 2499 26 97
Cape Henlopen School District Performance and Participation
Smarter Balanced Grade 8 Mathematics
District Statewide
Group Mean
Scale Score Percent
Proficiency Participation
Rate Mean
Scale Score Percent
Proficient Participation
Rate
All Students 2611 58 97 2549 38 97
Students with Disability 2518 22 96 2437 6 96
ELL 2485 18 > 99 2438 9 96
Low-Income 2578 50 93 2500 20 95
White 2629 67 97 2584 51 97
Hispanic 2580 48 98 2518 25 98
African American 2556 30 94 2501 20 96
American Indian * * * 2547 41 96
Asian American 2743 > 99 > 99 2659 74 98
Hawaiian/Pacific Islander 2779 > 99 > 99 2470 33 90
Multiracial 2596 45 > 99 2555 40 98
Student Gap Group 2573 44 96 2509 23 96

Attachment 2 – 2016 Smarter State Summary – District Performance & Participation Office of Assessment
*Indicates no student in this cell
Page | 25
Capital School District Performance and Participation
Smarter Balanced Grade 3 ELA
District Statewide
Group Mean
Scale Score Percent
Proficiency Participation
Rate Mean
Scale Score Percent
Proficient Participation
Rate
All Students 2448 57 > 99 2440 54 99
Students with Disability 2384 29 99 2373 22 98
ELL 2407 33 > 99 2391 28 > 99
Low-Income 2428 48 98 2408 38 99
White 2471 69 > 99 2465 66 99
Hispanic 2435 53 > 99 2415 41 > 99
African American 2432 49 99 2409 39 99
American Indian 2439 50 > 99 2439 58 98
Asian American 2531 80 > 99 2497 80 > 99
Hawaiian/Pacific Islander 2441 33 > 99 2454 62 > 99
Multiracial 2475 77 93 2447 57 99
Student Gap Group 2435 52 99 2416 42 99
Capital School District Performance and Participation
Smarter Balanced Grade 4 ELA
District Statewide
Group Mean
Scale Score Percent
Proficiency Participation
Rate Mean
Scale Score Percent
Proficient Participation
Rate
All Students 2489 60 99 2483 56 99
Students with Disability 2413 23 98 2400 19 98
ELL 2405 18 > 99 2402 16 > 99
Low-Income 2469 48 99 2446 39 99
White 2515 74 > 99 2510 68 99
Hispanic 2472 51 > 99 2456 43 > 99
African American 2472 50 98 2449 41 99
American Indian 2523 80 > 99 2484 62 97
Asian American 2514 71 > 99 2551 82 > 99
Hawaiian/Pacific Islander 2641 > 99 > 99 2477 50 88
Multiracial 2464 50 89 2482 57 > 99
Student Gap Group 2475 53 98 2454 43 99

Attachment 2 – 2016 Smarter State Summary – District Performance & Participation Office of Assessment
*Indicates no student in this cell
Page | 26
Capital School District Performance and Participation
Smarter Balanced Grade 5 ELA
District Statewide
Group Mean
Scale Score Percent
Proficiency Participation
Rate Mean
Scale Score Percent
Proficient Participation
Rate
All Students 2506 52 97 2519 60 99
Students with Disability 2447 19 95 2431 20 98
ELL 2426 11 > 99 2418 13 99
Low-Income 2488 42 98 2485 44 99
White 2533 64 95 2547 73 98
Hispanic 2493 47 > 99 2493 49 > 99
African American 2492 45 98 2485 44 99
American Indian 2472 20 83 2536 67 98
Asian American 2568 80 > 99 2585 85 > 99
Hawaiian/Pacific Islander 2591 > 99 > 99 2556 83 > 99
Multiracial 2513 68 95 2525 64 99
Student Gap Group 2492 46 97 2492 48 99
Capital School District Performance and Participation
Smarter Balanced Grade 6 ELA
District Statewide
Group Mean
Scale Score Percent
Proficiency Participation
Rate Mean
Scale Score Percent
Proficient Participation
Rate
All Students 2518 45 96 2531 52 98
Students with Disability 2445 10 94 2439 11 96
ELL 2438 27 > 99 2416 7 96
Low-Income 2494 33 94 2493 35 97
White 2546 60 95 2557 65 98
Hispanic 2515 38 98 2506 40 98
African American 2500 36 95 2495 35 97
American Indian 2524 43 > 99 2526 47 96
Asian American 2585 80 > 99 2604 82 98
Hawaiian/Pacific Islander 2634 > 99 > 99 2534 73 > 99
Multiracial 2512 56 90 2537 51 97
Student Gap Group 2503 37 96 2501 38 97

Attachment 2 – 2016 Smarter State Summary – District Performance & Participation Office of Assessment
*Indicates no student in this cell
Page | 27
Capital School District Performance and Participation
Smarter Balanced Grade 7 ELA
District Statewide
Group Mean
Scale Score Percent
Proficiency Participation
Rate Mean
Scale Score Percent
Proficient Participation
Rate
All Students 2528 38 96 2553 53 98
Students with Disability 2440 6 95 2455 12 95
ELL 2445 < 1 > 99 2434 6 97
Low-Income 2504 26 94 2511 35 96
White 2550 49 99 2580 65 98
Hispanic 2522 31 98 2528 42 98
African American 2515 32 95 2515 36 96
American Indian 2476 20 > 99 2581 67 98
Asian American 2581 55 > 99 2635 83 98
Hawaiian/Pacific Islander * * * 2536 30 > 99
Multiracial 2525 45 > 99 2568 63 97
Student Gap Group 2512 29 96 2521 39 97
Capital School District Performance and Participation
Smarter Balanced Grade 8 ELA
District Statewide
Group Mean
Scale Score Percent
Proficiency Participation
Rate Mean
Scale Score Percent
Proficient Participation
Rate
All Students 2555 48 95 2571 54 97
Students with Disability 2462 7 93 2470 11 95
ELL 2425 9 85 2452 8 94
Low-Income 2534 37 92 2531 36 95
White 2593 67 98 2598 67 97
Hispanic 2526 35 94 2544 44 97
African American 2533 37 93 2534 38 96
American Indian 2611 33 > 99 2578 55 98
Asian American 2620 79 > 99 2646 81 98
Hawaiian/Pacific Islander 2314 < 1 > 99 2485 22 90
Multiracial 2593 57 > 99 2571 51 98
Student Gap Group 2536 38 93 2539 40 96

Attachment 2 – 2016 Smarter State Summary – District Performance & Participation Office of Assessment
*Indicates no student in this cell
Page | 28
Capital School District Performance and Participation
Smarter Balanced Grade 3 Mathematics
District Statewide
Group Mean
Scale Score Percent
Proficiency Participation
Rate Mean
Scale Score Percent
Proficient Participation
Rate
All Students 2436 52 99 2444 55 99
Students with Disability 2368 22 99 2382 26 98
ELL 2412 29 > 99 2410 35 > 99
Low-Income 2419 43 98 2416 40 99
White 2460 66 > 99 2468 68 99
Hispanic 2427 44 > 99 2424 44 > 99
African American 2418 42 98 2412 39 99
American Indian 2439 25 > 99 2442 50 98
Asian American 2498 80 > 99 2509 87 99
Hawaiian/Pacific Islander 2449 67 > 99 2458 62 > 99
Multiracial 2465 62 93 2448 56 98
Student Gap Group 2423 44 99 2422 44 99
Capital School District Performance and Participation
Smarter Balanced Grade 4 Mathematics
District Statewide
Group Mean
Scale Score Percent
Proficiency Participation
Rate Mean
Scale Score Percent
Proficient Participation
Rate
All Students 2484 48 98 2485 51 99
Students with Disability 2419 13 98 2416 17 98
ELL 2420 17 > 99 2425 18 99
Low-Income 2464 38 99 2454 34 99
White 2508 64 > 99 2510 65 99
Hispanic 2458 32 > 99 2463 38 > 99
African American 2468 38 97 2452 33 99
American Indian 2505 70 > 99 2489 49 97
Asian American 2549 67 > 99 2555 81 > 99
Hawaiian/Pacific Islander 2588 > 99 > 99 2490 57 88
Multiracial 2474 50 89 2482 49 99
Student Gap Group 2469 40 98 2460 37 99
Attachment 2 – 2016 Smarter State Summary – District Performance & Participation Office of Assessment
*Indicates no student in this cell
Page | 29
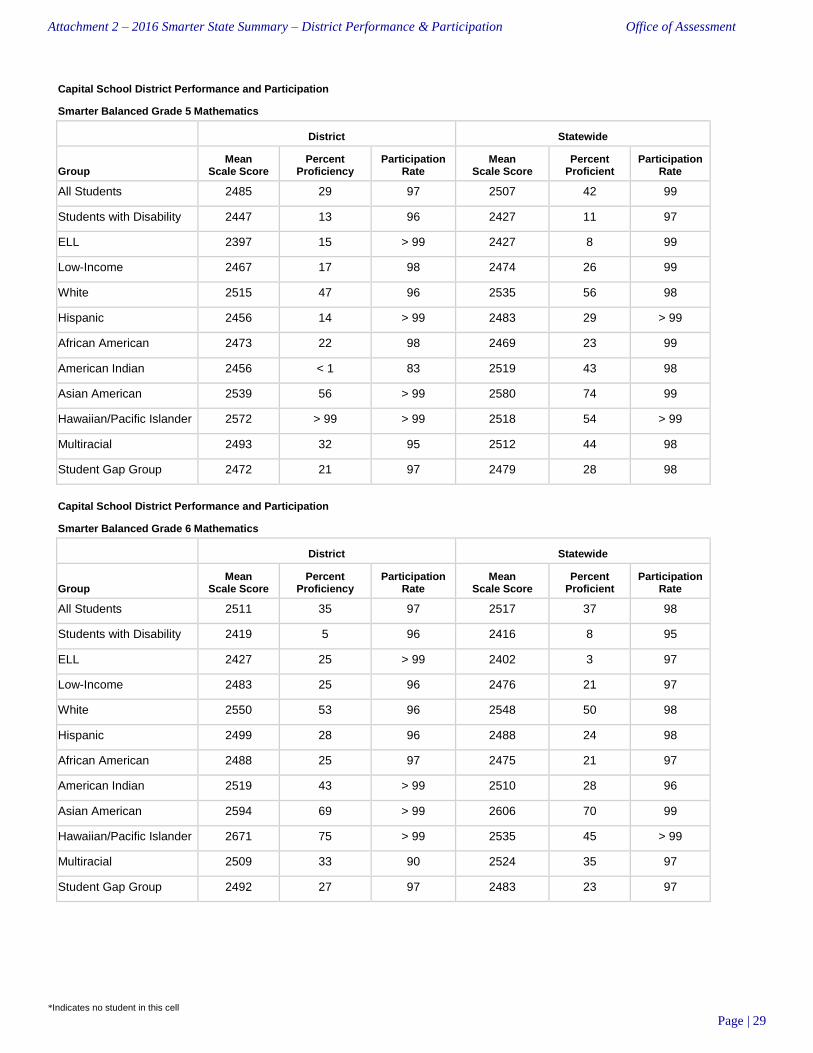
Capital School District Performance and Participation
Smarter Balanced Grade 5 Mathematics
District Statewide
Group Mean
Scale Score Percent
Proficiency Participation
Rate Mean
Scale Score Percent
Proficient Participation
Rate
All Students 2485 29 97 2507 42 99
Students with Disability 2447 13 96 2427 11 97
ELL 2397 15 > 99 2427 8 99
Low-Income 2467 17 98 2474 26 99
White 2515 47 96 2535 56 98
Hispanic 2456 14 > 99 2483 29 > 99
African American 2473 22 98 2469 23 99
American Indian 2456 < 1 83 2519 43 98
Asian American 2539 56 > 99 2580 74 99
Hawaiian/Pacific Islander 2572 > 99 > 99 2518 54 > 99
Multiracial 2493 32 95 2512 44 98
Student Gap Group 2472 21 97 2479 28 98
Capital School District Performance and Participation
Smarter Balanced Grade 6 Mathematics
District Statewide
Group Mean
Scale Score Percent
Proficiency Participation
Rate Mean
Scale Score Percent
Proficient Participation
Rate
All Students 2511 35 97 2517 37 98
Students with Disability 2419 5 96 2416 8 95
ELL 2427 25 > 99 2402 3 97
Low-Income 2483 25 96 2476 21 97
White 2550 53 96 2548 50 98
Hispanic 2499 28 96 2488 24 98
African American 2488 25 97 2475 21 97
American Indian 2519 43 > 99 2510 28 96
Asian American 2594 69 > 99 2606 70 99
Hawaiian/Pacific Islander 2671 75 > 99 2535 45 > 99
Multiracial 2509 33 90 2524 35 97
Student Gap Group 2492 27 97 2483 23 97

Attachment 2 – 2016 Smarter State Summary – District Performance & Participation Office of Assessment
*Indicates no student in this cell
Page | 30
Capital School District Performance and Participation
Smarter Balanced Grade 7 Mathematics
District Statewide
Group Mean
Scale Score Percent
Proficiency Participation
Rate Mean
Scale Score Percent
Proficient Participation
Rate
All Students 2497 21 96 2535 40 98
Students with Disability 2411 5 97 2428 8 95
ELL 2401 < 1 > 99 2422 7 97
Low-Income 2470 11 94 2490 22 96
White 2527 34 99 2566 52 98
Hispanic 2463 7 98 2506 29 98
African American 2484 16 94 2489 21 96
American Indian 2437 20 > 99 2560 55 > 99
Asian American 2569 45 > 99 2640 77 98
Hawaiian/Pacific Islander * * * 2531 40 > 99
Multiracial 2500 18 > 99 2545 38 96
Student Gap Group 2478 14 95 2499 26 97
Capital School District Performance and Participation
Smarter Balanced Grade 8 Mathematics
District Statewide
Group Mean
Scale Score Percent
Proficiency Participation
Rate Mean
Scale Score Percent
Proficient Participation
Rate
All Students 2522 27 95 2549 38 97
Students with Disability 2434 4 97 2437 6 96
ELL 2405 6 89 2438 9 96
Low-Income 2501 21 94 2500 20 95
White 2564 39 > 99 2584 51 97
Hispanic 2488 16 95 2518 25 98
African American 2497 20 93 2501 20 96
American Indian 2552 50 > 99 2547 41 96
Asian American 2631 64 > 99 2659 74 98
Hawaiian/Pacific Islander 2256 < 1 > 99 2470 33 90
Multiracial 2530 29 > 99 2555 40 98
Student Gap Group 2500 21 94 2509 23 96

Attachment 2 – 2016 Smarter State Summary – District Performance & Participation Office of Assessment
*Indicates no student in this cell
Page | 31
Christina School District Performance and Participation
Smarter Balanced Grade 3 ELA
District Statewide
Group Mean
Scale Score Percent
Proficiency Participation
Rate Mean
Scale Score Percent
Proficient Participation
Rate
All Students 2420 43 98 2440 54 99
Students with Disability 2347 10 97 2373 22 98
ELL 2394 29 99 2391 28 > 99
Low-Income 2394 31 99 2408 38 99
White 2451 56 98 2465 66 99
Hispanic 2411 38 99 2415 41 > 99
African American 2394 32 98 2409 39 99
American Indian 2426 67 > 99 2439 58 98
Asian American 2489 81 99 2497 80 > 99
Hawaiian/Pacific Islander * * * 2454 62 > 99
Multiracial 2431 53 99 2447 57 99
Student Gap Group 2404 36 98 2416 42 99
Christina School District Performance and Participation
Smarter Balanced Grade 4 ELA
District Statewide
Group Mean
Scale Score Percent
Proficiency Participation
Rate Mean
Scale Score Percent
Proficient Participation
Rate
All Students 2459 46 98 2483 56 99
Students with Disability 2374 11 94 2400 19 98
ELL 2383 14 98 2402 16 > 99
Low-Income 2433 35 99 2446 39 99
White 2493 61 97 2510 68 99
Hispanic 2440 38 99 2456 43 > 99
African American 2432 35 98 2449 41 99
American Indian 2614 > 99 > 99 2484 62 97
Asian American 2522 65 98 2551 82 > 99
Hawaiian/Pacific Islander * * * 2477 50 88
Multiracial 2472 53 98 2482 57 > 99
Student Gap Group 2439 37 98 2454 43 99

Attachment 2 – 2016 Smarter State Summary – District Performance & Participation Office of Assessment
*Indicates no student in this cell
Page | 32
Christina School District Performance and Participation
Smarter Balanced Grade 5 ELA
District Statewide
Group Mean
Scale Score Percent
Proficiency Participation
Rate Mean
Scale Score Percent
Proficient Participation
Rate
All Students 2493 49 98 2519 60 99
Students with Disability 2402 12 98 2431 20 98
ELL 2412 9 97 2418 13 99
Low-Income 2466 37 99 2485 44 99
White 2526 64 98 2547 73 98
Hispanic 2472 38 99 2493 49 > 99
African American 2473 41 98 2485 44 99
American Indian 2498 67 > 99 2536 67 98
Asian American 2549 66 98 2585 85 > 99
Hawaiian/Pacific Islander 2572 > 99 > 99 2556 83 > 99
Multiracial 2498 54 96 2525 64 99
Student Gap Group 2476 41 98 2492 48 99
Christina School District Performance and Participation
Smarter Balanced Grade 6 ELA
District Statewide
Group Mean
Scale Score Percent
Proficiency Participation
Rate Mean
Scale Score Percent
Proficient Participation
Rate
All Students 2474 28 98 2531 52 98
Students with Disability 2395 2 97 2439 11 96
ELL 2383 4 96 2416 7 96
Low-Income 2454 20 98 2493 35 97
White 2501 38 99 2557 65 98
Hispanic 2461 21 > 99 2506 40 98
African American 2457 21 97 2495 35 97
American Indian * * * 2526 47 96
Asian American 2533 62 93 2604 82 98
Hawaiian/Pacific Islander 2413 50 > 99 2534 73 > 99
Multiracial 2475 22 > 99 2537 51 97
Student Gap Group 2459 22 98 2501 38 97

Attachment 2 – 2016 Smarter State Summary – District Performance & Participation Office of Assessment
*Indicates no student in this cell
Page | 33
Christina School District Performance and Participation
Smarter Balanced Grade 7 ELA
District Statewide
Group Mean
Scale Score Percent
Proficiency Participation
Rate Mean
Scale Score Percent
Proficient Participation
Rate
All Students 2504 32 95 2553 53 98
Students with Disability 2422 5 91 2455 12 95
ELL 2409 4 98 2434 6 97
Low-Income 2476 20 92 2511 35 96
White 2537 45 96 2580 65 98
Hispanic 2488 26 97 2528 42 98
African American 2482 24 92 2515 36 96
American Indian 2575 75 > 99 2581 67 98
Asian American 2576 67 96 2635 83 98
Hawaiian/Pacific Islander * * * 2536 30 > 99
Multiracial 2529 47 94 2568 63 97
Student Gap Group 2486 25 94 2521 39 97
Christina School District Performance and Participation
Smarter Balanced Grade 8 ELA
District Statewide
Group Mean
Scale Score Percent
Proficiency Participation
Rate Mean
Scale Score Percent
Proficient Participation
Rate
All Students 2509 28 96 2571 54 97
Students with Disability 2432 3 93 2470 11 95
ELL 2433 8 96 2452 8 94
Low-Income 2489 20 93 2531 36 95
White 2543 42 96 2598 67 97
Hispanic 2501 24 98 2544 44 97
African American 2487 20 94 2534 38 96
American Indian 2542 33 > 99 2578 55 98
Asian American 2562 55 95 2646 81 98
Hawaiian/Pacific Islander 2425 < 1 67 2485 22 90
Multiracial 2489 17 96 2571 51 98
Student Gap Group 2494 21 95 2539 40 96

Attachment 2 – 2016 Smarter State Summary – District Performance & Participation Office of Assessment
*Indicates no student in this cell
Page | 34
Christina School District Performance and Participation
Smarter Balanced Grade 3 Mathematics
District Statewide
Group Mean
Scale Score Percent
Proficiency Participation
Rate Mean
Scale Score Percent
Proficient Participation
Rate
All Students 2430 48 98 2444 55 99
Students with Disability 2364 18 97 2382 26 98
ELL 2418 39 98 2410 35 > 99
Low-Income 2406 35 98 2416 40 99
White 2459 61 97 2468 68 99
Hispanic 2427 46 99 2424 44 > 99
African American 2402 35 98 2412 39 99
American Indian 2448 33 > 99 2442 50 98
Asian American 2508 84 96 2509 87 99
Hawaiian/Pacific Islander * * * 2458 62 > 99
Multiracial 2436 50 99 2448 56 98
Student Gap Group 2416 41 98 2422 44 99
Christina School District Performance and Participation
Smarter Balanced Grade 4 Mathematics
District Statewide
Group Mean
Scale Score Percent
Proficiency Participation
Rate Mean
Scale Score Percent
Proficient Participation
Rate
All Students 2464 39 98 2485 51 99
Students with Disability 2395 8 94 2416 17 98
ELL 2414 15 95 2425 18 99
Low-Income 2440 25 98 2454 34 99
White 2495 55 97 2510 65 99
Hispanic 2452 31 98 2463 38 > 99
African American 2436 24 98 2452 33 99
American Indian 2539 > 99 > 99 2489 49 97
Asian American 2526 70 98 2555 81 > 99
Hawaiian/Pacific Islander * * * 2490 57 88
Multiracial 2473 45 98 2482 49 99
Student Gap Group 2446 29 97 2460 37 99

Attachment 2 – 2016 Smarter State Summary – District Performance & Participation Office of Assessment
*Indicates no student in this cell
Page | 35
Christina School District Performance and Participation
Smarter Balanced Grade 5 Mathematics
District Statewide
Group Mean
Scale Score Percent
Proficiency Participation
Rate Mean
Scale Score Percent
Proficient Participation
Rate
All Students 2482 30 98 2507 42 99
Students with Disability 2401 6 98 2427 11 97
ELL 2433 10 96 2427 8 99
Low-Income 2454 20 98 2474 26 99
White 2514 44 97 2535 56 98
Hispanic 2468 23 99 2483 29 > 99
African American 2456 20 98 2469 23 99
American Indian 2474 33 > 99 2519 43 98
Asian American 2559 61 98 2580 74 99
Hawaiian/Pacific Islander 2515 50 > 99 2518 54 > 99
Multiracial 2490 30 95 2512 44 98
Student Gap Group 2465 23 98 2479 28 98
Christina School District Performance and Participation
Smarter Balanced Grade 6 Mathematics
District Statewide
Group Mean
Scale Score Percent
Proficiency Participation
Rate Mean
Scale Score Percent
Proficient Participation
Rate
All Students 2467 18 97 2517 37 98
Students with Disability 2379 2 96 2416 8 95
ELL 2388 2 97 2402 3 97
Low-Income 2444 11 97 2476 21 97
White 2502 29 99 2548 50 98
Hispanic 2456 13 > 99 2488 24 98
African American 2441 10 96 2475 21 97
American Indian * * * 2510 28 96
Asian American 2540 49 93 2606 70 99
Hawaiian/Pacific Islander 2433 50 > 99 2535 45 > 99
Multiracial 2462 16 97 2524 35 97
Student Gap Group 2451 13 97 2483 23 97
Attachment 2 – 2016 Smarter State Summary – District Performance & Participation Office of Assessment
*Indicates no student in this cell
Page | 36
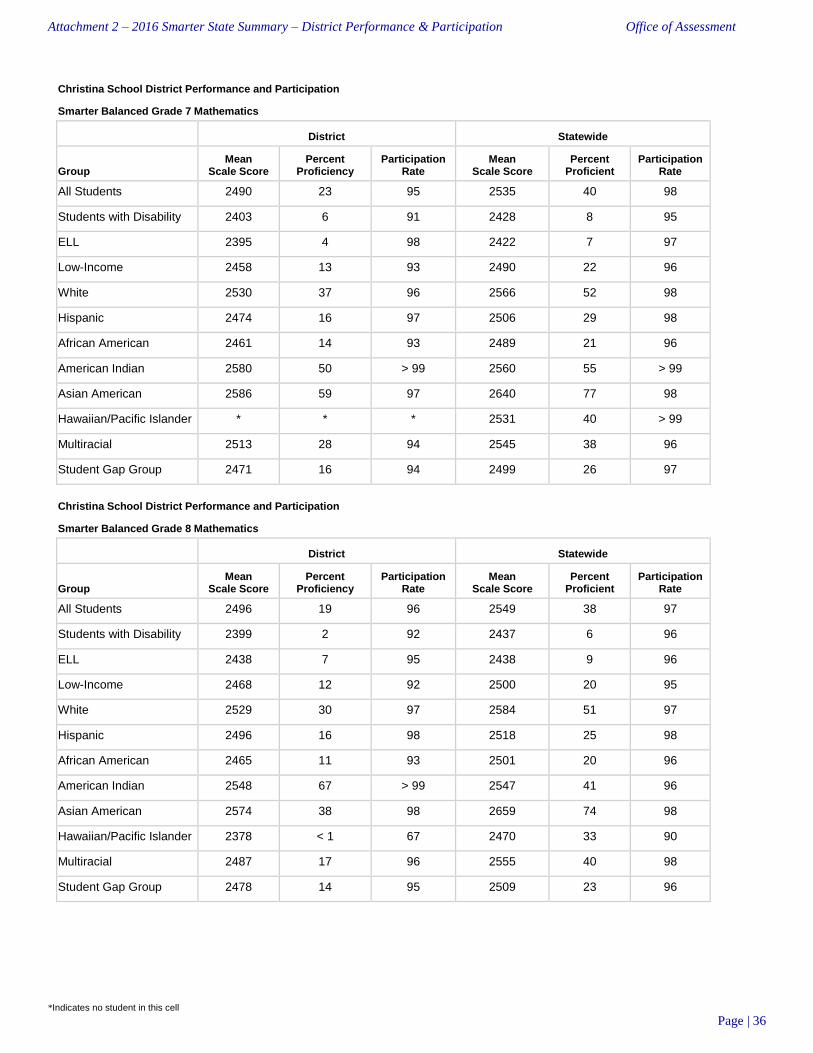
Christina School District Performance and Participation
Smarter Balanced Grade 7 Mathematics
District Statewide
Group Mean
Scale Score Percent
Proficiency Participation
Rate Mean
Scale Score Percent
Proficient Participation
Rate
All Students 2490 23 95 2535 40 98
Students with Disability 2403 6 91 2428 8 95
ELL 2395 4 98 2422 7 97
Low-Income 2458 13 93 2490 22 96
White 2530 37 96 2566 52 98
Hispanic 2474 16 97 2506 29 98
African American 2461 14 93 2489 21 96
American Indian 2580 50 > 99 2560 55 > 99
Asian American 2586 59 97 2640 77 98
Hawaiian/Pacific Islander * * * 2531 40 > 99
Multiracial 2513 28 94 2545 38 96
Student Gap Group 2471 16 94 2499 26 97
Christina School District Performance and Participation
Smarter Balanced Grade 8 Mathematics
District Statewide
Group Mean
Scale Score Percent
Proficiency Participation
Rate Mean
Scale Score Percent
Proficient Participation
Rate
All Students 2496 19 96 2549 38 97
Students with Disability 2399 2 92 2437 6 96
ELL 2438 7 95 2438 9 96
Low-Income 2468 12 92 2500 20 95
White 2529 30 97 2584 51 97
Hispanic 2496 16 98 2518 25 98
African American 2465 11 93 2501 20 96
American Indian 2548 67 > 99 2547 41 96
Asian American 2574 38 98 2659 74 98
Hawaiian/Pacific Islander 2378 < 1 67 2470 33 90
Multiracial 2487 17 96 2555 40 98
Student Gap Group 2478 14 95 2509 23 96

Attachment 2 – 2016 Smarter State Summary – District Performance & Participation Office of Assessment
*Indicates no student in this cell
Page | 37
Colonial School District Performance and Participation
Smarter Balanced Grade 3 ELA
District Statewide
Group Mean
Scale Score Percent
Proficiency Participation
Rate Mean
Scale Score Percent
Proficient Participation
Rate
All Students 2420 43 > 99 2440 54 99
Students with Disability 2346 8 > 99 2373 22 98
ELL 2388 21 > 99 2391 28 > 99
Low-Income 2401 30 99 2408 38 99
White 2434 52 > 99 2465 66 99
Hispanic 2411 36 > 99 2415 41 > 99
African American 2413 39 99 2409 39 99
American Indian 2396 50 > 99 2439 58 98
Asian American 2446 64 96 2497 80 > 99
Hawaiian/Pacific Islander 2369 < 1 > 99 2454 62 > 99
Multiracial 2418 35 95 2447 57 99
Student Gap Group 2411 38 99 2416 42 99
Colonial School District Performance and Participation
Smarter Balanced Grade 4 ELA
District Statewide
Group Mean
Scale Score Percent
Proficiency Participation
Rate Mean
Scale Score Percent
Proficient Participation
Rate
All Students 2470 50 > 99 2483 56 99
Students with Disability 2386 11 98 2400 19 98
ELL 2409 11 99 2402 16 > 99
Low-Income 2455 40 98 2446 39 99
White 2478 54 > 99 2510 68 99
Hispanic 2459 41 > 99 2456 43 > 99
African American 2469 50 99 2449 41 99
American Indian * * * 2484 62 97
Asian American 2519 75 > 99 2551 82 > 99
Hawaiian/Pacific Islander 2275 < 1 50 2477 50 88
Multiracial 2446 40 > 99 2482 57 > 99
Student Gap Group 2461 45 99 2454 43 99
Attachment 2 – 2016 Smarter State Summary – District Performance & Participation Office of Assessment
*Indicates no student in this cell
Page | 38
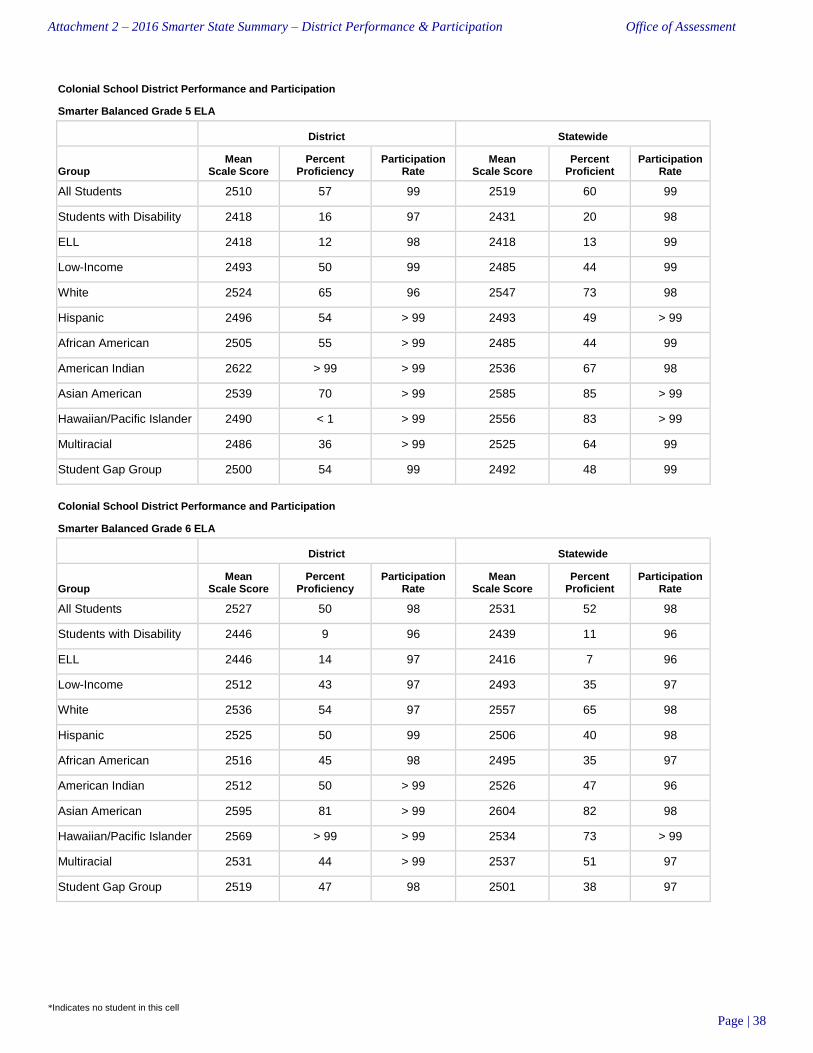
Colonial School District Performance and Participation
Smarter Balanced Grade 5 ELA
District Statewide
Group Mean
Scale Score Percent
Proficiency Participation
Rate Mean
Scale Score Percent
Proficient Participation
Rate
All Students 2510 57 99 2519 60 99
Students with Disability 2418 16 97 2431 20 98
ELL 2418 12 98 2418 13 99
Low-Income 2493 50 99 2485 44 99
White 2524 65 96 2547 73 98
Hispanic 2496 54 > 99 2493 49 > 99
African American 2505 55 > 99 2485 44 99
American Indian 2622 > 99 > 99 2536 67 98
Asian American 2539 70 > 99 2585 85 > 99
Hawaiian/Pacific Islander 2490 < 1 > 99 2556 83 > 99
Multiracial 2486 36 > 99 2525 64 99
Student Gap Group 2500 54 99 2492 48 99
Colonial School District Performance and Participation
Smarter Balanced Grade 6 ELA
District Statewide
Group Mean
Scale Score Percent
Proficiency Participation
Rate Mean
Scale Score Percent
Proficient Participation
Rate
All Students 2527 50 98 2531 52 98
Students with Disability 2446 9 96 2439 11 96
ELL 2446 14 97 2416 7 96
Low-Income 2512 43 97 2493 35 97
White 2536 54 97 2557 65 98
Hispanic 2525 50 99 2506 40 98
African American 2516 45 98 2495 35 97
American Indian 2512 50 > 99 2526 47 96
Asian American 2595 81 > 99 2604 82 98
Hawaiian/Pacific Islander 2569 > 99 > 99 2534 73 > 99
Multiracial 2531 44 > 99 2537 51 97
Student Gap Group 2519 47 98 2501 38 97
Attachment 2 – 2016 Smarter State Summary – District Performance & Participation Office of Assessment
*Indicates no student in this cell
Page | 39
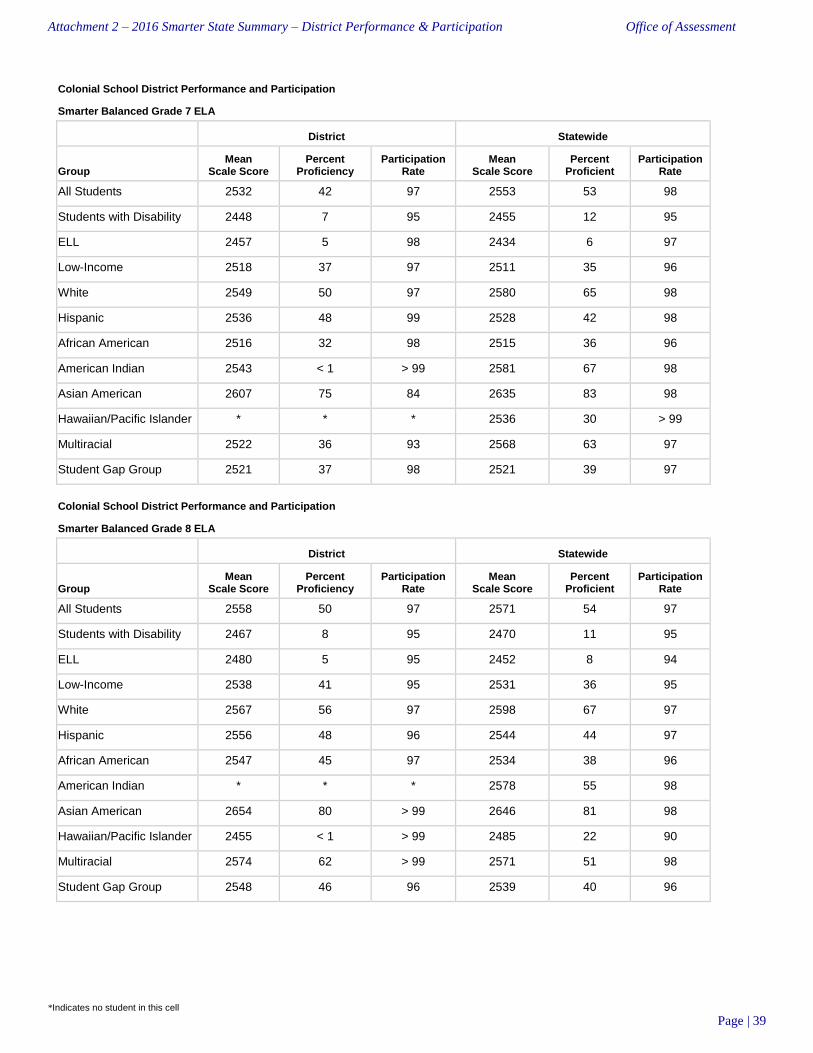
Colonial School District Performance and Participation
Smarter Balanced Grade 7 ELA
District Statewide
Group Mean
Scale Score Percent
Proficiency Participation
Rate Mean
Scale Score Percent
Proficient Participation
Rate
All Students 2532 42 97 2553 53 98
Students with Disability 2448 7 95 2455 12 95
ELL 2457 5 98 2434 6 97
Low-Income 2518 37 97 2511 35 96
White 2549 50 97 2580 65 98
Hispanic 2536 48 99 2528 42 98
African American 2516 32 98 2515 36 96
American Indian 2543 < 1 > 99 2581 67 98
Asian American 2607 75 84 2635 83 98
Hawaiian/Pacific Islander * * * 2536 30 > 99
Multiracial 2522 36 93 2568 63 97
Student Gap Group 2521 37 98 2521 39 97
Colonial School District Performance and Participation
Smarter Balanced Grade 8 ELA
District Statewide
Group Mean
Scale Score Percent
Proficiency Participation
Rate Mean
Scale Score Percent
Proficient Participation
Rate
All Students 2558 50 97 2571 54 97
Students with Disability 2467 8 95 2470 11 95
ELL 2480 5 95 2452 8 94
Low-Income 2538 41 95 2531 36 95
White 2567 56 97 2598 67 97
Hispanic 2556 48 96 2544 44 97
African American 2547 45 97 2534 38 96
American Indian * * * 2578 55 98
Asian American 2654 80 > 99 2646 81 98
Hawaiian/Pacific Islander 2455 < 1 > 99 2485 22 90
Multiracial 2574 62 > 99 2571 51 98
Student Gap Group 2548 46 96 2539 40 96
Attachment 2 – 2016 Smarter State Summary – District Performance & Participation Office of Assessment
*Indicates no student in this cell
Page | 40
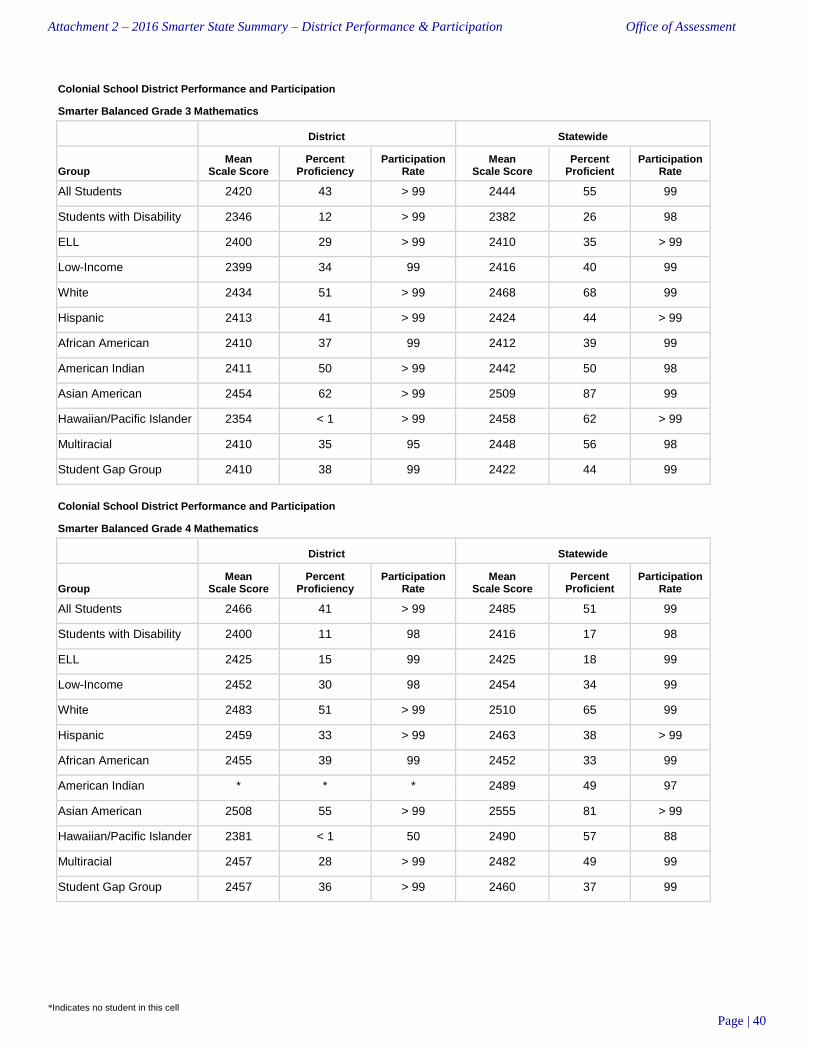
Colonial School District Performance and Participation
Smarter Balanced Grade 3 Mathematics
District Statewide
Group Mean
Scale Score Percent
Proficiency Participation
Rate Mean
Scale Score Percent
Proficient Participation
Rate
All Students 2420 43 > 99 2444 55 99
Students with Disability 2346 12 > 99 2382 26 98
ELL 2400 29 > 99 2410 35 > 99
Low-Income 2399 34 99 2416 40 99
White 2434 51 > 99 2468 68 99
Hispanic 2413 41 > 99 2424 44 > 99
African American 2410 37 99 2412 39 99
American Indian 2411 50 > 99 2442 50 98
Asian American 2454 62 > 99 2509 87 99
Hawaiian/Pacific Islander 2354 < 1 > 99 2458 62 > 99
Multiracial 2410 35 95 2448 56 98
Student Gap Group 2410 38 99 2422 44 99
Colonial School District Performance and Participation
Smarter Balanced Grade 4 Mathematics
District Statewide
Group Mean
Scale Score Percent
Proficiency Participation
Rate Mean
Scale Score Percent
Proficient Participation
Rate
All Students 2466 41 > 99 2485 51 99
Students with Disability 2400 11 98 2416 17 98
ELL 2425 15 99 2425 18 99
Low-Income 2452 30 98 2454 34 99
White 2483 51 > 99 2510 65 99
Hispanic 2459 33 > 99 2463 38 > 99
African American 2455 39 99 2452 33 99
American Indian * * * 2489 49 97
Asian American 2508 55 > 99 2555 81 > 99
Hawaiian/Pacific Islander 2381 < 1 50 2490 57 88
Multiracial 2457 28 > 99 2482 49 99
Student Gap Group 2457 36 > 99 2460 37 99
Attachment 2 – 2016 Smarter State Summary – District Performance & Participation Office of Assessment
*Indicates no student in this cell
Page | 41
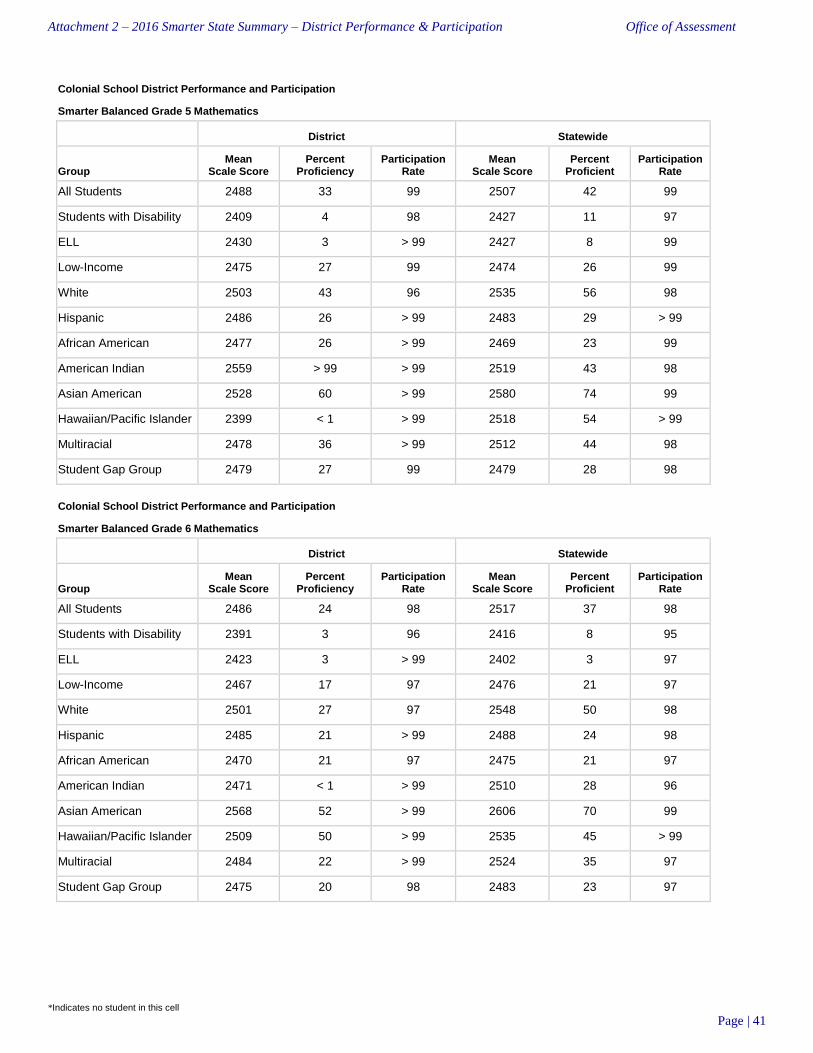
Colonial School District Performance and Participation
Smarter Balanced Grade 5 Mathematics
District Statewide
Group Mean
Scale Score Percent
Proficiency Participation
Rate Mean
Scale Score Percent
Proficient Participation
Rate
All Students 2488 33 99 2507 42 99
Students with Disability 2409 4 98 2427 11 97
ELL 2430 3 > 99 2427 8 99
Low-Income 2475 27 99 2474 26 99
White 2503 43 96 2535 56 98
Hispanic 2486 26 > 99 2483 29 > 99
African American 2477 26 > 99 2469 23 99
American Indian 2559 > 99 > 99 2519 43 98
Asian American 2528 60 > 99 2580 74 99
Hawaiian/Pacific Islander 2399 < 1 > 99 2518 54 > 99
Multiracial 2478 36 > 99 2512 44 98
Student Gap Group 2479 27 99 2479 28 98
Colonial School District Performance and Participation
Smarter Balanced Grade 6 Mathematics
District Statewide
Group Mean
Scale Score Percent
Proficiency Participation
Rate Mean
Scale Score Percent
Proficient Participation
Rate
All Students 2486 24 98 2517 37 98
Students with Disability 2391 3 96 2416 8 95
ELL 2423 3 > 99 2402 3 97
Low-Income 2467 17 97 2476 21 97
White 2501 27 97 2548 50 98
Hispanic 2485 21 > 99 2488 24 98
African American 2470 21 97 2475 21 97
American Indian 2471 < 1 > 99 2510 28 96
Asian American 2568 52 > 99 2606 70 99
Hawaiian/Pacific Islander 2509 50 > 99 2535 45 > 99
Multiracial 2484 22 > 99 2524 35 97
Student Gap Group 2475 20 98 2483 23 97
Attachment 2 – 2016 Smarter State Summary – District Performance & Participation Office of Assessment
*Indicates no student in this cell
Page | 42
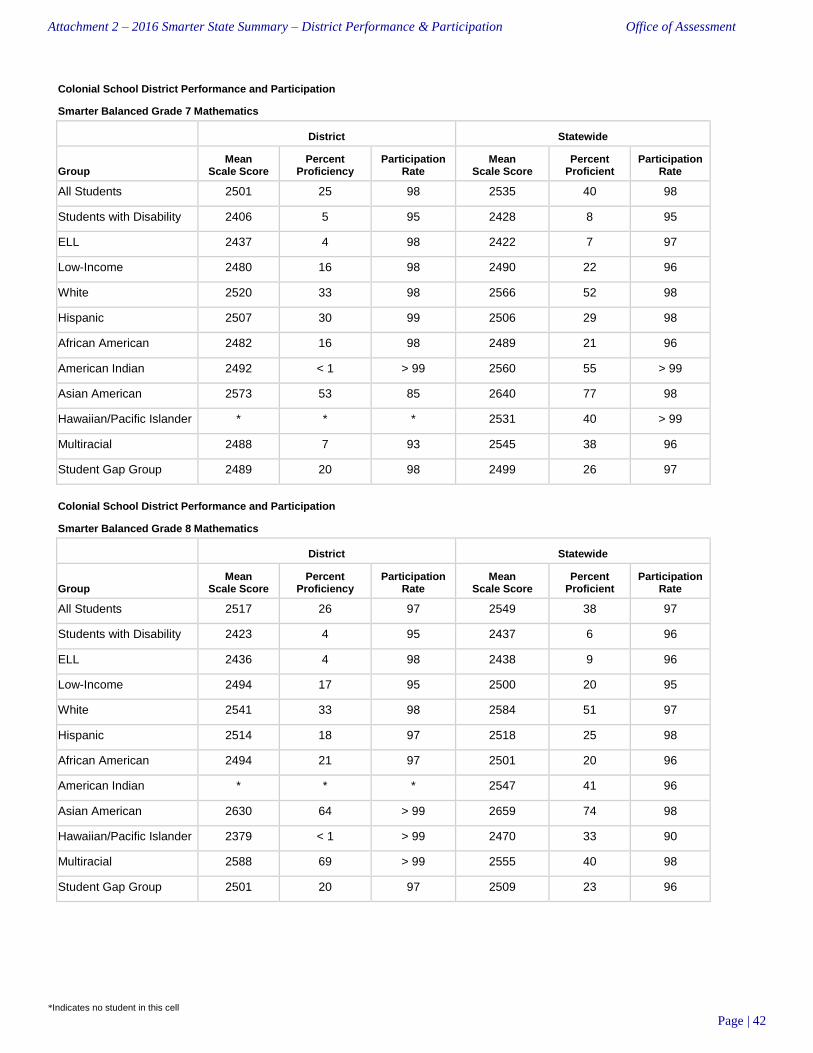
Colonial School District Performance and Participation
Smarter Balanced Grade 7 Mathematics
District Statewide
Group Mean
Scale Score Percent
Proficiency Participation
Rate Mean
Scale Score Percent
Proficient Participation
Rate
All Students 2501 25 98 2535 40 98
Students with Disability 2406 5 95 2428 8 95
ELL 2437 4 98 2422 7 97
Low-Income 2480 16 98 2490 22 96
White 2520 33 98 2566 52 98
Hispanic 2507 30 99 2506 29 98
African American 2482 16 98 2489 21 96
American Indian 2492 < 1 > 99 2560 55 > 99
Asian American 2573 53 85 2640 77 98
Hawaiian/Pacific Islander * * * 2531 40 > 99
Multiracial 2488 7 93 2545 38 96
Student Gap Group 2489 20 98 2499 26 97
Colonial School District Performance and Participation
Smarter Balanced Grade 8 Mathematics
District Statewide
Group Mean
Scale Score Percent
Proficiency Participation
Rate Mean
Scale Score Percent
Proficient Participation
Rate
All Students 2517 26 97 2549 38 97
Students with Disability 2423 4 95 2437 6 96
ELL 2436 4 98 2438 9 96
Low-Income 2494 17 95 2500 20 95
White 2541 33 98 2584 51 97
Hispanic 2514 18 97 2518 25 98
African American 2494 21 97 2501 20 96
American Indian * * * 2547 41 96
Asian American 2630 64 > 99 2659 74 98
Hawaiian/Pacific Islander 2379 < 1 > 99 2470 33 90
Multiracial 2588 69 > 99 2555 40 98
Student Gap Group 2501 20 97 2509 23 96

Attachment 2 – 2016 Smarter State Summary – District Performance & Participation Office of Assessment
*Indicates no student in this cell
Page | 43
Delmar School District Performance and Participation
Smarter Balanced Grade 5 ELA
District Statewide
Group Mean
Scale Score Percent
Proficiency Participation
Rate Mean
Scale Score Percent
Proficient Participation
Rate
All Students 2513 59 99 2519 60 99
Students with Disability 2466 29 > 99 2431 20 98
ELL 2458 33 > 99 2418 13 99
Low-Income 2473 45 97 2485 44 99
White 2524 63 > 99 2547 73 98
Hispanic 2475 47 > 99 2493 49 > 99
African American 2499 50 94 2485 44 99
American Indian * * * 2536 67 98
Asian American 2526 67 > 99 2585 85 > 99
Hawaiian/Pacific Islander * * * 2556 83 > 99
Multiracial 2375 < 1 > 99 2525 64 99
Student Gap Group 2487 48 99 2492 48 99
Delmar School District Performance and Participation
Smarter Balanced Grade 6 ELA
District Statewide
Group Mean
Scale Score Percent
Proficiency Participation
Rate Mean
Scale Score Percent
Proficient Participation
Rate
All Students 2512 42 > 99 2531 52 98
Students with Disability 2437 9 > 99 2439 11 96
ELL 2481 50 > 99 2416 7 96
Low-Income 2481 26 > 99 2493 35 97
White 2519 45 > 99 2557 65 98
Hispanic 2531 73 > 99 2506 40 98
African American 2474 23 > 99 2495 35 97
American Indian 2601 > 99 > 99 2526 47 96
Asian American 2570 67 > 99 2604 82 98
Hawaiian/Pacific Islander * * * 2534 73 > 99
Multiracial 2468 11 > 99 2537 51 97
Student Gap Group 2486 33 > 99 2501 38 97
Attachment 2 – 2016 Smarter State Summary – District Performance & Participation Office of Assessment
*Indicates no student in this cell
Page | 44
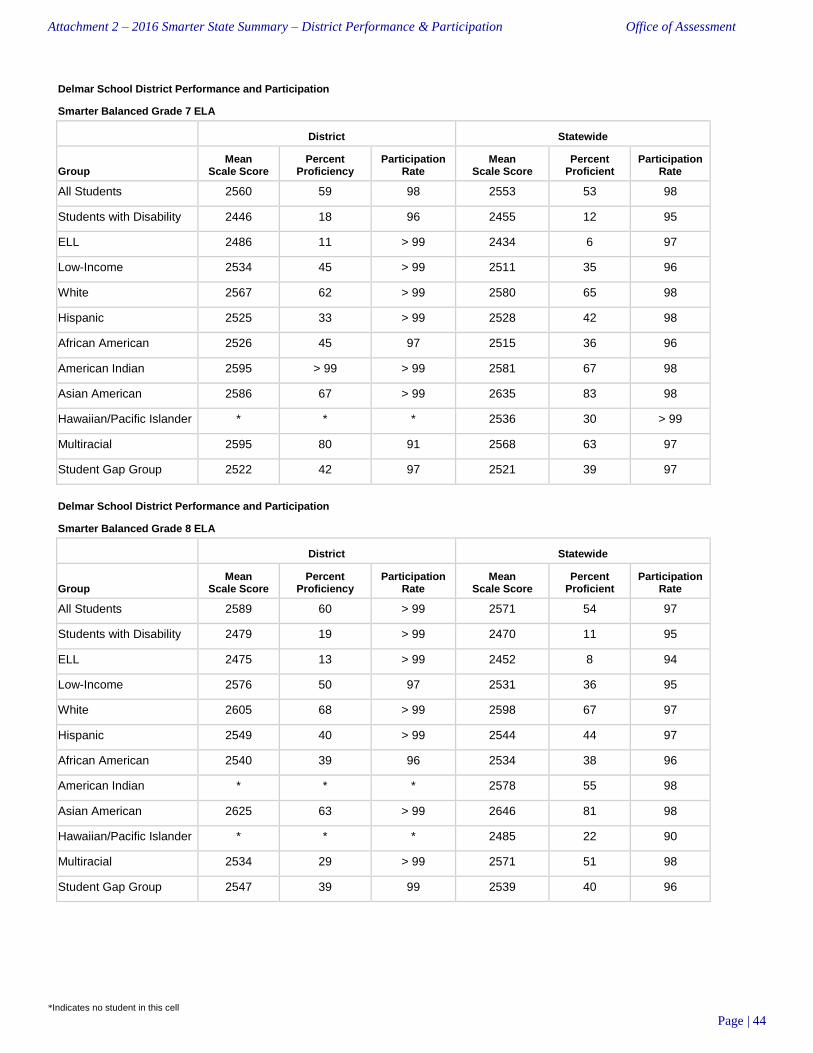
Delmar School District Performance and Participation
Smarter Balanced Grade 7 ELA
District Statewide
Group Mean
Scale Score Percent
Proficiency Participation
Rate Mean
Scale Score Percent
Proficient Participation
Rate
All Students 2560 59 98 2553 53 98
Students with Disability 2446 18 96 2455 12 95
ELL 2486 11 > 99 2434 6 97
Low-Income 2534 45 > 99 2511 35 96
White 2567 62 > 99 2580 65 98
Hispanic 2525 33 > 99 2528 42 98
African American 2526 45 97 2515 36 96
American Indian 2595 > 99 > 99 2581 67 98
Asian American 2586 67 > 99 2635 83 98
Hawaiian/Pacific Islander * * * 2536 30 > 99
Multiracial 2595 80 91 2568 63 97
Student Gap Group 2522 42 97 2521 39 97
Delmar School District Performance and Participation
Smarter Balanced Grade 8 ELA
District Statewide
Group Mean
Scale Score Percent
Proficiency Participation
Rate Mean
Scale Score Percent
Proficient Participation
Rate
All Students 2589 60 > 99 2571 54 97
Students with Disability 2479 19 > 99 2470 11 95
ELL 2475 13 > 99 2452 8 94
Low-Income 2576 50 97 2531 36 95
White 2605 68 > 99 2598 67 97
Hispanic 2549 40 > 99 2544 44 97
African American 2540 39 96 2534 38 96
American Indian * * * 2578 55 98
Asian American 2625 63 > 99 2646 81 98
Hawaiian/Pacific Islander * * * 2485 22 90
Multiracial 2534 29 > 99 2571 51 98
Student Gap Group 2547 39 99 2539 40 96
Attachment 2 – 2016 Smarter State Summary – District Performance & Participation Office of Assessment
*Indicates no student in this cell
Page | 45
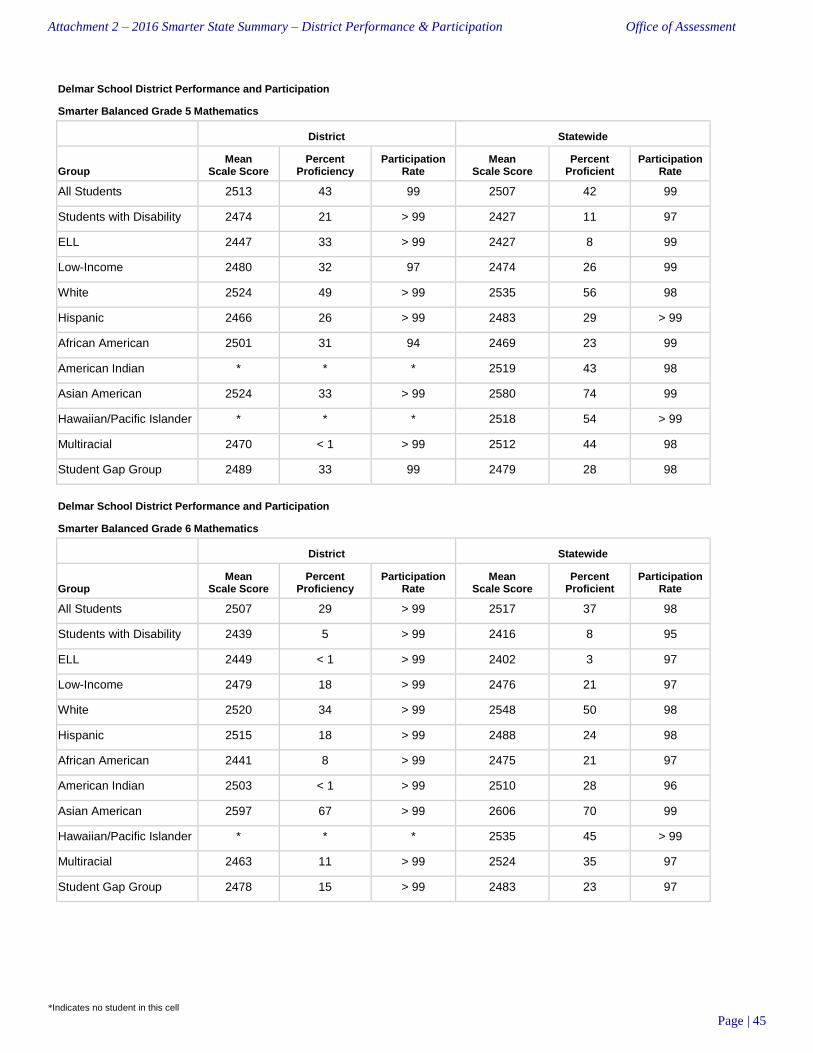
Delmar School District Performance and Participation
Smarter Balanced Grade 5 Mathematics
District Statewide
Group Mean
Scale Score Percent
Proficiency Participation
Rate Mean
Scale Score Percent
Proficient Participation
Rate
All Students 2513 43 99 2507 42 99
Students with Disability 2474 21 > 99 2427 11 97
ELL 2447 33 > 99 2427 8 99
Low-Income 2480 32 97 2474 26 99
White 2524 49 > 99 2535 56 98
Hispanic 2466 26 > 99 2483 29 > 99
African American 2501 31 94 2469 23 99
American Indian * * * 2519 43 98
Asian American 2524 33 > 99 2580 74 99
Hawaiian/Pacific Islander * * * 2518 54 > 99
Multiracial 2470 < 1 > 99 2512 44 98
Student Gap Group 2489 33 99 2479 28 98
Delmar School District Performance and Participation
Smarter Balanced Grade 6 Mathematics
District Statewide
Group Mean
Scale Score Percent
Proficiency Participation
Rate Mean
Scale Score Percent
Proficient Participation
Rate
All Students 2507 29 > 99 2517 37 98
Students with Disability 2439 5 > 99 2416 8 95
ELL 2449 < 1 > 99 2402 3 97
Low-Income 2479 18 > 99 2476 21 97
White 2520 34 > 99 2548 50 98
Hispanic 2515 18 > 99 2488 24 98
African American 2441 8 > 99 2475 21 97
American Indian 2503 < 1 > 99 2510 28 96
Asian American 2597 67 > 99 2606 70 99
Hawaiian/Pacific Islander * * * 2535 45 > 99
Multiracial 2463 11 > 99 2524 35 97
Student Gap Group 2478 15 > 99 2483 23 97
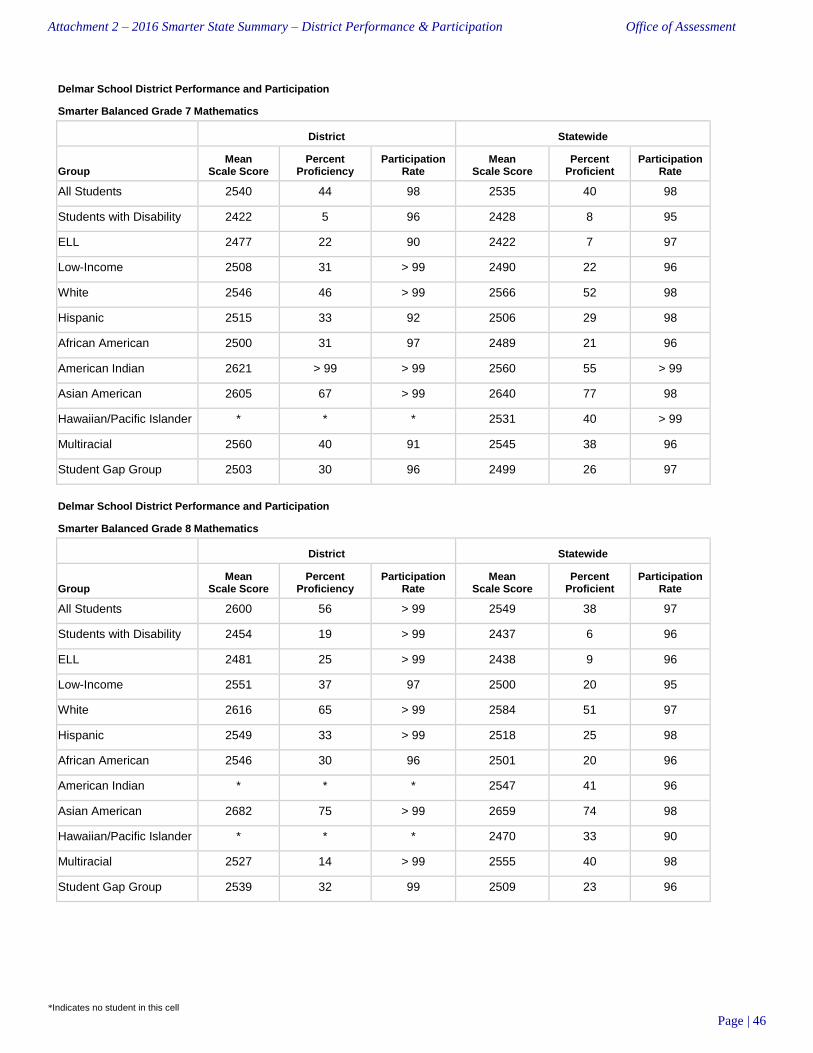
Attachment 2 – 2016 Smarter State Summary – District Performance & Participation Office of Assessment
*Indicates no student in this cell
Page | 46
Delmar School District Performance and Participation
Smarter Balanced Grade 7 Mathematics
District Statewide
Group Mean
Scale Score Percent
Proficiency Participation
Rate Mean
Scale Score Percent
Proficient Participation
Rate
All Students 2540 44 98 2535 40 98
Students with Disability 2422 5 96 2428 8 95
ELL 2477 22 90 2422 7 97
Low-Income 2508 31 > 99 2490 22 96
White 2546 46 > 99 2566 52 98
Hispanic 2515 33 92 2506 29 98
African American 2500 31 97 2489 21 96
American Indian 2621 > 99 > 99 2560 55 > 99
Asian American 2605 67 > 99 2640 77 98
Hawaiian/Pacific Islander * * * 2531 40 > 99
Multiracial 2560 40 91 2545 38 96
Student Gap Group 2503 30 96 2499 26 97
Delmar School District Performance and Participation
Smarter Balanced Grade 8 Mathematics
District Statewide
Group Mean
Scale Score Percent
Proficiency Participation
Rate Mean
Scale Score Percent
Proficient Participation
Rate
All Students 2600 56 > 99 2549 38 97
Students with Disability 2454 19 > 99 2437 6 96
ELL 2481 25 > 99 2438 9 96
Low-Income 2551 37 97 2500 20 95
White 2616 65 > 99 2584 51 97
Hispanic 2549 33 > 99 2518 25 98
African American 2546 30 96 2501 20 96
American Indian * * * 2547 41 96
Asian American 2682 75 > 99 2659 74 98
Hawaiian/Pacific Islander * * * 2470 33 90
Multiracial 2527 14 > 99 2555 40 98
Student Gap Group 2539 32 99 2509 23 96

Attachment 2 – 2016 Smarter State Summary – District Performance & Participation Office of Assessment
*Indicates no student in this cell
Page | 47
Indian River School District Performance and Participation
Smarter Balanced Grade 3 ELA
District Statewide
Group Mean
Scale Score Percent
Proficiency Participation
Rate Mean
Scale Score Percent
Proficient Participation
Rate
All Students 2446 56 > 99 2440 54 99
Students with Disability 2390 28 > 99 2373 22 98
ELL 2389 25 > 99 2391 28 > 99
Low-Income 2418 39 > 99 2408 38 99
White 2469 69 > 99 2465 66 99
Hispanic 2411 37 > 99 2415 41 > 99
African American 2421 42 98 2409 39 99
American Indian 2469 67 > 99 2439 58 98
Asian American 2440 64 > 99 2497 80 > 99
Hawaiian/Pacific Islander 2436 > 99 > 99 2454 62 > 99
Multiracial 2461 63 > 99 2447 57 99
Student Gap Group 2421 43 > 99 2416 42 99
Indian River School District Performance and Participation
Smarter Balanced Grade 4 ELA
District Statewide
Group Mean
Scale Score Percent
Proficiency Participation
Rate Mean
Scale Score Percent
Proficient Participation
Rate
All Students 2490 60 > 99 2483 56 99
Students with Disability 2409 18 > 99 2400 19 98
ELL 2400 11 > 99 2402 16 > 99
Low-Income 2464 47 > 99 2446 39 99
White 2516 72 > 99 2510 68 99
Hispanic 2465 48 > 99 2456 43 > 99
African American 2456 43 > 99 2449 41 99
American Indian 2472 57 > 99 2484 62 97
Asian American 2525 > 99 > 99 2551 82 > 99
Hawaiian/Pacific Islander * * * 2477 50 88
Multiracial 2471 56 > 99 2482 57 > 99
Student Gap Group 2466 48 > 99 2454 43 99

Attachment 2 – 2016 Smarter State Summary – District Performance & Participation Office of Assessment
*Indicates no student in this cell
Page | 48
Indian River School District Performance and Participation
Smarter Balanced Grade 5 ELA
District Statewide
Group Mean
Scale Score Percent
Proficiency Participation
Rate Mean
Scale Score Percent
Proficient Participation
Rate
All Students 2536 69 > 99 2519 60 99
Students with Disability 2465 33 98 2431 20 98
ELL 2418 13 97 2418 13 99
Low-Income 2518 61 > 99 2485 44 99
White 2556 79 > 99 2547 73 98
Hispanic 2512 59 > 99 2493 49 > 99
African American 2505 54 > 99 2485 44 99
American Indian 2535 88 > 99 2536 67 98
Asian American 2614 > 99 > 99 2585 85 > 99
Hawaiian/Pacific Islander 2603 > 99 > 99 2556 83 > 99
Multiracial 2548 74 > 99 2525 64 99
Student Gap Group 2517 61 > 99 2492 48 99
Indian River School District Performance and Participation
Smarter Balanced Grade 6 ELA
District Statewide
Group Mean
Scale Score Percent
Proficiency Participation
Rate Mean
Scale Score Percent
Proficient Participation
Rate
All Students 2554 63 99 2531 52 98
Students with Disability 2457 12 98 2439 11 96
ELL 2423 5 97 2416 7 96
Low-Income 2530 50 98 2493 35 97
White 2573 75 99 2557 65 98
Hispanic 2532 52 > 99 2506 40 98
African American 2520 42 98 2495 35 97
American Indian 2562 67 > 99 2526 47 96
Asian American 2596 67 > 99 2604 82 98
Hawaiian/Pacific Islander * * * 2534 73 > 99
Multiracial 2561 56 > 99 2537 51 97
Student Gap Group 2532 52 98 2501 38 97

Attachment 2 – 2016 Smarter State Summary – District Performance & Participation Office of Assessment
*Indicates no student in this cell
Page | 49
Indian River School District Performance and Participation
Smarter Balanced Grade 7 ELA
District Statewide
Group Mean
Scale Score Percent
Proficiency Participation
Rate Mean
Scale Score Percent
Proficient Participation
Rate
All Students 2571 61 > 99 2553 53 98
Students with Disability 2492 22 99 2455 12 95
ELL 2442 3 > 99 2434 6 97
Low-Income 2546 51 > 99 2511 35 96
White 2590 70 > 99 2580 65 98
Hispanic 2553 55 > 99 2528 42 98
African American 2527 40 > 99 2515 36 96
American Indian 2578 70 > 99 2581 67 98
Asian American 2630 86 > 99 2635 83 98
Hawaiian/Pacific Islander 2440 < 1 > 99 2536 30 > 99
Multiracial 2588 65 > 99 2568 63 97
Student Gap Group 2545 50 > 99 2521 39 97
Indian River School District Performance and Participation
Smarter Balanced Grade 8 ELA
District Statewide
Group Mean
Scale Score Percent
Proficiency Participation
Rate Mean
Scale Score Percent
Proficient Participation
Rate
All Students 2592 65 99 2571 54 97
Students with Disability 2507 19 > 99 2470 11 95
ELL 2452 8 96 2452 8 94
Low-Income 2573 55 99 2531 36 95
White 2609 73 > 99 2598 67 97
Hispanic 2577 60 > 99 2544 44 97
African American 2555 44 97 2534 38 96
American Indian 2591 79 > 99 2578 55 98
Asian American 2642 83 > 99 2646 81 98
Hawaiian/Pacific Islander * * * 2485 22 90
Multiracial 2563 48 95 2571 51 98
Student Gap Group 2571 55 > 99 2539 40 96

Attachment 2 – 2016 Smarter State Summary – District Performance & Participation Office of Assessment
*Indicates no student in this cell
Page | 50
Indian River School District Performance and Participation
Smarter Balanced Grade 3 Mathematics
District Statewide
Group Mean
Scale Score Percent
Proficiency Participation
Rate Mean
Scale Score Percent
Proficient Participation
Rate
All Students 2453 61 > 99 2444 55 99
Students with Disability 2396 28 > 99 2382 26 98
ELL 2419 38 > 99 2410 35 > 99
Low-Income 2431 46 > 99 2416 40 99
White 2472 73 > 99 2468 68 99
Hispanic 2431 48 > 99 2424 44 > 99
African American 2425 42 98 2412 39 99
American Indian 2449 33 > 99 2442 50 98
Asian American 2484 91 > 99 2509 87 99
Hawaiian/Pacific Islander 2377 < 1 > 99 2458 62 > 99
Multiracial 2454 63 > 99 2448 56 98
Student Gap Group 2433 49 > 99 2422 44 99
Indian River School District Performance and Participation
Smarter Balanced Grade 4 Mathematics
District Statewide
Group Mean
Scale Score Percent
Proficiency Participation
Rate Mean
Scale Score Percent
Proficient Participation
Rate
All Students 2497 57 > 99 2485 51 99
Students with Disability 2426 12 > 99 2416 17 98
ELL 2420 12 99 2425 18 99
Low-Income 2477 45 > 99 2454 34 99
White 2517 69 > 99 2510 65 99
Hispanic 2477 46 > 99 2463 38 > 99
African American 2470 41 > 99 2452 33 99
American Indian 2480 29 > 99 2489 49 97
Asian American 2558 > 99 > 99 2555 81 > 99
Hawaiian/Pacific Islander * * * 2490 57 88
Multiracial 2473 48 > 99 2482 49 99
Student Gap Group 2477 46 > 99 2460 37 99

Attachment 2 – 2016 Smarter State Summary – District Performance & Participation Office of Assessment
*Indicates no student in this cell
Page | 51
Indian River School District Performance and Participation
Smarter Balanced Grade 5 Mathematics
District Statewide
Group Mean
Scale Score Percent
Proficiency Participation
Rate Mean
Scale Score Percent
Proficient Participation
Rate
All Students 2529 54 > 99 2507 42 99
Students with Disability 2452 16 98 2427 11 97
ELL 2426 11 95 2427 8 99
Low-Income 2512 44 99 2474 26 99
White 2550 67 > 99 2535 56 98
Hispanic 2511 44 99 2483 29 > 99
African American 2486 25 > 99 2469 23 99
American Indian 2520 50 > 99 2519 43 98
Asian American 2572 75 > 99 2580 74 99
Hawaiian/Pacific Islander 2542 > 99 > 99 2518 54 > 99
Multiracial 2539 58 > 99 2512 44 98
Student Gap Group 2509 43 > 99 2479 28 98
Indian River School District Performance and Participation
Smarter Balanced Grade 6 Mathematics
District Statewide
Group Mean
Scale Score Percent
Proficiency Participation
Rate Mean
Scale Score Percent
Proficient Participation
Rate
All Students 2528 43 99 2517 37 98
Students with Disability 2439 8 98 2416 8 95
ELL 2378 < 1 98 2402 3 97
Low-Income 2505 30 97 2476 21 97
White 2551 53 98 2548 50 98
Hispanic 2498 32 > 99 2488 24 98
African American 2495 24 98 2475 21 97
American Indian 2540 22 > 99 2510 28 96
Asian American 2562 56 > 99 2606 70 99
Hawaiian/Pacific Islander * * * 2535 45 > 99
Multiracial 2552 52 > 99 2524 35 97
Student Gap Group 2502 31 98 2483 23 97

Attachment 2 – 2016 Smarter State Summary – District Performance & Participation Office of Assessment
*Indicates no student in this cell
Page | 52
Indian River School District Performance and Participation
Smarter Balanced Grade 7 Mathematics
District Statewide
Group Mean
Scale Score Percent
Proficiency Participation
Rate Mean
Scale Score Percent
Proficient Participation
Rate
All Students 2547 44 > 99 2535 40 98
Students with Disability 2464 10 99 2428 8 95
ELL 2429 5 > 99 2422 7 97
Low-Income 2521 30 > 99 2490 22 96
White 2571 55 > 99 2566 52 98
Hispanic 2532 34 > 99 2506 29 98
African American 2490 20 > 99 2489 21 96
American Indian 2551 60 > 99 2560 55 > 99
Asian American 2611 79 > 99 2640 77 98
Hawaiian/Pacific Islander 2375 < 1 > 99 2531 40 > 99
Multiracial 2529 24 > 99 2545 38 96
Student Gap Group 2521 31 > 99 2499 26 97
Indian River School District Performance and Participation
Smarter Balanced Grade 8 Mathematics
District Statewide
Group Mean
Scale Score Percent
Proficiency Participation
Rate Mean
Scale Score Percent
Proficient Participation
Rate
All Students 2556 40 98 2549 38 97
Students with Disability 2456 10 98 2437 6 96
ELL 2451 12 96 2438 9 96
Low-Income 2529 27 98 2500 20 95
White 2573 47 99 2584 51 97
Hispanic 2550 38 > 99 2518 25 98
African American 2502 20 96 2501 20 96
American Indian 2529 29 > 99 2547 41 96
Asian American 2601 67 > 99 2659 74 98
Hawaiian/Pacific Islander * * * 2470 33 90
Multiracial 2527 24 95 2555 40 98
Student Gap Group 2533 31 99 2509 23 96

Attachment 2 – 2016 Smarter State Summary – District Performance & Participation Office of Assessment
*Indicates no student in this cell
Page | 53
Lake Forest School District Performance and Participation
Smarter Balanced Grade 3 ELA
District Statewide
Group Mean
Scale Score Percent
Proficiency Participation
Rate Mean
Scale Score Percent
Proficient Participation
Rate
All Students 2465 66 > 99 2440 54 99
Students with Disability 2410 35 > 99 2373 22 98
ELL 2458 67 75 2391 28 > 99
Low-Income 2450 57 > 99 2408 38 99
White 2476 73 > 99 2465 66 99
Hispanic 2450 58 96 2415 41 > 99
African American 2433 48 98 2409 39 99
American Indian 2367 < 1 > 99 2439 58 98
Asian American 2459 > 99 > 99 2497 80 > 99
Hawaiian/Pacific Islander * * * 2454 62 > 99
Multiracial 2470 57 > 99 2447 57 99
Student Gap Group 2443 54 99 2416 42 99
Lake Forest School District Performance and Participation
Smarter Balanced Grade 4 ELA
District Statewide
Group Mean
Scale Score Percent
Proficiency Participation
Rate Mean
Scale Score Percent
Proficient Participation
Rate
All Students 2494 63 > 99 2483 56 99
Students with Disability 2413 19 > 99 2400 19 98
ELL 2393 < 1 > 99 2402 16 > 99
Low-Income 2471 51 > 99 2446 39 99
White 2506 70 > 99 2510 68 99
Hispanic 2457 39 > 99 2456 43 > 99
African American 2471 52 > 99 2449 41 99
American Indian 2547 > 99 > 99 2484 62 97
Asian American 2598 > 99 > 99 2551 82 > 99
Hawaiian/Pacific Islander * * * 2477 50 88
Multiracial 2464 52 > 99 2482 57 > 99
Student Gap Group 2469 49 > 99 2454 43 99
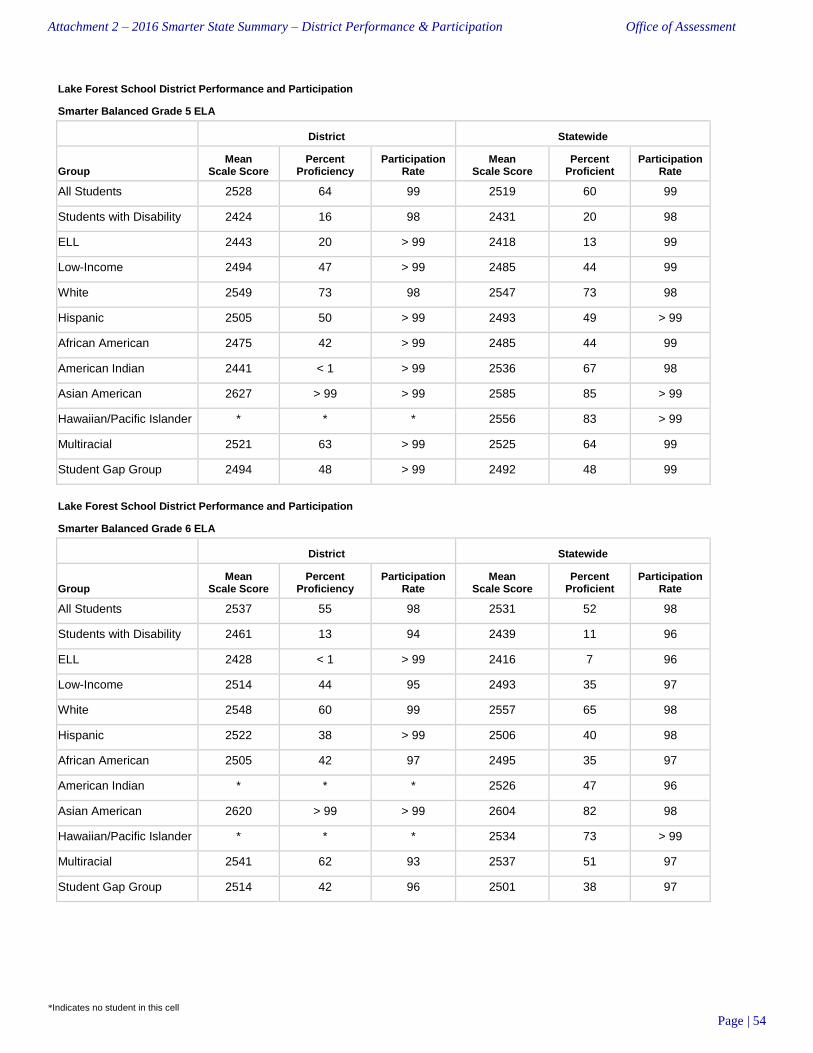
Attachment 2 – 2016 Smarter State Summary – District Performance & Participation Office of Assessment
*Indicates no student in this cell
Page | 54
Lake Forest School District Performance and Participation
Smarter Balanced Grade 5 ELA
District Statewide
Group Mean
Scale Score Percent
Proficiency Participation
Rate Mean
Scale Score Percent
Proficient Participation
Rate
All Students 2528 64 99 2519 60 99
Students with Disability 2424 16 98 2431 20 98
ELL 2443 20 > 99 2418 13 99
Low-Income 2494 47 > 99 2485 44 99
White 2549 73 98 2547 73 98
Hispanic 2505 50 > 99 2493 49 > 99
African American 2475 42 > 99 2485 44 99
American Indian 2441 < 1 > 99 2536 67 98
Asian American 2627 > 99 > 99 2585 85 > 99
Hawaiian/Pacific Islander * * * 2556 83 > 99
Multiracial 2521 63 > 99 2525 64 99
Student Gap Group 2494 48 > 99 2492 48 99
Lake Forest School District Performance and Participation
Smarter Balanced Grade 6 ELA
District Statewide
Group Mean
Scale Score Percent
Proficiency Participation
Rate Mean
Scale Score Percent
Proficient Participation
Rate
All Students 2537 55 98 2531 52 98
Students with Disability 2461 13 94 2439 11 96
ELL 2428 < 1 > 99 2416 7 96
Low-Income 2514 44 95 2493 35 97
White 2548 60 99 2557 65 98
Hispanic 2522 38 > 99 2506 40 98
African American 2505 42 97 2495 35 97
American Indian * * * 2526 47 96
Asian American 2620 > 99 > 99 2604 82 98
Hawaiian/Pacific Islander * * * 2534 73 > 99
Multiracial 2541 62 93 2537 51 97
Student Gap Group 2514 42 96 2501 38 97

Attachment 2 – 2016 Smarter State Summary – District Performance & Participation Office of Assessment
*Indicates no student in this cell
Page | 55
Lake Forest School District Performance and Participation
Smarter Balanced Grade 7 ELA
District Statewide
Group Mean
Scale Score Percent
Proficiency Participation
Rate Mean
Scale Score Percent
Proficient Participation
Rate
All Students 2556 54 97 2553 53 98
Students with Disability 2442 6 96 2455 12 95
ELL 2366 < 1 > 99 2434 6 97
Low-Income 2520 41 97 2511 35 96
White 2572 61 97 2580 65 98
Hispanic 2535 39 90 2528 42 98
African American 2507 32 98 2515 36 96
American Indian 2579 67 > 99 2581 67 98
Asian American 2493 50 > 99 2635 83 98
Hawaiian/Pacific Islander * * * 2536 30 > 99
Multiracial 2576 71 > 99 2568 63 97
Student Gap Group 2521 40 97 2521 39 97
Lake Forest School District Performance and Participation
Smarter Balanced Grade 8 ELA
District Statewide
Group Mean
Scale Score Percent
Proficiency Participation
Rate Mean
Scale Score Percent
Proficient Participation
Rate
All Students 2567 56 97 2571 54 97
Students with Disability 2458 14 95 2470 11 95
ELL 2391 < 1 > 99 2452 8 94
Low-Income 2531 41 96 2531 36 95
White 2575 61 97 2598 67 97
Hispanic 2573 56 > 99 2544 44 97
African American 2528 39 98 2534 38 96
American Indian 2545 50 > 99 2578 55 98
Asian American 2687 > 99 > 99 2646 81 98
Hawaiian/Pacific Islander * * * 2485 22 90
Multiracial 2557 44 > 99 2571 51 98
Student Gap Group 2532 42 96 2539 40 96

Attachment 2 – 2016 Smarter State Summary – District Performance & Participation Office of Assessment
*Indicates no student in this cell
Page | 56
Lake Forest School District Performance and Participation
Smarter Balanced Grade 3 Mathematics
District Statewide
Group Mean
Scale Score Percent
Proficiency Participation
Rate Mean
Scale Score Percent
Proficient Participation
Rate
All Students 2469 67 > 99 2444 55 99
Students with Disability 2424 39 > 99 2382 26 98
ELL 2504 75 80 2410 35 > 99
Low-Income 2456 60 > 99 2416 40 99
White 2479 73 > 99 2468 68 99
Hispanic 2469 63 96 2424 44 > 99
African American 2436 46 98 2412 39 99
American Indian 2385 < 1 > 99 2442 50 98
Asian American 2461 > 99 > 99 2509 87 99
Hawaiian/Pacific Islander * * * 2458 62 > 99
Multiracial 2470 71 > 99 2448 56 98
Student Gap Group 2450 57 99 2422 44 99
Lake Forest School District Performance and Participation
Smarter Balanced Grade 4 Mathematics
District Statewide
Group Mean
Scale Score Percent
Proficiency Participation
Rate Mean
Scale Score Percent
Proficient Participation
Rate
All Students 2506 64 > 99 2485 51 99
Students with Disability 2441 21 > 99 2416 17 98
ELL 2409 17 > 99 2425 18 99
Low-Income 2488 55 > 99 2454 34 99
White 2516 71 > 99 2510 65 99
Hispanic 2471 48 > 99 2463 38 > 99
African American 2493 56 > 99 2452 33 99
American Indian 2518 75 > 99 2489 49 97
Asian American 2594 > 99 > 99 2555 81 > 99
Hawaiian/Pacific Islander * * * 2490 57 88
Multiracial 2479 38 > 99 2482 49 99
Student Gap Group 2487 52 > 99 2460 37 99

Attachment 2 – 2016 Smarter State Summary – District Performance & Participation Office of Assessment
*Indicates no student in this cell
Page | 57
Lake Forest School District Performance and Participation
Smarter Balanced Grade 5 Mathematics
District Statewide
Group Mean
Scale Score Percent
Proficiency Participation
Rate Mean
Scale Score Percent
Proficient Participation
Rate
All Students 2513 43 99 2507 42 99
Students with Disability 2415 10 98 2427 11 97
ELL 2410 < 1 > 99 2427 8 99
Low-Income 2480 27 > 99 2474 26 99
White 2535 54 98 2535 56 98
Hispanic 2485 29 > 99 2483 29 > 99
African American 2458 22 > 99 2469 23 99
American Indian 2413 < 1 > 99 2519 43 98
Asian American 2651 > 99 > 99 2580 74 99
Hawaiian/Pacific Islander * * * 2518 54 > 99
Multiracial 2504 26 > 99 2512 44 98
Student Gap Group 2480 28 > 99 2479 28 98
Lake Forest School District Performance and Participation
Smarter Balanced Grade 6 Mathematics
District Statewide
Group Mean
Scale Score Percent
Proficiency Participation
Rate Mean
Scale Score Percent
Proficient Participation
Rate
All Students 2535 42 98 2517 37 98
Students with Disability 2447 7 94 2416 8 95
ELL 2470 < 1 > 99 2402 3 97
Low-Income 2510 31 95 2476 21 97
White 2548 49 99 2548 50 98
Hispanic 2515 33 > 99 2488 24 98
African American 2504 30 97 2475 21 97
American Indian * * * 2510 28 96
Asian American 2599 33 > 99 2606 70 99
Hawaiian/Pacific Islander * * * 2535 45 > 99
Multiracial 2529 38 93 2524 35 97
Student Gap Group 2509 29 96 2483 23 97

Attachment 2 – 2016 Smarter State Summary – District Performance & Participation Office of Assessment
*Indicates no student in this cell
Page | 58
Lake Forest School District Performance and Participation
Smarter Balanced Grade 7 Mathematics
District Statewide
Group Mean
Scale Score Percent
Proficiency Participation
Rate Mean
Scale Score Percent
Proficient Participation
Rate
All Students 2551 49 97 2535 40 98
Students with Disability 2438 10 96 2428 8 95
ELL 2311 < 1 > 99 2422 7 97
Low-Income 2519 33 95 2490 22 96
White 2568 56 97 2566 52 98
Hispanic 2533 39 90 2506 29 98
African American 2496 27 97 2489 21 96
American Indian 2583 33 > 99 2560 55 > 99
Asian American 2449 50 > 99 2640 77 98
Hawaiian/Pacific Islander * * * 2531 40 > 99
Multiracial 2570 53 > 99 2545 38 96
Student Gap Group 2519 35 96 2499 26 97
Lake Forest School District Performance and Participation
Smarter Balanced Grade 8 Mathematics
District Statewide
Group Mean
Scale Score Percent
Proficiency Participation
Rate Mean
Scale Score Percent
Proficient Participation
Rate
All Students 2547 38 97 2549 38 97
Students with Disability 2424 4 95 2437 6 96
ELL 2318 < 1 > 99 2438 9 96
Low-Income 2497 23 96 2500 20 95
White 2563 45 96 2584 51 97
Hispanic 2544 30 > 99 2518 25 98
African American 2479 13 98 2501 20 96
American Indian 2516 < 1 > 99 2547 41 96
Asian American 2767 > 99 > 99 2659 74 98
Hawaiian/Pacific Islander * * * 2470 33 90
Multiracial 2532 39 > 99 2555 40 98
Student Gap Group 2501 22 96 2509 23 96
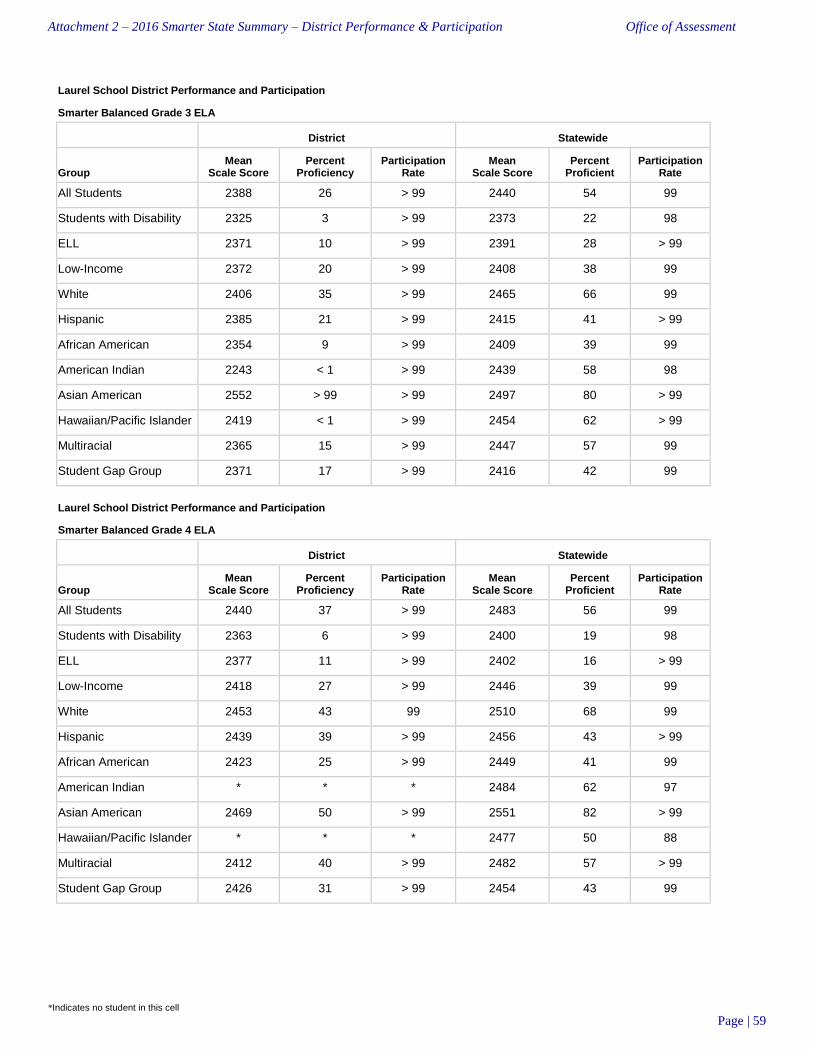
Attachment 2 – 2016 Smarter State Summary – District Performance & Participation Office of Assessment
*Indicates no student in this cell
Page | 59
Laurel School District Performance and Participation
Smarter Balanced Grade 3 ELA
District Statewide
Group Mean
Scale Score Percent
Proficiency Participation
Rate Mean
Scale Score Percent
Proficient Participation
Rate
All Students 2388 26 > 99 2440 54 99
Students with Disability 2325 3 > 99 2373 22 98
ELL 2371 10 > 99 2391 28 > 99
Low-Income 2372 20 > 99 2408 38 99
White 2406 35 > 99 2465 66 99
Hispanic 2385 21 > 99 2415 41 > 99
African American 2354 9 > 99 2409 39 99
American Indian 2243 < 1 > 99 2439 58 98
Asian American 2552 > 99 > 99 2497 80 > 99
Hawaiian/Pacific Islander 2419 < 1 > 99 2454 62 > 99
Multiracial 2365 15 > 99 2447 57 99
Student Gap Group 2371 17 > 99 2416 42 99
Laurel School District Performance and Participation
Smarter Balanced Grade 4 ELA
District Statewide
Group Mean
Scale Score Percent
Proficiency Participation
Rate Mean
Scale Score Percent
Proficient Participation
Rate
All Students 2440 37 > 99 2483 56 99
Students with Disability 2363 6 > 99 2400 19 98
ELL 2377 11 > 99 2402 16 > 99
Low-Income 2418 27 > 99 2446 39 99
White 2453 43 99 2510 68 99
Hispanic 2439 39 > 99 2456 43 > 99
African American 2423 25 > 99 2449 41 99
American Indian * * * 2484 62 97
Asian American 2469 50 > 99 2551 82 > 99
Hawaiian/Pacific Islander * * * 2477 50 88
Multiracial 2412 40 > 99 2482 57 > 99
Student Gap Group 2426 31 > 99 2454 43 99
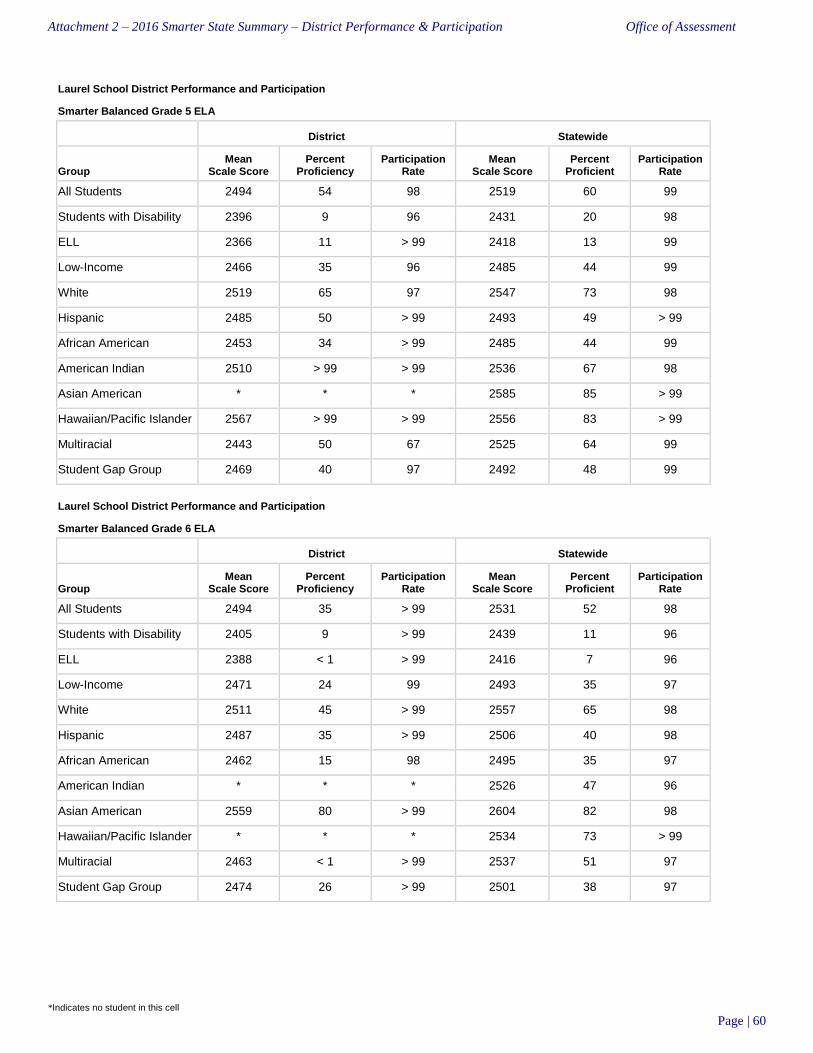
Attachment 2 – 2016 Smarter State Summary – District Performance & Participation Office of Assessment
*Indicates no student in this cell
Page | 60
Laurel School District Performance and Participation
Smarter Balanced Grade 5 ELA
District Statewide
Group Mean
Scale Score Percent
Proficiency Participation
Rate Mean
Scale Score Percent
Proficient Participation
Rate
All Students 2494 54 98 2519 60 99
Students with Disability 2396 9 96 2431 20 98
ELL 2366 11 > 99 2418 13 99
Low-Income 2466 35 96 2485 44 99
White 2519 65 97 2547 73 98
Hispanic 2485 50 > 99 2493 49 > 99
African American 2453 34 > 99 2485 44 99
American Indian 2510 > 99 > 99 2536 67 98
Asian American * * * 2585 85 > 99
Hawaiian/Pacific Islander 2567 > 99 > 99 2556 83 > 99
Multiracial 2443 50 67 2525 64 99
Student Gap Group 2469 40 97 2492 48 99
Laurel School District Performance and Participation
Smarter Balanced Grade 6 ELA
District Statewide
Group Mean
Scale Score Percent
Proficiency Participation
Rate Mean
Scale Score Percent
Proficient Participation
Rate
All Students 2494 35 > 99 2531 52 98
Students with Disability 2405 9 > 99 2439 11 96
ELL 2388 < 1 > 99 2416 7 96
Low-Income 2471 24 99 2493 35 97
White 2511 45 > 99 2557 65 98
Hispanic 2487 35 > 99 2506 40 98
African American 2462 15 98 2495 35 97
American Indian * * * 2526 47 96
Asian American 2559 80 > 99 2604 82 98
Hawaiian/Pacific Islander * * * 2534 73 > 99
Multiracial 2463 < 1 > 99 2537 51 97
Student Gap Group 2474 26 > 99 2501 38 97

Attachment 2 – 2016 Smarter State Summary – District Performance & Participation Office of Assessment
*Indicates no student in this cell
Page | 61
Laurel School District Performance and Participation
Smarter Balanced Grade 7 ELA
District Statewide
Group Mean
Scale Score Percent
Proficiency Participation
Rate Mean
Scale Score Percent
Proficient Participation
Rate
All Students 2549 51 99 2553 53 98
Students with Disability 2451 14 > 99 2455 12 95
ELL 2438 < 1 > 99 2434 6 97
Low-Income 2530 44 97 2511 35 96
White 2562 59 99 2580 65 98
Hispanic 2566 55 92 2528 42 98
African American 2527 36 > 99 2515 36 96
American Indian 2560 50 > 99 2581 67 98
Asian American 2482 50 > 99 2635 83 98
Hawaiian/Pacific Islander 2661 > 99 > 99 2536 30 > 99
Multiracial 2477 33 > 99 2568 63 97
Student Gap Group 2533 45 98 2521 39 97
Laurel School District Performance and Participation
Smarter Balanced Grade 8 ELA
District Statewide
Group Mean
Scale Score Percent
Proficiency Participation
Rate Mean
Scale Score Percent
Proficient Participation
Rate
All Students 2538 39 96 2571 54 97
Students with Disability 2450 10 95 2470 11 95
ELL 2443 < 1 50 2452 8 94
Low-Income 2524 37 92 2531 36 95
White 2554 45 98 2598 67 97
Hispanic 2529 33 88 2544 44 97
African American 2517 34 96 2534 38 96
American Indian 2425 < 1 > 99 2578 55 98
Asian American 2579 50 > 99 2646 81 98
Hawaiian/Pacific Islander * * * 2485 22 90
Multiracial 2498 < 1 > 99 2571 51 98
Student Gap Group 2521 34 94 2539 40 96

Attachment 2 – 2016 Smarter State Summary – District Performance & Participation Office of Assessment
*Indicates no student in this cell
Page | 62
Laurel School District Performance and Participation
Smarter Balanced Grade 3 Mathematics
District Statewide
Group Mean
Scale Score Percent
Proficiency Participation
Rate Mean
Scale Score Percent
Proficient Participation
Rate
All Students 2411 31 > 99 2444 55 99
Students with Disability 2358 10 > 99 2382 26 98
ELL 2385 9 > 99 2410 35 > 99
Low-Income 2399 24 > 99 2416 40 99
White 2427 40 > 99 2468 68 99
Hispanic 2398 12 > 99 2424 44 > 99
African American 2383 22 > 99 2412 39 99
American Indian 2237 < 1 > 99 2442 50 98
Asian American 2509 50 > 99 2509 87 99
Hawaiian/Pacific Islander 2506 > 99 > 99 2458 62 > 99
Multiracial 2393 20 > 99 2448 56 98
Student Gap Group 2396 23 > 99 2422 44 99
Laurel School District Performance and Participation
Smarter Balanced Grade 4 Mathematics
District Statewide
Group Mean
Scale Score Percent
Proficiency Participation
Rate Mean
Scale Score Percent
Proficient Participation
Rate
All Students 2453 37 > 99 2485 51 99
Students with Disability 2382 3 > 99 2416 17 98
ELL 2397 15 > 99 2425 18 99
Low-Income 2438 32 > 99 2454 34 99
White 2471 46 99 2510 65 99
Hispanic 2451 38 > 99 2463 38 > 99
African American 2427 25 > 99 2452 33 99
American Indian * * * 2489 49 97
Asian American 2509 50 > 99 2555 81 > 99
Hawaiian/Pacific Islander * * * 2490 57 88
Multiracial 2446 20 > 99 2482 49 99
Student Gap Group 2438 30 > 99 2460 37 99
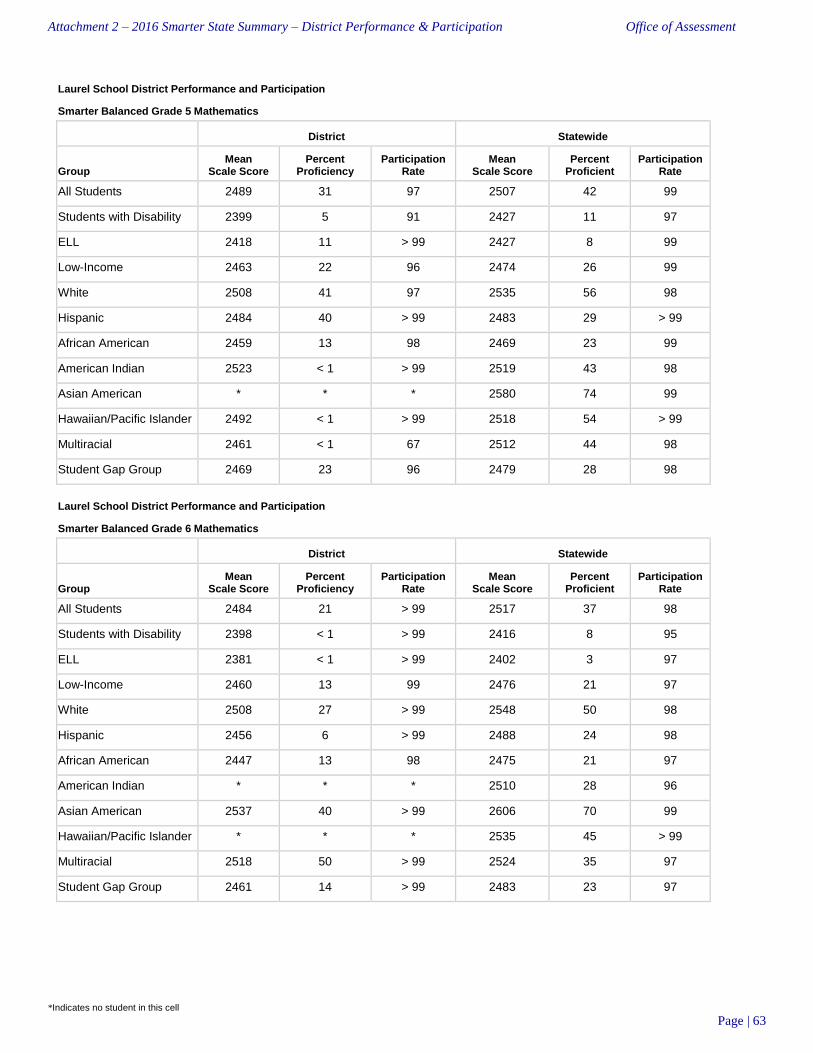
Attachment 2 – 2016 Smarter State Summary – District Performance & Participation Office of Assessment
*Indicates no student in this cell
Page | 63
Laurel School District Performance and Participation
Smarter Balanced Grade 5 Mathematics
District Statewide
Group Mean
Scale Score Percent
Proficiency Participation
Rate Mean
Scale Score Percent
Proficient Participation
Rate
All Students 2489 31 97 2507 42 99
Students with Disability 2399 5 91 2427 11 97
ELL 2418 11 > 99 2427 8 99
Low-Income 2463 22 96 2474 26 99
White 2508 41 97 2535 56 98
Hispanic 2484 40 > 99 2483 29 > 99
African American 2459 13 98 2469 23 99
American Indian 2523 < 1 > 99 2519 43 98
Asian American * * * 2580 74 99
Hawaiian/Pacific Islander 2492 < 1 > 99 2518 54 > 99
Multiracial 2461 < 1 67 2512 44 98
Student Gap Group 2469 23 96 2479 28 98
Laurel School District Performance and Participation
Smarter Balanced Grade 6 Mathematics
District Statewide
Group Mean
Scale Score Percent
Proficiency Participation
Rate Mean
Scale Score Percent
Proficient Participation
Rate
All Students 2484 21 > 99 2517 37 98
Students with Disability 2398 < 1 > 99 2416 8 95
ELL 2381 < 1 > 99 2402 3 97
Low-Income 2460 13 99 2476 21 97
White 2508 27 > 99 2548 50 98
Hispanic 2456 6 > 99 2488 24 98
African American 2447 13 98 2475 21 97
American Indian * * * 2510 28 96
Asian American 2537 40 > 99 2606 70 99
Hawaiian/Pacific Islander * * * 2535 45 > 99
Multiracial 2518 50 > 99 2524 35 97
Student Gap Group 2461 14 > 99 2483 23 97
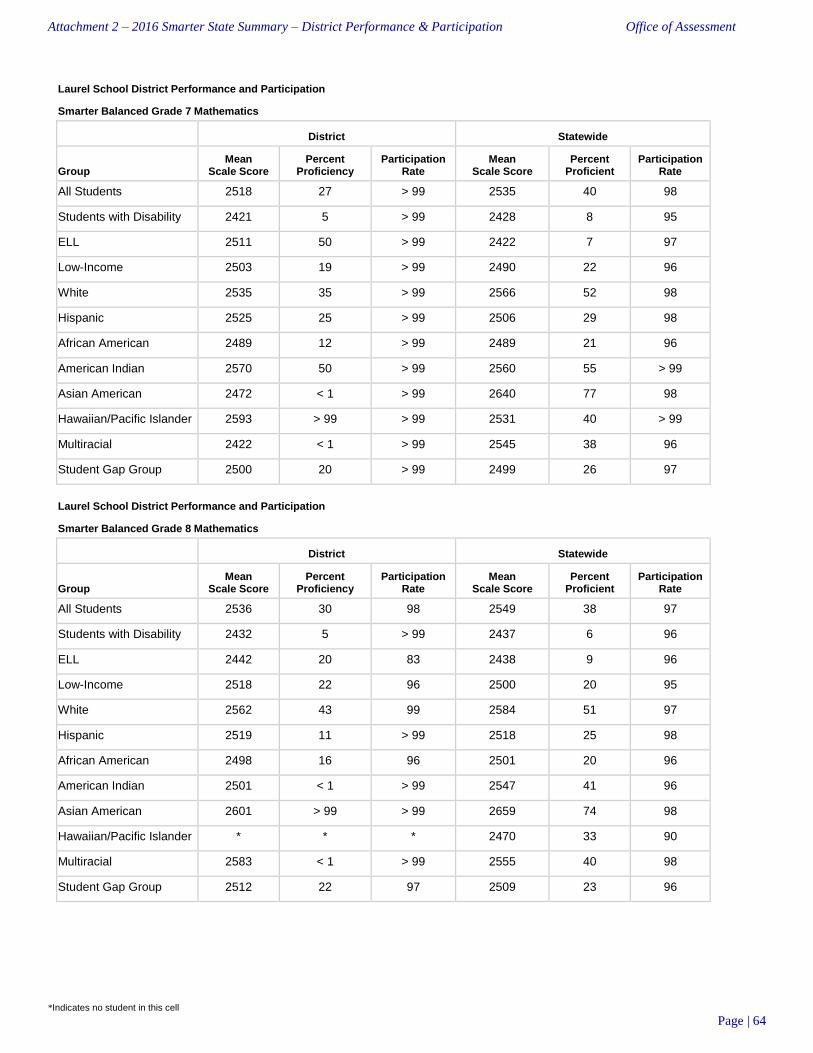
Attachment 2 – 2016 Smarter State Summary – District Performance & Participation Office of Assessment
*Indicates no student in this cell
Page | 64
Laurel School District Performance and Participation
Smarter Balanced Grade 7 Mathematics
District Statewide
Group Mean
Scale Score Percent
Proficiency Participation
Rate Mean
Scale Score Percent
Proficient Participation
Rate
All Students 2518 27 > 99 2535 40 98
Students with Disability 2421 5 > 99 2428 8 95
ELL 2511 50 > 99 2422 7 97
Low-Income 2503 19 > 99 2490 22 96
White 2535 35 > 99 2566 52 98
Hispanic 2525 25 > 99 2506 29 98
African American 2489 12 > 99 2489 21 96
American Indian 2570 50 > 99 2560 55 > 99
Asian American 2472 < 1 > 99 2640 77 98
Hawaiian/Pacific Islander 2593 > 99 > 99 2531 40 > 99
Multiracial 2422 < 1 > 99 2545 38 96
Student Gap Group 2500 20 > 99 2499 26 97
Laurel School District Performance and Participation
Smarter Balanced Grade 8 Mathematics
District Statewide
Group Mean
Scale Score Percent
Proficiency Participation
Rate Mean
Scale Score Percent
Proficient Participation
Rate
All Students 2536 30 98 2549 38 97
Students with Disability 2432 5 > 99 2437 6 96
ELL 2442 20 83 2438 9 96
Low-Income 2518 22 96 2500 20 95
White 2562 43 99 2584 51 97
Hispanic 2519 11 > 99 2518 25 98
African American 2498 16 96 2501 20 96
American Indian 2501 < 1 > 99 2547 41 96
Asian American 2601 > 99 > 99 2659 74 98
Hawaiian/Pacific Islander * * * 2470 33 90
Multiracial 2583 < 1 > 99 2555 40 98
Student Gap Group 2512 22 97 2509 23 96

Attachment 2 – 2016 Smarter State Summary – District Performance & Participation Office of Assessment
*Indicates no student in this cell
Page | 65
Milford School District Performance and Participation
Smarter Balanced Grade 3 ELA
District Statewide
Group Mean
Scale Score Percent
Proficiency Participation
Rate Mean
Scale Score Percent
Proficient Participation
Rate
All Students 2439 54 > 99 2440 54 99
Students with Disability 2391 23 > 99 2373 22 98
ELL 2392 32 > 99 2391 28 > 99
Low-Income 2425 48 > 99 2408 38 99
White 2458 63 > 99 2465 66 99
Hispanic 2430 53 > 99 2415 41 > 99
African American 2416 38 > 99 2409 39 99
American Indian 2441 > 99 > 99 2439 58 98
Asian American * * * 2497 80 > 99
Hawaiian/Pacific Islander * * * 2454 62 > 99
Multiracial 2412 40 > 99 2447 57 99
Student Gap Group 2427 47 > 99 2416 42 99
Milford School District Performance and Participation
Smarter Balanced Grade 4 ELA
District Statewide
Group Mean
Scale Score Percent
Proficiency Participation
Rate Mean
Scale Score Percent
Proficient Participation
Rate
All Students 2477 53 > 99 2483 56 99
Students with Disability 2434 34 > 99 2400 19 98
ELL 2406 19 > 99 2402 16 > 99
Low-Income 2447 37 > 99 2446 39 99
White 2499 63 > 99 2510 68 99
Hispanic 2459 43 > 99 2456 43 > 99
African American 2443 41 > 99 2449 41 99
American Indian 2445 < 1 > 99 2484 62 97
Asian American 2597 > 99 > 99 2551 82 > 99
Hawaiian/Pacific Islander 2377 < 1 > 99 2477 50 88
Multiracial 2496 59 > 99 2482 57 > 99
Student Gap Group 2456 42 > 99 2454 43 99
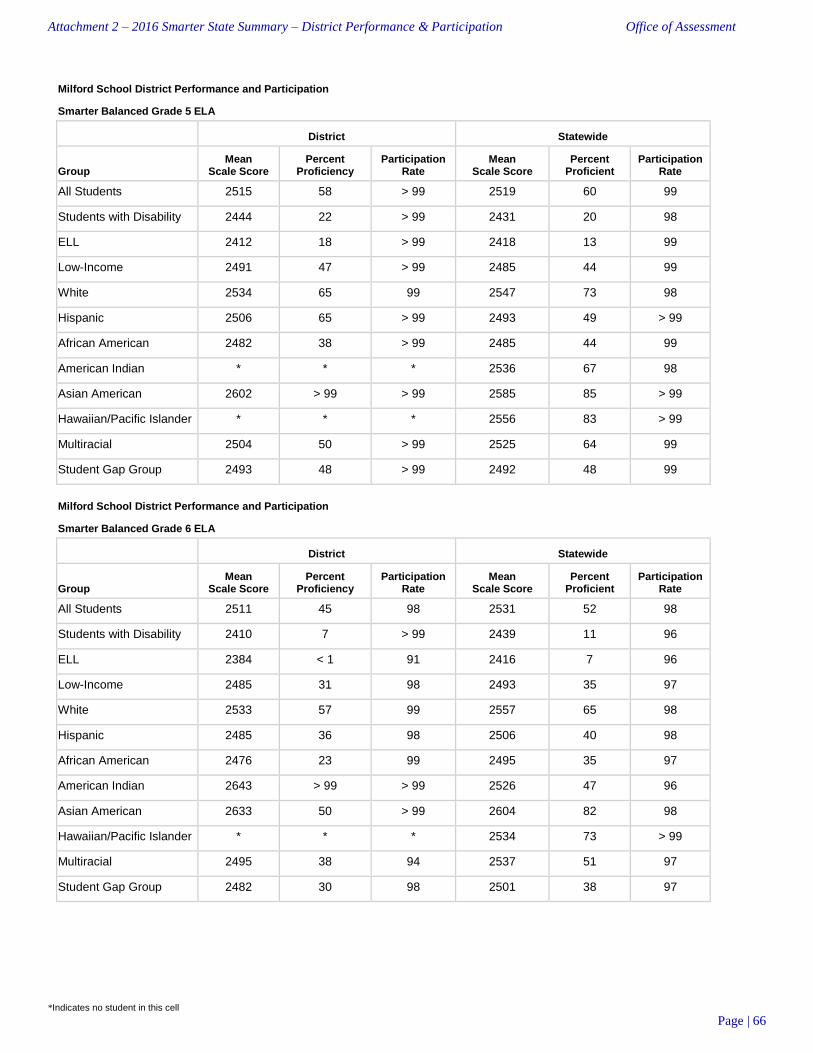
Attachment 2 – 2016 Smarter State Summary – District Performance & Participation Office of Assessment
*Indicates no student in this cell
Page | 66
Milford School District Performance and Participation
Smarter Balanced Grade 5 ELA
District Statewide
Group Mean
Scale Score Percent
Proficiency Participation
Rate Mean
Scale Score Percent
Proficient Participation
Rate
All Students 2515 58 > 99 2519 60 99
Students with Disability 2444 22 > 99 2431 20 98
ELL 2412 18 > 99 2418 13 99
Low-Income 2491 47 > 99 2485 44 99
White 2534 65 99 2547 73 98
Hispanic 2506 65 > 99 2493 49 > 99
African American 2482 38 > 99 2485 44 99
American Indian * * * 2536 67 98
Asian American 2602 > 99 > 99 2585 85 > 99
Hawaiian/Pacific Islander * * * 2556 83 > 99
Multiracial 2504 50 > 99 2525 64 99
Student Gap Group 2493 48 > 99 2492 48 99
Milford School District Performance and Participation
Smarter Balanced Grade 6 ELA
District Statewide
Group Mean
Scale Score Percent
Proficiency Participation
Rate Mean
Scale Score Percent
Proficient Participation
Rate
All Students 2511 45 98 2531 52 98
Students with Disability 2410 7 > 99 2439 11 96
ELL 2384 < 1 91 2416 7 96
Low-Income 2485 31 98 2493 35 97
White 2533 57 99 2557 65 98
Hispanic 2485 36 98 2506 40 98
African American 2476 23 99 2495 35 97
American Indian 2643 > 99 > 99 2526 47 96
Asian American 2633 50 > 99 2604 82 98
Hawaiian/Pacific Islander * * * 2534 73 > 99
Multiracial 2495 38 94 2537 51 97
Student Gap Group 2482 30 98 2501 38 97

Attachment 2 – 2016 Smarter State Summary – District Performance & Participation Office of Assessment
*Indicates no student in this cell
Page | 67
Milford School District Performance and Participation
Smarter Balanced Grade 7 ELA
District Statewide
Group Mean
Scale Score Percent
Proficiency Participation
Rate Mean
Scale Score Percent
Proficient Participation
Rate
All Students 2539 44 97 2553 53 98
Students with Disability 2440 2 95 2455 12 95
ELL 2459 < 1 92 2434 6 97
Low-Income 2506 28 97 2511 35 96
White 2556 52 97 2580 65 98
Hispanic 2520 29 > 99 2528 42 98
African American 2505 27 96 2515 36 96
American Indian * * * 2581 67 98
Asian American 2565 50 > 99 2635 83 98
Hawaiian/Pacific Islander 2463 < 1 > 99 2536 30 > 99
Multiracial 2570 75 > 99 2568 63 97
Student Gap Group 2510 30 97 2521 39 97
Milford School District Performance and Participation
Smarter Balanced Grade 8 ELA
District Statewide
Group Mean
Scale Score Percent
Proficiency Participation
Rate Mean
Scale Score Percent
Proficient Participation
Rate
All Students 2560 47 97 2571 54 97
Students with Disability 2470 4 96 2470 11 95
ELL 2441 6 89 2452 8 94
Low-Income 2532 33 97 2531 36 95
White 2580 56 99 2598 67 97
Hispanic 2548 48 94 2544 44 97
African American 2524 27 95 2534 38 96
American Indian 2455 < 1 > 99 2578 55 98
Asian American 2678 > 99 > 99 2646 81 98
Hawaiian/Pacific Islander * * * 2485 22 90
Multiracial 2510 27 > 99 2571 51 98
Student Gap Group 2530 32 97 2539 40 96

Attachment 2 – 2016 Smarter State Summary – District Performance & Participation Office of Assessment
*Indicates no student in this cell
Page | 68
Milford School District Performance and Participation
Smarter Balanced Grade 3 Mathematics
District Statewide
Group Mean
Scale Score Percent
Proficiency Participation
Rate Mean
Scale Score Percent
Proficient Participation
Rate
All Students 2456 58 > 99 2444 55 99
Students with Disability 2417 38 > 99 2382 26 98
ELL 2412 33 > 99 2410 35 > 99
Low-Income 2443 51 > 99 2416 40 99
White 2474 69 > 99 2468 68 99
Hispanic 2441 51 > 99 2424 44 > 99
African American 2436 47 > 99 2412 39 99
American Indian 2452 > 99 > 99 2442 50 98
Asian American * * * 2509 87 99
Hawaiian/Pacific Islander * * * 2458 62 > 99
Multiracial 2437 40 > 99 2448 56 98
Student Gap Group 2441 50 > 99 2422 44 99
Milford School District Performance and Participation
Smarter Balanced Grade 4 Mathematics
District Statewide
Group Mean
Scale Score Percent
Proficiency Participation
Rate Mean
Scale Score Percent
Proficient Participation
Rate
All Students 2480 45 > 99 2485 51 99
Students with Disability 2454 32 > 99 2416 17 98
ELL 2424 11 > 99 2425 18 99
Low-Income 2457 30 > 99 2454 34 99
White 2503 61 > 99 2510 65 99
Hispanic 2457 29 > 99 2463 38 > 99
African American 2451 27 > 99 2452 33 99
American Indian 2412 < 1 > 99 2489 49 97
Asian American 2536 67 > 99 2555 81 > 99
Hawaiian/Pacific Islander 2416 < 1 > 99 2490 57 88
Multiracial 2501 59 > 99 2482 49 99
Student Gap Group 2462 34 > 99 2460 37 99
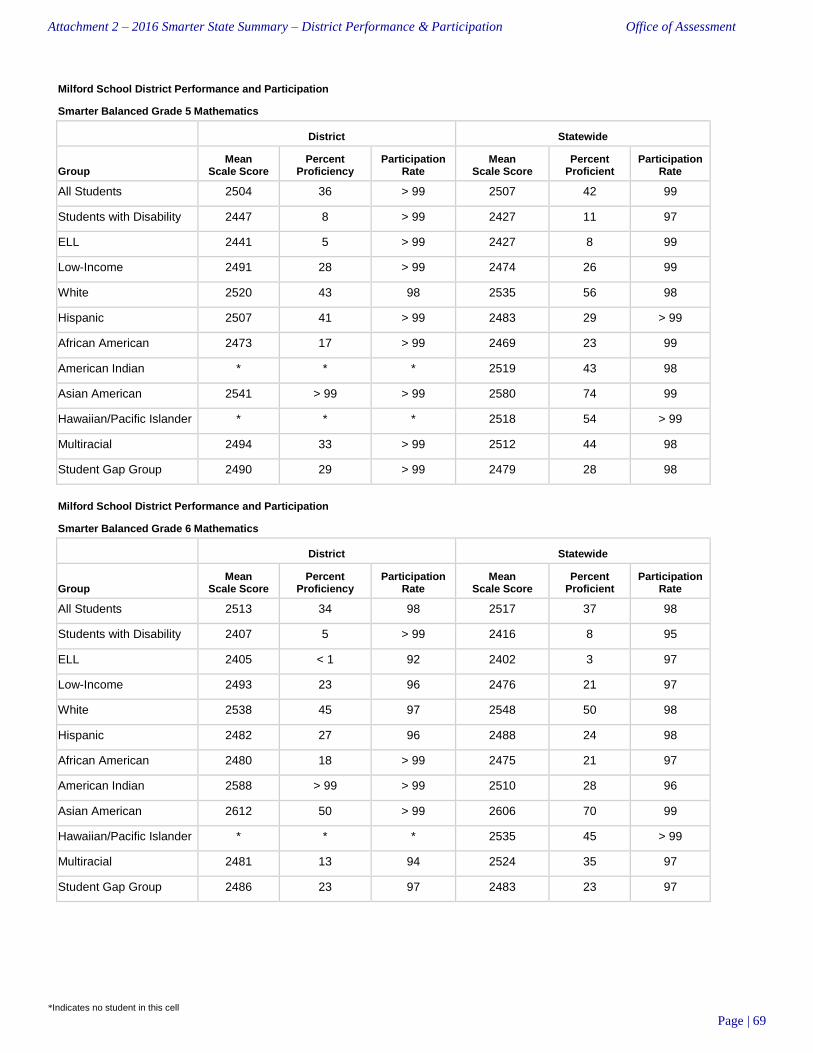
Attachment 2 – 2016 Smarter State Summary – District Performance & Participation Office of Assessment
*Indicates no student in this cell
Page | 69
Milford School District Performance and Participation
Smarter Balanced Grade 5 Mathematics
District Statewide
Group Mean
Scale Score Percent
Proficiency Participation
Rate Mean
Scale Score Percent
Proficient Participation
Rate
All Students 2504 36 > 99 2507 42 99
Students with Disability 2447 8 > 99 2427 11 97
ELL 2441 5 > 99 2427 8 99
Low-Income 2491 28 > 99 2474 26 99
White 2520 43 98 2535 56 98
Hispanic 2507 41 > 99 2483 29 > 99
African American 2473 17 > 99 2469 23 99
American Indian * * * 2519 43 98
Asian American 2541 > 99 > 99 2580 74 99
Hawaiian/Pacific Islander * * * 2518 54 > 99
Multiracial 2494 33 > 99 2512 44 98
Student Gap Group 2490 29 > 99 2479 28 98
Milford School District Performance and Participation
Smarter Balanced Grade 6 Mathematics
District Statewide
Group Mean
Scale Score Percent
Proficiency Participation
Rate Mean
Scale Score Percent
Proficient Participation
Rate
All Students 2513 34 98 2517 37 98
Students with Disability 2407 5 > 99 2416 8 95
ELL 2405 < 1 92 2402 3 97
Low-Income 2493 23 96 2476 21 97
White 2538 45 97 2548 50 98
Hispanic 2482 27 96 2488 24 98
African American 2480 18 > 99 2475 21 97
American Indian 2588 > 99 > 99 2510 28 96
Asian American 2612 50 > 99 2606 70 99
Hawaiian/Pacific Islander * * * 2535 45 > 99
Multiracial 2481 13 94 2524 35 97
Student Gap Group 2486 23 97 2483 23 97
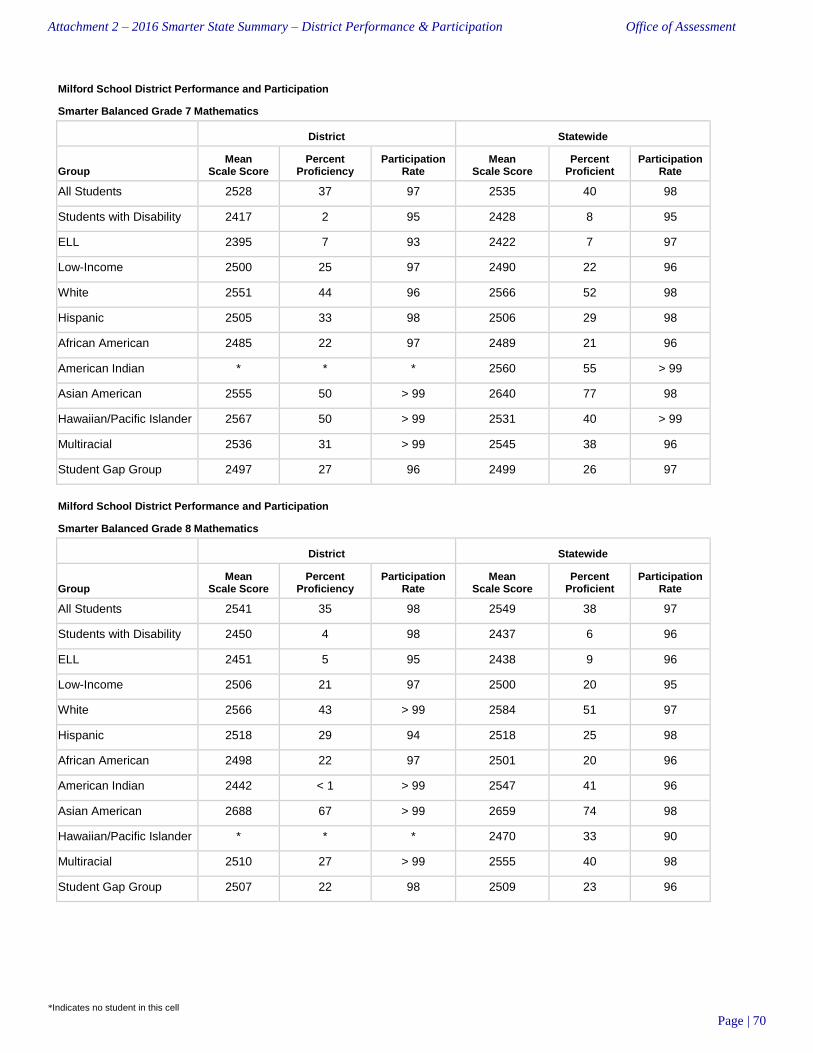
Attachment 2 – 2016 Smarter State Summary – District Performance & Participation Office of Assessment
*Indicates no student in this cell
Page | 70
Milford School District Performance and Participation
Smarter Balanced Grade 7 Mathematics
District Statewide
Group Mean
Scale Score Percent
Proficiency Participation
Rate Mean
Scale Score Percent
Proficient Participation
Rate
All Students 2528 37 97 2535 40 98
Students with Disability 2417 2 95 2428 8 95
ELL 2395 7 93 2422 7 97
Low-Income 2500 25 97 2490 22 96
White 2551 44 96 2566 52 98
Hispanic 2505 33 98 2506 29 98
African American 2485 22 97 2489 21 96
American Indian * * * 2560 55 > 99
Asian American 2555 50 > 99 2640 77 98
Hawaiian/Pacific Islander 2567 50 > 99 2531 40 > 99
Multiracial 2536 31 > 99 2545 38 96
Student Gap Group 2497 27 96 2499 26 97
Milford School District Performance and Participation
Smarter Balanced Grade 8 Mathematics
District Statewide
Group Mean
Scale Score Percent
Proficiency Participation
Rate Mean
Scale Score Percent
Proficient Participation
Rate
All Students 2541 35 98 2549 38 97
Students with Disability 2450 4 98 2437 6 96
ELL 2451 5 95 2438 9 96
Low-Income 2506 21 97 2500 20 95
White 2566 43 > 99 2584 51 97
Hispanic 2518 29 94 2518 25 98
African American 2498 22 97 2501 20 96
American Indian 2442 < 1 > 99 2547 41 96
Asian American 2688 67 > 99 2659 74 98
Hawaiian/Pacific Islander * * * 2470 33 90
Multiracial 2510 27 > 99 2555 40 98
Student Gap Group 2507 22 98 2509 23 96

Attachment 2 – 2016 Smarter State Summary – District Performance & Participation Office of Assessment
*Indicates no student in this cell
Page | 71
Red Clay Consolidated School District Performance and Participation
Smarter Balanced Grade 3 ELA
District Statewide
Group Mean
Scale Score Percent
Proficiency Participation
Rate Mean
Scale Score Percent
Proficient Participation
Rate
All Students 2426 49 98 2440 54 99
Students with Disability 2353 18 98 2373 22 98
ELL 2382 26 > 99 2391 28 > 99
Low-Income 2391 32 > 99 2408 38 99
White 2460 66 97 2465 66 99
Hispanic 2399 35 > 99 2415 41 > 99
African American 2377 26 > 99 2409 39 99
American Indian 2485 > 99 > 99 2439 58 98
Asian American 2517 84 > 99 2497 80 > 99
Hawaiian/Pacific Islander * * * 2454 62 > 99
Multiracial 2445 60 98 2447 57 99
Student Gap Group 2399 35 > 99 2416 42 99
Red Clay Consolidated School District Performance and Participation
Smarter Balanced Grade 4 ELA
District Statewide
Group Mean
Scale Score Percent
Proficiency Participation
Rate Mean
Scale Score Percent
Proficient Participation
Rate
All Students 2462 47 99 2483 56 99
Students with Disability 2369 13 > 99 2400 19 98
ELL 2403 18 > 99 2402 16 > 99
Low-Income 2414 26 > 99 2446 39 99
White 2496 62 97 2510 68 99
Hispanic 2432 32 > 99 2456 43 > 99
African American 2401 24 > 99 2449 41 99
American Indian 2357 < 1 > 99 2484 62 97
Asian American 2562 86 > 99 2551 82 > 99
Hawaiian/Pacific Islander * * * 2477 50 88
Multiracial 2483 56 98 2482 57 > 99
Student Gap Group 2423 30 > 99 2454 43 99

Attachment 2 – 2016 Smarter State Summary – District Performance & Participation Office of Assessment
*Indicates no student in this cell
Page | 72
Red Clay Consolidated School District Performance and Participation
Smarter Balanced Grade 5 ELA
District Statewide
Group Mean
Scale Score Percent
Proficiency Participation
Rate Mean
Scale Score Percent
Proficient Participation
Rate
All Students 2506 54 99 2519 60 99
Students with Disability 2399 11 98 2431 20 98
ELL 2417 12 > 99 2418 13 99
Low-Income 2461 33 > 99 2485 44 99
White 2544 74 98 2547 73 98
Hispanic 2475 38 99 2493 49 > 99
African American 2447 27 > 99 2485 44 99
American Indian 2682 > 99 > 99 2536 67 98
Asian American 2609 93 > 99 2585 85 > 99
Hawaiian/Pacific Islander * * * 2556 83 > 99
Multiracial 2510 53 97 2525 64 99
Student Gap Group 2467 35 > 99 2492 48 99
Red Clay Consolidated School District Performance and Participation
Smarter Balanced Grade 6 ELA
District Statewide
Group Mean
Scale Score Percent
Proficiency Participation
Rate Mean
Scale Score Percent
Proficient Participation
Rate
All Students 2528 49 97 2531 52 98
Students with Disability 2431 13 96 2439 11 96
ELL 2411 3 95 2416 7 96
Low-Income 2478 28 95 2493 35 97
White 2560 65 97 2557 65 98
Hispanic 2484 27 97 2506 40 98
African American 2479 28 96 2495 35 97
American Indian 2491 33 86 2526 47 96
Asian American 2616 87 99 2604 82 98
Hawaiian/Pacific Islander * * * 2534 73 > 99
Multiracial 2528 48 > 99 2537 51 97
Student Gap Group 2488 31 97 2501 38 97
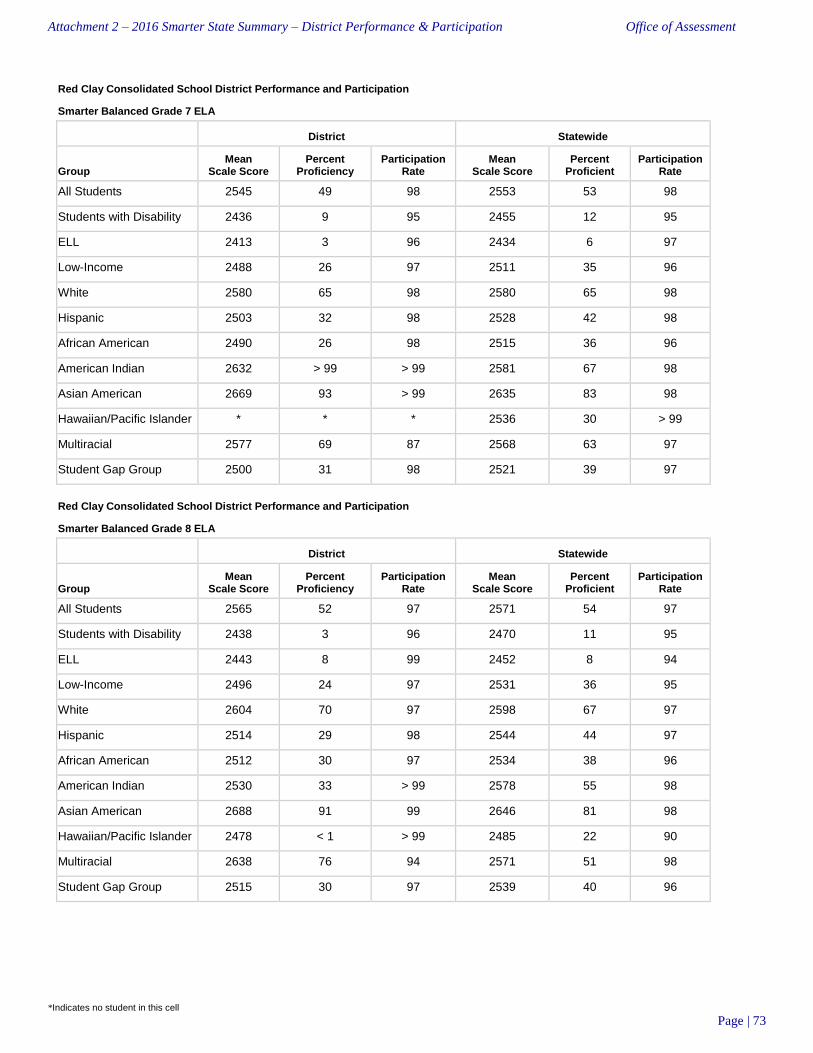
Attachment 2 – 2016 Smarter State Summary – District Performance & Participation Office of Assessment
*Indicates no student in this cell
Page | 73
Red Clay Consolidated School District Performance and Participation
Smarter Balanced Grade 7 ELA
District Statewide
Group Mean
Scale Score Percent
Proficiency Participation
Rate Mean
Scale Score Percent
Proficient Participation
Rate
All Students 2545 49 98 2553 53 98
Students with Disability 2436 9 95 2455 12 95
ELL 2413 3 96 2434 6 97
Low-Income 2488 26 97 2511 35 96
White 2580 65 98 2580 65 98
Hispanic 2503 32 98 2528 42 98
African American 2490 26 98 2515 36 96
American Indian 2632 > 99 > 99 2581 67 98
Asian American 2669 93 > 99 2635 83 98
Hawaiian/Pacific Islander * * * 2536 30 > 99
Multiracial 2577 69 87 2568 63 97
Student Gap Group 2500 31 98 2521 39 97
Red Clay Consolidated School District Performance and Participation
Smarter Balanced Grade 8 ELA
District Statewide
Group Mean
Scale Score Percent
Proficiency Participation
Rate Mean
Scale Score Percent
Proficient Participation
Rate
All Students 2565 52 97 2571 54 97
Students with Disability 2438 3 96 2470 11 95
ELL 2443 8 99 2452 8 94
Low-Income 2496 24 97 2531 36 95
White 2604 70 97 2598 67 97
Hispanic 2514 29 98 2544 44 97
African American 2512 30 97 2534 38 96
American Indian 2530 33 > 99 2578 55 98
Asian American 2688 91 99 2646 81 98
Hawaiian/Pacific Islander 2478 < 1 > 99 2485 22 90
Multiracial 2638 76 94 2571 51 98
Student Gap Group 2515 30 97 2539 40 96

Attachment 2 – 2016 Smarter State Summary – District Performance & Participation Office of Assessment
*Indicates no student in this cell
Page | 74
Red Clay Consolidated School District Performance and Participation
Smarter Balanced Grade 3 Mathematics
District Statewide
Group Mean
Scale Score Percent
Proficiency Participation
Rate Mean
Scale Score Percent
Proficient Participation
Rate
All Students 2424 45 98 2444 55 99
Students with Disability 2356 19 98 2382 26 98
ELL 2392 29 > 99 2410 35 > 99
Low-Income 2392 29 > 99 2416 40 99
White 2455 61 97 2468 68 99
Hispanic 2402 34 > 99 2424 44 > 99
African American 2373 20 98 2412 39 99
American Indian 2510 67 > 99 2442 50 98
Asian American 2524 91 99 2509 87 99
Hawaiian/Pacific Islander * * * 2458 62 > 99
Multiracial 2438 56 97 2448 56 98
Student Gap Group 2400 33 99 2422 44 99
Red Clay Consolidated School District Performance and Participation
Smarter Balanced Grade 4 Mathematics
District Statewide
Group Mean
Scale Score Percent
Proficiency Participation
Rate Mean
Scale Score Percent
Proficient Participation
Rate
All Students 2461 39 99 2485 51 99
Students with Disability 2381 9 99 2416 17 98
ELL 2424 21 > 99 2425 18 99
Low-Income 2425 19 > 99 2454 34 99
White 2486 52 97 2510 65 99
Hispanic 2436 26 > 99 2463 38 > 99
African American 2412 15 > 99 2452 33 99
American Indian 2409 < 1 > 99 2489 49 97
Asian American 2557 85 > 99 2555 81 > 99
Hawaiian/Pacific Islander * * * 2490 57 88
Multiracial 2475 45 95 2482 49 99
Student Gap Group 2430 23 > 99 2460 37 99

Attachment 2 – 2016 Smarter State Summary – District Performance & Participation Office of Assessment
*Indicates no student in this cell
Page | 75
Red Clay Consolidated School District Performance and Participation
Smarter Balanced Grade 5 Mathematics
District Statewide
Group Mean
Scale Score Percent
Proficiency Participation
Rate Mean
Scale Score Percent
Proficient Participation
Rate
All Students 2487 33 99 2507 42 99
Students with Disability 2392 6 98 2427 11 97
ELL 2419 5 > 99 2427 8 99
Low-Income 2441 14 > 99 2474 26 99
White 2524 52 98 2535 56 98
Hispanic 2456 17 > 99 2483 29 > 99
African American 2427 8 > 99 2469 23 99
American Indian 2742 > 99 > 99 2519 43 98
Asian American 2605 82 > 99 2580 74 99
Hawaiian/Pacific Islander * * * 2518 54 > 99
Multiracial 2489 30 97 2512 44 98
Student Gap Group 2448 15 > 99 2479 28 98
Red Clay Consolidated School District Performance and Participation
Smarter Balanced Grade 6 Mathematics
District Statewide
Group Mean
Scale Score Percent
Proficiency Participation
Rate Mean
Scale Score Percent
Proficient Participation
Rate
All Students 2509 34 97 2517 37 98
Students with Disability 2397 10 97 2416 8 95
ELL 2394 1 98 2402 3 97
Low-Income 2457 15 97 2476 21 97
White 2542 47 97 2548 50 98
Hispanic 2467 18 98 2488 24 98
African American 2444 12 96 2475 21 97
American Indian 2484 17 86 2510 28 96
Asian American 2628 73 99 2606 70 99
Hawaiian/Pacific Islander * * * 2535 45 > 99
Multiracial 2532 35 > 99 2524 35 97
Student Gap Group 2464 18 97 2483 23 97

Attachment 2 – 2016 Smarter State Summary – District Performance & Participation Office of Assessment
*Indicates no student in this cell
Page | 76
Red Clay Consolidated School District Performance and Participation
Smarter Balanced Grade 7 Mathematics
District Statewide
Group Mean
Scale Score Percent
Proficiency Participation
Rate Mean
Scale Score Percent
Proficient Participation
Rate
All Students 2531 39 98 2535 40 98
Students with Disability 2410 5 94 2428 8 95
ELL 2409 7 94 2422 7 97
Low-Income 2469 15 97 2490 22 96
White 2571 54 98 2566 52 98
Hispanic 2481 23 98 2506 29 98
African American 2465 15 99 2489 21 96
American Indian 2628 > 99 > 99 2560 55 > 99
Asian American 2679 87 > 99 2640 77 98
Hawaiian/Pacific Islander * * * 2531 40 > 99
Multiracial 2561 38 87 2545 38 96
Student Gap Group 2479 21 98 2499 26 97
Red Clay Consolidated School District Performance and Participation
Smarter Balanced Grade 8 Mathematics
District Statewide
Group Mean
Scale Score Percent
Proficiency Participation
Rate Mean
Scale Score Percent
Proficient Participation
Rate
All Students 2548 38 97 2549 38 97
Students with Disability 2409 3 97 2437 6 96
ELL 2429 9 > 99 2438 9 96
Low-Income 2465 13 95 2500 20 95
White 2592 53 97 2584 51 97
Hispanic 2485 17 98 2518 25 98
African American 2483 19 94 2501 20 96
American Indian 2464 25 > 99 2547 41 96
Asian American 2727 89 99 2659 74 98
Hawaiian/Pacific Islander 2347 < 1 > 99 2470 33 90
Multiracial 2583 47 94 2555 40 98
Student Gap Group 2486 18 96 2509 23 96
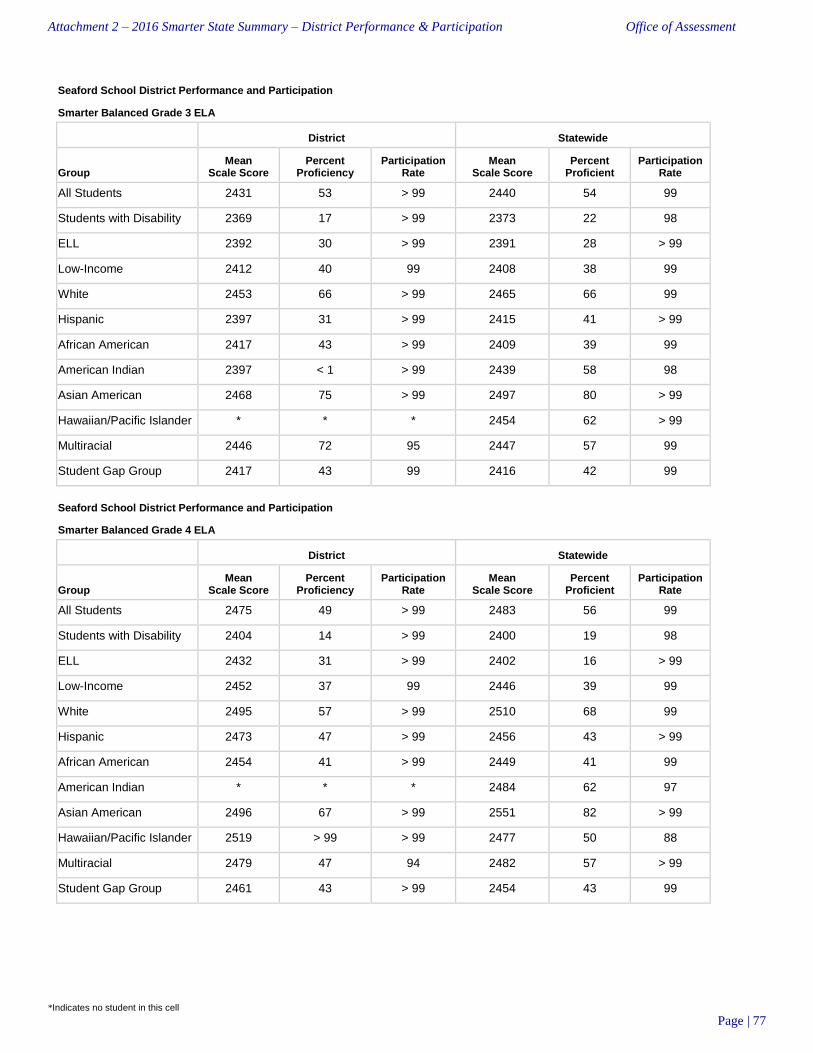
Attachment 2 – 2016 Smarter State Summary – District Performance & Participation Office of Assessment
*Indicates no student in this cell
Page | 77
Seaford School District Performance and Participation
Smarter Balanced Grade 3 ELA
District Statewide
Group Mean
Scale Score Percent
Proficiency Participation
Rate Mean
Scale Score Percent
Proficient Participation
Rate
All Students 2431 53 > 99 2440 54 99
Students with Disability 2369 17 > 99 2373 22 98
ELL 2392 30 > 99 2391 28 > 99
Low-Income 2412 40 99 2408 38 99
White 2453 66 > 99 2465 66 99
Hispanic 2397 31 > 99 2415 41 > 99
African American 2417 43 > 99 2409 39 99
American Indian 2397 < 1 > 99 2439 58 98
Asian American 2468 75 > 99 2497 80 > 99
Hawaiian/Pacific Islander * * * 2454 62 > 99
Multiracial 2446 72 95 2447 57 99
Student Gap Group 2417 43 99 2416 42 99
Seaford School District Performance and Participation
Smarter Balanced Grade 4 ELA
District Statewide
Group Mean
Scale Score Percent
Proficiency Participation
Rate Mean
Scale Score Percent
Proficient Participation
Rate
All Students 2475 49 > 99 2483 56 99
Students with Disability 2404 14 > 99 2400 19 98
ELL 2432 31 > 99 2402 16 > 99
Low-Income 2452 37 99 2446 39 99
White 2495 57 > 99 2510 68 99
Hispanic 2473 47 > 99 2456 43 > 99
African American 2454 41 > 99 2449 41 99
American Indian * * * 2484 62 97
Asian American 2496 67 > 99 2551 82 > 99
Hawaiian/Pacific Islander 2519 > 99 > 99 2477 50 88
Multiracial 2479 47 94 2482 57 > 99
Student Gap Group 2461 43 > 99 2454 43 99
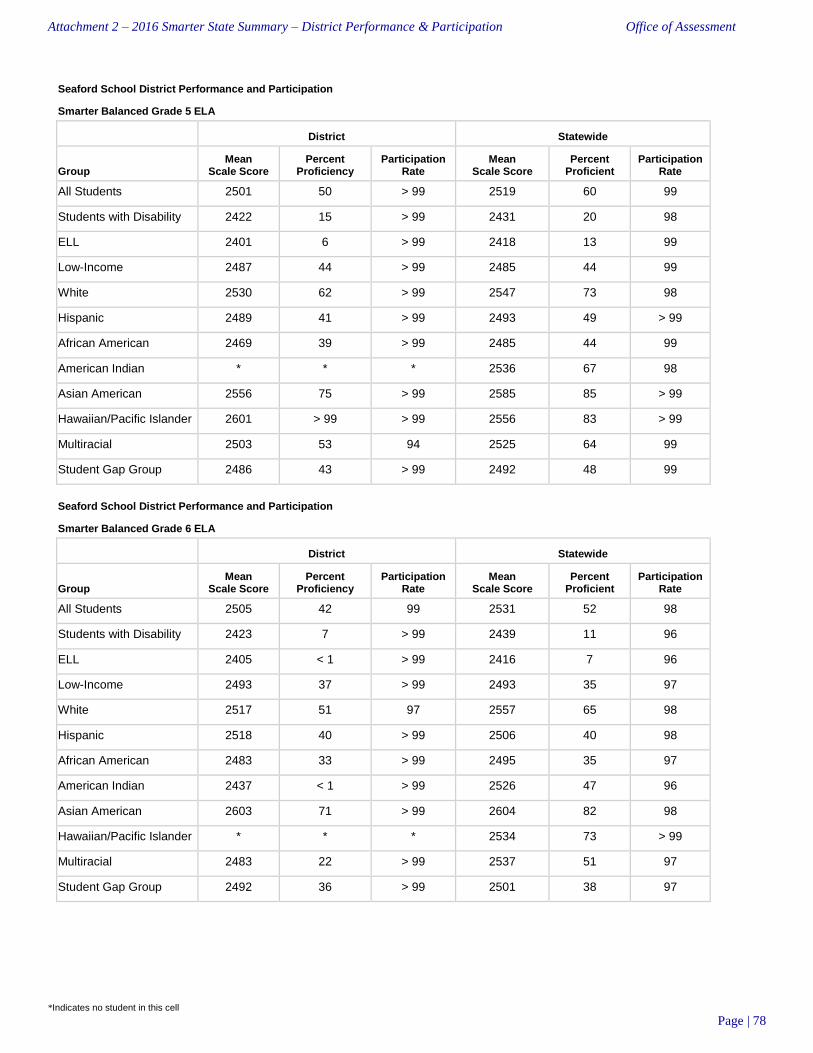
Attachment 2 – 2016 Smarter State Summary – District Performance & Participation Office of Assessment
*Indicates no student in this cell
Page | 78
Seaford School District Performance and Participation
Smarter Balanced Grade 5 ELA
District Statewide
Group Mean
Scale Score Percent
Proficiency Participation
Rate Mean
Scale Score Percent
Proficient Participation
Rate
All Students 2501 50 > 99 2519 60 99
Students with Disability 2422 15 > 99 2431 20 98
ELL 2401 6 > 99 2418 13 99
Low-Income 2487 44 > 99 2485 44 99
White 2530 62 > 99 2547 73 98
Hispanic 2489 41 > 99 2493 49 > 99
African American 2469 39 > 99 2485 44 99
American Indian * * * 2536 67 98
Asian American 2556 75 > 99 2585 85 > 99
Hawaiian/Pacific Islander 2601 > 99 > 99 2556 83 > 99
Multiracial 2503 53 94 2525 64 99
Student Gap Group 2486 43 > 99 2492 48 99
Seaford School District Performance and Participation
Smarter Balanced Grade 6 ELA
District Statewide
Group Mean
Scale Score Percent
Proficiency Participation
Rate Mean
Scale Score Percent
Proficient Participation
Rate
All Students 2505 42 99 2531 52 98
Students with Disability 2423 7 > 99 2439 11 96
ELL 2405 < 1 > 99 2416 7 96
Low-Income 2493 37 > 99 2493 35 97
White 2517 51 97 2557 65 98
Hispanic 2518 40 > 99 2506 40 98
African American 2483 33 > 99 2495 35 97
American Indian 2437 < 1 > 99 2526 47 96
Asian American 2603 71 > 99 2604 82 98
Hawaiian/Pacific Islander * * * 2534 73 > 99
Multiracial 2483 22 > 99 2537 51 97
Student Gap Group 2492 36 > 99 2501 38 97

Attachment 2 – 2016 Smarter State Summary – District Performance & Participation Office of Assessment
*Indicates no student in this cell
Page | 79
Seaford School District Performance and Participation
Smarter Balanced Grade 7 ELA
District Statewide
Group Mean
Scale Score Percent
Proficiency Participation
Rate Mean
Scale Score Percent
Proficient Participation
Rate
All Students 2543 51 99 2553 53 98
Students with Disability 2452 13 > 99 2455 12 95
ELL 2434 7 > 99 2434 6 97
Low-Income 2518 40 99 2511 35 96
White 2586 71 98 2580 65 98
Hispanic 2522 40 > 99 2528 42 98
African American 2497 32 99 2515 36 96
American Indian * * * 2581 67 98
Asian American 2636 > 99 > 99 2635 83 98
Hawaiian/Pacific Islander 2747 > 99 > 99 2536 30 > 99
Multiracial 2593 71 > 99 2568 63 97
Student Gap Group 2522 42 99 2521 39 97
Seaford School District Performance and Participation
Smarter Balanced Grade 8 ELA
District Statewide
Group Mean
Scale Score Percent
Proficiency Participation
Rate Mean
Scale Score Percent
Proficient Participation
Rate
All Students 2550 46 98 2571 54 97
Students with Disability 2490 18 97 2470 11 95
ELL 2481 14 93 2452 8 94
Low-Income 2523 30 97 2531 36 95
White 2572 56 98 2598 67 97
Hispanic 2547 44 96 2544 44 97
African American 2523 35 99 2534 38 96
American Indian 2522 < 1 > 99 2578 55 98
Asian American 2627 80 > 99 2646 81 98
Hawaiian/Pacific Islander * * * 2485 22 90
Multiracial 2545 50 > 99 2571 51 98
Student Gap Group 2536 39 97 2539 40 96

Attachment 2 – 2016 Smarter State Summary – District Performance & Participation Office of Assessment
*Indicates no student in this cell
Page | 80
Seaford School District Performance and Participation
Smarter Balanced Grade 3 Mathematics
District Statewide
Group Mean
Scale Score Percent
Proficiency Participation
Rate Mean
Scale Score Percent
Proficient Participation
Rate
All Students 2448 58 99 2444 55 99
Students with Disability 2388 25 98 2382 26 98
ELL 2424 41 > 99 2410 35 > 99
Low-Income 2435 52 98 2416 40 99
White 2462 68 > 99 2468 68 99
Hispanic 2438 52 > 99 2424 44 > 99
African American 2433 46 98 2412 39 99
American Indian 2453 50 > 99 2442 50 98
Asian American 2466 80 > 99 2509 87 99
Hawaiian/Pacific Islander * * * 2458 62 > 99
Multiracial 2459 67 95 2448 56 98
Student Gap Group 2436 51 98 2422 44 99
Seaford School District Performance and Participation
Smarter Balanced Grade 4 Mathematics
District Statewide
Group Mean
Scale Score Percent
Proficiency Participation
Rate Mean
Scale Score Percent
Proficient Participation
Rate
All Students 2490 53 99 2485 51 99
Students with Disability 2431 19 > 99 2416 17 98
ELL 2454 25 > 99 2425 18 99
Low-Income 2474 46 99 2454 34 99
White 2515 69 > 99 2510 65 99
Hispanic 2484 51 > 99 2463 38 > 99
African American 2469 36 98 2452 33 99
American Indian * * * 2489 49 97
Asian American 2543 > 99 > 99 2555 81 > 99
Hawaiian/Pacific Islander 2483 50 > 99 2490 57 88
Multiracial 2474 53 94 2482 49 99
Student Gap Group 2478 46 99 2460 37 99

Attachment 2 – 2016 Smarter State Summary – District Performance & Participation Office of Assessment
*Indicates no student in this cell
Page | 81
Seaford School District Performance and Participation
Smarter Balanced Grade 5 Mathematics
District Statewide
Group Mean
Scale Score Percent
Proficiency Participation
Rate Mean
Scale Score Percent
Proficient Participation
Rate
All Students 2483 31 > 99 2507 42 99
Students with Disability 2418 4 > 99 2427 11 97
ELL 2392 6 > 99 2427 8 99
Low-Income 2469 23 > 99 2474 26 99
White 2517 48 > 99 2535 56 98
Hispanic 2475 21 > 99 2483 29 > 99
African American 2448 17 > 99 2469 23 99
American Indian * * * 2519 43 98
Asian American 2523 50 > 99 2580 74 99
Hawaiian/Pacific Islander 2570 > 99 > 99 2518 54 > 99
Multiracial 2468 20 94 2512 44 98
Student Gap Group 2467 23 > 99 2479 28 98
Seaford School District Performance and Participation
Smarter Balanced Grade 6 Mathematics
District Statewide
Group Mean
Scale Score Percent
Proficiency Participation
Rate Mean
Scale Score Percent
Proficient Participation
Rate
All Students 2485 26 99 2517 37 98
Students with Disability 2404 7 > 99 2416 8 95
ELL 2375 < 1 > 99 2402 3 97
Low-Income 2469 20 > 99 2476 21 97
White 2504 33 97 2548 50 98
Hispanic 2488 23 > 99 2488 24 98
African American 2460 18 > 99 2475 21 97
American Indian 2432 < 1 > 99 2510 28 96
Asian American 2608 86 > 99 2606 70 99
Hawaiian/Pacific Islander * * * 2535 45 > 99
Multiracial 2430 < 1 > 99 2524 35 97
Student Gap Group 2470 21 > 99 2483 23 97

Attachment 2 – 2016 Smarter State Summary – District Performance & Participation Office of Assessment
*Indicates no student in this cell
Page | 82
Seaford School District Performance and Participation
Smarter Balanced Grade 7 Mathematics
District Statewide
Group Mean
Scale Score Percent
Proficiency Participation
Rate Mean
Scale Score Percent
Proficient Participation
Rate
All Students 2522 39 99 2535 40 98
Students with Disability 2424 17 > 99 2428 8 95
ELL 2393 < 1 > 99 2422 7 97
Low-Income 2497 29 99 2490 22 96
White 2568 56 98 2566 52 98
Hispanic 2499 28 > 99 2506 29 98
African American 2477 25 99 2489 21 96
American Indian * * * 2560 55 > 99
Asian American 2655 > 99 > 99 2640 77 98
Hawaiian/Pacific Islander 2664 > 99 > 99 2531 40 > 99
Multiracial 2555 29 > 99 2545 38 96
Student Gap Group 2500 31 99 2499 26 97
Seaford School District Performance and Participation
Smarter Balanced Grade 8 Mathematics
District Statewide
Group Mean
Scale Score Percent
Proficiency Participation
Rate Mean
Scale Score Percent
Proficient Participation
Rate
All Students 2513 21 97 2549 38 97
Students with Disability 2438 10 > 99 2437 6 96
ELL 2386 < 1 88 2438 9 96
Low-Income 2484 10 96 2500 20 95
White 2551 33 98 2584 51 97
Hispanic 2506 15 98 2518 25 98
African American 2470 9 95 2501 20 96
American Indian 2475 < 1 > 99 2547 41 96
Asian American 2583 60 > 99 2659 74 98
Hawaiian/Pacific Islander * * * 2470 33 90
Multiracial 2479 < 1 > 99 2555 40 98
Student Gap Group 2493 13 96 2509 23 96
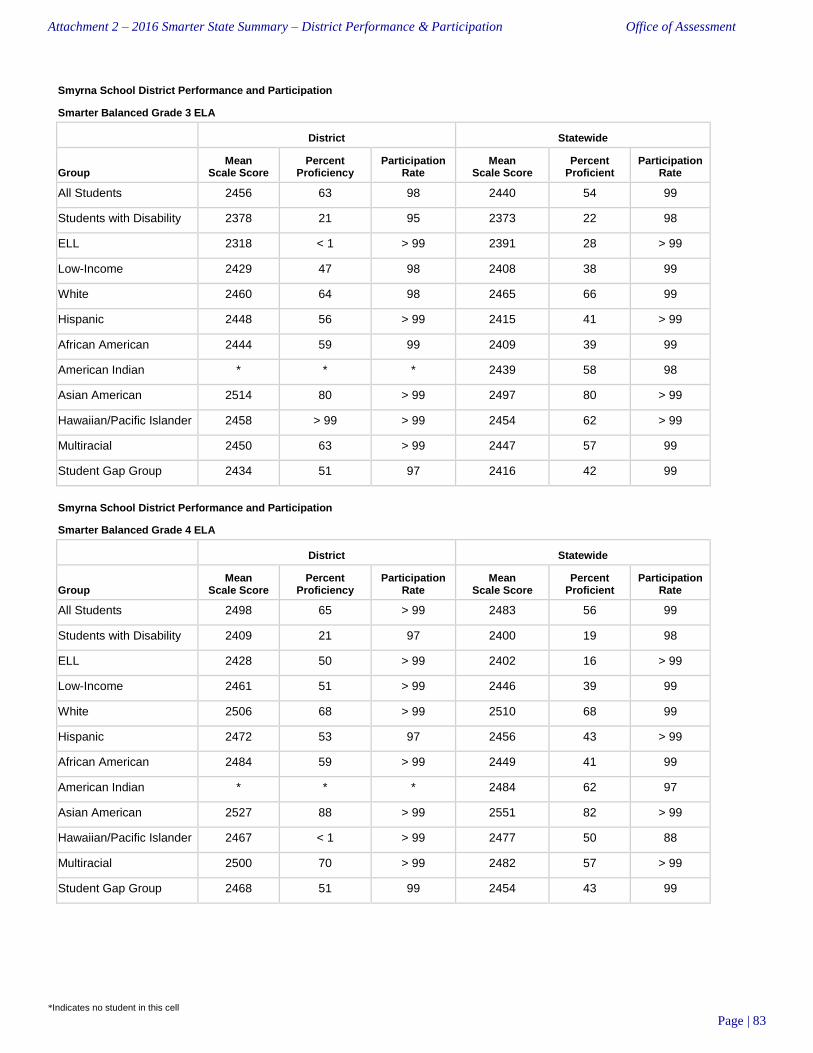
Attachment 2 – 2016 Smarter State Summary – District Performance & Participation Office of Assessment
*Indicates no student in this cell
Page | 83
Smyrna School District Performance and Participation
Smarter Balanced Grade 3 ELA
District Statewide
Group Mean
Scale Score Percent
Proficiency Participation
Rate Mean
Scale Score Percent
Proficient Participation
Rate
All Students 2456 63 98 2440 54 99
Students with Disability 2378 21 95 2373 22 98
ELL 2318 < 1 > 99 2391 28 > 99
Low-Income 2429 47 98 2408 38 99
White 2460 64 98 2465 66 99
Hispanic 2448 56 > 99 2415 41 > 99
African American 2444 59 99 2409 39 99
American Indian * * * 2439 58 98
Asian American 2514 80 > 99 2497 80 > 99
Hawaiian/Pacific Islander 2458 > 99 > 99 2454 62 > 99
Multiracial 2450 63 > 99 2447 57 99
Student Gap Group 2434 51 97 2416 42 99
Smyrna School District Performance and Participation
Smarter Balanced Grade 4 ELA
District Statewide
Group Mean
Scale Score Percent
Proficiency Participation
Rate Mean
Scale Score Percent
Proficient Participation
Rate
All Students 2498 65 > 99 2483 56 99
Students with Disability 2409 21 97 2400 19 98
ELL 2428 50 > 99 2402 16 > 99
Low-Income 2461 51 > 99 2446 39 99
White 2506 68 > 99 2510 68 99
Hispanic 2472 53 97 2456 43 > 99
African American 2484 59 > 99 2449 41 99
American Indian * * * 2484 62 97
Asian American 2527 88 > 99 2551 82 > 99
Hawaiian/Pacific Islander 2467 < 1 > 99 2477 50 88
Multiracial 2500 70 > 99 2482 57 > 99
Student Gap Group 2468 51 99 2454 43 99

Attachment 2 – 2016 Smarter State Summary – District Performance & Participation Office of Assessment
*Indicates no student in this cell
Page | 84
Smyrna School District Performance and Participation
Smarter Balanced Grade 5 ELA
District Statewide
Group Mean
Scale Score Percent
Proficiency Participation
Rate Mean
Scale Score Percent
Proficient Participation
Rate
All Students 2530 66 99 2519 60 99
Students with Disability 2435 24 94 2431 20 98
ELL 2493 50 > 99 2418 13 99
Low-Income 2490 47 > 99 2485 44 99
White 2544 74 98 2547 73 98
Hispanic 2491 46 > 99 2493 49 > 99
African American 2511 55 > 99 2485 44 99
American Indian 2549 50 > 99 2536 67 98
Asian American 2520 86 > 99 2585 85 > 99
Hawaiian/Pacific Islander * * * 2556 83 > 99
Multiracial 2608 88 > 99 2525 64 99
Student Gap Group 2499 51 98 2492 48 99
Smyrna School District Performance and Participation
Smarter Balanced Grade 6 ELA
District Statewide
Group Mean
Scale Score Percent
Proficiency Participation
Rate Mean
Scale Score Percent
Proficient Participation
Rate
All Students 2550 59 99 2531 52 98
Students with Disability 2468 13 95 2439 11 96
ELL 2424 < 1 > 99 2416 7 96
Low-Income 2524 42 98 2493 35 97
White 2556 65 99 2557 65 98
Hispanic 2550 61 97 2506 40 98
African American 2537 49 > 99 2495 35 97
American Indian 2502 33 > 99 2526 47 96
Asian American 2645 50 > 99 2604 82 98
Hawaiian/Pacific Islander 2541 > 99 > 99 2534 73 > 99
Multiracial 2527 33 > 99 2537 51 97
Student Gap Group 2530 46 98 2501 38 97

Attachment 2 – 2016 Smarter State Summary – District Performance & Participation Office of Assessment
*Indicates no student in this cell
Page | 85
Smyrna School District Performance and Participation
Smarter Balanced Grade 7 ELA
District Statewide
Group Mean
Scale Score Percent
Proficiency Participation
Rate Mean
Scale Score Percent
Proficient Participation
Rate
All Students 2567 60 > 99 2553 53 98
Students with Disability 2481 14 > 99 2455 12 95
ELL 2399 < 1 > 99 2434 6 97
Low-Income 2535 44 98 2511 35 96
White 2577 64 > 99 2580 65 98
Hispanic 2552 49 > 99 2528 42 98
African American 2543 49 98 2515 36 96
American Indian 2537 33 > 99 2581 67 98
Asian American 2560 80 > 99 2635 83 98
Hawaiian/Pacific Islander * * * 2536 30 > 99
Multiracial 2615 > 99 > 99 2568 63 97
Student Gap Group 2542 48 99 2521 39 97
Smyrna School District Performance and Participation
Smarter Balanced Grade 8 ELA
District Statewide
Group Mean
Scale Score Percent
Proficiency Participation
Rate Mean
Scale Score Percent
Proficient Participation
Rate
All Students 2584 59 98 2571 54 97
Students with Disability 2483 14 97 2470 11 95
ELL 2484 < 1 > 99 2452 8 94
Low-Income 2562 50 96 2531 36 95
White 2596 64 > 99 2598 67 97
Hispanic 2564 49 > 99 2544 44 97
African American 2568 52 96 2534 38 96
American Indian 2474 < 1 > 99 2578 55 98
Asian American 2586 63 > 99 2646 81 98
Hawaiian/Pacific Islander * * * 2485 22 90
Multiracial 2584 50 > 99 2571 51 98
Student Gap Group 2559 48 97 2539 40 96

Attachment 2 – 2016 Smarter State Summary – District Performance & Participation Office of Assessment
*Indicates no student in this cell
Page | 86
Smyrna School District Performance and Participation
Smarter Balanced Grade 3 Mathematics
District Statewide
Group Mean
Scale Score Percent
Proficiency Participation
Rate Mean
Scale Score Percent
Proficient Participation
Rate
All Students 2453 58 98 2444 55 99
Students with Disability 2385 22 95 2382 26 98
ELL 2407 33 > 99 2410 35 > 99
Low-Income 2432 42 98 2416 40 99
White 2462 62 98 2468 68 99
Hispanic 2442 56 > 99 2424 44 > 99
African American 2430 52 99 2412 39 99
American Indian * * * 2442 50 98
Asian American 2491 80 > 99 2509 87 99
Hawaiian/Pacific Islander 2458 > 99 > 99 2458 62 > 99
Multiracial 2451 44 95 2448 56 98
Student Gap Group 2431 47 97 2422 44 99
Smyrna School District Performance and Participation
Smarter Balanced Grade 4 Mathematics
District Statewide
Group Mean
Scale Score Percent
Proficiency Participation
Rate Mean
Scale Score Percent
Proficient Participation
Rate
All Students 2491 50 99 2485 51 99
Students with Disability 2419 13 97 2416 17 98
ELL 2428 25 > 99 2425 18 99
Low-Income 2459 34 98 2454 34 99
White 2500 55 98 2510 65 99
Hispanic 2487 53 97 2463 38 > 99
African American 2469 38 > 99 2452 33 99
American Indian * * * 2489 49 97
Asian American 2558 75 > 99 2555 81 > 99
Hawaiian/Pacific Islander 2536 > 99 > 99 2490 57 88
Multiracial 2472 30 > 99 2482 49 99
Student Gap Group 2465 36 98 2460 37 99

Attachment 2 – 2016 Smarter State Summary – District Performance & Participation Office of Assessment
*Indicates no student in this cell
Page | 87
Smyrna School District Performance and Participation
Smarter Balanced Grade 5 Mathematics
District Statewide
Group Mean
Scale Score Percent
Proficiency Participation
Rate Mean
Scale Score Percent
Proficient Participation
Rate
All Students 2508 41 99 2507 42 99
Students with Disability 2419 6 94 2427 11 97
ELL 2507 50 > 99 2427 8 99
Low-Income 2469 20 > 99 2474 26 99
White 2524 50 98 2535 56 98
Hispanic 2472 27 > 99 2483 29 > 99
African American 2483 26 > 99 2469 23 99
American Indian 2502 < 1 > 99 2519 43 98
Asian American 2528 57 > 99 2580 74 99
Hawaiian/Pacific Islander * * * 2518 54 > 99
Multiracial 2552 63 > 99 2512 44 98
Student Gap Group 2476 25 98 2479 28 98
Smyrna School District Performance and Participation
Smarter Balanced Grade 6 Mathematics
District Statewide
Group Mean
Scale Score Percent
Proficiency Participation
Rate Mean
Scale Score Percent
Proficient Participation
Rate
All Students 2550 53 99 2517 37 98
Students with Disability 2450 11 97 2416 8 95
ELL 2404 < 1 50 2402 3 97
Low-Income 2527 42 98 2476 21 97
White 2562 58 99 2548 50 98
Hispanic 2546 59 97 2488 24 98
African American 2526 42 > 99 2475 21 97
American Indian 2470 17 > 99 2510 28 96
Asian American 2645 75 > 99 2606 70 99
Hawaiian/Pacific Islander 2483 < 1 > 99 2535 45 > 99
Multiracial 2546 33 > 99 2524 35 97
Student Gap Group 2524 41 98 2483 23 97

Attachment 2 – 2016 Smarter State Summary – District Performance & Participation Office of Assessment
*Indicates no student in this cell
Page | 88
Smyrna School District Performance and Participation
Smarter Balanced Grade 7 Mathematics
District Statewide
Group Mean
Scale Score Percent
Proficiency Participation
Rate Mean
Scale Score Percent
Proficient Participation
Rate
All Students 2544 39 99 2535 40 98
Students with Disability 2441 5 > 99 2428 8 95
ELL 2514 < 1 > 99 2422 7 97
Low-Income 2507 22 97 2490 22 96
White 2560 48 99 2566 52 98
Hispanic 2518 22 > 99 2506 29 98
African American 2508 23 98 2489 21 96
American Indian 2492 < 1 > 99 2560 55 > 99
Asian American 2578 40 > 99 2640 77 98
Hawaiian/Pacific Islander * * * 2531 40 > 99
Multiracial 2572 40 > 99 2545 38 96
Student Gap Group 2510 25 98 2499 26 97
Smyrna School District Performance and Participation
Smarter Balanced Grade 8 Mathematics
District Statewide
Group Mean
Scale Score Percent
Proficiency Participation
Rate Mean
Scale Score Percent
Proficient Participation
Rate
All Students 2545 35 99 2549 38 97
Students with Disability 2439 3 99 2437 6 96
ELL 2476 < 1 > 99 2438 9 96
Low-Income 2521 23 97 2500 20 95
White 2565 45 > 99 2584 51 97
Hispanic 2516 29 > 99 2518 25 98
African American 2517 17 97 2501 20 96
American Indian 2422 < 1 > 99 2547 41 96
Asian American 2545 38 > 99 2659 74 98
Hawaiian/Pacific Islander * * * 2470 33 90
Multiracial 2548 50 > 99 2555 40 98
Student Gap Group 2513 21 98 2509 23 96

Attachment 2 – 2016 Smarter State Summary – District Performance & Participation Office of Assessment
*Indicates no student in this cell
Page | 89
Woodbridge School District Performance and Participation
Smarter Balanced Grade 3 ELA
District Statewide
Group Mean
Scale Score Percent
Proficiency Participation
Rate Mean
Scale Score Percent
Proficient Participation
Rate
All Students 2434 50 > 99 2440 54 99
Students with Disability 2402 27 > 99 2373 22 98
ELL 2418 33 > 99 2391 28 > 99
Low-Income 2422 43 > 99 2408 38 99
White 2446 57 > 99 2465 66 99
Hispanic 2442 54 > 99 2415 41 > 99
African American 2411 37 > 99 2409 39 99
American Indian * * * 2439 58 98
Asian American 2419 < 1 > 99 2497 80 > 99
Hawaiian/Pacific Islander * * * 2454 62 > 99
Multiracial 2428 33 > 99 2447 57 99
Student Gap Group 2422 42 > 99 2416 42 99
Woodbridge School District Performance and Participation
Smarter Balanced Grade 4 ELA
District Statewide
Group Mean
Scale Score Percent
Proficiency Participation
Rate Mean
Scale Score Percent
Proficient Participation
Rate
All Students 2486 57 > 99 2483 56 99
Students with Disability 2421 26 > 99 2400 19 98
ELL 2367 < 1 > 99 2402 16 > 99
Low-Income 2465 46 > 99 2446 39 99
White 2505 67 > 99 2510 68 99
Hispanic 2479 54 > 99 2456 43 > 99
African American 2459 43 98 2449 41 99
American Indian * * * 2484 62 97
Asian American * * * 2551 82 > 99
Hawaiian/Pacific Islander * * * 2477 50 88
Multiracial 2468 50 > 99 2482 57 > 99
Student Gap Group 2474 51 > 99 2454 43 99

Attachment 2 – 2016 Smarter State Summary – District Performance & Participation Office of Assessment
*Indicates no student in this cell
Page | 90
Woodbridge School District Performance and Participation
Smarter Balanced Grade 5 ELA
District Statewide
Group Mean
Scale Score Percent
Proficiency Participation
Rate Mean
Scale Score Percent
Proficient Participation
Rate
All Students 2501 50 > 99 2519 60 99
Students with Disability 2447 17 97 2431 20 98
ELL 2403 10 > 99 2418 13 99
Low-Income 2487 43 > 99 2485 44 99
White 2520 60 98 2547 73 98
Hispanic 2483 44 > 99 2493 49 > 99
African American 2480 33 > 99 2485 44 99
American Indian 2486 50 > 99 2536 67 98
Asian American 2530 67 > 99 2585 85 > 99
Hawaiian/Pacific Islander * * * 2556 83 > 99
Multiracial 2501 60 > 99 2525 64 99
Student Gap Group 2488 42 99 2492 48 99
Woodbridge School District Performance and Participation
Smarter Balanced Grade 6 ELA
District Statewide
Group Mean
Scale Score Percent
Proficiency Participation
Rate Mean
Scale Score Percent
Proficient Participation
Rate
All Students 2499 38 > 99 2531 52 98
Students with Disability 2397 4 > 99 2439 11 96
ELL 2421 17 86 2416 7 96
Low-Income 2487 33 > 99 2493 35 97
White 2507 42 > 99 2557 65 98
Hispanic 2517 58 97 2506 40 98
African American 2473 22 > 99 2495 35 97
American Indian * * * 2526 47 96
Asian American 2569 67 > 99 2604 82 98
Hawaiian/Pacific Islander * * * 2534 73 > 99
Multiracial 2526 20 > 99 2537 51 97
Student Gap Group 2490 33 > 99 2501 38 97

Attachment 2 – 2016 Smarter State Summary – District Performance & Participation Office of Assessment
*Indicates no student in this cell
Page | 91
Woodbridge School District Performance and Participation
Smarter Balanced Grade 7 ELA
District Statewide
Group Mean
Scale Score Percent
Proficiency Participation
Rate Mean
Scale Score Percent
Proficient Participation
Rate
All Students 2544 45 > 99 2553 53 98
Students with Disability 2452 4 96 2455 12 95
ELL 2475 10 > 99 2434 6 97
Low-Income 2518 34 > 99 2511 35 96
White 2554 55 > 99 2580 65 98
Hispanic 2547 43 > 99 2528 42 98
African American 2509 28 98 2515 36 96
American Indian 2702 > 99 > 99 2581 67 98
Asian American 2692 > 99 > 99 2635 83 98
Hawaiian/Pacific Islander * * * 2536 30 > 99
Multiracial 2572 40 > 99 2568 63 97
Student Gap Group 2526 37 > 99 2521 39 97
Woodbridge School District Performance and Participation
Smarter Balanced Grade 8 ELA
District Statewide
Group Mean
Scale Score Percent
Proficiency Participation
Rate Mean
Scale Score Percent
Proficient Participation
Rate
All Students 2554 51 98 2571 54 97
Students with Disability 2464 13 > 99 2470 11 95
ELL 2463 14 88 2452 8 94
Low-Income 2531 40 99 2531 36 95
White 2573 60 99 2598 67 97
Hispanic 2550 54 95 2544 44 97
African American 2519 30 98 2534 38 96
American Indian * * * 2578 55 98
Asian American 2617 > 99 > 99 2646 81 98
Hawaiian/Pacific Islander * * * 2485 22 90
Multiracial 2538 33 > 99 2571 51 98
Student Gap Group 2537 44 98 2539 40 96
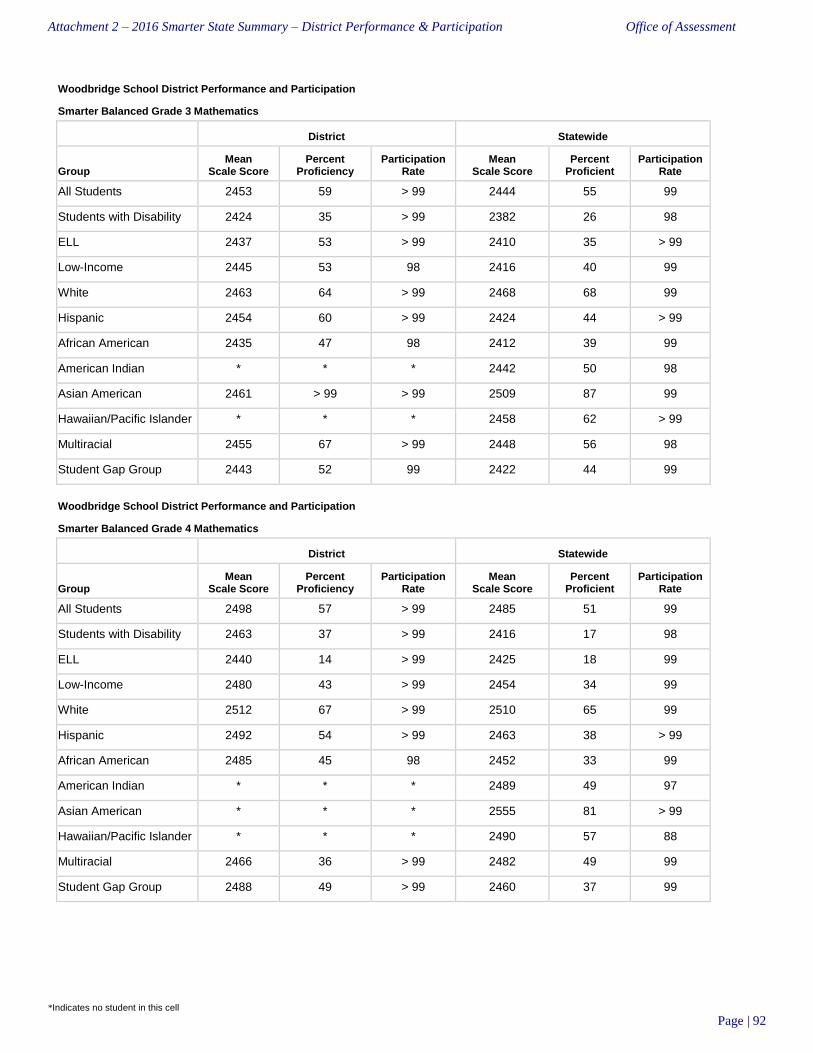
Attachment 2 – 2016 Smarter State Summary – District Performance & Participation Office of Assessment
*Indicates no student in this cell
Page | 92
Woodbridge School District Performance and Participation
Smarter Balanced Grade 3 Mathematics
District Statewide
Group Mean
Scale Score Percent
Proficiency Participation
Rate Mean
Scale Score Percent
Proficient Participation
Rate
All Students 2453 59 > 99 2444 55 99
Students with Disability 2424 35 > 99 2382 26 98
ELL 2437 53 > 99 2410 35 > 99
Low-Income 2445 53 98 2416 40 99
White 2463 64 > 99 2468 68 99
Hispanic 2454 60 > 99 2424 44 > 99
African American 2435 47 98 2412 39 99
American Indian * * * 2442 50 98
Asian American 2461 > 99 > 99 2509 87 99
Hawaiian/Pacific Islander * * * 2458 62 > 99
Multiracial 2455 67 > 99 2448 56 98
Student Gap Group 2443 52 99 2422 44 99
Woodbridge School District Performance and Participation
Smarter Balanced Grade 4 Mathematics
District Statewide
Group Mean
Scale Score Percent
Proficiency Participation
Rate Mean
Scale Score Percent
Proficient Participation
Rate
All Students 2498 57 > 99 2485 51 99
Students with Disability 2463 37 > 99 2416 17 98
ELL 2440 14 > 99 2425 18 99
Low-Income 2480 43 > 99 2454 34 99
White 2512 67 > 99 2510 65 99
Hispanic 2492 54 > 99 2463 38 > 99
African American 2485 45 98 2452 33 99
American Indian * * * 2489 49 97
Asian American * * * 2555 81 > 99
Hawaiian/Pacific Islander * * * 2490 57 88
Multiracial 2466 36 > 99 2482 49 99
Student Gap Group 2488 49 > 99 2460 37 99

Attachment 2 – 2016 Smarter State Summary – District Performance & Participation Office of Assessment
*Indicates no student in this cell
Page | 93
Woodbridge School District Performance and Participation
Smarter Balanced Grade 5 Mathematics
District Statewide
Group Mean
Scale Score Percent
Proficiency Participation
Rate Mean
Scale Score Percent
Proficient Participation
Rate
All Students 2517 47 99 2507 42 99
Students with Disability 2488 27 97 2427 11 97
ELL 2449 < 1 > 99 2427 8 99
Low-Income 2510 45 98 2474 26 99
White 2533 53 98 2535 56 98
Hispanic 2498 41 > 99 2483 29 > 99
African American 2499 35 98 2469 23 99
American Indian 2587 > 99 > 99 2519 43 98
Asian American 2529 67 > 99 2580 74 99
Hawaiian/Pacific Islander * * * 2518 54 > 99
Multiracial 2521 60 > 99 2512 44 98
Student Gap Group 2508 43 98 2479 28 98
Woodbridge School District Performance and Participation
Smarter Balanced Grade 6 Mathematics
District Statewide
Group Mean
Scale Score Percent
Proficiency Participation
Rate Mean
Scale Score Percent
Proficient Participation
Rate
All Students 2494 26 > 99 2517 37 98
Students with Disability 2396 < 1 > 99 2416 8 95
ELL 2406 < 1 > 99 2402 3 97
Low-Income 2487 25 99 2476 21 97
White 2497 32 > 99 2548 50 98
Hispanic 2508 31 > 99 2488 24 98
African American 2478 15 98 2475 21 97
American Indian * * * 2510 28 96
Asian American 2532 33 > 99 2606 70 99
Hawaiian/Pacific Islander * * * 2535 45 > 99
Multiracial 2520 20 > 99 2524 35 97
Student Gap Group 2486 24 > 99 2483 23 97
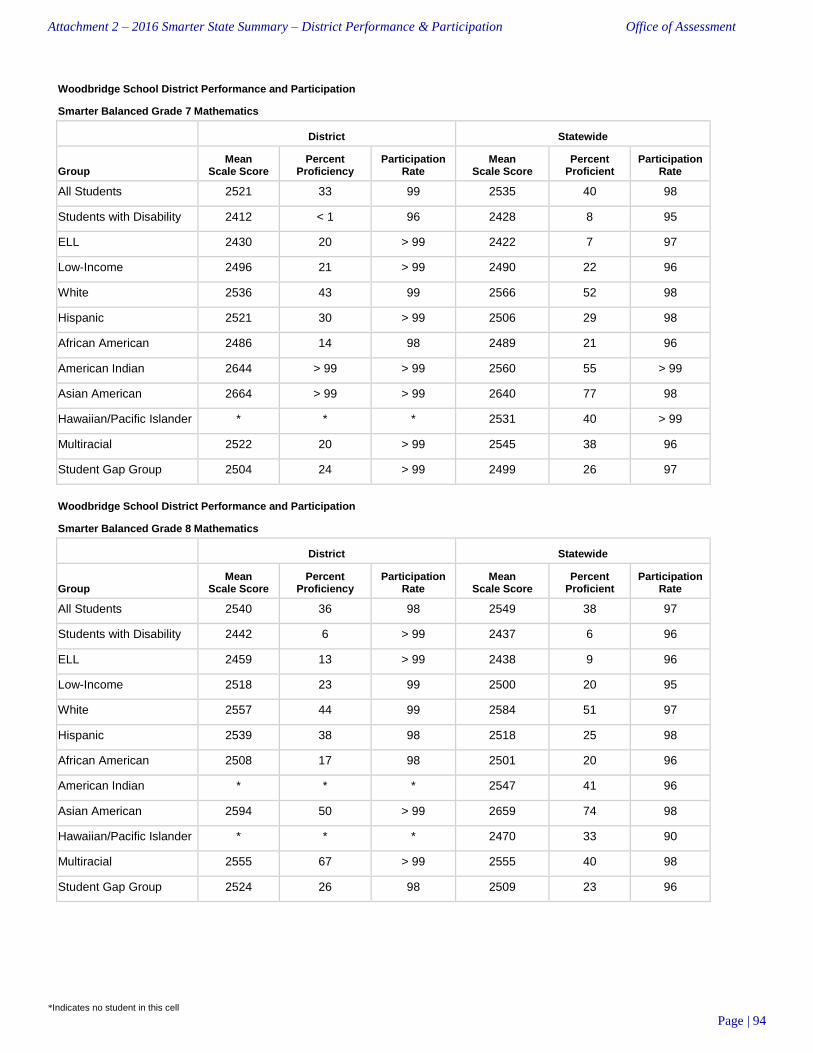
Attachment 2 – 2016 Smarter State Summary – District Performance & Participation Office of Assessment
*Indicates no student in this cell
Page | 94
Woodbridge School District Performance and Participation
Smarter Balanced Grade 7 Mathematics
District Statewide
Group Mean
Scale Score Percent
Proficiency Participation
Rate Mean
Scale Score Percent
Proficient Participation
Rate
All Students 2521 33 99 2535 40 98
Students with Disability 2412 < 1 96 2428 8 95
ELL 2430 20 > 99 2422 7 97
Low-Income 2496 21 > 99 2490 22 96
White 2536 43 99 2566 52 98
Hispanic 2521 30 > 99 2506 29 98
African American 2486 14 98 2489 21 96
American Indian 2644 > 99 > 99 2560 55 > 99
Asian American 2664 > 99 > 99 2640 77 98
Hawaiian/Pacific Islander * * * 2531 40 > 99
Multiracial 2522 20 > 99 2545 38 96
Student Gap Group 2504 24 > 99 2499 26 97
Woodbridge School District Performance and Participation
Smarter Balanced Grade 8 Mathematics
District Statewide
Group Mean
Scale Score Percent
Proficiency Participation
Rate Mean
Scale Score Percent
Proficient Participation
Rate
All Students 2540 36 98 2549 38 97
Students with Disability 2442 6 > 99 2437 6 96
ELL 2459 13 > 99 2438 9 96
Low-Income 2518 23 99 2500 20 95
White 2557 44 99 2584 51 97
Hispanic 2539 38 98 2518 25 98
African American 2508 17 98 2501 20 96
American Indian * * * 2547 41 96
Asian American 2594 50 > 99 2659 74 98
Hawaiian/Pacific Islander * * * 2470 33 90
Multiracial 2555 67 > 99 2555 40 98
Student Gap Group 2524 26 98 2509 23 96