australia's digital pulse 2017 - acss... · australia’s digital pulse policy priorities to...
TRANSCRIPT
Australia’s Digital PulsePolicy priorities to fuel Australia’s digital workforce boomAustralian Computer Society, 2017
Limitation of our work
General use restrictionThis report is prepared solely for the Australian Computer Society (ACS) by Deloitte Access Economics (DAE). This report is not intended to and should not be used or relied upon by anyone else and we accept no duty of care to any other person or entity. The report has been prepared for the purpose of analysing Australia’s digital economy, workforce and policy. You should not refer to or use our name or the advice for any other purpose
ContentsExecutive summary 1
1. Exponential technologies are changing Australian businesses and industries 4
2. Digital technologies provide a significant economic dividend 8
3. Trade and investment activity in ICT continues to grow 12
4. Australia’s ICT workforce is highly skilled and works across a range of industries 18
5. Future demand for ICT workers and skills is expected to be high 26
6. There is a global labour market for ICT talent 32
7. Vibrant digital ecosystems are required to attract and retain businesses 37
8. Australia’s digital landscape and relevant policy issues 42
References 54
Appendix A: Statistical compendium 57
Australia’s Digital Pulse | Policy priorities to fuel Australia’s digital workforce boom
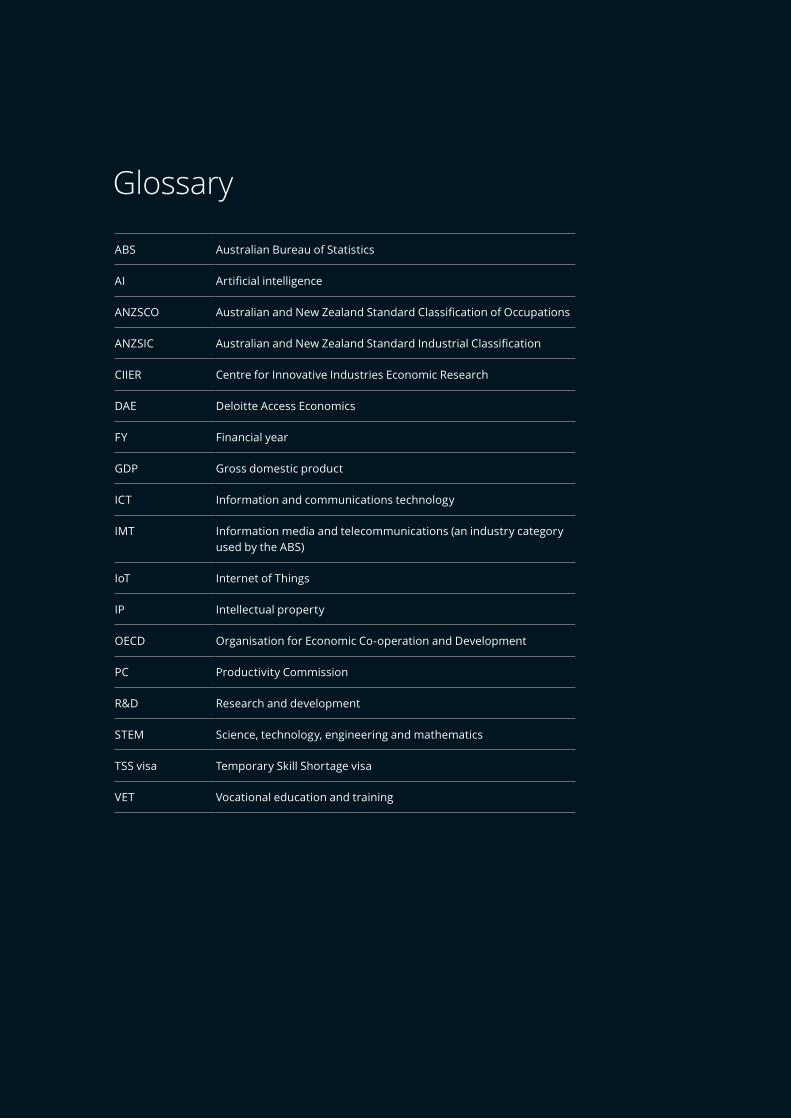
Glossary
ABS Australian Bureau of Statistics
AI Artificial intelligence
ANZSCO Australian and New Zealand Standard Classification of Occupations
ANZSIC Australian and New Zealand Standard Industrial Classification
CIIER Centre for Innovative Industries Economic Research
DAE Deloitte Access Economics
FY Financial year
GDP Gross domestic product
ICT Information and communications technology
IMT Information media and telecommunications (an industry category used by the ABS)
IoT Internet of Things
IP Intellectual property
OECD Organisation for Economic Co-operation and Development
PC Productivity Commission
R&D Research and development
STEM Science, technology, engineering and mathematics
TSS visa Temporary Skill Shortage visa
VET Vocational education and training
Australia’s Digital Pulse | Policy priorities to fuel Australia’s digital workforce boom
1
Executive summary
1 In this study, we have calculated employment figures for ICT workers using Australian Bureau of Statistics (ABS) occupation and industry classifications, based on the methodology used in previous editions of Australia’s Digital Pulse. This methodology draws on definitions and nomenclature developed by Ian Dennis FACS, lead researcher from the Centre for Innovative Industries Economic Research (CIIER), and used in the Australian Computer Society’s 2008–13 statistical compendiums and other CIIER analysis.
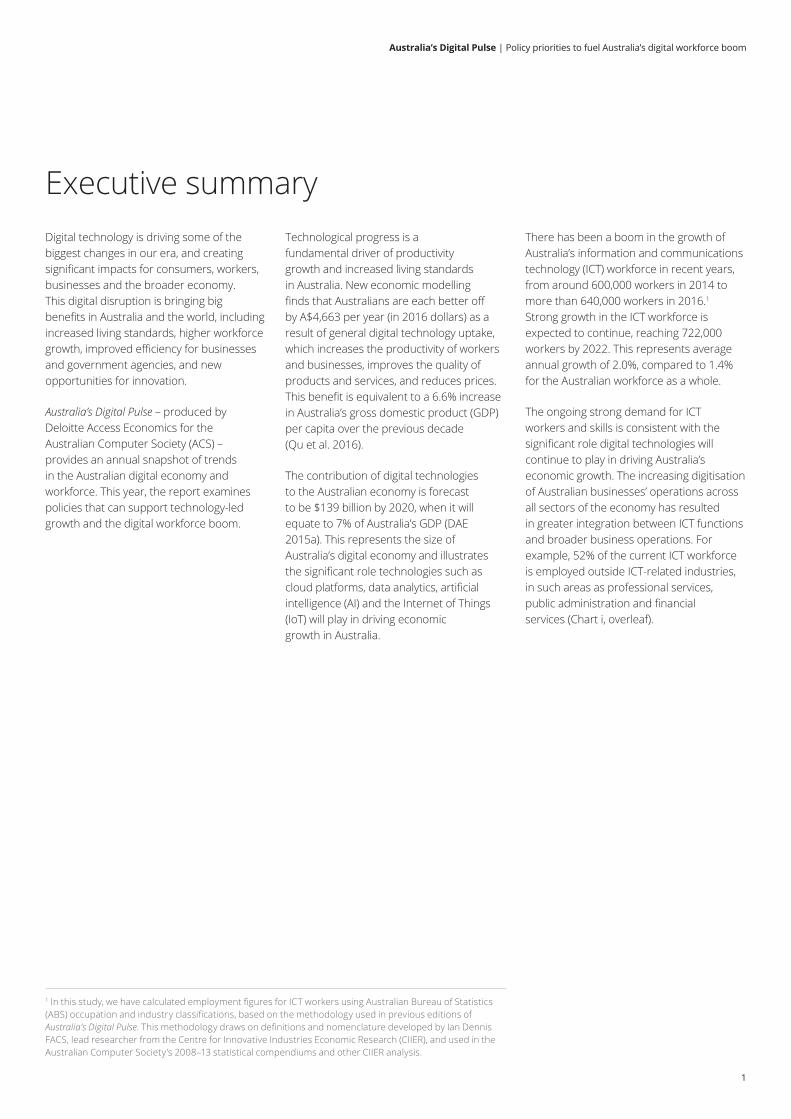
Digital technology is driving some of the biggest changes in our era, and creating significant impacts for consumers, workers, businesses and the broader economy. This digital disruption is bringing big benefits in Australia and the world, including increased living standards, higher workforce growth, improved efficiency for businesses and government agencies, and new opportunities for innovation.
Australia’s Digital Pulse – produced by Deloitte Access Economics for the Australian Computer Society (ACS) – provides an annual snapshot of trends in the Australian digital economy and workforce. This year, the report examines policies that can support technology-led growth and the digital workforce boom.
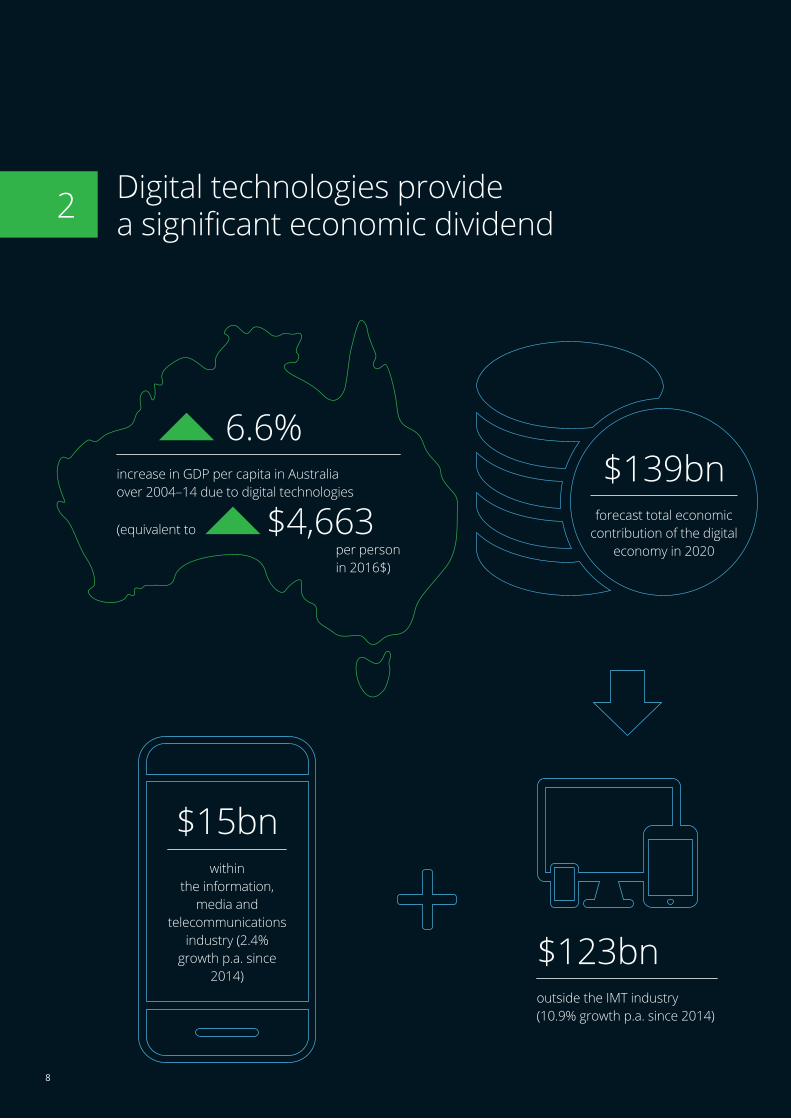
Technological progress is a fundamental driver of productivity growth and increased living standards in Australia. New economic modelling finds that Australians are each better off by A$4,663 per year (in 2016 dollars) as a result of general digital technology uptake, which increases the productivity of workers and businesses, improves the quality of products and services, and reduces prices. This benefit is equivalent to a 6.6% increase in Australia’s gross domestic product (GDP) per capita over the previous decade (Qu et al. 2016).
The contribution of digital technologies to the Australian economy is forecast to be $139 billion by 2020, when it will equate to 7% of Australia’s GDP (DAE 2015a). This represents the size of Australia’s digital economy and illustrates the significant role technologies such as cloud platforms, data analytics, artificial intelligence (AI) and the Internet of Things (IoT) will play in driving economic growth in Australia.
There has been a boom in the growth of Australia’s information and communications technology (ICT) workforce in recent years, from around 600,000 workers in 2014 to more than 640,000 workers in 2016.1 Strong growth in the ICT workforce is expected to continue, reaching 722,000 workers by 2022. This represents average annual growth of 2.0%, compared to 1.4% for the Australian workforce as a whole.
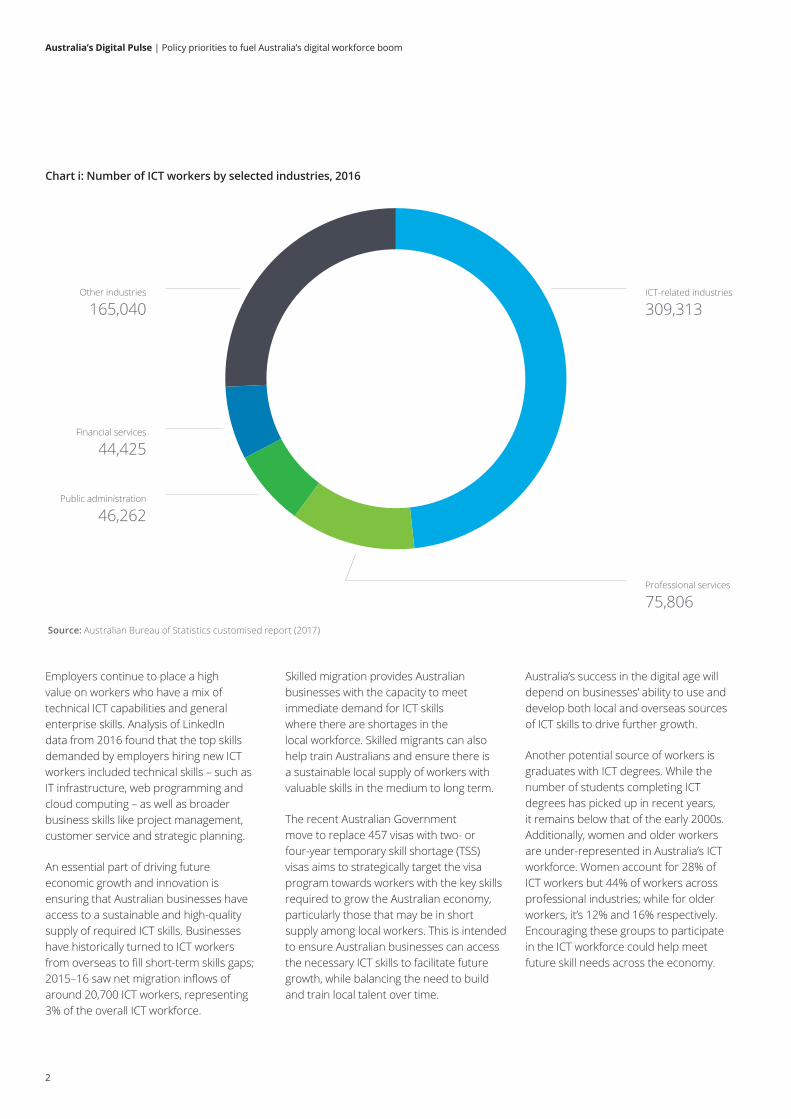
The ongoing strong demand for ICT workers and skills is consistent with the significant role digital technologies will continue to play in driving Australia’s economic growth. The increasing digitisation of Australian businesses’ operations across all sectors of the economy has resulted in greater integration between ICT functions and broader business operations. For example, 52% of the current ICT workforce is employed outside ICT-related industries, in such areas as professional services, public administration and financial services (Chart i, overleaf).
Australia’s Digital Pulse | Policy priorities to fuel Australia’s digital workforce boom
2
Chart i: Number of ICT workers by selected industries, 2016
Source: Australian Bureau of Statistics customised report (2017)
ICT-related industries
309,313Other industries
165,040
Financial services
44,425
Public administration
46,262
Professional services
75,806
Employers continue to place a high value on workers who have a mix of technical ICT capabilities and general enterprise skills. Analysis of LinkedIn data from 2016 found that the top skills demanded by employers hiring new ICT workers included technical skills – such as IT infrastructure, web programming and cloud computing – as well as broader business skills like project management, customer service and strategic planning.
An essential part of driving future economic growth and innovation is ensuring that Australian businesses have access to a sustainable and high-quality supply of required ICT skills. Businesses have historically turned to ICT workers from overseas to fill short-term skills gaps; 2015–16 saw net migration inflows of around 20,700 ICT workers, representing 3% of the overall ICT workforce.
Skilled migration provides Australian businesses with the capacity to meet immediate demand for ICT skills where there are shortages in the local workforce. Skilled migrants can also help train Australians and ensure there is a sustainable local supply of workers with valuable skills in the medium to long term.
The recent Australian Government move to replace 457 visas with two- or four-year temporary skill shortage (TSS) visas aims to strategically target the visa program towards workers with the key skills required to grow the Australian economy, particularly those that may be in short supply among local workers. This is intended to ensure Australian businesses can access the necessary ICT skills to facilitate future growth, while balancing the need to build and train local talent over time.
Australia’s success in the digital age will depend on businesses’ ability to use and develop both local and overseas sources of ICT skills to drive further growth.
Another potential source of workers is graduates with ICT degrees. While the number of students completing ICT degrees has picked up in recent years, it remains below that of the early 2000s. Additionally, women and older workers are under-represented in Australia’s ICT workforce. Women account for 28% of ICT workers but 44% of workers across professional industries; while for older workers, it’s 12% and 16% respectively. Encouraging these groups to participate in the ICT workforce could help meet future skill needs across the economy.
Australia’s Digital Pulse | Policy priorities to fuel Australia’s digital workforce boom
3
Australia’s digital revolution is primarily driven by consumers and businesses, who have rapidly taken up increasingly convenient and cheaper digital tools such as social media, and mobile and cloud technology. The growth of digital ecosystems across Australian cities creates clusters of firms, suppliers, researchers and related networks to enable digitally driven collaboration and innovation. These ecosystems operate across a range of broader industries, reflecting the economy-wide impacts of digital disruption. However, key to the success of each of these digital ecosystems is a strong ICT core; that is, ICT skills and workers that will provide the foundations on which growth and innovation can be built.
Trade in ICT continues to grow; Australia’s ICT services exports increased by 12% to $2.8 billion in 2015–16. In addition, our goods exports have included a greater share of embedded digital technologies over recent years as there has been greater uptake of new technologies across key economically significant industries, such as agriculture and manufacturing. The ICT input share of Australia’s goods exports increased from 4% in 2013 to 7% in 2016.
This increasing digital activity also brings risks, such as the cyber security risks from the digitisation of more consumer and business transactions. The average cost of a cyber attack to an Australian business is around $419,000 (Ponemon Institute 2015). On the flipside, the development of Australia’s cyber capabilities presents new opportunities for digital growth and innovation. Economic modelling suggests that a greater focus on cyber security by Australian businesses could increase business investment by 5.5% and wages by 2.0%. It could also employ an additional 60,000 people by 2030 (Deloitte 2017a).
As Australia’s digital economy develops, there is a range of opportunities to refine the policy framework and the Government’s role in facilitating digitally led growth, so that Australia can reap the full dividends from the digital era. There are opportunities to:
• Build digital communities to facilitate collaboration and innovation. Facilitating a supportive environment will encourage growth, particularly in the early stages of developing digital ecosystems across Australia. Initiatives could be targeted at building digital communities in particular sectors.
• Continue to support digital skills development in education. Encouraging continued policy support for introducing coding in school classrooms, multidisciplinary degrees and relevant training programs will help to build a pipeline of workers with valuable ICT skills.
• Use skilled migration appropriately to support skill needs and build local talent. We must maintain an open approach to skilled migration while ensuring it addresses genuine skills shortages and avoids exploitation of migrant workers.
• Strengthen Australia’s cyber security capabilities. It’s important for the government to collaborate with industry and academia to address cyber security threats; better detect and respond to vulnerabilities and attacks; and build Australia’s cyber skills and capabilities.
• Accelerate efforts towards open data. Work must continue towards making more government data publicly available, and considering how best to analyse data to improve our national welfare.
• Support digital transformation in government. Efforts must continue towards the digital transformation of government transactions and services, and learning from recent challenges associated with this digitisation process.
• Respond to technology-related workforce disruption. Planning and investing in necessary technology, innovation and education policies will ensure Australia can fully realise the benefits from new jobs and industries that emerge as the digital economy grows.
• Improve the measurement of the digital economy and workforce. The government must work towards improving the availability of data on the digital economy, and ensure that the information collected accurately captures the innovative and dynamic activity of Australia’s digital industries and workforce.
• Provide adequate access to digital infrastructure for regional businesses. Policy can assist in addressing gaps in National Broadband Network (NBN) service provision to ensure that the infrastructure needs of businesses in regional Australia are met.
• Create a 5G data policy in Australia. Collaboration with industry and research agencies will help to optimise the effectiveness of 5G mobile technology deployment in a way that creates new opportunities and addresses known challenges.
• Maintain Australia’s research and development (R&D) tax incentives. The government must maintain certainty in R&D tax policy settings and carefully consider a federal government response to the Review of the R&D Tax Incentive, to achieve R&D policy objectives.
• Support small businesses, startups and innovation in government procurement. Improving procurement practices will help to reduce costs, provide new ICT supply opportunities for small businesses and startups, and leverage innovative solutions while strengthening the local tech industry.
• Adopt a ‘fair use’ approach to copyright. Given the growth in cloud computing and data-mining activities, efforts should focus on increasing Australia’s attractiveness as a market for technology investment and innovation.
Australia’s Digital Pulse | Policy priorities to fuel Australia’s digital workforce boom
4
Digital disruption has significantly increased the types and uses of technology available throughout the Australian economy. Businesses operating across different industries and locations are seeking new ways to apply digital technologies to enhance productivity, improve customer interactions and accelerate business growth, among other benefits.
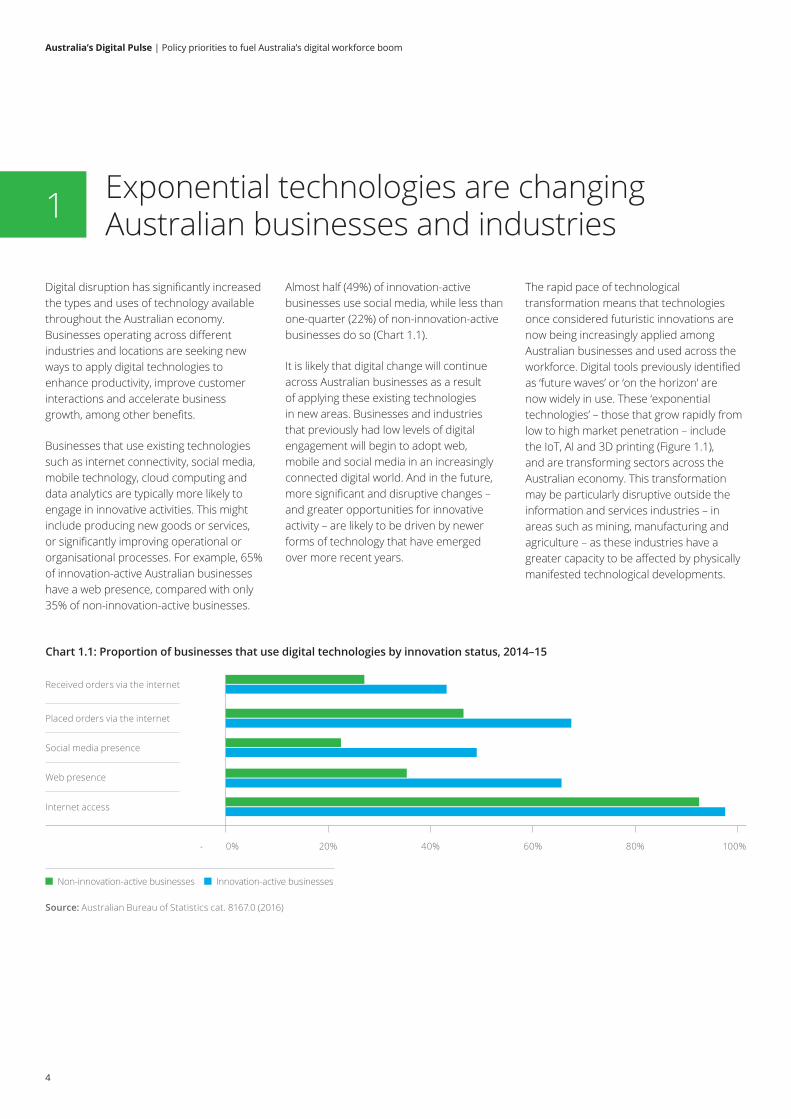
Businesses that use existing technologies such as internet connectivity, social media, mobile technology, cloud computing and data analytics are typically more likely to engage in innovative activities. This might include producing new goods or services, or significantly improving operational or organisational processes. For example, 65% of innovation-active Australian businesses have a web presence, compared with only 35% of non-innovation-active businesses.
Exponential technologies are changing Australian businesses and industries1
Chart 1.1: Proportion of businesses that use digital technologies by innovation status, 2014–15
Source: Australian Bureau of Statistics cat. 8167.0 (2016)
0% 20% 40% 100%60% 80%
Placed orders via the internet
Received orders via the internet
Social media presence
Web presence
Internet access
Non-innovation-active businesses Innovation-active businesses
Almost half (49%) of innovation-active businesses use social media, while less than one-quarter (22%) of non-innovation-active businesses do so (Chart 1.1).
It is likely that digital change will continue across Australian businesses as a result of applying these existing technologies in new areas. Businesses and industries that previously had low levels of digital engagement will begin to adopt web, mobile and social media in an increasingly connected digital world. And in the future, more significant and disruptive changes – and greater opportunities for innovative activity – are likely to be driven by newer forms of technology that have emerged over more recent years.
The rapid pace of technological transformation means that technologies once considered futuristic innovations are now being increasingly applied among Australian businesses and used across the workforce. Digital tools previously identified as ‘future waves’ or ‘on the horizon’ are now widely in use. These ‘exponential technologies’ – those that grow rapidly from low to high market penetration – include the IoT, AI and 3D printing (Figure 1.1), and are transforming sectors across the Australian economy. This transformation may be particularly disruptive outside the information and services industries – in areas such as mining, manufacturing and agriculture – as these industries have a greater capacity to be affected by physically manifested technological developments.
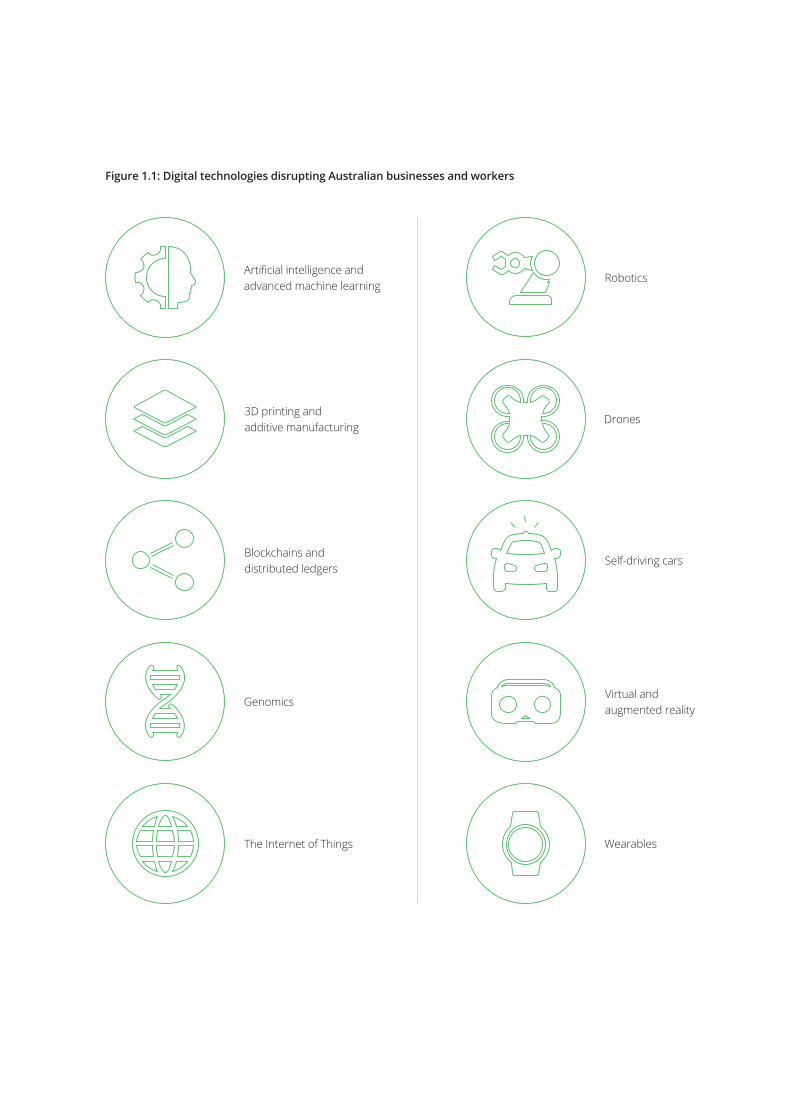
Figure 1.1: Digital technologies disrupting Australian businesses and workers
Australia’s Digital Pulse | Policy priorities to fuel Australia's digital workforce boom
5
Artificial intelligence and advanced machine learning
3D printing and additive manufacturing
Blockchains and distributed ledgers
Genomics
The Internet of Things
Robotics
Drones
Self-driving cars
Virtual and augmented reality
Wearables
Australia’s Digital Pulse | Policy priorities to fuel Australia’s digital workforce boom
6
Agriculture and the Internet of Things
Capturing on-farm data can allow real-time decision making and improve crop yields
Agriculture has historically been a key component of the Australian economy, particularly in regional and rural areas. Rising global demand for high-quality food products, particularly in the Asia-Pacific region, will create significant growth and export opportunities for Australian agribusinesses in the future.
A recent trend in the agriculture industry is the rise of technology-driven ‘smart agriculture’ and the application of big data analytics across the sector (RIRDC 2016). This has been enabled by the proliferation of on-farm sensor technology, which, using the IoT, lets farmers remotely monitor and capture data on metrics such as soil moisture, crop growth and livestock feed levels. This data can be processed in real time to analyse conditions and aid decision making, to help boost crop productivity and yields while reducing on-farm costs across the agricultural industry (CSIRO 2015).
The potential for future growth in this area is huge. Research has forecast that the average farm will generate an average of 4.1 million data points per day by 2050, compared to only 190,000 in 2014 (Meola 2016). Tapping into the opportunities for the IoT to drive productivity improvements can facilitate future export-led growth in the Australian agriculture sector. The Australian Government has created a Rural Research and Development for Profit program to support farmers seeking to invest in and implement these technological innovations (Department of Agriculture and Water Resources 2017).
Advanced manufacturing and 3D printing
New technologies provide opportunities to manufacture more advanced and complex products on demand
Technological developments have enabled manufacturers to produce complex and high-value-add goods with niche applications in specific industries. This boom in advanced manufacturing enables Australian manufacturers to supply unique and specialised products to other domestic industries, and to transfer this expertise into overseas export markets.
3D printing is an additive process of layering materials based on instructions from refined digital models of the final product. This technology has particular applications in advanced manufacturing and allows individualised products to be manufactured faster and cheaper, benefiting a range of industries. For example, it’s easier to make affordable medical prosthetics precisely tailored to a patient, or to create architectural models and designs more quickly and affordably than before (A3DMA 2017). Estimates suggest that using 3D printing can reduce product development time by up to 96% (Barnes 2013).
With the country’s traditional manufacturing base being eroded by overseas competition, advanced manufacturing and 3D printing are emerging as the means by which Australia’s manufacturing industry can become more innovative and add more value. In recognition of this, the Australian Government has established an Advanced Manufacturing Industry Growth Centre to drive collaboration between industry, academia and policymakers, and increase the sector’s competitiveness.
The following case studies describe how some of these previously identified ‘emerging’ technologies are now actively disrupting industries and businesses throughout the Australian economy. They illustrate the significant change that exponential technologies can create, and the benefits to be gained from applying them in various sectors.
Australia’s Digital Pulse | Policy priorities to fuel Australia’s digital workforce boom
7
Healthcare and robotics
Implementing new technologies can improve healthcare outcomes, particularly in regional Australia
The healthcare industry is a significant part of the Australian economy, particularly in the context of services-led economic growth. Living a healthy life is universally recognised as a basic human right, so the healthcare sector also plays a critical social role in ensuring the wellbeing of the Australian population. However, there can be challenges in providing quality healthcare to regional and remote Australia, where populations are smaller, distances are larger and resources are limited.
Robotics – which is rapidly becoming cheaper and more capable – can help improve healthcare service delivery in regional areas. This technology can help regional patients avoid travelling long distances to specialist clinics to undergo medical procedures. For example, new technologies have allowed medical professionals to conduct ultrasound procedures up to 1,000 kilometres away (Best 2016). And as modern robotic technologies become increasingly advanced and reliable, they are appearing in many surgery rooms across Australia, where their precision helps to speed up recovery times and reduce scarring (Stokes 2016).
The projection of ageing populations in Australia and globally implies significant increases in demand for healthcare in the future. Robotic technologies have the potential to help alleviate workforce shortages associated with this increased demand. With a forecast global shortfall of 18 million health workers by 2030, robotics could enhance and supplement the healthcare workforce, particularly in regional areas and developing countries (Limb 2016).
Financial services and artificial intelligence
Artificial intelligence is efficiently providing personalised financial advice
Financial advice enables many Australian households and businesses to better understand how they can achieve financial goals such as owning a home or obtaining a business loan. For the industry to remain relevant and fulfil its growth potential, this advice must be affordable, timely and personalised to the needs of each individual customer.
The financial services industry is increasingly turning to artificial intelligence (AI) to meet the needs of its customer base. Voice services or ‘chatbots’ similar to Apple’s Siri, Microsoft’s Cortana and Amazon’s Alexa can now interact through ‘virtual conversations’ with customers seeking financial advice. These AI systems use algorithms to gather information and analyse customers’ requirements, so they can perform actions faster than human operators and at any time of the day. For example, AMP has begun trialling an online chatbot developed by Sydney-based company Flamingo, to help customers choose which financial product might best suit their situation (Uribe 2017).
As AI technology continues to develop, the share of advice provided by machines will rise. It has been predicted that by 2020, robotic advisers will manage US investment assets worth more than US$2 trillion (A.T. Kearney 2015). Given the significant implications this could have for consumers and businesses across the Australian economy, appropriate government regulation is required to ensure that the associated risks are adequately managed. The Australian Securities and Investments Commission (ASIC) has recently consulted with the financial services industry and provided regulatory guidance regarding algorithm-based financial advice (Wong 2016).
forecast total economic contribution of the digital
economy in 2020
$139bn
within the information,
media and telecommunications
industry (2.4% growth p.a. since
2014)
$15bn
outside the IMT industry (10.9% growth p.a. since 2014)
$123bn
increase in GDP per capita in Australia over 2004–14 due to digital technologies
6.6%
$4,663per person in 2016$)
(equivalent to
Digital technologies provide a significant economic dividend2
8
Australia’s Digital Pulse | Policy priorities to fuel Australia’s digital workforce boom
9
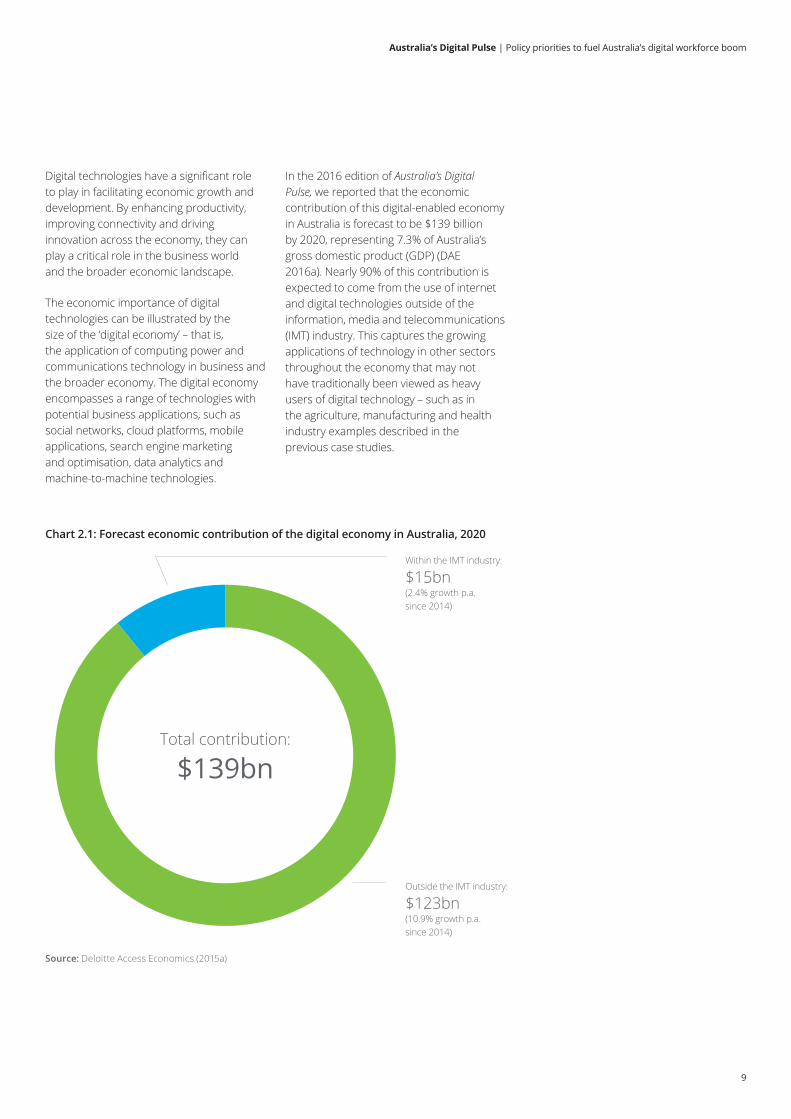
Digital technologies have a significant role to play in facilitating economic growth and development. By enhancing productivity, improving connectivity and driving innovation across the economy, they can play a critical role in the business world and the broader economic landscape.
The economic importance of digital technologies can be illustrated by the size of the ‘digital economy’ – that is, the application of computing power and communications technology in business and the broader economy. The digital economy encompasses a range of technologies with potential business applications, such as social networks, cloud platforms, mobile applications, search engine marketing and optimisation, data analytics and machine-to-machine technologies.
Chart 2.1: Forecast economic contribution of the digital economy in Australia, 2020
Source: Deloitte Access Economics (2015a)
Within the IMT industry:
$15bn (2.4% growth p.a. since 2014)
Outside the IMT industry:
$123bn (10.9% growth p.a. since 2014)
Total contribution:
$139bn
In the 2016 edition of Australia’s Digital Pulse, we reported that the economic contribution of this digital-enabled economy in Australia is forecast to be $139 billion by 2020, representing 7.3% of Australia’s gross domestic product (GDP) (DAE 2016a). Nearly 90% of this contribution is expected to come from the use of internet and digital technologies outside of the information, media and telecommunications (IMT) industry. This captures the growing applications of technology in other sectors throughout the economy that may not have traditionally been viewed as heavy users of digital technology – such as in the agriculture, manufacturing and health industry examples described in the previous case studies.
Australia’s Digital Pulse | Policy priorities to fuel Australia’s digital workforce boom
10
The size of the digital economy and its future growth is one way to measure the economic significance of digital technologies in Australia. Another question we could ask in this context is: ‘To what extent has technology actually driven economic growth over time in Australia?’
Traditionally, research into the economic impacts of technology on economic growth and productivity has tended to focus on the effect of ‘capital deepening’ through a growth accounting framework. As such, these studies only narrowly examine the effects of investment in ICT equipment and how this investment directly influences labour productivity. However, this capital deepening effect does not capture the full economic benefits of modern digital technologies, since the benefits associated with more recent ICT advances are primarily generated through productivity-enhancing ‘spillover’ effects – such as lower transaction costs and more robust competition – as new technologies are adopted by industries throughout the economy over time.
For example, cloud computing technologies have enabled a shift towards online service delivery, such as through Amazon Web Services and Google Cloud Platform. These cloud-based tools can substantially reduce the need for businesses to invest in physical ICT capital, so the benefits of adopting this technology are not accurately captured in the traditional capital deepening approach. Yet adopting these digital tools can lead to significant productivity benefits and efficiency gains for Australian businesses. In this context, investment in ICT capital is perhaps a poor measure for the benefits of adopting many modern technologies.
In relation to productivity in the Australian economy, the Productivity Commission (PC) has previously stated that ‘most fundamental of all is technological progress (in effect new knowledge), which leads to new products, new machines, and new ways of doing things’ (PC 2016a). Given the critical link between technological advancement and economic growth, more recent studies have aimed to broaden the discussion around the economic benefits of digital technologies.
The benefit of understanding how digital technologies influence overall productivity extends beyond national accounting statistics; rather, it provides a starting point for predicting the potential economic impact of new technologies in the future. For example, Brynjolfsson and McAfee (2014) argue that the fourth industrial revolution is just beginning, while Gordon (2015) contends that further ICT developments will bring diminishing economic returns.
A Deloitte Access Economics research paper that examined the productivity enhancements associated with adopting digital technologies across the Australian economy (Qu et al. 2016) found a significant impact on long-term economic growth. The results of this research suggest that technology use has been a major contributor to increased living standards in Australia; indeed, the adoption of digital technologies contributed to a 6.6% increase in Australia’s steady-state GDP per capita over the decade to 2014.2 This is equivalent to $4,663 per person in 2016 Australian dollar terms.
2 The analysis separately controlled for firms’ capital investment (including in ICT capital) in the growth equation. As such, this impact represents the benefits of digital technology adoption on Australia’s output above and beyond what may result from the capital deepening effect.
Measuring the economic benefits of technology
Research methodology
The Deloitte Access Economics researchers (Qu et al. 2016) used cross-country time series data to examine the impact of digital technologies on growth performance over time. Economic growth was modelled for 37 countries over the 2000–14 period. Adoption and prevalence rates for digital technologies in these countries were based on rates of internet use and mobile phone penetration, both of which are essential for propagating modern digital technologies among business and consumer users.
The economic framework was based on a standard neoclassical growth model, where growth is measured as a function of investment in physical capital, the depreciation rate, the stock of human capital and the population growth rate. The research extended this standard growth model by adding a set of policy and institutional factors, plus the measures of internet use and mobile penetration outlined above.
Australia’s Digital Pulse | Policy priorities to fuel Australia’s digital workforce boom
11
A number of other studies also recognise the role of digital technologies in facilitating a broader variety of economic and social benefits, some of which are not reflected in measures of economic activity such as GDP. As the Organisation for Economic Co-operation and Development (OECD) has noted (2013), digital technology can lead to various consumer surplus and social welfare gains that can be difficult to quantify. These gains include increased competition, improved consumer convenience and greater product choice.
The economy-wide benefits associated with adopting digital technologies are driven by the implementation and use of different types of technology at the individual business, worker and consumer level. In this context, certain segments of the Australian economy may benefit more than others from adopting modern digital technologies.
For example, small businesses can benefit significantly from using digital technologies, such as by having a business website or engaging in online marketing strategies, which improve accessibility, information availability and customer communications. While companies of all sizes can use digital tools and realise these benefits, the opportunities are particularly important for small businesses, which may not otherwise have the size or reach to engage with existing or new customers. A previous Deloitte Access Economics report, Connected Small Businesses (2016b), found that by adopting digital tools and boosting digital engagement, Australian small businesses can achieve significant economic dividends, such as increased revenue growth, job creation, exports and innovative activity.
The potential economic benefits are substantial: implementing new technologies – and finding increasingly diverse applications for existing technologies – can drive productivity improvements and innovation across the Australian economy. As digital technologies continue to be adopted by businesses, workers and consumers, these impacts will continue to yield significant economic dividends in the future.
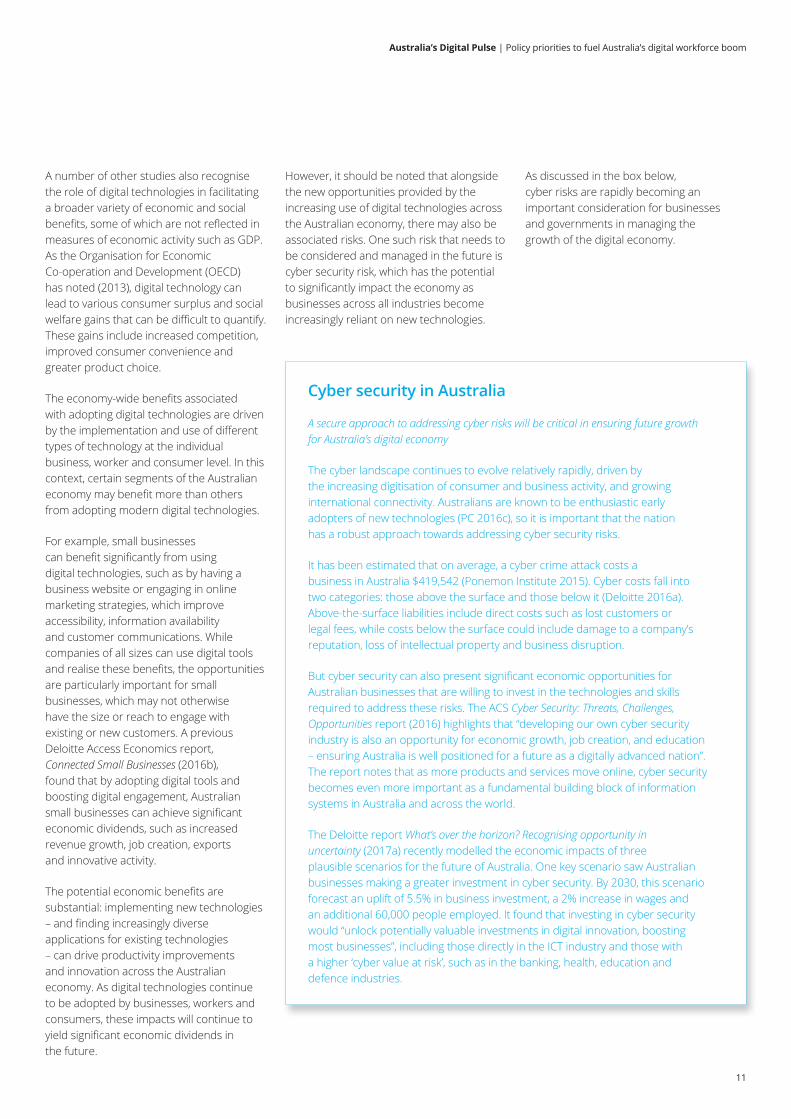
However, it should be noted that alongside the new opportunities provided by the increasing use of digital technologies across the Australian economy, there may also be associated risks. One such risk that needs to be considered and managed in the future is cyber security risk, which has the potential to significantly impact the economy as businesses across all industries become increasingly reliant on new technologies.
As discussed in the box below, cyber risks are rapidly becoming an important consideration for businesses and governments in managing the growth of the digital economy.
Cyber security in Australia
A secure approach to addressing cyber risks will be critical in ensuring future growth for Australia’s digital economy
The cyber landscape continues to evolve relatively rapidly, driven by the increasing digitisation of consumer and business activity, and growing international connectivity. Australians are known to be enthusiastic early adopters of new technologies (PC 2016c), so it is important that the nation has a robust approach towards addressing cyber security risks.
It has been estimated that on average, a cyber crime attack costs a business in Australia $419,542 (Ponemon Institute 2015). Cyber costs fall into two categories: those above the surface and those below it (Deloitte 2016a). Above-the-surface liabilities include direct costs such as lost customers or legal fees, while costs below the surface could include damage to a company’s reputation, loss of intellectual property and business disruption.
But cyber security can also present significant economic opportunities for Australian businesses that are willing to invest in the technologies and skills required to address these risks. The ACS Cyber Security: Threats, Challenges, Opportunities report (2016) highlights that “developing our own cyber security industry is also an opportunity for economic growth, job creation, and education – ensuring Australia is well positioned for a future as a digitally advanced nation”. The report notes that as more products and services move online, cyber security becomes even more important as a fundamental building block of information systems in Australia and across the world.
The Deloitte report What’s over the horizon? Recognising opportunity in uncertainty (2017a) recently modelled the economic impacts of three plausible scenarios for the future of Australia. One key scenario saw Australian businesses making a greater investment in cyber security. By 2030, this scenario forecast an uplift of 5.5% in business investment, a 2% increase in wages and an additional 60,000 people employed. It found that investing in cyber security would “unlock potentially valuable investments in digital innovation, boosting most businesses”, including those directly in the ICT industry and those with a higher ‘cyber value at risk’, such as in the banking, health, education and defence industries.
Australia’s Digital Pulse | Policy priorities to fuel Australia’s digital workforce boom
12
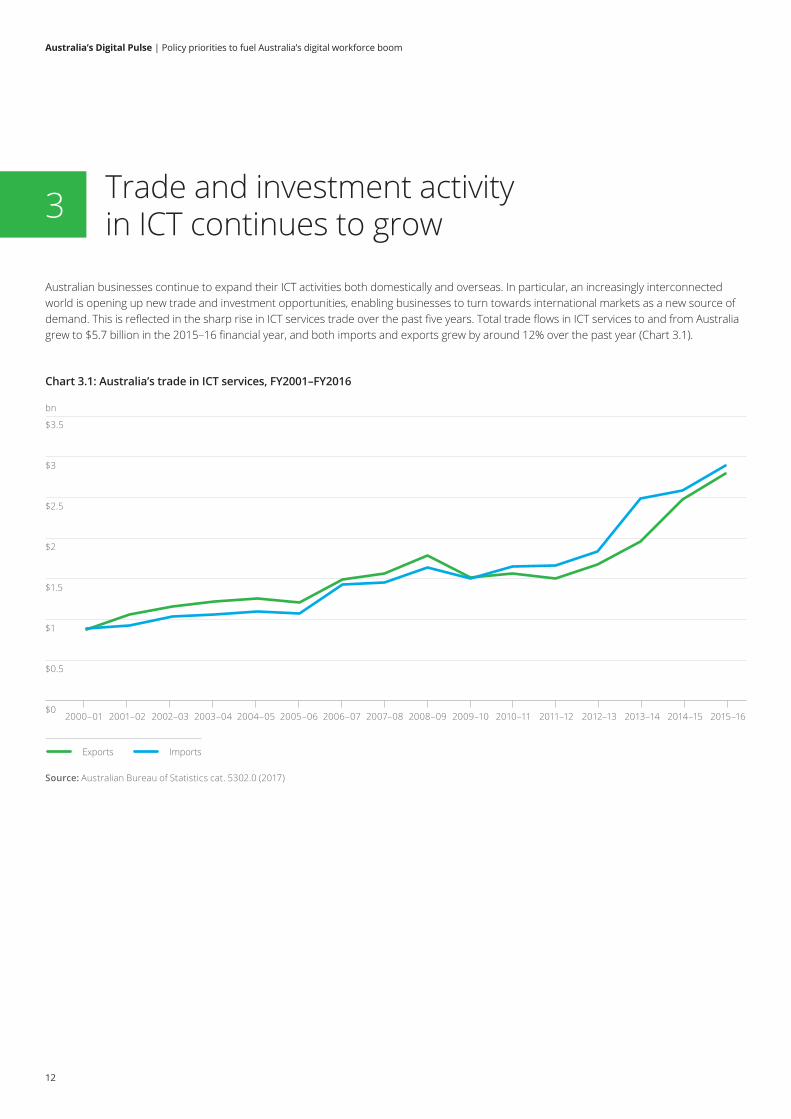
Australian businesses continue to expand their ICT activities both domestically and overseas. In particular, an increasingly interconnected world is opening up new trade and investment opportunities, enabling businesses to turn towards international markets as a new source of demand. This is reflected in the sharp rise in ICT services trade over the past five years. Total trade flows in ICT services to and from Australia grew to $5.7 billion in the 2015–16 financial year, and both imports and exports grew by around 12% over the past year (Chart 3.1).
Trade and investment activity in ICT continues to grow 3
$0.5
$1
$1.5
$2
$2.5
$3.5
bn
$3
Chart 3.1: Australia’s trade in ICT services, FY2001–FY2016
$02007–082006–072005–062004–052003–042002–032000–01 2001–02 2008–09 2009–10 2010–11 2011–12 2015–162014–152013–142012–13
Source: Australian Bureau of Statistics cat. 5302.0 (2017)
Exports Imports
Australia’s Digital Pulse | Policy priorities to fuel Australia’s digital workforce boom
13
Trade in ICT services has increased by around 2.5 times over the past decade, primarily concentrated in computer services for both inflows and outflows, within which hardware and software consultancy services represent the largest share. According to the latest Australian Bureau of Statistics (ABS) trade statistics, Australia’s largest ICT trading partner is the United States, representing around 30% of ICT services exports and imports in 2015 (ABS 2016a).
The rapid rise in ICT trade underscores the growth in international opportunities for businesses that provide innovative service offerings to the market. In particular, Australian businesses that operate in the ICT sector have access to a highly skilled workforce and comparatively low development costs if they wish to specialise in exporting high-value-add ICT services (Australian Trade and Investment Commission 2017). Recognising the important role of these exports in driving Australia’s economic growth, Minister for Trade, Tourism and Investment Steve Ciobo has previously stated that ‘the future will include a diversified export effort, with the high-margin services and technology sectors playing a greater role’ (Abernethy 2017).
In addition to this direct trade in ICT services, digital technologies also facilitate new trade flows in other parts of Australia’s economy. Online platforms and marketplaces allow more Australian consumers to connect with foreign businesses, and more overseas customers to connect with Australian businesses. According to The Future of Trade, a recent report published by Chartered Accountants Australia and New Zealand, digital technology has enabled ‘unprecedented access to a broader range of products and services, and this access is becoming more convenient, faster and cheaper’ (CAANZ 2017). In this context, digital technologies are facilitating but also benefiting from the increasingly globalised nature of economic activity.
Digital technologies are also embedded in Australia’s goods trade. As discussed earlier in this report, new technologies are changing the way goods are produced and delivered in some of Australia’s key exporting industries, including agriculture and advanced manufacturing. Although the final export products in these industries are recorded as goods, digital technologies play an increasingly significant role in producing these goods, and therefore in driving economic growth across the broader Australian economy.
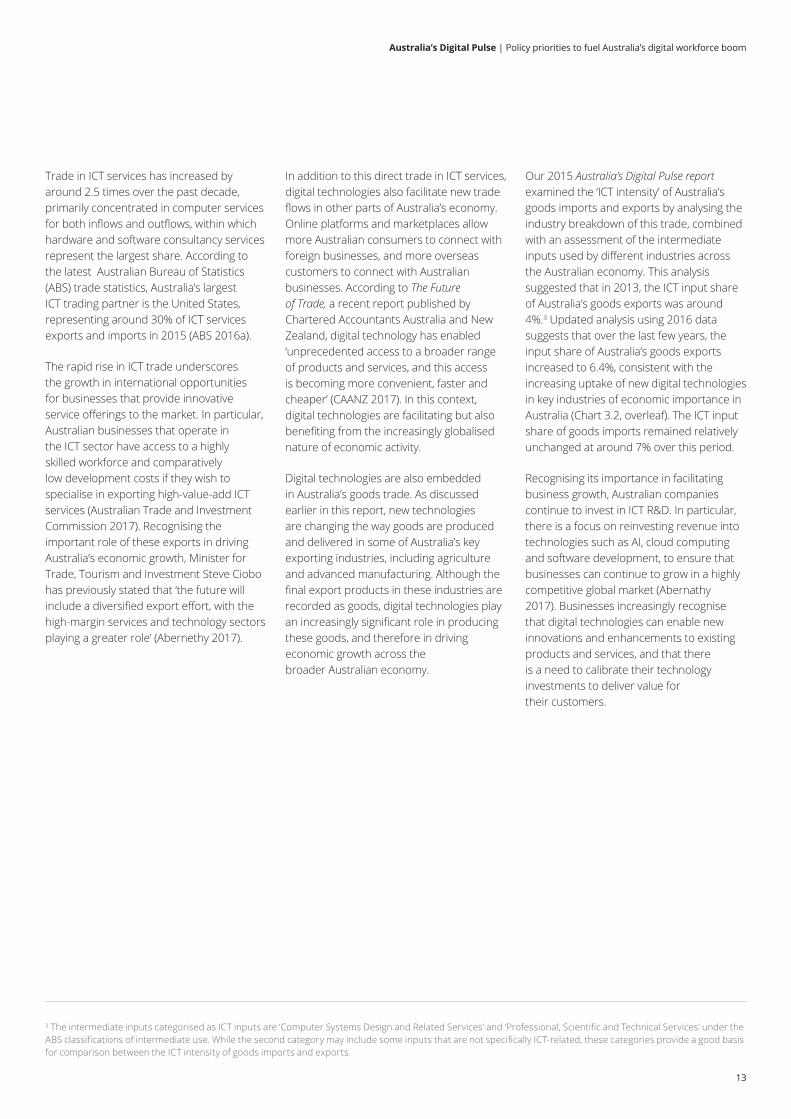
Our 2015 Australia’s Digital Pulse report examined the ‘ICT intensity’ of Australia’s goods imports and exports by analysing the industry breakdown of this trade, combined with an assessment of the intermediate inputs used by different industries across the Australian economy. This analysis suggested that in 2013, the ICT input share of Australia’s goods exports was around 4%.3 Updated analysis using 2016 data suggests that over the last few years, the input share of Australia’s goods exports increased to 6.4%, consistent with the increasing uptake of new digital technologies in key industries of economic importance in Australia (Chart 3.2, overleaf). The ICT input share of goods imports remained relatively unchanged at around 7% over this period.
Recognising its importance in facilitating business growth, Australian companies continue to invest in ICT R&D. In particular, there is a focus on reinvesting revenue into technologies such as AI, cloud computing and software development, to ensure that businesses can continue to grow in a highly competitive global market (Abernathy 2017). Businesses increasingly recognise that digital technologies can enable new innovations and enhancements to existing products and services, and that there is a need to calibrate their technology investments to deliver value for their customers.
3 The intermediate inputs categorised as ICT inputs are ‘Computer Systems Design and Related Services’ and ‘Professional, Scientific and Technical Services’ under the ABS classifications of intermediate use. While the second category may include some inputs that are not specifically ICT-related, these categories provide a good basis for comparison between the ICT intensity of goods imports and exports.
Australia’s Digital Pulse | Policy priorities to fuel Australia’s digital workforce boom
14
Chart 3.2: ICT input share of Australia’s goods trade, 2013 and 2016
1%
2%
3%
4%
5%
7%
8%
6%
0%
Source: ABS catalogues 5209.0 and 5368.0 (2017)
2013 2016
Merchandise imports Merchandise exports
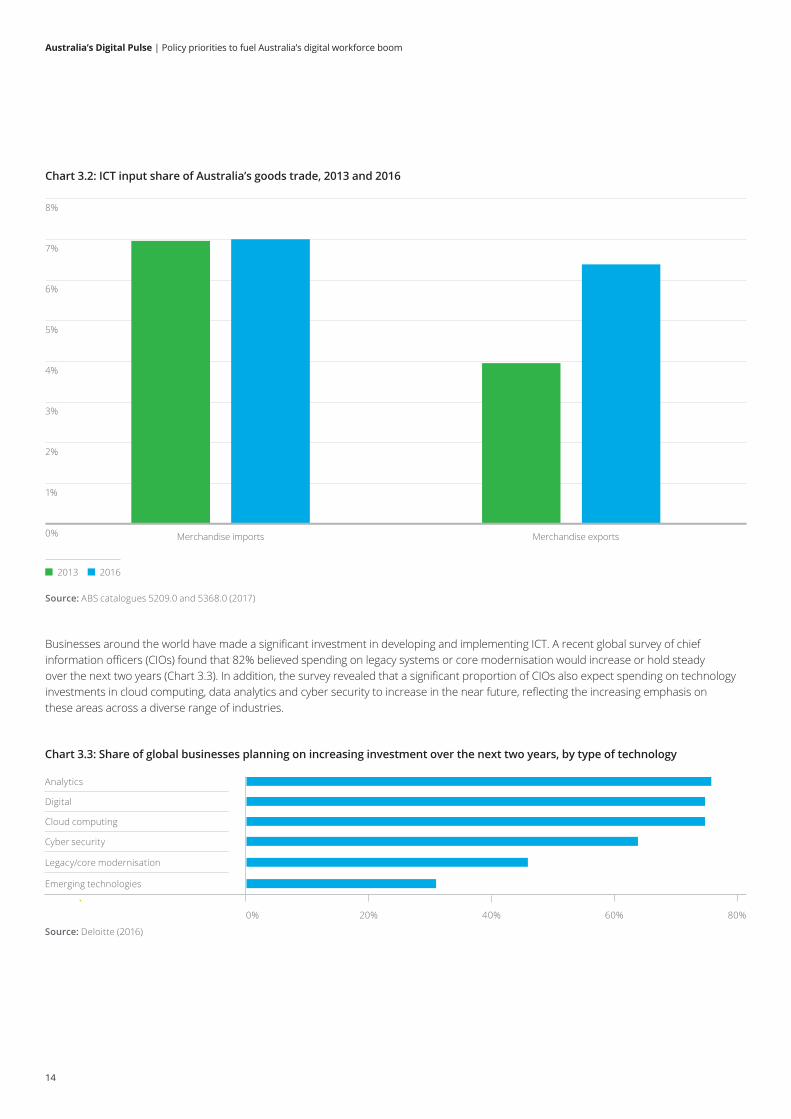
Businesses around the world have made a significant investment in developing and implementing ICT. A recent global survey of chief information officers (CIOs) found that 82% believed spending on legacy systems or core modernisation would increase or hold steady over the next two years (Chart 3.3). In addition, the survey revealed that a significant proportion of CIOs also expect spending on technology investments in cloud computing, data analytics and cyber security to increase in the near future, reflecting the increasing emphasis on these areas across a diverse range of industries.
Chart 3.3: Share of global businesses planning on increasing investment over the next two years, by type of technology
0% 20% 40% 60% 80%
Analytics
Digital
Cloud computing
Cyber security
Legacy/core modernisation
Emerging technologies
Source: Deloitte (2016)
Australia’s Digital Pulse | Policy priorities to fuel Australia’s digital workforce boom
15
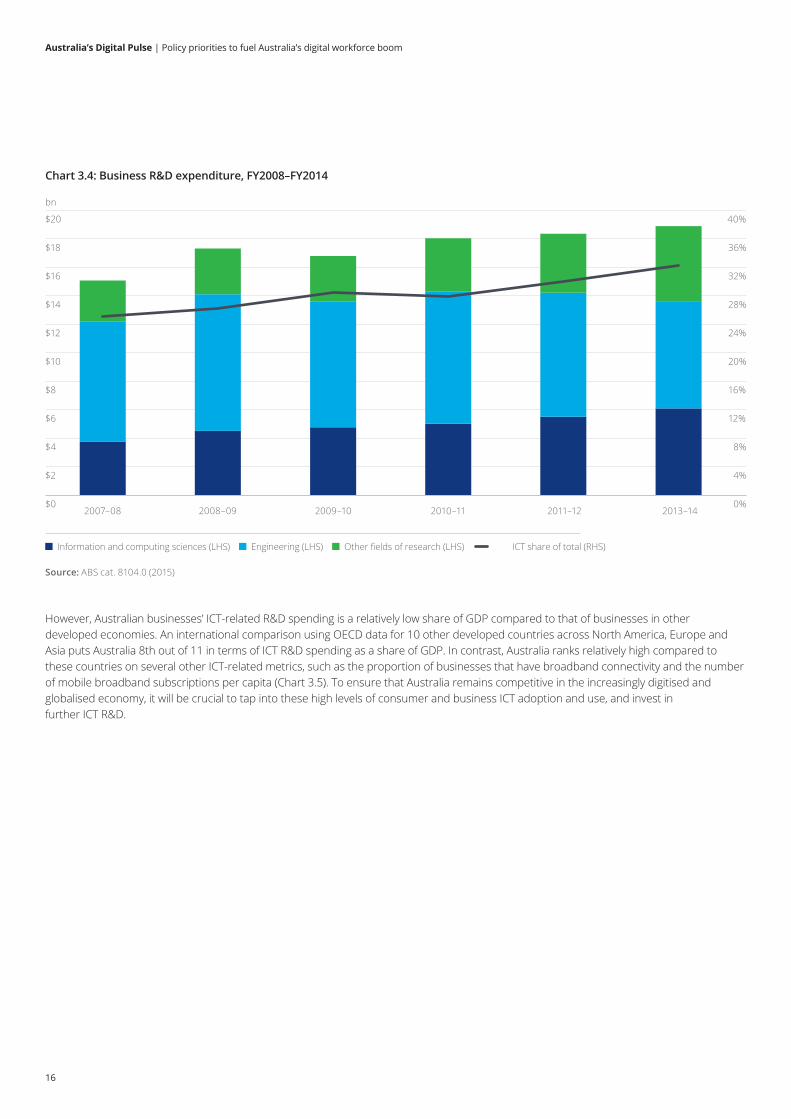
In this context, it is important that Australian businesses continue to invest in technology-related R&D if they are to remain competitive in a constantly evolving global environment. ABS statistics suggest that many Australian companies recognise this; the latest figures indicate that businesses spent more than $6 billion on ICT R&D in the 2013–14 financial year. This accounted for around one-third of total R&D expenditure by Australian businesses, a share that has been progressively increasing over recent years (Chart 3.4, overleaf).
Data opens up new opportunities for businesses
There is significant potential for piloting innovative technologies and using data analytics within the Australian economy
The NSW Data Analytics Centre uses large and varied data sets to inform NSW policy in areas such as transport, education and utilities. The Centre’s Head of Technology, Chris Mendes, says that while his work has been almost entirely digital in nature since his career began in 1989, the importance of developing and using digital technologies has become much more pronounced in recent years. “I’m now seeing the rest of the world catch up as digital technology becomes increasingly widespread in its applications,” he says.
Mr Mendes believes that Australia has significant potential to pilot innovative technology. For example, in a previous role in Canon’s global research team in North Ryde, he managed a research group that worked on rendering optimisations and practical applications of photo printing. “There is a great opportunity for multinationals to conduct this sort of research with ICT professionals in Australia because it’s a relatively small Western market in which their exposure (if an idea fails) is low,” he says. “Companies can therefore take risks and conduct pilots.”
Throughout his career, Mr Mendes has found that using data to drive positive business outcomes requires cultural change. “Many cultural changes around data need to happen in Australian industry,” he says. “As part of my role, I help clients to understand what they can do with their data and what this means from a systems and culture perspective. This openness to technology and data analytics for solving business problems is as valuable in the private sector as it is in the public sector.”
Australia’s Digital Pulse | Policy priorities to fuel Australia’s digital workforce boom
16
$2 4%
$4 8%
$6 12%
$8 16%
$10 20%
$16 32%
$14 28%
$20 40%
bn
$12 24%
$18 36%
Chart 3.4: Business R&D expenditure, FY2008–FY2014
$0 0%2007–08 2008–09 2009–10 2010–11 2011–12 2013–14
Source: ABS cat. 8104.0 (2015)
ICT share of total (RHS)Other fields of research (LHS)Engineering (LHS)Information and computing sciences (LHS)
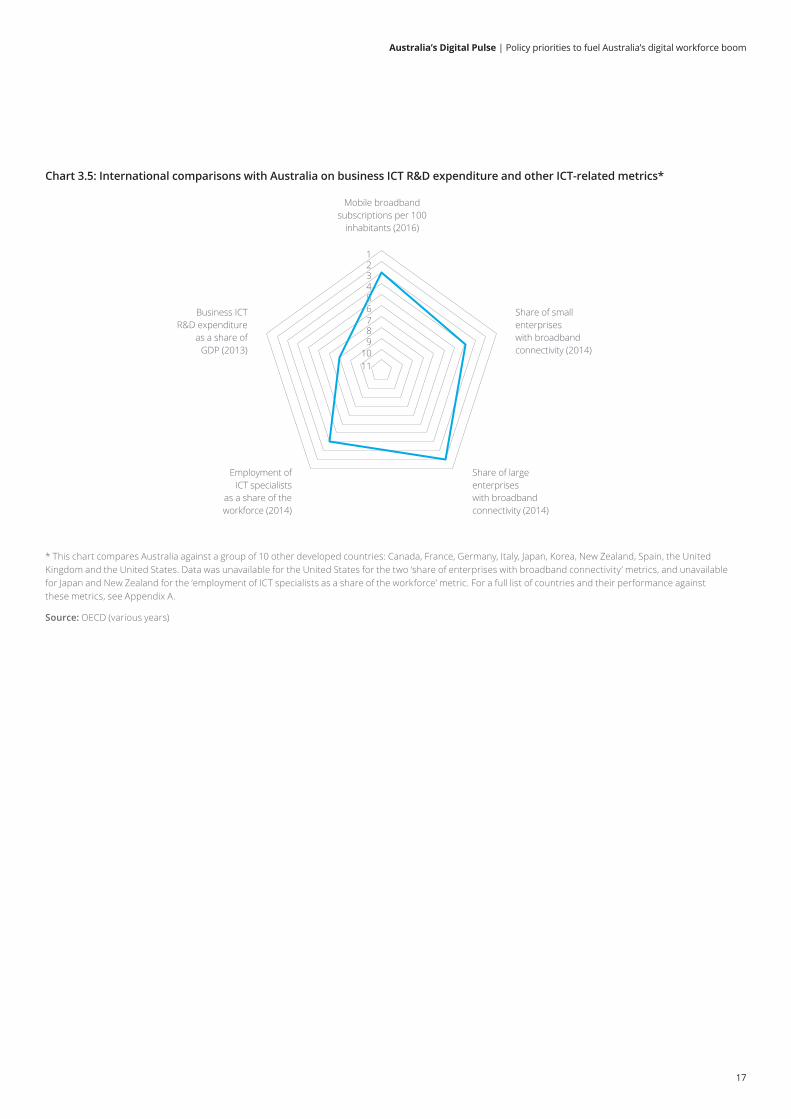
However, Australian businesses’ ICT-related R&D spending is a relatively low share of GDP compared to that of businesses in other developed economies. An international comparison using OECD data for 10 other developed countries across North America, Europe and Asia puts Australia 8th out of 11 in terms of ICT R&D spending as a share of GDP. In contrast, Australia ranks relatively high compared to these countries on several other ICT-related metrics, such as the proportion of businesses that have broadband connectivity and the number of mobile broadband subscriptions per capita (Chart 3.5). To ensure that Australia remains competitive in the increasingly digitised and globalised economy, it will be crucial to tap into these high levels of consumer and business ICT adoption and use, and invest in further ICT R&D.
Australia’s Digital Pulse | Policy priorities to fuel Australia’s digital workforce boom
17
* This chart compares Australia against a group of 10 other developed countries: Canada, France, Germany, Italy, Japan, Korea, New Zealand, Spain, the United Kingdom and the United States. Data was unavailable for the United States for the two ‘share of enterprises with broadband connectivity’ metrics, and unavailable for Japan and New Zealand for the ‘employment of ICT specialists as a share of the workforce’ metric. For a full list of countries and their performance against these metrics, see Appendix A.
Source: OECD (various years)
Chart 3.5: International comparisons with Australia on business ICT R&D expenditure and other ICT-related metrics*
9
Mobile broadband subscriptions per 100
inhabitants (2016)
Share of small enterprises with broadband connectivity (2014)
Business ICT R&D expenditure
as a share of GDP (2013)
Employment of ICT specialists
as a share of the workforce (2014)
Share of large enterprises with broadband connectivity (2014)
87654321
1110
Australia’s Digital Pulse | Policy priorities to fuel Australia’s digital workforce boom
18
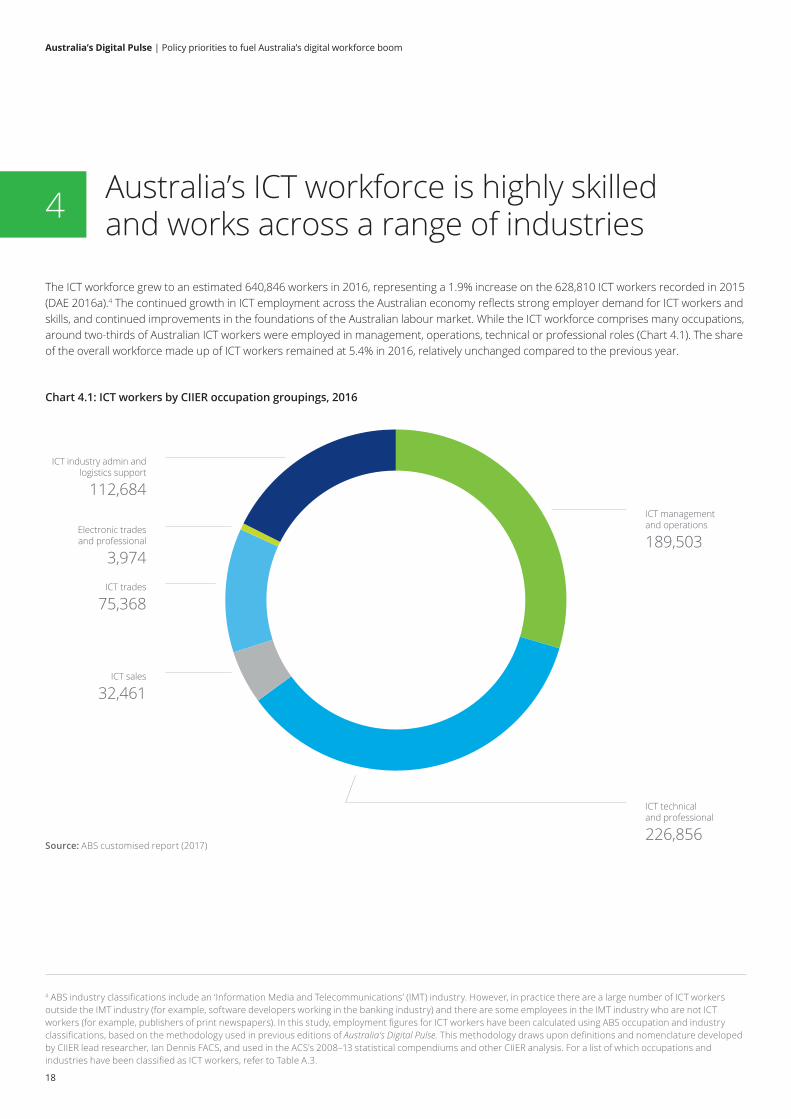
The ICT workforce grew to an estimated 640,846 workers in 2016, representing a 1.9% increase on the 628,810 ICT workers recorded in 2015 (DAE 2016a).4 The continued growth in ICT employment across the Australian economy reflects strong employer demand for ICT workers and skills, and continued improvements in the foundations of the Australian labour market. While the ICT workforce comprises many occupations, around two-thirds of Australian ICT workers were employed in management, operations, technical or professional roles (Chart 4.1). The share of the overall workforce made up of ICT workers remained at 5.4% in 2016, relatively unchanged compared to the previous year.
Australia’s ICT workforce is highly skilled and works across a range of industries4
Chart 4.1: ICT workers by CIIER occupation groupings, 2016
Source: ABS customised report (2017)
ICT management and operations
189,503
ICT industry admin and logistics support
112,684
Electronic trades and professional
3,974
ICT trades
75,368
ICT sales
32,461
ICT technical and professional
226,856
4 ABS industry classifications include an ‘Information Media and Telecommunications’ (IMT) industry. However, in practice there are a large number of ICT workers outside the IMT industry (for example, software developers working in the banking industry) and there are some employees in the IMT industry who are not ICT workers (for example, publishers of print newspapers). In this study, employment figures for ICT workers have been calculated using ABS occupation and industry classifications, based on the methodology used in previous editions of Australia’s Digital Pulse. This methodology draws upon definitions and nomenclature developed by CIIER lead researcher, Ian Dennis FACS, and used in the ACS’s 2008–13 statistical compendiums and other CIIER analysis. For a list of which occupations and industries have been classified as ICT workers, refer to Table A.3.
Australia’s Digital Pulse | Policy priorities to fuel Australia’s digital workforce boom
19
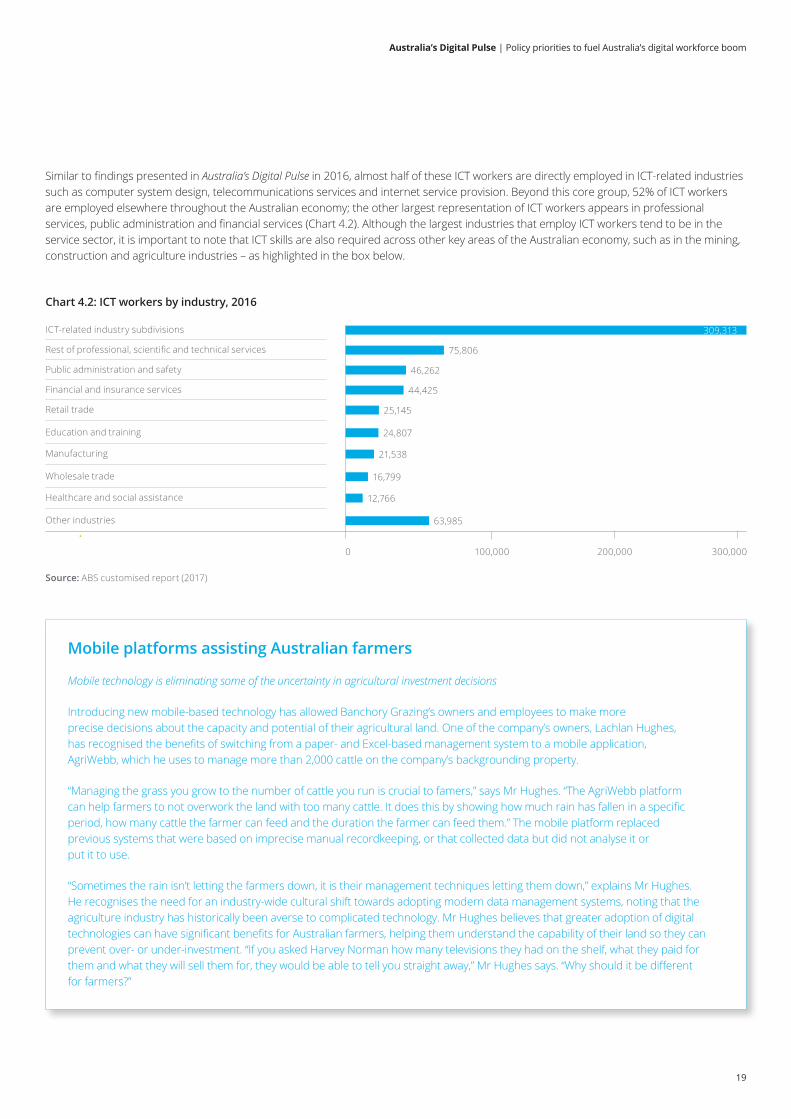
Chart 4.2: ICT workers by industry, 2016
0 100,000 200,000 300,000
ICT-related industry subdivisions
Rest of professional, scientific and technical services
Public administration and safety
Financial and insurance services
Retail trade
Manufacturing
Healthcare and social assistance
Education and training
Wholesale trade
Other industries
Source: ABS customised report (2017)
309,313
75,806
46,262
44,425
25,145
24,807
21,538
16,799
12,766
63,985
Similar to findings presented in Australia’s Digital Pulse in 2016, almost half of these ICT workers are directly employed in ICT-related industries such as computer system design, telecommunications services and internet service provision. Beyond this core group, 52% of ICT workers are employed elsewhere throughout the Australian economy; the other largest representation of ICT workers appears in professional services, public administration and financial services (Chart 4.2). Although the largest industries that employ ICT workers tend to be in the service sector, it is important to note that ICT skills are also required across other key areas of the Australian economy, such as in the mining, construction and agriculture industries – as highlighted in the box below.
Mobile platforms assisting Australian farmers
Mobile technology is eliminating some of the uncertainty in agricultural investment decisions
Introducing new mobile-based technology has allowed Banchory Grazing’s owners and employees to make more precise decisions about the capacity and potential of their agricultural land. One of the company’s owners, Lachlan Hughes, has recognised the benefits of switching from a paper- and Excel-based management system to a mobile application, AgriWebb, which he uses to manage more than 2,000 cattle on the company’s backgrounding property.
“Managing the grass you grow to the number of cattle you run is crucial to famers,” says Mr Hughes. “The AgriWebb platform can help farmers to not overwork the land with too many cattle. It does this by showing how much rain has fallen in a specific period, how many cattle the farmer can feed and the duration the farmer can feed them.” The mobile platform replaced previous systems that were based on imprecise manual recordkeeping, or that collected data but did not analyse it or put it to use.
“Sometimes the rain isn’t letting the farmers down, it is their management techniques letting them down,” explains Mr Hughes. He recognises the need for an industry-wide cultural shift towards adopting modern data management systems, noting that the agriculture industry has historically been averse to complicated technology. Mr Hughes believes that greater adoption of digital technologies can have significant benefits for Australian farmers, helping them understand the capability of their land so they can prevent over- or under-investment. “If you asked Harvey Norman how many televisions they had on the shelf, what they paid for them and what they will sell them for, they would be able to tell you straight away,” Mr Hughes says. “Why should it be different for farmers?”
Australia’s Digital Pulse | Policy priorities to fuel Australia’s digital workforce boom
20
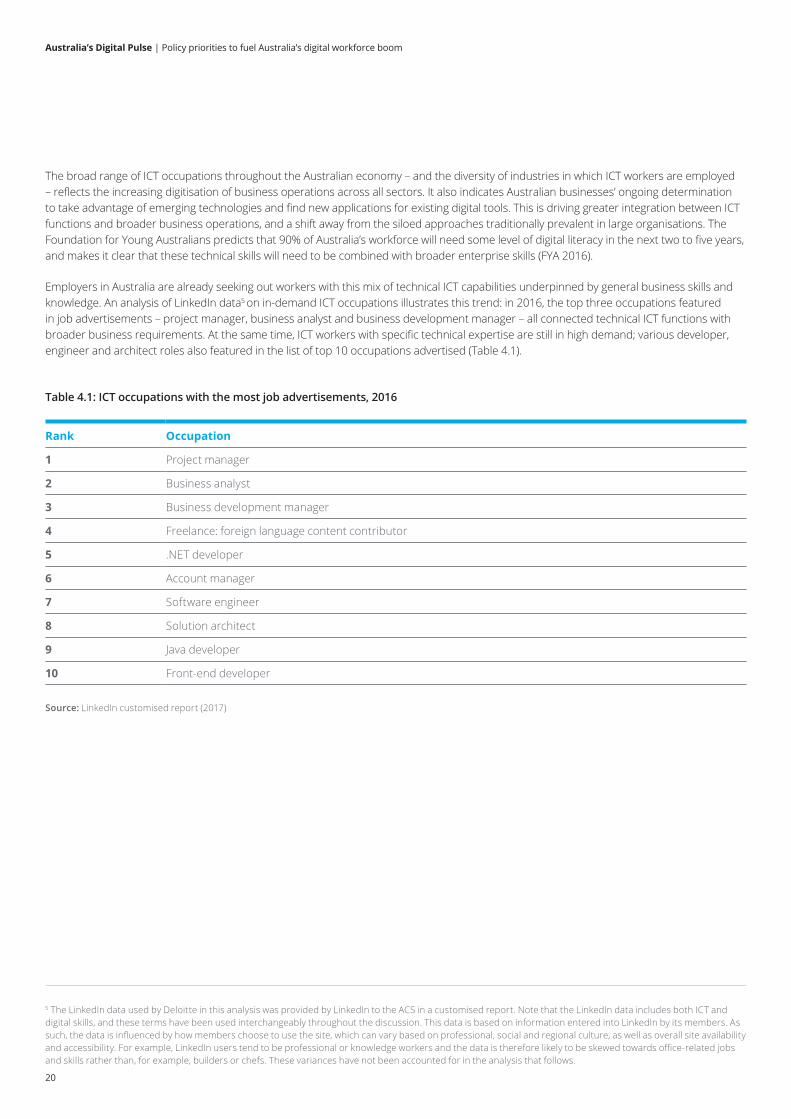
Table 4.1: ICT occupations with the most job advertisements, 2016
The broad range of ICT occupations throughout the Australian economy – and the diversity of industries in which ICT workers are employed – reflects the increasing digitisation of business operations across all sectors. It also indicates Australian businesses’ ongoing determination to take advantage of emerging technologies and find new applications for existing digital tools. This is driving greater integration between ICT functions and broader business operations, and a shift away from the siloed approaches traditionally prevalent in large organisations. The Foundation for Young Australians predicts that 90% of Australia’s workforce will need some level of digital literacy in the next two to five years, and makes it clear that these technical skills will need to be combined with broader enterprise skills (FYA 2016).
Employers in Australia are already seeking out workers with this mix of technical ICT capabilities underpinned by general business skills and knowledge. An analysis of LinkedIn data5 on in-demand ICT occupations illustrates this trend: in 2016, the top three occupations featured in job advertisements – project manager, business analyst and business development manager – all connected technical ICT functions with broader business requirements. At the same time, ICT workers with specific technical expertise are still in high demand; various developer, engineer and architect roles also featured in the list of top 10 occupations advertised (Table 4.1).
Rank Occupation
1 Project manager
2 Business analyst
3 Business development manager
4 Freelance: foreign language content contributor
5 .NET developer
6 Account manager
7 Software engineer
8 Solution architect
9 Java developer
10 Front-end developer
Source: LinkedIn customised report (2017)
5 The LinkedIn data used by Deloitte in this analysis was provided by LinkedIn to the ACS in a customised report. Note that the LinkedIn data includes both ICT and digital skills, and these terms have been used interchangeably throughout the discussion. This data is based on information entered into LinkedIn by its members. As such, the data is influenced by how members choose to use the site, which can vary based on professional, social and regional culture, as well as overall site availability and accessibility. For example, LinkedIn users tend to be professional or knowledge workers and the data is therefore likely to be skewed towards office-related jobs and skills rather than, for example, builders or chefs. These variances have not been accounted for in the analysis that follows.
Australia’s Digital Pulse | Policy priorities to fuel Australia’s digital workforce boom
21
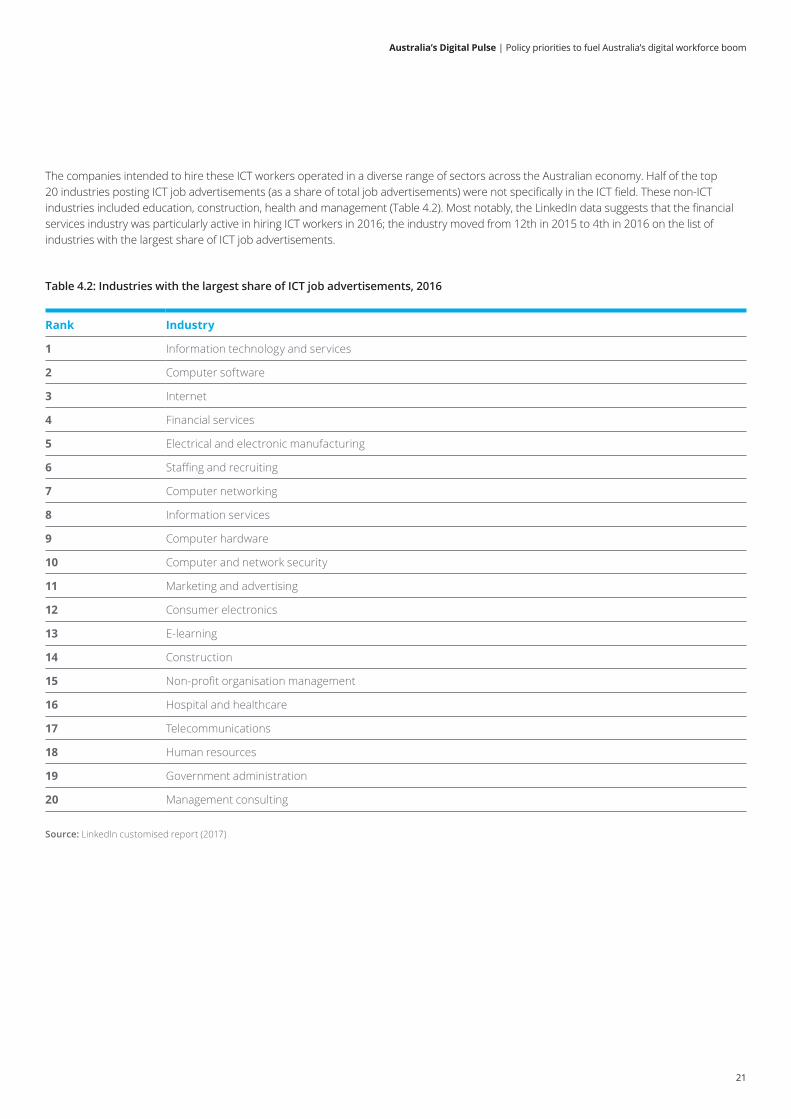
Table 4.2: Industries with the largest share of ICT job advertisements, 2016
Rank Industry
1 Information technology and services
2 Computer software
3 Internet
4 Financial services
5 Electrical and electronic manufacturing
6 Staffing and recruiting
7 Computer networking
8 Information services
9 Computer hardware
10 Computer and network security
11 Marketing and advertising
12 Consumer electronics
13 E-learning
14 Construction
15 Non-profit organisation management
16 Hospital and healthcare
17 Telecommunications
18 Human resources
19 Government administration
20 Management consulting
Source: LinkedIn customised report (2017)
The companies intended to hire these ICT workers operated in a diverse range of sectors across the Australian economy. Half of the top 20 industries posting ICT job advertisements (as a share of total job advertisements) were not specifically in the ICT field. These non-ICT industries included education, construction, health and management (Table 4.2). Most notably, the LinkedIn data suggests that the financial services industry was particularly active in hiring ICT workers in 2016; the industry moved from 12th in 2015 to 4th in 2016 on the list of industries with the largest share of ICT job advertisements.
Australia’s Digital Pulse | Policy priorities to fuel Australia’s digital workforce boom
22
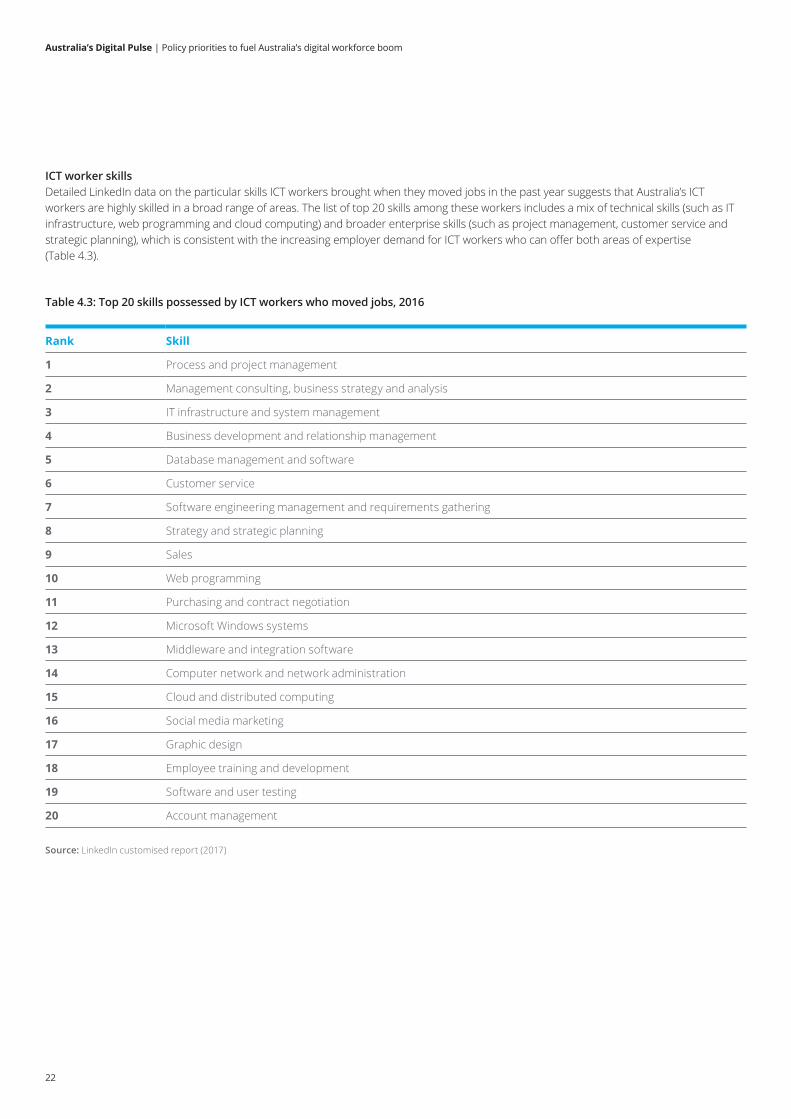
Table 4.3: Top 20 skills possessed by ICT workers who moved jobs, 2016
Rank Skill
1 Process and project management
2 Management consulting, business strategy and analysis
3 IT infrastructure and system management
4 Business development and relationship management
5 Database management and software
6 Customer service
7 Software engineering management and requirements gathering
8 Strategy and strategic planning
9 Sales
10 Web programming
11 Purchasing and contract negotiation
12 Microsoft Windows systems
13 Middleware and integration software
14 Computer network and network administration
15 Cloud and distributed computing
16 Social media marketing
17 Graphic design
18 Employee training and development
19 Software and user testing
20 Account management
Source: LinkedIn customised report (2017)
ICT worker skills Detailed LinkedIn data on the particular skills ICT workers brought when they moved jobs in the past year suggests that Australia’s ICT workers are highly skilled in a broad range of areas. The list of top 20 skills among these workers includes a mix of technical skills (such as IT infrastructure, web programming and cloud computing) and broader enterprise skills (such as project management, customer service and strategic planning), which is consistent with the increasing employer demand for ICT workers who can offer both areas of expertise (Table 4.3).
Australia’s Digital Pulse | Policy priorities to fuel Australia’s digital workforce boom
23
These broader skills are not just valuable for ICT workers already employed in Australia; they are also essential to increasing startup activity and ensuring research ideas are commercialised and translated into innovative new products and services. As highlighted in the box below, starting and growing a new company – particularly in the technology space – requires technical ICT skills to build the right product for the relevant consumer, as well as business and entrepreneurship skills to bring the product to market and develop it over time.
A mix of skills is required to drive digital growth
A new IT system at the National Blood Authority requires employees with technical ICT and general management skills to be successful
The National Blood Authority (NBA) rolled out a new IT system in 2016 to better connect health professionals in hospitals across the country. This is part of a general trend towards an increasing use of digital systems in healthcare, to increase the speed and precision of data transmitted from patients to doctors and between healthcare professionals.
As the Portfolio Product and Service Manager overseeing the establishment of the new IT system, Rebecca Heland has seen this shift towards technology firsthand. Ms Heland began her career when digital systems were becoming more mainstream in the health sector. “When I began my career as a nurse, we didn’t have many online systems or platforms,” she says. “I am proud that in my current role I have helped people in the medical profession move to electronic documentation, which assists in increasing efficiency and improving the agility of workers in the sector.”
A diverse range of skills are required in Ms Heland’s role at the NBA. Although technical digital skills are important, an understanding of project management is also vital when developing a successful IT system. “The current update of our system has required a good understanding of the needs of end users – such as doctors, lab technicians and nurses – in order to ensure its usability,” she says. Having a mix of these skills will be increasingly important as the uptake of electronic medical systems among health professionals continues to increase in the future.
Innovation and startups in Australia
NEXTDC CEO Craig Scroggie suggests that building innovative new products and services requires more than just expertise in ICT
NEXTDC is an Australian technology company that enables digital transformation through a growing network of carrier- and vendor-neutral data centres in five cities across Australia. Its business model is built on enabling the development of multi-sided platforms, creating value by facilitating direct interactions between public and private cloud computing providers, telecommunications companies, enterprises and government agencies that host their infrastructure with NEXTDC. NEXTDC has been a leader in enabling the as-a-service computing revolution in Australia – commonly known today as cloud computing – by providing data centre products to global technology behemoths such as IBM, Microsoft and Amazon, which in turn use NEXTDC data centres to service their own customers. Founded in December 2010, the ASX 200-listed company is now valued at $1.2 billion and is one of the fastest growing technology companies in the Asia-Pacific region.
NEXTDC’s CEO Craig Scroggie believes companies need to build products or services before consumers demand them, following the adage “build it and they will come”. For startups, this implies that when it comes to developing a solution for an emerging need, it’s essential to understand where a product fits into the market and the minimum viable product (MVP) that can be released. The MVP concept works on the assumption that iterative designs of the product build on the aspects of earlier versions that have proven most valuable to customers – that is, the aspects people are prepared to pay for. This philosophy is based on Eric Ries’s entrepreneur handbook The Lean Startup, which rejects the notion of a traditional five-year business plan in favour of continual testing and iterations of initial designs.
Australia’s Digital Pulse | Policy priorities to fuel Australia’s digital workforce boom
24
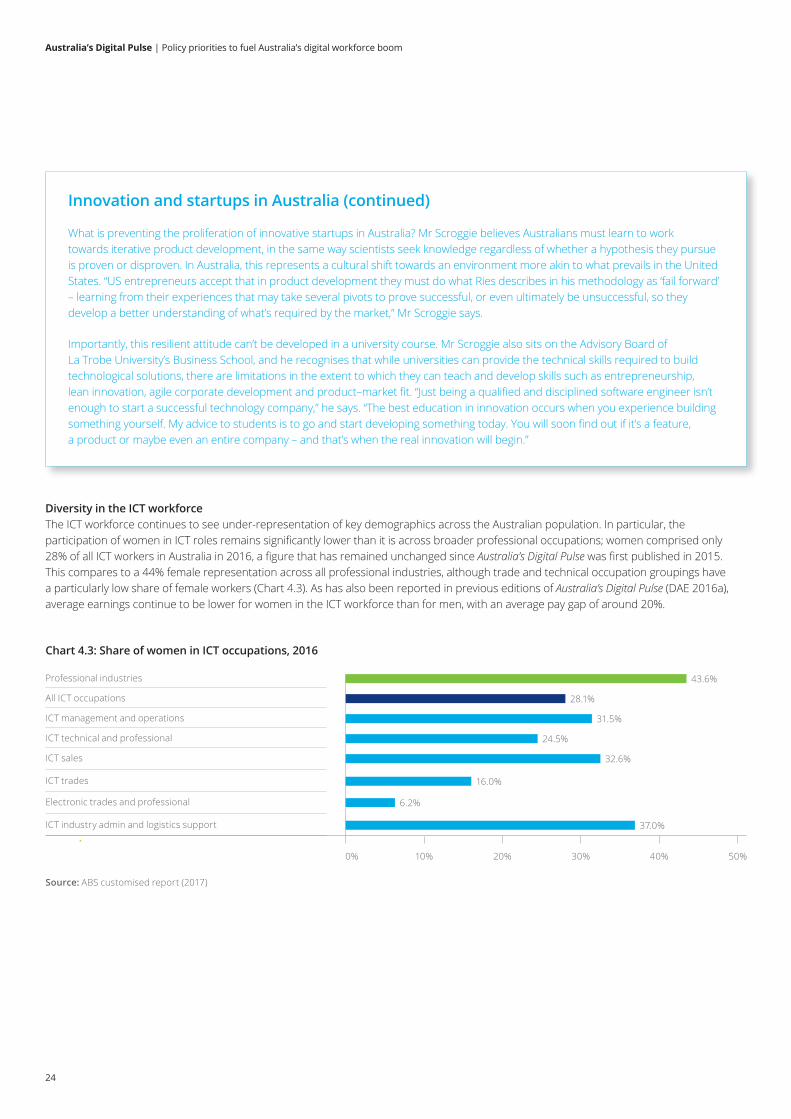
Diversity in the ICT workforce The ICT workforce continues to see under-representation of key demographics across the Australian population. In particular, the participation of women in ICT roles remains significantly lower than it is across broader professional occupations; women comprised only 28% of all ICT workers in Australia in 2016, a figure that has remained unchanged since Australia’s Digital Pulse was first published in 2015. This compares to a 44% female representation across all professional industries, although trade and technical occupation groupings have a particularly low share of female workers (Chart 4.3). As has also been reported in previous editions of Australia’s Digital Pulse (DAE 2016a), average earnings continue to be lower for women in the ICT workforce than for men, with an average pay gap of around 20%.
Chart 4.3: Share of women in ICT occupations, 2016
0% 10%
43.6%
28.1%
31.5%
24.5%
32.6%
16.0%
6.2%
37.0%
20% 30% 40% 50%
Professional industries
All ICT occupations
ICT management and operations
ICT technical and professional
ICT sales
Electronic trades and professional
ICT trades
ICT industry admin and logistics support
Source: ABS customised report (2017)
Innovation and startups in Australia (continued)
What is preventing the proliferation of innovative startups in Australia? Mr Scroggie believes Australians must learn to work towards iterative product development, in the same way scientists seek knowledge regardless of whether a hypothesis they pursue is proven or disproven. In Australia, this represents a cultural shift towards an environment more akin to what prevails in the United States. “US entrepreneurs accept that in product development they must do what Ries describes in his methodology as ‘fail forward’ – learning from their experiences that may take several pivots to prove successful, or even ultimately be unsuccessful, so they develop a better understanding of what’s required by the market,” Mr Scroggie says.
Importantly, this resilient attitude can’t be developed in a university course. Mr Scroggie also sits on the Advisory Board of La Trobe University’s Business School, and he recognises that while universities can provide the technical skills required to build technological solutions, there are limitations in the extent to which they can teach and develop skills such as entrepreneurship, lean innovation, agile corporate development and product–market fit. “Just being a qualified and disciplined software engineer isn’t enough to start a successful technology company,” he says. “The best education in innovation occurs when you experience building something yourself. My advice to students is to go and start developing something today. You will soon find out if it’s a feature, a product or maybe even an entire company – and that’s when the real innovation will begin.”
Australia’s Digital Pulse | Policy priorities to fuel Australia’s digital workforce boom
25
The relatively low representation of women in the ICT workforce is a global phenomenon. The World Economic Forum reports that women represent around 26% of the overall science, technology, engineering and mathematics (STEM) workforce in developed countries, where these numbers are skewed towards relatively more women in science and mathematics, and fewer in engineering and technology (Plunkett 2016). Previous Deloitte analysis of women in IT jobs suggested that improving female representation in the ICT workforce requires changing processes and cultures across the board, including in relation to the education pipeline; recruiting and hiring; remuneration and promotions; and retaining talent (Deloitte 2016b).
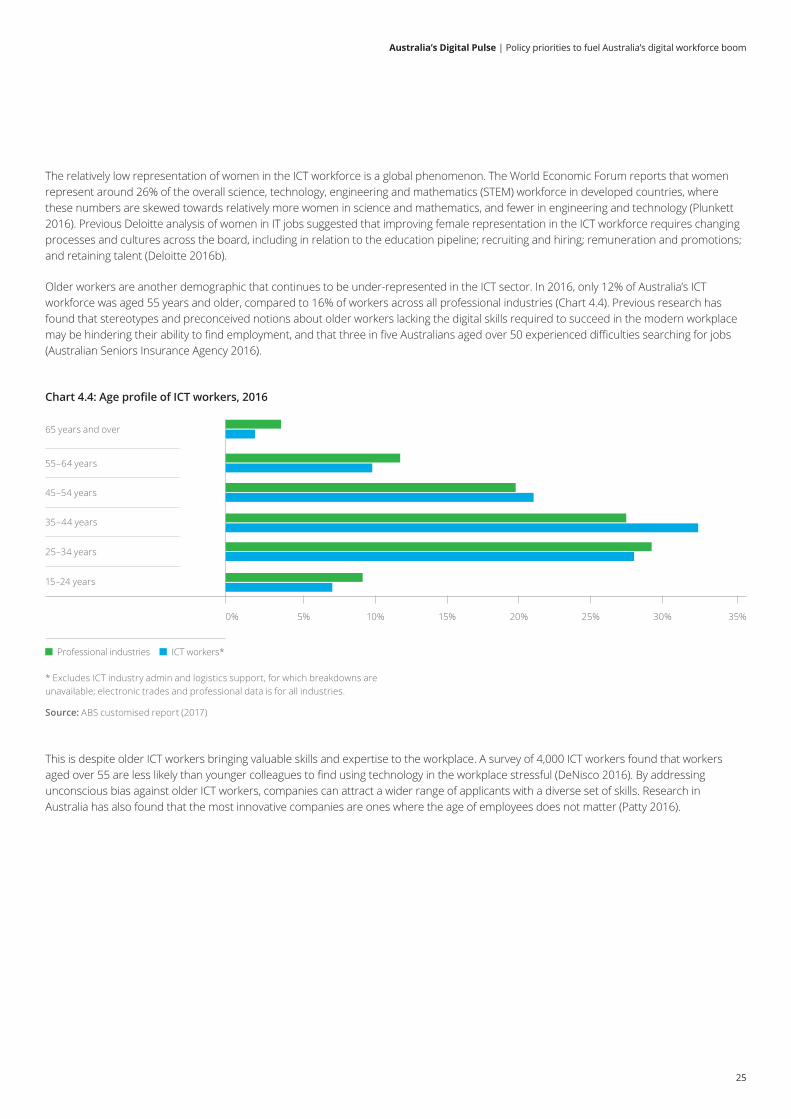
Older workers are another demographic that continues to be under-represented in the ICT sector. In 2016, only 12% of Australia’s ICT workforce was aged 55 years and older, compared to 16% of workers across all professional industries (Chart 4.4). Previous research has found that stereotypes and preconceived notions about older workers lacking the digital skills required to succeed in the modern workplace may be hindering their ability to find employment, and that three in five Australians aged over 50 experienced difficulties searching for jobs (Australian Seniors Insurance Agency 2016).
This is despite older ICT workers bringing valuable skills and expertise to the workplace. A survey of 4,000 ICT workers found that workers aged over 55 are less likely than younger colleagues to find using technology in the workplace stressful (DeNisco 2016). By addressing unconscious bias against older ICT workers, companies can attract a wider range of applicants with a diverse set of skills. Research in Australia has also found that the most innovative companies are ones where the age of employees does not matter (Patty 2016).
* Excludes ICT industry admin and logistics support, for which breakdowns are unavailable; electronic trades and professional data is for all industries.
Source: ABS customised report (2017)
Chart 4.4: Age profile of ICT workers, 2016
55–64 years
65 years and over
45–54 years
35–44 years
15–24 years
25–34 years
0% 5% 10% 35%15% 20% 25% 30%
Professional industries ICT workers*
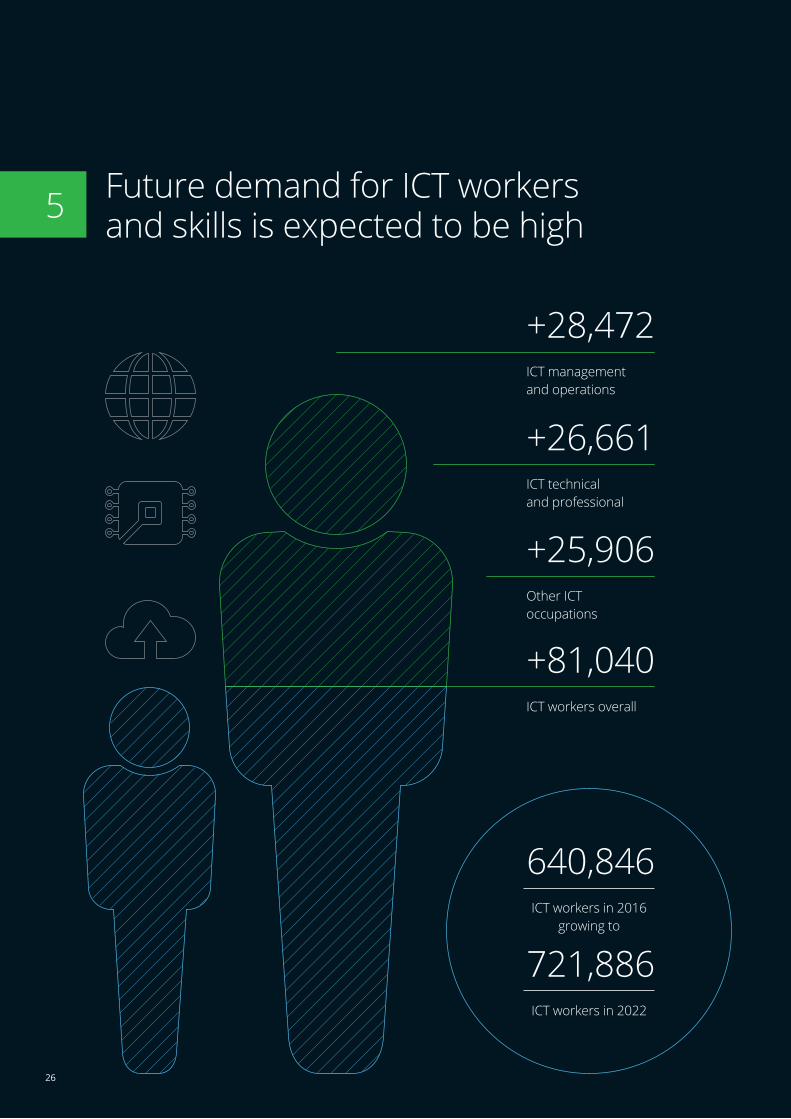
ICT workers in 2016 growing to
ICT workers in 2022
640,846
721,886
+28,472
+81,040
ICT management and operations
+26,661ICT technical and professional
+25,906Other ICT occupations
ICT workers overall
5 Future demand for ICT workers and skills is expected to be high
26
Australia’s Digital Pulse | Policy priorities to fuel Australia’s digital workforce boom
27
The outlook for the employment of ICT workers continues to be positive, consistent with the forecasts presented in previous editions of Australia’s Digital Pulse (DAE 2015 and 2016). Deloitte Access Economics forecasts that the number of ICT workers will increase from around 640,800 in 2016 to around 721,900 in 2022, at an average annual growth rate of 2.0%. This represents a higher growth rate than that expected for the overall Australian workforce over the same period, which we forecast to be 1.4% per annum. The ongoing strength in demand for ICT workers reflects the continued expectation that employment prospects will be relatively strong for ‘knowledge workers’, particularly those that are highly exposed to the growing digital economy.
The increasing prominence of digital technologies in all industries across the Australian economy means that there is growing demand for ICT workers and skills in a diverse range of sectors and roles. Digital technologies are increasingly a ‘horizontal’ element that overlays all ‘vertical’ industries, so there are many more opportunities for ICT employment. This trend is expected to continue to create strong demand for ICT workers in the future, particularly since digitally enabled innovation is and will continue to be a significant driver of growth and competitive advantage among Australian businesses.
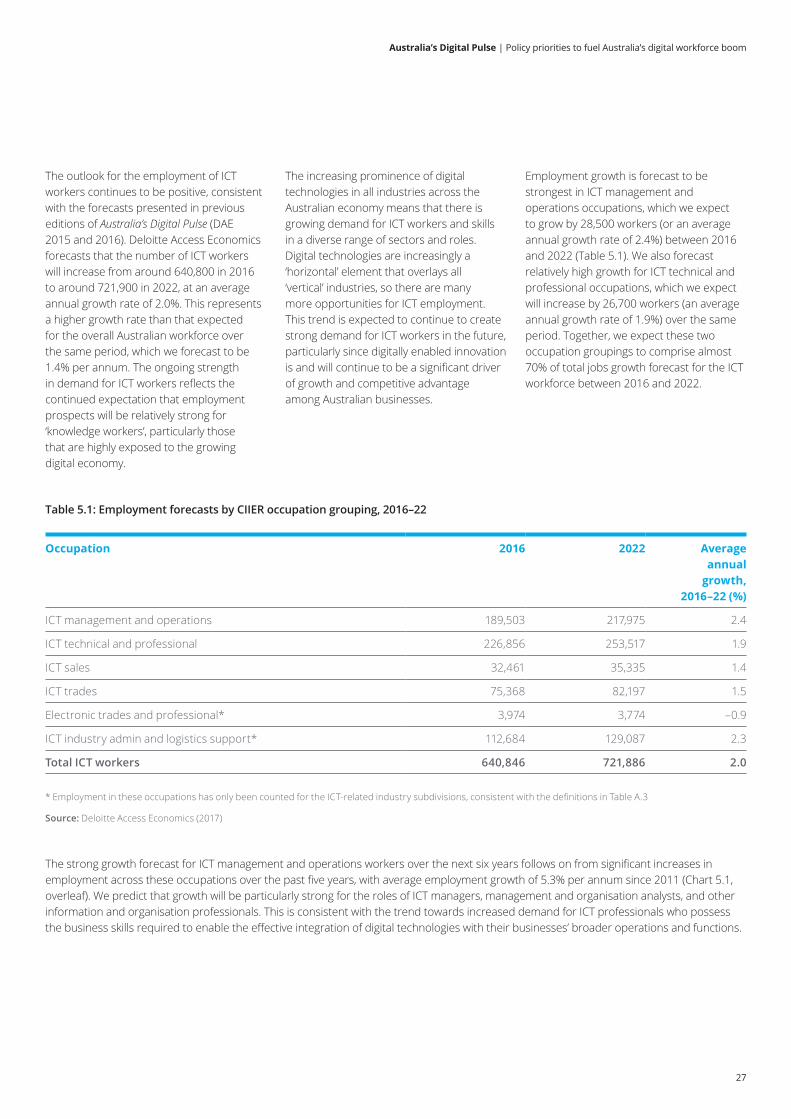
Employment growth is forecast to be strongest in ICT management and operations occupations, which we expect to grow by 28,500 workers (or an average annual growth rate of 2.4%) between 2016 and 2022 (Table 5.1). We also forecast relatively high growth for ICT technical and professional occupations, which we expect will increase by 26,700 workers (an average annual growth rate of 1.9%) over the same period. Together, we expect these two occupation groupings to comprise almost 70% of total jobs growth forecast for the ICT workforce between 2016 and 2022.
Occupation 2016 2022 Average annual
growth, 2016–22 (%)
ICT management and operations 189,503 217,975 2.4
ICT technical and professional 226,856 253,517 1.9
ICT sales 32,461 35,335 1.4
ICT trades 75,368 82,197 1.5
Electronic trades and professional* 3,974 3,774 –0.9
ICT industry admin and logistics support* 112,684 129,087 2.3
Total ICT workers 640,846 721,886 2.0
Table 5.1: Employment forecasts by CIIER occupation grouping, 2016–22
* Employment in these occupations has only been counted for the ICT-related industry subdivisions, consistent with the definitions in Table A.3
Source: Deloitte Access Economics (2017)
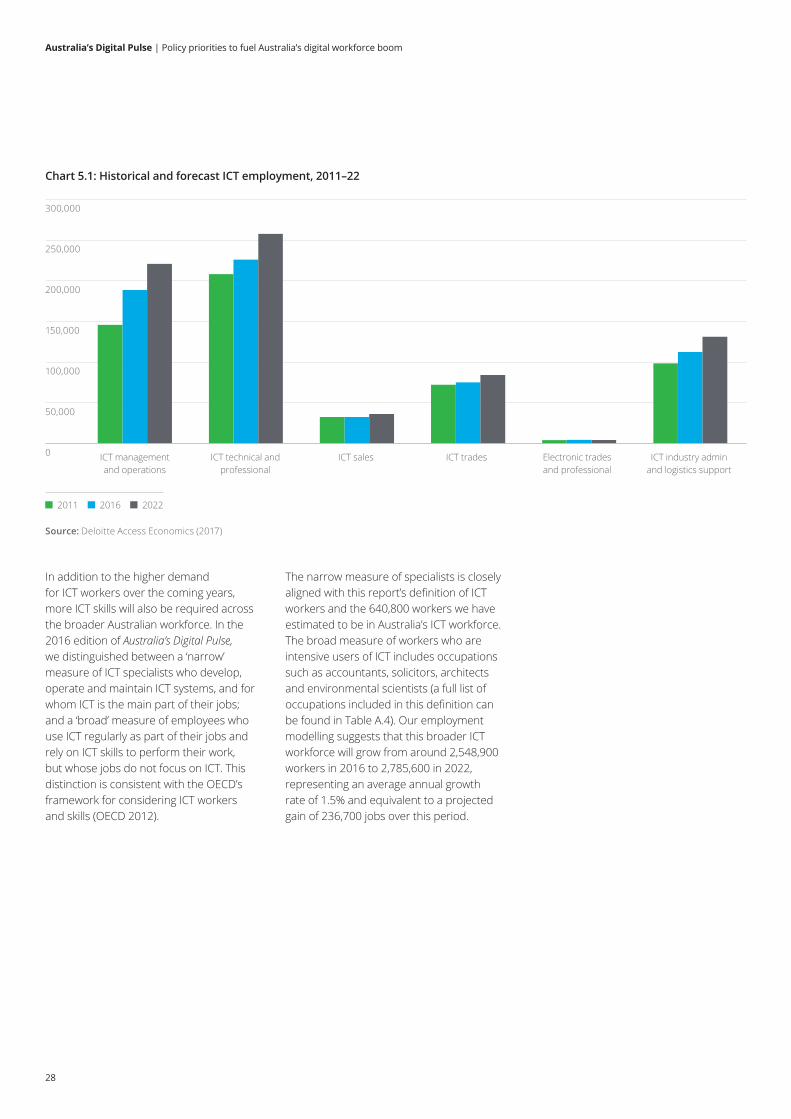
The strong growth forecast for ICT management and operations workers over the next six years follows on from significant increases in employment across these occupations over the past five years, with average employment growth of 5.3% per annum since 2011 (Chart 5.1, overleaf). We predict that growth will be particularly strong for the roles of ICT managers, management and organisation analysts, and other information and organisation professionals. This is consistent with the trend towards increased demand for ICT professionals who possess the business skills required to enable the effective integration of digital technologies with their businesses’ broader operations and functions.
Australia’s Digital Pulse | Policy priorities to fuel Australia’s digital workforce boom
28
In addition to the higher demand for ICT workers over the coming years, more ICT skills will also be required across the broader Australian workforce. In the 2016 edition of Australia’s Digital Pulse, we distinguished between a ‘narrow’ measure of ICT specialists who develop, operate and maintain ICT systems, and for whom ICT is the main part of their jobs; and a ‘broad’ measure of employees who use ICT regularly as part of their jobs and rely on ICT skills to perform their work, but whose jobs do not focus on ICT. This distinction is consistent with the OECD’s framework for considering ICT workers and skills (OECD 2012).
50,000
100,000
150,000
200,000
250,000
300,000
Chart 5.1: Historical and forecast ICT employment, 2011–22
0
Source: Deloitte Access Economics (2017)
2011 2016 2022
ICT management and operations
ICT technical and professional
ICT sales ICT trades Electronic trades and professional
ICT industry admin and logistics support
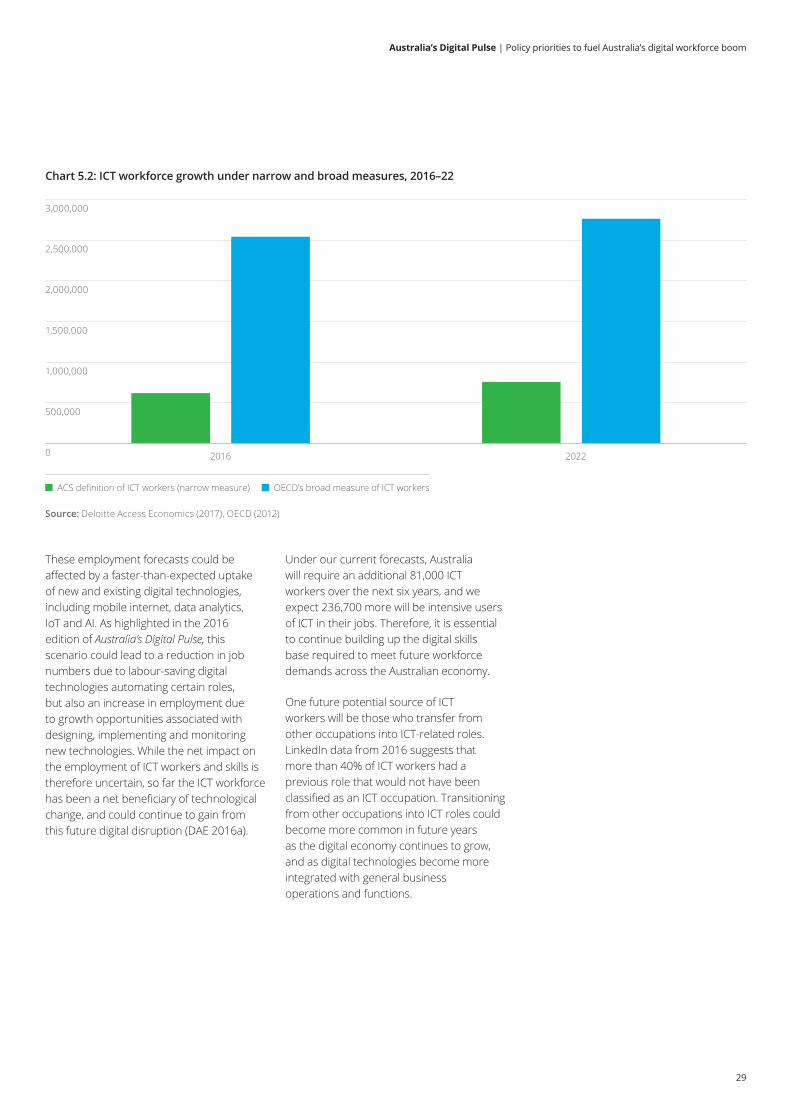
The narrow measure of specialists is closely aligned with this report’s definition of ICT workers and the 640,800 workers we have estimated to be in Australia’s ICT workforce. The broad measure of workers who are intensive users of ICT includes occupations such as accountants, solicitors, architects and environmental scientists (a full list of occupations included in this definition can be found in Table A.4). Our employment modelling suggests that this broader ICT workforce will grow from around 2,548,900 workers in 2016 to 2,785,600 in 2022, representing an average annual growth rate of 1.5% and equivalent to a projected gain of 236,700 jobs over this period.
Australia’s Digital Pulse | Policy priorities to fuel Australia’s digital workforce boom
29
500,000
1,000,000
1,500,000
2,000,000
2,500,000
3,000,000
Chart 5.2: ICT workforce growth under narrow and broad measures, 2016–22
0
Source: Deloitte Access Economics (2017), OECD (2012)
ACS definition of ICT workers (narrow measure) OECD’s broad measure of ICT workers
2016 2022
These employment forecasts could be affected by a faster-than-expected uptake of new and existing digital technologies, including mobile internet, data analytics, IoT and AI. As highlighted in the 2016 edition of Australia’s Digital Pulse, this scenario could lead to a reduction in job numbers due to labour-saving digital technologies automating certain roles, but also an increase in employment due to growth opportunities associated with designing, implementing and monitoring new technologies. While the net impact on the employment of ICT workers and skills is therefore uncertain, so far the ICT workforce has been a net beneficiary of technological change, and could continue to gain from this future digital disruption (DAE 2016a).
Under our current forecasts, Australia will require an additional 81,000 ICT workers over the next six years, and we expect 236,700 more will be intensive users of ICT in their jobs. Therefore, it is essential to continue building up the digital skills base required to meet future workforce demands across the Australian economy.
One future potential source of ICT workers will be those who transfer from other occupations into ICT-related roles. LinkedIn data from 2016 suggests that more than 40% of ICT workers had a previous role that would not have been classified as an ICT occupation. Transitioning from other occupations into ICT roles could become more common in future years as the digital economy continues to grow, and as digital technologies become more integrated with general business operations and functions.
Australia’s Digital Pulse | Policy priorities to fuel Australia’s digital workforce boom
30
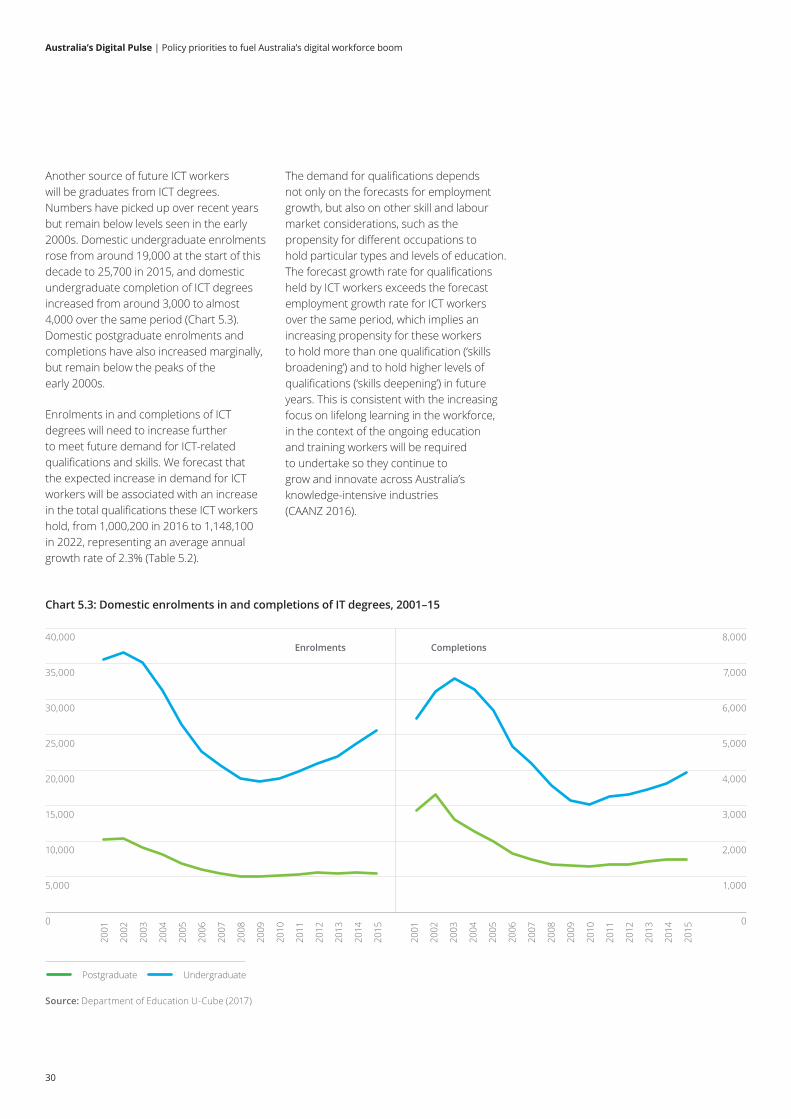
Another source of future ICT workers will be graduates from ICT degrees. Numbers have picked up over recent years but remain below levels seen in the early 2000s. Domestic undergraduate enrolments rose from around 19,000 at the start of this decade to 25,700 in 2015, and domestic undergraduate completion of ICT degrees increased from around 3,000 to almost 4,000 over the same period (Chart 5.3). Domestic postgraduate enrolments and completions have also increased marginally, but remain below the peaks of the early 2000s.
Enrolments in and completions of ICT degrees will need to increase further to meet future demand for ICT-related qualifications and skills. We forecast that the expected increase in demand for ICT workers will be associated with an increase in the total qualifications these ICT workers hold, from 1,000,200 in 2016 to 1,148,100 in 2022, representing an average annual growth rate of 2.3% (Table 5.2).
5,000 1,000
10,000 2,000
15,000 3,000
20,000 4,000
25,000 5,000
30,000 6,000
35,000 7,000
40,000 8,000
Chart 5.3: Domestic enrolments in and completions of IT degrees, 2001–15
0 0
Source: Department of Education U-Cube (2017)
Postgraduate Undergraduate
Enrolments Completions
2001
2001
2002
2002
2003
2003
2004
2004
2005
2005
2006
2006
2007
2007
2008
2008
2009
2009
2010
2010
2011
2011
2012
2012
2013
2013
2014
2014
2015
2015
The demand for qualifications depends not only on the forecasts for employment growth, but also on other skill and labour market considerations, such as the propensity for different occupations to hold particular types and levels of education. The forecast growth rate for qualifications held by ICT workers exceeds the forecast employment growth rate for ICT workers over the same period, which implies an increasing propensity for these workers to hold more than one qualification (‘skills broadening’) and to hold higher levels of qualifications (‘skills deepening’) in future years. This is consistent with the increasing focus on lifelong learning in the workforce, in the context of the ongoing education and training workers will be required to undertake so they continue to grow and innovate across Australia’s knowledge-intensive industries (CAANZ 2016).
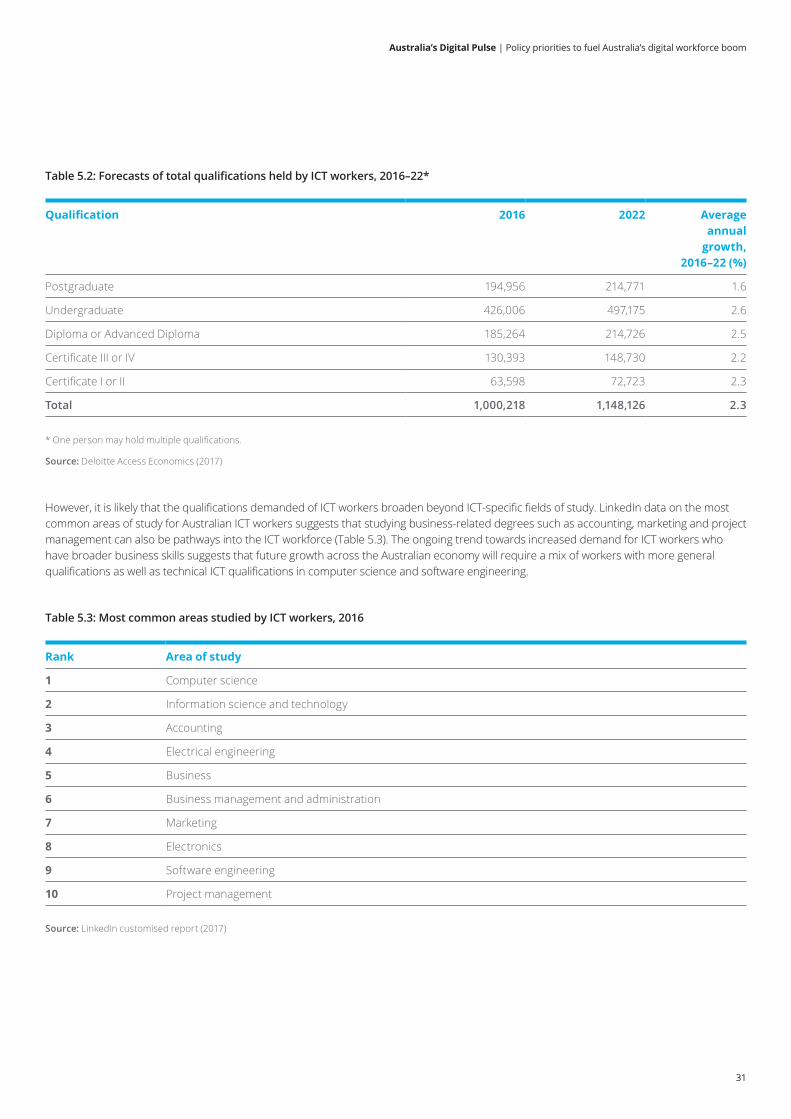
Australia’s Digital Pulse | Policy priorities to fuel Australia’s digital workforce boom
31
Qualification 2016 2022 Average annual
growth, 2016–22 (%)
Postgraduate 194,956 214,771 1.6
Undergraduate 426,006 497,175 2.6
Diploma or Advanced Diploma 185,264 214,726 2.5
Certificate III or IV 130,393 148,730 2.2
Certificate I or II 63,598 72,723 2.3
Total 1,000,218 1,148,126 2.3
Table 5.2: Forecasts of total qualifications held by ICT workers, 2016–22*
* One person may hold multiple qualifications.
Source: Deloitte Access Economics (2017)
However, it is likely that the qualifications demanded of ICT workers broaden beyond ICT-specific fields of study. LinkedIn data on the most common areas of study for Australian ICT workers suggests that studying business-related degrees such as accounting, marketing and project management can also be pathways into the ICT workforce (Table 5.3). The ongoing trend towards increased demand for ICT workers who have broader business skills suggests that future growth across the Australian economy will require a mix of workers with more general qualifications as well as technical ICT qualifications in computer science and software engineering.
Table 5.3: Most common areas studied by ICT workers, 2016
Rank Area of study
1 Computer science
2 Information science and technology
3 Accounting
4 Electrical engineering
5 Business
6 Business management and administration
7 Marketing
8 Electronics
9 Software engineering
10 Project management
Source: LinkedIn customised report (2017)
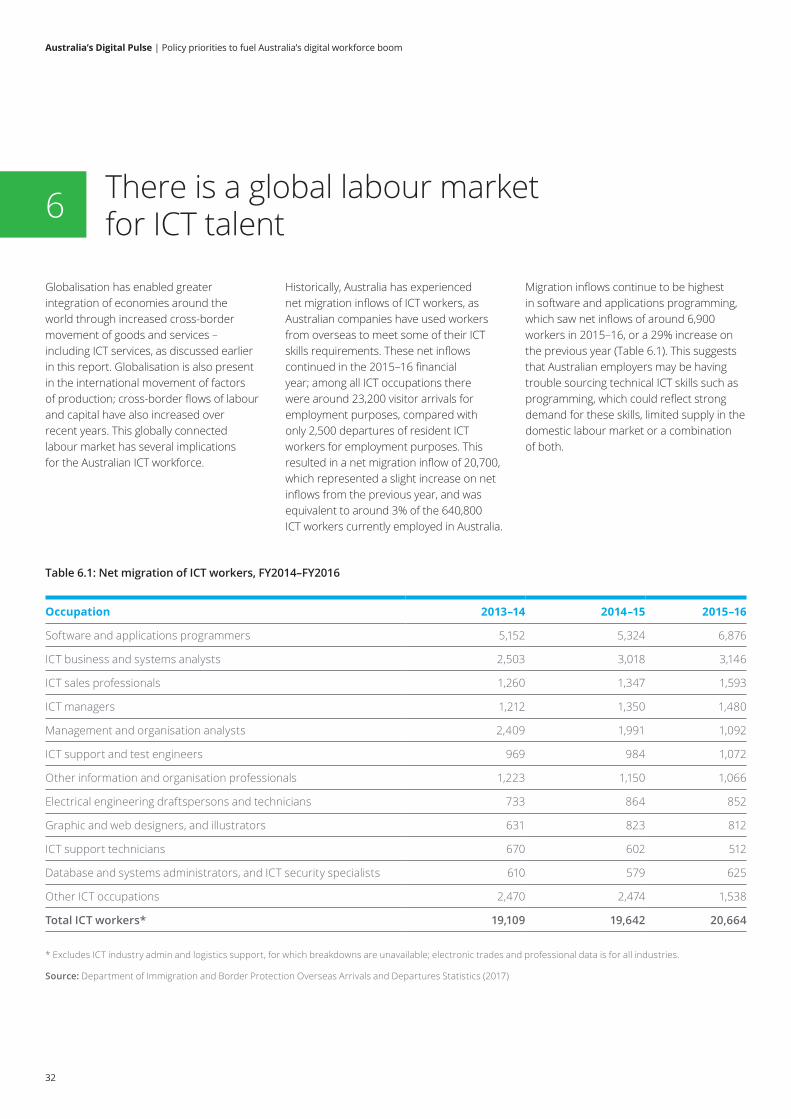
Australia’s Digital Pulse | Policy priorities to fuel Australia’s digital workforce boom
32
Globalisation has enabled greater integration of economies around the world through increased cross-border movement of goods and services – including ICT services, as discussed earlier in this report. Globalisation is also present in the international movement of factors of production; cross-border flows of labour and capital have also increased over recent years. This globally connected labour market has several implications for the Australian ICT workforce.
There is a global labour market for ICT talent6
Historically, Australia has experienced net migration inflows of ICT workers, as Australian companies have used workers from overseas to meet some of their ICT skills requirements. These net inflows continued in the 2015–16 financial year; among all ICT occupations there were around 23,200 visitor arrivals for employment purposes, compared with only 2,500 departures of resident ICT workers for employment purposes. This resulted in a net migration inflow of 20,700, which represented a slight increase on net inflows from the previous year, and was equivalent to around 3% of the 640,800 ICT workers currently employed in Australia.
Migration inflows continue to be highest in software and applications programming, which saw net inflows of around 6,900 workers in 2015–16, or a 29% increase on the previous year (Table 6.1). This suggests that Australian employers may be having trouble sourcing technical ICT skills such as programming, which could reflect strong demand for these skills, limited supply in the domestic labour market or a combination of both.
Occupation 2013–14 2014–15 2015–16
Software and applications programmers 5,152 5,324 6,876
ICT business and systems analysts 2,503 3,018 3,146
ICT sales professionals 1,260 1,347 1,593
ICT managers 1,212 1,350 1,480
Management and organisation analysts 2,409 1,991 1,092
ICT support and test engineers 969 984 1,072
Other information and organisation professionals 1,223 1,150 1,066
Electrical engineering draftspersons and technicians 733 864 852
Graphic and web designers, and illustrators 631 823 812
ICT support technicians 670 602 512
Database and systems administrators, and ICT security specialists 610 579 625
Other ICT occupations 2,470 2,474 1,538
Total ICT workers* 19,109 19,642 20,664
Table 6.1: Net migration of ICT workers, FY2014–FY2016
* Excludes ICT industry admin and logistics support, for which breakdowns are unavailable; electronic trades and professional data is for all industries.
Source: Department of Immigration and Border Protection Overseas Arrivals and Departures Statistics (2017)
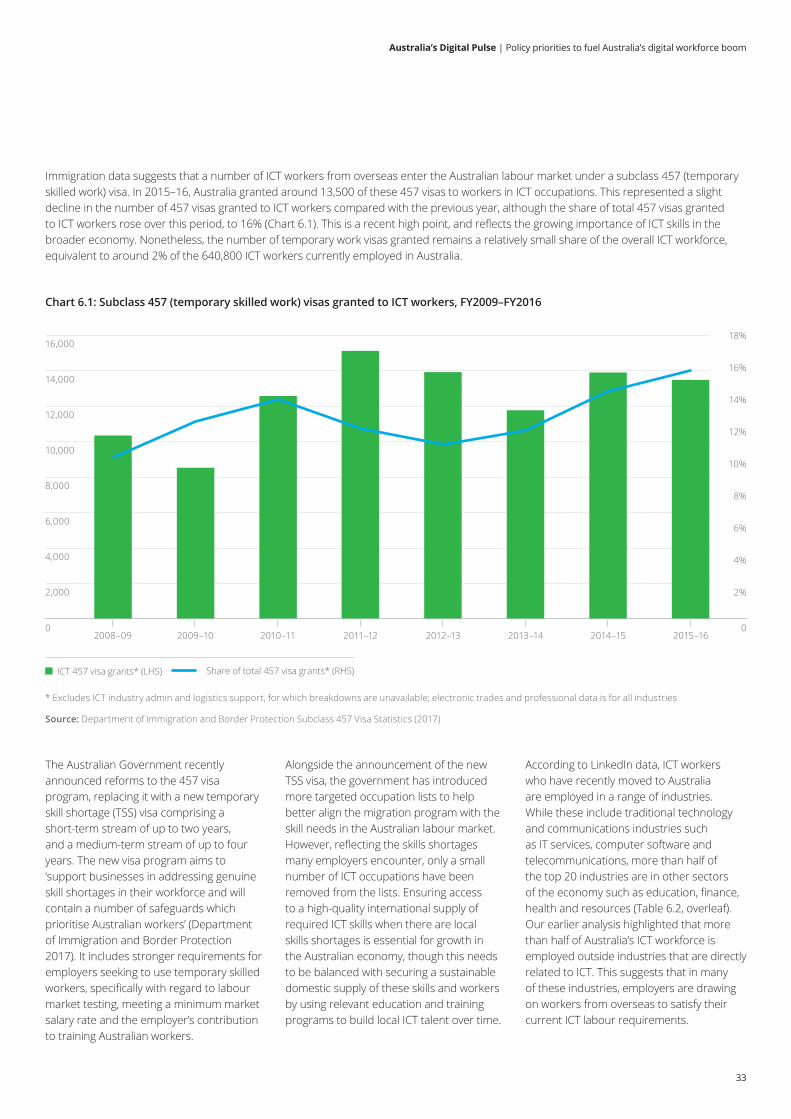
Australia’s Digital Pulse | Policy priorities to fuel Australia’s digital workforce boom
33
Immigration data suggests that a number of ICT workers from overseas enter the Australian labour market under a subclass 457 (temporary skilled work) visa. In 2015–16, Australia granted around 13,500 of these 457 visas to workers in ICT occupations. This represented a slight decline in the number of 457 visas granted to ICT workers compared with the previous year, although the share of total 457 visas granted to ICT workers rose over this period, to 16% (Chart 6.1). This is a recent high point, and reflects the growing importance of ICT skills in the broader economy. Nonetheless, the number of temporary work visas granted remains a relatively small share of the overall ICT workforce, equivalent to around 2% of the 640,800 ICT workers currently employed in Australia.
2,000 2%
4,000 4%
6,0006%
8,0008%
10,00010%
12,000
12%
14,000
14%
16,000
16%
18%
Chart 6.1: Subclass 457 (temporary skilled work) visas granted to ICT workers, FY2009–FY2016
0 02008–09 2009–10 2010–11 2011–12 2012–13 2013–14 2014–15 2015–16
* Excludes ICT industry admin and logistics support, for which breakdowns are unavailable; electronic trades and professional data is for all industries
Source: Department of Immigration and Border Protection Subclass 457 Visa Statistics (2017)
ICT 457 visa grants* (LHS) Share of total 457 visa grants* (RHS)
The Australian Government recently announced reforms to the 457 visa program, replacing it with a new temporary skill shortage (TSS) visa comprising a short-term stream of up to two years, and a medium-term stream of up to four years. The new visa program aims to ‘support businesses in addressing genuine skill shortages in their workforce and will contain a number of safeguards which prioritise Australian workers’ (Department of Immigration and Border Protection 2017). It includes stronger requirements for employers seeking to use temporary skilled workers, specifically with regard to labour market testing, meeting a minimum market salary rate and the employer’s contribution to training Australian workers.
Alongside the announcement of the new TSS visa, the government has introduced more targeted occupation lists to help better align the migration program with the skill needs in the Australian labour market. However, reflecting the skills shortages many employers encounter, only a small number of ICT occupations have been removed from the lists. Ensuring access to a high-quality international supply of required ICT skills when there are local skills shortages is essential for growth in the Australian economy, though this needs to be balanced with securing a sustainable domestic supply of these skills and workers by using relevant education and training programs to build local ICT talent over time.
According to LinkedIn data, ICT workers who have recently moved to Australia are employed in a range of industries. While these include traditional technology and communications industries such as IT services, computer software and telecommunications, more than half of the top 20 industries are in other sectors of the economy such as education, finance, health and resources (Table 6.2, overleaf). Our earlier analysis highlighted that more than half of Australia’s ICT workforce is employed outside industries that are directly related to ICT. This suggests that in many of these industries, employers are drawing on workers from overseas to satisfy their current ICT labour requirements.
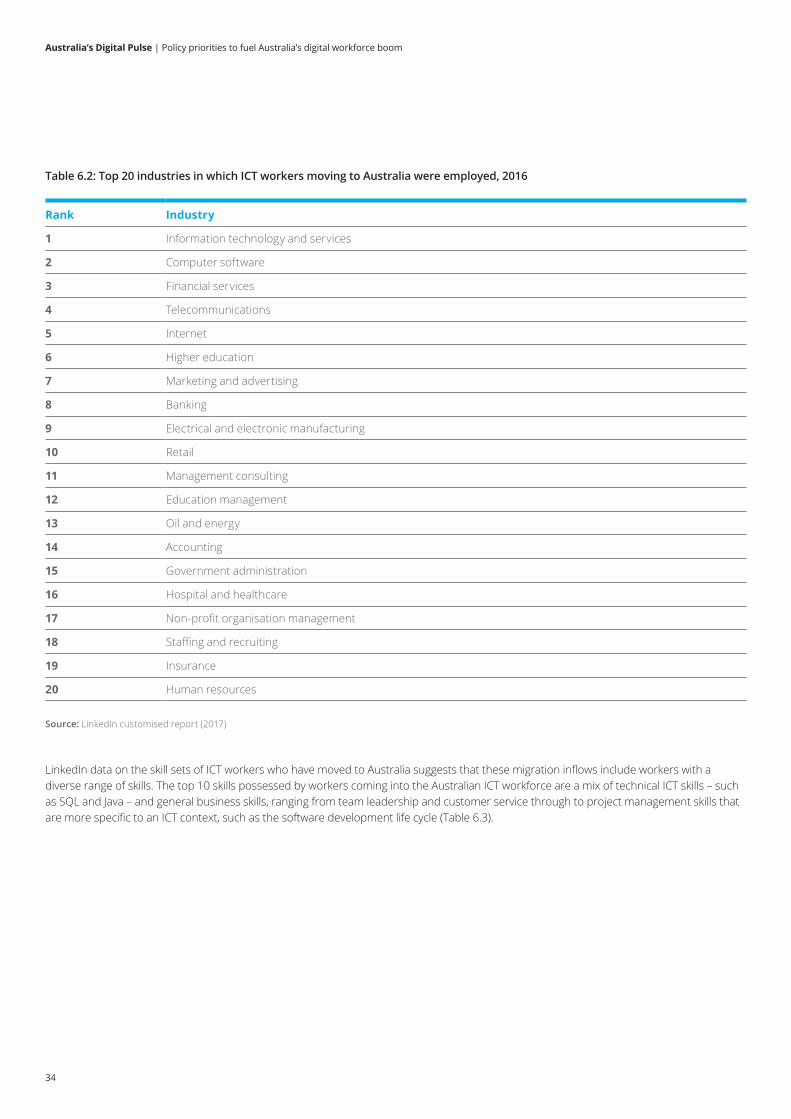
Australia’s Digital Pulse | Policy priorities to fuel Australia’s digital workforce boom
34
LinkedIn data on the skill sets of ICT workers who have moved to Australia suggests that these migration inflows include workers with a diverse range of skills. The top 10 skills possessed by workers coming into the Australian ICT workforce are a mix of technical ICT skills – such as SQL and Java – and general business skills, ranging from team leadership and customer service through to project management skills that are more specific to an ICT context, such as the software development life cycle (Table 6.3).
Table 6.2: Top 20 industries in which ICT workers moving to Australia were employed, 2016
Rank Industry
1 Information technology and services
2 Computer software
3 Financial services
4 Telecommunications
5 Internet
6 Higher education
7 Marketing and advertising
8 Banking
9 Electrical and electronic manufacturing
10 Retail
11 Management consulting
12 Education management
13 Oil and energy
14 Accounting
15 Government administration
16 Hospital and healthcare
17 Non-profit organisation management
18 Staffing and recruiting
19 Insurance
20 Human resources
Source: LinkedIn customised report (2017)
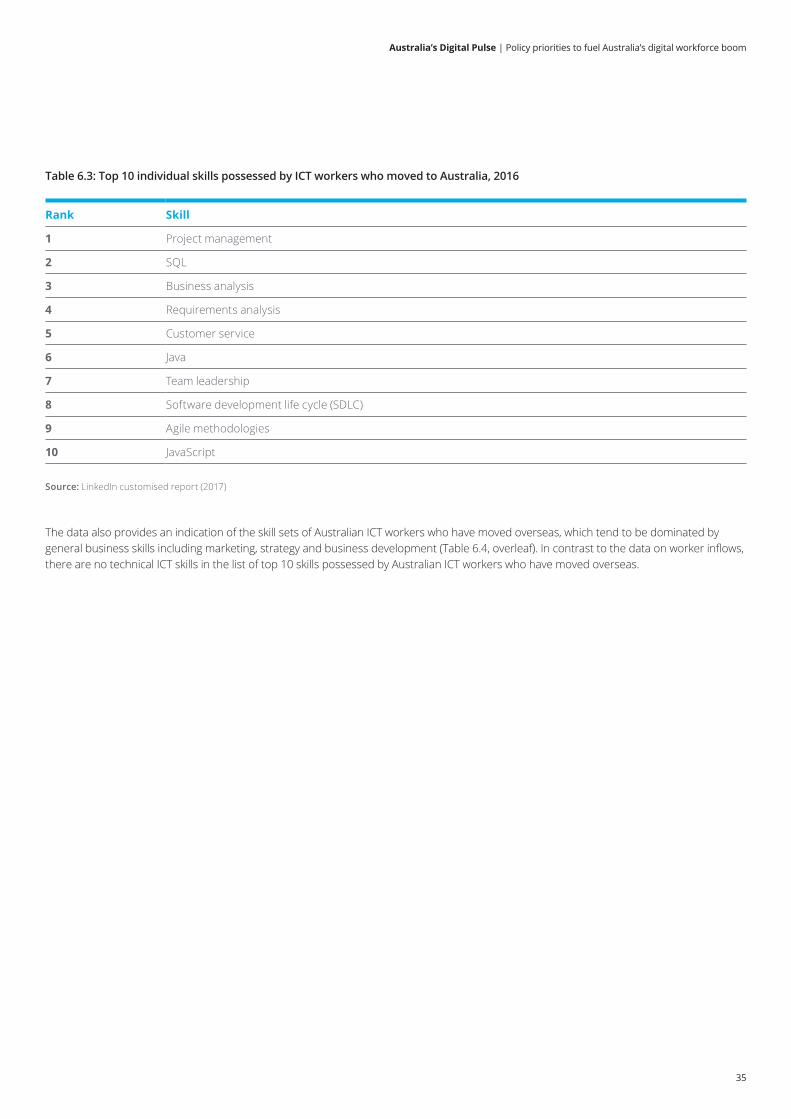
Australia’s Digital Pulse | Policy priorities to fuel Australia’s digital workforce boom
35
Table 6.3: Top 10 individual skills possessed by ICT workers who moved to Australia, 2016
Rank Skill
1 Project management
2 SQL
3 Business analysis
4 Requirements analysis
5 Customer service
6 Java
7 Team leadership
8 Software development life cycle (SDLC)
9 Agile methodologies
10 JavaScript
Source: LinkedIn customised report (2017)
The data also provides an indication of the skill sets of Australian ICT workers who have moved overseas, which tend to be dominated by general business skills including marketing, strategy and business development (Table 6.4, overleaf). In contrast to the data on worker inflows, there are no technical ICT skills in the list of top 10 skills possessed by Australian ICT workers who have moved overseas.
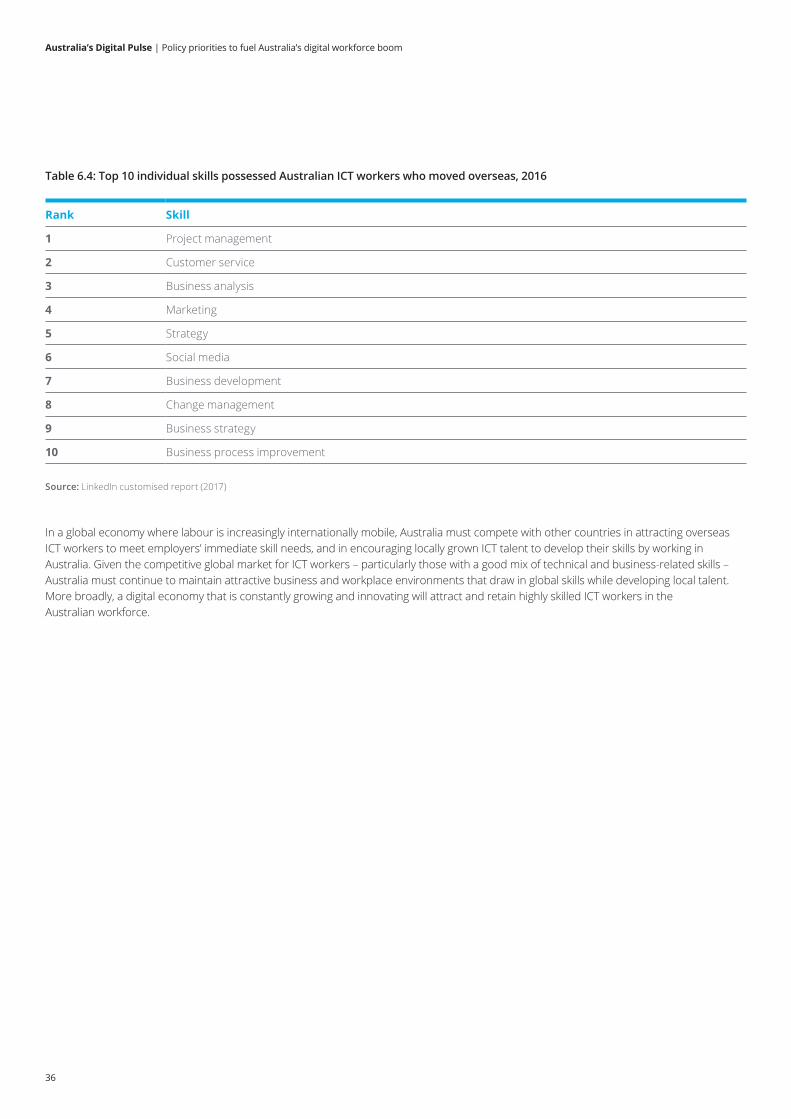
Australia’s Digital Pulse | Policy priorities to fuel Australia’s digital workforce boom
36
Table 6.4: Top 10 individual skills possessed Australian ICT workers who moved overseas, 2016
Rank Skill
1 Project management
2 Customer service
3 Business analysis
4 Marketing
5 Strategy
6 Social media
7 Business development
8 Change management
9 Business strategy
10 Business process improvement
Source: LinkedIn customised report (2017)
In a global economy where labour is increasingly internationally mobile, Australia must compete with other countries in attracting overseas ICT workers to meet employers’ immediate skill needs, and in encouraging locally grown ICT talent to develop their skills by working in Australia. Given the competitive global market for ICT workers – particularly those with a good mix of technical and business-related skills – Australia must continue to maintain attractive business and workplace environments that draw in global skills while developing local talent. More broadly, a digital economy that is constantly growing and innovating will attract and retain highly skilled ICT workers in the Australian workforce.
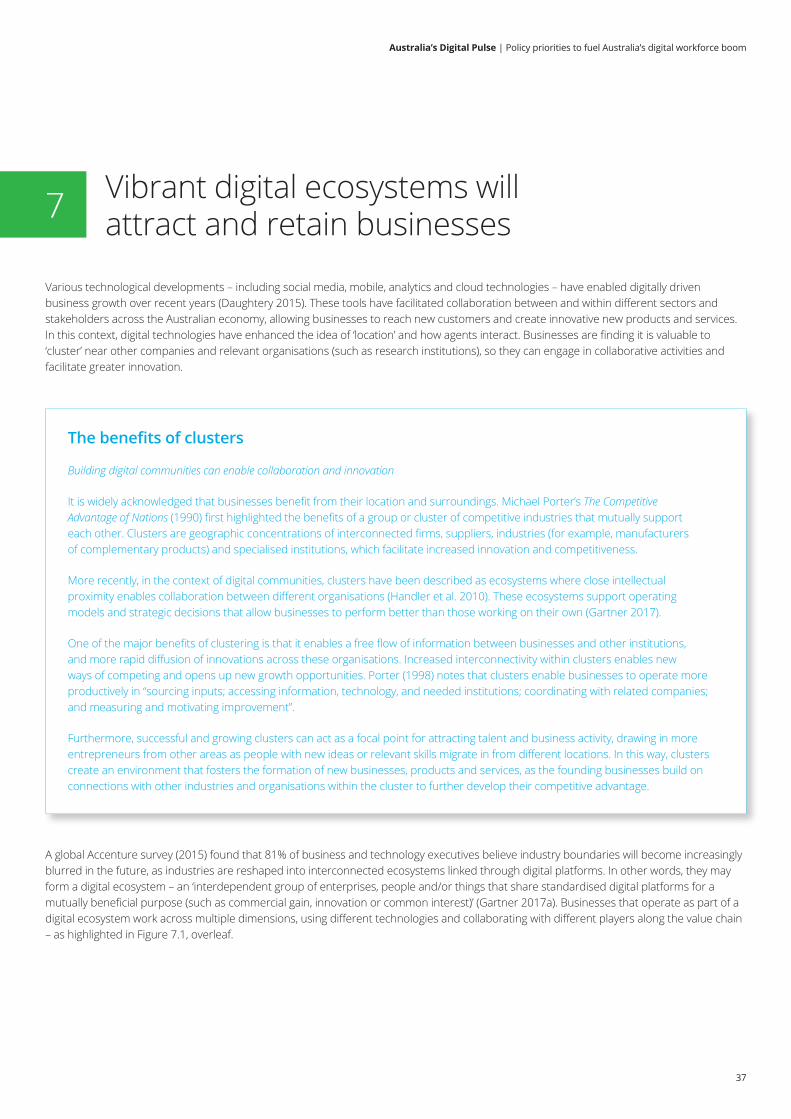
Australia’s Digital Pulse | Policy priorities to fuel Australia’s digital workforce boom
37
Various technological developments – including social media, mobile, analytics and cloud technologies – have enabled digitally driven business growth over recent years (Daughtery 2015). These tools have facilitated collaboration between and within different sectors and stakeholders across the Australian economy, allowing businesses to reach new customers and create innovative new products and services. In this context, digital technologies have enhanced the idea of ‘location’ and how agents interact. Businesses are finding it is valuable to ‘cluster’ near other companies and relevant organisations (such as research institutions), so they can engage in collaborative activities and facilitate greater innovation.
A global Accenture survey (2015) found that 81% of business and technology executives believe industry boundaries will become increasingly blurred in the future, as industries are reshaped into interconnected ecosystems linked through digital platforms. In other words, they may form a digital ecosystem – an ‘interdependent group of enterprises, people and/or things that share standardised digital platforms for a mutually beneficial purpose (such as commercial gain, innovation or common interest)’ (Gartner 2017a). Businesses that operate as part of a digital ecosystem work across multiple dimensions, using different technologies and collaborating with different players along the value chain – as highlighted in Figure 7.1, overleaf.
Vibrant digital ecosystems will attract and retain businesses7
The benefits of clusters
Building digital communities can enable collaboration and innovation
It is widely acknowledged that businesses benefit from their location and surroundings. Michael Porter’s The Competitive Advantage of Nations (1990) first highlighted the benefits of a group or cluster of competitive industries that mutually support each other. Clusters are geographic concentrations of interconnected firms, suppliers, industries (for example, manufacturers of complementary products) and specialised institutions, which facilitate increased innovation and competitiveness.
More recently, in the context of digital communities, clusters have been described as ecosystems where close intellectual proximity enables collaboration between different organisations (Handler et al. 2010). These ecosystems support operating models and strategic decisions that allow businesses to perform better than those working on their own (Gartner 2017).
One of the major benefits of clustering is that it enables a free flow of information between businesses and other institutions, and more rapid diffusion of innovations across these organisations. Increased interconnectivity within clusters enables new ways of competing and opens up new growth opportunities. Porter (1998) notes that clusters enable businesses to operate more productively in “sourcing inputs; accessing information, technology, and needed institutions; coordinating with related companies; and measuring and motivating improvement”.
Furthermore, successful and growing clusters can act as a focal point for attracting talent and business activity, drawing in more entrepreneurs from other areas as people with new ideas or relevant skills migrate in from different locations. In this way, clusters create an environment that fosters the formation of new businesses, products and services, as the founding businesses build on connections with other industries and organisations within the cluster to further develop their competitive advantage.
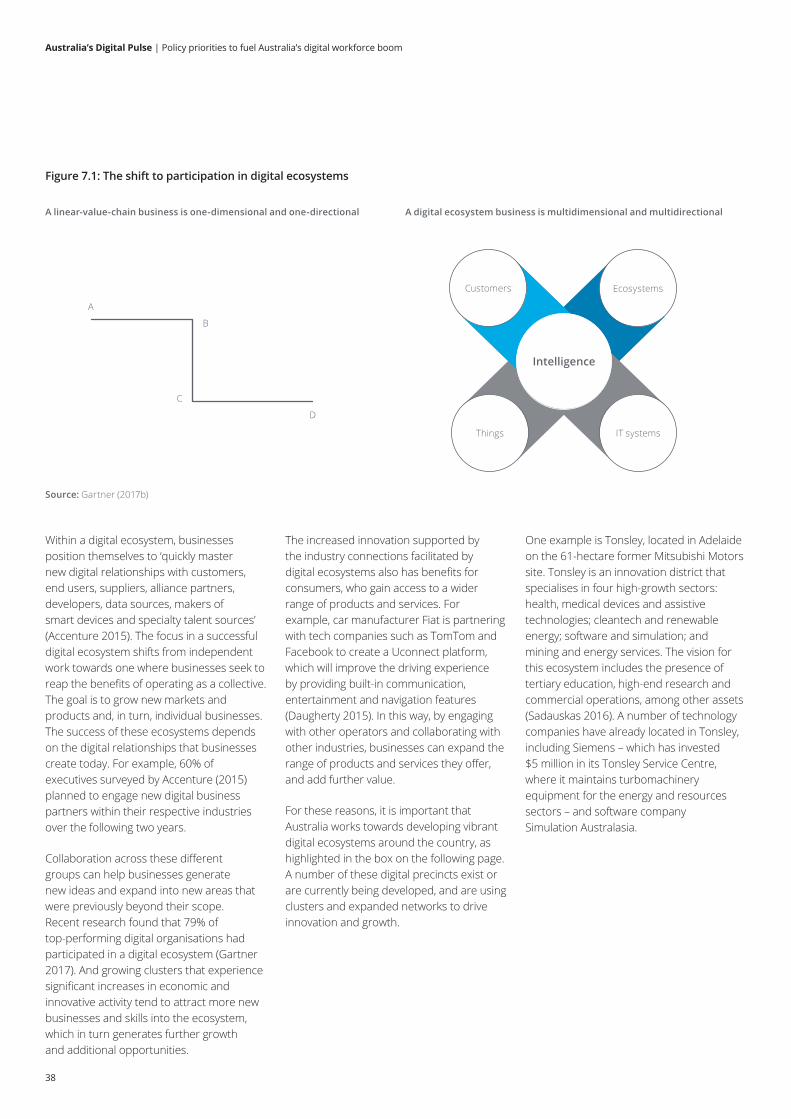
Australia’s Digital Pulse | Policy priorities to fuel Australia’s digital workforce boom
38
Within a digital ecosystem, businesses position themselves to ‘quickly master new digital relationships with customers, end users, suppliers, alliance partners, developers, data sources, makers of smart devices and specialty talent sources’ (Accenture 2015). The focus in a successful digital ecosystem shifts from independent work towards one where businesses seek to reap the benefits of operating as a collective. The goal is to grow new markets and products and, in turn, individual businesses. The success of these ecosystems depends on the digital relationships that businesses create today. For example, 60% of executives surveyed by Accenture (2015) planned to engage new digital business partners within their respective industries over the following two years.
Collaboration across these different groups can help businesses generate new ideas and expand into new areas that were previously beyond their scope. Recent research found that 79% of top-performing digital organisations had participated in a digital ecosystem (Gartner 2017). And growing clusters that experience significant increases in economic and innovative activity tend to attract more new businesses and skills into the ecosystem, which in turn generates further growth and additional opportunities.
The increased innovation supported by the industry connections facilitated by digital ecosystems also has benefits for consumers, who gain access to a wider range of products and services. For example, car manufacturer Fiat is partnering with tech companies such as TomTom and Facebook to create a Uconnect platform, which will improve the driving experience by providing built-in communication, entertainment and navigation features (Daugherty 2015). In this way, by engaging with other operators and collaborating with other industries, businesses can expand the range of products and services they offer, and add further value.
For these reasons, it is important that Australia works towards developing vibrant digital ecosystems around the country, as highlighted in the box on the following page. A number of these digital precincts exist or are currently being developed, and are using clusters and expanded networks to drive innovation and growth.
One example is Tonsley, located in Adelaide on the 61-hectare former Mitsubishi Motors site. Tonsley is an innovation district that specialises in four high-growth sectors: health, medical devices and assistive technologies; cleantech and renewable energy; software and simulation; and mining and energy services. The vision for this ecosystem includes the presence of tertiary education, high-end research and commercial operations, among other assets (Sadauskas 2016). A number of technology companies have already located in Tonsley, including Siemens – which has invested $5 million in its Tonsley Service Centre, where it maintains turbomachinery equipment for the energy and resources sectors – and software company Simulation Australasia.
Figure 7.1: The shift to participation in digital ecosystems
A
B
D
C
A linear-value-chain business is one-dimensional and one-directional A digital ecosystem business is multidimensional and multidirectional
Customers
Things
Ecosystems
Intelligence
IT systems
Source: Gartner (2017b)
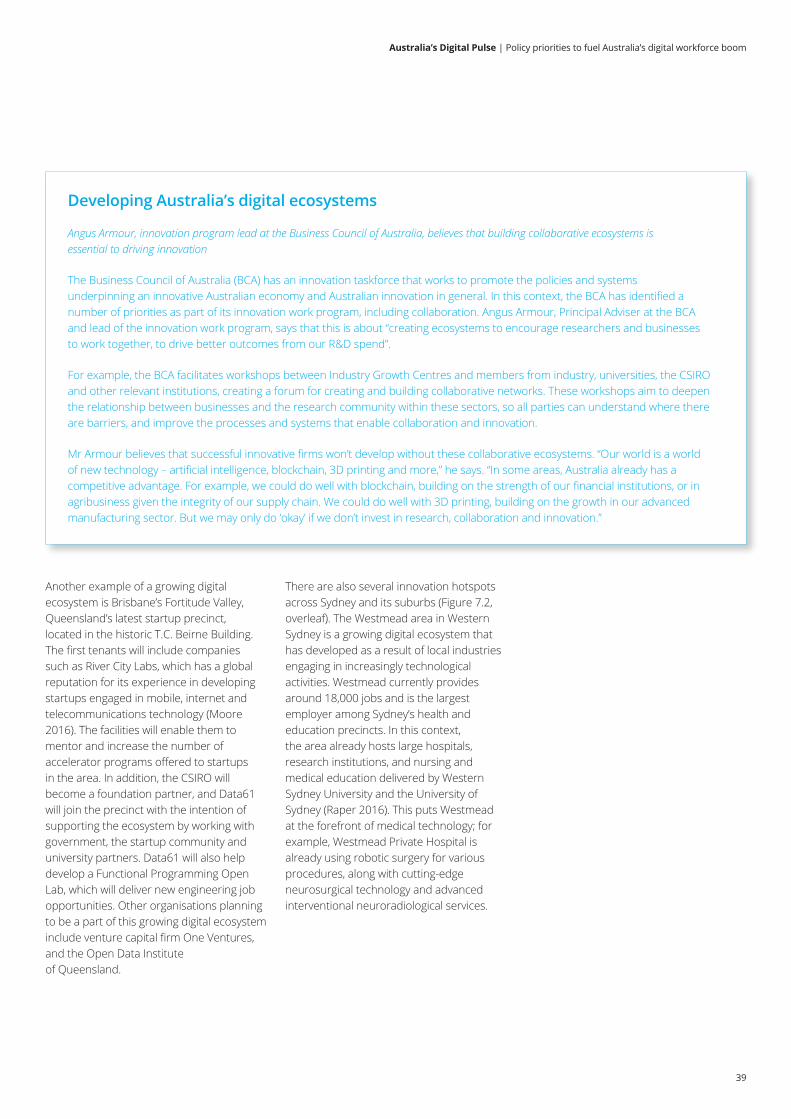
Australia’s Digital Pulse | Policy priorities to fuel Australia’s digital workforce boom
39
Another example of a growing digital ecosystem is Brisbane’s Fortitude Valley, Queensland’s latest startup precinct, located in the historic T.C. Beirne Building. The first tenants will include companies such as River City Labs, which has a global reputation for its experience in developing startups engaged in mobile, internet and telecommunications technology (Moore 2016). The facilities will enable them to mentor and increase the number of accelerator programs offered to startups in the area. In addition, the CSIRO will become a foundation partner, and Data61 will join the precinct with the intention of supporting the ecosystem by working with government, the startup community and university partners. Data61 will also help develop a Functional Programming Open Lab, which will deliver new engineering job opportunities. Other organisations planning to be a part of this growing digital ecosystem include venture capital firm One Ventures, and the Open Data Institute of Queensland.
Developing Australia’s digital ecosystems
Angus Armour, innovation program lead at the Business Council of Australia, believes that building collaborative ecosystems is essential to driving innovation
The Business Council of Australia (BCA) has an innovation taskforce that works to promote the policies and systems underpinning an innovative Australian economy and Australian innovation in general. In this context, the BCA has identified a number of priorities as part of its innovation work program, including collaboration. Angus Armour, Principal Adviser at the BCA and lead of the innovation work program, says that this is about “creating ecosystems to encourage researchers and businesses to work together, to drive better outcomes from our R&D spend”.
For example, the BCA facilitates workshops between Industry Growth Centres and members from industry, universities, the CSIRO and other relevant institutions, creating a forum for creating and building collaborative networks. These workshops aim to deepen the relationship between businesses and the research community within these sectors, so all parties can understand where there are barriers, and improve the processes and systems that enable collaboration and innovation.
Mr Armour believes that successful innovative firms won’t develop without these collaborative ecosystems. “Our world is a world of new technology – artificial intelligence, blockchain, 3D printing and more,” he says. “In some areas, Australia already has a competitive advantage. For example, we could do well with blockchain, building on the strength of our financial institutions, or in agribusiness given the integrity of our supply chain. We could do well with 3D printing, building on the growth in our advanced manufacturing sector. But we may only do ‘okay’ if we don’t invest in research, collaboration and innovation.”
There are also several innovation hotspots across Sydney and its suburbs (Figure 7.2, overleaf). The Westmead area in Western Sydney is a growing digital ecosystem that has developed as a result of local industries engaging in increasingly technological activities. Westmead currently provides around 18,000 jobs and is the largest employer among Sydney’s health and education precincts. In this context, the area already hosts large hospitals, research institutions, and nursing and medical education delivered by Western Sydney University and the University of Sydney (Raper 2016). This puts Westmead at the forefront of medical technology; for example, Westmead Private Hospital is already using robotic surgery for various procedures, along with cutting-edge neurosurgical technology and advanced interventional neuroradiological services.
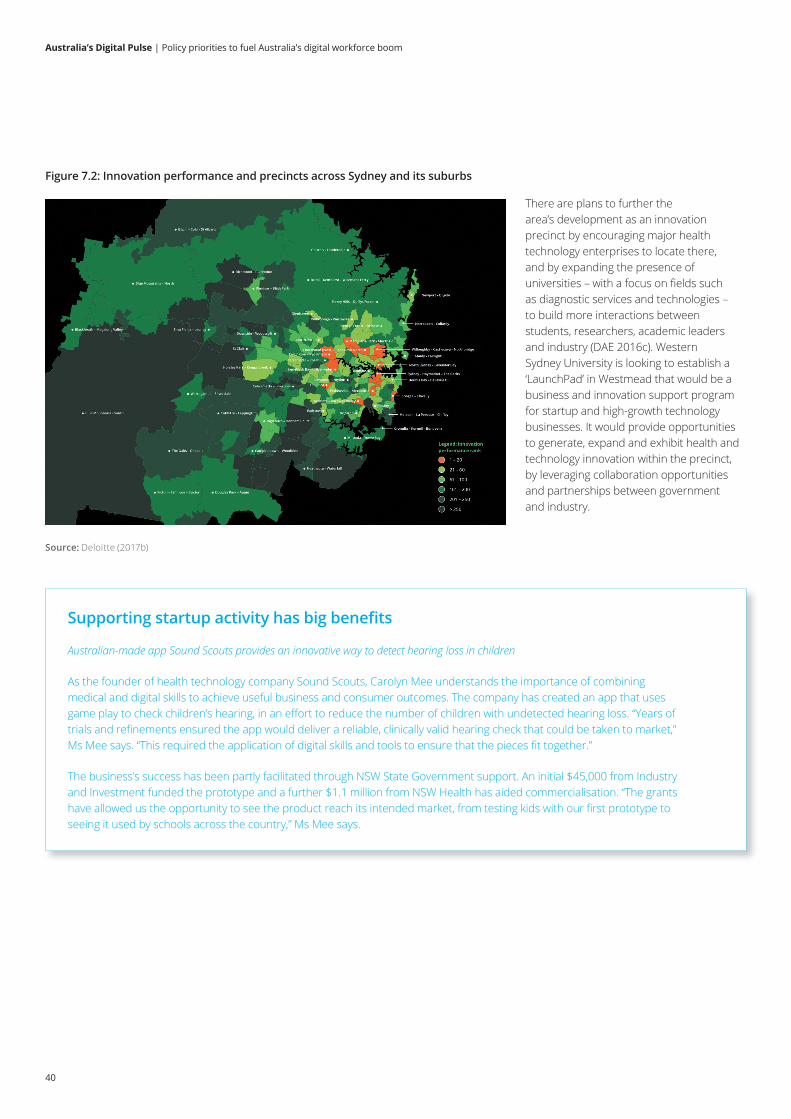
Australia’s Digital Pulse | Policy priorities to fuel Australia’s digital workforce boom
40
Figure 7.2: Innovation performance and precincts across Sydney and its suburbs
There are plans to further the area’s development as an innovation precinct by encouraging major health technology enterprises to locate there, and by expanding the presence of universities – with a focus on fields such as diagnostic services and technologies – to build more interactions between students, researchers, academic leaders and industry (DAE 2016c). Western Sydney University is looking to establish a ‘LaunchPad’ in Westmead that would be a business and innovation support program for startup and high-growth technology businesses. It would provide opportunities to generate, expand and exhibit health and technology innovation within the precinct, by leveraging collaboration opportunities and partnerships between government and industry.
Supporting startup activity has big benefits
Australian-made app Sound Scouts provides an innovative way to detect hearing loss in children
As the founder of health technology company Sound Scouts, Carolyn Mee understands the importance of combining medical and digital skills to achieve useful business and consumer outcomes. The company has created an app that uses game play to check children’s hearing, in an effort to reduce the number of children with undetected hearing loss. “Years of trials and refinements ensured the app would deliver a reliable, clinically valid hearing check that could be taken to market,” Ms Mee says. “This required the application of digital skills and tools to ensure that the pieces fit together.”
The business’s success has been partly facilitated through NSW State Government support. An initial $45,000 from Industry and Investment funded the prototype and a further $1.1 million from NSW Health has aided commercialisation. “The grants have allowed us the opportunity to see the product reach its intended market, from testing kids with our first prototype to seeing it used by schools across the country,” Ms Mee says.
Source: Deloitte (2017b)
Australia’s Digital Pulse | Policy priorities to fuel Australia’s digital workforce boom
41
An examination of successful ecosystems around the world suggests that three broad features characterise a successful digital ecosystem (Handler et al. 2010):
• A culture of networks. Strong networks will enable a fluid transfer of knowledge and ideas, and greater opportunities to collaborate.
• International connections. Entrepreneurs and businesses need to use their international connections to grow and innovate.
• Sustainable innovation. The culture must promote ongoing innovation, from business practices to new products and new industries.
Moreover, these ecosystems represent digital communities of interest; close intellectual proximity enables collaborative and innovative activities between businesses, researchers and other relevant organisations (Handler et al. 2010). These ecosystems create value by supporting business models that allow agents to perform better than those that operate on their own (Gartner 2017). While geographic proximity can be very useful in achieving these objectives, it is perhaps no longer the essential defining feature, as was initially described by Porter (1990). The rise of technological platforms that facilitate knowledge sharing and partnership building across different geographies means that virtual digital ecosystems can also exist, and foster similar benefits as if businesses were physically co-located.
Digital ecosystems around the world
Successful digital precincts can provide insights into developing similar ecosystems in Australia
The most well-known example of a successful digital ecosystem is Northern California’s Silicon Valley. This hub is internationally recognised as an area with significant high-tech startup activity that drives innovation and growth in the biotechnology, nanotechnology and ‘green’ technology industries, attracting more than a quarter of all venture capital investments in the United States (Handler et al. 2010). A key driver of Silicon Valley’s success is the intense collaboration between businesses and with research institutions in the precinct. The presence of world-renowned universities in the area – such as Stanford University and the University of California, Berkeley – has also enabled it to attract and develop a large talent pool (Deloitte 2013).
Another example of a globally successful digital ecosystem is the Tech City initiative in the United Kingdom. The first Tech City started as a cluster of digital industries located in East London, and the success of this region was in part due to the early adoption of technology by creative individuals who were originally drawn to the area by cheap rent (Hanna 2016). The hub’s attractiveness drove significant growth in the number of tech companies located in the precinct, from 15 companies in 2008 to more than 200 in 2011 (CNBC 2012). Another example is the Croydon Tech City cluster, which saw a 38% growth in technology businesses between 2011 and 2013, and in June 2016 was London’s fastest growing tech ecosystem, with more than a thousand “early-stage and scale-up digital, technical and creative companies” (Croydon Tech City 2017).
8 Australia’s digital landscape and relevant policy issues
42
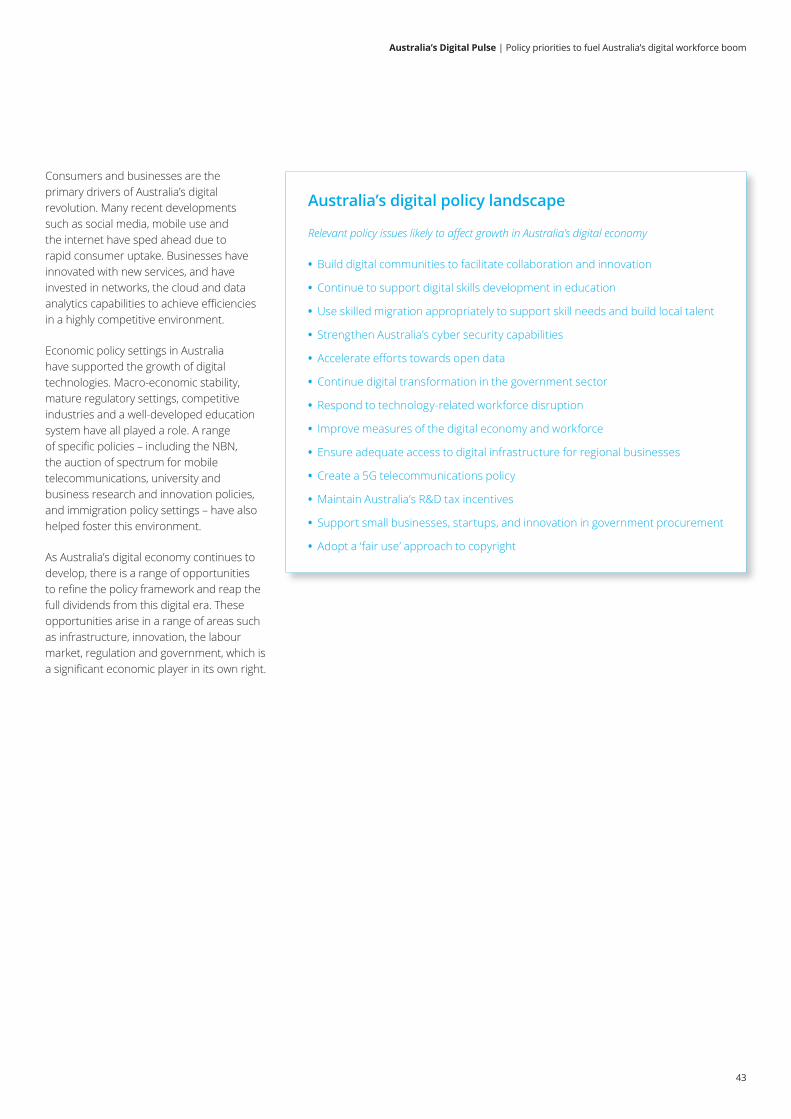
Australia’s Digital Pulse | Policy priorities to fuel Australia’s digital workforce boom
43
Consumers and businesses are the primary drivers of Australia’s digital revolution. Many recent developments such as social media, mobile use and the internet have sped ahead due to rapid consumer uptake. Businesses have innovated with new services, and have invested in networks, the cloud and data analytics capabilities to achieve efficiencies in a highly competitive environment.
Economic policy settings in Australia have supported the growth of digital technologies. Macro-economic stability, mature regulatory settings, competitive industries and a well-developed education system have all played a role. A range of specific policies – including the NBN, the auction of spectrum for mobile telecommunications, university and business research and innovation policies, and immigration policy settings – have also helped foster this environment.
As Australia’s digital economy continues to develop, there is a range of opportunities to refine the policy framework and reap the full dividends from this digital era. These opportunities arise in a range of areas such as infrastructure, innovation, the labour market, regulation and government, which is a significant economic player in its own right.
Australia’s digital policy landscape
Relevant policy issues likely to affect growth in Australia’s digital economy
• Build digital communities to facilitate collaboration and innovation
• Continue to support digital skills development in education
• Use skilled migration appropriately to support skill needs and build local talent
• Strengthen Australia’s cyber security capabilities
• Accelerate efforts towards open data
• Continue digital transformation in the government sector
• Respond to technology-related workforce disruption
• Improve measures of the digital economy and workforce
• Ensure adequate access to digital infrastructure for regional businesses
• Create a 5G telecommunications policy
• Maintain Australia’s R&D tax incentives
• Support small businesses, startups, and innovation in government procurement
• Adopt a ‘fair use’ approach to copyright
Australia’s Digital Pulse | Policy priorities to fuel Australia’s digital workforce boom
44
Build digital communities to facilitate collaboration and innovation Strong digital ecosystems can produce significant benefits by enabling collaboration between businesses, research institutions and government, and driving increased growth and innovation. These communities of digital activity can also help to attract and retain businesses and talent to Australia, generating new economic activity, growing the local digital skills base, and bringing in international best practice from large overseas technological ecosystems such as Silicon Valley.
Government policy can facilitate a supportive environment that will encourage growth in the early stages of these digital ecosystems, when it can be challenging to coordinate relevant stakeholders and source the required funding and skills. This is particularly the case when it comes to digital precincts that aim to generate startup activity, and requires strong connections between entrepreneurs, universities and established businesses in relevant industries – connections that may be difficult to build without initial government facilitation. Co-locating these stakeholders in digital precincts that enjoy government support can help build an open and collaborative culture that enables greater knowledge sharing and commercialisation of research ideas.
Deloitte’s recent report ImagineSydney: Create – Embracing an innovation mindset (2017b) explored the key policy levers governments can use to stimulate such innovation. Important considerations for policymakers building digital communities include:
• Building a location brand by establishing clear messaging that describes it as the best place to be for industry
• Leveraging diversity of like-minded businesses to facilitate greater connectivity
• Knowing what specialisations and industries are dense in particular employment hotspots, to ensure the right connections are available
• Understanding where government assistance can provide the best outcomes and returns, and prioritising these
• Identifying key areas where innovation is happening, and measuring this using a consistent and quantifiable approach.
As previously discussed, digital technologies increasingly represent a ‘horizontal’ concept that overlays all ‘vertical’ industries to drive growth. This means it is possible to target policy initiatives towards particular sectors when building digital communities, which can facilitate collaboration and driving innovative economic activity in the context of specific industries. For example, the Australian Government’s $250 million Industry Growth Centres initiative targets six industries of competitive strength and strategic priority and aims to ‘unlock commercial opportunities and drive innovation [in these industries] by connecting business and industry organisations with the research and technical expertise to solve challenges’ (DIIS 2016). This includes facilitating engagements with new technologies as part of the industry ecosystem, and building the necessary skills and capabilities required to fully realise the digitally enabled growth potential of these priority sectors.
Continue to support digital skills development in education Previous editions of Australia’s Digital Pulse have highlighted the role of the education system in developing digital and ICT skills for the workforce. At the school level, the 2015 report suggested that governments around Australia should increase their focus on equipping students with the computing skills that will be required of our future workforce (DAE 2015). There have been a number of policy developments in this area since then: the National Innovation and Science Agenda included a $51 million investment in programs to support school students creating and using digital technologies, and the implementation of the Technologies component in the Australian Curriculum has seen coding introduced to school classrooms across a number of states and territories.
There should be continued policy support for digital skills development for Australian school students, including the continued rollout of coding in classrooms, particularly where these skills can be embedded into other core subjects (such as using coding to teach mathematics or English). The latest results from the OECD’s Programme for International Student Assessment showed that Australian students’ performance in science and mathematics declined between 2012 and 2015, continuing a downward trend observed since the mid 2000s (Karp 2016). Further government investment in STEM education will be required to ensure that Australian students receive the education and support they need to develop these critical skills.
Australia’s Digital Pulse | Policy priorities to fuel Australia’s digital workforce boom
45
Ongoing skills development throughout university and in the workforce is also critical in meeting Australia’s growing demand for ICT workers and skills. Australia’s Digital Pulse in 2016 identified a number of formal and informal training opportunities, including university education, vocational education, corporate training, professional qualifications and personal learning. It is important that education practices at universities and in the workplace be consistent with the skills demanded by employers and, as discussed earlier in this report, that this promotes a mix of both technical ICT skills and general business skills. As such, support for multidisciplinary degrees and training programs is necessary to ensure that Australia continues to develop a pipeline of relevant skills.
The importance of ICT education in Australia
Technology entrepreneur Michael Malone believes collaboration between universities and industry is essential for developing a relevant ICT skills base
It is important that graduates entering the ICT workforce are equipped with the skills and experiences that employers demand. This means that students who are studying computing and ICT need to receive technical foundations such as coding and programming skills, as well as the knowledge and experience to be able to apply these foundational skills in a business context.
Michael Malone is an Australian technology entrepreneur; founder and former CEO of Perth-based telecommunications provider iiNet; and current director at NBN Co, satellite services provider SpeedCast, and domain and hosting provider Dreamscape Networks. Mr Malone believes that greater integration between businesses and universities is required to ensure that ICT students graduate with degrees that are relevant to industry. “We need to incorporate on-site industry experience into university education,” he says. “For example, in the US it’s common for ICT companies to collaborate with universities to offer students internships, for industry to offer scholarships to study ICT, for businesses to have academics on corporate boards. This is starting to happen in Australia, such as with the Commonwealth Bank’s collaboration with UNSW in quantum computing. But more engagement is required in order to build the ICT talent that Australia’s workforce needs.”
Furthermore, Mr Malone recognises the importance of attracting more students to ICT-related programs. “University is increasingly being viewed as an extension of high school, but students tend to perceive STEM degrees as relatively difficult compared to other areas,” he says. “So we need to work harder at attracting school students into the area, particularly through deliberate support for female students given the under-representation of women in ICT. Girls can choose what professions attract them from as young as eight years old, so we should be targeting them earlier at school and showing them what roles could be available in the tech industry.”
In his previous role at iiNet, Mr Malone was involved in sponsoring the ACS Foundation ICT Scholarships for WA students, which provided funding and internship opportunities to attract and retain top-performing students into the ICT industry. “Scholarships can encourage talented students to embark on further studies and career pathways in ICT, and linking these programs to industry provides these students with insights into the exciting opportunities available to them in a future ICT career,” he says.
Australia’s Digital Pulse | Policy priorities to fuel Australia’s digital workforce boom
46
Use skilled migration appropriately to support skill needs and build local talent Australia’s skilled migration program is generally acknowledged to have delivered significant tangible benefits to the broader economy, positively affecting the nation’s productivity, fiscal balance and labour market outcomes (Wright et al. 2016). As discussed previously, the ICT sector uses skilled workers from overseas to meet some existing skills requirements. In this context, skilled migrants not only help meet employers’ immediate demand for skills that are under-represented in the local population – they also help develop and train Australians in these areas, which helps secure a sustainable local supply of these skills in the medium and long term.
Greg Hunt, former Minister for Industry, Innovation and Science, has previously noted that ‘where there are gaps in Australia, if we can bring people in, they not only provide the employment which allows us to run our businesses here, but they train Australian workers and help them to be part of a globally competitive local business’ (Spencer 2016).
As such, the Australian Government should continue to maintain an open approach to skilled migration, which will support the ICT skill needs of Australian businesses. Replacing the 457 visa program with the TSS visa and the two-stream structured approach will provide a diverse range of occupations in the short-term stream, enabling businesses to operate flexibly, while the medium-term stream can be strategically targeted towards key skills that are required as part of a growing Australian economy but where there may be significant local worker shortages. This will ensure Australian businesses can access the ICT skills required to facilitate future growth, while balancing the need to secure a sustainable domestic supply of skills and workers through relevant training and development programs that build local ICT talent over time.
Notwithstanding this general principle of openness, specific areas of Australia’s skilled migration policy could be improved to address the challenges that have emerged and concerns that have arisen over recent years. These challenges include exploitation of migrant workers (particularly relatively unregulated temporary migrant workers) and misalignments between occupations on the migration list and areas where there are genuine skills shortages in Australia’s labour market (Committee for Economic Development of Australia 2016 and Wright et al. 2016). Adjustments to Australia’s skilled migration policy should seek to address these concerns to preserve the integrity of the program, maintain public confidence in the broader system and create migration policy settings that respond to the economy’s future workforce needs.
Australia’s Digital Pulse | Policy priorities to fuel Australia’s digital workforce boom
47
Improving Australia’s skilled migration program
President of the Australian Council of Trade Unions, Ged Kearney, suggests improvements to skilled migration policy
The Australian Council of Trade Unions (ACTU) is the largest peak body representing workers in Australia, comprising 38 affiliated unions across the country. Its role is to advocate for workers’ rights, including in relation to pay and conditions, workplace health and safety, and job security. It represents Australian workers in a range of government and non-government forums nationally and internationally.
Recent public debate around Australia’s skilled migration program has centred on concerns about the exploitation of migrant workers (particularly temporary migrants) and the implications of skilled migration inflows for local workers. In this context, Ged Kearney says three key ways Australia’s skilled migration policy could be improved are to:
• Address migrant worker exploitation. Temporary migrant workers can be particularly vulnerable to exploitation by unscrupulous employers, which undermines broader public confidence in the migration system. More safeguards and regulations could be implemented to protect the rights and interests of overseas workers living in Australia on temporary visas. The 2016 Senate Inquiry report A National Disgrace: The Exploitation of Temporary Work Visa Holders highlighted the extent of the exploitation in Australia’s labour market and called for these issues to be urgently addressed.
• Suitably target occupations on the skilled migration list. Although labour mobility can have economic benefits for all parties involved, the migration program needs to be targeted towards skills that are in high demand among Australian employers and where there are genuine shortages in the Australian labour market. Occupation listings should be monitored and updated regularly to ensure they accurately reflect changing local workforce conditions.
• Ensure that companies continue to employ and train Australian graduates. Although skilled migration is useful for addressing significant local skills shortages in the short term, it is critical that over the long term companies continue to train and develop Australian graduates, who represent the economy’s next generation of skilled workers. This could be tied to migration policy. For example, employers using a relatively high share of temporary migrant workers could be required to have a training plan detailing how they will also build the skills of local workers. The skilled migration program should contribute to Australia’s economy by helping to address genuine skill and labour market needs that cannot be met by training and employing Australian citizens and permanent residents.
Australia’s Digital Pulse | Policy priorities to fuel Australia’s digital workforce boom
48
Strengthen Australia’s cyber security capabilities A secure approach to addressing cyber risks in Australia will be necessary to ensure future growth in the digital economy. Prime Minister Malcolm Turnbull released Australia’s Cyber Security Strategy in 2016, setting out the Australian Government’s program for meeting the dual challenges of advancing and protecting our national interests online. The strategy acknowledges that ‘cyber opportunities and threats must be considered together and must be addressed proactively, not simply as a reaction to the inevitability of future cyber events’ (Department of the Prime Minister and Cabinet 2016). This creates a role for the government in facilitating innovation and providing security, alongside the role of Australian businesses in ensuring their cyber practices are secure, robust and up to date.
The strategy outlines key action themes the government will target over the four years to 2020, as part of securing Australia’s future prosperity in an increasingly connected digital world. These themes include: building partnerships between the government and private sector to develop Australia’s capabilities in cyber threat detection and response; cooperating with international partners to increase regional cyber security capacity; establishing a Cyber Security Growth Centre to increase cyber R&D and innovation; and working with businesses and researchers to address the shortage of cyber skills in Australia (Department of the Prime Minister and Cabinet 2016).
This report has already highlighted the significant growth opportunities associated with investing in cyber, including an uplift of 5.5% in business investment, a 2.0% increase in wages and the employment of an additional 60,000 people by 2030 (Deloitte 2017a).
Given the volume of sensitive data and important transactions held and facilitated by government agencies – such as in healthcare, defence and education – the public sector itself represents a large target for cyber crime. As such there are relatively large benefits to be gained in strengthening cyber security capabilities in this area and the costs of policy inaction could be significant.
Since 2011, the ACS’s Cyber Taskforce has highlighted the need to develop a coordinated approach to addressing Australia’s cyber risks and building a pipeline of skilled cyber professionals (ACS 2016). The ACS held a Cyber Forum in November 2016, uncovering many new insights into how Australia should develop its cyber security ecosystem, build the resilience of businesses and governments, and stay on top of old and new threats. Some of the key messages raised by Australian and global leaders who participated in the forum are outlined on the following page.
Accelerate efforts towards open data The government collects and holds a significant amount of data. This includes raw (or basic) data collected in the course of usual government operations, such as meteorological data; and incremental (value-added) data, where the data has been manipulated or additional information has been added, such as mapped mineral deposits.
There is economic value in making government data publicly available. Benefits include the creation of new data-driven products and services, increased operational efficiency in the public and private sectors, and better public engagement. Deloitte Access Economics recently conducted research for the Bureau of Communications Research (BCR) on Open government data and why it matters. The research found that open government data invariably has a net economic benefit and that the maximum public benefit will accrue from providing raw government data for free or, at the most, pricing data at the incremental cost of providing it (BCR 2016).
In this context, the PC recently completed an inquiry into ways of improving the availability and use of public and private sector data, handing a final report to the government in March 2017. The draft report highlighted the significant growth in data generation and usability in recent years, and opportunities for collecting and sharing this data to improve productivity and operational processes across the government sector and business (PC 2016b). The PC Chairman Peter Harris has since stated that as innovators, those in the public sector have been poorly served by current regulations and practices, which impede data analytics. ‘Data is the thing that ties our future national welfare together… [but] we are not using it to its potential,’ Mr Harris said (Sadler 2017).
Australia’s Digital Pulse | Policy priorities to fuel Australia’s digital workforce boom
49
Cyber security insights from Australian and global leaders
Key messages from the ACS Cyber Forum held in November 2016
“When you talk about confidence and trust, if people don’t have confidence and trust to trade, to buy, to sell or to undertake commerce within an e-digital world – an e-commerce world – then obviously that’s one of the quickest ways that we have to ensure that society starts to regress rather than to progress.” – The Hon. Philip Dalidakis, Victorian Minister for Small Business, Innovation and Trade
“Growth innovation is important to allow all Australian businesses to be able to benefit from cyber security. And it isn’t just the security businesses – it’s how do we enable all businesses to gain a competitive edge by having secured products and services? Also, [how do we become] a ‘cyber smart nation’ where all Australians have the knowledge, the skills and the capacity to thrive in the digital age?” – Ms Sandra Ragg, Assistant Secretary, Cyber Policy, Department of the Prime Minister and Cabinet
“We’re fighting against 17-year-old boys who hack just to show what they are capable of. We're fighting against hacktivists, like Anonymous, [who are] fighting for a certain ideology. We’re fighting against organised crime and we’re fighting against states who use their capabilities to steal information. It might be interesting for you to know that cyber crime and cyber-enabled crime has in some European countries surpassed traditional crime. You might ask yourself, ‘Is our police force ready to deal with this?’” – Ms Elly van den Heuvel, Secretary to the Cyber Security Council of the Netherlands
“The first thing we came to realise is that cyber security is a process, it is not a product … Of course, inside your own organisations it is an enterprise-wide risk. It is no good if the IT department is really good at cyber security, but if some in the HR department are not. That would be a vulnerable organisation through which you are compromised. Cyber security is a team sport. Is that how it’s seen in your organisations? Who are your partners? Who are you talking to in order to improve your understanding of the issues?” – Major General Stephen Day, former Head of Cyber at the Department of Defence and inaugural head of the Australian Cyber Security Centre
“Something that we found to be very important is the idea of adaptive security. Our security policies need to change depending on the context. They need to change over time. They need to change with the time of day, with the assets that are in a particular location and who is there.” – Mr Mike Hinchey, President International Federation for Information Processing
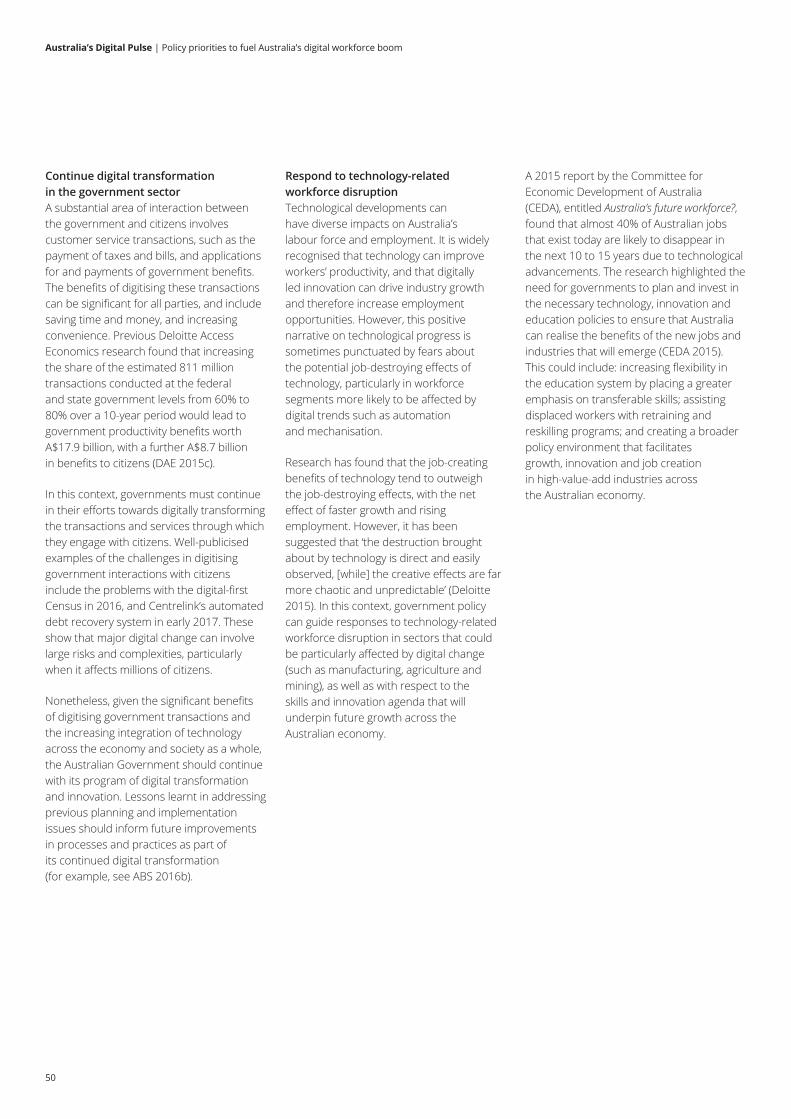
Australia’s Digital Pulse | Policy priorities to fuel Australia’s digital workforce boom
50
Continue digital transformation in the government sector A substantial area of interaction between the government and citizens involves customer service transactions, such as the payment of taxes and bills, and applications for and payments of government benefits. The benefits of digitising these transactions can be significant for all parties, and include saving time and money, and increasing convenience. Previous Deloitte Access Economics research found that increasing the share of the estimated 811 million transactions conducted at the federal and state government levels from 60% to 80% over a 10-year period would lead to government productivity benefits worth A$17.9 billion, with a further A$8.7 billion in benefits to citizens (DAE 2015c).
In this context, governments must continue in their efforts towards digitally transforming the transactions and services through which they engage with citizens. Well-publicised examples of the challenges in digitising government interactions with citizens include the problems with the digital-first Census in 2016, and Centrelink’s automated debt recovery system in early 2017. These show that major digital change can involve large risks and complexities, particularly when it affects millions of citizens.
Nonetheless, given the significant benefits of digitising government transactions and the increasing integration of technology across the economy and society as a whole, the Australian Government should continue with its program of digital transformation and innovation. Lessons learnt in addressing previous planning and implementation issues should inform future improvements in processes and practices as part of its continued digital transformation (for example, see ABS 2016b).
Respond to technology-related workforce disruption Technological developments can have diverse impacts on Australia’s labour force and employment. It is widely recognised that technology can improve workers’ productivity, and that digitally led innovation can drive industry growth and therefore increase employment opportunities. However, this positive narrative on technological progress is sometimes punctuated by fears about the potential job-destroying effects of technology, particularly in workforce segments more likely to be affected by digital trends such as automation and mechanisation.
Research has found that the job-creating benefits of technology tend to outweigh the job-destroying effects, with the net effect of faster growth and rising employment. However, it has been suggested that ‘the destruction brought about by technology is direct and easily observed, [while] the creative effects are far more chaotic and unpredictable’ (Deloitte 2015). In this context, government policy can guide responses to technology-related workforce disruption in sectors that could be particularly affected by digital change (such as manufacturing, agriculture and mining), as well as with respect to the skills and innovation agenda that will underpin future growth across the Australian economy.
A 2015 report by the Committee for Economic Development of Australia (CEDA), entitled Australia’s future workforce?, found that almost 40% of Australian jobs that exist today are likely to disappear in the next 10 to 15 years due to technological advancements. The research highlighted the need for governments to plan and invest in the necessary technology, innovation and education policies to ensure that Australia can realise the benefits of the new jobs and industries that will emerge (CEDA 2015). This could include: increasing flexibility in the education system by placing a greater emphasis on transferable skills; assisting displaced workers with retraining and reskilling programs; and creating a broader policy environment that facilitates growth, innovation and job creation in high-value-add industries across the Australian economy.
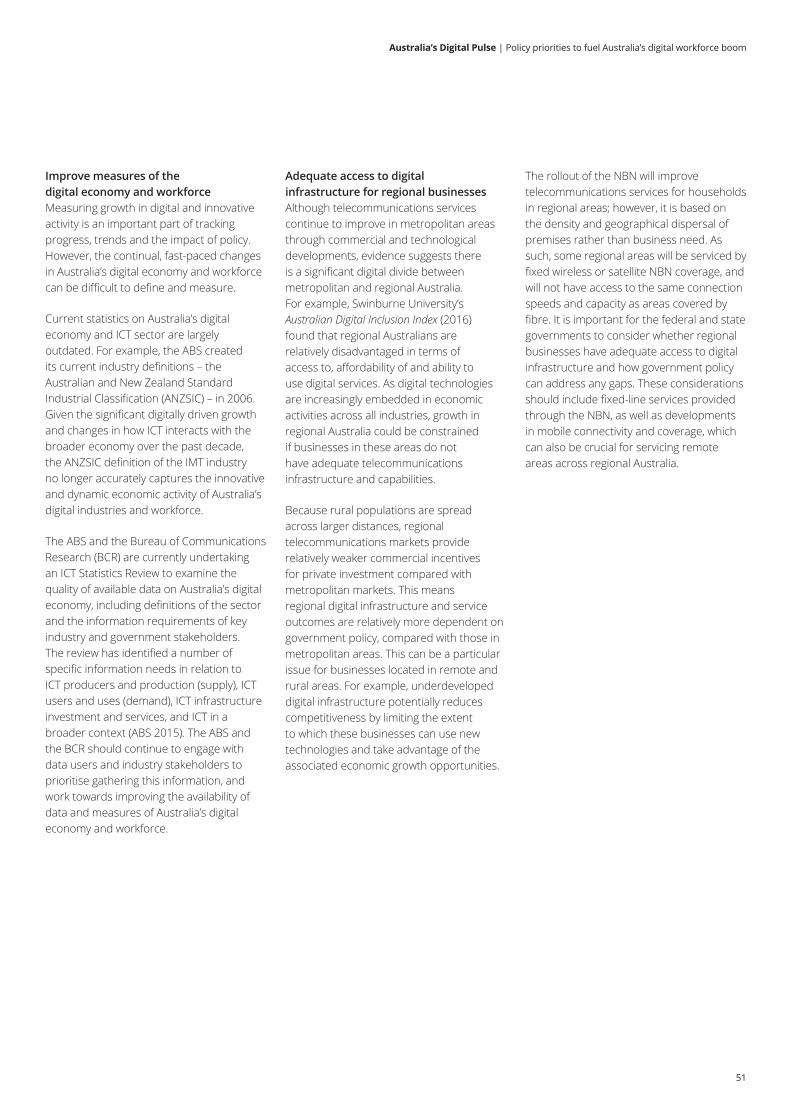
Australia’s Digital Pulse | Policy priorities to fuel Australia’s digital workforce boom
51
Improve measures of the digital economy and workforce Measuring growth in digital and innovative activity is an important part of tracking progress, trends and the impact of policy. However, the continual, fast-paced changes in Australia’s digital economy and workforce can be difficult to define and measure.
Current statistics on Australia’s digital economy and ICT sector are largely outdated. For example, the ABS created its current industry definitions – the Australian and New Zealand Standard Industrial Classification (ANZSIC) – in 2006. Given the significant digitally driven growth and changes in how ICT interacts with the broader economy over the past decade, the ANZSIC definition of the IMT industry no longer accurately captures the innovative and dynamic economic activity of Australia’s digital industries and workforce.
The ABS and the Bureau of Communications Research (BCR) are currently undertaking an ICT Statistics Review to examine the quality of available data on Australia’s digital economy, including definitions of the sector and the information requirements of key industry and government stakeholders. The review has identified a number of specific information needs in relation to ICT producers and production (supply), ICT users and uses (demand), ICT infrastructure investment and services, and ICT in a broader context (ABS 2015). The ABS and the BCR should continue to engage with data users and industry stakeholders to prioritise gathering this information, and work towards improving the availability of data and measures of Australia’s digital economy and workforce.
Adequate access to digital infrastructure for regional businesses Although telecommunications services continue to improve in metropolitan areas through commercial and technological developments, evidence suggests there is a significant digital divide between metropolitan and regional Australia. For example, Swinburne University’s Australian Digital Inclusion Index (2016) found that regional Australians are relatively disadvantaged in terms of access to, affordability of and ability to use digital services. As digital technologies are increasingly embedded in economic activities across all industries, growth in regional Australia could be constrained if businesses in these areas do not have adequate telecommunications infrastructure and capabilities.
Because rural populations are spread across larger distances, regional telecommunications markets provide relatively weaker commercial incentives for private investment compared with metropolitan markets. This means regional digital infrastructure and service outcomes are relatively more dependent on government policy, compared with those in metropolitan areas. This can be a particular issue for businesses located in remote and rural areas. For example, underdeveloped digital infrastructure potentially reduces competitiveness by limiting the extent to which these businesses can use new technologies and take advantage of the associated economic growth opportunities.
The rollout of the NBN will improve telecommunications services for households in regional areas; however, it is based on the density and geographical dispersal of premises rather than business need. As such, some regional areas will be serviced by fixed wireless or satellite NBN coverage, and will not have access to the same connection speeds and capacity as areas covered by fibre. It is important for the federal and state governments to consider whether regional businesses have adequate access to digital infrastructure and how government policy can address any gaps. These considerations should include fixed-line services provided through the NBN, as well as developments in mobile connectivity and coverage, which can also be crucial for servicing remote areas across regional Australia.
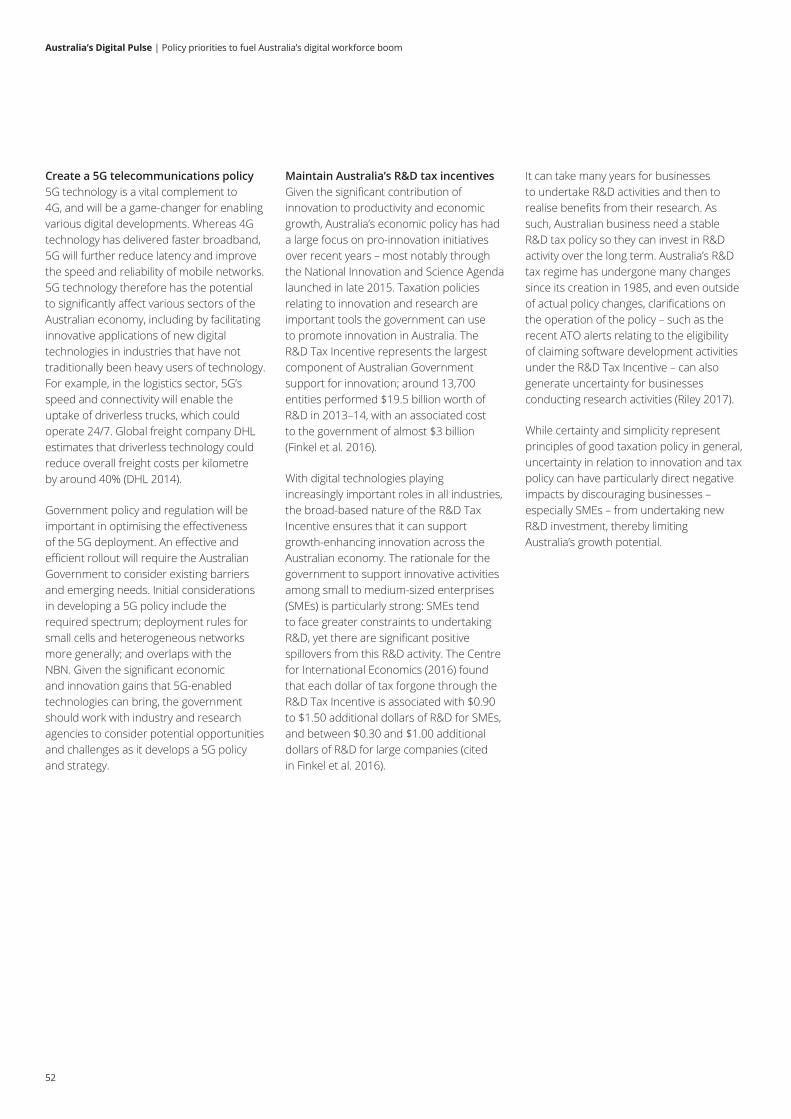
Australia’s Digital Pulse | Policy priorities to fuel Australia’s digital workforce boom
52
Create a 5G telecommunications policy 5G technology is a vital complement to 4G, and will be a game-changer for enabling various digital developments. Whereas 4G technology has delivered faster broadband, 5G will further reduce latency and improve the speed and reliability of mobile networks. 5G technology therefore has the potential to significantly affect various sectors of the Australian economy, including by facilitating innovative applications of new digital technologies in industries that have not traditionally been heavy users of technology. For example, in the logistics sector, 5G’s speed and connectivity will enable the uptake of driverless trucks, which could operate 24/7. Global freight company DHL estimates that driverless technology could reduce overall freight costs per kilometre by around 40% (DHL 2014).
Government policy and regulation will be important in optimising the effectiveness of the 5G deployment. An effective and efficient rollout will require the Australian Government to consider existing barriers and emerging needs. Initial considerations in developing a 5G policy include the required spectrum; deployment rules for small cells and heterogeneous networks more generally; and overlaps with the NBN. Given the significant economic and innovation gains that 5G-enabled technologies can bring, the government should work with industry and research agencies to consider potential opportunities and challenges as it develops a 5G policy and strategy.
Maintain Australia’s R&D tax incentives Given the significant contribution of innovation to productivity and economic growth, Australia’s economic policy has had a large focus on pro-innovation initiatives over recent years – most notably through the National Innovation and Science Agenda launched in late 2015. Taxation policies relating to innovation and research are important tools the government can use to promote innovation in Australia. The R&D Tax Incentive represents the largest component of Australian Government support for innovation; around 13,700 entities performed $19.5 billion worth of R&D in 2013–14, with an associated cost to the government of almost $3 billion (Finkel et al. 2016).
With digital technologies playing increasingly important roles in all industries, the broad-based nature of the R&D Tax Incentive ensures that it can support growth-enhancing innovation across the Australian economy. The rationale for the government to support innovative activities among small to medium-sized enterprises (SMEs) is particularly strong: SMEs tend to face greater constraints to undertaking R&D, yet there are significant positive spillovers from this R&D activity. The Centre for International Economics (2016) found that each dollar of tax forgone through the R&D Tax Incentive is associated with $0.90 to $1.50 additional dollars of R&D for SMEs, and between $0.30 and $1.00 additional dollars of R&D for large companies (cited in Finkel et al. 2016).
It can take many years for businesses to undertake R&D activities and then to realise benefits from their research. As such, Australian business need a stable R&D tax policy so they can invest in R&D activity over the long term. Australia’s R&D tax regime has undergone many changes since its creation in 1985, and even outside of actual policy changes, clarifications on the operation of the policy – such as the recent ATO alerts relating to the eligibility of claiming software development activities under the R&D Tax Incentive – can also generate uncertainty for businesses conducting research activities (Riley 2017).
While certainty and simplicity represent principles of good taxation policy in general, uncertainty in relation to innovation and tax policy can have particularly direct negative impacts by discouraging businesses – especially SMEs – from undertaking new R&D investment, thereby limiting Australia’s growth potential.
Australia’s Digital Pulse | Policy priorities to fuel Australia’s digital workforce boom
53
In this context, it is important for the government to carefully consider its response to the six recommendations provided in the Review of the R&D Tax Incentive (Finkel et al. 2016). While these recommendations are targeted towards improving the R&D Tax Incentive in key priority areas such as transparency, stability, additionality and promoting collaboration, it is also important that the government ensures that any policy changes do not erode Australia’s competitive advantage in attracting global innovation expenditure, and maintains suitable incentives for both SMEs and larger companies to invest in R&D. Some of the Review’s recommendations could be administratively complex and may deter future R&D activities. With the recent ATO alerts illustrating how even updated guidance on the R&D Tax Incentive can negatively impact businesses’ activities, the government must think carefully about making changes to this policy.
Support small businesses, startups and innovation in government procurement Governments represent a large potential market for Australian businesses, as they procure a range of goods and services from the private sector. There are a number of areas where government procurement practices could be improved, but unclear objectives in procurement is number one.
Improving procurement practices would reduce costs and provide new supply opportunities, particularly in supporting small businesses in Australia to compete and innovate in the longer term. In the context of digital technology procurement, it is also important for governments to set consistent and simple standards for ICT procurement, to ensure the functionality and interoperability of systems, and to enable services to be structured and priced appropriately (for example, pay-per-use versus major capital investment) to provide better overall value.
The Australian Government recently announced plans to increase the proportion of its A$5.6 billion ICT spend that goes to smaller local suppliers by 10 percentage points. This would open up as much as A$560 million for spending with startups and smaller technology companies. The purpose of this initiative is to improve the quality and efficiency of government service delivery by using innovative solutions from small businesses in the private sector while strengthening the local tech industry. In announcing these plans to combine government procurement with industry development, Assistant Minister for Digital Transformation and Cities Angus Taylor, noted that ‘innovation alongside the much more traditional vendor relationships [is] absolutely crucial’ (Riley 2016).
Adopt a ‘fair use’ approach to copyright Copyright law serves an important purpose in today’s economy. It seeks to encourage economic efficiency in the production, management and use of creative output by providing appropriate incentives for the creation of new content.
Australian copyright law currently contains a number of ‘fair dealing’ exceptions, specifying that copyright material can be used for certain purposes without the copyright owner’s permission. These include research or study, criticism, review, parody, satire and news reporting. Lawyers and attorneys may also use it in giving professional advice. An alternative approach called ‘fair use’ exists in the United States and has been adopted by a number of other countries in recent years. Rather than specifying particular uses that may be permitted without a copyright holder’s permission, it sets out a series of principles for assessing whether any potential use is fair. These include the purpose and character of the use, the nature of the copyrighted work, the amount of work used and the potential effect on the market value of the copyrighted work.
The potential for Australia to shift from its current system of fair dealing to one of fair use has been considered in a number of recent reviews. In 2013, the Australian Law Reform Commission (ALRC) recommended introducing fair use in Australia. The key reasons were that fair use is technology-neutral, so that as new technologies emerge in a digital economy, there is no need to wait for Parliament to introduce additional exceptions to the current fair dealing exceptions to cover these new uses. Under fair use, any potential use could be simply assessed against the fair use principles. The ALRC concluded that fair use would make Australia a more attractive market for technology investment and innovation, and would promote the transformative use of material as digital platforms enable producers to transform existing works into new ones.
The ALRC report also flagged that the legality of activities such as text mining, data mining and cloud computing – which are significant growth areas of the digital economy – remained uncertain under current copyright laws. The ALRC’s findings were recently backed up by those of the PC Inquiry into Australia’s Intellectual Property Arrangements, which also recommended a shift to fair use. This approach has been supported by the findings in a recent cost–benefit analysis of the shift to fair use, conducted by Ernst & Young for the Department of Communications and the Arts. This analysis concluded that an open-ended system of exceptions such as fair use is likely to have the largest net benefit to society given its flexibility in responding to a rapidly changing digital environment.
Australia’s Digital Pulse | Policy priorities to fuel Australia’s digital workforce boom
54
ReferencesA3DMA (2017), Manufacturing Value for Australia – Industry. Available at: http://www.a3dma.org.au/aboutus/industry/.
Abernathy, Mark (2017), ‘High margin services and technology to take greater role: Ciobo’, Australian Financial Review. Available at: http://www.afr.com/news/special-reports/export-and-trade/highmargin-services-and-technology-to-take-greater-role--ciobo-20170319-gv1r6k.
Australian Bureau of Statistics [ABS] (2015), Discussion Paper: Submission Process for the Information and Communications Technology Statistics Review, 2014–15. Available at: http://www.abs.gov.au/ausstats/[email protected]/Lookup/8179.0.55.001main+features12014-15.
ABS (2016a), International Trade: Supplementary Information, Calendar Year, 2015. Available at: http://www.abs.gov.au/ausstats/ [email protected]/PrimaryMainFeatures/5368.0.55.004?OpenDocument.
ABS (2016b), Census 2016: Lessons Learned – Improving Cyber Security Culture and Practice. Available at: http://www.abs.gov.au/websitedbs/d3310114.nsf/home/Australian%20Statistician%20-%20Speeches%20-%20Census%202016%20Lessons%20Learned.
Australian Computer Society [ACS] (2016), Cyber Security: Threats, Challenges, Opportunities. Available at: https://www.acs.org.au/content/dam/acs/acs-publications/ACS_Cybersecurity_Guide.pdf.
Australian Seniors Insurance Agency (2016), Seniors in the workplace, Available at: http://www.seniors.com.au/news-insights/ageism-in-the-aussie-workplace-are-we-missing-out.
Australian Trade and Investment Commission (2017), Information Communications Technology. Available at: https://www.austrade.gov.au/International/Buy/Australian-industry-capabilities/ICT.
Barnes, John (2013), ‘Can 3D printing rebuild manufacturing in Australia?’, The Conversation. Available at: http://theconversation.com/can-3d-printing-rebuild-manufacturing-in-australia-16670.
Best, Cameron (2016), ‘Remote ultrasound robot that give operator sense of touch pioneered by scientists’, ABC News. Available at: http://www.abc.net.au/news/2016-05-20/remote-ultrasound-robots-give-operator-sense-of-touch-developed/7433598.
Bureau of Communications Research (2016), Open government data and why it matters.
Committee for Economic Development of Australia [CEDA] (2016), Migration: the economic debate.
Chartered Accountants Australia and New Zealand [CAANZ] (2016), The Future of Work: How can we adapt to survive and thrive?. Available at: https://www2.deloitte.com/content/dam/Deloitte/au/Documents/Economics/deloitte-au-economics-future-inc-adapt-thrive-survive-230215.pdf.
CAANZ (2017), The Future of Trade: Are we ready to embrace the opportunities?. Available at: https://www.charteredaccountantsanz.com/news-and-analysis/insights/future-inc/future-of-trade.
CNBC (2012), 15 Surprising Global Technology Cities. Available at: http://www.cnbc.com/2012/10/10/15-Surprising-Global-Technology-Cities.html.
Committee for Economic Development Australia [CEDA] (2015), Australia’s future workforce?. Available at: http://adminpanel.ceda.com.au/FOLDERS/Service/Files/Documents/26792~Futureworkforce_ June2015.pdf.
Commonwealth Scientific and Industrial Research Organisation [CSIRO] (2015), Phenonet: harnessing digital agriculture. Available at: https://www.csiro.au/en/Research/D61/Areas/Robotics-and-autonomous-systems/Internet-of-Things/Phenonet.
Croydon Tech City (2017), Homepage. Available at: http://croydontechcity.com/.
CSIRO (2016), Home Monitoring of Chronic Disease for Aged Care. Available at: https://www.csiro.au/en/Research/BF/Areas/Digital-health/Improving-access/Home-monitoring.
Daugherty, Paul (2015), The Rise Of Digital Ecosystems in the ‘We Economy’, Forbes. Available at: https://www.forbes.com/sites/ciocentral/2015/03/09/the-rise-of-digital-ecosystems-in-the-we-economy/#665897e15514.
Deloitte (2013), London: Enabling a world leading digital hub.
Deloitte (2015), Technology and people: The great job-creating machine. Available at: http://www2.deloitte.com/content/dam/Deloitte/uk/Documents/finance/deloitte-uktechnology-and-people.pdf.
Deloitte (2016a), Beneath the surface of a cyberattack: A deeper look at business impacts. Available at: https://www2.deloitte.com/us/en/pages/risk/articles/hidden-business-impact-of-cyberattack.html.
Deloitte (2016b), Women in IT jobs: it is about education, but also about more than just education. Available at: https://www2.deloitte.com/au/en/pages/technology-media-and-telecommunications/articles/tmt-predictions-2016-tech-women-in-it-jobs.html.
Deloitte (2017a), What’s over the horizon? Recognising opportunity in uncertainty. Available at: https://www2.deloitte.com/au/en/pages/building -lucky-country/articles/whats-over-horizon.html.
Deloitte (2017b), ImagineSydney: Create – Embracing an innovation mindset. Available at: https://www2.deloitte.com/au/en/pages/future-of-cities/articles/imagine-sydney-create.html.
Deloitte Access Economics [DAE] (2015a), The Connected Continent II: How digital technology is transforming the Australian economy. Available at: https://www2.deloitte.com/content/dam/Deloitte/au/Documents/Economics/deloitte-au-economics-connected-continent-ii-2015-300315.pdf.
DAE (2015b), Australia’s Digital Pulse: Key challenges for our nation – digital skills, jobs and education. Available at: https://www.acs.org.au/content/dam/acs/acs-publications/02062015-Australias-Digital-Pulse-FINAL.PDF.
DAE (2015c), Digital government transformation. Available at: https://www2.deloitte.com/content/dam/Deloitte/au/Documents/Economics/deloitte-au-economics-digital-government-transformation-230715.pdf.
Australia’s Digital Pulse | Policy priorities to fuel Australia’s digital workforce boom
55
DAE (2016a), Australia’s Digital Pulse: Developing the digital workforce to drive growth in the future. Available at: https://www.acs.org.au/content/dam/acs/acs-documents/PJ52569-Australias-Digital-Pulse-2016_LAYOUT_Final_Web.pdf.
DAE (2016b), Connected Small Businesses 2016. Available at: https://www2.deloitte.com/content/dam/Deloitte/au/Documents/Economics/deloitte-au-economics-connected-small-businesses-google-051016.pdf.
DAE (2016c), Westmead Innovation District: Building Western Sydney’s jobs engine.
DAE (2017a), The Future of Trade. Available at: https://www2.deloitte.com/ au/en/pages/economics/articles/future-inc-series-caanz.html.
DAE (2017b) Navigating legacy: Charting the course to business value. Available at: https://www2.deloitte.com/uk/en/pages/technology/articles/cio-survey.html.
DeNisco, Alison (2016), ‘Myth busted: older workers are just as tech savvy as younger ones says new survey’, Tech Republic. Available at: http://www.techrepublic.com/article/myth-busted-older-workers-are -just-as-tech-savvy-as-younger-ones-says-new-survey/.
Department of Agriculture and Water Resources (2017), Rural Research and Development for Profit. Available at: http://www.agriculture.gov.au/ag-farm-food/innovation/rural-research-development-for-profit.
Department of Immigration and Border Protection [DIBP] (2017), Abolition and replacement of the 457 visa – Government reforms to employer sponsored skilled migration visas. Available at: https://www.border.gov.au/Trav/Work/457-abolition-replacement.
Department of Industry, Innovation and Science [DIIS] (2015), Australian Industry Report. Available at: https://industry.gov.au/Office-of-the-Chief-Economist/Publications/Documents/AIR2015.pdf.
Department of Prime Minister and Cabinet [DPMC] (2016), Australia’s Cyber Security Strategy: Enabling innovation, growth & prosperity. Available at: https://cybersecuritystrategy.dpmc.gov.au/assets/img/PMC-Cyber-Strategy.pdf.
DIIS (2016), Industry Growth Centres: Initiative summary. Available at: https://industry.gov.au/industry/Industry-Growth-Centres/Pages/default.aspx.
DHL (2014), Self-driving Vehicles in Logistics. Available at: http://www.dhl.com/content/dam/downloads/g0/about_us/logistics_insights/dhl_self_driving_vehicles.pdf.
Finkel, Alan; Ferris, Bill; and Fraser, John (2016), Review of the R&D Tax Incentive. Available at: https://www.business.gov.au/assistance/research-and-development-tax-incentive/review-of-the-randd-tax-incentive.
Foundation for Young Australians [FYA] (2016), The New Basics. Available at: https://www.fya.org.au/wp-content/uploads/2016/04/The-New-Basics_ Update_Web.pdf.
Gartner (2017a), Ecosystems are the future of digital. Available at: http://www.gartner.com/technology/topics/digital-ecosystems.jsp.
Gartner (2017b), Insights From the 2017 CIO Agenda Report: Seize the Digital Ecosystem Opportunity. Available at: http://www.gartner.com/imagesrv/cio/pdf/Gartner_CIO_Agenda_2017.pdf.
Gartner (2017c), Top Organisations Create Digital Ecosystems. Available at: http://www.gartner.com/technology/cio-trends/cio-agenda/cio-infographic.jsp.
Handler, Doug; Lange, Anne; and Vila, James (2010), Next-Generation Clusters: Creating Innovation Hubs To Boost Economic Growth, CISCO White Paper, June 2010. Available at: http://www.cisco.com/c/dam/en_us/about/ac79/docs/pov/Clusters_Innovation_Hubs_FINAL.pdf.
Hanna, Kat (2016), Spaced To Think: Innovation Districts And The Changing Geography of London’s Knowledge Economy, Centre for London. Available at: http://www.centreforlondon.org/wp-content/uploads/2016/08/J4234CFL_Innovation_Districts_WEB.pdf.
Henry, Mark (2015), ‘Big data and the future of farming’, Farm Institute Insights Vol 12(4).
Karp, Paul (2016), ‘Pisa results: Australian students’ science, maths and reading in long-term decline’, The Guardian. Available at: https://www.theguardian.com/australia-news/2016/dec/06/pisa-results-australian-students-science-maths-and-reading-in-long-term-decline.
Kimmorley, Sarah (2016), Here are the new tax incentives for Australian entrepreneurs, Business Insider Australia. Available at: https://www.businessinsider.com.au/australian-entrepreneurs-new-tax-changes-innovation-2016-3.
Limb, Matthew (2016), ‘World will lack 18 million health workers by 2030 without adequate investment, warns UN’, British Medical Journal. Available at: http://www.who.int/hrh/com-heeg/bmj.i5169.full.pdf?ua=1.
McKinsey (2016), Digital globalization: The new era of global flows.
Meola, Andrew (2016), ‘Why IoT, big data & smart farming are the future of agriculture’, Business Insider. Available at: http://www.businessinsider.com/internet-of-things-smart-agriculture-2016-10/?r=AU&IR=T.
Moore, Tony (2016), Fortitude Valley to become Queensland’s new Start-Up Precinct: Premier, Brisbane Times. Available at: http://www.brisbanetimes.com.au/queensland/fortitude-valley-to-become-queenslands-new-startup-precinct-premier-20160428-gogwjs.html.
Organisation for Economic Co-operation and Development [OECD] (2012), ICT Skills and Employment – New competencies and jobs for a greener and smarter economy.
OECD (2013), Measuring the Internet Economy: A Contribution to Research Agenda. OECD Digital Economy Papers, No. 225.
Patty, Anna (2016), ‘Companies that use older workers are the most innovative: new research’, The Sydney Morning Herald. Available at: http://www.smh.com.au/business/workplace-relations/companies-that-use-older-workers-are-the-most-innovative-new-research-20160418-go93h1.html.
Plunkett, Suzanne (2016), Testing times: The Fourth Industrial Revolution will bring challenges for both genders. Available at: https://www.weforum.org/agenda/2016/01/could-women-see-gender-parity-in-the-4th-industrial-revolution/.
Ponemon Institute (2015), 2015 Cost of Cyber Crime Study: Australia. Available at: https://ssl.www8.hp.com/ww/en/secure/pdf/4aa5-5210enw.pdf.
Porter, Michael E. (1990), The competitive advantage of nations, Harvard Business Review, March/April 1990.
Porter, Michael E. (1998), Clusters and the New Economics of Competition, Harvard Business Review, November/December 1998, Vol. 76, Issue 6.
Productivity Commission [PC] (2016a), Increasing Australia’s future prosperity: 5 year productivity review. Productivity Commission Discussion Paper, November 2016.
PC (2016b), Data Availability and Use: Productivity Commission Draft Report – Overview & Draft Recommendations, October 2016. Available at: http://www.pc.gov.au/inquiries/completed/data-access/draft/data-access-overview-draft.pdf.
Australia’s Digital Pulse | Policy priorities to fuel Australia’s digital workforce boom
56
PC (2016c), Digital Disruption: What do governments need to do?. Productivity Commission Research Paper, June 2016.
Qu, Jason; Simes, Ric; and O’Mahony, John (2016), How do digital technologies drive economic growth?.
Raper, Ashleigh (2016), Plan to turn western Sydney’s Westmead into Silicon Valley of health, ABC News. Available at: http://www.abc.net.au/news/2016-07-19/plan-to-turn-westmead-into-silicon-valley-of-health-services/7640072.
Riley, James (2016), Taylor’s boost for local tech SMEs, InnovationAus. Available at: http://www.innovationaus.com/2016/11/Taylors-boost-for-local-tech-SMEs/.
Riley, James (2017), R&D: Keep calm, carry on claiming, InnovationAus. Available at: http://www.innovationaus.com/2017/03/RD-Keep-calm-carry-on-claiming/.
Rural Industries Research and Development Corporation [RIRDC] (2016), Cross-Industry Innovation Scan. Available at: https://rirdc.infoservices.com.au/items/16-046.
Rosseau, Oscar (2015), Australian beef goes online in China. Available at: http://www.globalmeatnews.com/Industry-Markets/Australian-beef-goes-online-in-China.
Sadauskas, Andrew (2016), Could Tonsley become Australia’s Silicon Valley?, Business IT. Available at: https://www.bit.com.au/guide/438138,could-tonsley-become-australia8217s-silicon-valley.aspx.
Sadler, Denham (2017), Deleting data like ‘book burning’, InnovationAus. Available at: http://www.innovationaus.com/2017/03/Deleting-data-like -book-burning/.
Spencer, Leon (2016), IT workers singled out amid 457 visa changes, ARN. Available at: http://www.arnnet.com.au/article/610376/govt-singles-it-workers-amid-457-visa-changes/.
Stokes, Katrina (2016), ‘Robotic surgery gains in popularity in Australia but is it a dream machine or expensive operation’, The Advertisers.
Swinburne University (2016), Measuring Australia’s Digital Divide. Available at: http://digitalinclusionindex.org.au/wp-content/uploads/2016/08/Australian-Digital-Inclusion-Index-2016.pdf.
Tech City (n.d.), Find Out About Us – Tech City UK. Available at: http://www.techcityuk.com/about-us/.
Tech City UK (2016), Tech Nation 2016: Transforming UK Industries. Available at: http://www.techcityuk.com/wp-content/uploads/2016/02/Tech-Nation-2016_FINAL-ONLINE-1.pdf.
Tonsley (2017), Homepage. Available at: https://tonsley.com.au/.
Thompson, Clive (2017), ‘The next big blue collar job is coding’, WIRED. Available at: https://www.wired.com/2017/02/programming-is-the-new-blue-collar-job/?mbid=nl_21117_p1&CNDID=24591883.
United Nations Food and Agriculture Organisation (2011), State of the World’s Land and Water Resources for Food and Agriculture, Available at: http://www.fao.org/docrep/017/i1688e/i1688e00.htm.
Ward, James (2017), Queensland government opens new startup precinct in Fortitude Valley, Startup Daily. Available at: http://www.startupdaily.net/ 2017/03/queensland-government-opens-startup-precinct-fortitude-valley/.
Wright, Chris; Clibborn, Stephen; Piper, Nicola; and Cini, Nicole (2016), Economic migration and Australia in the 21st century, Lowy Institute.
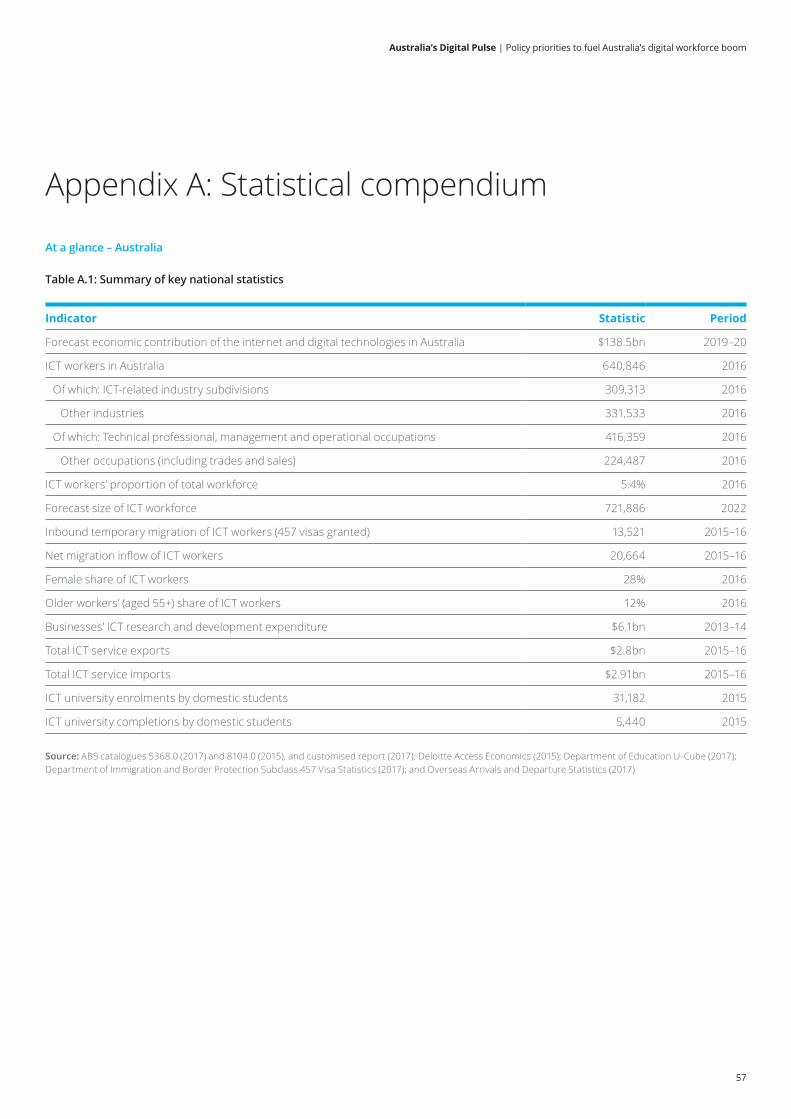
Australia’s Digital Pulse | Policy priorities to fuel Australia’s digital workforce boom
57
Appendix A: Statistical compendium
At a glance – Australia
Table A.1: Summary of key national statistics
Indicator Statistic Period
Forecast economic contribution of the internet and digital technologies in Australia $138.5bn 2019–20
ICT workers in Australia 640,846 2016
Of which: ICT-related industry subdivisions 309,313 2016
Other industries 331,533 2016
Of which: Technical professional, management and operational occupations 416,359 2016
Other occupations (including trades and sales) 224,487 2016
ICT workers’ proportion of total workforce 5.4% 2016
Forecast size of ICT workforce 721,886 2022
Inbound temporary migration of ICT workers (457 visas granted) 13,521 2015–16
Net migration inflow of ICT workers 20,664 2015–16
Female share of ICT workers 28% 2016
Older workers’ (aged 55+) share of ICT workers 12% 2016
Businesses’ ICT research and development expenditure $6.1bn 2013–14
Total ICT service exports $2.8bn 2015–16
Total ICT service imports $2.91bn 2015–16
ICT university enrolments by domestic students 31,182 2015
ICT university completions by domestic students 5,440 2015
Source: ABS catalogues 5368.0 (2017) and 8104.0 (2015), and customised report (2017); Deloitte Access Economics (2015); Department of Education U-Cube (2017); Department of Immigration and Border Protection Subclass 457 Visa Statistics (2017); and Overseas Arrivals and Departure Statistics (2017)
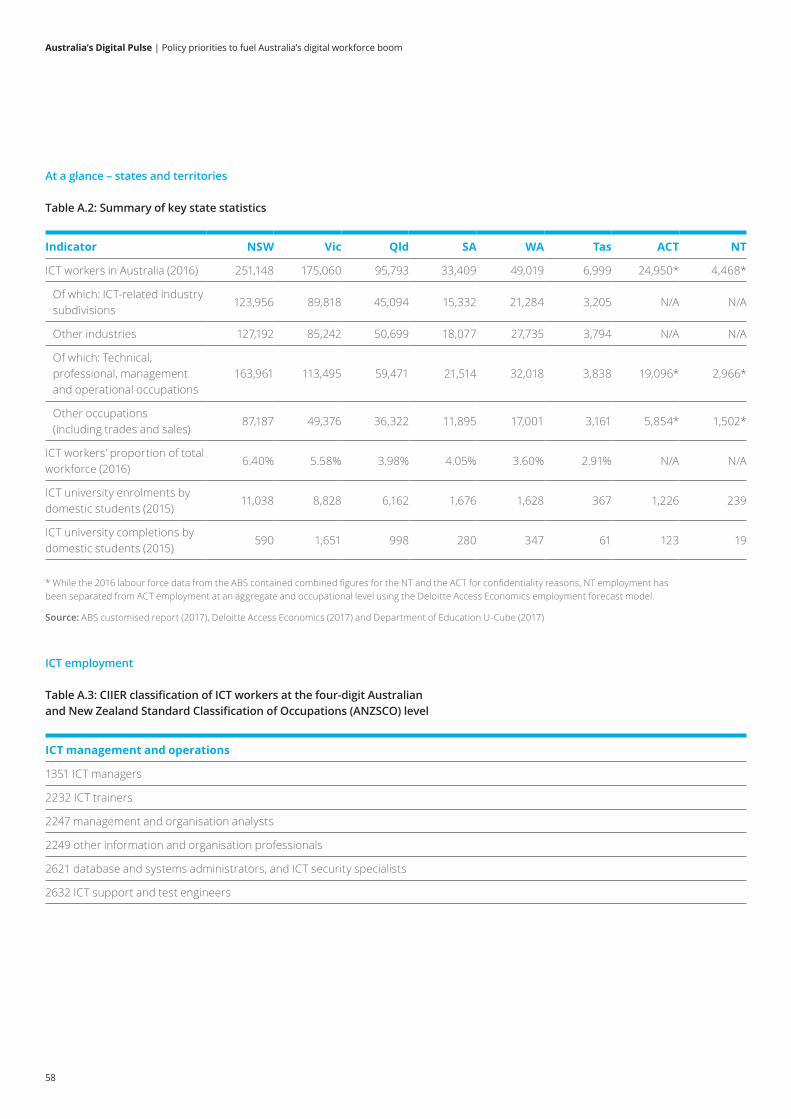
Australia’s Digital Pulse | Policy priorities to fuel Australia’s digital workforce boom
58
At a glance – states and territories
Table A.2: Summary of key state statistics
ICT employment
Table A.3: CIIER classification of ICT workers at the four-digit Australian and New Zealand Standard Classification of Occupations (ANZSCO) level
Indicator NSW Vic Qld SA WA Tas ACT NT
ICT workers in Australia (2016) 251,148 175,060 95,793 33,409 49,019 6,999 24,950* 4,468*
Of which: ICT-related industry subdivisions
123,956 89,818 45,094 15,332 21,284 3,205 N/A N/A
Other industries 127,192 85,242 50,699 18,077 27,735 3,794 N/A N/A
Of which: Technical, professional, management and operational occupations
163,961 113,495 59,471 21,514 32,018 3,838 19,096* 2,966*
Other occupations (including trades and sales)
87,187 49,376 36,322 11,895 17,001 3,161 5,854* 1,502*
ICT workers’ proportion of total workforce (2016)
6.40% 5.58% 3.98% 4.05% 3.60% 2.91% N/A N/A
ICT university enrolments by domestic students (2015)
11,038 8,828 6,162 1,676 1,628 367 1,226 239
ICT university completions by domestic students (2015)
590 1,651 998 280 347 61 123 19
ICT management and operations
1351 ICT managers
2232 ICT trainers
2247 management and organisation analysts
2249 other information and organisation professionals
2621 database and systems administrators, and ICT security specialists
2632 ICT support and test engineers
* While the 2016 labour force data from the ABS contained combined figures for the NT and the ACT for confidentiality reasons, NT employment has been separated from ACT employment at an aggregate and occupational level using the Deloitte Access Economics employment forecast model.
Source: ABS customised report (2017), Deloitte Access Economics (2017) and Department of Education U-Cube (2017)
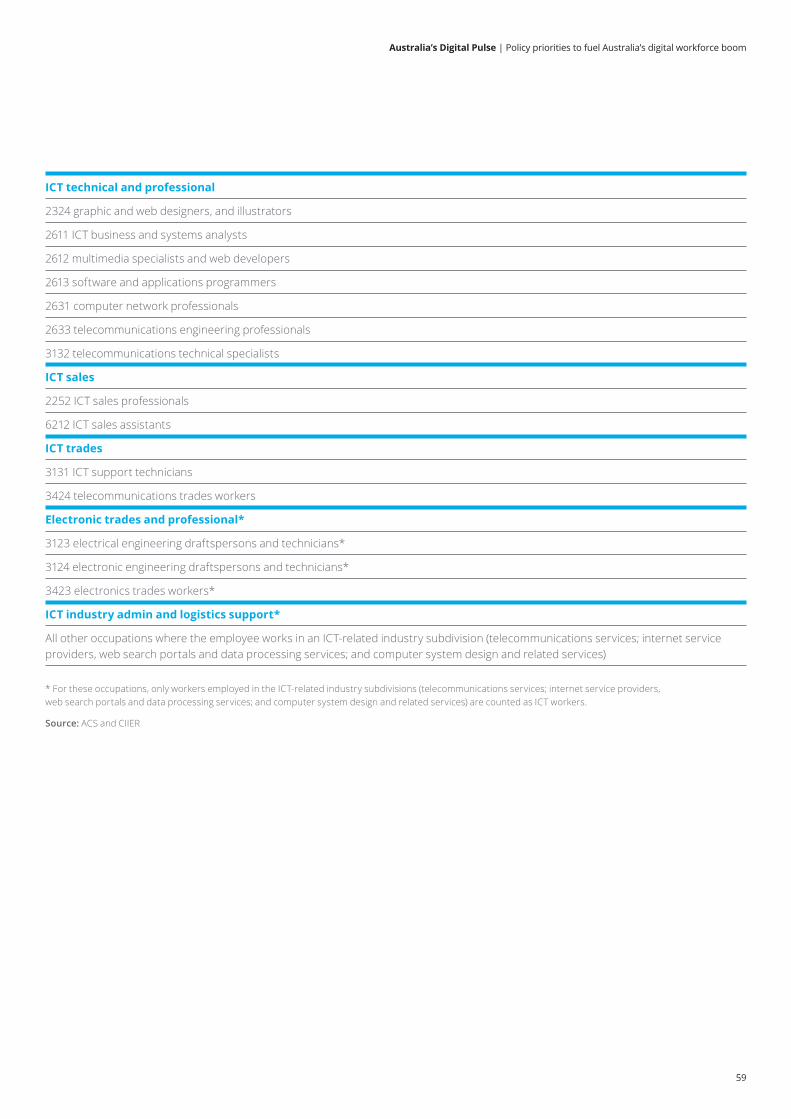
Australia’s Digital Pulse | Policy priorities to fuel Australia’s digital workforce boom
59
ICT technical and professional
2324 graphic and web designers, and illustrators
2611 ICT business and systems analysts
2612 multimedia specialists and web developers
2613 software and applications programmers
2631 computer network professionals
2633 telecommunications engineering professionals
3132 telecommunications technical specialists
ICT sales
2252 ICT sales professionals
6212 ICT sales assistants
ICT trades
3131 ICT support technicians
3424 telecommunications trades workers
Electronic trades and professional*
3123 electrical engineering draftspersons and technicians*
3124 electronic engineering draftspersons and technicians*
3423 electronics trades workers*
ICT industry admin and logistics support*
All other occupations where the employee works in an ICT-related industry subdivision (telecommunications services; internet service providers, web search portals and data processing services; and computer system design and related services)
* For these occupations, only workers employed in the ICT-related industry subdivisions (telecommunications services; internet service providers, web search portals and data processing services; and computer system design and related services) are counted as ICT workers.
Source: ACS and CIIER
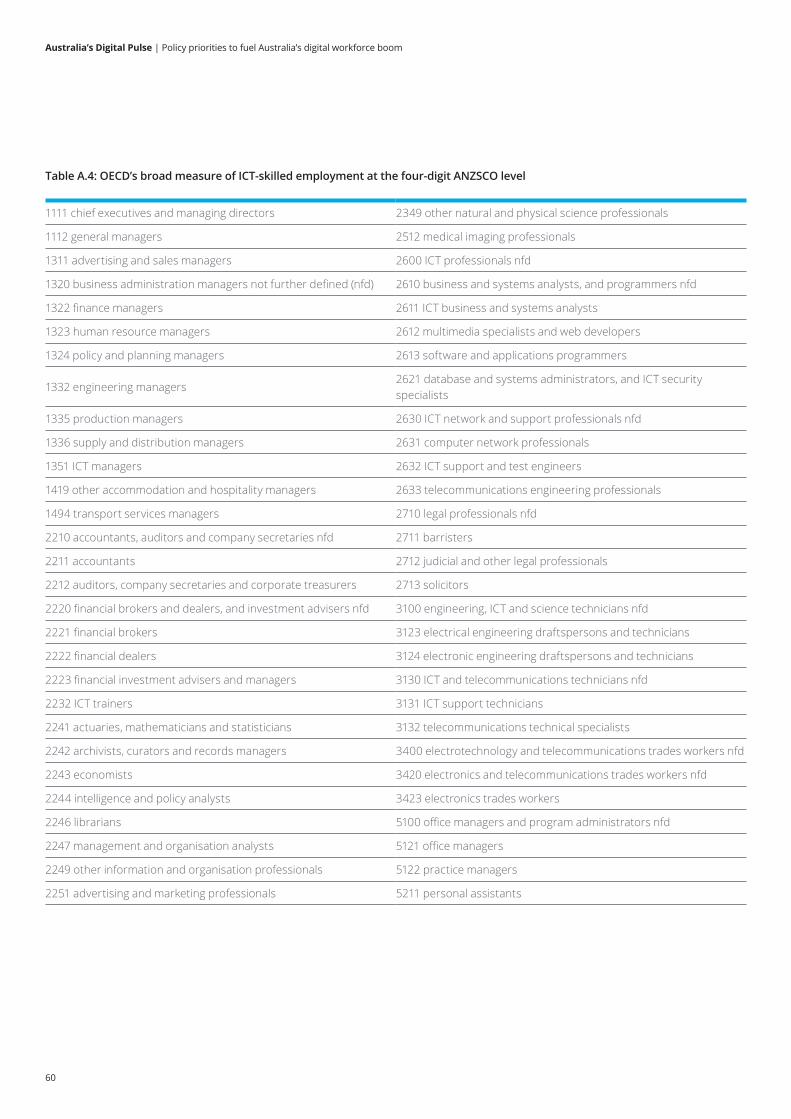
Australia’s Digital Pulse | Policy priorities to fuel Australia’s digital workforce boom
60
Table A.4: OECD’s broad measure of ICT-skilled employment at the four-digit ANZSCO level
1111 chief executives and managing directors 2349 other natural and physical science professionals
1112 general managers 2512 medical imaging professionals
1311 advertising and sales managers 2600 ICT professionals nfd
1320 business administration managers not further defined (nfd) 2610 business and systems analysts, and programmers nfd
1322 finance managers 2611 ICT business and systems analysts
1323 human resource managers 2612 multimedia specialists and web developers
1324 policy and planning managers 2613 software and applications programmers
1332 engineering managers2621 database and systems administrators, and ICT security specialists
1335 production managers 2630 ICT network and support professionals nfd
1336 supply and distribution managers 2631 computer network professionals
1351 ICT managers 2632 ICT support and test engineers
1419 other accommodation and hospitality managers 2633 telecommunications engineering professionals
1494 transport services managers 2710 legal professionals nfd
2210 accountants, auditors and company secretaries nfd 2711 barristers
2211 accountants 2712 judicial and other legal professionals
2212 auditors, company secretaries and corporate treasurers 2713 solicitors
2220 financial brokers and dealers, and investment advisers nfd 3100 engineering, ICT and science technicians nfd
2221 financial brokers 3123 electrical engineering draftspersons and technicians
2222 financial dealers 3124 electronic engineering draftspersons and technicians
2223 financial investment advisers and managers 3130 ICT and telecommunications technicians nfd
2232 ICT trainers 3131 ICT support technicians
2241 actuaries, mathematicians and statisticians 3132 telecommunications technical specialists
2242 archivists, curators and records managers 3400 electrotechnology and telecommunications trades workers nfd
2243 economists 3420 electronics and telecommunications trades workers nfd
2244 intelligence and policy analysts 3423 electronics trades workers
2246 librarians 5100 office managers and program administrators nfd
2247 management and organisation analysts 5121 office managers
2249 other information and organisation professionals 5122 practice managers
2251 advertising and marketing professionals 5211 personal assistants
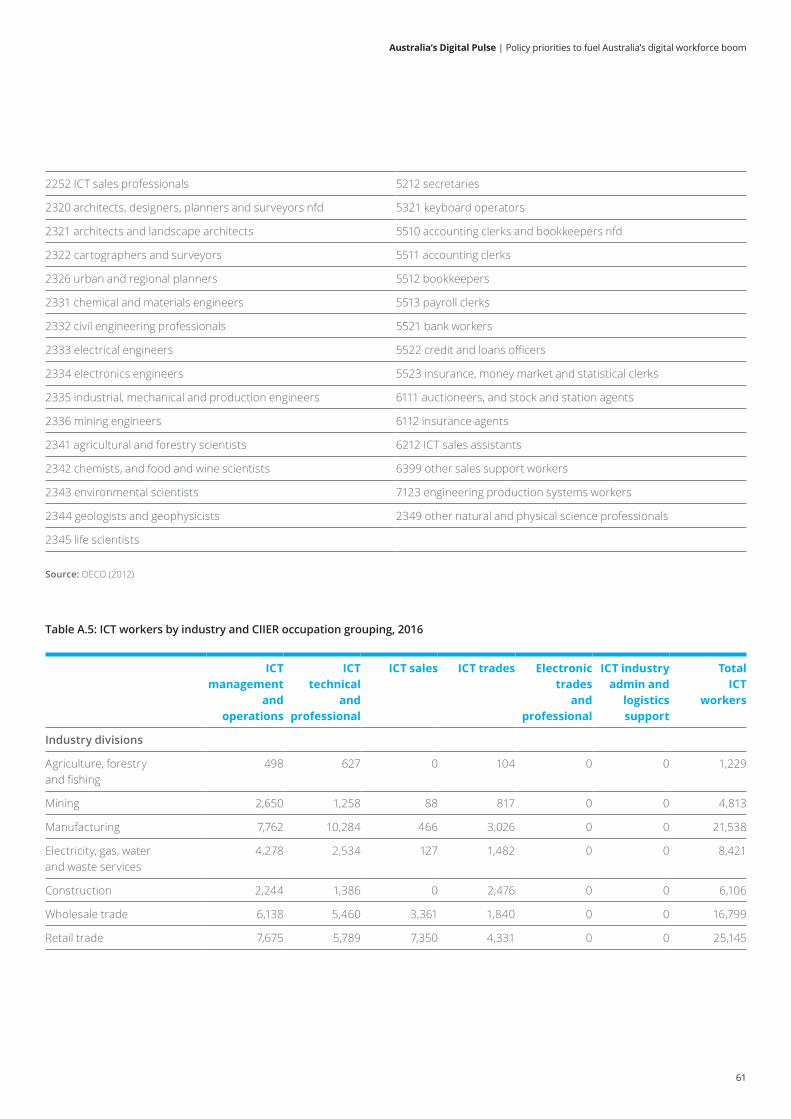
Australia’s Digital Pulse | Policy priorities to fuel Australia’s digital workforce boom
61
2252 ICT sales professionals 5212 secretaries
2320 architects, designers, planners and surveyors nfd 5321 keyboard operators
2321 architects and landscape architects 5510 accounting clerks and bookkeepers nfd
2322 cartographers and surveyors 5511 accounting clerks
2326 urban and regional planners 5512 bookkeepers
2331 chemical and materials engineers 5513 payroll clerks
2332 civil engineering professionals 5521 bank workers
2333 electrical engineers 5522 credit and loans officers
2334 electronics engineers 5523 insurance, money market and statistical clerks
2335 industrial, mechanical and production engineers 6111 auctioneers, and stock and station agents
2336 mining engineers 6112 insurance agents
2341 agricultural and forestry scientists 6212 ICT sales assistants
2342 chemists, and food and wine scientists 6399 other sales support workers
2343 environmental scientists 7123 engineering production systems workers
2344 geologists and geophysicists 2349 other natural and physical science professionals
2345 life scientists
Table A.5: ICT workers by industry and CIIER occupation grouping, 2016
ICT management
and operations
ICT technical
and professional
ICT sales ICT trades Electronic trades
and professional
ICT industry admin and
logistics support
Total ICT
workers
Industry divisions
Agriculture, forestry and fishing
498 627 0 104 0 0 1,229
Mining 2,650 1,258 88 817 0 0 4,813
Manufacturing 7,762 10,284 466 3,026 0 0 21,538
Electricity, gas, water and waste services
4,278 2,534 127 1,482 0 0 8,421
Construction 2,244 1,386 0 2,476 0 0 6,106
Wholesale trade 6,138 5,460 3,361 1,840 0 0 16,799
Retail trade 7,675 5,789 7,350 4,331 0 0 25,145
Source: OECD (2012)
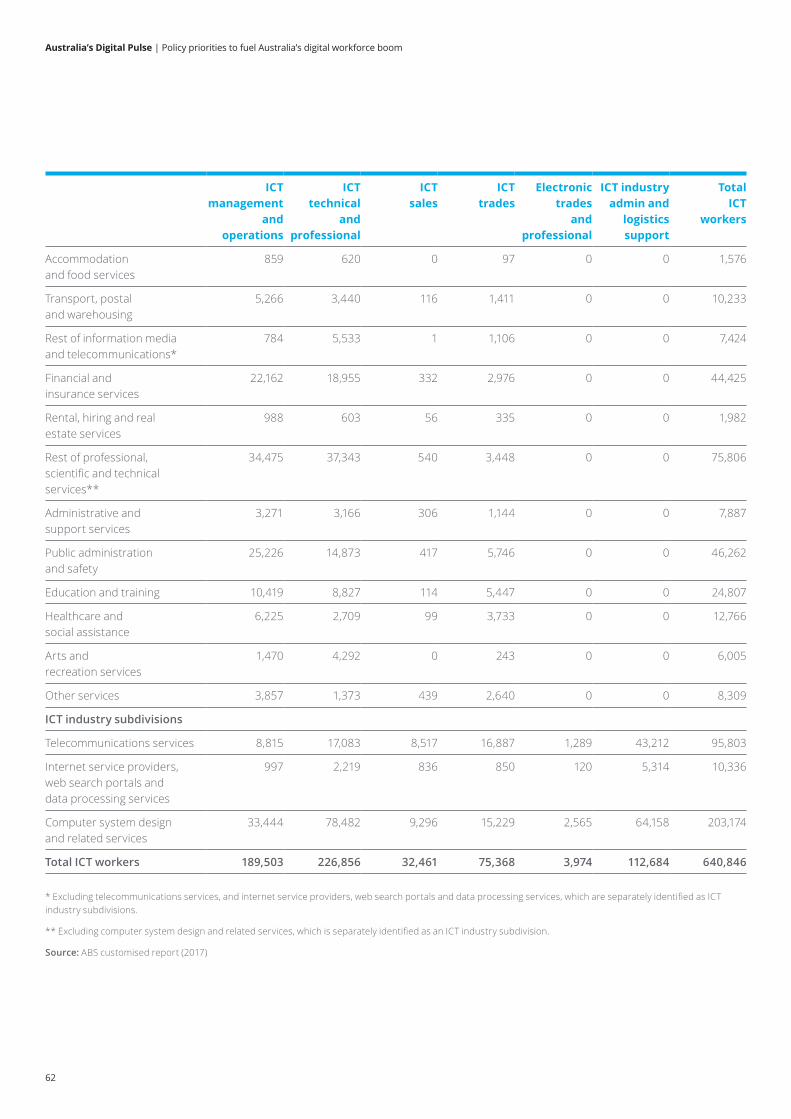
Australia’s Digital Pulse | Policy priorities to fuel Australia’s digital workforce boom
62
ICT management
and operations
ICT technical
and professional
ICT sales
ICT trades
Electronic trades
and professional
ICT industry admin and
logistics support
Total ICT
workers
Accommodation and food services
859 620 0 97 0 0 1,576
Transport, postal and warehousing
5,266 3,440 116 1,411 0 0 10,233
Rest of information media and telecommunications*
784 5,533 1 1,106 0 0 7,424
Financial and insurance services
22,162 18,955 332 2,976 0 0 44,425
Rental, hiring and real estate services
988 603 56 335 0 0 1,982
Rest of professional, scientific and technical services**
34,475 37,343 540 3,448 0 0 75,806
Administrative and support services
3,271 3,166 306 1,144 0 0 7,887
Public administration and safety
25,226 14,873 417 5,746 0 0 46,262
Education and training 10,419 8,827 114 5,447 0 0 24,807
Healthcare and social assistance
6,225 2,709 99 3,733 0 0 12,766
Arts and recreation services
1,470 4,292 0 243 0 0 6,005
Other services 3,857 1,373 439 2,640 0 0 8,309
ICT industry subdivisions
Telecommunications services 8,815 17,083 8,517 16,887 1,289 43,212 95,803
Internet service providers, web search portals and data processing services
997 2,219 836 850 120 5,314 10,336
Computer system design and related services
33,444 78,482 9,296 15,229 2,565 64,158 203,174
Total ICT workers 189,503 226,856 32,461 75,368 3,974 112,684 640,846
* Excluding telecommunications services, and internet service providers, web search portals and data processing services, which are separately identified as ICT industry subdivisions.
** Excluding computer system design and related services, which is separately identified as an ICT industry subdivision.
Source: ABS customised report (2017)
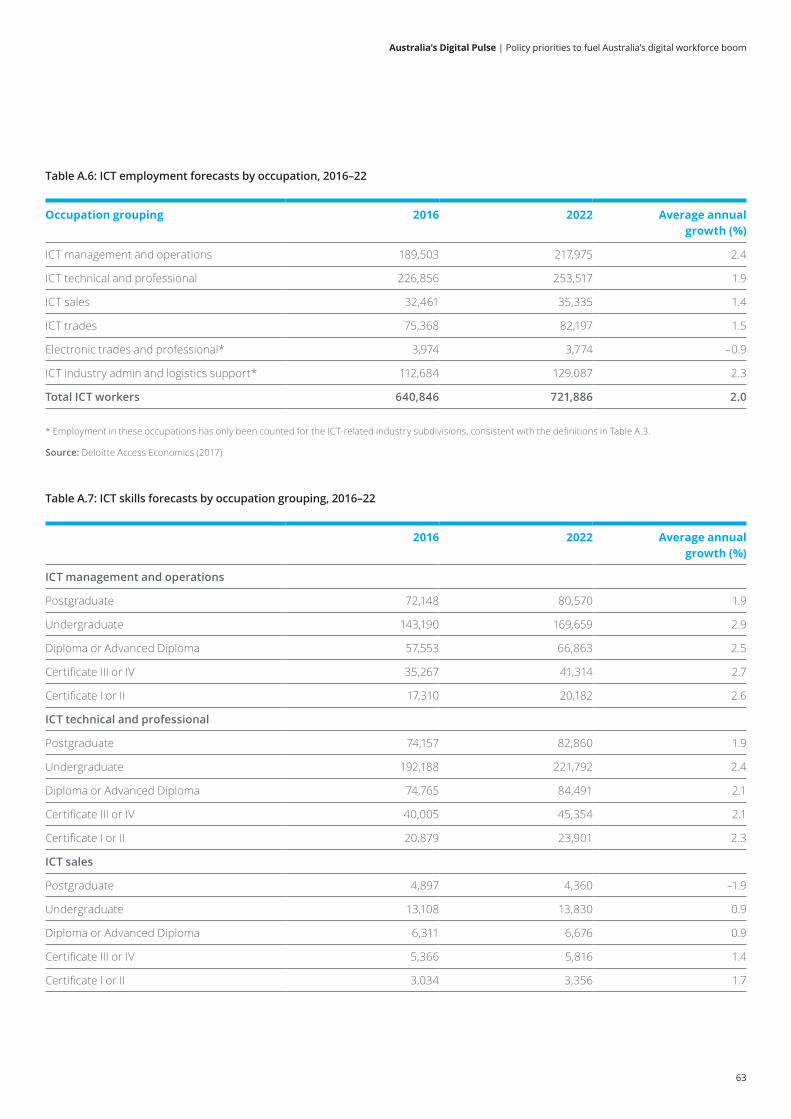
Australia’s Digital Pulse | Policy priorities to fuel Australia’s digital workforce boom
63
Table A.6: ICT employment forecasts by occupation, 2016–22
Table A.7: ICT skills forecasts by occupation grouping, 2016–22
Occupation grouping 2016 2022 Average annual growth (%)
ICT management and operations 189,503 217,975 2.4
ICT technical and professional 226,856 253,517 1.9
ICT sales 32,461 35,335 1.4
ICT trades 75,368 82,197 1.5
Electronic trades and professional* 3,974 3,774 –0.9
ICT industry admin and logistics support* 112,684 129,087 2.3
Total ICT workers 640,846 721,886 2.0
2016 2022 Average annual growth (%)
ICT management and operations
Postgraduate 72,148 80,570 1.9
Undergraduate 143,190 169,659 2.9
Diploma or Advanced Diploma 57,553 66,863 2.5
Certificate III or IV 35,267 41,314 2.7
Certificate I or II 17,310 20,182 2.6
ICT technical and professional
Postgraduate 74,157 82,860 1.9
Undergraduate 192,188 221,792 2.4
Diploma or Advanced Diploma 74,765 84,491 2.1
Certificate III or IV 40,005 45,354 2.1
Certificate I or II 20,879 23,901 2.3
ICT sales
Postgraduate 4,897 4,360 –1.9
Undergraduate 13,108 13,830 0.9
Diploma or Advanced Diploma 6,311 6,676 0.9
Certificate III or IV 5,366 5,816 1.4
Certificate I or II 3,034 3,356 1.7
* Employment in these occupations has only been counted for the ICT-related industry subdivisions, consistent with the definitions in Table A.3.
Source: Deloitte Access Economics (2017)
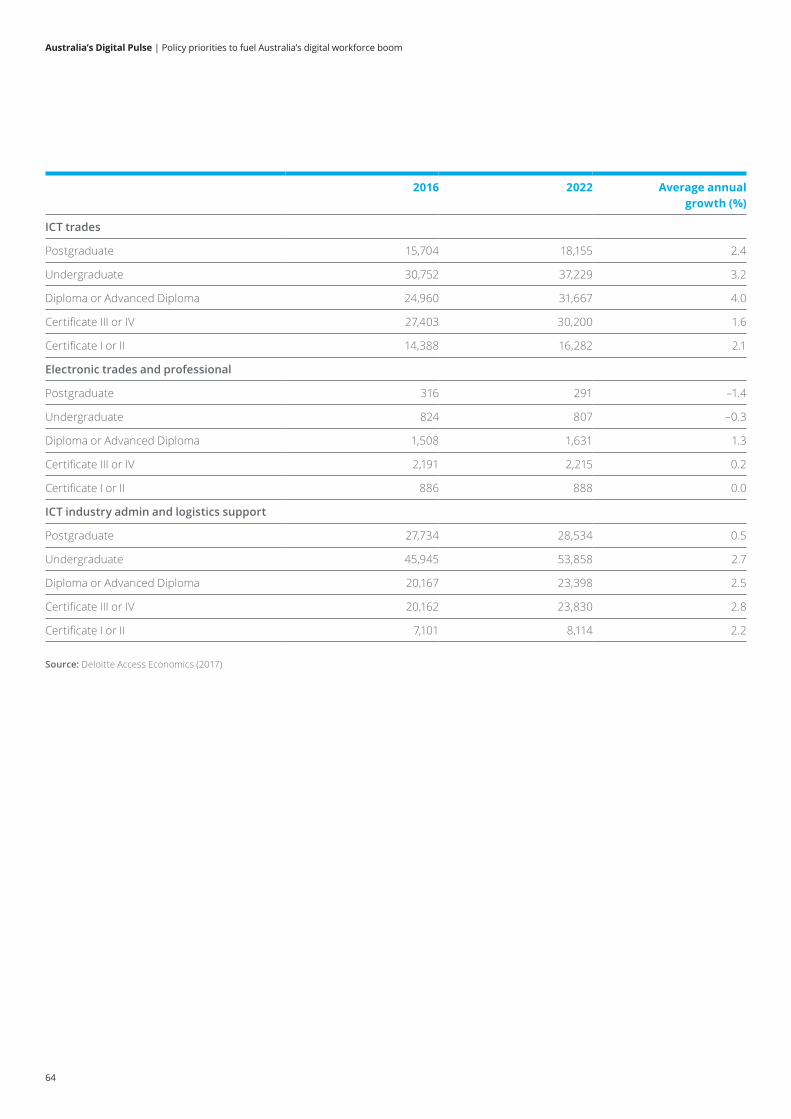
Australia’s Digital Pulse | Policy priorities to fuel Australia’s digital workforce boom
64
2016 2022 Average annual growth (%)
ICT trades
Postgraduate 15,704 18,155 2.4
Undergraduate 30,752 37,229 3.2
Diploma or Advanced Diploma 24,960 31,667 4.0
Certificate III or IV 27,403 30,200 1.6
Certificate I or II 14,388 16,282 2.1
Electronic trades and professional
Postgraduate 316 291 –1.4
Undergraduate 824 807 –0.3
Diploma or Advanced Diploma 1,508 1,631 1.3
Certificate III or IV 2,191 2,215 0.2
Certificate I or II 886 888 0.0
ICT industry admin and logistics support
Postgraduate 27,734 28,534 0.5
Undergraduate 45,945 53,858 2.7
Diploma or Advanced Diploma 20,167 23,398 2.5
Certificate III or IV 20,162 23,830 2.8
Certificate I or II 7,101 8,114 2.2
Source: Deloitte Access Economics (2017)
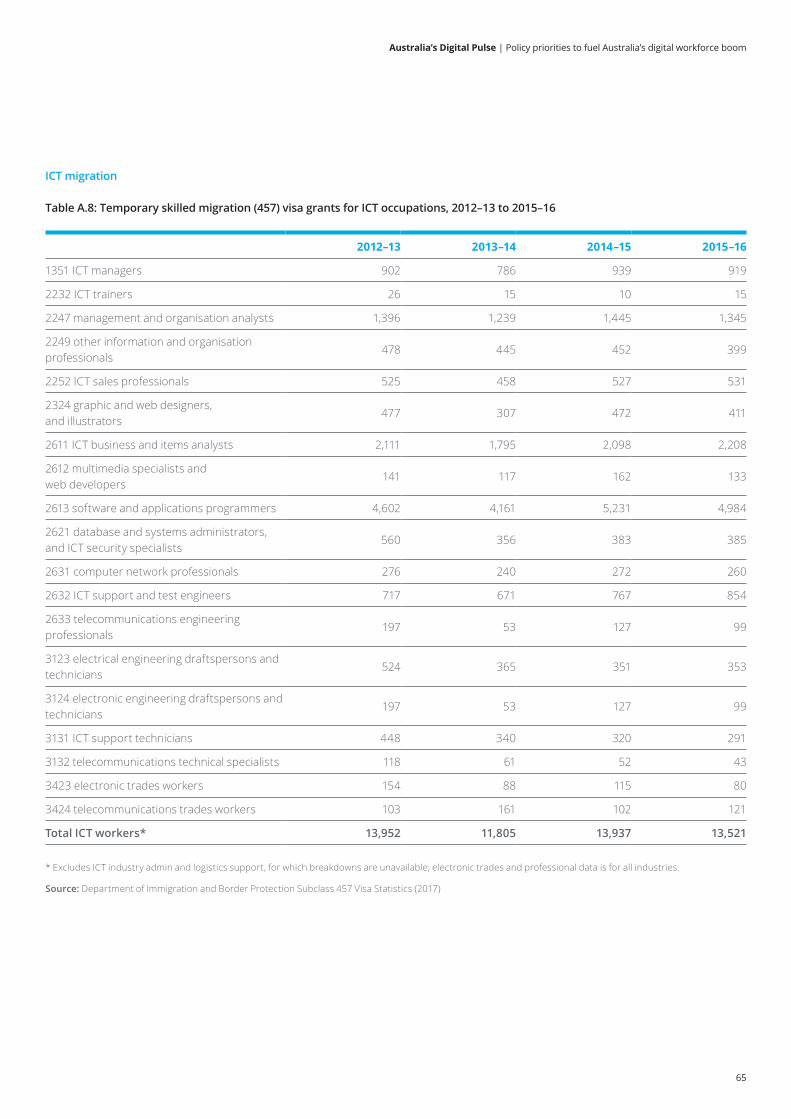
Australia’s Digital Pulse | Policy priorities to fuel Australia’s digital workforce boom
65
ICT migration
Table A.8: Temporary skilled migration (457) visa grants for ICT occupations, 2012–13 to 2015–16
2012–13 2013–14 2014–15 2015–16
1351 ICT managers 902 786 939 919
2232 ICT trainers 26 15 10 15
2247 management and organisation analysts 1,396 1,239 1,445 1,345
2249 other information and organisation professionals
478 445 452 399
2252 ICT sales professionals 525 458 527 531
2324 graphic and web designers, and illustrators
477 307 472 411
2611 ICT business and items analysts 2,111 1,795 2,098 2,208
2612 multimedia specialists and web developers
141 117 162 133
2613 software and applications programmers 4,602 4,161 5,231 4,984
2621 database and systems administrators, and ICT security specialists
560 356 383 385
2631 computer network professionals 276 240 272 260
2632 ICT support and test engineers 717 671 767 854
2633 telecommunications engineering professionals
197 53 127 99
3123 electrical engineering draftspersons and technicians
524 365 351 353
3124 electronic engineering draftspersons and technicians
197 53 127 99
3131 ICT support technicians 448 340 320 291
3132 telecommunications technical specialists 118 61 52 43
3423 electronic trades workers 154 88 115 80
3424 telecommunications trades workers 103 161 102 121
Total ICT workers* 13,952 11,805 13,937 13,521
* Excludes ICT industry admin and logistics support, for which breakdowns are unavailable; electronic trades and professional data is for all industries.
Source: Department of Immigration and Border Protection Subclass 457 Visa Statistics (2017)
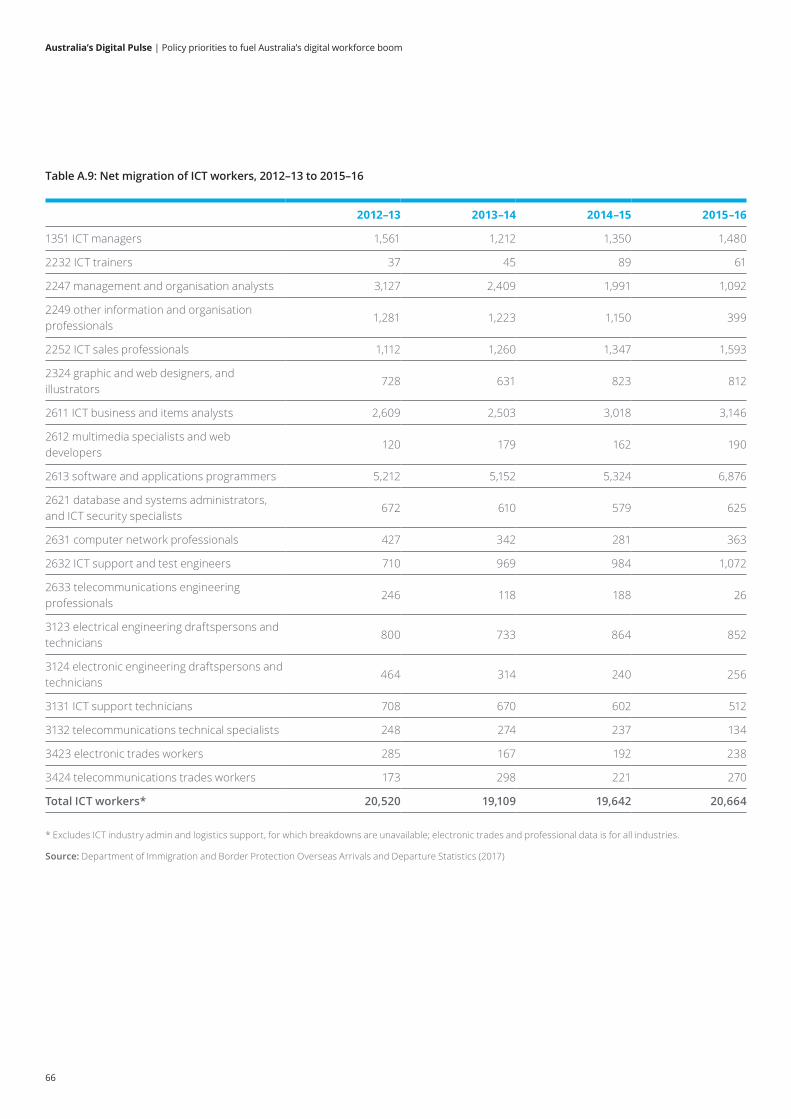
Australia’s Digital Pulse | Policy priorities to fuel Australia’s digital workforce boom
66
Table A.9: Net migration of ICT workers, 2012–13 to 2015–16
2012–13 2013–14 2014–15 2015–16
1351 ICT managers 1,561 1,212 1,350 1,480
2232 ICT trainers 37 45 89 61
2247 management and organisation analysts 3,127 2,409 1,991 1,092
2249 other information and organisation professionals
1,281 1,223 1,150 399
2252 ICT sales professionals 1,112 1,260 1,347 1,593
2324 graphic and web designers, and illustrators
728 631 823 812
2611 ICT business and items analysts 2,609 2,503 3,018 3,146
2612 multimedia specialists and web developers
120 179 162 190
2613 software and applications programmers 5,212 5,152 5,324 6,876
2621 database and systems administrators, and ICT security specialists
672 610 579 625
2631 computer network professionals 427 342 281 363
2632 ICT support and test engineers 710 969 984 1,072
2633 telecommunications engineering professionals
246 118 188 26
3123 electrical engineering draftspersons and technicians
800 733 864 852
3124 electronic engineering draftspersons and technicians
464 314 240 256
3131 ICT support technicians 708 670 602 512
3132 telecommunications technical specialists 248 274 237 134
3423 electronic trades workers 285 167 192 238
3424 telecommunications trades workers 173 298 221 270
Total ICT workers* 20,520 19,109 19,642 20,664
* Excludes ICT industry admin and logistics support, for which breakdowns are unavailable; electronic trades and professional data is for all industries.
Source: Department of Immigration and Border Protection Overseas Arrivals and Departure Statistics (2017)
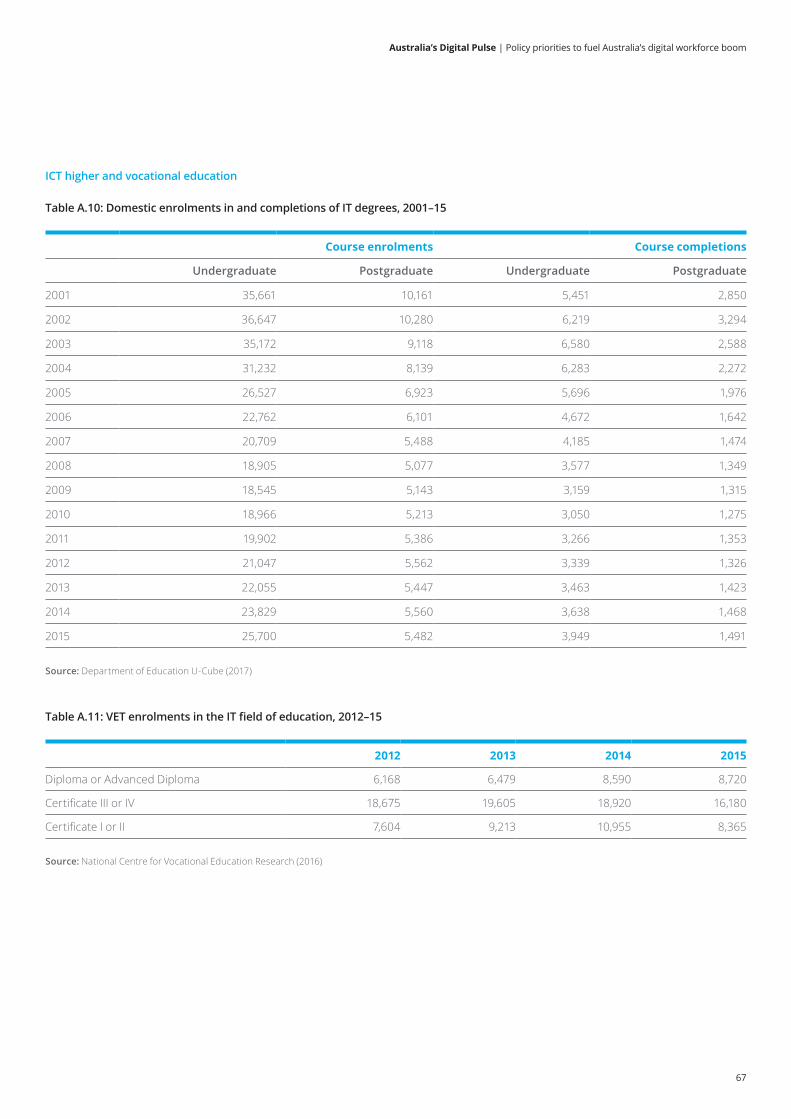
Australia’s Digital Pulse | Policy priorities to fuel Australia’s digital workforce boom
67
ICT higher and vocational education
Table A.10: Domestic enrolments in and completions of IT degrees, 2001–15
Table A.11: VET enrolments in the IT field of education, 2012–15
Course enrolments Course completions
Undergraduate Postgraduate Undergraduate Postgraduate
2001 35,661 10,161 5,451 2,850
2002 36,647 10,280 6,219 3,294
2003 35,172 9,118 6,580 2,588
2004 31,232 8,139 6,283 2,272
2005 26,527 6,923 5,696 1,976
2006 22,762 6,101 4,672 1,642
2007 20,709 5,488 4,185 1,474
2008 18,905 5,077 3,577 1,349
2009 18,545 5,143 3,159 1,315
2010 18,966 5,213 3,050 1,275
2011 19,902 5,386 3,266 1,353
2012 21,047 5,562 3,339 1,326
2013 22,055 5,447 3,463 1,423
2014 23,829 5,560 3,638 1,468
2015 25,700 5,482 3,949 1,491
Source: Department of Education U-Cube (2017)
Source: National Centre for Vocational Education Research (2016)
2012 2013 2014 2015
Diploma or Advanced Diploma 6,168 6,479 8,590 8,720
Certificate III or IV 18,675 19,605 18,920 16,180
Certificate I or II 7,604 9,213 10,955 8,365
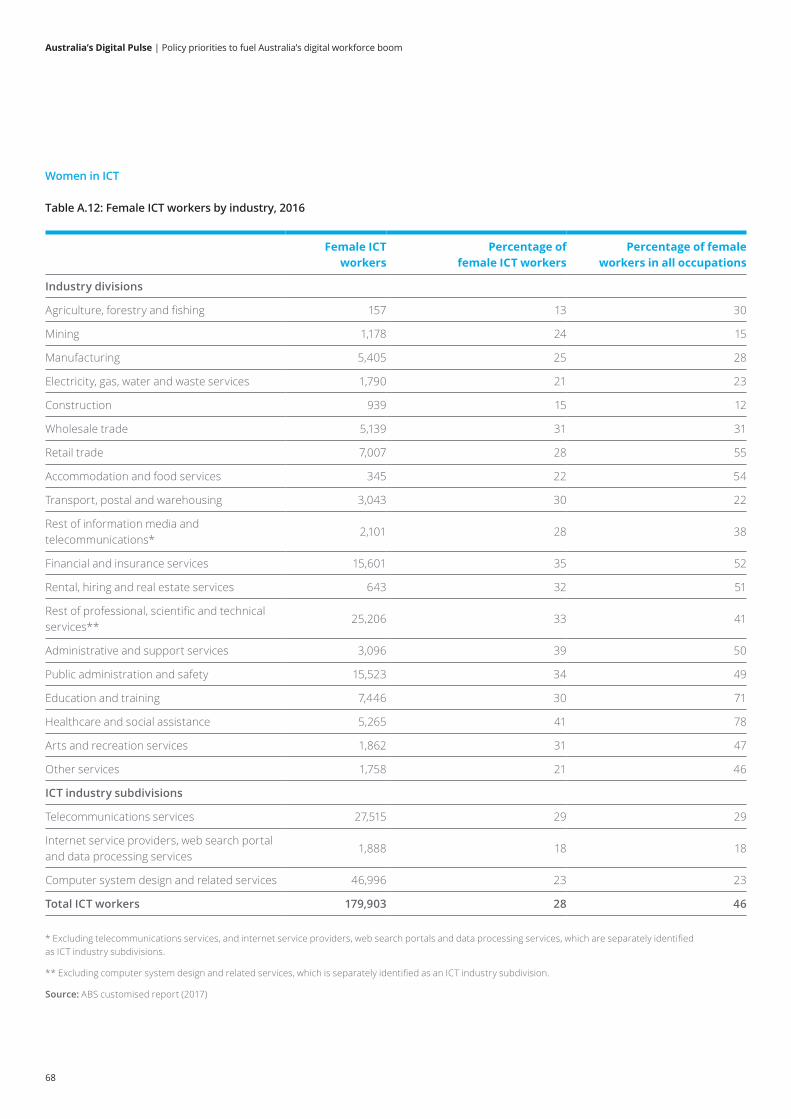
Australia’s Digital Pulse | Policy priorities to fuel Australia’s digital workforce boom
68
Women in ICT
Table A.12: Female ICT workers by industry, 2016
Female ICT workers
Percentage of female ICT workers
Percentage of female workers in all occupations
Industry divisions
Agriculture, forestry and fishing 157 13 30
Mining 1,178 24 15
Manufacturing 5,405 25 28
Electricity, gas, water and waste services 1,790 21 23
Construction 939 15 12
Wholesale trade 5,139 31 31
Retail trade 7,007 28 55
Accommodation and food services 345 22 54
Transport, postal and warehousing 3,043 30 22
Rest of information media and telecommunications*
2,101 28 38
Financial and insurance services 15,601 35 52
Rental, hiring and real estate services 643 32 51
Rest of professional, scientific and technical services**
25,206 33 41
Administrative and support services 3,096 39 50
Public administration and safety 15,523 34 49
Education and training 7,446 30 71
Healthcare and social assistance 5,265 41 78
Arts and recreation services 1,862 31 47
Other services 1,758 21 46
ICT industry subdivisions
Telecommunications services 27,515 29 29
Internet service providers, web search portal and data processing services
1,888 18 18
Computer system design and related services 46,996 23 23
Total ICT workers 179,903 28 46
* Excluding telecommunications services, and internet service providers, web search portals and data processing services, which are separately identified as ICT industry subdivisions.
** Excluding computer system design and related services, which is separately identified as an ICT industry subdivision.
Source: ABS customised report (2017)
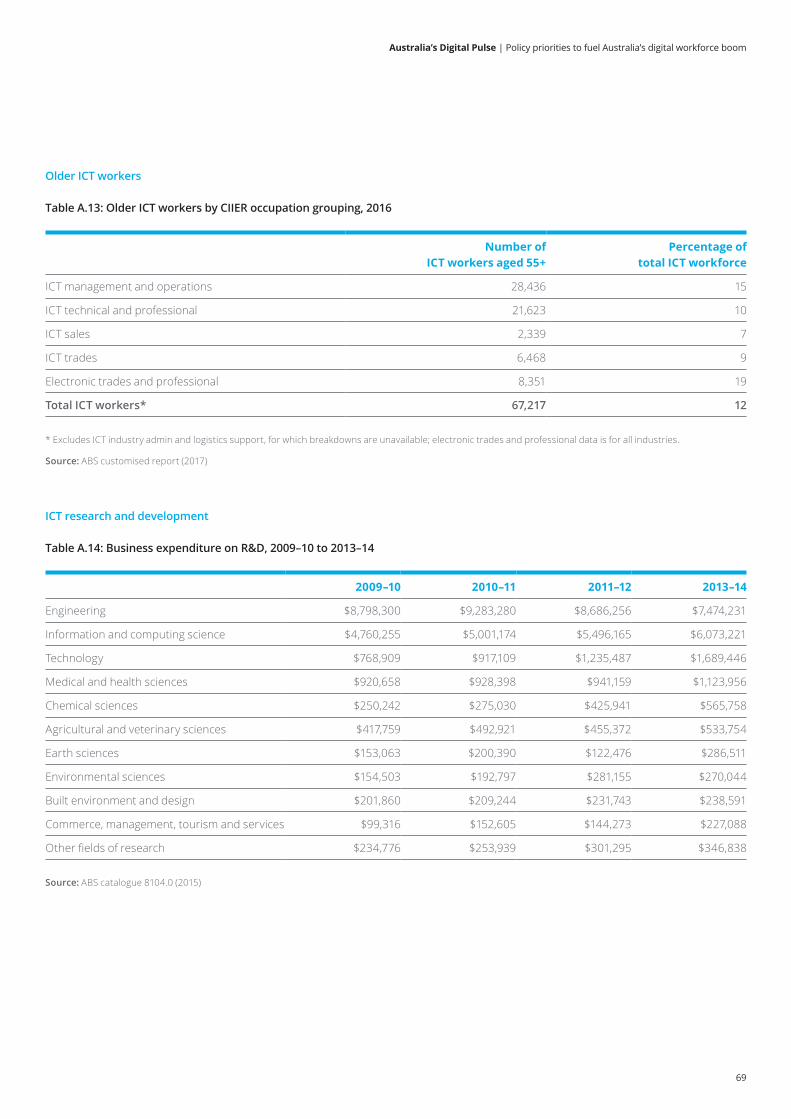
Australia’s Digital Pulse | Policy priorities to fuel Australia’s digital workforce boom
69
Older ICT workers
Table A.13: Older ICT workers by CIIER occupation grouping, 2016
Number of ICT workers aged 55+
Percentage of total ICT workforce
ICT management and operations 28,436 15
ICT technical and professional 21,623 10
ICT sales 2,339 7
ICT trades 6,468 9
Electronic trades and professional 8,351 19
Total ICT workers* 67,217 12
* Excludes ICT industry admin and logistics support, for which breakdowns are unavailable; electronic trades and professional data is for all industries.
Source: ABS customised report (2017)
ICT research and development
Table A.14: Business expenditure on R&D, 2009–10 to 2013–14
2009–10 2010–11 2011–12 2013–14
Engineering $8,798,300 $9,283,280 $8,686,256 $7,474,231
Information and computing science $4,760,255 $5,001,174 $5,496,165 $6,073,221
Technology $768,909 $917,109 $1,235,487 $1,689,446
Medical and health sciences $920,658 $928,398 $941,159 $1,123,956
Chemical sciences $250,242 $275,030 $425,941 $565,758
Agricultural and veterinary sciences $417,759 $492,921 $455,372 $533,754
Earth sciences $153,063 $200,390 $122,476 $286,511
Environmental sciences $154,503 $192,797 $281,155 $270,044
Built environment and design $201,860 $209,244 $231,743 $238,591
Commerce, management, tourism and services $99,316 $152,605 $144,273 $227,088
Other fields of research $234,776 $253,939 $301,295 $346,838
Source: ABS catalogue 8104.0 (2015)

Australia’s Digital Pulse | Policy priorities to fuel Australia’s digital workforce boom
70
Trade in ICT services
Table A.16: Exports and imports of ICT services, 2011–12 to 2015–16 ($bn)
Table A.15: Government expenditure on ICT R&D, 2008–09 to 2014–15
2011–12 2012–13 2013–14 2014–15 2015–16
Exports 1.51 1.68 1.96 2.48 2.80
Imports 1.66 1.84 2.50 2.59 2.91
2008–09 2011–12 2012–13 2014–15
Commonwealth ICT R&D expenditure $260,948,000 $314,437,000 $240,828,000 $247,462,000
Commonwealth ICT share of R&D expenditure 12% 13% 10% 11%
State and territory ICT R&D expenditure $29,570,000 $8,596,000 $12,778,000 $20,882,000
State and territory ICT share of R&D expenditure
3% 1% 1% 2%
Source: ABS catalogue 8104.0 (2015)
Source: ABS catalogue 8109.0 (2017)

Australia’s Digital Pulse | Policy priorities to fuel Australia’s digital workforce boom
71
Detailed state figures
Table A.17: State breakdown of ICT workers by industry, 2016
NSW Vic Qld SA WA Tas ACT* NT*
Industry divisions
Agriculture, forestry and fishing
255 450 418 0 0 90 N/A N/A
Mining 206 266 1,210 54 2,959 0 N/A N/A
Manufacturing 9,279 5,842 3,142 1,978 1,037 141 N/A N/A
Electricity, gas, water and waste services
2,637 2,998 656 507 1,162 397 N/A N/A
Construction 2,014 1,995 785 302 786 107 N/A N/A
Wholesale trade 7,012 5,068 1,636 770 1,542 135 N/A N/A
Retail trade 11,050 7,888 3,559 1,184 1,059 124 N/A N/A
Accommodation and food services
695 322 462 0 97 0 N/A N/A
Transport, postal and warehousing
4,504 2,481 2,235 170 565 61 N/A N/A
Rest of information media and telecommunications**
3,958 1,734 929 529 0 78 N/A N/A
Financial and insurance services
25,202 11,789 4,429 994 1,311 147 N/A N/A
Rental, hiring and real estate services
1,096 242 425 182 0 37 N/A N/A
Rest of professional, scientific and technical services***
27,174 23,573 11,586 3,501 6,174 468 N/A N/A
Administrative and support services
3,859 1,485 1,242 504 420 28 N/A N/A
Public administration and safety
10,951 6,645 7,862 4,033 4,458 885 N/A N/A
Education and training 8,239 5,709 4,600 1,932 2,959 500 N/A N/A
Healthcare and social assistance
3,824 3,513 2,549 671 1,872 230 N/A N/A
Arts and recreation services 2,233 1,662 1,337 169 367 157 N/A N/A
Other services 3,004 1,580 1,637 597 967 209 N/A N/A
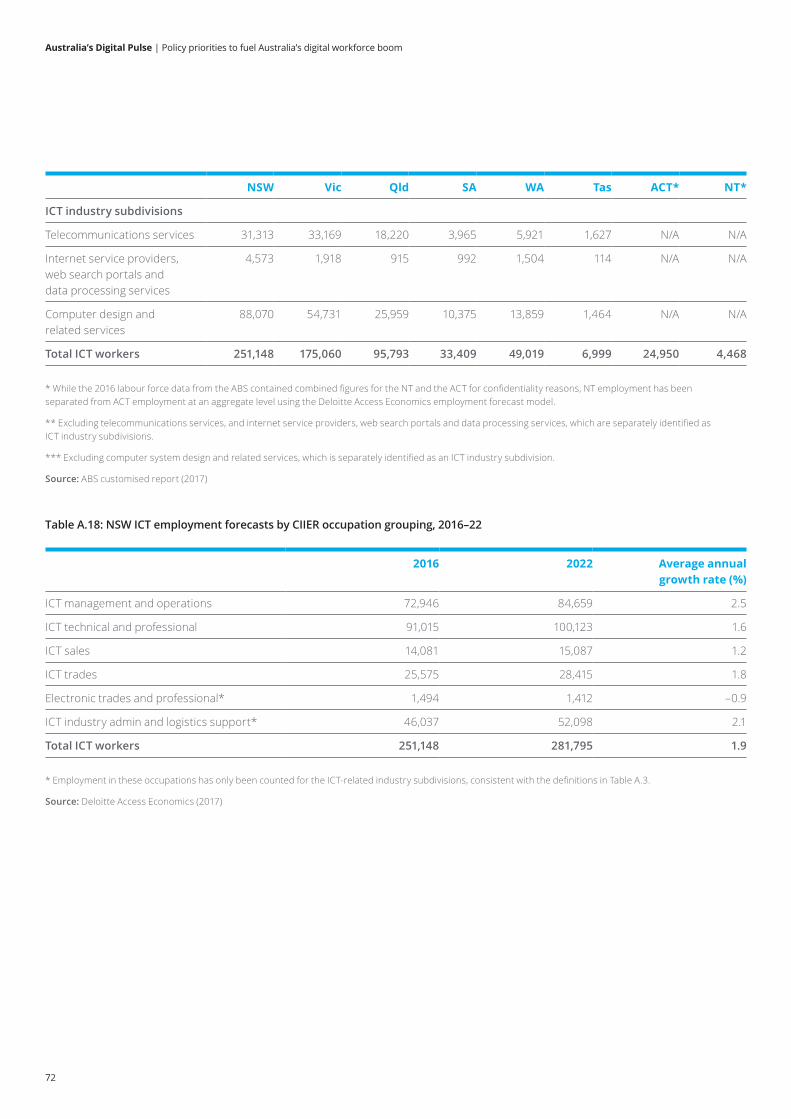
Australia’s Digital Pulse | Policy priorities to fuel Australia’s digital workforce boom
72
NSW Vic Qld SA WA Tas ACT* NT*
ICT industry subdivisions
Telecommunications services 31,313 33,169 18,220 3,965 5,921 1,627 N/A N/A
Internet service providers, web search portals and data processing services
4,573 1,918 915 992 1,504 114 N/A N/A
Computer design and related services
88,070 54,731 25,959 10,375 13,859 1,464 N/A N/A
Total ICT workers 251,148 175,060 95,793 33,409 49,019 6,999 24,950 4,468
* While the 2016 labour force data from the ABS contained combined figures for the NT and the ACT for confidentiality reasons, NT employment has been separated from ACT employment at an aggregate level using the Deloitte Access Economics employment forecast model.
** Excluding telecommunications services, and internet service providers, web search portals and data processing services, which are separately identified as ICT industry subdivisions.
*** Excluding computer system design and related services, which is separately identified as an ICT industry subdivision.
Source: ABS customised report (2017)
* Employment in these occupations has only been counted for the ICT-related industry subdivisions, consistent with the definitions in Table A.3.
Source: Deloitte Access Economics (2017)
Table A.18: NSW ICT employment forecasts by CIIER occupation grouping, 2016–22
2016 2022 Average annual growth rate (%)
ICT management and operations 72,946 84,659 2.5
ICT technical and professional 91,015 100,123 1.6
ICT sales 14,081 15,087 1.2
ICT trades 25,575 28,415 1.8
Electronic trades and professional* 1,494 1,412 –0.9
ICT industry admin and logistics support* 46,037 52,098 2.1
Total ICT workers 251,148 281,795 1.9
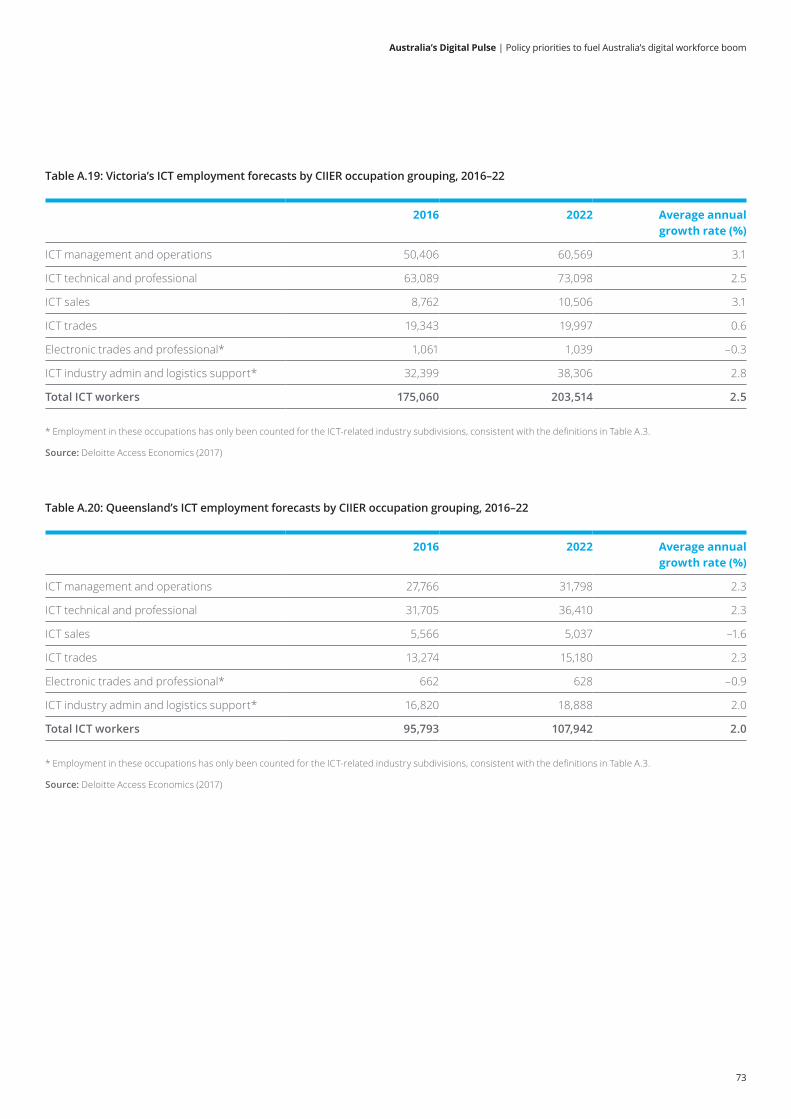
Australia’s Digital Pulse | Policy priorities to fuel Australia’s digital workforce boom
73
* Employment in these occupations has only been counted for the ICT-related industry subdivisions, consistent with the definitions in Table A.3.
Source: Deloitte Access Economics (2017)
* Employment in these occupations has only been counted for the ICT-related industry subdivisions, consistent with the definitions in Table A.3.
Source: Deloitte Access Economics (2017)
Table A.19: Victoria’s ICT employment forecasts by CIIER occupation grouping, 2016–22
Table A.20: Queensland’s ICT employment forecasts by CIIER occupation grouping, 2016–22
2016 2022 Average annual growth rate (%)
ICT management and operations 50,406 60,569 3.1
ICT technical and professional 63,089 73,098 2.5
ICT sales 8,762 10,506 3.1
ICT trades 19,343 19,997 0.6
Electronic trades and professional* 1,061 1,039 –0.3
ICT industry admin and logistics support* 32,399 38,306 2.8
Total ICT workers 175,060 203,514 2.5
2016 2022 Average annual growth rate (%)
ICT management and operations 27,766 31,798 2.3
ICT technical and professional 31,705 36,410 2.3
ICT sales 5,566 5,037 –1.6
ICT trades 13,274 15,180 2.3
Electronic trades and professional* 662 628 –0.9
ICT industry admin and logistics support* 16,820 18,888 2.0
Total ICT workers 95,793 107,942 2.0
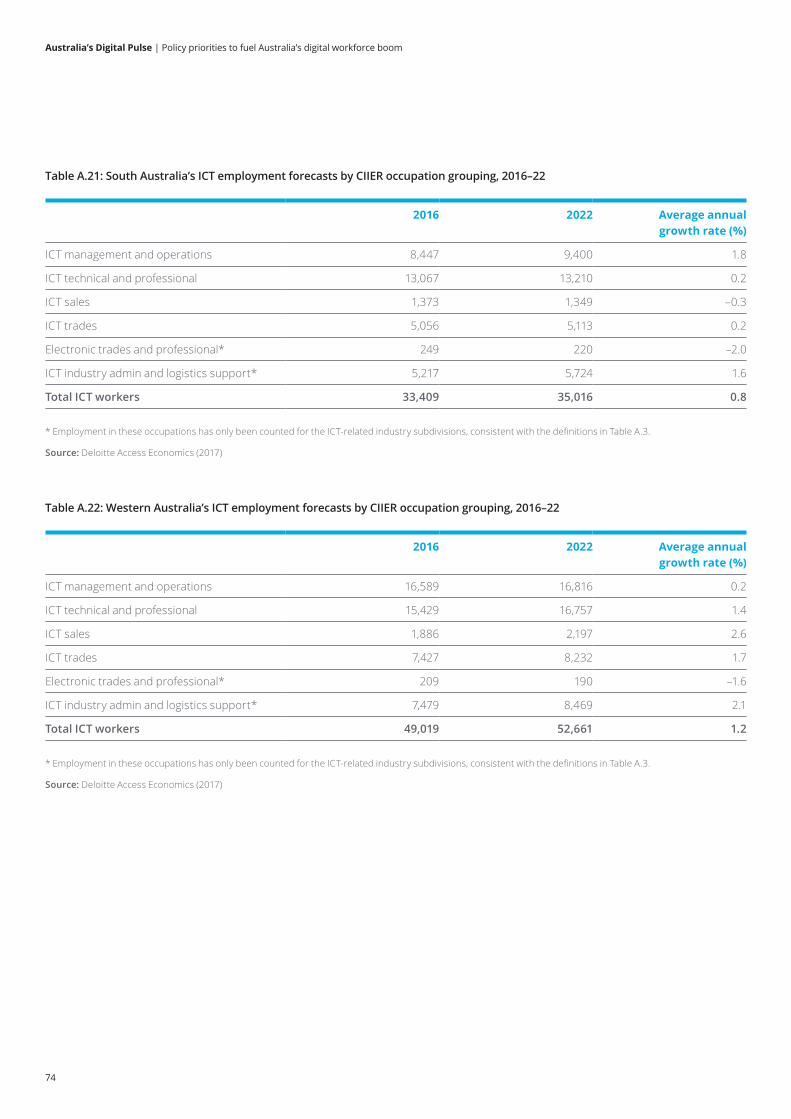
Australia’s Digital Pulse | Policy priorities to fuel Australia’s digital workforce boom
74
* Employment in these occupations has only been counted for the ICT-related industry subdivisions, consistent with the definitions in Table A.3.
Source: Deloitte Access Economics (2017)
* Employment in these occupations has only been counted for the ICT-related industry subdivisions, consistent with the definitions in Table A.3.
Source: Deloitte Access Economics (2017)
Table A.21: South Australia’s ICT employment forecasts by CIIER occupation grouping, 2016–22
Table A.22: Western Australia’s ICT employment forecasts by CIIER occupation grouping, 2016–22
2016 2022 Average annual growth rate (%)
ICT management and operations 8,447 9,400 1.8
ICT technical and professional 13,067 13,210 0.2
ICT sales 1,373 1,349 –0.3
ICT trades 5,056 5,113 0.2
Electronic trades and professional* 249 220 –2.0
ICT industry admin and logistics support* 5,217 5,724 1.6
Total ICT workers 33,409 35,016 0.8
2016 2022 Average annual growth rate (%)
ICT management and operations 16,589 16,816 0.2
ICT technical and professional 15,429 16,757 1.4
ICT sales 1,886 2,197 2.6
ICT trades 7,427 8,232 1.7
Electronic trades and professional* 209 190 –1.6
ICT industry admin and logistics support* 7,479 8,469 2.1
Total ICT workers 49,019 52,661 1.2
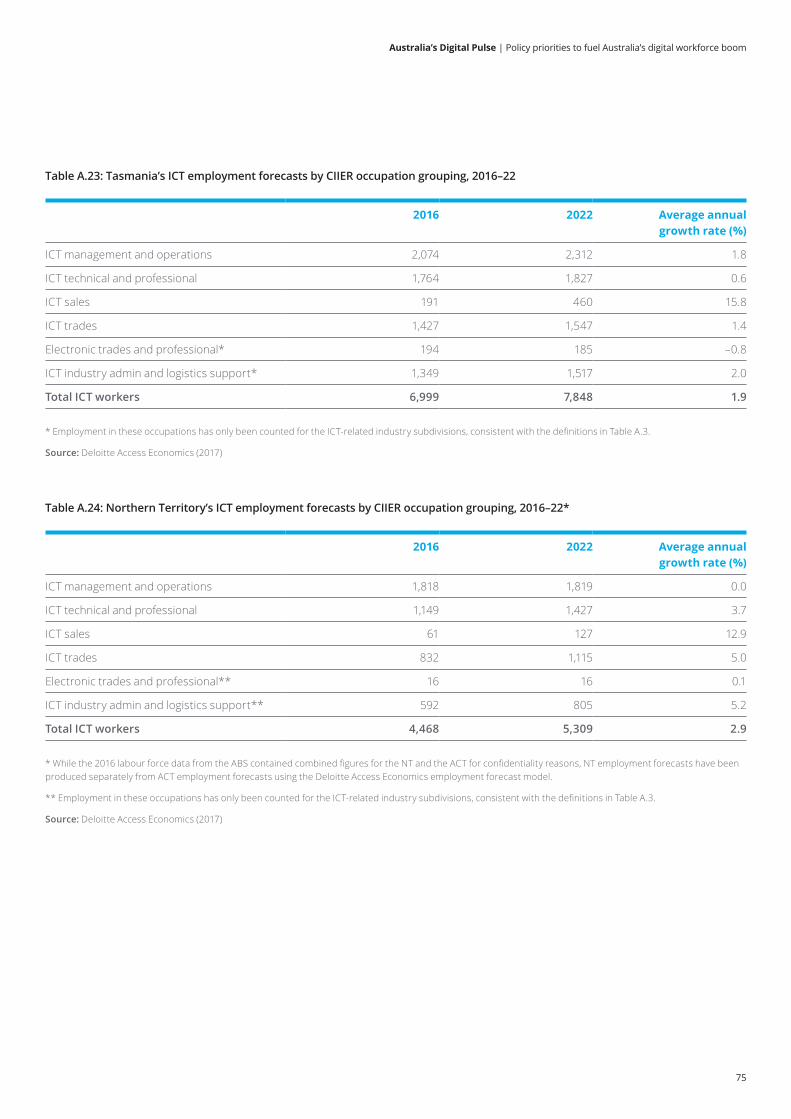
Australia’s Digital Pulse | Policy priorities to fuel Australia’s digital workforce boom
75
* Employment in these occupations has only been counted for the ICT-related industry subdivisions, consistent with the definitions in Table A.3.
Source: Deloitte Access Economics (2017)
Table A.23: Tasmania’s ICT employment forecasts by CIIER occupation grouping, 2016–22
Table A.24: Northern Territory’s ICT employment forecasts by CIIER occupation grouping, 2016–22*
2016 2022 Average annual growth rate (%)
ICT management and operations 2,074 2,312 1.8
ICT technical and professional 1,764 1,827 0.6
ICT sales 191 460 15.8
ICT trades 1,427 1,547 1.4
Electronic trades and professional* 194 185 –0.8
ICT industry admin and logistics support* 1,349 1,517 2.0
Total ICT workers 6,999 7,848 1.9
2016 2022 Average annual growth rate (%)
ICT management and operations 1,818 1,819 0.0
ICT technical and professional 1,149 1,427 3.7
ICT sales 61 127 12.9
ICT trades 832 1,115 5.0
Electronic trades and professional** 16 16 0.1
ICT industry admin and logistics support** 592 805 5.2
Total ICT workers 4,468 5,309 2.9
* While the 2016 labour force data from the ABS contained combined figures for the NT and the ACT for confidentiality reasons, NT employment forecasts have been produced separately from ACT employment forecasts using the Deloitte Access Economics employment forecast model.
** Employment in these occupations has only been counted for the ICT-related industry subdivisions, consistent with the definitions in Table A.3.
Source: Deloitte Access Economics (2017)
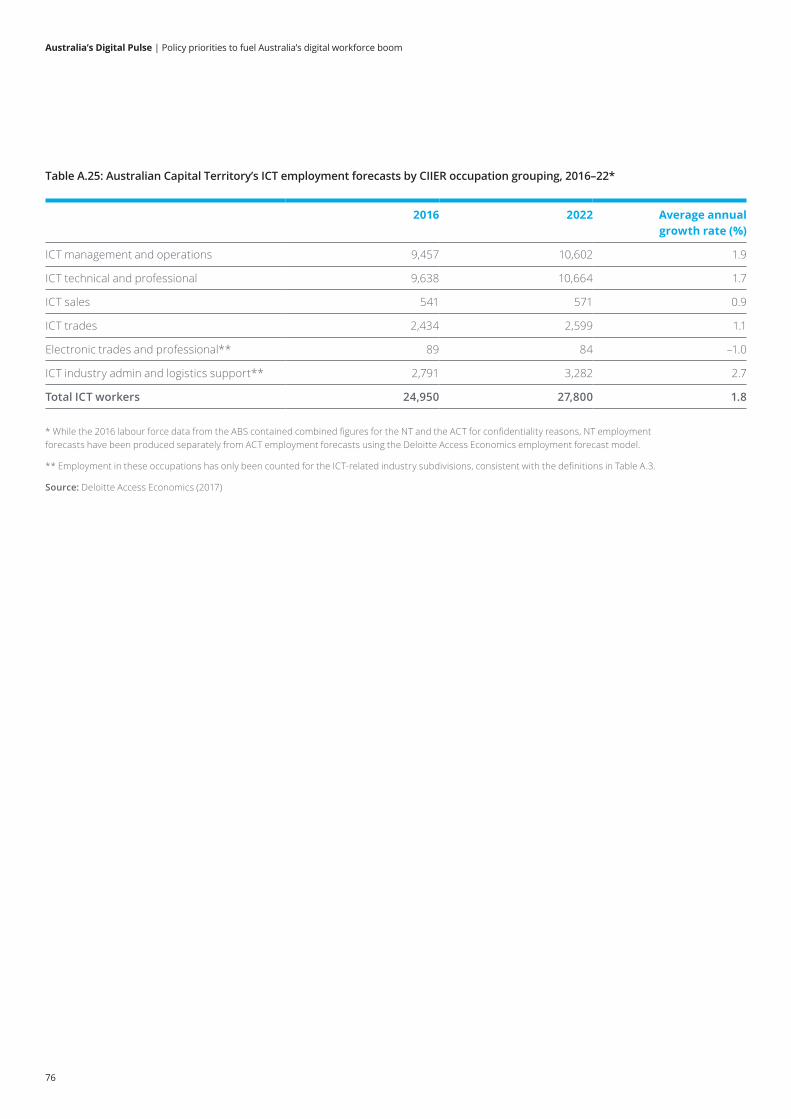
Australia’s Digital Pulse | Policy priorities to fuel Australia’s digital workforce boom
76
Table A.25: Australian Capital Territory’s ICT employment forecasts by CIIER occupation grouping, 2016–22*
2016 2022 Average annual growth rate (%)
ICT management and operations 9,457 10,602 1.9
ICT technical and professional 9,638 10,664 1.7
ICT sales 541 571 0.9
ICT trades 2,434 2,599 1.1
Electronic trades and professional** 89 84 –1.0
ICT industry admin and logistics support** 2,791 3,282 2.7
Total ICT workers 24,950 27,800 1.8
* While the 2016 labour force data from the ABS contained combined figures for the NT and the ACT for confidentiality reasons, NT employment forecasts have been produced separately from ACT employment forecasts using the Deloitte Access Economics employment forecast model.
** Employment in these occupations has only been counted for the ICT-related industry subdivisions, consistent with the definitions in Table A.3.
Source: Deloitte Access Economics (2017)
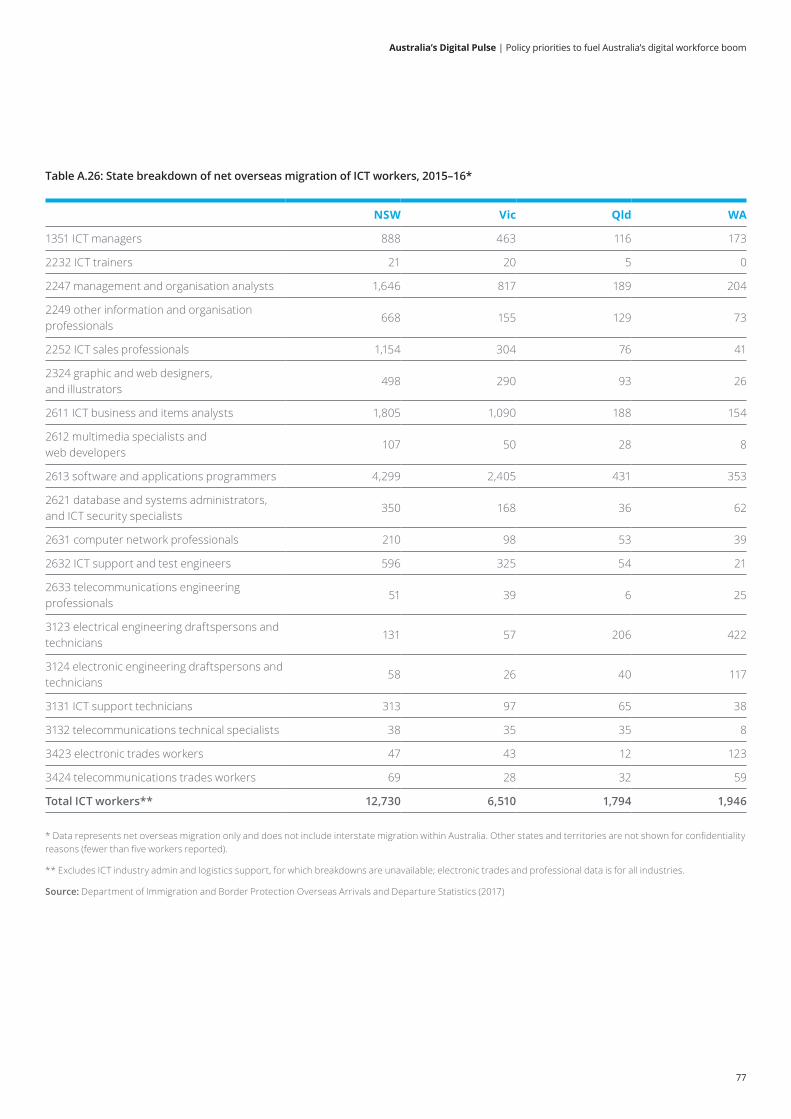
Australia’s Digital Pulse | Policy priorities to fuel Australia’s digital workforce boom
77
Table A.26: State breakdown of net overseas migration of ICT workers, 2015–16*
NSW Vic Qld WA
1351 ICT managers 888 463 116 173
2232 ICT trainers 21 20 5 0
2247 management and organisation analysts 1,646 817 189 204
2249 other information and organisation professionals
668 155 129 73
2252 ICT sales professionals 1,154 304 76 41
2324 graphic and web designers, and illustrators
498 290 93 26
2611 ICT business and items analysts 1,805 1,090 188 154
2612 multimedia specialists and web developers
107 50 28 8
2613 software and applications programmers 4,299 2,405 431 353
2621 database and systems administrators, and ICT security specialists
350 168 36 62
2631 computer network professionals 210 98 53 39
2632 ICT support and test engineers 596 325 54 21
2633 telecommunications engineering professionals
51 39 6 25
3123 electrical engineering draftspersons and technicians
131 57 206 422
3124 electronic engineering draftspersons and technicians
58 26 40 117
3131 ICT support technicians 313 97 65 38
3132 telecommunications technical specialists 38 35 35 8
3423 electronic trades workers 47 43 12 123
3424 telecommunications trades workers 69 28 32 59
Total ICT workers** 12,730 6,510 1,794 1,946
* Data represents net overseas migration only and does not include interstate migration within Australia. Other states and territories are not shown for confidentiality reasons (fewer than five workers reported).
** Excludes ICT industry admin and logistics support, for which breakdowns are unavailable; electronic trades and professional data is for all industries.
Source: Department of Immigration and Border Protection Overseas Arrivals and Departure Statistics (2017)
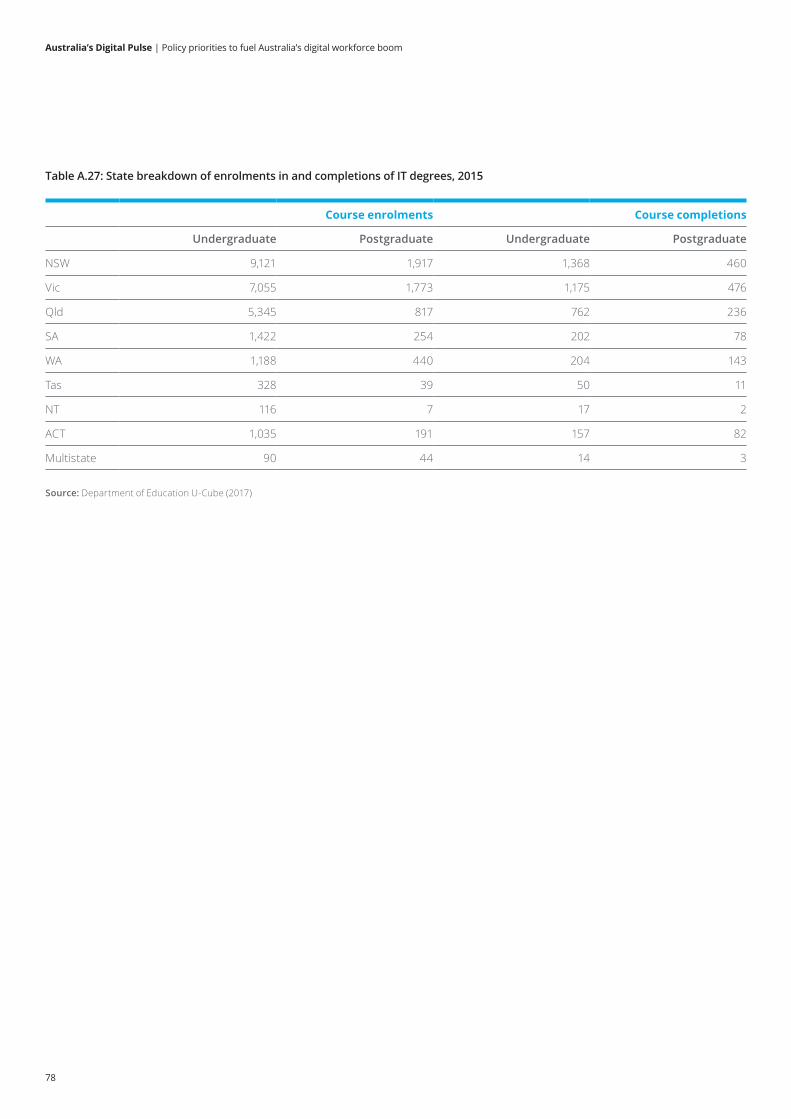
Australia’s Digital Pulse | Policy priorities to fuel Australia’s digital workforce boom
78
Table A.27: State breakdown of enrolments in and completions of IT degrees, 2015
Course enrolments Course completions
Undergraduate Postgraduate Undergraduate Postgraduate
NSW 9,121 1,917 1,368 460
Vic 7,055 1,773 1,175 476
Qld 5,345 817 762 236
SA 1,422 254 202 78
WA 1,188 440 204 143
Tas 328 39 50 11
NT 116 7 17 2
ACT 1,035 191 157 82
Multistate 90 44 14 3
Source: Department of Education U-Cube (2017)
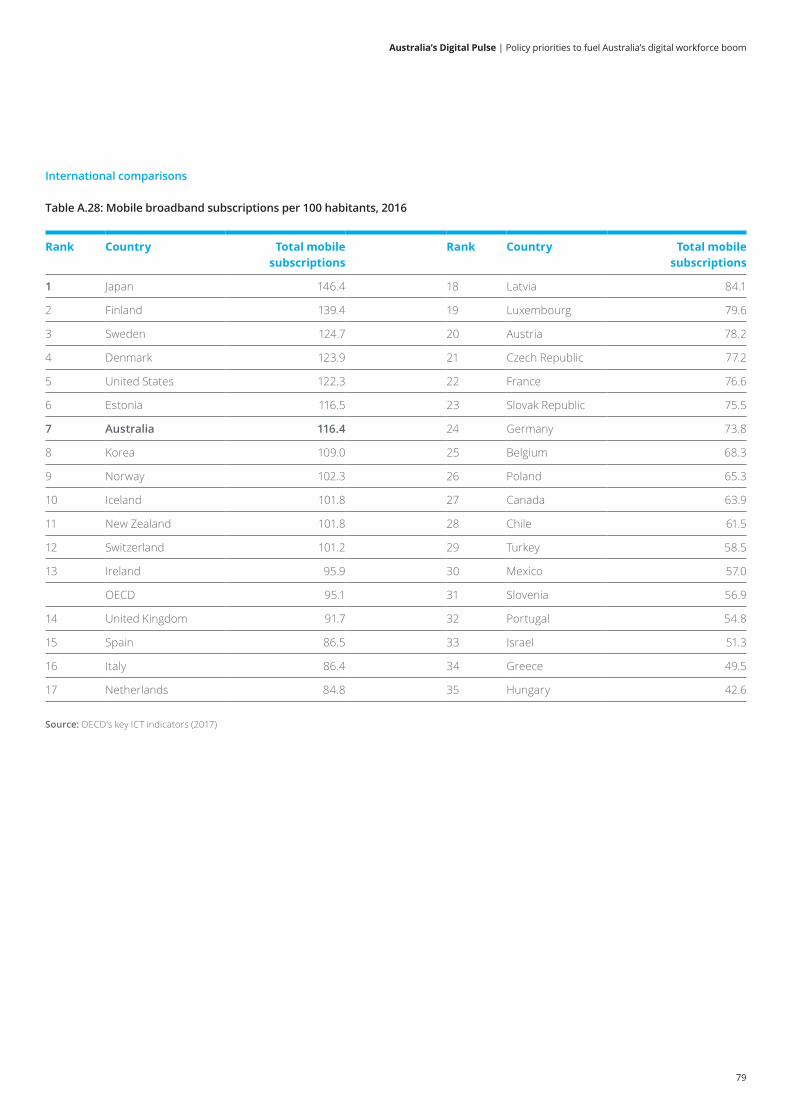
Australia’s Digital Pulse | Policy priorities to fuel Australia’s digital workforce boom
79
International comparisons
Table A.28: Mobile broadband subscriptions per 100 habitants, 2016
Rank Country Total mobile subscriptions
Rank Country Total mobile subscriptions
1 Japan 146.4 18 Latvia 84.1
2 Finland 139.4 19 Luxembourg 79.6
3 Sweden 124.7 20 Austria 78.2
4 Denmark 123.9 21 Czech Republic 77.2
5 United States 122.3 22 France 76.6
6 Estonia 116.5 23 Slovak Republic 75.5
7 Australia 116.4 24 Germany 73.8
8 Korea 109.0 25 Belgium 68.3
9 Norway 102.3 26 Poland 65.3
10 Iceland 101.8 27 Canada 63.9
11 New Zealand 101.8 28 Chile 61.5
12 Switzerland 101.2 29 Turkey 58.5
13 Ireland 95.9 30 Mexico 57.0
OECD 95.1 31 Slovenia 56.9
14 United Kingdom 91.7 32 Portugal 54.8
15 Spain 86.5 33 Israel 51.3
16 Italy 86.4 34 Greece 49.5
17 Netherlands 84.8 35 Hungary 42.6
Source: OECD’s key ICT indicators (2017)
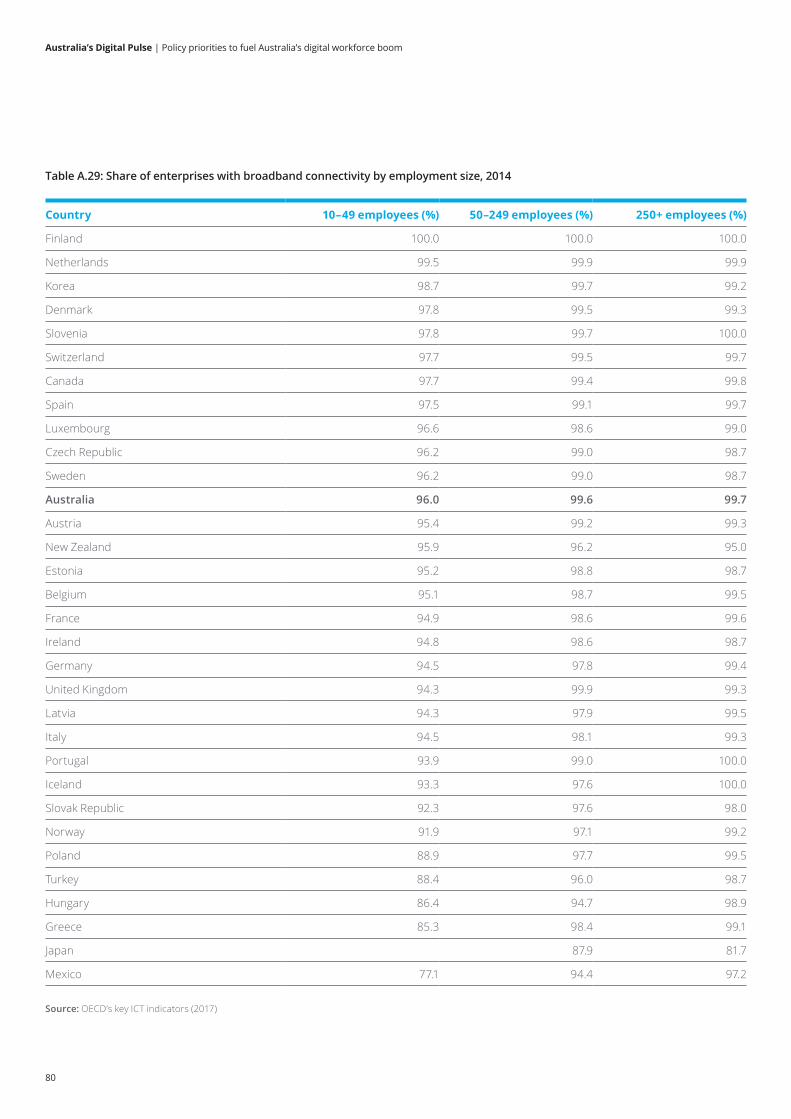
Australia’s Digital Pulse | Policy priorities to fuel Australia’s digital workforce boom
80
Table A.29: Share of enterprises with broadband connectivity by employment size, 2014
Country 10–49 employees (%) 50–249 employees (%) 250+ employees (%)
Finland 100.0 100.0 100.0
Netherlands 99.5 99.9 99.9
Korea 98.7 99.7 99.2
Denmark 97.8 99.5 99.3
Slovenia 97.8 99.7 100.0
Switzerland 97.7 99.5 99.7
Canada 97.7 99.4 99.8
Spain 97.5 99.1 99.7
Luxembourg 96.6 98.6 99.0
Czech Republic 96.2 99.0 98.7
Sweden 96.2 99.0 98.7
Australia 96.0 99.6 99.7
Austria 95.4 99.2 99.3
New Zealand 95.9 96.2 95.0
Estonia 95.2 98.8 98.7
Belgium 95.1 98.7 99.5
France 94.9 98.6 99.6
Ireland 94.8 98.6 98.7
Germany 94.5 97.8 99.4
United Kingdom 94.3 99.9 99.3
Latvia 94.3 97.9 99.5
Italy 94.5 98.1 99.3
Portugal 93.9 99.0 100.0
Iceland 93.3 97.6 100.0
Slovak Republic 92.3 97.6 98.0
Norway 91.9 97.1 99.2
Poland 88.9 97.7 99.5
Turkey 88.4 96.0 98.7
Hungary 86.4 94.7 98.9
Greece 85.3 98.4 99.1
Japan 87.9 81.7
Mexico 77.1 94.4 97.2
Source: OECD’s key ICT indicators (2017)
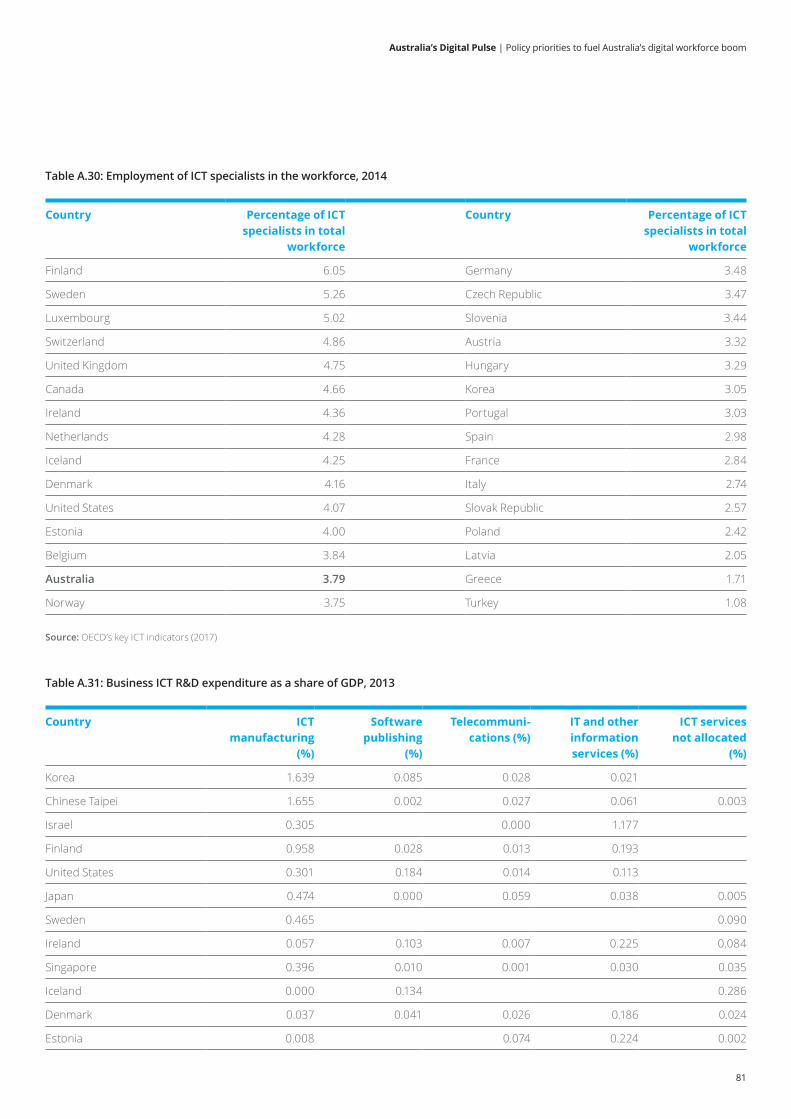
Australia’s Digital Pulse | Policy priorities to fuel Australia’s digital workforce boom
81
Table A.30: Employment of ICT specialists in the workforce, 2014
Country Percentage of ICT specialists in total
workforce
Country Percentage of ICT specialists in total
workforce
Finland 6.05 Germany 3.48
Sweden 5.26 Czech Republic 3.47
Luxembourg 5.02 Slovenia 3.44
Switzerland 4.86 Austria 3.32
United Kingdom 4.75 Hungary 3.29
Canada 4.66 Korea 3.05
Ireland 4.36 Portugal 3.03
Netherlands 4.28 Spain 2.98
Iceland 4.25 France 2.84
Denmark 4.16 Italy 2.74
United States 4.07 Slovak Republic 2.57
Estonia 4.00 Poland 2.42
Belgium 3.84 Latvia 2.05
Australia 3.79 Greece 1.71
Norway 3.75 Turkey 1.08
Source: OECD’s key ICT indicators (2017)
Table A.31: Business ICT R&D expenditure as a share of GDP, 2013
Country ICT manufacturing
(%)
Software publishing
(%)
Telecommuni-cations (%)
IT and other information services (%)
ICT services not allocated
(%)
Korea 1.639 0.085 0.028 0.021
Chinese Taipei 1.655 0.002 0.027 0.061 0.003
Israel 0.305 0.000 1.177
Finland 0.958 0.028 0.013 0.193
United States 0.301 0.184 0.014 0.113
Japan 0.474 0.000 0.059 0.038 0.005
Sweden 0.465 0.090
Ireland 0.057 0.103 0.007 0.225 0.084
Singapore 0.396 0.010 0.001 0.030 0.035
Iceland 0.000 0.134 0.286
Denmark 0.037 0.041 0.026 0.186 0.024
Estonia 0.008 0.074 0.224 0.002
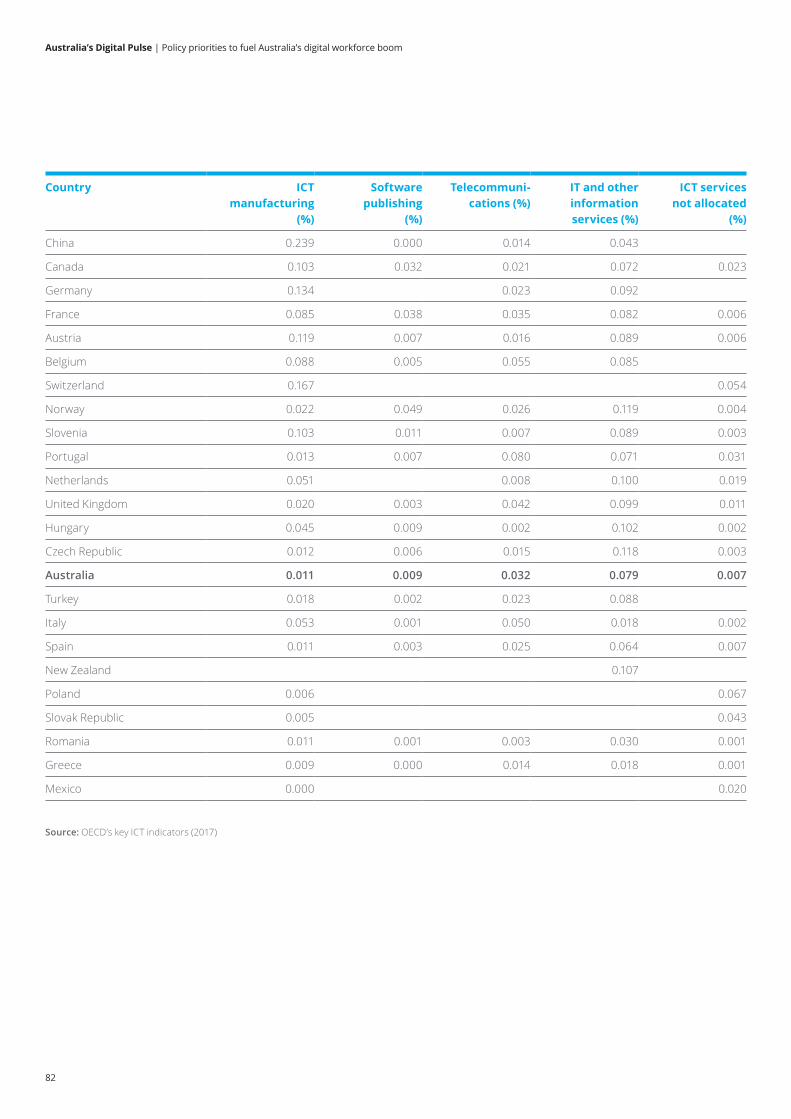
Australia’s Digital Pulse | Policy priorities to fuel Australia’s digital workforce boom
82
Source: OECD’s key ICT indicators (2017)
Country ICT manufacturing
(%)
Software publishing
(%)
Telecommuni-cations (%)
IT and other information services (%)
ICT services not allocated
(%)
China 0.239 0.000 0.014 0.043
Canada 0.103 0.032 0.021 0.072 0.023
Germany 0.134 0.023 0.092
France 0.085 0.038 0.035 0.082 0.006
Austria 0.119 0.007 0.016 0.089 0.006
Belgium 0.088 0.005 0.055 0.085
Switzerland 0.167 0.054
Norway 0.022 0.049 0.026 0.119 0.004
Slovenia 0.103 0.011 0.007 0.089 0.003
Portugal 0.013 0.007 0.080 0.071 0.031
Netherlands 0.051 0.008 0.100 0.019
United Kingdom 0.020 0.003 0.042 0.099 0.011
Hungary 0.045 0.009 0.002 0.102 0.002
Czech Republic 0.012 0.006 0.015 0.118 0.003
Australia 0.011 0.009 0.032 0.079 0.007
Turkey 0.018 0.002 0.023 0.088
Italy 0.053 0.001 0.050 0.018 0.002
Spain 0.011 0.003 0.025 0.064 0.007
New Zealand 0.107
Poland 0.006 0.067
Slovak Republic 0.005 0.043
Romania 0.011 0.001 0.003 0.030 0.001
Greece 0.009 0.000 0.014 0.018 0.001
Mexico 0.000 0.020
Australia’s Digital Pulse | Policy priorities to fuel Australia’s digital workforce boom
83
Our people
Sara MaManager+61 3 9671 [email protected]
Neal SarmaManager+61 3 9671 [email protected]
Nick HullAnalyst+61 2 8260 [email protected]
John O’MahonyPartner+61 2 9322 [email protected]
David RumbensPartner+61 3 9671 [email protected]
Contact us
Deloitte Access EconomicsACN: 149 633 116Level 14, 225 George StreetSydney NSW 2000Tel: +61 2 9322 7000Fax: +61 2 9322 7001
Australian Computer SocietyARBN 160 325 931Level 11, 50 Carrington StreetSydney NSW 2000Tel: +61 2 9299 3666Fax: +61 2 9299 3997
Deloitte Access Economics is Australia’s pre-eminent economics advisory practice and a member of Deloitte's global economics group. For more information, please visit our website
www.deloitte.com/au/deloitte-access-economics
Deloitte refers to one or more of Deloitte Touche Tohmatsu Limited, a UK private company limited by guarantee, and its network of member firms, each of which is a legally separate and independent entity. Please see www.deloitte.com/au/about for a detailed description of the legal structure of Deloitte Touche Tohmatsu Limited and its member firms.
The entity named herein is a legally separate and independent entity. In providing this document, the author only acts in the named capacity and does not act in any other capacity. Nothing in this document, nor any related attachments or communications or services, have any capacity to bind any other entity under the ‘Deloitte’ network of member firms (including those operating in Australia).
About the ACS The ACS is the professional association for Australia’s Information and Communication Technology (ICT) sector. Over 22,000 ACS members work in business, education, government and the community. The Society exists to create the environment and provide the opportunities for members and partners to succeed. The ACS strives for ICT professionals to be recognised as drivers of innovation in our society, relevant across all sectors, and to promote the formulation of effective policies on ICT and related matters. Visit www.acs.org.au for more information.
About Deloitte Deloitte provides audit, tax, consulting, and financial advisory services to public and private clients spanning multiple industries. With a globally connected network of member firms in more than 150 countries, Deloitte brings world-class capabilities and high-quality service to clients, delivering the insights they need to address their most complex business challenges. Deloitte's approximately 200,000 professionals are committed to becoming the standard of excellence.
About Deloitte Australia In Australia, the member firm is the Australian partnership of Deloitte Touche Tohmatsu. As one of Australia’s leading professional services firms. Deloitte Touche Tohmatsu and its affiliates provide audit, tax, consulting, and financial advisory services through approximately 6000 people across the country. Focused on the creation of value and growth, and known as an employer of choice for innovative human resources programs, we are dedicated to helping our clients and our people excel. For more information, please visit our web site at www.deloitte.com.au.
Liability limited by a scheme approved under Professional Standards Legislation.
Member of Deloitte Touche Tohmatsu Limited
© 2017 Deloitte Touche Tohmatsu
MCBD_HYD_05/17_054040