author's personal copy - pellet · 2012-08-10 · airborne dust particle dimensional...
TRANSCRIPT

This article appeared in a journal published by Elsevier. The attachedcopy is furnished to the author for internal non-commercial researchand education use, including for instruction at the authors institution
and sharing with colleagues.
Other uses, including reproduction and distribution, or selling orlicensing copies, or posting to personal, institutional or third party
websites are prohibited.
In most cases authors are permitted to post their version of thearticle (e.g. in Word or Tex form) to their personal website orinstitutional repository. Authors requiring further information
regarding Elsevier’s archiving and manuscript policies areencouraged to visit:
http://www.elsevier.com/copyright
Author's personal copy
Machine vision based particle size and size distribution determination of airbornedust particles of wood and bark pellets
C. Igathinathane a,b,⁎, S. Melin b,c, S. Sokhansanj b, X. Bi b, C.J. Lim b, L.O. Pordesimo d, E.P. Columbus a
a Department of Agricultural and Biological Engineering, Mississippi State University, 130 Creelman Street, Mississippi State, MS 39762, USAb Department of Chemical and Biological Engineering, University of British Columbia, 2360 East Mall, Vancouver, BC, Canada V6T 1Z3c Delta Research Corporation, 501 Centennial Parkway, Delta, BC, Canada V4L 2L5d ADM Alliance Nutrition, 1000 North 30th Street, Quincy, IL 62301, USA
a b s t r a c ta r t i c l e i n f o
Article history:Received 10 April 2009Received in revised form 6 July 2009Accepted 31 July 2009Available online 11 August 2009
Keywords:DustWood pelletImageJ pluginParticle size distributionPhysical propertyImage processing
Dust management strategies in industrial environment, especially of airborne dust, require quantificationand measurement of size and size distribution of the particles. Advanced specialized instruments thatmeasure airborne particle size and size distribution apply indirect methods that involve light scattering,acoustic spectroscopy, and laser diffraction. In this research, we propose a simple and direct method ofairborne dust particle dimensional measurement and size distribution analysis using machine vision. Themethod involves development of a user-coded ImageJ plugin that measures particle length and width andanalyzes size distribution of particles based on particle length from high resolution scan images. Testmaterials were airborne dust from soft pine wood sawdust pellets and ground pine tree bark pellets.Subsamples prepared by dividing the original dust using 230 mesh (63 μm) sieve were analyzed as well. Aflatbed document scanner acquired the digital images of the dust particles. Proper sampling, layout of dustparticles in singulated arrangement, good contrast smooth background, high resolution images, and accuratealgorithm are essential for reliable analysis. A “halo effect” around grey-scale images ensured correctthreshold limits. The measurement algorithm used Feret's diameter for particle length and “pixel-march”technique for particle width. Particle size distribution was analyzed in a sieveless manner after groupingparticles according to their distinct lengths, and several significant dimensions and parameters of particlesize distribution were evaluated. Results of the measurement and analysis were presented in textual andgraphical formats. The developed plugin was evaluated to have a dimension measurement accuracy in excessof 98.9% and a computer speed of analysis of b8 s/image. Arithmetic mean length of original wood and barkpellets airborne dust particles were 0.1138±0.0123 and 0.1181±0.0149 mm, respectively. The airbornedust particles of wood and bark pellets can be described as non-uniform, finer particles dominated, veryfinely skewed with positive skewness, leptokurtic, and very well sorted category. Experimental mechanicalsieving and machine vision methods produced comparable particle size distribution. The limitations andmerits of using the machine vision technique for the measurement of size and size distribution of fineparticles such as airborne dust were discussed.
Published by Elsevier B.V.
1. Introduction
Dust in industrial environment is an undesirable byproductconsidered as a pollutant, hence needs proper management. Basedon the type of industrial source dust can be classified as organic andinorganic dust. Dust particles occur over a range of particles sizes.From occupational health view point, dust are categorized asrespirable (b10 μm), inhalable (median diameter 10 μm), and totaldust covering both [1]. When the dust particle sizes are small anddepending on the particle density, they become airborne and pose
more serious issues than larger particles that easily settle out.Industrial dust issues include health hazards (e.g., respiratory,irritation to organs and skin), dust explosions and fire, equipmentdamage, impaired visibility, unpleasant odors, and problems incommunity relations [1], apart from being an inconvenience toplant operators. Determination of size and size distribution of the dustparticles is fundamental to characterization of dust that is vital fordesigning handling devices and developing management strategies(prevention, control, dilution or isolation).
The wood pellets industry in Canada with total sales of $2×10⁵
mainly as biofuel in European Union nations is an importantcomponent of Canada's rural economy [2], but dust is a seriousconcern if not yet a problem. Organic dust in pelleting industries likethat in grain industries, presents the outlined dust related issues
Powder Technology 196 (2009) 202–212
⁎ Corresponding author. Tel.: +1 662 325 3365; fax: +1 662 325 3385.E-mail addresses: [email protected], [email protected] (C. Igathinathane).
0032-5910/$ – see front matter. Published by Elsevier B.V.doi:10.1016/j.powtec.2009.07.024
Contents lists available at ScienceDirect
Powder Technology
j ourna l homepage: www.e lsev ie r.com/ locate /powtec
Author's personal copy
during pellets production, handling, storage, and transport. Dust isproduced during handling the particulate wood before pelleting(grinding, and handling), and after pelleting (breakage duringcooling, handing, storage, and shipment). Self-heating and explosivityof dust in pellet industries may lead to catastrophic damages, as thepellets are energy densified fuels unlike agricultural grains, hencewarrant strict and careful management.
Assessment of particle size and size distribution of dust, an essentialfirst stagemeasurement, can be obtained utilizing severalmethods suchas the basic mechanical sieving, and advanced light scattering, acousticspectroscopy, and laser diffraction methods. Sieve analysis basedapproach, although considered as a standard method, cannot beconsidered asanaccuratemethodof classifying theparticulatematerialsby length [3–5]. Directmeasurementof a largenumber of particlesusingtravelling microscopes would be tedious. However, advanced instru-ments providing quicker results are highly expensive and sophisticated.Someof the indirect advancedmethods involving scatteredor diffractedlight or laser assume the particle to be spherical, which is not always thepredominant case with natural particulate materials.
Machine vision is another approach to measure the size ofparticulate material, and image processing techniques were actuallyused for calibrating the aforementioned advanced instruments. Reviewson various machine vision research in such areas as robotic weedcontrol, food quality evaluation, grading, inspection, classification,analysis of several agricultural and food products, and the merits andlimitations ofmachine vision systems, aswell asfish eggs counting fromscanned images are available [6–9]. The machine vision applicationsusing high-end proprietary software reported in literature generallytend to be expensive. A simpler and elegant alternative to this approachis user-coded plugin programs developed using ImageJ. ImageJdeveloped at the National Institutes of Health (NIH), USA is a Java-based public domain image processing and analysis program, which isfreely available, open source, multithreaded, and platform independent[10] that can be utilized to develop user-coded plugins to suit thespecific requirements of any conceived application. ImageJ offers toolsfor the development of user-coded macros and plugins that can betailored to suit specific image processing applications [11,12]. Analyzingdigital imageswith a user-coded ImageJ plugin has been shown to be analternativemethodwithgood accuracy for thedeterminationof size andsize distribution of particulate materials [13,14].
This research to determine the size and size distribution ofairborne dust from the wood pellet industry, in most part, followsthe method outlined in our previous efforts [4,5,13,14]. Since airbornedust particles are minute, accurate measurement requires highresolution images that can effectively “capture” the physical dimen-sions of dispersed dust particles. It can be shown that the input imagequality in terms of its resolution directly affects the accuracy of themeasurements. For cost containment and wider applicability, it was aconscious choice in this research that a flatbed document scanneravailable in retail be used as the image acquisition device. The particlesize distribution will be analyzed based on length, themost significantdimension, in a sieveless manner using distinct dimensioned particles[5]. A host of several parameters describing the size distribution ofdust particles will be also evaluated. The objectives of this researchwere to apply our sieveless particle size distribution analysis plugin[5] after suitable development to handle fine airborne dust particles,evaluate the plugin size measurement accuracy, and compare theparticle size distribution with mechanical sieving.
2. Experimental
2.1. Airborne dust samples and sampling procedure
The airborne dust samples from pelleting operations werecollected from the baghouse deposits. Airborne dust samples frompelleting sawdust of soft pine (Pinus spp.) wood (Fibreco, Vancouver,
British Columbia, Canada) and from pelleting ground bark of pine treetrunk (Enligna, Nova Scotia, Canada) were used as test materials. It isoften followed in dust or fine particulates analysis to divide the dustby a 230 mesh sieve (63 μm) and analyze them separately. Therefore,subsamples were prepared for wood and bark pellet dust bysubjecting the original dust through the 230 mesh sieve as overflowand underflow. The original (unseparated) and overflow and under-flow subsamples (separated by 230 mesh) of the two materials wereheld in individual Ziploc® bags (total six samples). The test materialswere stored in air-conditioned laboratory environment (about 22 °Cand 55% RH) before the experiments.
For sampling, the dust in each bagwas thoroughlymixed by shakingthe contents and turning with a spatula, and a scoop (~2–3 g) wasobtainedwith a spoon. The dustwas poured into a heap on a clear sheetof paper. Then the heap was spread using a strong-thin cardboard bygentle vertical choppingmotion,first alongonedirection and then in thedirection perpendicular to that. Cardboard was used as it did not causeelectrostatic attraction of the dust particles. This chopping action causesthe dust heap to spread uniformly into a thin bed of dust. Using thecardboard, small squared areas of spread dust were separated as theselected samples for the experiment. Care was taken to recover all theparticles from the marked areas thereby ensuring that a truerepresentation of the spectrum of the particle sizes in the dust ismaintained. Thus, proper mixing of the bulk dust and meticulousspreading and dividing ensure that the drawn samples to represent theoriginal bulk. Finalmass of sample used for image acquisitionwas about100 to 200 mg.
2.2. Dust sample layout for imaging
A flatbed document scanner (4800×9600 DPI; Cano-scan 4400F,Canon USA. Inc., Lake Success, NY, USA) was used to acquire the colorimages of dust particles. The aim was to spread the individual dustparticles so that they did not touch or overlap with the other particles(singulated arrangement) for better image quality and easier analysis.Singulated arrangement of particles, followed in the study, simplifiesthe analysis and eliminates the need for advance image handlingmethods such as erosion–scrap–dilation procedures to resolve non-singulated particles [15]. However, in a fish eggs counting study theOptimas image processing system (Ver. 6.5) applied an erosion–dilation filter to separate touching eggs from a single cluster to thecomponent individual eggs [9]. In this study, to make the imageanalysis simple, the problem of particles touching was addressed bymanual separation of particles, as explained subsequently, at thesource itself rather than at the later image preprocessing stage.
A good quality overhead projector transparent sheet covered thescanner bed. This forms an intermediate layer protecting the scannerglass bed and aids in removing the sample quickly. A 3/4″ flat art brushwith smooth bristles was utilized to pick up the divided batches of dustand transfer the dust to the scanner bed. The brush with dust particleswere held over the scanner bed by about 150 mm and bristles werestroked using the thin cardboard. This caused the dust particles to flydown and settle on the scanner bed. Stroking was repeated to dislodgeall the dust particles from the brush till it was clean. The process ofpicking the dust and depositing themby strokingwas repeated until thesample was spread completely. During each deposition, the brush wasmoved to across and down the scanner bed area. Sprinkling of thepicked up dust uniformly on the scanner to achieve singulatedarrangement of dust particles is the critical step. Since sporadic touchingand overlapping of particles cannot be avoided, those particles wereidentified using an illuminated magnifier and moved around using apointed knife (X-ACTO, #11, Elmer's Products, Columbus, Ohio, USA).Although the entire procedure takes some time (10min or less based onthe dust particle characteristics for an area of 216×279mm(8.5″×11″)that produces about 10 image samples), singulated arrangement of dustparticles was practically achievable. One pixel gap between particles is
203C. Igathinathane et al. / Powder Technology 196 (2009) 202–212
Author's personal copy
as good as a huge gap between particles in constituting a singulararrangement for the analysis. To achieve good contrast a blackbackground (oil painted special quality art paper) was carefully placedover the sprinkled dust. If the background paper quality was not good,then the fiber matrix of the paper will be captured and that impairs thequality of the acquired digital image.
2.3. Image acquisition
The maximum image size that the scanner can capture was21,000×30,000 pixel in the horizontal and vertical directions respec-tively; hence an image can have a maximum of 6.3×108 pixels. Actualphysical dimensions of the objects scanned were decided based on theresolution setting in terms of dots per inch (DPI) values,which can be setthrough advanced settings in the scanner software. For instance, at6350 DPI an image having 20,826×29,982 pixel represents a physicaldimension of about 83×120 mm, with each square pixel having aphysical dimension of 4 μm, and the resulting image file size was17.14 MB. Therefore, DPI settings directly influence the accuracy orresolution of the image and indirectly influence the physical size of theimage acquired. In this research, we used a 6350 DPI with physicaldimension of 50.8×50.8mm (12,700×12,700 pixel) for the images thathad a mean file size of 5.9 MB. Although digital pictures from the digitalcamera are equally applicable for image analysis, the DPI will be usuallylow (e.g., b200 DPI for a 5 megapixels camera). Therefore, unlessspecializeddigital cameraswithhigh zoomcapacitywere used, commondigital cameras cannot be used to analyze airborne dust particles.
After proper layout of dust on the scanner bed (216×297 mm) theimages can be scanned by fixing the 50.8mm square imagewindow atdesired location on the whole view. Successive images can be easilycaptured by moving image window and performing the scans. Tenimages were acquired from single layout of the dust and these servedas replications. The procedure was repeated for all samples ofdifferent material (wood and bark dust), sieve separation (original,overflow and underflow of 230 mesh), and replications (10). Thus 60images were obtained and analyzed.
2.4. Image preprocessing
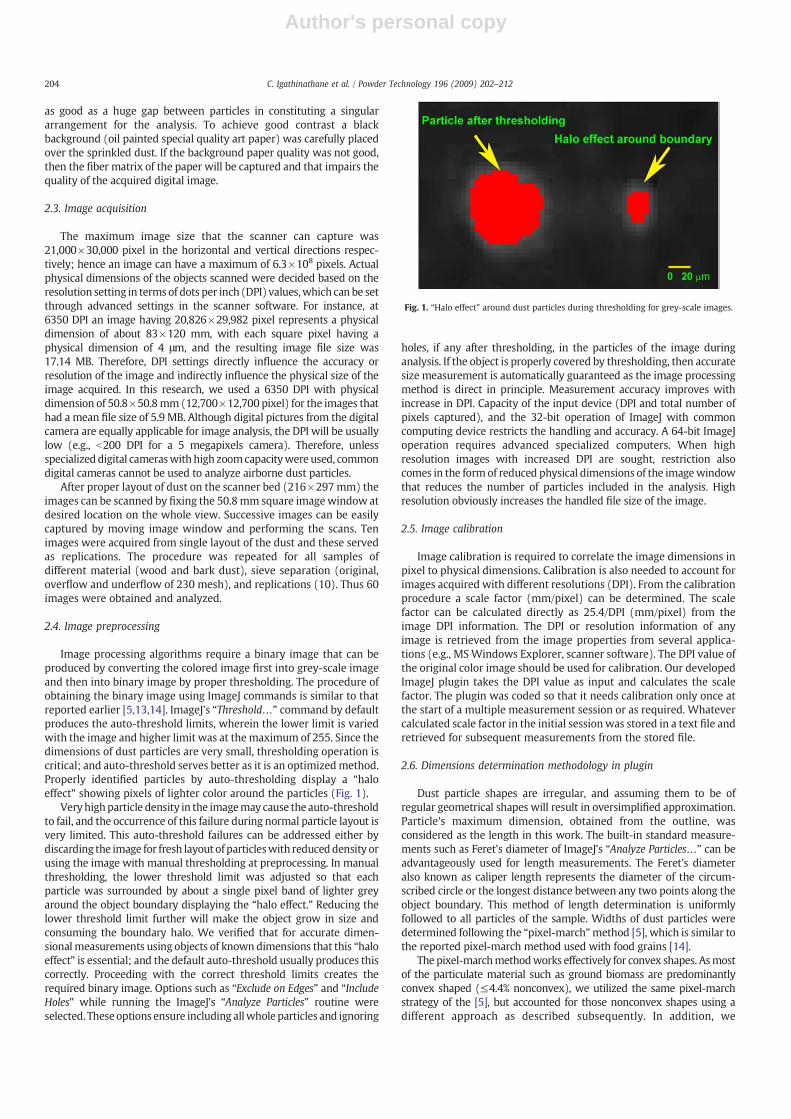
Image processing algorithms require a binary image that can beproduced by converting the colored image first into grey-scale imageand then into binary image by proper thresholding. The procedure ofobtaining the binary image using ImageJ commands is similar to thatreported earlier [5,13,14]. ImageJ's “Threshold…” command by defaultproduces the auto-threshold limits, wherein the lower limit is variedwith the image and higher limit was at themaximum of 255. Since thedimensions of dust particles are very small, thresholding operation iscritical; and auto-threshold serves better as it is an optimizedmethod.Properly identified particles by auto-thresholding display a “haloeffect” showing pixels of lighter color around the particles (Fig. 1).
Veryhighparticle density in the imagemay cause the auto-thresholdto fail, and the occurrence of this failure during normal particle layout isvery limited. This auto-threshold failures can be addressed either bydiscarding the image for fresh layout of particleswith reduceddensity orusing the image with manual thresholding at preprocessing. In manualthresholding, the lower threshold limit was adjusted so that eachparticle was surrounded by about a single pixel band of lighter greyaround the object boundary displaying the “halo effect.” Reducing thelower threshold limit further will make the object grow in size andconsuming the boundary halo. We verified that for accurate dimen-sionalmeasurements using objects of known dimensions that this “haloeffect” is essential; and the default auto-threshold usually produces thiscorrectly. Proceeding with the correct threshold limits creates therequired binary image. Options such as “Exclude on Edges” and “IncludeHoles” while running the ImageJ's “Analyze Particles” routine wereselected. Theseoptions ensure including allwhole particles and ignoring
holes, if any after thresholding, in the particles of the image duringanalysis. If the object is properly covered by thresholding, then accuratesize measurement is automatically guaranteed as the image processingmethod is direct in principle. Measurement accuracy improves withincrease in DPI. Capacity of the input device (DPI and total number ofpixels captured), and the 32-bit operation of ImageJ with commoncomputing device restricts the handling and accuracy. A 64-bit ImageJoperation requires advanced specialized computers. When highresolution images with increased DPI are sought, restriction alsocomes in the formof reduced physical dimensions of the imagewindowthat reduces the number of particles included in the analysis. Highresolution obviously increases the handled file size of the image.
2.5. Image calibration
Image calibration is required to correlate the image dimensions inpixel to physical dimensions. Calibration is also needed to account forimages acquired with different resolutions (DPI). From the calibrationprocedure a scale factor (mm/pixel) can be determined. The scalefactor can be calculated directly as 25.4/DPI (mm/pixel) from theimage DPI information. The DPI or resolution information of anyimage is retrieved from the image properties from several applica-tions (e.g., MSWindows Explorer, scanner software). The DPI value ofthe original color image should be used for calibration. Our developedImageJ plugin takes the DPI value as input and calculates the scalefactor. The plugin was coded so that it needs calibration only once atthe start of a multiple measurement session or as required. Whatevercalculated scale factor in the initial sessionwas stored in a text file andretrieved for subsequent measurements from the stored file.
2.6. Dimensions determination methodology in plugin
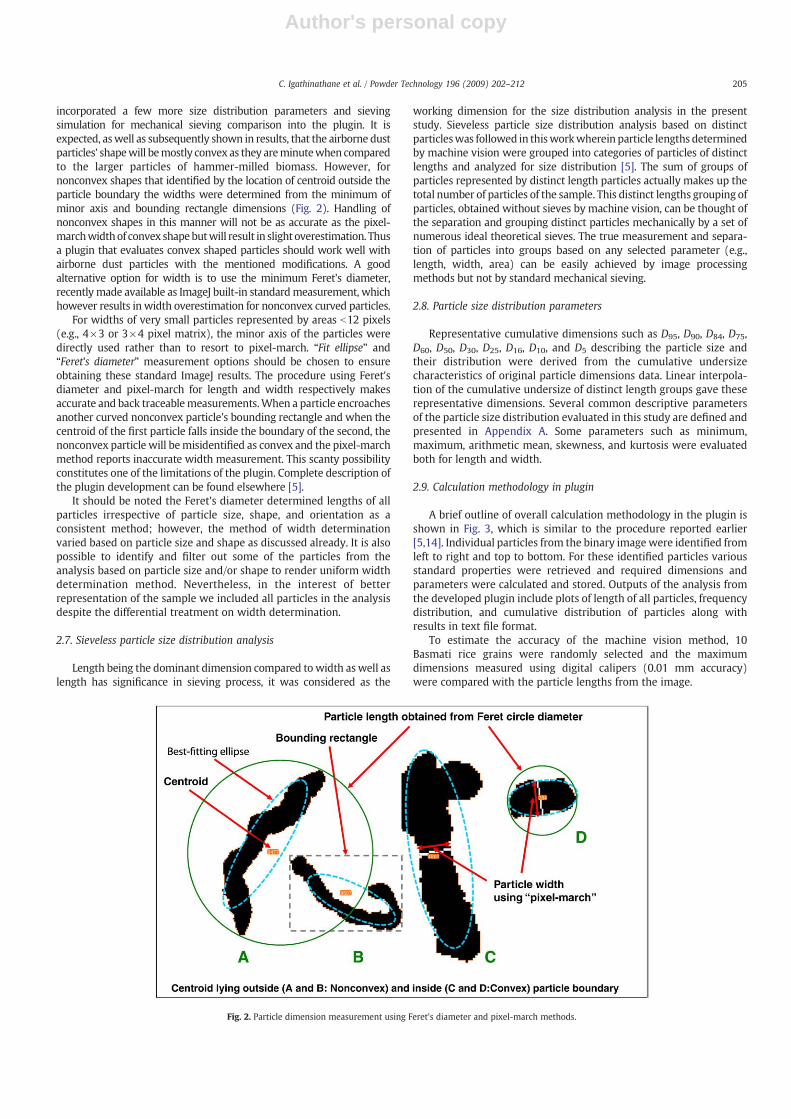
Dust particle shapes are irregular, and assuming them to be ofregular geometrical shapes will result in oversimplified approximation.Particle's maximum dimension, obtained from the outline, wasconsidered as the length in this work. The built-in standard measure-ments such as Feret's diameter of ImageJ's “Analyze Particles…” can beadvantageously used for length measurements. The Feret's diameteralso known as caliper length represents the diameter of the circum-scribed circle or the longest distance between any two points along theobject boundary. This method of length determination is uniformlyfollowed to all particles of the sample. Widths of dust particles weredetermined following the “pixel-march”method [5], which is similar tothe reported pixel-march method used with food grains [14].
The pixel-marchmethodworks effectively for convex shapes. Asmostof the particulate material such as ground biomass are predominantlyconvex shaped (≤4.4% nonconvex), we utilized the same pixel-marchstrategy of the [5], but accounted for those nonconvex shapes using adifferent approach as described subsequently. In addition, we
Fig. 1. “Halo effect” around dust particles during thresholding for grey-scale images.
204 C. Igathinathane et al. / Powder Technology 196 (2009) 202–212
Author's personal copy
incorporated a few more size distribution parameters and sievingsimulation for mechanical sieving comparison into the plugin. It isexpected, aswell as subsequently shown in results, that the airborne dustparticles' shapewill bemostly convex as they areminutewhen comparedto the larger particles of hammer-milled biomass. However, fornonconvex shapes that identified by the location of centroid outside theparticle boundary the widths were determined from the minimum ofminor axis and bounding rectangle dimensions (Fig. 2). Handling ofnonconvex shapes in this manner will not be as accurate as the pixel-marchwidthof convex shapebutwill result in slight overestimation. Thusa plugin that evaluates convex shaped particles should work well withairborne dust particles with the mentioned modifications. A goodalternative option for width is to use the minimum Feret's diameter,recentlymade available as ImageJ built-in standardmeasurement, whichhowever results in width overestimation for nonconvex curved particles.
For widths of very small particles represented by areas b12 pixels(e.g., 4×3 or 3×4 pixel matrix), the minor axis of the particles weredirectly used rather than to resort to pixel-march. “Fit ellipse” and“Feret's diameter” measurement options should be chosen to ensureobtaining these standard ImageJ results. The procedure using Feret'sdiameter and pixel-march for length and width respectively makesaccurate and back traceablemeasurements.When a particle encroachesanother curved nonconvex particle's bounding rectangle and when thecentroid of the first particle falls inside the boundary of the second, thenonconvex particle will bemisidentified as convex and the pixel-marchmethod reports inaccurate width measurement. This scanty possibilityconstitutes one of the limitations of the plugin. Complete description ofthe plugin development can be found elsewhere [5].
It should be noted the Feret's diameter determined lengths of allparticles irrespective of particle size, shape, and orientation as aconsistent method; however, the method of width determinationvaried based on particle size and shape as discussed already. It is alsopossible to identify and filter out some of the particles from theanalysis based on particle size and/or shape to render uniform widthdetermination method. Nevertheless, in the interest of betterrepresentation of the sample we included all particles in the analysisdespite the differential treatment on width determination.
2.7. Sieveless particle size distribution analysis
Length being the dominant dimension compared to width aswell aslength has significance in sieving process, it was considered as the
working dimension for the size distribution analysis in the presentstudy. Sieveless particle size distribution analysis based on distinctparticleswas followed in thisworkwherein particle lengths determinedby machine vision were grouped into categories of particles of distinctlengths and analyzed for size distribution [5]. The sum of groups ofparticles represented by distinct length particles actually makes up thetotal number of particles of the sample. This distinct lengths grouping ofparticles, obtained without sieves by machine vision, can be thought ofthe separation and grouping distinct particles mechanically by a set ofnumerous ideal theoretical sieves. The true measurement and separa-tion of particles into groups based on any selected parameter (e.g.,length, width, area) can be easily achieved by image processingmethods but not by standard mechanical sieving.
2.8. Particle size distribution parameters
Representative cumulative dimensions such as D95, D90, D84, D75,D60, D50, D30, D25, D16, D10, and D5 describing the particle size andtheir distribution were derived from the cumulative undersizecharacteristics of original particle dimensions data. Linear interpola-tion of the cumulative undersize of distinct length groups gave theserepresentative dimensions. Several common descriptive parametersof the particle size distribution evaluated in this study are defined andpresented in Appendix A. Some parameters such as minimum,maximum, arithmetic mean, skewness, and kurtosis were evaluatedboth for length and width.
2.9. Calculation methodology in plugin
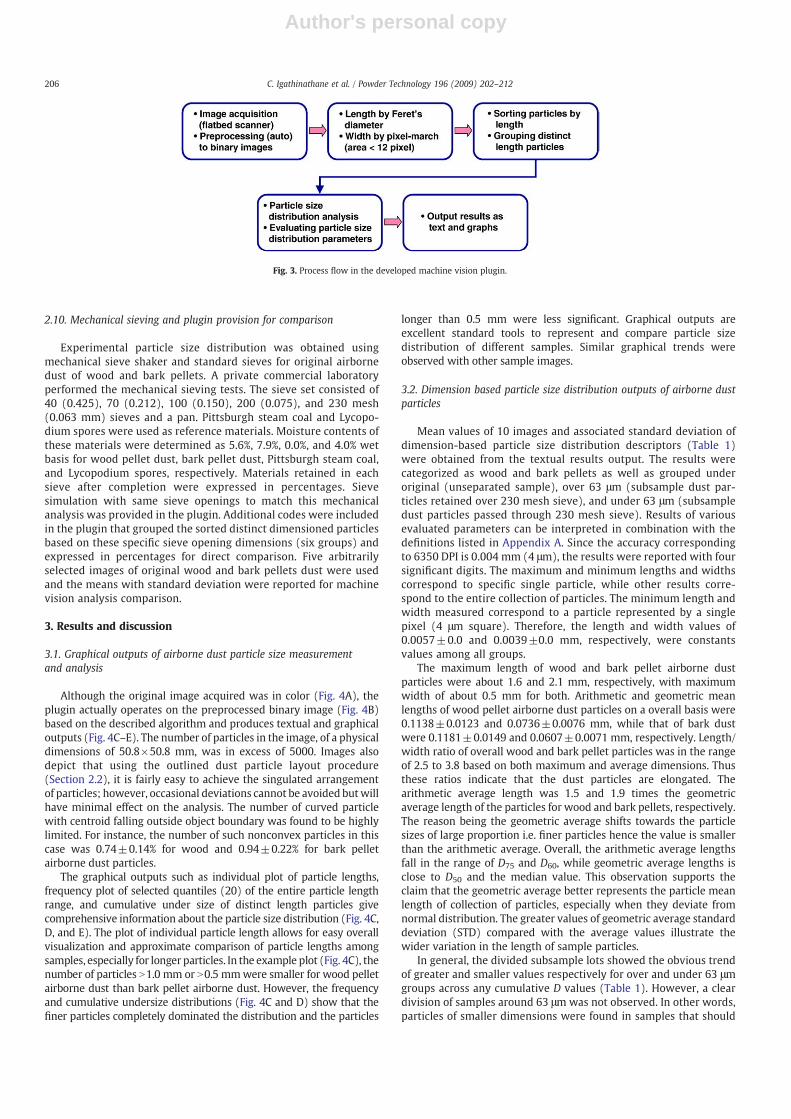
A brief outline of overall calculation methodology in the plugin isshown in Fig. 3, which is similar to the procedure reported earlier[5,14]. Individual particles from the binary imagewere identified fromleft to right and top to bottom. For these identified particles variousstandard properties were retrieved and required dimensions andparameters were calculated and stored. Outputs of the analysis fromthe developed plugin include plots of length of all particles, frequencydistribution, and cumulative distribution of particles along withresults in text file format.
To estimate the accuracy of the machine vision method, 10Basmati rice grains were randomly selected and the maximumdimensions measured using digital calipers (0.01 mm accuracy)were compared with the particle lengths from the image.
Fig. 2. Particle dimension measurement using Feret's diameter and pixel-march methods.
205C. Igathinathane et al. / Powder Technology 196 (2009) 202–212
Author's personal copy
2.10. Mechanical sieving and plugin provision for comparison
Experimental particle size distribution was obtained usingmechanical sieve shaker and standard sieves for original airbornedust of wood and bark pellets. A private commercial laboratoryperformed the mechanical sieving tests. The sieve set consisted of40 (0.425), 70 (0.212), 100 (0.150), 200 (0.075), and 230 mesh(0.063 mm) sieves and a pan. Pittsburgh steam coal and Lycopo-dium spores were used as reference materials. Moisture contents ofthese materials were determined as 5.6%, 7.9%, 0.0%, and 4.0% wetbasis for wood pellet dust, bark pellet dust, Pittsburgh steam coal,and Lycopodium spores, respectively. Materials retained in eachsieve after completion were expressed in percentages. Sievesimulation with same sieve openings to match this mechanicalanalysis was provided in the plugin. Additional codes were includedin the plugin that grouped the sorted distinct dimensioned particlesbased on these specific sieve opening dimensions (six groups) andexpressed in percentages for direct comparison. Five arbitrarilyselected images of original wood and bark pellets dust were usedand the means with standard deviation were reported for machinevision analysis comparison.
3. Results and discussion
3.1. Graphical outputs of airborne dust particle size measurementand analysis
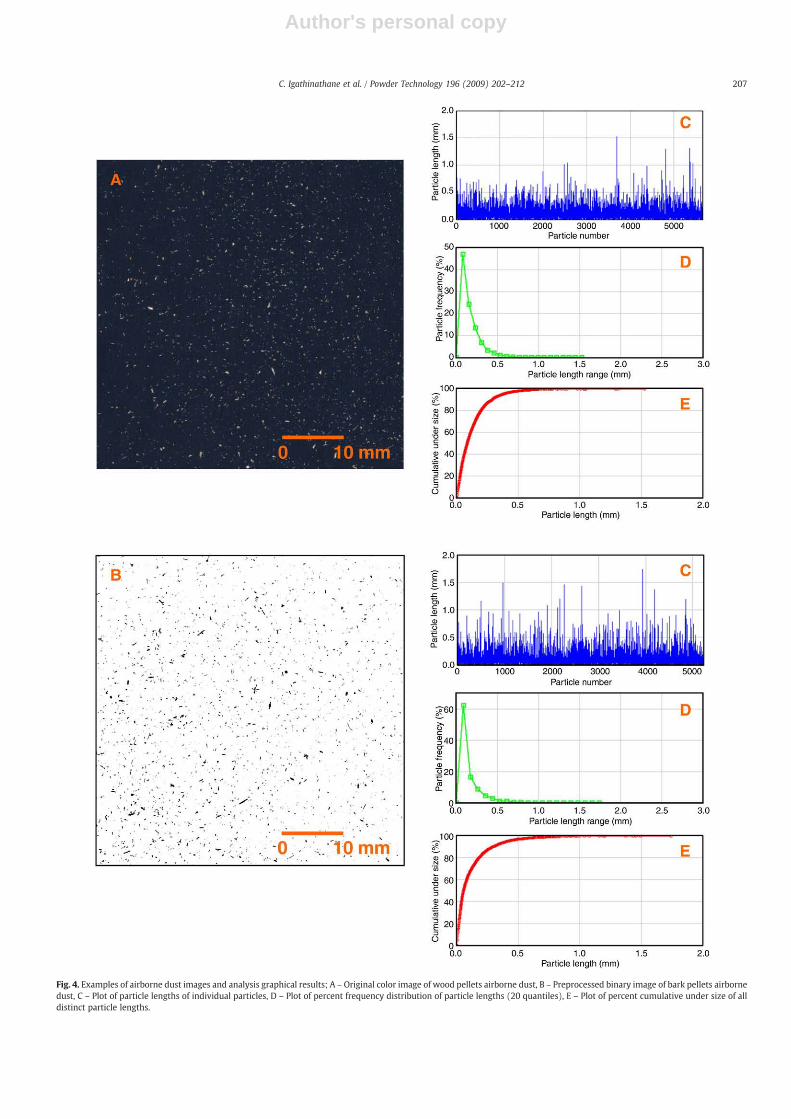
Although the original image acquired was in color (Fig. 4A), theplugin actually operates on the preprocessed binary image (Fig. 4B)based on the described algorithm and produces textual and graphicaloutputs (Fig. 4C–E). The number of particles in the image, of a physicaldimensions of 50.8×50.8 mm, was in excess of 5000. Images alsodepict that using the outlined dust particle layout procedure(Section 2.2), it is fairly easy to achieve the singulated arrangementof particles; however, occasional deviations cannot be avoided butwillhave minimal effect on the analysis. The number of curved particlewith centroid falling outside object boundary was found to be highlylimited. For instance, the number of such nonconvex particles in thiscase was 0.74±0.14% for wood and 0.94±0.22% for bark pelletairborne dust particles.
The graphical outputs such as individual plot of particle lengths,frequency plot of selected quantiles (20) of the entire particle lengthrange, and cumulative under size of distinct length particles givecomprehensive information about the particle size distribution (Fig. 4C,D, and E). The plot of individual particle length allows for easy overallvisualization and approximate comparison of particle lengths amongsamples, especially for longer particles. In the example plot (Fig. 4C), thenumber of particles N1.0 mm or N0.5 mmwere smaller for wood pelletairborne dust than bark pellet airborne dust. However, the frequencyand cumulative undersize distributions (Fig. 4C and D) show that thefiner particles completely dominated the distribution and the particles
longer than 0.5 mm were less significant. Graphical outputs areexcellent standard tools to represent and compare particle sizedistribution of different samples. Similar graphical trends wereobserved with other sample images.
3.2. Dimension based particle size distribution outputs of airborne dustparticles
Mean values of 10 images and associated standard deviation ofdimension-based particle size distribution descriptors (Table 1)were obtained from the textual results output. The results werecategorized as wood and bark pellets as well as grouped underoriginal (unseparated sample), over 63 μm (subsample dust par-ticles retained over 230 mesh sieve), and under 63 μm (subsampledust particles passed through 230 mesh sieve). Results of variousevaluated parameters can be interpreted in combination with thedefinitions listed in Appendix A. Since the accuracy correspondingto 6350 DPI is 0.004 mm (4 μm), the results were reported with foursignificant digits. The maximum and minimum lengths and widthscorrespond to specific single particle, while other results corre-spond to the entire collection of particles. The minimum length andwidth measured correspond to a particle represented by a singlepixel (4 μm square). Therefore, the length and width values of0.0057±0.0 and 0.0039±0.0 mm, respectively, were constantsvalues among all groups.
The maximum length of wood and bark pellet airborne dustparticles were about 1.6 and 2.1 mm, respectively, with maximumwidth of about 0.5 mm for both. Arithmetic and geometric meanlengths of wood pellet airborne dust particles on a overall basis were0.1138±0.0123 and 0.0736±0.0076 mm, while that of bark dustwere 0.1181±0.0149 and 0.0607±0.0071 mm, respectively. Length/width ratio of overall wood and bark pellet particles was in the rangeof 2.5 to 3.8 based on both maximum and average dimensions. Thusthese ratios indicate that the dust particles are elongated. Thearithmetic average length was 1.5 and 1.9 times the geometricaverage length of the particles for wood and bark pellets, respectively.The reason being the geometric average shifts towards the particlesizes of large proportion i.e. finer particles hence the value is smallerthan the arithmetic average. Overall, the arithmetic average lengthsfall in the range of D75 and D60, while geometric average lengths isclose to D50 and the median value. This observation supports theclaim that the geometric average better represents the particle meanlength of collection of particles, especially when they deviate fromnormal distribution. The greater values of geometric average standarddeviation (STD) compared with the average values illustrate thewider variation in the length of sample particles.
In general, the divided subsample lots showed the obvious trendof greater and smaller values respectively for over and under 63 μmgroups across any cumulative D values (Table 1). However, a cleardivision of samples around 63 μm was not observed. In other words,particles of smaller dimensions were found in samples that should
Fig. 3. Process flow in the developed machine vision plugin.
206 C. Igathinathane et al. / Powder Technology 196 (2009) 202–212
Author's personal copy
Fig. 4. Examples of airborne dust images and analysis graphical results; A – Original color image of wood pellets airborne dust, B – Preprocessed binary image of bark pellets airbornedust, C – Plot of particle lengths of individual particles, D – Plot of percent frequency distribution of particle lengths (20 quantiles), E – Plot of percent cumulative under size of alldistinct particle lengths.
207C. Igathinathane et al. / Powder Technology 196 (2009) 202–212
Author's personal copy
have only particles of length N63 μm, and vice versa. The combinedeffect of ineffective flow of material through the microscopicopenings of the sieve and the clumping of fine dust particles due toelectrostatic forces may constitute the reason for smaller particlesfound in the over 63 μm sample. With finer particle such as airbornedust, it is practically impossible to pass all the smaller particlesthrough fine sieves such as 63 μm. “Falling through” effect oflengthier particles [5] and ineffective length separation of sieves [3]were the reasons for observing particles longer than 63 μm in theunder 63 μm group. The machine vision approach followed in thisresearch will not have these lacunas, as it divides the particles andgroups based on “true length separation” in a sieveless method ofanalysis on all distinct particles.
3.3. Particle size distribution parameters of airborne dust particles
On average, the number of dust particles processed in imagesranged from 3220 to 14204 with about 23±13% being distinctparticles (Table 2). Observed uniformity index (values 100% repre-senting uniform particles) less than 10.5% indicate that the particlesare not uniform. The dust particles had greater variation amonglengths as depicted by size range variation coefficients that rangedfrom 66 to 255%. A wider spread in the lengths was corroborated bylarger values of relative span ranging from 1.8 to 6.9. With coefficientof uniformity, any positive deviation from the value of 1.0 indicatesnon-uniformity among the particles as observed from the valuesranging from 3.4 to 9.6. As a comparison, for instance, a fairly uniformnatural product such as Basmati rice grains gave a uniformity index of79.3%, size range variation coefficient of 7.6%, relative span of 0.2, andcoefficient of uniformity of 1.1 [5].
Statistical skewness (lengthN2.0; widthN1.5), a measure of dataasymmetry, of airborne dust particle lengths and widths weresignificantly “positively skewed” (critical value=0.20; α=0.01;df=1000) depicting increased number of smaller particles in thedistribution. Statistical kurtosis (length: 8.4–33.6; width: 3.8–15.5), ameasure of peakedness of distribution, showed the distribution hadsignificant peak (critical value=0.28; α=0.02; df=2000). Suchdistributions with large narrow peak can be described as “leptokur-
tic.” The peak, as seen in Fig. 4D, at the initial was invariably due to thehuge collection of tiny particles corresponding to the first of the 20quantiles. In most cases the smallest particle that can be measured,which is represented by single pixel, makes the largest percentageamong other groups.
According to the Folk and Ward (1957) graphical measuresclassification [16,17], the pellet airborne dust particles were catego-rized as follows based on the determined graphical parameters shownin Table 2. Both wood and bark pellet airborne dust with inclusivegraphic skewness valuesN0.3 were classified as “very finely skewed.”Unlike the statistical moment, based kurtosis having a value of 3.0 fornormal distribution, graphic kurtosis value for normal distribution is1.0. The dust particles mostly belong to “leptokurtic” (1.11–1.50), asnoted earlier. And, based on inclusive graphic STD (Table 1), the dustparticles fall in the category of “very well sorted” (b0.35). Thearithmetic skewness and kurtosis of width distribution followed thelength distribution as well.
3.4. Particle size distribution of separated dust samples using 230 meshsieve (63 μm)
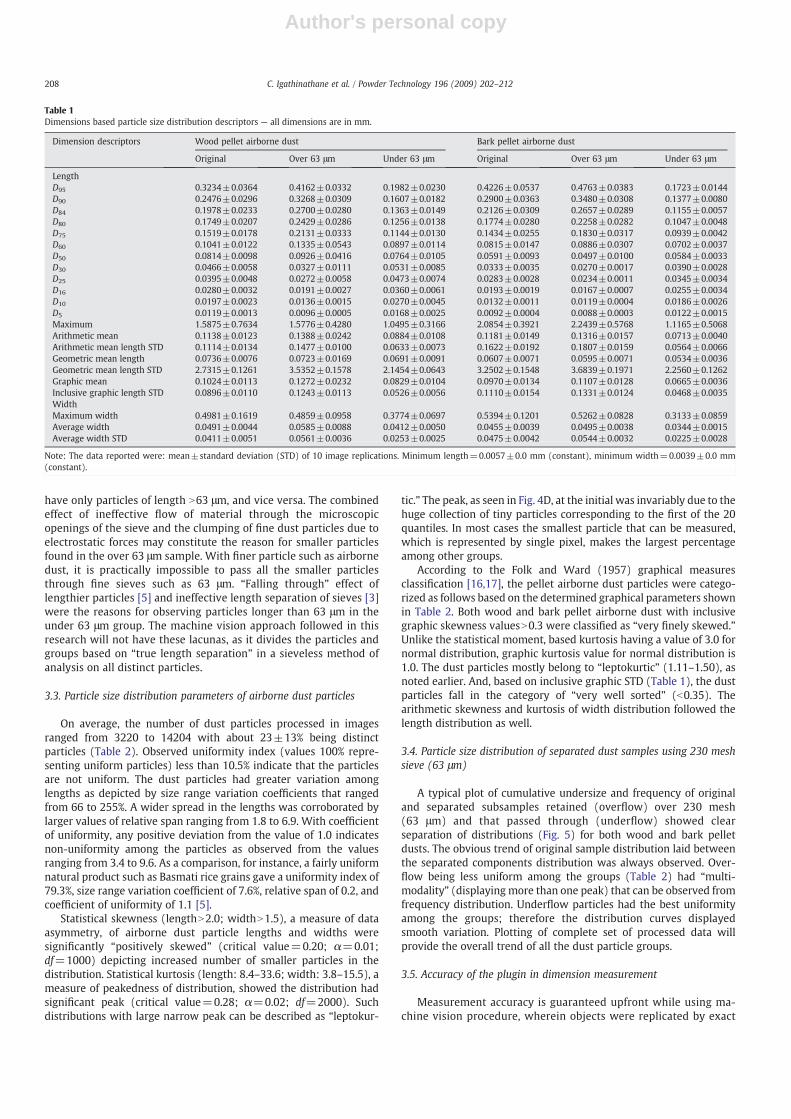
A typical plot of cumulative undersize and frequency of originaland separated subsamples retained (overflow) over 230 mesh(63 μm) and that passed through (underflow) showed clearseparation of distributions (Fig. 5) for both wood and bark pelletdusts. The obvious trend of original sample distribution laid betweenthe separated components distribution was always observed. Over-flow being less uniform among the groups (Table 2) had “multi-modality” (displaying more than one peak) that can be observed fromfrequency distribution. Underflow particles had the best uniformityamong the groups; therefore the distribution curves displayedsmooth variation. Plotting of complete set of processed data willprovide the overall trend of all the dust particle groups.
3.5. Accuracy of the plugin in dimension measurement
Measurement accuracy is guaranteed upfront while using ma-chine vision procedure, wherein objects were replicated by exact
Table 1Dimensions based particle size distribution descriptors — all dimensions are in mm.
Dimension descriptors Wood pellet airborne dust Bark pellet airborne dust
Original Over 63 μm Under 63 μm Original Over 63 μm Under 63 μm
LengthD95 0.3234±0.0364 0.4162±0.0332 0.1982±0.0230 0.4226±0.0537 0.4763±0.0383 0.1723±0.0144D90 0.2476±0.0296 0.3268±0.0309 0.1607±0.0182 0.2900±0.0363 0.3480±0.0308 0.1377±0.0080D84 0.1978±0.0233 0.2700±0.0280 0.1363±0.0149 0.2126±0.0309 0.2657±0.0289 0.1155±0.0057D80 0.1749±0.0207 0.2429±0.0286 0.1256±0.0138 0.1774±0.0280 0.2258±0.0282 0.1047±0.0048D75 0.1519±0.0178 0.2131±0.0333 0.1144±0.0130 0.1434±0.0255 0.1830±0.0317 0.0939±0.0042D60 0.1041±0.0122 0.1335±0.0543 0.0897±0.0114 0.0815±0.0147 0.0886±0.0307 0.0702±0.0037D50 0.0814±0.0098 0.0926±0.0416 0.0764±0.0105 0.0591±0.0093 0.0497±0.0100 0.0584±0.0033D30 0.0466±0.0058 0.0327±0.0111 0.0531±0.0085 0.0333±0.0035 0.0270±0.0017 0.0390±0.0028D25 0.0395±0.0048 0.0272±0.0058 0.0473±0.0074 0.0283±0.0028 0.0234±0.0011 0.0345±0.0034D16 0.0280±0.0032 0.0191±0.0027 0.0360±0.0061 0.0193±0.0019 0.0167±0.0007 0.0255±0.0034D10 0.0197±0.0023 0.0136±0.0015 0.0270±0.0045 0.0132±0.0011 0.0119±0.0004 0.0186±0.0026D5 0.0119±0.0013 0.0096±0.0005 0.0168±0.0025 0.0092±0.0004 0.0088±0.0003 0.0122±0.0015Maximum 1.5875±0.7634 1.5776±0.4280 1.0495±0.3166 2.0854±0.3921 2.2439±0.5768 1.1165±0.5068Arithmetic mean 0.1138±0.0123 0.1388±0.0242 0.0884±0.0108 0.1181±0.0149 0.1316±0.0157 0.0713±0.0040Arithmetic mean length STD 0.1114±0.0134 0.1477±0.0100 0.0633±0.0073 0.1622±0.0192 0.1807±0.0159 0.0564±0.0066Geometric mean length 0.0736±0.0076 0.0723±0.0169 0.0691±0.0091 0.0607±0.0071 0.0595±0.0071 0.0534±0.0036Geometric mean length STD 2.7315±0.1261 3.5352±0.1578 2.1454±0.0643 3.2502±0.1548 3.6839±0.1971 2.2560±0.1262Graphic mean 0.1024±0.0113 0.1272±0.0232 0.0829±0.0104 0.0970±0.0134 0.1107±0.0128 0.0665±0.0036Inclusive graphic length STD 0.0896±0.0110 0.1243±0.0113 0.0526±0.0056 0.1110±0.0154 0.1331±0.0124 0.0468±0.0035WidthMaximum width 0.4981±0.1619 0.4859±0.0958 0.3774±0.0697 0.5394±0.1201 0.5262±0.0828 0.3133±0.0859Average width 0.0491±0.0044 0.0585±0.0088 0.0412±0.0050 0.0455±0.0039 0.0495±0.0038 0.0344±0.0015Average width STD 0.0411±0.0051 0.0561±0.0036 0.0253±0.0025 0.0475±0.0042 0.0544±0.0032 0.0225±0.0028
Note: The data reported were: mean±standard deviation (STD) of 10 image replications. Minimum length=0.0057±0.0 mm (constant), minimum width=0.0039±0.0 mm(constant).
208 C. Igathinathane et al. / Powder Technology 196 (2009) 202–212
Author's personal copy
digital images and measured directly. Only possible loss ofaccuracy stems from low resolution, poor image quality, lesscontrast between object and background, improper thresholds,and faulty measurement algorithms. Comparing with the caliperdimensions of Basmati rice, the machine vision method had an
accuracy in excess of 98.9% (mean absolute error=1.11±0.80%).Since least dimension measurable with machine vision at6350 DPI is 0.004 mm and by digital calipers is 0.01, the errorobserved can be attributed to unrepeatability and error in manualmeasurements.
Fig. 5. Typical cumulative and frequency distribution of original and subsamples separated using 230 mesh sieve (63 μm).
Table 2Overall particle size distribution parameters and plugin performance.
Parameters Wood pellet airborne dust Bark pellet airborne dust
Original Over 63 μm Under 63 μm Original Over 63 μm Under 63 μm
Total number of particles 6686±1860 3220±695 10,581±4886 3920±1250 3228±445 14,204±3644Total number of distinct particles 1401±290 1192±299 1042±297 1110±323 1099±173 979±139Particles b9 pixels area (%) 10.09±1.52 17.10±2.78 6.52±1.56 16.82±1.91 19.62±1.19 10.90±3.05Nonconvex particles (%) 0.50±0.64 0.87±0.28 0.75±0.17 1.03±0.22 1.02±0.28 0.64±0.18Total CPU time taken (ms) 6948±879 5457±914 7870±2439 5630±926 5276±434 8391±1795Number of particles analyzed/s 946±182 587±67 1295±221 682±138 612±70 1683±135LengthUniformity index (%) 4.88±0.76 2.95±0.28 10.47±1.08 3.20±0.40 2.55±0.29 8.87±1.15Size grade number (mm) 8.14±0.98 9.26±4.16 7.64±1.05 5.91±0.93 4.97±1.00 5.84±0.33Size range variation coefficient (%) 104.45±8.14 168.39±87.08 66.13±4.95 164.02±13.11 255.01±27.59 77.25±6.46Relative span 2.81±0.24 4.23±2.24 1.76±0.12 4.71±0.37 6.93±1.06 2.04±0.17Coefficient of uniformity 5.33±0.63 9.62±3.53 3.35±0.21 6.16±1.02 7.50±2.70 3.84±0.56Coefficient of gradation 1.06±0.07 0.66±0.31 1.16±0.04 1.04±0.07 0.78±0.27 1.17±0.08Statistical skewness 2.90±1.21 2.03±0.30 2.68±0.72 3.68±0.48 3.12±0.50 3.05±1.23Statistical kurtosis 23.94±39.79 8.42±4.31 19.31±10.47 21.91±5.44 17.68±7.35 33.57±37.73Inclusive graphic skewness 0.44±0.04 0.51±0.22 0.25±0.04 0.66±0.04 0.77±0.04 0.32±0.03Graphic kurtosis 1.14±0.06 0.91±0.13 1.11±0.04 1.50±0.19 1.24±0.26 1.10±0.05Geometric STD of high region 2.43±0.15 3.62±1.86 1.79±0.08 3.61±0.26 5.45±0.62 1.98±0.09Geometric STD of low region 2.91±0.25 4.69±1.70 2.13±0.10 3.07±0.40 2.98±0.63 2.32±0.29Geometric STD of total region 2.66±0.16 3.77±0.17 1.96±0.08 3.32±0.24 3.99±0.25 2.14±0.17WidthStatistical skewness 2.23±0.74 1.53±0.36 2.15±0.91 2.59±0.41 2.14±0.25 1.45±0.48Statistical kurtosis 11.63±12.41 3.84±2.09 15.50±12.13 11.82±4.34 7.67±2.48 7.05±4.75
Note: The data reported were: mean±standard deviation of 10 image replications.
209C. Igathinathane et al. / Powder Technology 196 (2009) 202–212
Author's personal copy
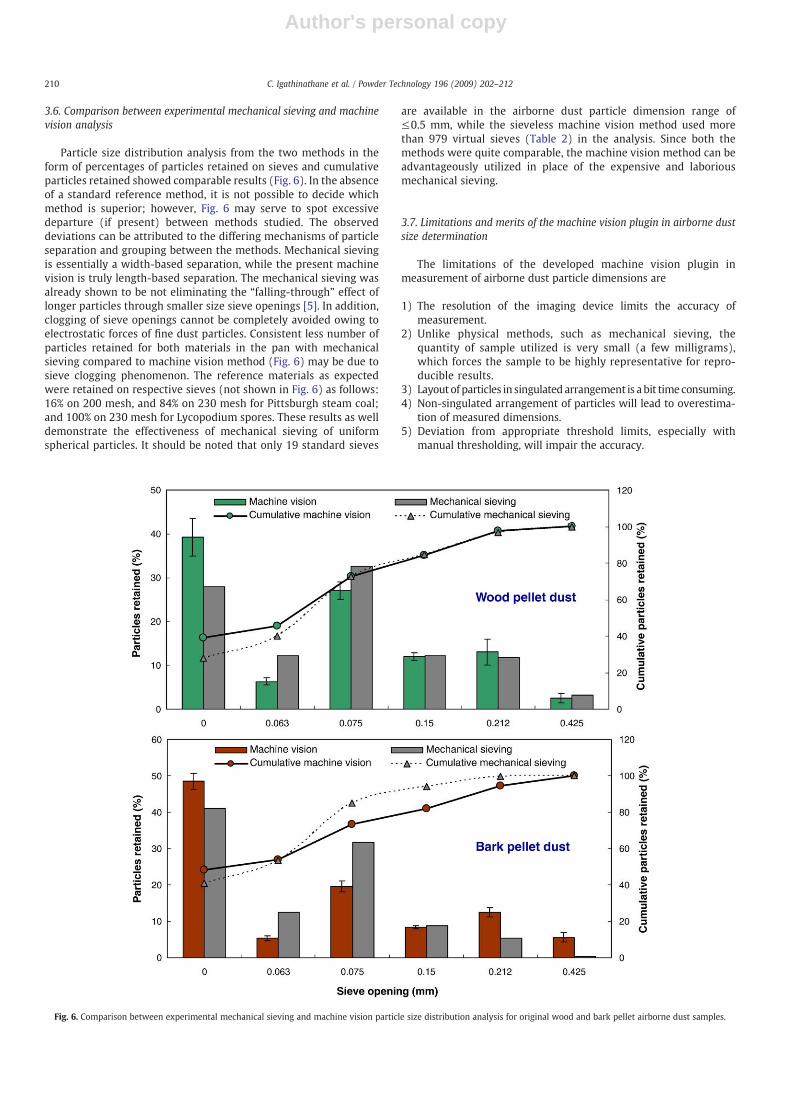
3.6. Comparison between experimental mechanical sieving and machinevision analysis
Particle size distribution analysis from the two methods in theform of percentages of particles retained on sieves and cumulativeparticles retained showed comparable results (Fig. 6). In the absenceof a standard reference method, it is not possible to decide whichmethod is superior; however, Fig. 6 may serve to spot excessivedeparture (if present) between methods studied. The observeddeviations can be attributed to the differing mechanisms of particleseparation and grouping between the methods. Mechanical sievingis essentially a width-based separation, while the present machinevision is truly length-based separation. The mechanical sieving wasalready shown to be not eliminating the “falling-through” effect oflonger particles through smaller size sieve openings [5]. In addition,clogging of sieve openings cannot be completely avoided owing toelectrostatic forces of fine dust particles. Consistent less number ofparticles retained for both materials in the pan with mechanicalsieving compared to machine vision method (Fig. 6) may be due tosieve clogging phenomenon. The reference materials as expectedwere retained on respective sieves (not shown in Fig. 6) as follows:16% on 200 mesh, and 84% on 230 mesh for Pittsburgh steam coal;and 100% on 230 mesh for Lycopodium spores. These results as welldemonstrate the effectiveness of mechanical sieving of uniformspherical particles. It should be noted that only 19 standard sieves
are available in the airborne dust particle dimension range of≤0.5 mm, while the sieveless machine vision method used morethan 979 virtual sieves (Table 2) in the analysis. Since both themethods were quite comparable, the machine vision method can beadvantageously utilized in place of the expensive and laboriousmechanical sieving.
3.7. Limitations and merits of the machine vision plugin in airborne dustsize determination
The limitations of the developed machine vision plugin inmeasurement of airborne dust particle dimensions are
1) The resolution of the imaging device limits the accuracy ofmeasurement.
2) Unlike physical methods, such as mechanical sieving, thequantity of sample utilized is very small (a few milligrams),which forces the sample to be highly representative for repro-ducible results.
3) Layout of particles in singulated arrangement is a bit time consuming.4) Non-singulated arrangement of particles will lead to overestima-
tion of measured dimensions.5) Deviation from appropriate threshold limits, especially with
manual thresholding, will impair the accuracy.
Fig. 6. Comparison between experimental mechanical sieving and machine vision particle size distribution analysis for original wood and bark pellet airborne dust samples.
210 C. Igathinathane et al. / Powder Technology 196 (2009) 202–212
Author's personal copy
6) A scanty possibility exists of improper width measurement onlywhen the centroid of a curvedparticle falls over another encroachingparticle.
7) High resolution images in combinationwith large physical dimensionof imagemakes the image file size very large (in the order of GB) thatcannotbehandledbypersonal computerswith32bitmicroprocessor.
Merits of developed plugin and machine vision method in relationto the present airborne dust particle size and size distributiondetermination and in general include
1) accuracy of measurement,2) speedy calculations and automated analysis (Present work: mean
of 587–1683 particles/s),3) measurement of true length and width of particles through
respective Feret's diameter and pixel-march techniques,4) distinct particles grouped and particle size distribution analyzed
in a sieveless manner,5) the sieveless analysis producing ultimate grouping of particles is
equivalent to involving an unlimited number of sieves based on thesample's number of distinct particles (Present work: 979–1401mean distinct particles),
6) direct and nondestructive method of measurement,7) desired parameters of size distribution and graphical outputs can
be coded into the plugin,8) algorithms are tailor-made to tackle different requirements (size
and shape) of particles size and size distribution,9) wide user accessibility by using ImageJ with Java compiler, and
10) cost-effectiveness achieved because of the utilization of an imageprocessing freeware ImageJ, and the only expenditure required isthe affordable commercial document flatbed scanner.
4. Conclusions
Size and size distribution determination of airborne dust particlesfrom wood and bark pellets that can only be attained presently usingsophisticated instruments can be also effectively accomplished using auser-coded machine vision ImageJ plugin to analyzed unsophisticatedscanned images. Themachine visionmethodwith the developed pluginwas accurate (N98.9%), quick (b8 s per image), reproducible, and highlyinexpensive. Minute airborne dust particles of dimensions greater than4 μm can be imaged utilizing flatbed scanner with resolution of6350 DPI; however, still finer particles require proportionatelyincreased DPI images but need specialized computing resources.Automatic threshold limits of ImageJ that leaves a “halo effect” aroundthe particles grey-scale image gives the best result for binary imageconversion.Wood pellet airborne dust particles are shorter than that ofbark pellets. Arithmetic and geometric mean lengths of wood pelletairborne dust particles were 0.1138±0.0123 and 0.0736±0.0076mm,while that of bark dust were 0.1181±0.0149 and 0.0607±0.0071mm,respectively. The dust particles were elongated having length/widthratios in the range of 2.5 to 3.8. Clear division of subsamples based onlength by standard 230 mesh (63 μm) cannot be achieved by sieving,owing to perpendicular “falling-through” effect of longer particles andelectrostatic forces among the particles. Some of the overflowsubsamples (N63 μm) exhibited “multimodality,” while underflowsubsamples (b63 μm) exhibited smooth variation of length. Theairborne dust particles of wood and bark pellets were non-uniform,dominated by finer particles, “positively skewed” with very “finelyskewed classification,” “leptokurtic,” and belonged to “verywell sorted”category. Results of experimental mechanical sieving and machinevision analysis of airborne dust particles were found to be comparable.The machine vision method of analyzing size and size distribution ofairborne dust and similar particles has a great potential to be consideredas a standardized method of measurement and analysis.
Acknowledgements
Financial support fromtheNatural Sciences andEngineeringResearchCouncil of Canada (NSERC: CRDPJ 342219-06, UBC PG11R82830) andWood Pellets Association of Canada (WPA: UBC PG11R42500) isgratefully acknowledged.
Appendix A. Descriptive parameters of particle size distribution
Parameter Formula
Average length (mm) L =PNi=1
Li =N
Average width (mm) W =PNi=1
Wi =N
Standard deviation (Y=L, W) (mm) s =ffiffiffiffiffiffiffiffiffiffiffiffiffiffiffiffiffiffiffiffiffiffiffiffiffiffiffiffiffiffiffiffiffiffiffiffiffiffiffiffiffiffiffiffiffiffiffiffiffiffiffiffiffiffiffiffiPN
i = 1 Yi−Y� �2
= N − 1ð Þq
ASABE geometric mean length (mm) Xgl = ln−1P
Ni × lnXið ÞPNi
� �
ASABE geometric mean length STD (mm) Sgl = ln−1P
Ni lnXi − lnXglð Þ2� �
PNi
� �12
Graphic mean (mm) Lg = D16 + D50 + D843
Inclusive graphic STD STDig = D84 − D164
h i+ D95 − D5
6:6
h iUniformity index (%) Iu = D5
D90× 100
Size grade number (mm) Nsg = D50 × 100
Size range variation coefficient (%) Sv = D84 − D162D50
× 100
Relative span Sl =D90 − D10
D50
Coefficient of uniformity Cu = D60D10
Coefficient of gradation Cg = D230
D10 × D60
Statistical length skewness Ls =PN
i = 1Li − Lð Þ3
N − 1ð Þs3
Statistical width skewness Ws =PN
i = 1Wi −Wð Þ3
N − 1ð Þs3
Statistical length kurtosis Lk =PN
i = 1Li −Lð Þ4
N − 1ð Þs4 − 3
Statistical width kurtosis Wk =PN
i = 1Wi −Wð Þ4
N − 1ð Þs4 − 3
Inclusive graphic skewness Sig = D84 + D16 − 2D502 D84 − D16ð Þ
h i+ D95 + D5 − 2D50
2 D95 − D5ð Þh i
Graphic kurtosis Kg = D95 − D52:44 D75 − D25ð Þh i
Geometric STD of high region STDh = D84D50
Geometric STD of low region STDl =D50D16
Geometric STD of total region STDt =ffiffiffiffiffiffiD84D16
q
References
[1] V. Mody, R. Jakhete, Dust control handbook for minerals processing, A miningresearch contract report, Contract No. J0235005, February 1987, Bureau of MinesU.S. Department of the Interior, 1987.
[2] Wood Pellets Association of Canada, http://www.pellet.org/Site/Forms/ViewPage.aspx?PageID=318, (Accessed July 2009).
[3] A.R. Womac, C. Igathinathane, P. Bitra, P. Miu, T. Yang, S. Sokhansanj, S. Narayan,Biomass pre-processing size reduction with instrumented mills, ASABE Paper No.076046, ASABE, St. Joseph, MI, 2007.
[4] C. Igathinathane, L.O. Pordesimo, W.D. Batchelor, Ground biomass sieve analysissimulation by image processing and experimental verification of particle sizedistribution, ASABE Paper No. 084126, ASABE, St. Joseph, MI, 2008.
[5] C. Igathinathane, L.O. Pordesimo, E.P. Columbus, W.D. Batchelor, S. Sokhansanj,Sieveless particle size distribution analysis of particulate materials throughcomputer vision, Computers and Electronics in Agriculture 66 (2009) 147–158.
[6] D.C. Slaughter, D.K. Giles, D. Downey, Autonomous robotic weed control systems:a review, Computers and Electronics in Agriculture 61 (2008) 63–78.
[7] C.J. Du, D.W. Sun, Recent developments in the applications of image processingtechniques for food quality evaluation, Trends in Food Science & Technology 15(2004) 230–249 231.
[8] T. Brosnan, D.W. Sun, Inspection and grading of agricultural and food products bycomputer vision systems — a review, Computers and Electronics in Agriculture 36(2002) 193–213.
[9] K.D. Friedland, D. Ama-Abasi, M. Manning, L. Clarke, G. Kligys, R.C. Chambers,Automated egg counting and sizing from scanned images: rapid sampleprocessing and large data volumes for fecundity estimates, Journal of Sea Research54 (2005) 307–316.
211C. Igathinathane et al. / Powder Technology 196 (2009) 202–212

Author's personal copy
[10] W.S. Rasband, ImageJ. U.S. National Institutes of Health, Bethesda, MD, USA, 2007http://rsb.info.nih.gov/ij/index.html (Accessed July 2009).
[11] W. Bailer, Writing ImageJ Plugins — A Tutorial. Version 1.71, 2006 http://rsb.info.nih.gov/ij/download/docs/tutorial171.pdf (Accessed July 2009).
[12] W. Burger, M.J. Burge, Digital Image Processing — An Algorithmic Introductionusing Java, Springer, New York, N.Y., 2008.
[13] C. Igathinathane, L.O. Pordesimo, E.P. Columbus, W.D. Batchelor, S.R. Methuku,Shape identification and particles size distribution from basic shape para-meters using ImageJ, Computers and Electronics in Agriculture 63 (2008)168–182.
[14] C. Igathinathane, L.O. Pordesimo, W.D. Batchelor, Major orthogonal dimensionsmeasurement of food grains by machine vision using ImageJ, Food ResearchInternational 42 (2009) 76–84.
[15] M.A. Shahin, S.J. Symons, Seed sizing from images of non-singulated grain samples,Canadian Biosystems Engineering 47 (2005) 49–54.
[16] R.L. Folk, W.C. Ward, Brazos River bar: a study in the significance of grain sizeparameters, Journal of Sedimentary Petrology 27 (1957) 3–26.
[17] S.J. Blott, K. Pye, GRADISTAT: a grain size distribution and statistics package for theanalysis of unconsolidated sediments, Earth Surface Processes and Landforms 26(2001) 1237–1248.
212 C. Igathinathane et al. / Powder Technology 196 (2009) 202–212