b oard of director s agenda - sandag.org · 3 . board of directors. friday, april 13, 2012 . item #...
TRANSCRIPT
Board
JeromMayo
Jack DCounc
Jim JaMayo
Matt Mayo
CheryMayo
CarrieCounc
Carl HMayo
Mark Mayo
Sam AMayo
Art MMayo
Mary Mayo
Ron MMayo
Jim WMayo
Don HMayo
Jerry SMayo
Tony YCounc
Jim DMayo
Lesa HCounc
Judy RMayo
Ron RChairm
Bill HoSuper
Advis
Hon. JSuperImper
MalcoCalifoof Tra
Harry Metr
Chris North
CAPT SouthEnginU.S. D
Lou SmSan D
JavierSan D
Allen SouthChair
RemeConsu
Gary LExecu
d Members
me Stocks, Chair or, Encinitas
Dale, First Vice Chcilmember, Sante
anney, Second Vicor, Imperial Beac
Hall or, Carlsbad
yl Cox or, Chula Vista
e Downey cilmember, Coro
Hilliard or, Del Mar
Lewis or, El Cajon
Abed or, Escondido
Madrid or, La Mesa
Teresa Sessom or, Lemon Grove
Morrison or, National City
Wood or, Oceanside
Higginson or, Poway
Sanders or, San Diego
Young cil President, San
esmond or, San Marcos
Heebner cilmember, Solan
Ritter or, Vista
Roberts man, County of
orn rvisor, County of
sory Members
John Renison rvisor, District 1 rial County
olm Dougherty, Aornia Departmenansportation
Mathis, Chairmaopolitan Transi
Orlando, Chairmah County Trans
Clifford Maurer, hwest Division Navneering CommandDepartment of D
mith, Chairman Diego Unified Po
r Saunders, DirectDiego County W
Lawson/Edwin ‘Thern California rmen’s Associat
edios Gómez-Arnul General of Mex
L. Gallegos utive Director, SA
hair ee
ce Chair ch
nado
e
y
n Diego
na Beach
San Diego
f San Diego
Acting Director nt
n it System
an it District
USN, CEC, val Facilities d Defense
ort District
tor Water Authority
Thorpe’ Romero Tribal
tion
au xico
NDAG
B
•
ME
In compl
for legis
Committe
$100. C
The 18 cit
SANDAG
and bu
Sa
BOAR
A
SANDPROG
PLEASE TU
YOU CEETING BY
iance with Gove
lative body mem
ee (EC) $100, Bo
Compensation r
com
ties and county g
G builds consens
uilds public tran
n Diego Associat
(6
RD OA
Frida10 a
SAND401 B
AGEND
DAG’S “PAGRAM
URN OFF CE
AN LISTENVISITING O
MESSAernment Code §
mbers attending
oard of Directors
rates for the EC
mpensation rate
MISgovernment are
sus, makes strate
nsit, and provide
r
ion of Governme
619) 699-1900 ⋅
OF DGEN
ay, April 1a.m. to 12DAG BoarB Street, 7
San Dieg
DA HIG
AY FOR P
ELL PHONE
N TO THE BOOUR WEB S
AGE FROM T§54952.3, the Cle
g the following
s (BOD) $150, an
and BOD are se
for the RTC is s
SSION STATe SANDAG servi
egic plans, obta
es information o
region's quality
ents ⋅ 401 B Stre
Fax (619) 699-1
DIRECNDA
13, 2012 2 noon rd Room 7th Floorgo
GHLIGH
PERFORM
ES DURING
OARD OF DSITE AT WW
THE CLERK erk hereby anno
simultaneous o
nd Regional Tra
et pursuant to th
set pursuant to s
TEMENT ing as the forum
ains and allocate
on a broad rang
of life.
eet, Suite 800, Sa
905 ⋅ www.san
CTOR
r
HTS
MANCE”
THE MEET
DIRECTORS WW.SANDA
ounces that the
or serial meeting
ansportation Co
he SANDAG Byla
state law.
m for regional de
es resources, pla
ge of topics pert
n Diego, CA 921
dag.org
RS
ING
AG.ORG
compensation
gs is: Executive
mmission (RTC)
aws and the
ecision-making.
ans, engineers,
tinent to the
01-4231

WcCeT Tarot SAcpwf Ino7( S7
La
如
请
Welcome to SAconsidering theClerk of the Boaentitled Public CThe Board of D
This agenda anagenda can bereceived no lateother materiathe Clerk of th
SANDAG operaAct. SANDAG hcomplaint are aprocedures showho believes hfile a written co
n compliance worder to partic72 hours in ad619) 699-1900,
SANDAG agend72 hours in adv
Los materiales dal menos 72 ho
如有需要, 我们可
请在会议前至少
SANDA
ANDAG. Membe item. Please coard seated at tComments/Comirectors may ta
nd related stafforwarded to
er than 12 nooals from the phe Board no la
ates its programhas developed available to theuld be directedimself or herse
omplaint with t
with the Ameripate in SAND
dvance of the (619) 699-1904
da materials cavance of the me
de la agenda dras antes de la
可以把SANDAG
少 72 小时打电话
AG offices areBicycle
bers of the puomplete a Speahe front table. mmunications/Make action on a
f reports can bSANDAG via t
n, two workingpublic intendelater than 12 n
ms without regaprocedures fo
e public upon rd to SANDAG Gelf or any specifthe Federal Tra
ricans with DisaDAG meetings.
meeting. To 4 (TTY), or fax (
an be made aeeting.
de SANDAG estreunión.
G议程材料翻译成
话 (619) 699-190
e accessible bye parking is a
2
ublic may speaaker’s Slip, whiMembers of th
Member Commny item appear
be accessed at the e-mail comg days prior to ed for distribunoon, two wo
ard to race, color investigatingrequest. QuestioGeneral Counsefic class of pers
ansit Administra
abilities Act (AIf such assista
request this d(619) 699-1905.
vailable in alte
tán disponible
成其他語言.
0 提出请求.
y public transvailable in th
2
k to the Boardch is located inhe public may a
ments. Public spring on the age
www.sandag.mment form av
the Board of Dution at the Borking days p
lor, and nationg and trackingons concerningel, John Kirk, atsons to be subjeation.
ADA), SANDAG ance is requireddocument or r.
ernative langu
s en otros idio
sit. Phone 511he parking gar
d of Directors n the rear of theaddress the Bo
peakers are limenda.
org under Mevailable on theDirectors meetiBoard of Direcprior to the m
nal origin in comg Title VI compg SANDAG nont (619) 699-199ected to discrim
will accommod, please contarelated reports
ages. To make
omas. Para hace
1 or see 511sdrage of the SA
on any item e room, and th
oard on any issuited to three m
eetings. Public e Web site. E-mng. Any handctors meeting
meeting.
mpliance with plaints and thndiscrimination97 or John.Kirkmination prohi
odate persons wact SANDAG as in an altern
e a request ca
er una solicitud
d.com for rouANDAG office
Re
at the time thhen present theue under the agminutes or less p
comments regmail commentsdouts, presentg should be re
Title VI of the e procedures f
n obligations [email protected]. Abited by Title V
who require asat (619) 699-19ative format,
ll (619) 699-19
d, llame al (619
ute informatioes.
ev. 020912
he Board is e slip to the genda item per person.
garding the s should be tations, or eceived by
Civil Rights for filing a r complaint Any person VI also may
ssistance in 900 at least
please call
900 at least
9) 699-1900
on.

3
BOARD OF DIRECTORS Friday, April 13, 2012
ITEM # RECOMMENDATION
1. PUBLIC COMMENTS/COMMUNICATIONS/MEMBER COMMENTS
Public comments under this agenda item will be limited to five public speakers. Members of the public shall have the opportunity to address the Board on any issue within the jurisdiction of SANDAG that is not on this agenda. Other public comments will be heard during the items under the heading “Reports.” Anyone desiring to speak shall reserve time by completing a “Request to Speak” form and giving it to the Clerk of the Board prior to speaking. Public speakers should notify the Clerk of the Board if they have a handout for distribution to Board members. Public speakers are limited to three minutes or less per person. Board members also may provide information and announcements under this agenda item.
REPORTS (2)
+2. SANDAG’S “PAY FOR PERFORMANCE” PROGRAM (Laura Coté and Melissa Coffelt)
DISCUSSION
Staff will provide an overview of the agency's merit-based “pay for performance” program.
3. CONTINUED PUBLIC COMMENTS
If the five speaker limit for public comments was exceeded at the beginning of this agenda, other public comments will be taken at this time. Subjects of previous agenda items may not again be addressed under public comment.
4. UPCOMING MEETINGS INFORMATION
The next Board Business meeting is scheduled for Friday, April 27, 2012, at 9 a.m.
5. ADJOURNMENT
+ next to an agenda item indicates an attachment
BOARD OF DIRECTORS AGENDA ITEM NO. 12-04-2APRIL 13, 2012 ACTION REQUESTED – DISCUSSION
SANDAG’S “PAY FOR PERFORMANCE” File Number 8000100 PROGRAM
BOARDAPRIL 1
SANDAPROGR
Introduc
As part oasked foroverview annual bstructurespresented
Overview
SANDAG’refers to factor in if any. ThGovernmorganizateligible tworkforcemployee
A key meagency gagency’s goals beithat are r
Another distributethe exterto determfall, assumunderstan
D OF DIREC13, 2012
AG’S “PAY AM
ction
of the reviewr additional i
of the ageudget recoms internally ad in detail.
w of SANDA
’s compensathe agency’sdetermining
his strategy isents (SCAG)tions of all sito participae, known aes, do not pa
easure that asgoals are sucperformanceng aligned trelevant and
critical meaed based on rnal market amine where iming at leastnd how posit
CTORS
Y FOR PERF
w of the draftinformation ncy’s compe
mmendation and to the ex
AG’s “Pay fo
tion programs practice of ug the amounts used by oth) and Northizes such as Gte in the pas “Limited
articipate as t
ssesses the efccessfully mee managemeto the Board reasonable.
sure that is factors such
and within thin the salaryt satisfactory tions and sal
FORMANC
t FY 2013 Anabout the agnsation prog– the agency
xternal marke
or Performa
m includes ausing formalt of salary iner regional ah County TGoogle, Quapay for per Term” antheir employ
ffectiveness oet or exceed
ent program of Directors
assessed fo as level of phe organizat range an inperformanc
ary ranges co
AC
CE”
nnual Progragency’s pay fgram with ay’s pay for pet and, rewa
ance” Progr
a merit-base evaluations
ncrease and/oagencies suchTransit Distrilcomm, andrformance pd “TIPS” (Tment is cons
of SANDAG’sded by empemphasizes t
s’ overall goa
r program sperformancetion. SANDAGndividual’s bae. The agencompare agai
AGEND
CTION REQ
am Budget, Sfor performa
an emphasis performance rding emplo
ram
ed “pay for of individuaor bonus givh as the Soutict (NCTD) WD-40. SAN
program whTemporary, idered temp
s pay for perployees. In sthe importanals, and defin
success is whe, experienceG systematicase pay shoucy also condunst the priva
DA ITEM N
QUESTED –
File
SANDAG Boaance programon the factstrategy, ali
oyees for perf
performanceal performanven to each ethern Califorand in mo
NDAG’s Reguhile the age
Intern, Parporary in natu
rformance prupport of tnce of individnes performa
hether compe, and value ally reviews
uld reasonabucts periodic ate and publi
**REVISE
NO. 12-04
– DISCUSS
e Number 800
ard membersm. In responstors that drivignment of sformance - w
e” approachnce as a signifeligible emplnia Associatist private slar employee
ency’s contint-time, Seasure.
rogram is whhis principledual performance expecta
pensation is of the positiemployee sa
bly be expectmarket stud
ic sectors.
ED**
4-2SION
00100
s have se, an ve an salary
will be
h that ficant loyee, ion of sector es are ngent sonal)
ether e, the mance ations
fairly ion in alaries ted to dies to
2
Performance Evaluation Cycle
The foundation of SANDAG’s pay for performance program is the annual performance evaluation cycle which is conducted in June/July each year. This timing has been chosen so that employees and managers are able to review performance and the accomplishment of goals as the fiscal year draws to a close, as well as identify goals and objectives for the upcoming year. The agency’s Strategic Priorities, as defined by the Board of Directors, as well as projects identified in the Overall Work Program (OWP) and the Capital Improvement Program (CIP), are tightly woven into the development of individual employee goal plans and ensure that employees understand what is required of them each year. This goal-setting phase is accomplished through a sophisticated process that is formally communicated to all employees and monitored by managers and executives. SANDAG uses a Web-based application called SuccessFactors for goal setting and performance evaluations. This tool, also used by other public and private entities such as the Department of Labor, Veterans Affairs, General Dynamics, and Petco, supports the agency in “cascading” the Board’s five Strategic Goals and six Areas of Emphasis from the executive level, to managers, and then throughout the organization. As a result, each employee is able to understand the link between the projects, tasks, and assignments they work on and how this work contributes to the agency’s overall success. Managers and employees review goals on a regular basis to keep them up-to-date.
In addition to developing project and task related goals each year, employees and managers also identify competency development and professional training goals. SANDAG’s competencies are defined as descriptions or definitions of the various attributes, behaviors, areas of knowledge, skills, and abilities that lead to superior job performance and professional growth. The agency incorporates competencies into the goal development process and then evaluates them as a mechanism to review not only the project-related results an employee achieves but the manner in which these results are achieved. See Attachment 1 for SANDAG’s Competency Model, Competency Definitions and Rating Scales.
The annual performance evaluation cycle begins in June with employees completing a self-evaluation of both goal accomplishments and competency effectiveness. Managers subsequently review and rate employee performance and provide formal feedback. Performance ratings for each employee are then tabulated, and the manager, in collaboration with their Department Director, recommends a reward (when a merit budget is available) to senior executives for approval. In order to ensure fairness, both actual and perceived, SANDAG has established internal checks and balances such as senior executive review and approval of all recommended merit increases to ensure that managers are, in fact, using appropriate judgment and discretion in developing reward recommendations. Further, guidelines and training are provided to all managers to equip them to exercise that judgment responsibly as trust between managers and employees is critical to program success. Attachment 2 outlines the training provided to managers and employees during last year’s evaluation cycle to support their roles within the performance evaluation phase. Attachment 3 is an outline of the FY 2011 Performance Evaluation Schedule.
As a result of annual performance evaluations when funding is available, exceptional performers receive the greatest rewards to acknowledge their superior contributions and to motivate them to continue their high performance. Average performers on the other hand receive smaller rewards which are intended to encourage them to work harder to achieve larger raises in the future. Finally, poor performers do not receive a reward which serves to persuade these individuals to work with their manager on developing and executing an improvement plan.
3
As part of the decision by senior executives to award annual salary raises and/or bonuses, employee salaries are reviewed for internal equity and consistency across the agency. The review assesses each individual’s level of experience and performance compared to where their base pay falls within the salary range. When appropriate, an employee may receive additional base salary over and above a merit increase if their current salary is deemed inequitably low when compared to other similarly situated employees. Consequently, if an employee’s base salary is significantly higher than appropriate, increases to base salary may be limited. In order to maintain the integrity of the pay for performance program, one option previously used by SANDAG in this instance is to offer a cash bonus instead of a base salary increase to reward exceptional performance.
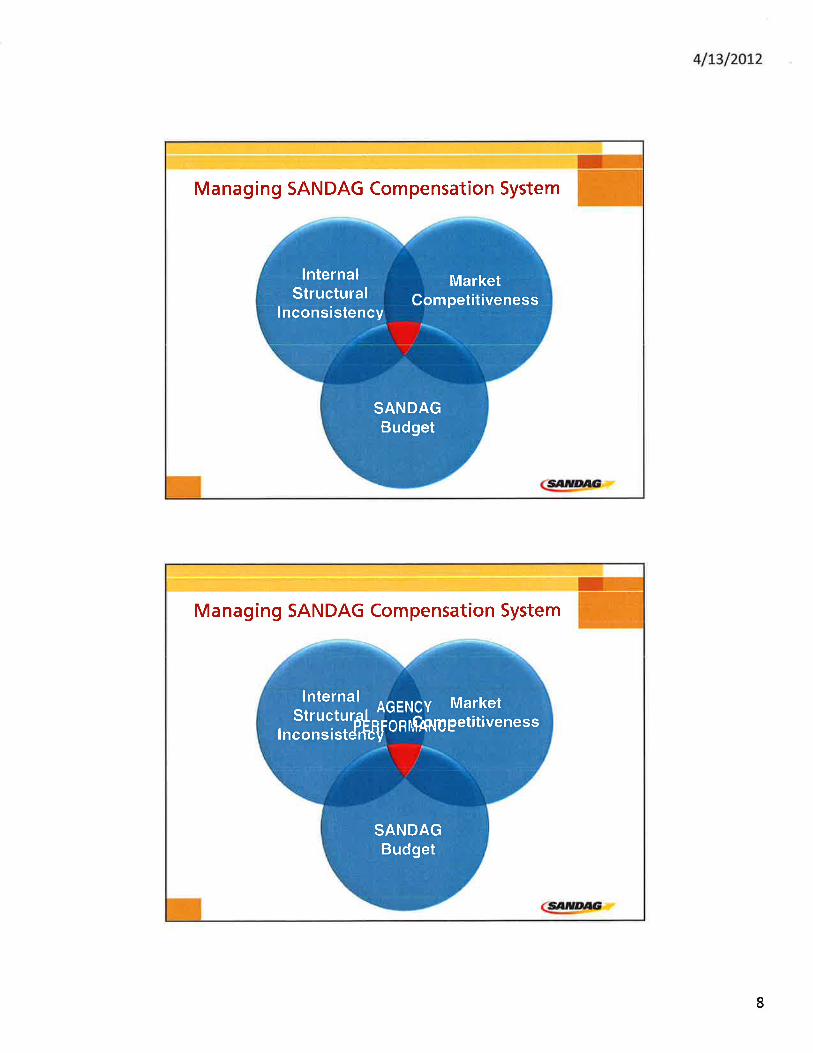
Compensation Program Annual Review and Maintenance
In preparing a recommendation for the FY 2013 salary budget, SANDAG conducted a review of its compensation program and pay for performance practices. The review focused on several areas - the internal equity and consistency of employee salaries, the alignment of the agency’s salary range structure to the market, the alignment of current employee salaries to market salary ranges, and options for rewarding employees for performance. This review revealed several structural issues and concerns.
1. Internal Pay Inconsistencies
When employee salaries are aligned properly to existing salary ranges, appropriate pay differences exist between managers and the employees they supervise, employees in different grades, and employees in the same pay grade with different levels of responsibility, qualifications, and performance. SANDAG’s review of current employee salaries to assess whether individual pay inconsistencies exist followed a systematic methodology that was based on the agency’s established classifications (minimum job requirements) and years of relevant experience in the current role, and assumed a level of at least satisfactory performance. These factors determine where in the salary range an individual’s base pay should reasonably be expected to fall.
The foundation of SANDAG’s compensation program relies on merit-based adjustments to move employees through their salary range versus scheduled increases within a salary band based on tenure. In previous years when a merit budget has been available, SANDAG’s senior executives have used a portion of the merit pool to make individual salary adjustments that maintain the internal integrity and fairness of employee compensation. Due to the absence of a merit budget the last three years, SANDAG has been unable to maintain its compensation and pay for performance programs and an unintended consequence of this action is that a significant number of employees are experiencing pay inconsistencies. Specific examples include:
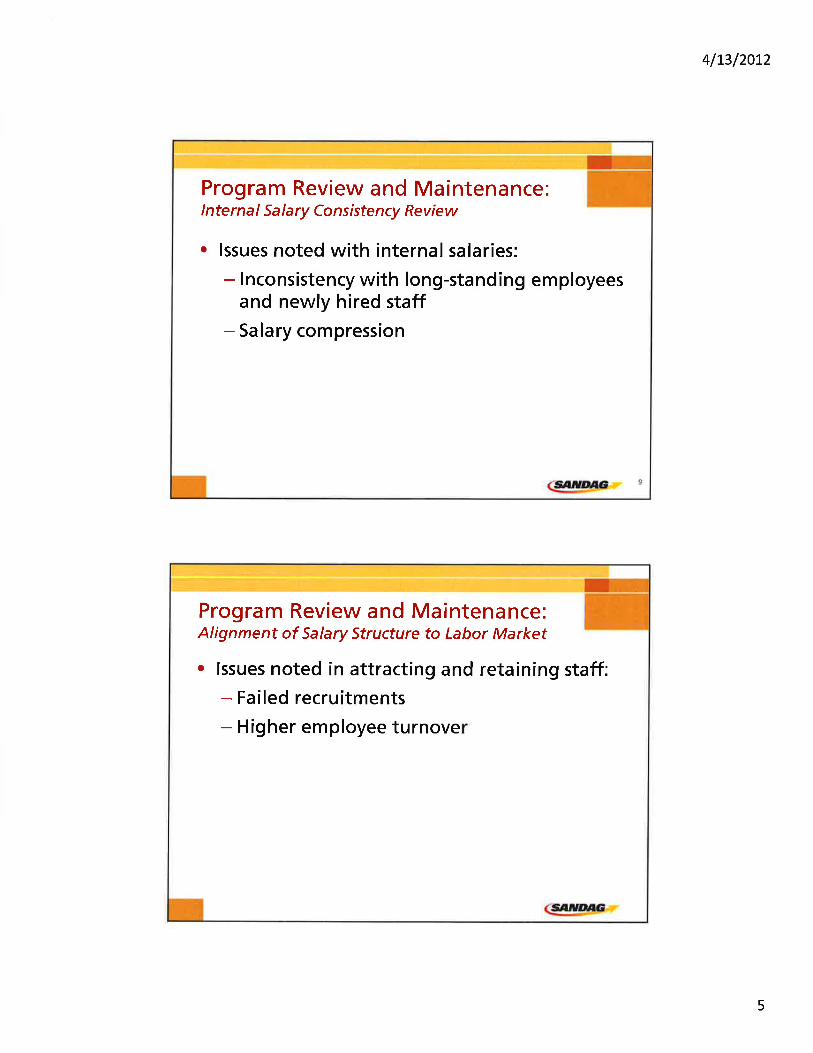
• Inequities among long-standing employees compared to the pay of newly hired staff. Twenty-four percent of new employees who joined SANDAG in FY 2011 were hired near the top of their salary range. This has increased to 36 percent of new employees in FY 2012 to date. Since new employees start at the market rate for their position, not necessarily at the bottom of the salary range, SANDAG is experiencing salary inequities between newly hired employees and those whose salaries have been frozen for three years.

4
• Several examples of salary compression were uncovered. This situation exists when employees at different position levels within a job family are earning almost the exact same pay. For example, SANDAG has managers who are earning only slightly more (less than 5%) than their direct reports. In addition it was noted that there are Associate level staff who currently receive a larger base salary than some Senior level staff.
2. Difficulty Attracting and Retaining Employees
SANDAG has recently experienced challenges with attracting and retaining employees as noted by the following examples:
• A number of failed recruitments have occurred in the past year due to the agency’s inability to offer an attractive salary because of internal equity concerns or because the agency did not receive applications from appropriately qualified candidates. Examples include recent recruitments for a Finance Manager, Contracts and Procurement Analyst, and several Programmer Analysts.
• An upward trend in employee turnover has been noted this year. Eight employees left SANDAG in FY 2011, and so far in FY 2012 (9 months) 16 employees have left the agency. Of particular note are the number of more senior employees who decided to leave (e.g. Department Director of Finance, Senior Programmer Analyst, Senior Information Systems Analyst, Marketing Manager, Senior Planner, Senior Systems Engineer, and Associate General Counsel).
In response to the issues and concerns noted above, the agency conducted a compensation study in February 2012 to help determine whether SANDAG’s salary structure was in alignment with the relevant labor market. A representative number of positions were benchmarked against 29 public agencies (member agencies and local and regional organizations with functions similar to SANDAG). See Attachment 4 for a list of these 29 agencies; see Attachment 5 SANDAG Compensation Study Draft Report February 2012. The study also compared positions to published survey data from both the private and public sectors.
The results of the study provided further insight into the overall compensation program review by highlighting the following:
• A majority of the current position salary ranges, which have been in place since July 2007, continue to be competitive in today’s labor market.
• When comparing the representative positions used in the study to those at the other 29 public sector agencies, SANDAG’s ranges are, on average, five percent (5%) lower. Since the last compensation study conducted in 2007, SANDAG’s representative position salaries have decreased by ten percent (10%) compared to other public sector agencies. In other words, in 2007, SANDAG’s representative position salaries were on average five percent (5%) above the public sector market and have since trended downward by ten percent (10%) through today.
5
• A total of 99 employees are found to be candidates for either a reclassification of pay range and/or a salary adjustment because their current salary is below the expected pay rate for their position and experience level. This illustrates the extent of inconsistencies that exist after three years of frozen salaries. In order to balance the structural inconsistencies of pay across the agency, it is estimated that up to $240,000 would be needed, representing approximately 1.2 percent of the projected salaries in the draft FY 2013 Budget.
Rewarding Employees for Performance
SANDAG’s “pay for performance” program relies on the ability to reward employees for outstanding performance. Determining the merit/bonus budget each year is generally based on staying competitive within the external market, and maintaining internal salary consistencies among employees, all within the context of overall budget capacity. Depending upon budget availability, merit increases and/or bonuses are the most common rewards given at the agency.
Conclusion
While the merit system has worked for SANDAG in the past, the fact that the system hasn’t been funded for the past three years has created significant inconsistencies among employee salaries and suggests that an equity adjustment would be in order to correct this situation. Ultimately, this adjustment would “reset” the pay for performance program and provide an equitable platform for future compensation decisions. In order to continue to achieve the goals of a merit based system, consideration should be given to some level of funding for a merit/bonus pool. For reference purposes, every 1 percent of a merit/bonus pool amounts to approximately $250,000.
GARY L. GALLEGOS Executive Director
Attachments: 1. SANDAG’s Competency Model and Competency Definitions 2. Training Schedule for Managers and Employees 3. Performance Evaluation Schedule 4. List of 29 Agencies in Compensation Study 5. SANDAG Compensation Study Draft Report February 2012 Key Staff Contacts: Laura Coté, (619) 699-6947, [email protected] Melissa Coffelt, (619) 699-1955, [email protected]

SANDAG 401 B Street, Suite 800 | San Diego, CA 92101-4231 | (619) 699-1900 | Fax: (619) 699-6905 | www.sandag.org
Executives Driving Organizational Agility
Managing Vision and Purpose
Strategic Planning
Managers and Project Managers Building Effective Teams
Courage
Decision Making (includes Problem Solving and Dealing with Ambiguity)
Effectiveness with Executives/Board (includes concepts from Political Savvy)
Managing and Developing Direct Reports and Others* (includes Motivating Others, Directing Others, Delegation)
Planning
All Staff Communication
(includes Listening, Presentation Skills)
Customer/Stakeholder Focus (includes concepts from Patience)
Drive for Results (includes Time Management, Priority Setting, Resilience)
Innovation
Learning Agility (includes Technical/Functional Skills)
Team Orientation (includes Approachability, Interpersonal Savvy)
FY 2012 performance evaluations Competency Model and Definitions
* Only for Managers and Project Managers who directly supervise one or more SANDAG employees.
6

All Staff
Communication
Clearly and effectively communicates with individuals and groups, inside and outside the organization, both orally (formal and
informal presentations) and in writing; practices attentive and active listening; is responsive to the various styles and needs of
the individuals/groups with which he/she is communicating; and can get messages across that have the desired effect.
Customer/Stakeholder Focus Is dedicated to meeting the expectations and requirements of internal and external customers/stakeholders; is tolerant with
people and processes; gets first-hand information and uses it for improvements in products and services; is sensitive to how
people and organizations function and acts with this in mind; and establishes and maintains effective relationships with
customers/stakeholders and gains their trust and respect.
Drive for Results
Can be counted on to exceed goals successfully; is action oriented and pursues everything with energy, drive, and a need to
finish; seldom gives up before finishing, especially in the face of resistance or setbacks; is constantly and consistently a top
performer; and steadfastly pushes self and others for results.
Innovation Comes up with new and unique ideas; challenges the status quo; supports change; tries and/or encourages new ways of doing
things; and solves problems creatively.
Learning Agility
Continues to develop functional and technical knowledge and skills to do the job at a high level of accomplishment; knows
personal strengths and weaknesses and is committed to and actively works to continuously improve him/herself; learns quickly
when facing new problems; gains insights from mistakes and is open to feedback; is a relentless and versatile learner; and enjoys
the challenge of unfamiliar tasks.
Team Orientation Works cooperatively with other team members, both inside and outside the agency, and contributes to group solutions through
constructive feedback, ideas, and suggestions; is easy to approach and talk to; spends the extra effort to put others at ease; can
be warm, pleasant, and gracious; builds rapport well and is a good listener; and displays a high level of effort and commitment
toward supporting the team.
7
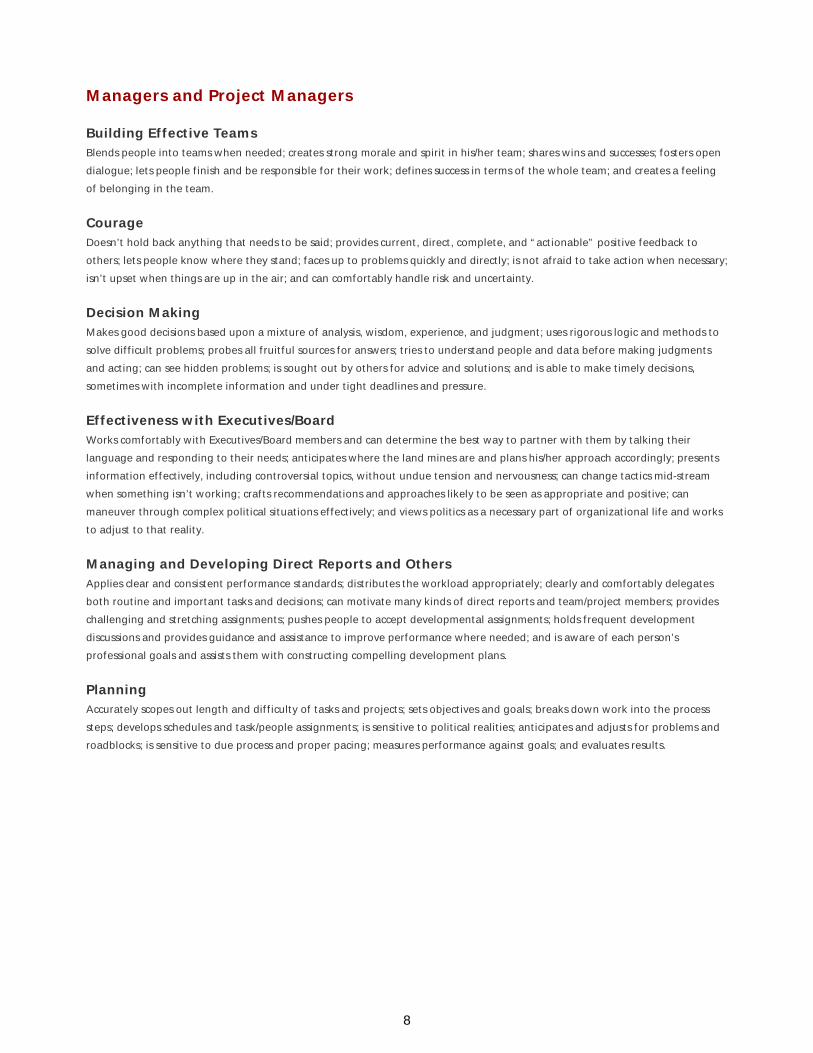
Managers and Project Managers
Building Effective Teams Blends people into teams when needed; creates strong morale and spirit in his/her team; shares wins and successes; fosters open
dialogue; lets people finish and be responsible for their work; defines success in terms of the whole team; and creates a feeling
of belonging in the team.
Courage Doesn’t hold back anything that needs to be said; provides current, direct, complete, and “actionable” positive feedback to
others; lets people know where they stand; faces up to problems quickly and directly; is not afraid to take action when necessary;
isn’t upset when things are up in the air; and can comfortably handle risk and uncertainty.
Decision Making Makes good decisions based upon a mixture of analysis, wisdom, experience, and judgment; uses rigorous logic and methods to
solve difficult problems; probes all fruitful sources for answers; tries to understand people and data before making judgments
and acting; can see hidden problems; is sought out by others for advice and solutions; and is able to make timely decisions,
sometimes with incomplete information and under tight deadlines and pressure.
Effectiveness with Executives/Board Works comfortably with Executives/Board members and can determine the best way to partner with them by talking their
language and responding to their needs; anticipates where the land mines are and plans his/her approach accordingly; presents
information effectively, including controversial topics, without undue tension and nervousness; can change tactics mid-stream
when something isn’t working; crafts recommendations and approaches likely to be seen as appropriate and positive; can
maneuver through complex political situations effectively; and views politics as a necessary part of organizational life and works
to adjust to that reality.
Managing and Developing Direct Reports and Others Applies clear and consistent performance standards; distributes the workload appropriately; clearly and comfortably delegates
both routine and important tasks and decisions; can motivate many kinds of direct reports and team/project members; provides
challenging and stretching assignments; pushes people to accept developmental assignments; holds frequent development
discussions and provides guidance and assistance to improve performance where needed; and is aware of each person’s
professional goals and assists them with constructing compelling development plans.
Planning
Accurately scopes out length and difficulty of tasks and projects; sets objectives and goals; breaks down work into the process
steps; develops schedules and task/people assignments; is sensitive to political realities; anticipates and adjusts for problems and
roadblocks; is sensitive to due process and proper pacing; measures performance against goals; and evaluates results.
8
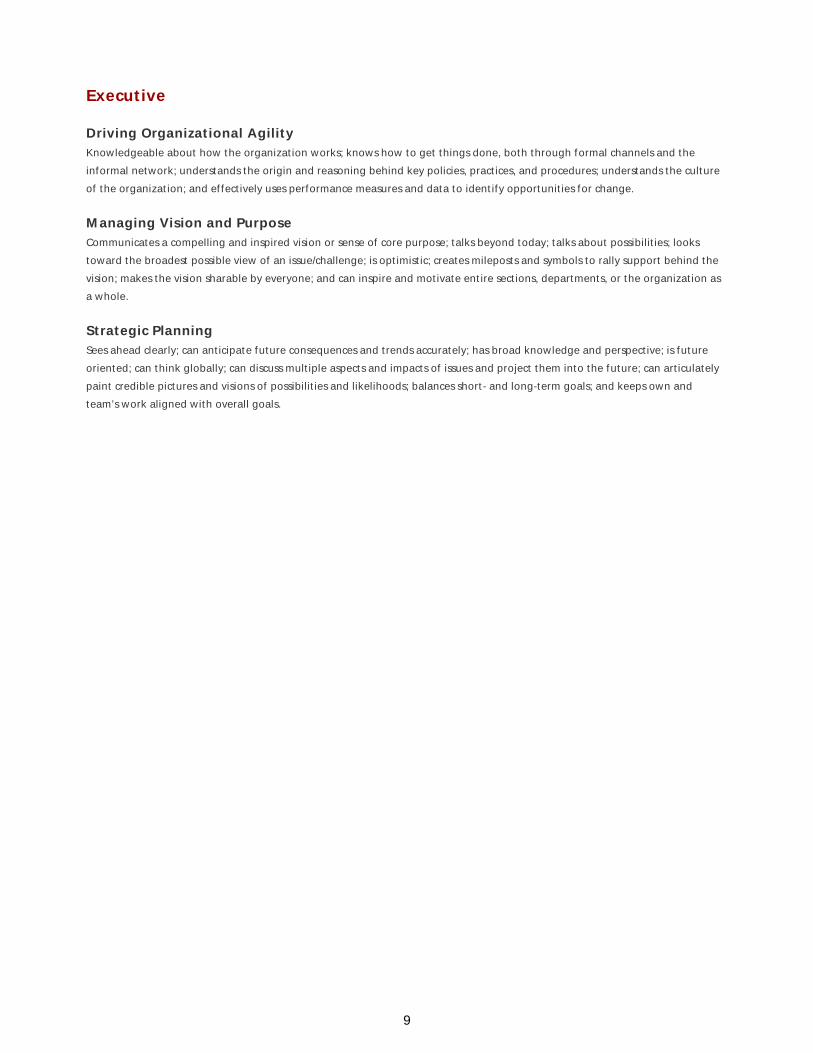
Executive
Driving Organizational Agility Knowledgeable about how the organization works; knows how to get things done, both through formal channels and the
informal network; understands the origin and reasoning behind key policies, practices, and procedures; understands the culture
of the organization; and effectively uses performance measures and data to identify opportunities for change.
Managing Vision and Purpose Communicates a compelling and inspired vision or sense of core purpose; talks beyond today; talks about possibilities; looks
toward the broadest possible view of an issue/challenge; is optimistic; creates mileposts and symbols to rally support behind the
vision; makes the vision sharable by everyone; and can inspire and motivate entire sections, departments, or the organization as
a whole.
Strategic Planning Sees ahead clearly; can anticipate future consequences and trends accurately; has broad knowledge and perspective; is future
oriented; can think globally; can discuss multiple aspects and impacts of issues and project them into the future; can articulately
paint credible pictures and visions of possibilities and likelihoods; balances short- and long-term goals; and keeps own and
team’s work aligned with overall goals.
9
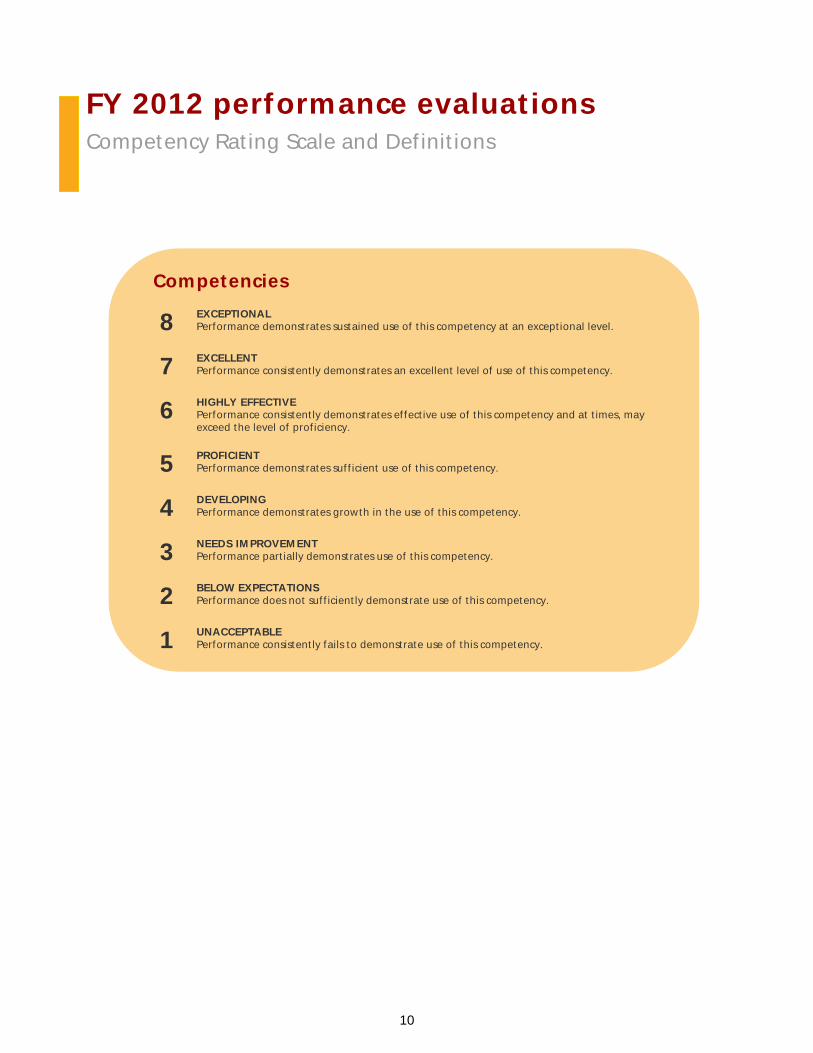
FY 2012 performance evaluations Competency Rating Scale and Definitions
Competencies
8 EXCEPTIONAL Performance demonstrates sustained use of this competency at an exceptional level.
7 EXCELLENT Performance consistently demonstrates an excellent level of use of this competency.
6 HIGHLY EFFECTIVE Performance consistently demonstrates effective use of this competency and at times, may exceed the level of proficiency.
5 PROFICIENT Performance demonstrates sufficient use of this competency.
4 DEVELOPING Performance demonstrates growth in the use of this competency.
3 NEEDS IMPROVEMENT Performance partially demonstrates use of this competency.
2 BELOW EXPECTATIONS Performance does not sufficiently demonstrate use of this competency.
1 UNACCEPTABLE Performance consistently fails to demonstrate use of this competency.
10

8 EXCEPTIONAL Performance demonstrates a sustained use of this competency at an exceptional level.
Work is consistently performed in a manner that exemplifies this competency; the employee represents one of the
very best examples of this competency and is seldom matched by others.
Professional development is a top priority; the employee shows an eagerness to make sacrifices for development
opportunities and proactively seeks out tough assignments that will stretch their comfort zone.
Career development plans are thoroughly crafted and lay out specific steps to address each development goal; the
employee works on development areas with maturity and balance.
Feedback on performance is proactively sought from a broad range of managers, co-workers, and customers; the
employee learns from the feedback received and is so self aware they also can readily learn from mistakes without
direct feedback.
7 EXCELLENT Performance consistently demonstrates an excellent level of use of this competency.
Work consistently includes a high level of application of this competency; the employee almost always exceeds the
competency criteria required for successful performance and is widely known for their effectiveness.
Professional development is a high priority; the employee demonstrates flexibility in pursuing development
opportunities and is willing to take on tough assignments to get the skills and experience needed for the future.
A career development plan is in place and contains specific milestones; the employee frequently follows through
on development activities.
Feedback from managers, co-workers, and customers is requested; the employee learns well from coaching, takes
action on improvement suggestions, and requires little to no direction to continue development activities.
6 HIGHLY EFFECTIVE
Performance consistently demonstrates effective use of this competency and at times, may exceed the
level of proficiency.
The completion of projects and tasks illustrates a highly effective use of this competency; the employee may
exceed the competency criteria required for successful performance.
Professional development is important; the employee is motivated to develop skills and experience and
enthusiastically participates when given new opportunities.
A career development plan exists and it contains clear actions and performance milestones; the employee uses the
plan to help guide their performance improvement activities.
Feedback about self development is welcomed and suggestions for improvement are incorporated into the plan;
the employee is aware of development needs and takes steps to leverage strengths and overcome weaknesses.
5 PROFICIENT Performance demonstrates sufficient use of this competency.
Work assignments are completed with an acceptable use of this competency; the employee may reach further
levels of success by continuing to improve in this area.
Professional development is somewhat important; the employee is aware that some developmental needs exist
and is eager to learn new skills when guided toward opportunities.
A development plan has been created that contains personal improvement goals; the employee may require
assistance from their supervisor/manager to identify developmental activities but once incorporated into the plan,
the employee follows through.
Feedback on performance is well received and most suggestions for improvement are acted on; the employee
relies on regular guidance from their supervisor/manager for the ongoing development of this competency.
11
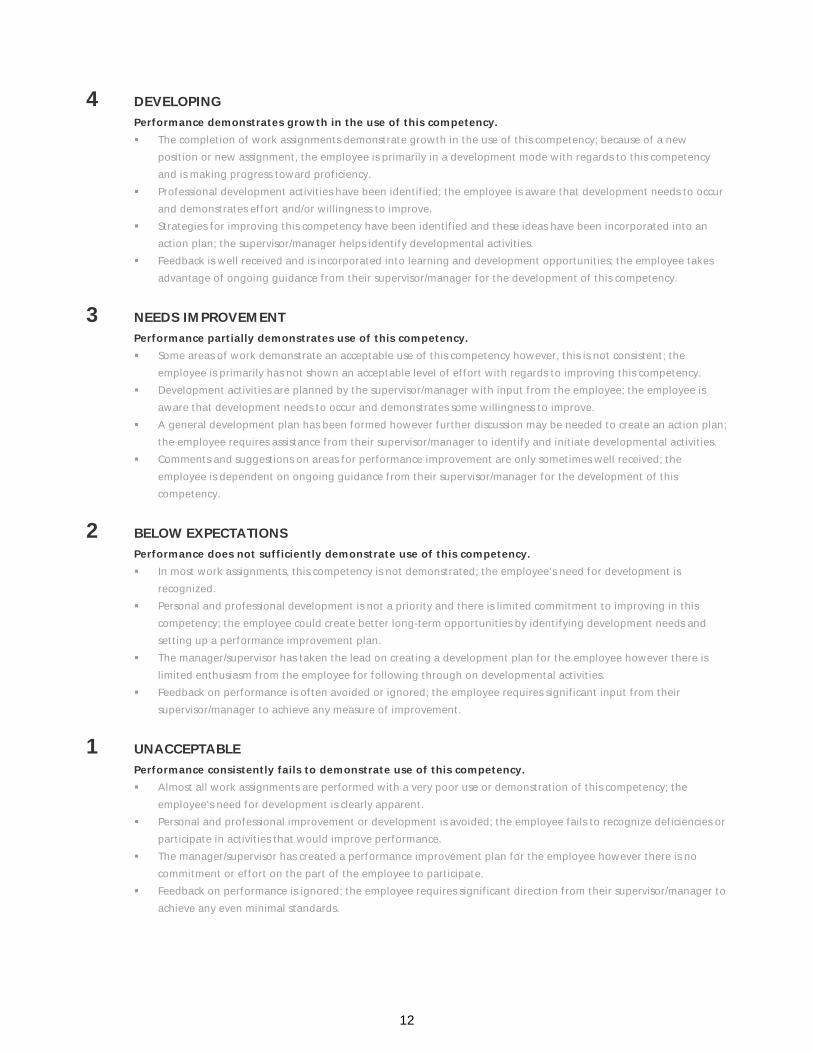
4 DEVELOPING Performance demonstrates growth in the use of this competency.
The completion of work assignments demonstrate growth in the use of this competency; because of a new
position or new assignment, the employee is primarily in a development mode with regards to this competency
and is making progress toward proficiency.
Professional development activities have been identified; the employee is aware that development needs to occur
and demonstrates effort and/or willingness to improve.
Strategies for improving this competency have been identified and these ideas have been incorporated into an
action plan; the supervisor/manager helps identify developmental activities.
Feedback is well received and is incorporated into learning and development opportunities; the employee takes
advantage of ongoing guidance from their supervisor/manager for the development of this competency.
3 NEEDS IMPROVEMENT Performance partially demonstrates use of this competency.
Some areas of work demonstrate an acceptable use of this competency however, this is not consistent; the
employee is primarily has not shown an acceptable level of effort with regards to improving this competency.
Development activities are planned by the supervisor/manager with input from the employee; the employee is
aware that development needs to occur and demonstrates some willingness to improve.
A general development plan has been formed however further discussion may be needed to create an action plan;
the employee requires assistance from their supervisor/manager to identify and initiate developmental activities.
Comments and suggestions on areas for performance improvement are only sometimes well received; the
employee is dependent on ongoing guidance from their supervisor/manager for the development of this
competency.
2 BELOW EXPECTATIONS Performance does not sufficiently demonstrate use of this competency.
In most work assignments, this competency is not demonstrated; the employee’s need for development is
recognized.
Personal and professional development is not a priority and there is limited commitment to improving in this
competency; the employee could create better long-term opportunities by identifying development needs and
setting up a performance improvement plan.
The manager/supervisor has taken the lead on creating a development plan for the employee however there is
limited enthusiasm from the employee for following through on developmental activities.
Feedback on performance is often avoided or ignored; the employee requires significant input from their
supervisor/manager to achieve any measure of improvement.
1 UNACCEPTABLE Performance consistently fails to demonstrate use of this competency.
Almost all work assignments are performed with a very poor use or demonstration of this competency; the
employee’s need for development is clearly apparent.
Personal and professional improvement or development is avoided; the employee fails to recognize deficiencies or
participate in activities that would improve performance.
The manager/supervisor has created a performance improvement plan for the employee however there is no
commitment or effort on the part of the employee to participate.
Feedback on performance is ignored; the employee requires significant direction from their supervisor/manager to
achieve any even minimal standards.
12

FY 2012 performance evaluations Performance Goals Rating Scale and Definitions
Goals
4 EXCEEDS EXPECTATIONS Performance consistently exceeds expectations in all primary areas of responsibility.
3 MEETS EXPECTATIONS Performance meets expectations in all primary areas of responsibility.
2 NEEDS IMPROVEMENT Performance does not consistently meet expectations in all primary areas of responsibility.
1 UNACCEPTABLE Performance fails to meet minimum position requirements.
13
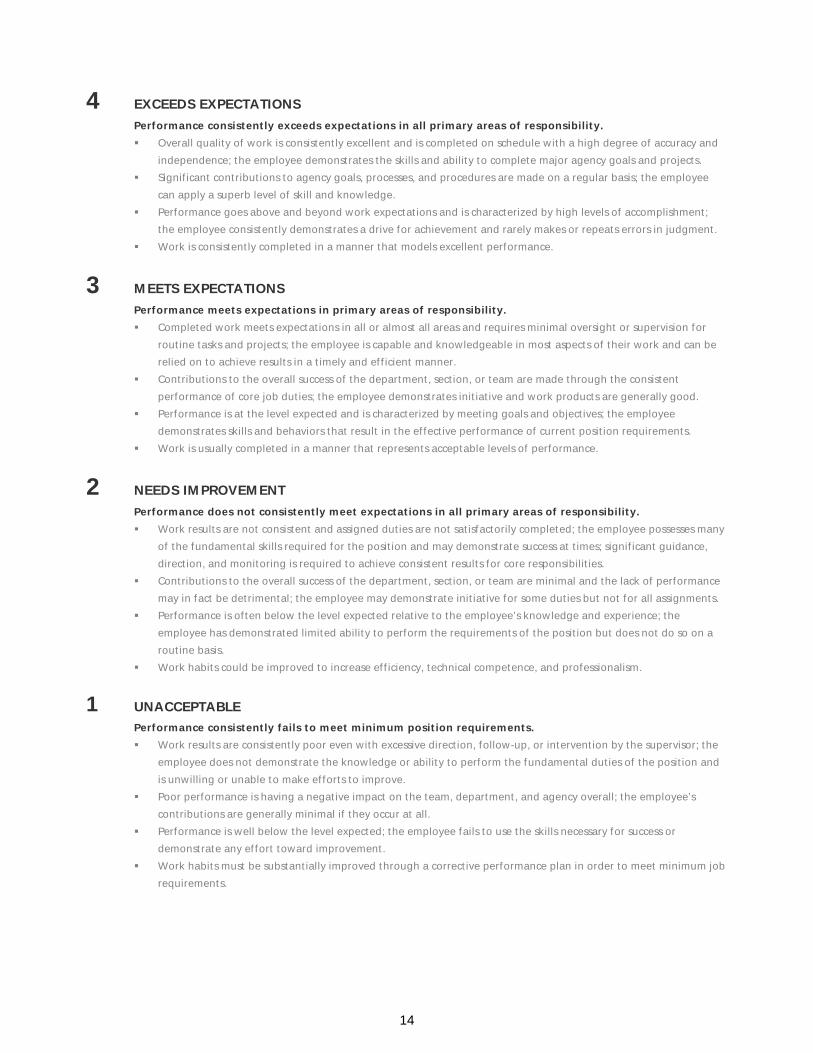
4 EXCEEDS EXPECTATIONS
Performance consistently exceeds expectations in all primary areas of responsibility.
Overall quality of work is consistently excellent and is completed on schedule with a high degree of accuracy and
independence; the employee demonstrates the skills and ability to complete major agency goals and projects.
Significant contributions to agency goals, processes, and procedures are made on a regular basis; the employee
can apply a superb level of skill and knowledge.
Performance goes above and beyond work expectations and is characterized by high levels of accomplishment;
the employee consistently demonstrates a drive for achievement and rarely makes or repeats errors in judgment.
Work is consistently completed in a manner that models excellent performance.
3 MEETS EXPECTATIONS
Performance meets expectations in primary areas of responsibility.
Completed work meets expectations in all or almost all areas and requires minimal oversight or supervision for
routine tasks and projects; the employee is capable and knowledgeable in most aspects of their work and can be
relied on to achieve results in a timely and efficient manner.
Contributions to the overall success of the department, section, or team are made through the consistent
performance of core job duties; the employee demonstrates initiative and work products are generally good.
Performance is at the level expected and is characterized by meeting goals and objectives; the employee
demonstrates skills and behaviors that result in the effective performance of current position requirements.
Work is usually completed in a manner that represents acceptable levels of performance.
2 NEEDS IMPROVEMENT
Performance does not consistently meet expectations in all primary areas of responsibility.
Work results are not consistent and assigned duties are not satisfactorily completed; the employee possesses many
of the fundamental skills required for the position and may demonstrate success at times; significant guidance,
direction, and monitoring is required to achieve consistent results for core responsibilities.
Contributions to the overall success of the department, section, or team are minimal and the lack of performance
may in fact be detrimental; the employee may demonstrate initiative for some duties but not for all assignments.
Performance is often below the level expected relative to the employee’s knowledge and experience; the
employee has demonstrated limited ability to perform the requirements of the position but does not do so on a
routine basis.
Work habits could be improved to increase efficiency, technical competence, and professionalism.
1 UNACCEPTABLE Performance consistently fails to meet minimum position requirements.
Work results are consistently poor even with excessive direction, follow-up, or intervention by the supervisor; the
employee does not demonstrate the knowledge or ability to perform the fundamental duties of the position and
is unwilling or unable to make efforts to improve.
Poor performance is having a negative impact on the team, department, and agency overall; the employee’s
contributions are generally minimal if they occur at all.
Performance is well below the level expected; the employee fails to use the skills necessary for success or
demonstrate any effort toward improvement.
Work habits must be substantially improved through a corrective performance plan in order to meet minimum job
requirements.
14
SANDAG 401 B Street, Suite 800 | San Diego, CA 92101-4231 | (619) 699-1900 | Fax: (619) 699-6905 | www.sandag.org
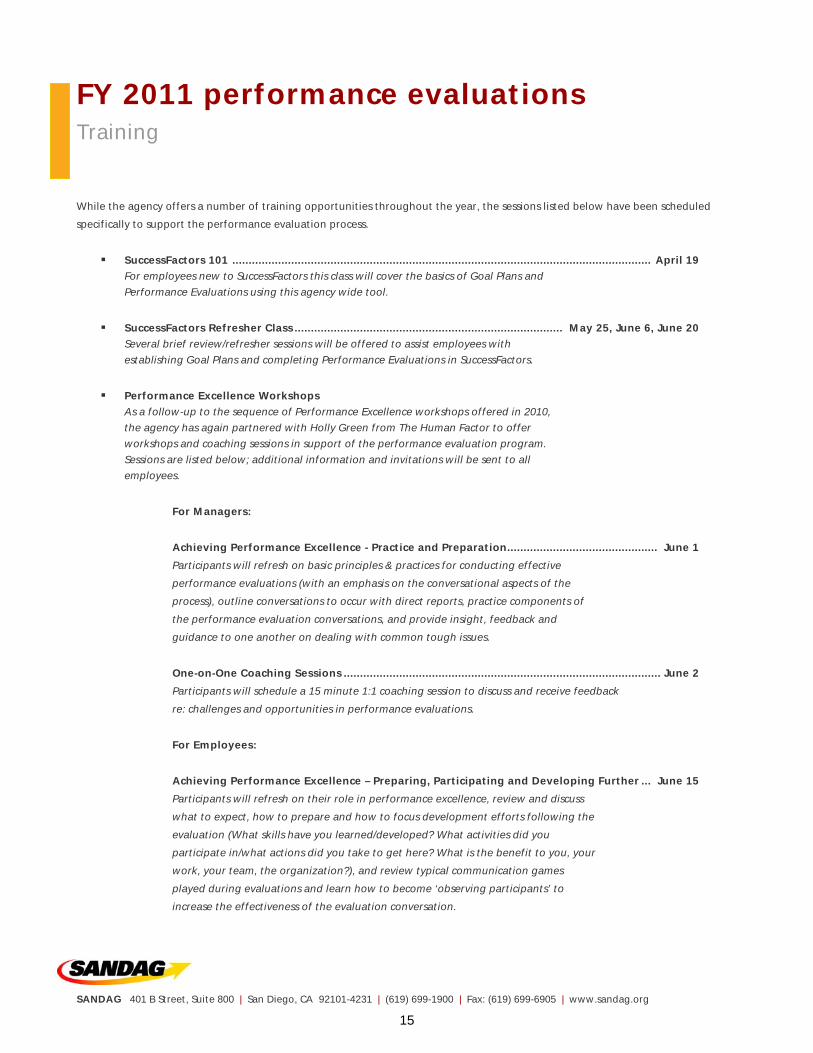
FY 2011 performance evaluations Training
While the agency offers a number of training opportunities throughout the year, the sessions listed below have been scheduled
specifically to support the performance evaluation process.
SuccessFactors 101 ................................................................................................................................ April 19 For employees new to SuccessFactors this class will cover the basics of Goal Plans and
Performance Evaluations using this agency wide tool.
SuccessFactors Refresher Class .................................................................................. May 25, June 6, June 20 Several brief review/refresher sessions will be offered to assist employees with
establishing Goal Plans and completing Performance Evaluations in SuccessFactors.
Performance Excellence Workshops As a follow-up to the sequence of Performance Excellence workshops offered in 2010,
the agency has again partnered with Holly Green from The Human Factor to offer
workshops and coaching sessions in support of the performance evaluation program.
Sessions are listed below; additional information and invitations will be sent to all
employees.
For Managers:
Achieving Performance Excellence - Practice and Preparation .............................................. June 1
Participants will refresh on basic principles & practices for conducting effective
performance evaluations (with an emphasis on the conversational aspects of the
process), outline conversations to occur with direct reports, practice components of
the performance evaluation conversations, and provide insight, feedback and
guidance to one another on dealing with common tough issues.
One-on-One Coaching Sessions ................................................................................................. June 2
Participants will schedule a 15 minute 1:1 coaching session to discuss and receive feedback
re: challenges and opportunities in performance evaluations.
For Employees:
Achieving Performance Excellence – Preparing, Participating and Developing Further ... June 15
Participants will refresh on their role in performance excellence, review and discuss
what to expect, how to prepare and how to focus development efforts following the
evaluation (What skills have you learned/developed? What activities did you
participate in/what actions did you take to get here? What is the benefit to you, your
work, your team, the organization?), and review typical communication games
played during evaluations and learn how to become ‘observing participants’ to
increase the effectiveness of the evaluation conversation.
15
SANDAG 401 B Street, Suite 800 | San Diego, CA 92101-4231 | (619) 699-1900 | Fax: (619) 699-6905 | www.sandag.org
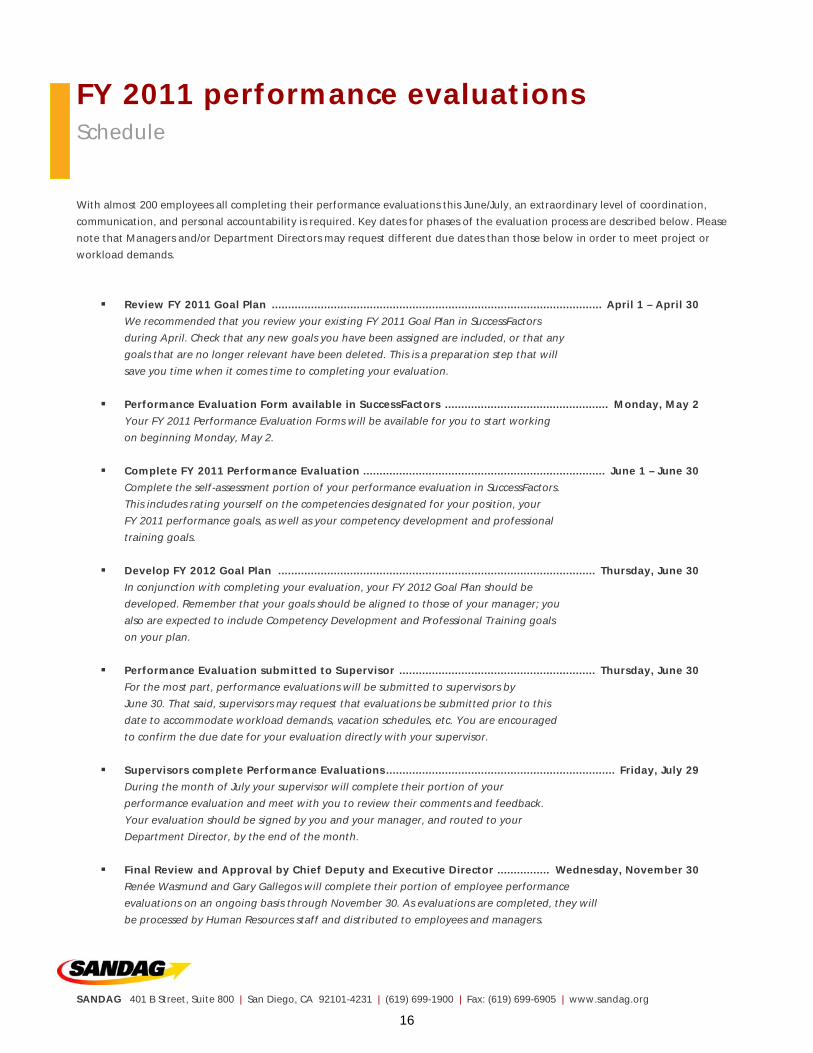
FY 2011 performance evaluations Schedule
With almost 200 employees all completing their performance evaluations this June/July, an extraordinary level of coordination,
communication, and personal accountability is required. Key dates for phases of the evaluation process are described below. Please
note that Managers and/or Department Directors may request different due dates than those below in order to meet project or
workload demands.
Review FY 2011 Goal Plan ..................................................................................................... April 1 – April 30
We recommended that you review your existing FY 2011 Goal Plan in SuccessFactors
during April. Check that any new goals you have been assigned are included, or that any
goals that are no longer relevant have been deleted. This is a preparation step that will
save you time when it comes time to completing your evaluation.
Performance Evaluation Form available in SuccessFactors .................................................. Monday, May 2
Your FY 2011 Performance Evaluation Forms will be available for you to start working
on beginning Monday, May 2.
Complete FY 2011 Performance Evaluation .......................................................................... June 1 – June 30
Complete the self-assessment portion of your performance evaluation in SuccessFactors.
This includes rating yourself on the competencies designated for your position, your
FY 2011 performance goals, as well as your competency development and professional
training goals.
Develop FY 2012 Goal Plan ................................................................................................. Thursday, June 30
In conjunction with completing your evaluation, your FY 2012 Goal Plan should be
developed. Remember that your goals should be aligned to those of your manager; you
also are expected to include Competency Development and Professional Training goals
on your plan.
Performance Evaluation submitted to Supervisor ............................................................ Thursday, June 30
For the most part, performance evaluations will be submitted to supervisors by
June 30. That said, supervisors may request that evaluations be submitted prior to this
date to accommodate workload demands, vacation schedules, etc. You are encouraged
to confirm the due date for your evaluation directly with your supervisor.
Supervisors complete Performance Evaluations ...................................................................... Friday, July 29
During the month of July your supervisor will complete their portion of your
performance evaluation and meet with you to review their comments and feedback.
Your evaluation should be signed by you and your manager, and routed to your
Department Director, by the end of the month.
Final Review and Approval by Chief Deputy and Executive Director ................ Wednesday, November 30
Renée Wasmund and Gary Gallegos will complete their portion of employee performance
evaluations on an ongoing basis through November 30. As evaluations are completed, they will
be processed by Human Resources staff and distributed to employees and managers.
16

FY 2012 Custom Survey Participants
Organization
Returned Data
City of Carlsbad YES
City of Chula Vista YES
City of Coronado YES
City of Del Mar YES
City of Escondido YES
City of La Mesa YES
City of Lemon Grove YES
City of National City YES
City of Oceanside YES
City of Poway YES
City of San Diego YES
City of San Marcos YES
City of Santee YES
City of Solana Beach YES
County of San Diego* YES
Denver Regional Council of Governments YES
Los Angeles County Metropolitan Transportation Authority (Metro) YES
Maricopa Associations of Governments YES
Metropolitan Transit System (MTS) YES
Metropolitan Transportation Commission (MTC) YES
North County Transit District (NCTD) YES
Orange County Transportation Authority (OCTA) YES
Pima Association of Governments YES
Puget Sound Regional Council YES
Riverside County Transportation Commission (RCTC) YES
Sacramento Area Council of Governments (SACOG) YES
San Diego County Regional Airport Authority YES
San Diego County Water Authority YES
Southern California Association of Governments (SCAG) YES
Association of Bay Area of Governments (ABAG) NO
California Department of Transportation (Caltrans) NO
City of EI Cajon NO
City of Encinitas NO
City of Imperial Beach NO
City of Vista NO
Port of San Diego NO
Portland Oregon Metro NO
*Provided salary range data only.
17
SANDAG
Compensation Study
Draft Report
February 2012
Prepared by:
The Epler Company
San Diego, CA 92101
18

G:\cp\SANDAG\2012 Study\Exhibits-Board Packet\Total Rewards Custom Market-exh 1c.doc
SANDAG
TOTAL REWARDS PHILOSOPHY CUSTOM MARKET
February 2012
Organization
Association of Bay Area of Governments (ABAG)
California Department of Transportation (Caltrans)
City of Carlsbad
City of Chula Vista
City of Coronado
City of Del Mar
City of El Cajon
City of Encinitas
City of Escondido
City of Imperial Beach
City of La Mesa
City of Lemon Grove
City of National City
City of Oceanside
City of Poway
City of San Diego
City of San Marcos
City of Santee
City of Solana Beach
City of Vista
County of San Diego
Denver Regional Council of Governments
Los Angeles County Metropolitan Transportation Authority (Metro)
Maricopa Associations of Governments
Metropolitan Transit System (MTS)
Metropolitan Transportation Commission (MTC)
North County Transit District (NCTD)
Orange County Transportation Authority (OCTA)
Pima Association of Governments
Port of San Diego
Portland Oregon Metro
Puget Sound Regional Council
Riverside County Transportation Commission (RCTC)
Sacramento Area Council of Governments (SACOG)
San Diego County Regional Airport Authority
San Diego County Water Authority
Southern California Association of Governments (SCAG)
19
SANDAG
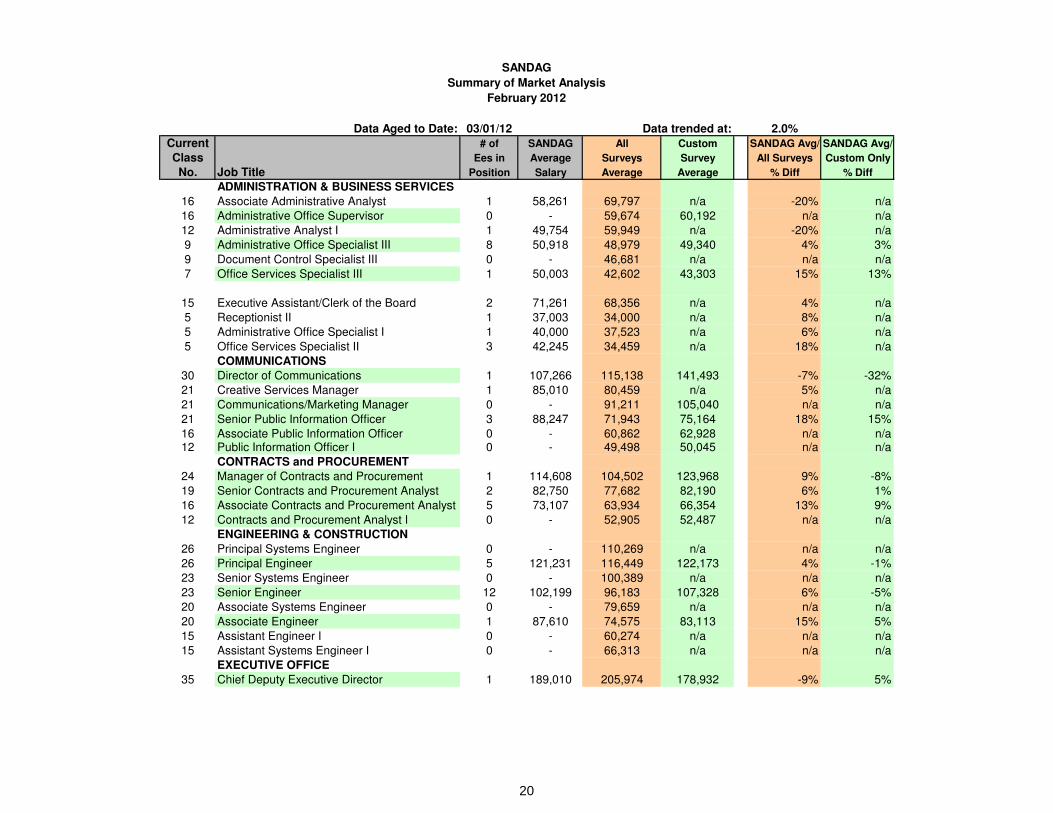
Summary of Market Analysis
February 2012
Data Aged to Date: 03/01/12 Data trended at: 2.0%
Current # of SANDAG All Custom SANDAG Avg/ SANDAG Avg/
Class Ees in Average Surveys Survey All Surveys Custom Only
No. Job Title Position Salary Average Average % Diff % Diff
ADMINISTRATION & BUSINESS SERVICES
16 Associate Administrative Analyst 1 58,261 69,797 n/a -20% n/a
16 Administrative Office Supervisor 0 - 59,674 60,192 n/a n/a
12 Administrative Analyst I 1 49,754 59,949 n/a -20% n/a
9 Administrative Office Specialist III 8 50,918 48,979 49,340 4% 3%
9 Document Control Specialist III 0 - 46,681 n/a n/a n/a
7 Office Services Specialist III 1 50,003 42,602 43,303 15% 13%
15 Executive Assistant/Clerk of the Board 2 71,261 68,356 n/a 4% n/a
5 Receptionist II 1 37,003 34,000 n/a 8% n/a
5 Administrative Office Specialist I 1 40,000 37,523 n/a 6% n/a
5 Office Services Specialist II 3 42,245 34,459 n/a 18% n/a
COMMUNICATIONS
30 Director of Communications 1 107,266 115,138 141,493 -7% -32%
21 Creative Services Manager 1 85,010 80,459 n/a 5% n/a
21 Communications/Marketing Manager 0 - 91,211 105,040 n/a n/a
21 Senior Public Information Officer 3 88,247 71,943 75,164 18% 15%
16 Associate Public Information Officer 0 - 60,862 62,928 n/a n/a12 Public Information Officer I 0 - 49,498 50,045 n/a n/a
CONTRACTS and PROCUREMENT
24 Manager of Contracts and Procurement 1 114,608 104,502 123,968 9% -8%
19 Senior Contracts and Procurement Analyst 2 82,750 77,682 82,190 6% 1%
16 Associate Contracts and Procurement Analyst 5 73,107 63,934 66,354 13% 9%
12 Contracts and Procurement Analyst I 0 - 52,905 52,487 n/a n/a
ENGINEERING & CONSTRUCTION
26 Principal Systems Engineer 0 - 110,269 n/a n/a n/a
26 Principal Engineer 5 121,231 116,449 122,173 4% -1%
23 Senior Systems Engineer 0 - 100,389 n/a n/a n/a
23 Senior Engineer 12 102,199 96,183 107,328 6% -5%
20 Associate Systems Engineer 0 - 79,659 n/a n/a n/a
20 Associate Engineer 1 87,610 74,575 83,113 15% 5%
15 Assistant Engineer I 0 - 60,274 n/a n/a n/a
15 Assistant Systems Engineer I 0 - 66,313 n/a n/a n/a
EXECUTIVE OFFICE
35 Chief Deputy Executive Director 1 189,010 205,974 178,932 -9% 5%
20
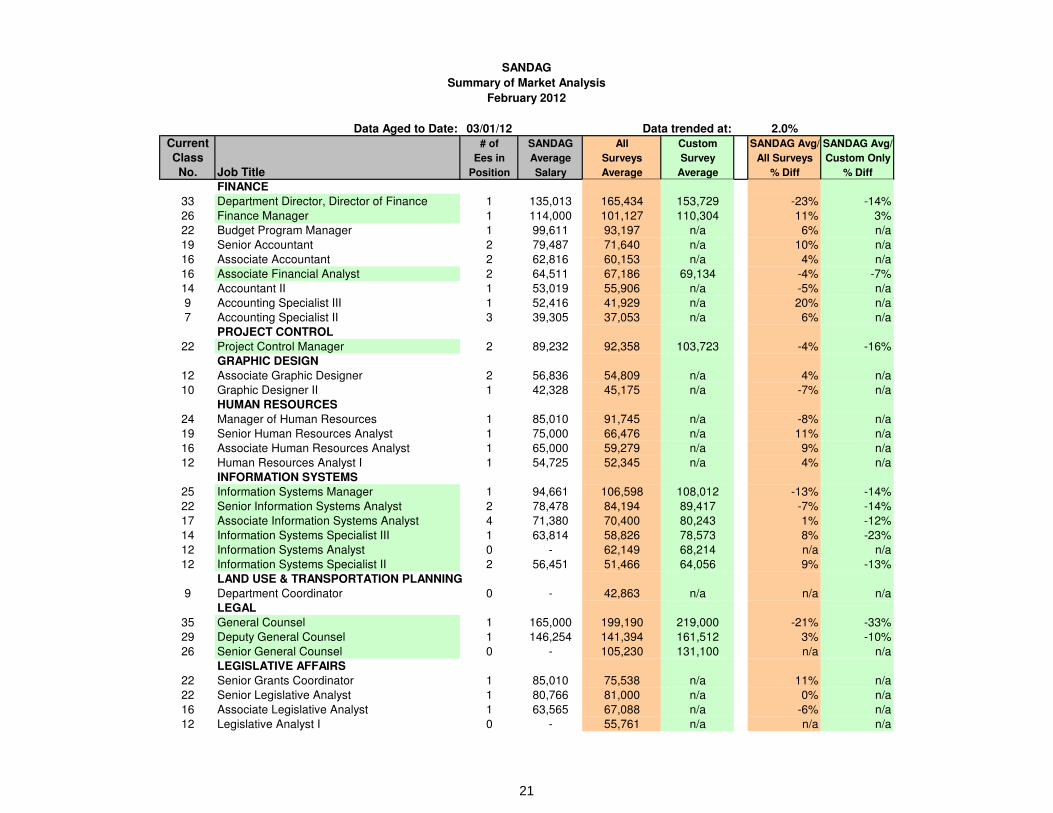
SANDAG
Summary of Market Analysis
February 2012
Data Aged to Date: 03/01/12 Data trended at: 2.0%
Current # of SANDAG All Custom SANDAG Avg/ SANDAG Avg/
Class Ees in Average Surveys Survey All Surveys Custom Only
No. Job Title Position Salary Average Average % Diff % Diff
FINANCE
33 Department Director, Director of Finance 1 135,013 165,434 153,729 -23% -14%
26 Finance Manager 1 114,000 101,127 110,304 11% 3%
22 Budget Program Manager 1 99,611 93,197 n/a 6% n/a
19 Senior Accountant 2 79,487 71,640 n/a 10% n/a
16 Associate Accountant 2 62,816 60,153 n/a 4% n/a
16 Associate Financial Analyst 2 64,511 67,186 69,134 -4% -7%
14 Accountant II 1 53,019 55,906 n/a -5% n/a
9 Accounting Specialist III 1 52,416 41,929 n/a 20% n/a
7 Accounting Specialist II 3 39,305 37,053 n/a 6% n/a
PROJECT CONTROL
22 Project Control Manager 2 89,232 92,358 103,723 -4% -16%
GRAPHIC DESIGN
12 Associate Graphic Designer 2 56,836 54,809 n/a 4% n/a
10 Graphic Designer II 1 42,328 45,175 n/a -7% n/a
HUMAN RESOURCES
24 Manager of Human Resources 1 85,010 91,745 n/a -8% n/a
19 Senior Human Resources Analyst 1 75,000 66,476 n/a 11% n/a
16 Associate Human Resources Analyst 1 65,000 59,279 n/a 9% n/a
12 Human Resources Analyst I 1 54,725 52,345 n/a 4% n/a
INFORMATION SYSTEMS
25 Information Systems Manager 1 94,661 106,598 108,012 -13% -14%
22 Senior Information Systems Analyst 2 78,478 84,194 89,417 -7% -14%
17 Associate Information Systems Analyst 4 71,380 70,400 80,243 1% -12%
14 Information Systems Specialist III 1 63,814 58,826 78,573 8% -23%
12 Information Systems Analyst 0 - 62,149 68,214 n/a n/a
12 Information Systems Specialist II 2 56,451 51,466 64,056 9% -13%
LAND USE & TRANSPORTATION PLANNING
9 Department Coordinator 0 - 42,863 n/a n/a n/a
LEGAL
35 General Counsel 1 165,000 199,190 219,000 -21% -33%
29 Deputy General Counsel 1 146,254 141,394 161,512 3% -10%
26 Senior General Counsel 0 - 105,230 131,100 n/a n/a
LEGISLATIVE AFFAIRS
22 Senior Grants Coordinator 1 85,010 75,538 n/a 11% n/a
22 Senior Legislative Analyst 1 80,766 81,000 n/a 0% n/a
16 Associate Legislative Analyst 1 63,565 67,088 n/a -6% n/a
12 Legislative Analyst I 0 - 55,761 n/a n/a n/a
21

SANDAG
Summary of Market Analysis
February 2012
Data Aged to Date: 03/01/12 Data trended at: 2.0%
Current # of SANDAG All Custom SANDAG Avg/ SANDAG Avg/
Class Ees in Average Surveys Survey All Surveys Custom Only
No. Job Title Position Salary Average Average % Diff % Diff
MARKETING
19 Senior Marketing Analyst 0 - 66,358 n/a n/a n/a
16 Associate Marketing Analyst 1 65,520 57,227 n/a 13% n/a
12 Marketing Analyst I 0 - 49,389 n/a n/a n/a
5 Customer Service Representative II 1 34,778 35,616 n/a -2% n/a
PLANNING
25 Principal Regional Planner 6 117,069 94,520 101,698 19% 13%
22 Senior Regional Planner 19 87,944 77,380 86,649 12% 1%
16 Associate Regional Planner 13 63,914 64,881 72,780 -2% -14%
12 Regional Planner I 4 42,016 52,675 55,765 -25% -33%
RESEARCH
25 Principal Research Analyst 2 101,764 104,852 118,632 -3% -17%
22 Senior Research Analyst 7 81,958 81,356 87,330 1% -7%
16 Associate Research Analyst 6 68,300 68,845 74,633 -1% -9%
12 Research Analyst I 4 42,666 52,099 59,062 -22% -38%
SMALL BUSINESS DEVELOPMENT
24 Manager of Small Business Development 0 - 96,689 95,813 n/a n/a
SOFTWARE DEVELOPMENT
22 Senior Programmer Analyst 2 93,469 88,191 n/a 6% n/a
17 Associate Programmer Analyst 2 73,278 73,167 n/a 0% n/a
12 Programmer Analyst I 0 - 62,266 n/a n/a n/a
TECHNOLOGY PROGRAMS
25 Principal Technology Program Manager 2 116,594 105,537 103,770 9% 11%
22 Senior Technology Program Analyst 2 92,009 82,670 83,324 10% 9%
16 Project Coordinator 2 68,318 60,975 n/a 11% n/a
TRANSNET PROJECT OFFICE
23 Senior Project Scheduler 1 108,014 92,468 n/a 14% n/a
11 Project Scheduler 1 55,016 57,010 n/a -4% n/a
TRANSPORTATION MODELING
22 Senior Transportation Modeler 3 87,305 94,584 94,584 -8% -8%
16 Associate Transportation Modeler 4 64,282 70,421 70,421 -10% -10%
12 Transportation Modeler I 0 - 49,537 49,537 n/a n/a
Included in Custom Survey
Survey 1
2011 San Diego Salary & Benefits Survey. Data effective April 1, 2011, aged to March 1, 2012.
San Diego general industry, 95 organizations (public, private, non-profit). Used all organization breakout unless otherwise noted.
Survey 2
2012 Economic Research Institute
National database, used San Diego data, all general industries breakout. Current database, used planning date of March 1, 2012.
22

SANDAG
Summary of Market Analysis
February 2012
Data Aged to Date: 03/01/12 Data trended at: 2.0%
Current # of SANDAG All Custom SANDAG Avg/ SANDAG Avg/
Class Ees in Average Surveys Survey All Surveys Custom Only
No. Job Title Position Salary Average Average % Diff % Diff
Survey 3
2012 Economic Research Institute
National database, used San Diego data, government (public) breakout. Current database, used planning date of March 1, 2012.
Survey 4
2012 Custom Salary Survey Sponsored by SANDAG
The following 29 organizations participated in the custom salary survey:
City of Carlsbad
City of Chula Vista
City of Coronado
City of Del Mar
City of Escondido
City of La Mesa
City of Lemon Grove
City of National City
City of Oceanside
City of Poway
City of San Diego
City of San Marcos
City of Santee
City of Solana Beach
County of San Diego*
Denver Regional Council of Governments
Los Angeles County Metropolitan Trans
Authority (Metro)
Maricopa Associations of Governments
Metropolitan Transit System (MTS)
Metropolitan Transportation Commission
North County Transit District (NCTD)
Orange County Transportation Authority
(OCTA)
Pima Associaton of Governments
Puget Sound Regional Council
Riverside County Transportation Commission
(RCTC)
Sacramento Area Council of Governments
(SACOG)San Diego County Regional Airport Authority
San Diego County Water Authority
Southern California Association of
Governments (SCAG)
* Provided salary range data only.
23
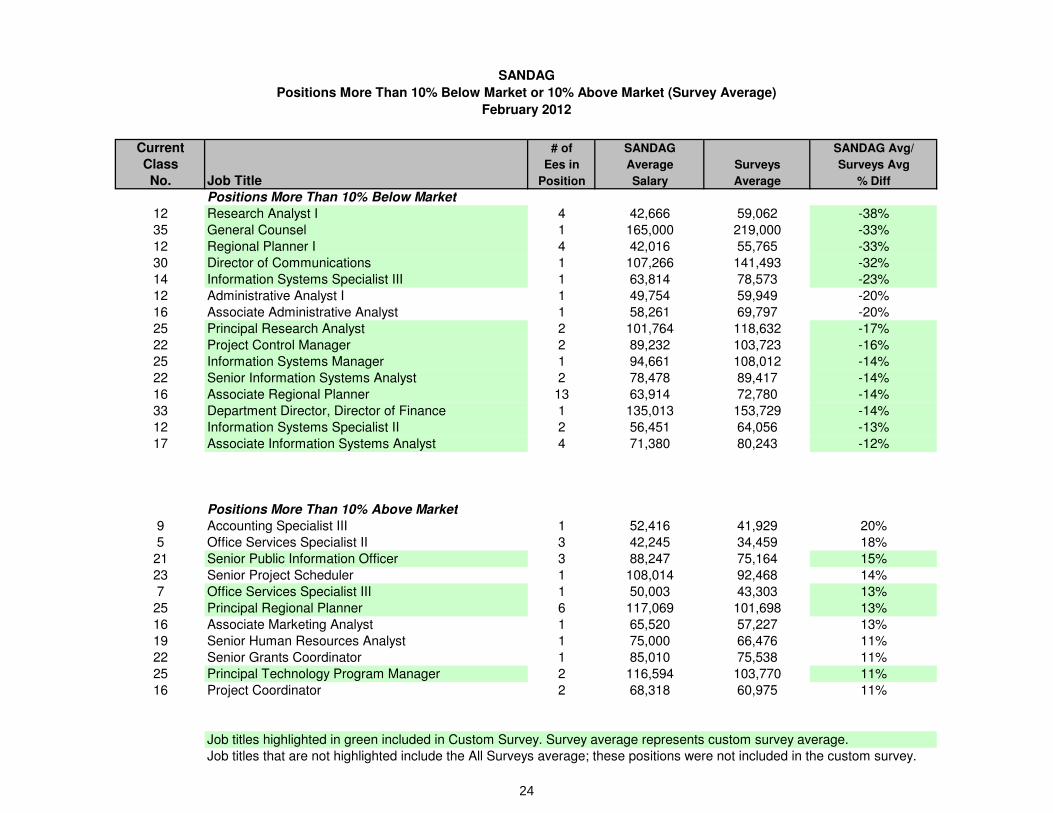
SANDAG
Positions More Than 10% Below Market or 10% Above Market (Survey Average)
February 2012
Current # of SANDAG SANDAG Avg/
Class Ees in Average Surveys Surveys Avg
No. Job Title Position Salary Average % Diff
Positions More Than 10% Below Market
12 Research Analyst I 4 42,666 59,062 -38%
35 General Counsel 1 165,000 219,000 -33%
12 Regional Planner I 4 42,016 55,765 -33%
30 Director of Communications 1 107,266 141,493 -32%
14 Information Systems Specialist III 1 63,814 78,573 -23%
12 Administrative Analyst I 1 49,754 59,949 -20%
16 Associate Administrative Analyst 1 58,261 69,797 -20%
25 Principal Research Analyst 2 101,764 118,632 -17%
22 Project Control Manager 2 89,232 103,723 -16%
25 Information Systems Manager 1 94,661 108,012 -14%
22 Senior Information Systems Analyst 2 78,478 89,417 -14%
16 Associate Regional Planner 13 63,914 72,780 -14%
33 Department Director, Director of Finance 1 135,013 153,729 -14%
12 Information Systems Specialist II 2 56,451 64,056 -13%
17 Associate Information Systems Analyst 4 71,380 80,243 -12%
Positions More Than 10% Above Market
9 Accounting Specialist III 1 52,416 41,929 20%
5 Office Services Specialist II 3 42,245 34,459 18%
21 Senior Public Information Officer 3 88,247 75,164 15%
23 Senior Project Scheduler 1 108,014 92,468 14%
7 Office Services Specialist III 1 50,003 43,303 13%
25 Principal Regional Planner 6 117,069 101,698 13%
16 Associate Marketing Analyst 1 65,520 57,227 13%
19 Senior Human Resources Analyst 1 75,000 66,476 11%
22 Senior Grants Coordinator 1 85,010 75,538 11%
25 Principal Technology Program Manager 2 116,594 103,770 11%
16 Project Coordinator 2 68,318 60,975 11%
Job titles highlighted in green included in Custom Survey. Survey average represents custom survey average.
Job titles that are not highlighted include the All Surveys average; these positions were not included in the custom survey.
24
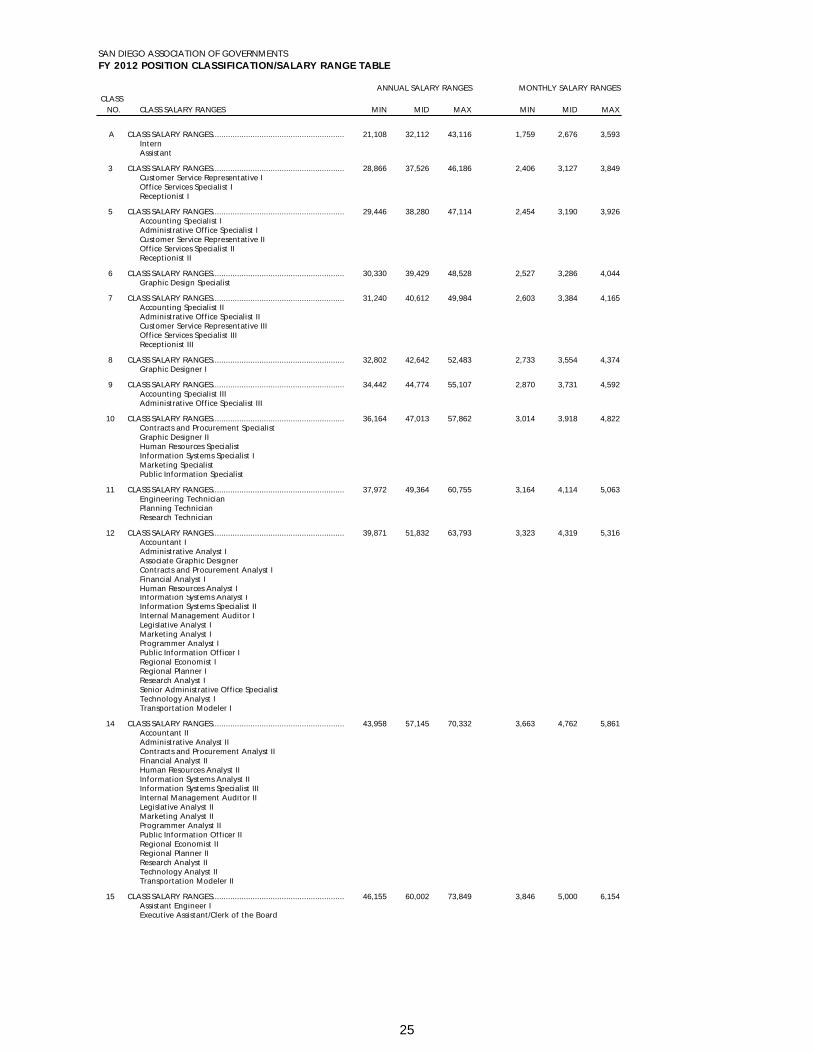
CLASS NO. CLASS SALARY RANGES MIN MID MAX MIN MID MAX
A CLASS SALARY RANGES............................................................ 21,108 32,112 43,116 1,759 2,676 3,593InternAssistant
3 CLASS SALARY RANGES............................................................ 28,866 37,526 46,186 2,406 3,127 3,849Customer Service Representative IOffice Services Specialist IReceptionist I
5 CLASS SALARY RANGES............................................................ 29,446 38,280 47,114 2,454 3,190 3,926Accounting Specialist IAdministrative Office Specialist ICustomer Service Representative IIOffice Services Specialist IIReceptionist II
6 CLASS SALARY RANGES............................................................ 30,330 39,429 48,528 2,527 3,286 4,044Graphic Design Specialist
7 CLASS SALARY RANGES............................................................ 31,240 40,612 49,984 2,603 3,384 4,165Accounting Specialist IIAdministrative Office Specialist IICustomer Service Representative IIIOffice Services Specialist IIIReceptionist III
8 CLASS SALARY RANGES............................................................ 32,802 42,642 52,483 2,733 3,554 4,374Graphic Designer I
9 CLASS SALARY RANGES............................................................ 34,442 44,774 55,107 2,870 3,731 4,592Accounting Specialist IIIAdministrative Office Specialist III
10 CLASS SALARY RANGES............................................................ 36,164 47,013 57,862 3,014 3,918 4,822Contracts and Procurement SpecialistGraphic Designer IIHuman Resources SpecialistInformation Systems Specialist IMarketing SpecialistPublic Information Specialist
11 CLASS SALARY RANGES............................................................ 37,972 49,364 60,755 3,164 4,114 5,063Engineering TechnicianPlanning TechnicianResearch Technician
12 CLASS SALARY RANGES............................................................ 39,871 51,832 63,793 3,323 4,319 5,316Accountant IAdministrative Analyst IAssociate Graphic DesignerContracts and Procurement Analyst IFinancial Analyst IHuman Resources Analyst IInformation Systems Analyst IInformation Systems Specialist IIInternal Management Auditor ILegislative Analyst IMarketing Analyst IProgrammer Analyst IPublic Information Officer IRegional Economist IRegional Planner IResearch Analyst ISenior Administrative Office SpecialistTechnology Analyst ITransportation Modeler I
14 CLASS SALARY RANGES............................................................ 43,958 57,145 70,332 3,663 4,762 5,861Accountant IIAdministrative Analyst IIContracts and Procurement Analyst IIFinancial Analyst IIHuman Resources Analyst IIInformation Systems Analyst IIInformation Systems Specialist IIIInternal Management Auditor IILegislative Analyst IIMarketing Analyst IIProgrammer Analyst IIPublic Information Officer IIRegional Economist IIRegional Planner IIResearch Analyst IITechnology Analyst IITransportation Modeler II
15 CLASS SALARY RANGES............................................................ 46,155 60,002 73,849 3,846 5,000 6,154Assistant Engineer IExecutive Assistant/Clerk of the Board
SAN DIEGO ASSOCIATION OF GOVERNMENTSFY 2012 POSITION CLASSIFICATION/SALARY RANGE TABLE
MONTHLY SALARY RANGES ANNUAL SALARY RANGES
25

CLASS NO. CLASS SALARY RANGES MIN MID MAX MIN MID MAX
SAN DIEGO ASSOCIATION OF GOVERNMENTSFY 2012 POSITION CLASSIFICATION/SALARY RANGE TABLE
MONTHLY SALARY RANGES ANNUAL SALARY RANGES
16 CLASS SALARY RANGES............................................................ 48,463 63,002 77,541 4,039 5,250 6,462Administrative Office SupervisorAssociate AccountantAssociate Administrative AnalystAssociate Contracts and Procurement AnalystAssociate Financial AnalystAssociate Human Resources AnalystAssociate Internal Management AuditorAssociate Legislative AnalystAssociate Marketing AnalystAssociate Public Information OfficerAssociate Regional EconomistAssociate Regional PlannerAssociate Research AnalystAssociate Transportation ModelerProject Coordinator
17 CLASS SALARY RANGES............................................................ 50,886 66,152 81,418 4,241 5,513 6,785Assistant Engineer IIAssociate Information Systems AnalystAssociate Programmer AnalystAssociate Technology AnalystPass Sales Manager
19 CLASS SALARY RANGES............................................................ 56,117 72,952 89,787 4,676 6,079 7,482Senior AccountantSenior Administrative AnalystSenior Contracts and Procurement AnalystSenior Financial AnalystSenior Human Resources AnalystSenior Marketing Analyst
20 CLASS SALARY RANGES............................................................ 58,923 76,600 94,277 4,910 6,383 7,856Associate Engineer
21 CLASS SALARY RANGES............................................................ 61,869 80,430 98,991 5,156 6,702 8,249Communications ManagerCreative Services ManagerSenior Public Information Officer
22 CLASS SALARY RANGES............................................................ 64,963 84,451 103,940 5,414 7,038 8,662Borders Program ManagerBudget Program ManagerBusiness Services ManagerFinancial Programming ManagerMarketing ManagerProject Control ManagerSenior Information Systems AnalystSenior Internal Management AuditorSenior Legislative AnalystSenior Programmer AnalystSenior Regional EconomistSenior Regional PlannerSenior Research AnalystSenior Technology AnalystSenior Transportation Modeler
23 CLASS SALARY RANGES............................................................ 68,211 88,674 109,137 5,684 7,389 9,095Associate General CounselSenior EngineerSenior Engineer / Contracts Manager
24 CLASS SALARY RANGES............................................................ 71,621 93,108 114,594 5,968 7,759 9,550Manager of Contracts and ProcurementManager of Human Resources
25 CLASS SALARY RANGES............................................................ 75,202 97,763 120,324 6,267 8,147 10,027Information Systems ManagerPrincipal Technology Program ManagerPrincipal Regional EconomistPrincipal Regional PlannerPrincipal Research AnalystPrincipal Transportation ModelerProject Development Program Manager
26 CLASS SALARY RANGES............................................................ 78,962 102,651 126,340 6,580 8,554 10,528Finance ManagerManager of Financial Programming and Project ControlPrincipal EngineerPrincipal Internal Management Auditor
29 CLASS SALARY RANGES............................................................ 91,409 118,832 146,254 7,617 9,903 12,188Deputy General Counsel
30 CLASS SALARY RANGES............................................................ 95,979 124,773 153,567 7,998 10,398 12,797Chief Economist
Goods Movement Policy Manager
33 CLASS SALARY RANGES............................................................ 111,108 144,441 177,773 9,259 12,037 14,814Department Director
35 CLASS SALARY RANGES............................................................ 122,497 159,246 195,995 10,208 13,270 16,333Chief Deputy Executive DirectorGeneral Counsel
N/A EXECUTIVE DIRECTOR.............................................................. (Set by Board of Directors)
Director: Communications, Criminal Justice,Engineering, Public Safety, Rail
TransNet and Legislative Affairs Program Director
26

SANDAG
Summary of Salary Structure Analysis
February 2012Current # of SANDAG Current Custom SANDAG Avg/ Curr Mdpt/ All SANDAG Avg/ SANDAG Avg/ Current Mdpt/ Consider
Class Ees in Average Class Current Median/ Custom Avg Custom Avg Surveys All Survey Avg Current Mdpt All Survey Avg Class
No. Job Title Position Salary No. Midpoint MidPoint % Diff Comparatio Average % Diff Comparatio Comparatio No Comments Based on Current Midpoints
1 Vacant - - 1 36,787 n/a n/a n/a n/a
2 Vacant - - 2 37,155 n/a n/a n/a n/a
3 Not included in study n/a - 3 37,526 n/a n/a n/a n/a
4 Vacant - - 4 37,901 n/a n/a n/a n/a
5 Administrative Office Specialist I 1 40,000 5 38,280 37,523 6% 1.04 1.02
5 Customer Service Representative II 1 34,778 5 38,280 35,616 -2% 0.91 1.07
5 Office Services Specialist II 3 42,245 5 38,280 34,459 18% 1.10 1.11
5 Receptionist II 1 37,003 5 38,280 34,000 8% 0.97 1.13
6 Not included in study n/a - 6 39,429 n/a n/a n/a n/a
7 Accounting Specialist II 3 39,305 7 40,612 37,053 6% 0.97 1.10
7 Office Services Specialist III 1 50,003 7 40,612 43,303 13% 0.94 42,602 15% 1.23 0.95 Based on survey data alone, Class 7 is OK.
8 Not included in study n/a - 8 42,642 n/a n/a n/a n/a
9 Accounting Specialist III 1 52,416 9 44,774 41,929 20% 1.17 1.07
9 Administrative Office Specialist III 8 50,918 9 44,774 45,360 11% 0.99 48,979 4% 1.14 0.91 Based on average midpoint, Class 9 is OK.
9 Department Coordinator 0 - 9 44,774 42,863 n/a n/a 1.04
9 Document Control Specialist III 0 - 9 44,774 46,681 n/a n/a 0.96
10 Graphic Designer II 1 42,328 10 47,013 45,175 -7% 0.90 1.04
11 Project Scheduler 1 55,016 11 49,364 57,010 -4% 1.11 0.87 14 Based on survey data alone, Class 14 is appropriate.
12 Administrative Analyst I 1 49,754 12 51,832 59,949 -20% 0.96 0.86 14 Based on survey data alone, Class 14 is appropriate.
12 Associate Graphic Designer 2 56,836 12 51,832 54,809 4% 1.10 0.95
12 Contracts and Procurement Analyst I 0 - 12 51,832 52,487 n/a 0.99 52,905 n/a n/a 0.98 Based on survey data alone, Class 12 is OK.
12 Human Resources Analyst I 1 54,725 12 51,832 52,345 4% 1.06 0.99
12 Information Systems Analyst I 0 - 12 51,832 68,214 n/a 0.76 62,149 n/a n/a 0.83 15 Based on all survey average, Class 15 is appropriate.
12 Information Systems Specialist II 2 56,451 12 51,832 64,056 -13% 0.81 51,466 9% 1.09 1.01 Based on all survey average, Class 12 is OK.
12 Legislative Analyst I 0 - 12 51,832 55,761 n/a n/a 0.93
12 Marketing Analyst I 0 - 12 51,832 49,389 n/a n/a 1.05
12 Programmer Analyst I 0 - 12 51,832 62,266 n/a n/a 0.83 15 Based on all survey average, Class 15 is appropriate.
12 Public Information Officer I 0 - 12 51,832 50,045 n/a 1.04 49,498 n/a n/a 1.05
12 Regional Planner I 4 42,016 12 51,832 56,998 -36% 0.91 52,675 -25% 0.81 0.98 14 Based on average midpoint, Class 14 is appropriate.
12 Research Analyst I 4 42,666 12 51,832 59,062 -38% 0.88 52,099 -22% 0.82 0.99 14 Based on survey data alone, Class 14 is appropriate
12 Transportation Modeler I 0 - 12 51,832 59,672 n/a 0.87 49,537 n/a n/a 1.05 14 Based on average midpoint, Class 14 is appropriate.
13 Vacant - - 13 54,424 n/a n/a n/a n/a
27
SANDAG
Summary of Salary Structure Analysis
February 2012Current # of SANDAG Current Custom SANDAG Avg/ Curr Mdpt/ All SANDAG Avg/ SANDAG Avg/ Current Mdpt/ Consider
Class Ees in Average Class Current Median/ Custom Avg Custom Avg Surveys All Survey Avg Current Mdpt All Survey Avg Class
No. Job Title Position Salary No. Midpoint MidPoint % Diff Comparatio Average % Diff Comparatio Comparatio No Comments Based on Current Midpoints
14 Accountant II 1 53,019 14 57,145 55,906 -5% 0.93 1.02
14 Information Systems Specialist III 1 63,814 14 57,145 73,068 -15% 0.78 58,826 8% 1.12 0.97 Based on all survey average, Class 14 is OK.
15 Assistant Engineer I 0 - 15 60,002 60,274 n/a n/a 1.00
15 Assistant Systems Engineer I 0 - 15 60,002 66,313 n/a n/a 0.90
15 Executive Assistant/Clerk of the Board 2 71,261 15 60,002 68,356 4% 1.19 0.88 17 Based on survey data alone, Class 17 is appropriate.
16 Administrative Office Supervisor 0 - 16 63,002 60,192 n/a 1.05 59,674 n/a n/a 1.06
16 Associate Accountant 2 62,816 16 63,002 60,153 4% 1.00 1.05
16 Associate Administrative Analyst 1 58,261 16 63,002 69,797 -20% 0.92 0.90
16 Assoc Contracts & Procurement Analyst 5 73,107 16 63,002 66,354 9% 0.95 63,934 13% 1.16 0.99 Based on survey average, Class 16 is OK.
16 Associate Financial Analyst 2 64,511 16 63,002 63,970 1% 0.98 67,186 -4% 1.02 0.94 Based on average midpoint, Class 16 is OK.
16 Associate Human Resources Analyst 1 65,000 16 63,002 59,279 9% 1.03 1.06
16 Associate Legislative Analyst 1 63,565 16 63,002 67,088 -6% 1.01 0.94
16 Associate Marketing Analyst 1 65,520 16 63,002 57,227 13% 1.04 1.10
16 Associate Public Information Officer 0 - 16 63,002 62,928 n/a 1.00 60,862 n/a n/a 1.04 Based on survey average, Class 16 is OK.
16 Associate Regional Planner 13 63,914 16 63,002 68,435 -7% 0.92 64,881 -2% 1.01 0.97 18 Based on average midpoint, Class 18 is appropriate.
16 Associate Research Analyst 6 68,300 16 63,002 70,516 -3% 0.89 68,845 -1% 1.08 0.92 18 Based on average midpoint, Class 18 is appropriate.
16 Associate Transportation Modeler 4 64,282 16 63,002 70,421 -10% 0.89 70,421 -10% 1.02 0.89 18 Based on survey data alone, Class 18 is appropriate.
16 Project Coordinator 2 68,318 16 63,002 60,975 11% 1.08 1.03
17 Associate Information Systems Analyst 4 71,380 17 66,152 72,191 -1% 0.92 70,400 1% 1.08 0.94 18 or 19 Based on average midpoint, Class 18 or 19 is appropriate.
17 Associate Programmer Analyst 2 73,278 17 66,152 73,167 0% 1.11 0.90 18 or 19 Based on all survey average, Class 18 or 19 is appropriate.
18 Vacant - - 18 69,460 n/a n/a n/a n/a
19 Senior Accountant 2 79,487 19 72,952 71,640 10% 1.09 1.02
19 Senior Contracts and Procurement Analyst 2 82,750 19 72,952 82,190 1% 0.89 77,682 6% 1.13 0.94 Based on all survey average, Class 19 is OK.
19 Senior Human Resources Analyst 1 75,000 19 72,952 66,476 11% 1.03 1.10
19 Senior Marketing Analyst 0 - 19 72,952 66,358 n/a n/a 1.10
20 Associate Engineer 1 87,610 20 76,600 78,183 11% 0.98 74,575 15% 1.14 1.03 Based on average midpoint, Class 20 is OK.
20 Associate Systems Engineer 0 - 20 76,600 79,659 n/a n/a 0.96
21 Communications/Marketing Manager 0 - 21 80,430 105,040 n/a 0.77 91,211 n/a n/a 0.88 23 Based on the all survey average, Class 23 is appropriate.
21 Creative Services Manager 1 85,010 21 80,430 80,459 5% 1.06 1.00
21 Senior Public Information Officer 3 88,247 21 80,430 75,164 15% 1.07 71,943 18% 1.10 1.12 Based on survey data alone, Class 21 is OK.
22 Budget Program Manager 1 99,611 22 84,451 93,197 6% 1.18 0.91
22 Project Control Manager 2 89,232 22 84,451 91,466 -3% 0.92 92,358 -4% 1.06 0.91 Based on average midpoint, Class 22 is OK.
22 Senior Grants Coordinator 1 85,010 22 84,451 75,538 11% 1.01 1.12
22 Senior Information Systems Analyst 2 78,478 22 84,451 89,417 -14% 0.94 84,194 -7% 0.93 1.00 Based on survey data alone, Class 22 is OK.
22 Senior Legislative Analyst 1 80,766 22 84,451 81,000 0% 0.96 1.04
28

SANDAG
Summary of Salary Structure Analysis
February 2012Current # of SANDAG Current Custom SANDAG Avg/ Curr Mdpt/ All SANDAG Avg/ SANDAG Avg/ Current Mdpt/ Consider
Class Ees in Average Class Current Median/ Custom Avg Custom Avg Surveys All Survey Avg Current Mdpt All Survey Avg Class
No. Job Title Position Salary No. Midpoint MidPoint % Diff Comparatio Average % Diff Comparatio Comparatio No Comments Based on Current Midpoints
22 Senior Programmer Analyst 2 93,469 22 84,451 88,191 6% 1.11 0.96
22 Senior Regional Planner 19 87,944 22 84,451 79,612 9% 1.06 77,380 12% 1.04 1.09 Based on average midpoint, Class 22 is OK.
22 Senior Research Analyst 7 81,958 22 84,451 82,973 -1% 1.02 81,356 1% 0.97 1.04 Based on average midpoint, Class 22 is OK.
22 Senior Technology Program Analyst 2 92,009 22 84,451 83,324 9% 1.01 82,670 10% 1.09 1.02 Based on survey data alone, Class 22 is OK.
22 Senior Transportation Modeler 3 87,305 22 84,451 88,569 -1% 0.95 94,584 -8% 1.03 0.89 Based on average midpoint, Class 22 is OK.
23 Senior Engineer 12 102,199 23 88,674 96,574 6% 0.92 96,183 6% 1.15 0.92 Based on average midpoint, Class 23 is OK.
23 Senior Project Scheduler 1 108,014 23 88,674 92,468 14% 1.22 0.96
23 Senior Systems Engineer 0 - 23 88,674 100,389 n/a n/a 0.88 Based on survey data alone, Class 23 is OK.
24 Manager of Contracts and Procurement 1 114,608 24 93,108 115,382 -1% 0.81 104,502 9% 1.23 0.89 28 Based on average midpoint, Class 28 is appropriate.
24 Manager of Human Resources 1 85,010 24 93,108 91,745 -8% 0.91 1.01
24 Manager of Small Business Development 0 - 24 93,108 87,851 n/a 1.06 96,689 n/a n/a 0.96 Based on all survey average, Class 24 is OK.
25 Information Systems Manager 1 94,661 25 97,763 98,184 -4% 1.00 106,598 -13% 0.97 0.92 Based on average midpoint, Class 25 is OK.
25 Principal Regional Planner 6 117,069 25 97,763 101,698 13% 0.96 94,520 19% 1.20 1.03 Based on survey data alone, Class 25 is OK.
25 Principal Research Analyst 2 101,764 25 97,763 118,632 -17% 0.82 104,852 -3% 1.04 0.93 Based on all survey average, Class 25 is OK.
25 Principal Technology Program Manager 2 116,594 25 97,763 94,265 19% 1.04 105,537 9% 1.19 0.93 Based on average midpoint, Class 25 is OK.
26 Finance Manager 1 114,000 26 102,651 100,708 12% 1.02 101,127 11% 1.11 1.02 Based on average midpoint, Class 26 is OK.
26 Principal Engineer 5 121,231 26 102,651 111,443 8% 0.92 116,449 4% 1.18 0.88 Based on average midpoint, Class 26 is OK.
26 Principal Systems Engineer 0 - 26 102,651 110,269 n/a n/a 0.93 Based on survey data alone, Class 26 is OK.
26 Senior General Counsel 0 - 26 102,651 115,644 n/a 0.89 105,230 n/a n/a 0.98 28 Based on average midpoint, Class 28 is appropriate.
27 Vacant - - 27 107,784 n/a n/a n/a n/a
28 Vacant - - 28 113,173 n/a n/a n/a n/a
29 Deputy General Counsel 1 146,254 29 118,832 152,916 -5% 0.78 141,394 3% 1.23 0.84 34 Based on average midpoint, Class 34 is appropriate.
30 Director of Communications 1 107,266 30 124,773 131,364 -22% 0.95 115,138 -7% 0.86 1.08 Based on average midpoint, Class 30 is OK.
31 Vacant - - 31 131,012 n/a n/a n/a n/a
32 Vacant - 1 32 137,562 n/a n/a n/a n/a
33 Department Director, Director of Finance 1 135,013 33 144,441 138,873 -3% 1.04 165,434 -23% 0.93 0.87 Based on average midpoint, Class 33 is OK.
34 Vacant - - 34 151,663 n/a n/a n/a n/a
35 Chief Deputy Executive Director 1 189,010 35 159,246 178,932 5% 0.89 205,974 -9% 1.19 0.77 Consider a higher range or do not include in a salary range
35 General Counsel 1 165,000 35 159,246 219,000 -33% 0.73 199,190 -21% 1.04 0.80 Consider a higher range or do not include in a salary range
Included in Custom Salary Survey
Custom Median/Midpoint column - this column represents the median of salaries reported or the midpoint average of the ranges reported in the custom survey.
29
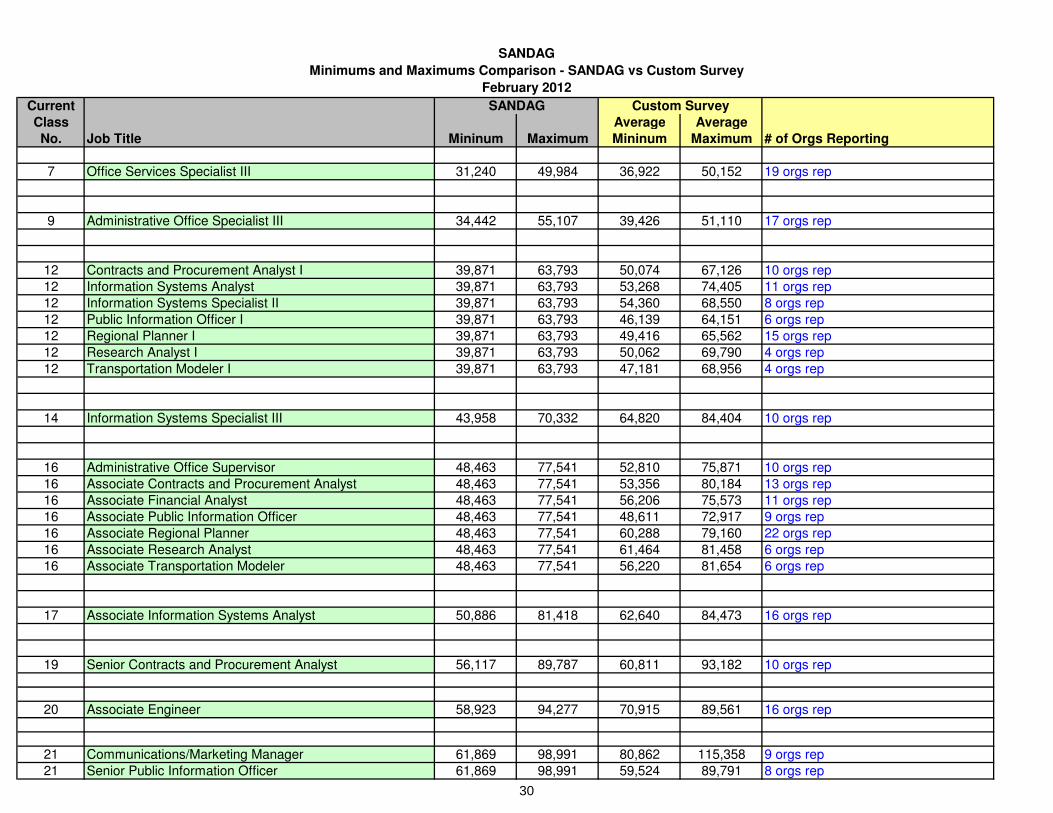
SANDAG
Minimums and Maximums Comparison - SANDAG vs Custom Survey
February 2012
Current
Class Average Average
No. Job Title Mininum Maximum Mininum Maximum # of Orgs Reporting
7 Office Services Specialist III 31,240 49,984 36,922 50,152 19 orgs rep
9 Administrative Office Specialist III 34,442 55,107 39,426 51,110 17 orgs rep
12 Contracts and Procurement Analyst I 39,871 63,793 50,074 67,126 10 orgs rep
12 Information Systems Analyst 39,871 63,793 53,268 74,405 11 orgs rep
12 Information Systems Specialist II 39,871 63,793 54,360 68,550 8 orgs rep
12 Public Information Officer I 39,871 63,793 46,139 64,151 6 orgs rep
12 Regional Planner I 39,871 63,793 49,416 65,562 15 orgs rep
12 Research Analyst I 39,871 63,793 50,062 69,790 4 orgs rep
12 Transportation Modeler I 39,871 63,793 47,181 68,956 4 orgs rep
14 Information Systems Specialist III 43,958 70,332 64,820 84,404 10 orgs rep
16 Administrative Office Supervisor 48,463 77,541 52,810 75,871 10 orgs rep
16 Associate Contracts and Procurement Analyst 48,463 77,541 53,356 80,184 13 orgs rep
16 Associate Financial Analyst 48,463 77,541 56,206 75,573 11 orgs rep
16 Associate Public Information Officer 48,463 77,541 48,611 72,917 9 orgs rep
16 Associate Regional Planner 48,463 77,541 60,288 79,160 22 orgs rep
16 Associate Research Analyst 48,463 77,541 61,464 81,458 6 orgs rep
16 Associate Transportation Modeler 48,463 77,541 56,220 81,654 6 orgs rep
17 Associate Information Systems Analyst 50,886 81,418 62,640 84,473 16 orgs rep
19 Senior Contracts and Procurement Analyst 56,117 89,787 60,811 93,182 10 orgs rep
20 Associate Engineer 58,923 94,277 70,915 89,561 16 orgs rep
21 Communications/Marketing Manager 61,869 98,991 80,862 115,358 9 orgs rep
21 Senior Public Information Officer 61,869 98,991 59,524 89,791 8 orgs rep
Custom SurveySANDAG
30

SANDAG
Minimums and Maximums Comparison - SANDAG vs Custom Survey
February 2012
Current
Class Average Average
No. Job Title Mininum Maximum Mininum Maximum # of Orgs Reporting
Custom SurveySANDAG
22 Project Control Manager 64,963 103,940 74,780 108,149 7 orgs rep
22 Senior Information Systems Analyst 64,963 103,940 71,698 98,762 13 orgs rep
22 Senior Regional Planner 64,963 103,940 69,624 93,005 24 orgs rep
22 Senior Research Analyst 64,963 103,940 70,903 94,877 8 orgs rep22 Senior Technology Program Analyst 64,963 103,940 65,052 97,562 4 orgs rep
22 Senior Transportation Modeler 64,963 103,940 71,910 104,508 8 orgs rep
23 Senior Engineer 68,211 109,137 83,532 116,688 13 orgs rep
24 Manager of Contracts and Procurement 71,621 114,594 94,516 129,826 9 orgs rep
24 Manager of Small Business Development 71,621 114,594 72,992 104,589 4 orgs rep
25 Information Systems Manager 75,202 120,324 82,644 117,207 21 orgs rep
25 Principal Regional Planner 75,202 120,324 84,690 114,252 21 orgs rep
25 Principal Research Analyst 75,202 120,324 92,012 129,926 3 orgs rep
25 Principal Technology Program Manager 75,202 120,324 75,412 113,119 5 orgs rep
26 Finance Manager 78,962 126,340 87,299 118,557 24 orgs rep
26 Principal Engineer 78,962 126,340 94,779 129,356 14 orgs rep
26 Senior General Counsel 78,962 126,340 99,720 134,112 7 orgs rep
29 Deputy General Counsel 91,409 146,254 130,140 175,692 8 orgs rep
30 Director of Communications 95,979 153,567 102,985 154,515 10 orgs rep
33 Department Director, Director of Finance 111,108 177,773 115,644 162,087 22 orgs rep
35 Chief Deputy Executive Director 122,497 195,995 141,324 199,380 21 orgs rep
35 General Counsel 122,497 195,995 n/a n/a 11 orgs rep
Included in Custom31

SANDAG
Minimums and Maximums Comparison - SANDAG vs Custom Survey
February 2012
Current
Class Average Average
No. Job Title Mininum Maximum Mininum Maximum # of Orgs Reporting
Custom SurveySANDAG
2012 Custom Salary Survey Sponsored by SANDAG
The following 29 organizations participated in the custom salary survey:
City of Carlsbad
City of Chula Vista
City of Coronado
City of Del Mar
City of Escondido
City of La Mesa
City of Lemon Grove
City of National City
City of Oceanside
City of Poway
City of San Diego
City of San Marcos
City of Santee
City of Solana Beach
County of San Diego*
Denver Regional Council of Governments
Los Angeles County Metropolitan Trans Authority (Metro)
Maricopa Associations of Governments
Metropolitan Transit System (MTS)
Metropolitan Transportation Commission (MTC)
North County Transit District (NCTD)
Orange County Transportation Authority (OCTA)
Pima Associaton of Governments
Puget Sound Regional Council
Riverside County Transportation Commission (RCTC)
Sacramento Area Council of Governments (SACOG)
San Diego County Regional Airport Authority
San Diego County Water Authority
Southern California Association of Governments (SCAG)
* Provided salary range data only.
32