behaviour of laterally loaded pile - uliege.be · 2019-09-17 · behaviour of laterally loaded pile...
TRANSCRIPT
Behaviour of Laterally Loaded Pile
S. AhayanArGEnCo DepartementUniversity of Liege, BelgiumInstitut de Recherche en Genie Civil et Mecanique (GeM)Ecole Centrale Nantes, France
B. Cerfontaine, F. CollinArGEnCo DepartementUniversity of Liege, Belgium
P. KotronisInstitut de Recherche en Genie Civil et Mecanique (GeM)Ecole Centrale Nantes, France
ABSTRACT: Monopiles have been by far the most common support structure for offshore turbines. Theyhave always been an appropriate solution for complex site conditions.Design of monopiles is usually based on the use of nonlinear p-y curve. These curves are primordially based onthe use of simple constitutive models for soil, such as Tresca criterion. Since soil behavior is highly non-linearand very complex, fundamental features of soil such as anisotropy, creep, or destructuration have to be takeninto consideration. Accordingly, it is necessary to consider more complex soil behavior constitutive models. Thiswork aims to explain, via FEM simulations, the influence of different constitutive laws for soil, on the laterallyloaded pile responses. Tresca, Mohr-Coulomb criteria and Modified Cam-Clay model have been compared andtheir effect on p-y curve is analyzed.
1 INTRODUCTION
Offshore wind energy applications have great poten-tial towards achieving European Unions energy targetfor 2020. Accordingly, in the last decade, there is anexponential increase in the offshore wind energy in-dustry. Offshore Wind Turbines (OWT) substructureis an important concern. This is due to the huge con-struction cost of the foundations and substructures,which counts for 25 to 30% of the total constructioncost (EWEA 2015). Larger wind parks are increas-ingly developed away from the coastline, at increas-ing water depths. Current projects reach a distance of150Km offshore and at a water depth up to 45m. Thescale of online wind farms follows an upward trendsince the early 2000s, and is correlated to the risingsize and production capacity of individual windmills.In the last 25 years, the energy production of one sin-gle OWT has been increased twentyfold, while rotordiameter has been grown from 35m up to more than150m (Schaumann, Lochte-Holtgreven, & Steppeler2011). The continuous increase of OWT dimensions
attests the rapid growth of the offshore wind market.The type and design of the foundation solutions for
OWT projects depend on the size of the turbine, wa-ter depth, and local seabed conditions. According tothose constraints, the challenge is to develop the mostcost-effective solution for the support structure andonsite installation process (Arshad & OKelly 2013).The support structure of OWT comprises the sub-structure on the top of the foundation system. On onehand, the substructure is chosen based on the meansea level. On the other hand, the foundation type isbonded to the OWT dimensions, transfer of appliedloads to the soil, and ground geotechnical properties.
In a shallow and moderate water depth, between10m and 70m , the use is made of bottom-mountedsubstructures that are firmly fixed to the seabed byunderwater foundations. Three main layouts are com-monly used for shallow OWT applications: monopod,multipod, and jacket structure. Additionally, thereare three practical options for the foundation system,comprising the gravity base foundations (GBF), piledfoundations, and the skirt or bucket foundations, also
known as suction caissons foundations.Based on the database of The European Wind En-
ergy Association (EWEA) for the year 2016, it showsthat 88% of the installed substructure foundation sys-tems in Europe used monopiles, whereas the remain-ing 12% corresponded to jacket structures. In this re-search, the focus is made on offshore wind turbinebased on single piles, which are designed to resist lat-eral loading, such as wind, wave and rotor reactions.
P-y curve is one of the most common methods thathas been widely used (API (RP2A-WSD 2000), DNV(Veritas 2004),ect). P-y curves represent the relation-ship between the lateral load (p) and lateral displace-ment (y) at a certain point of a pile. Several numericaltechniques, such as finite element and finite differencemethods, are employed to predict the p-y curve forlaterally loaded pile design (Byrne, McAdam, Burd,Houlsby, Martin, Zdravkovi, Taborda, Potts, Jardine,& Sideri 2015), (Zdravkovic, Taborda, Potts, Jardine,Sideri, Schroeder, Byrne, McAdam, Burd, Houlsby,et al. 2015)).
The work of Matlock (Matlock 1970) is widelyused by the offshore pile industry. Matlocks recom-mendations are primordially based on the use of sim-ple constitutive models for soil, meaning elastic per-fectly plastic model such as Tresca or Mohr- Coulombcriteria. Since the behaviour of the clay soil is highlynonlinear and very complex, it is necessary to con-sider advanced constitutive models (Ahayan, Yin,Kotronis, & Collin 2016). This research aims to ex-plain, via FEM simulations, the influence of using dif-ferent constitutive laws of the soil on the responses oflaterally loaded piles. Those laws vary from the sim-plest model, such as Tresca, to the critical state lawof Cam-Clay model (Roscoe & Burland 1968). Theeffect of each model on the prediction of p-y curve ispresented in the following sections.
2 FINITE ELEMENT MODEL
The finite element model presented in this sectionallows analysing pile behaviour under lateral mono-tonic loading. The main objective is to assess the in-fluence of soil behaviour on the p-y curve.
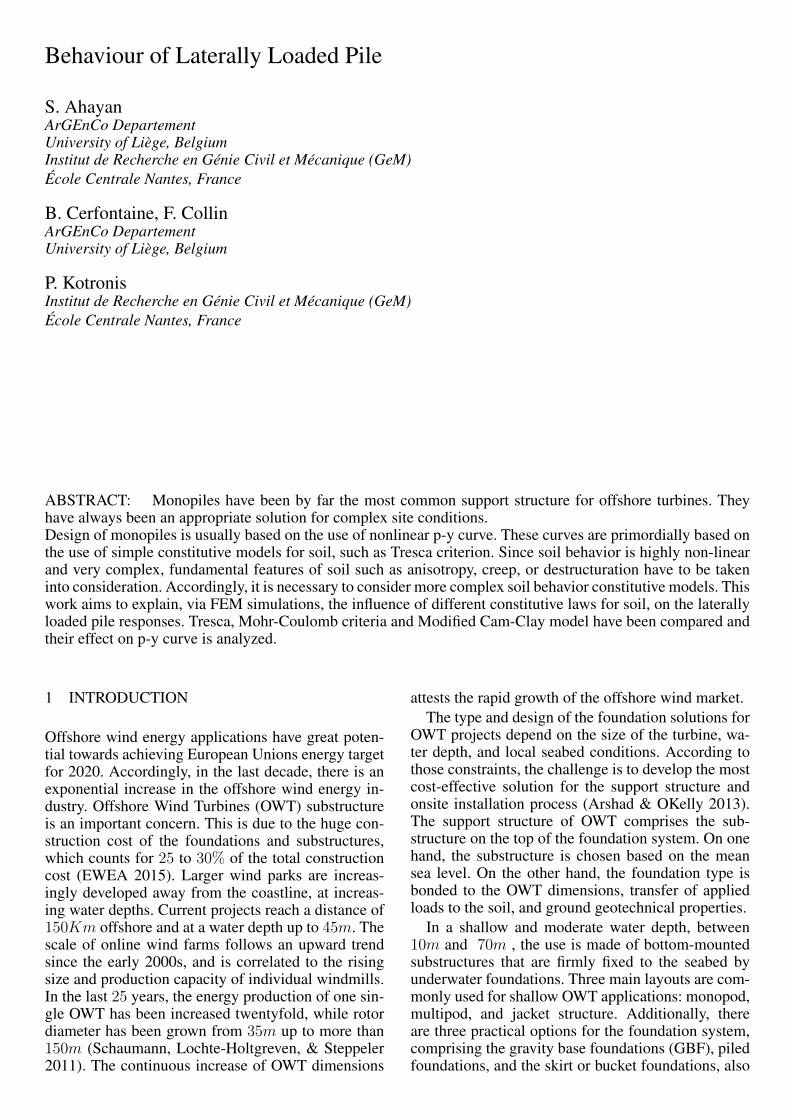
The p-y curve method considers the pile as a beam,while the soil is considered as a series of uncouplednon-linear springs (Reese, Cox, & Koop 1974). Eachof those springs are defined by a p-y curve, as shownin Figure 1.
The non-linear finite element code LAGAMINE,developed at the University of Liege (Collin 2003), isselected as the main numerical platform for this study.
2D simulation of laterally loaded pile
In the present work, the 3D problem of laterallyloaded pile is simplified to a 2D problem to determinethe characteristic p-y curve by numerical modeling.This simplification takes place by considering a slice
Displacement (y)lateral load (p)
Distribution of soil
Reaction
y
p
pult
k
y
p
pult
y
ppult
y
ppult
Symmetry
Beam
Spring
zy
Pile
Figure 1: The p-y curve method
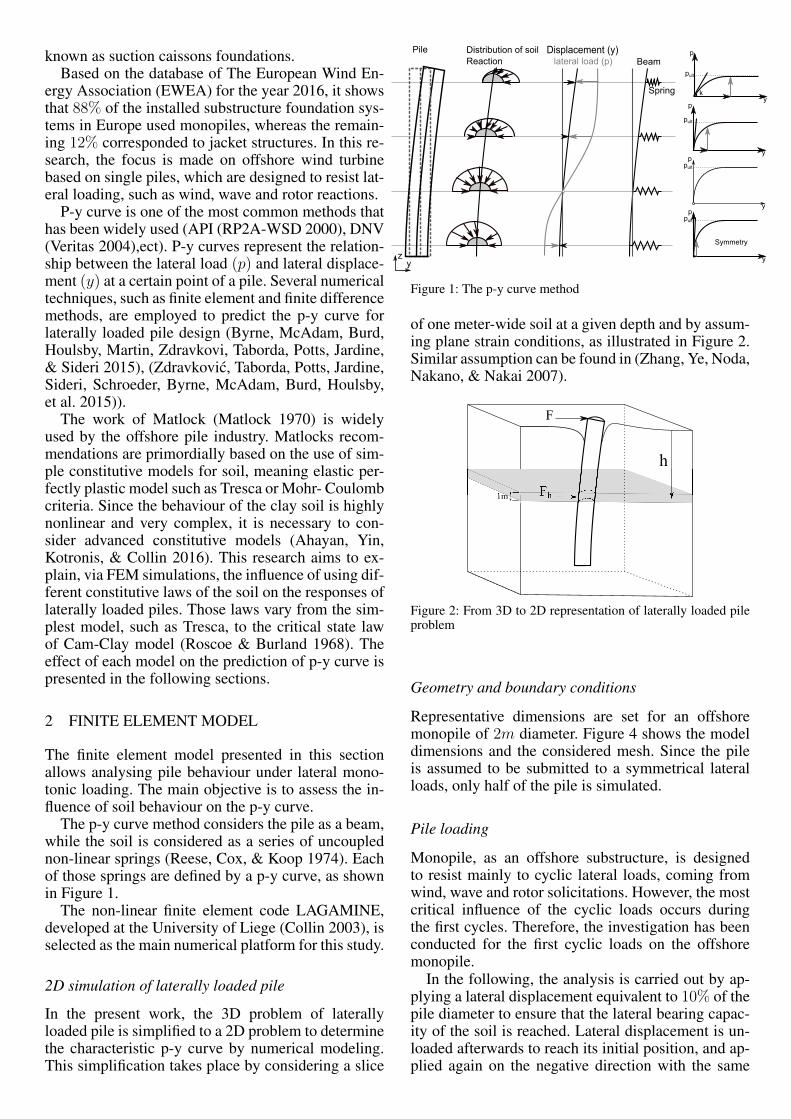
of one meter-wide soil at a given depth and by assum-ing plane strain conditions, as illustrated in Figure 2.Similar assumption can be found in (Zhang, Ye, Noda,Nakano, & Nakai 2007).
F
h
1m
Figure 2: From 3D to 2D representation of laterally loaded pileproblem
Geometry and boundary conditions
Representative dimensions are set for an offshoremonopile of 2m diameter. Figure 4 shows the modeldimensions and the considered mesh. Since the pileis assumed to be submitted to a symmetrical lateralloads, only half of the pile is simulated.
Pile loading
Monopile, as an offshore substructure, is designedto resist mainly to cyclic lateral loads, coming fromwind, wave and rotor solicitations. However, the mostcritical influence of the cyclic loads occurs duringthe first cycles. Therefore, the investigation has beenconducted for the first cyclic loads on the offshoremonopile.
In the following, the analysis is carried out by ap-plying a lateral displacement equivalent to 10% of thepile diameter to ensure that the lateral bearing capac-ity of the soil is reached. Lateral displacement is un-loaded afterwards to reach its initial position, and ap-plied again on the negative direction with the same
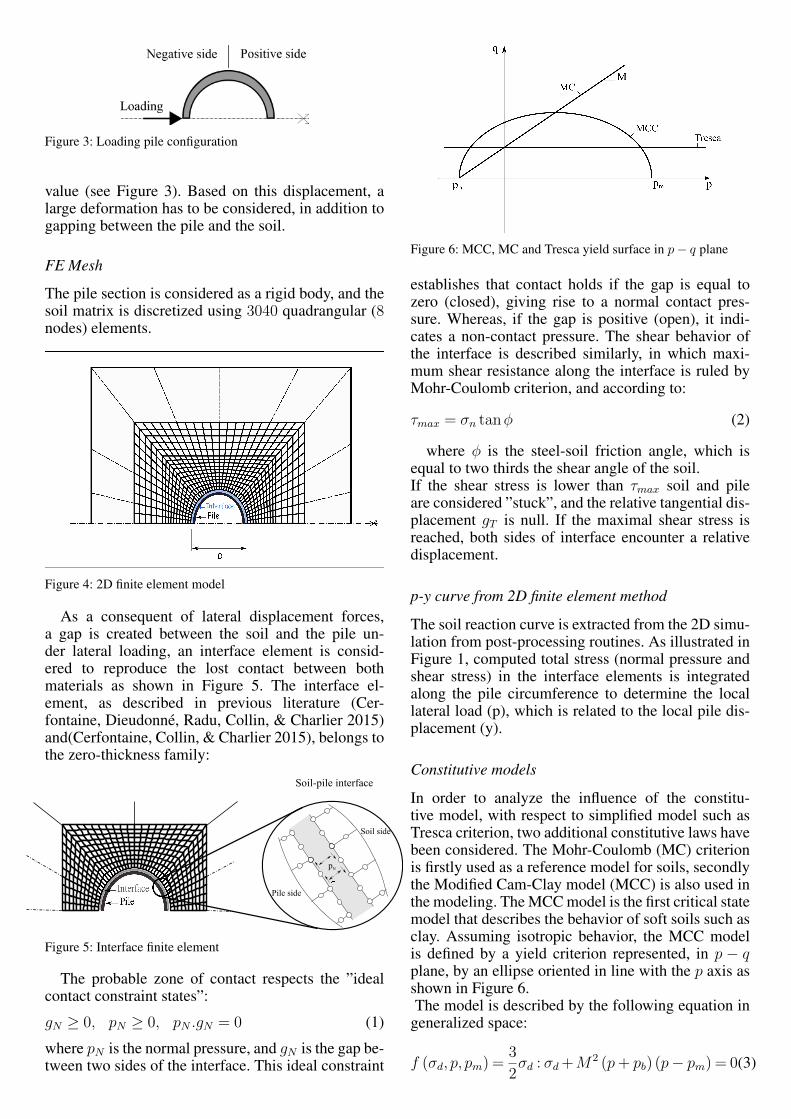
Figure 3: Loading pile configuration
value (see Figure 3). Based on this displacement, alarge deformation has to be considered, in addition togapping between the pile and the soil.
FE Mesh
The pile section is considered as a rigid body, and thesoil matrix is discretized using 3040 quadrangular (8nodes) elements.
D
Figure 4: 2D finite element model
As a consequent of lateral displacement forces,a gap is created between the soil and the pile un-der lateral loading, an interface element is consid-ered to reproduce the lost contact between bothmaterials as shown in Figure 5. The interface el-ement, as described in previous literature (Cer-fontaine, Dieudonne, Radu, Collin, & Charlier 2015)and(Cerfontaine, Collin, & Charlier 2015), belongs tothe zero-thickness family:
pN
�
Soil side
Pile side
Soil-pile interface
Figure 5: Interface finite element
The probable zone of contact respects the ”idealcontact constraint states”:
gN ≥ 0, pN ≥ 0, pN .gN = 0 (1)
where pN is the normal pressure, and gN is the gap be-tween two sides of the interface. This ideal constraint
Figure 6: MCC, MC and Tresca yield surface in p− q plane
establishes that contact holds if the gap is equal tozero (closed), giving rise to a normal contact pres-sure. Whereas, if the gap is positive (open), it indi-cates a non-contact pressure. The shear behavior ofthe interface is described similarly, in which maxi-mum shear resistance along the interface is ruled byMohr-Coulomb criterion, and according to:
τmax = σn tanφ (2)
where φ is the steel-soil friction angle, which isequal to two thirds the shear angle of the soil.If the shear stress is lower than τmax soil and pileare considered ”stuck”, and the relative tangential dis-placement gT is null. If the maximal shear stress isreached, both sides of interface encounter a relativedisplacement.
p-y curve from 2D finite element method
The soil reaction curve is extracted from the 2D simu-lation from post-processing routines. As illustrated inFigure 1, computed total stress (normal pressure andshear stress) in the interface elements is integratedalong the pile circumference to determine the locallateral load (p), which is related to the local pile dis-placement (y).
Constitutive models
In order to analyze the influence of the constitu-tive model, with respect to simplified model such asTresca criterion, two additional constitutive laws havebeen considered. The Mohr-Coulomb (MC) criterionis firstly used as a reference model for soils, secondlythe Modified Cam-Clay model (MCC) is also used inthe modeling. The MCC model is the first critical statemodel that describes the behavior of soft soils such asclay. Assuming isotropic behavior, the MCC modelis defined by a yield criterion represented, in p − qplane, by an ellipse oriented in line with the p axis asshown in Figure 6.The model is described by the following equation in
generalized space:
f (σd, p, pm) =3
2σd : σd+M
2 (p+ pb) (p− pm) = 0(3)
σd is the shear stress tensor(σdij = σij − δijp
), and p
is the mean stress. M is the slope of the critical stateline in p− q plane. This parameter is calculated di-rectly from the shear angle of soil φ, as follow:
M =6sinφ
3− sinφ(4)
−0.1 −0.05 0 0.05 0.1−150
−100
−50
0
50
100
150
y ( − )
p (
kN
/m)
h=5m
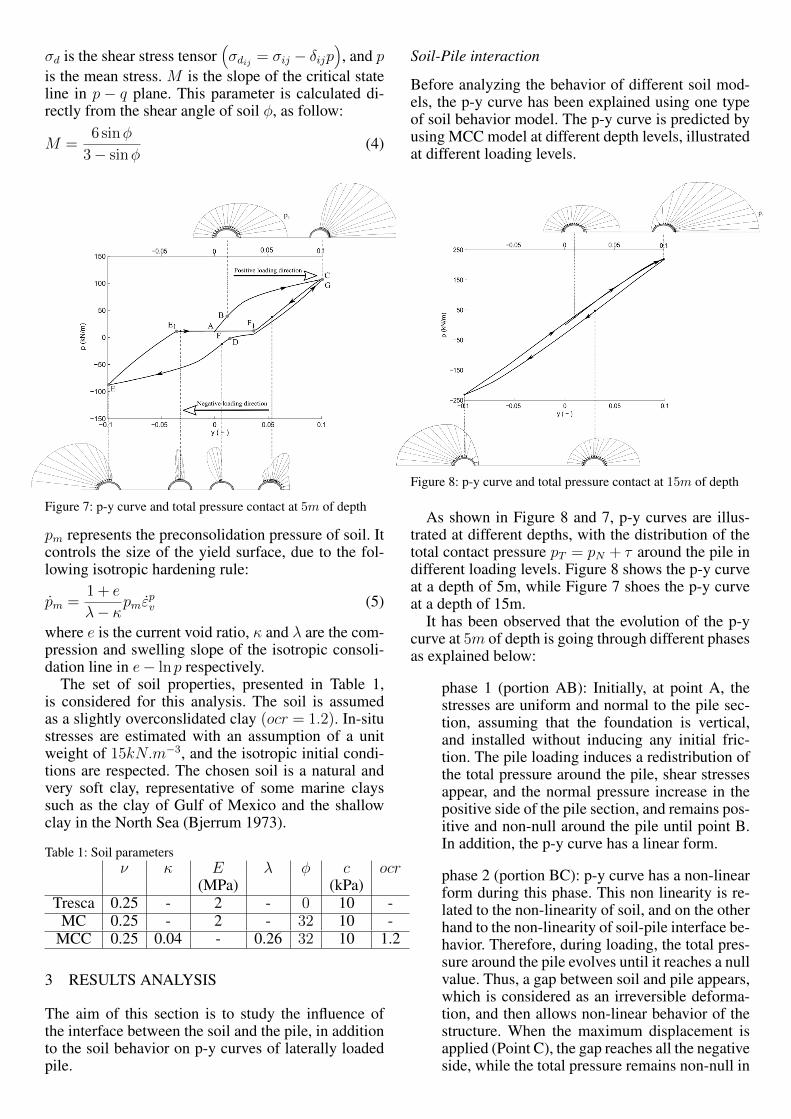
Figure 7: p-y curve and total pressure contact at 5m of depth
pm represents the preconsolidation pressure of soil. Itcontrols the size of the yield surface, due to the fol-lowing isotropic hardening rule:
pm =1+ e
λ− κpmε
pv (5)
where e is the current void ratio, κ and λ are the com-pression and swelling slope of the isotropic consoli-dation line in e− lnp respectively.
The set of soil properties, presented in Table 1,is considered for this analysis. The soil is assumedas a slightly overconslidated clay (ocr = 1.2). In-situstresses are estimated with an assumption of a unitweight of 15kN.m−3, and the isotropic initial condi-tions are respected. The chosen soil is a natural andvery soft clay, representative of some marine clayssuch as the clay of Gulf of Mexico and the shallowclay in the North Sea (Bjerrum 1973).
Table 1: Soil parametersν κ E λ φ c ocr
(MPa) (kPa)Tresca 0.25 - 2 - 0 10 -
MC 0.25 - 2 - 32 10 -MCC 0.25 0.04 - 0.26 32 10 1.2
3 RESULTS ANALYSIS
The aim of this section is to study the influence ofthe interface between the soil and the pile, in additionto the soil behavior on p-y curves of laterally loadedpile.
Soil-Pile interaction
Before analyzing the behavior of different soil mod-els, the p-y curve has been explained using one typeof soil behavior model. The p-y curve is predicted byusing MCC model at different depth levels, illustratedat different loading levels.
−0.1 −0.05 0 0.05 0.1−250
−150
−50
50
150
250
y ( − )
p (
kN
/m)
h=5m
Figure 8: p-y curve and total pressure contact at 15m of depth
As shown in Figure 8 and 7, p-y curves are illus-trated at different depths, with the distribution of thetotal contact pressure pT = pN + τ around the pile indifferent loading levels. Figure 8 shows the p-y curveat a depth of 5m, while Figure 7 shoes the p-y curveat a depth of 15m.
It has been observed that the evolution of the p-ycurve at 5m of depth is going through different phasesas explained below:
phase 1 (portion AB): Initially, at point A, thestresses are uniform and normal to the pile sec-tion, assuming that the foundation is vertical,and installed without inducing any initial fric-tion. The pile loading induces a redistribution ofthe total pressure around the pile, shear stressesappear, and the normal pressure increase in thepositive side of the pile section, and remains pos-itive and non-null around the pile until point B.In addition, the p-y curve has a linear form.
phase 2 (portion BC): p-y curve has a non-linearform during this phase. This non linearity is re-lated to the non-linearity of soil, and on the otherhand to the non-linearity of soil-pile interface be-havior. Therefore, during loading, the total pres-sure around the pile evolves until it reaches a nullvalue. Thus, a gap between soil and pile appears,which is considered as an irreversible deforma-tion, and then allows non-linear behavior of thestructure. When the maximum displacement isapplied (Point C), the gap reaches all the negativeside, while the total pressure remains non-null in
the positive side and reaches its maximum valuein front of the pile section.
phase 3 (portion CD) : The unloading phase isstarted. In the positive side, the soil reaction (p)decreases with unloading, until a gap appears. Inthe negative side, the contact pressure increases.
phase 4 (portion DE): first, the pile is loaded untilits initial position, and then loaded in the nega-tive direction up to 10% of pile diameter. Duringthis phase, the contact pressure is increasing inthe negative side, and decreasing in the positiveside, until its reaches its maximum value at pointE. The gap increases during this phase in the pos-itive side.
phase 5 (portion EF): During this phase, a hori-zontal displacement is applied in the positive di-rection until its initial position. The contact pres-sure decreased in the negative side, and increasesin the positive side. Then, the gap evolves in thenegative and positive sides. Due to the gap be-havior, the soil reaction (p) reaches its minimumvalue in the portion (E1F), where the two struc-tures are in contact just in the head of the pilesection.
phase 6 (portion FG): This section can be sub-divided into two portions, the first portion (FF1,which is similar to the portion E1F, and charac-terized by the gap in the negative and the positivesides, and the second portion (F1G), when thegap disappears in the positive side. The segmentF1G has the same form of the portion CD,duringthe unloading.
At 15 meters of depth, the distribution of contact pres-sure remains non-null around the pile during loadingand unloading phases. The resulted p-y curve has con-tinuous form, without any slop break.
As shown in Figures 8 and 7, the p-y curve has en-tirely different form compared to the extracted curvein 5 meters of depth. The resulted p-y curves have dif-ferent evolutions due to two main reasons. The firstreason is related to the depth of the analyzed surface,while the second reason is due to the soil-pile inter-face behavior resulting from the lateral loading on thepile. However, the consequence of the soil-pile inter-face behavior highly differs from one depth to an-other. For instance, at the depth of 5 meters, lateralloading shifts the soil together with the pile. This shiftcauses a redistribution of the contact pressure aroundthe pile and creates a gap between the soil and thepile. Thus, a null value is obtained for the total con-tact pressure as a result of that gap. However, the sameloading does not induce a gap at a depth of 15 meters,it only redistributes the contact pressure. From thisanalysis, it is concluded that the evolution of the lat-eral capacity (p) at a certain depth is entirely relatedto the soil behavior.
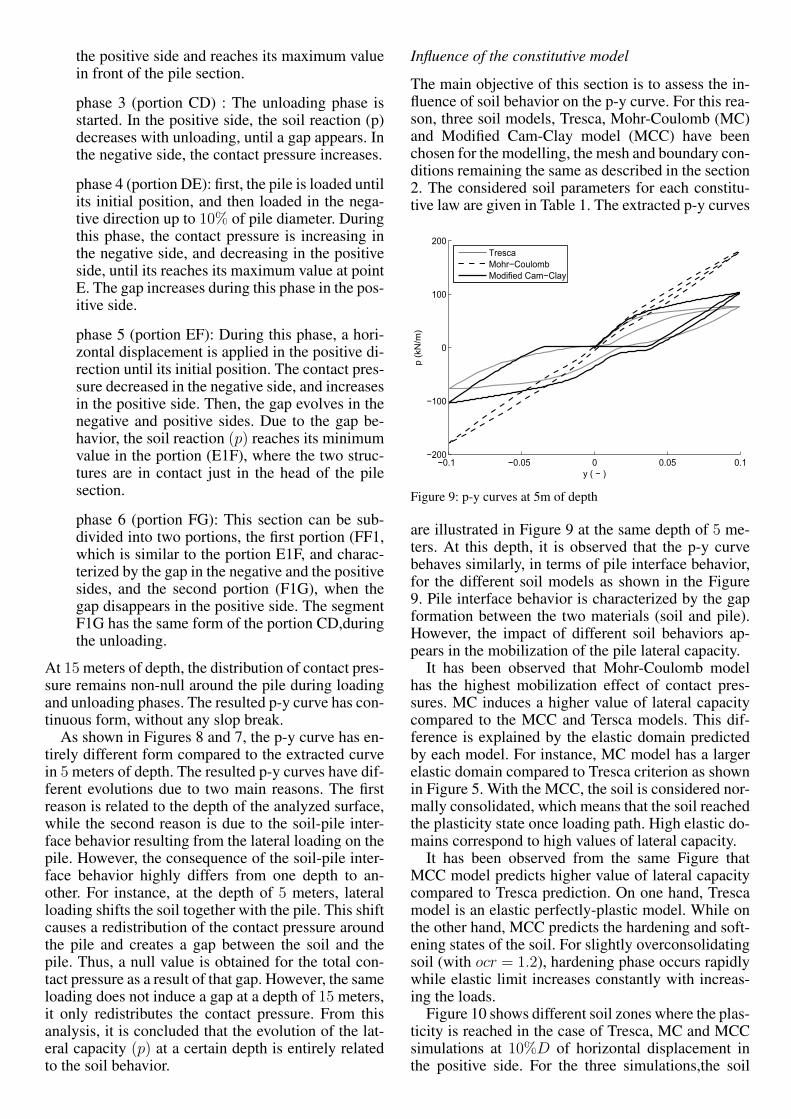
Influence of the constitutive model
The main objective of this section is to assess the in-fluence of soil behavior on the p-y curve. For this rea-son, three soil models, Tresca, Mohr-Coulomb (MC)and Modified Cam-Clay model (MCC) have beenchosen for the modelling, the mesh and boundary con-ditions remaining the same as described in the section2. The considered soil parameters for each constitu-tive law are given in Table 1. The extracted p-y curves
−0.1 −0.05 0 0.05 0.1−200
−100
0
100
200
y ( − )
p (
kN
/m)
Tresca
Mohr−Coulomb
Modified Cam−Clay
Figure 9: p-y curves at 5m of depth
are illustrated in Figure 9 at the same depth of 5 me-ters. At this depth, it is observed that the p-y curvebehaves similarly, in terms of pile interface behavior,for the different soil models as shown in the Figure9. Pile interface behavior is characterized by the gapformation between the two materials (soil and pile).However, the impact of different soil behaviors ap-pears in the mobilization of the pile lateral capacity.
It has been observed that Mohr-Coulomb modelhas the highest mobilization effect of contact pres-sures. MC induces a higher value of lateral capacitycompared to the MCC and Tersca models. This dif-ference is explained by the elastic domain predictedby each model. For instance, MC model has a largerelastic domain compared to Tresca criterion as shownin Figure 5. With the MCC, the soil is considered nor-mally consolidated, which means that the soil reachedthe plasticity state once loading path. High elastic do-mains correspond to high values of lateral capacity.
It has been observed from the same Figure thatMCC model predicts higher value of lateral capacitycompared to Tresca prediction. On one hand, Trescamodel is an elastic perfectly-plastic model. While onthe other hand, MCC predicts the hardening and soft-ening states of the soil. For slightly overconsolidatingsoil (with ocr = 1.2), hardening phase occurs rapidlywhile elastic limit increases constantly with increas-ing the loads.
Figure 10 shows different soil zones where the plas-ticity is reached in the case of Tresca, MC and MCCsimulations at 10%D of horizontal displacement inthe positive side. For the three simulations,the soil
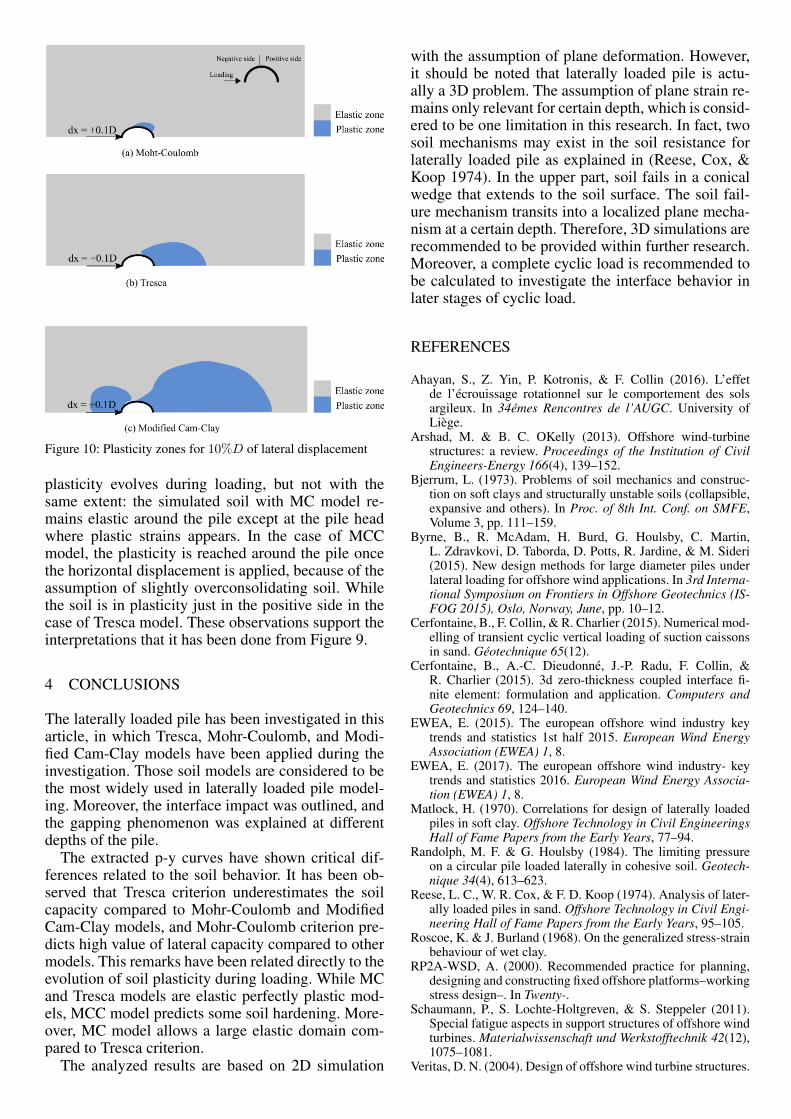
Figure 10: Plasticity zones for 10%D of lateral displacement
plasticity evolves during loading, but not with thesame extent: the simulated soil with MC model re-mains elastic around the pile except at the pile headwhere plastic strains appears. In the case of MCCmodel, the plasticity is reached around the pile oncethe horizontal displacement is applied, because of theassumption of slightly overconsolidating soil. Whilethe soil is in plasticity just in the positive side in thecase of Tresca model. These observations support theinterpretations that it has been done from Figure 9.
4 CONCLUSIONS
The laterally loaded pile has been investigated in thisarticle, in which Tresca, Mohr-Coulomb, and Modi-fied Cam-Clay models have been applied during theinvestigation. Those soil models are considered to bethe most widely used in laterally loaded pile model-ing. Moreover, the interface impact was outlined, andthe gapping phenomenon was explained at differentdepths of the pile.
The extracted p-y curves have shown critical dif-ferences related to the soil behavior. It has been ob-served that Tresca criterion underestimates the soilcapacity compared to Mohr-Coulomb and ModifiedCam-Clay models, and Mohr-Coulomb criterion pre-dicts high value of lateral capacity compared to othermodels. This remarks have been related directly to theevolution of soil plasticity during loading. While MCand Tresca models are elastic perfectly plastic mod-els, MCC model predicts some soil hardening. More-over, MC model allows a large elastic domain com-pared to Tresca criterion.
The analyzed results are based on 2D simulation
with the assumption of plane deformation. However,it should be noted that laterally loaded pile is actu-ally a 3D problem. The assumption of plane strain re-mains only relevant for certain depth, which is consid-ered to be one limitation in this research. In fact, twosoil mechanisms may exist in the soil resistance forlaterally loaded pile as explained in (Reese, Cox, &Koop 1974). In the upper part, soil fails in a conicalwedge that extends to the soil surface. The soil fail-ure mechanism transits into a localized plane mecha-nism at a certain depth. Therefore, 3D simulations arerecommended to be provided within further research.Moreover, a complete cyclic load is recommended tobe calculated to investigate the interface behavior inlater stages of cyclic load.
REFERENCES
Ahayan, S., Z. Yin, P. Kotronis, & F. Collin (2016). L’effetde l’ecrouissage rotationnel sur le comportement des solsargileux. In 34emes Rencontres de l’AUGC. University ofLiege.
Arshad, M. & B. C. OKelly (2013). Offshore wind-turbinestructures: a review. Proceedings of the Institution of CivilEngineers-Energy 166(4), 139–152.
Bjerrum, L. (1973). Problems of soil mechanics and construc-tion on soft clays and structurally unstable soils (collapsible,expansive and others). In Proc. of 8th Int. Conf. on SMFE,Volume 3, pp. 111–159.
Byrne, B., R. McAdam, H. Burd, G. Houlsby, C. Martin,L. Zdravkovi, D. Taborda, D. Potts, R. Jardine, & M. Sideri(2015). New design methods for large diameter piles underlateral loading for offshore wind applications. In 3rd Interna-tional Symposium on Frontiers in Offshore Geotechnics (IS-FOG 2015), Oslo, Norway, June, pp. 10–12.
Cerfontaine, B., F. Collin, & R. Charlier (2015). Numerical mod-elling of transient cyclic vertical loading of suction caissonsin sand. Geotechnique 65(12).
Cerfontaine, B., A.-C. Dieudonne, J.-P. Radu, F. Collin, &R. Charlier (2015). 3d zero-thickness coupled interface fi-nite element: formulation and application. Computers andGeotechnics 69, 124–140.
EWEA, E. (2015). The european offshore wind industry keytrends and statistics 1st half 2015. European Wind EnergyAssociation (EWEA) 1, 8.
EWEA, E. (2017). The european offshore wind industry- keytrends and statistics 2016. European Wind Energy Associa-tion (EWEA) 1, 8.
Matlock, H. (1970). Correlations for design of laterally loadedpiles in soft clay. Offshore Technology in Civil EngineeringsHall of Fame Papers from the Early Years, 77–94.
Randolph, M. F. & G. Houlsby (1984). The limiting pressureon a circular pile loaded laterally in cohesive soil. Geotech-nique 34(4), 613–623.
Reese, L. C., W. R. Cox, & F. D. Koop (1974). Analysis of later-ally loaded piles in sand. Offshore Technology in Civil Engi-neering Hall of Fame Papers from the Early Years, 95–105.
Roscoe, K. & J. Burland (1968). On the generalized stress-strainbehaviour of wet clay.
RP2A-WSD, A. (2000). Recommended practice for planning,designing and constructing fixed offshore platforms–workingstress design–. In Twenty-.
Schaumann, P., S. Lochte-Holtgreven, & S. Steppeler (2011).Special fatigue aspects in support structures of offshore windturbines. Materialwissenschaft und Werkstofftechnik 42(12),1075–1081.
Veritas, D. N. (2004). Design of offshore wind turbine structures.

Offshore Standard DNV-OS-J101 6, 2004.Zdravkovic, L., D. Taborda, D. Potts, R. Jardine, M. Sideri,
F. Schroeder, B. Byrne, R. McAdam, H. Burd, G. Houlsby,et al. (2015). Numerical modelling of large diameter pilesunder lateral loading for offshore wind applications. In Pro-ceeding 3rd International Symposium on Frontiers in Off-shore Geotechnics. Norway:[sn].
Zhang, F., B. Ye, T. Noda, M. Nakano, & K. Nakai (2007). Ex-planation of cyclic mobility of soils: Approach by stress-induced anisotropy. Soils and Foundations 47(4), 635–648.