laterally loaded pile cap connections · a design assuming a truly fixed ... 2.1 behavior of...
TRANSCRIPT
a
LATERALLY LOADED PILE CAP CONNECTIONS
Revised Final Report Work Task 4
by
Kyle M . Rollins and Tony E. Stenlund
Department of Civil and Environmental Engineering Brigham Young University 368 CB Provo, Utah 84602
Prepared for
Utah Dept of Transportation Research Division
Lead Agency for Pooled-Fund Study “Dynamic Passive Pressure on Abutments and Pile Caps”
May 2008

ABSTRACT
There is presently considerable uncertainty regarding appropriate connection
details between driven piles and pile caps. Prior research on the subject suggests that
given a proper embedment length, a specialized reinforced connection may not be
necessary. Eliminating these costly connection details could save thousands of dollars
on both labor and materials. This research study focuses on the importance of the
pile-to-cap connection detail with respect to the reinforcement connection and pile
embedment length.
Four pile caps were constructed, each with two 40 foot-long steel pipe piles,
and were tested with different connection details. Two caps included a reinforced
connection detail while the other two relied on their respective embedment lengths. A
hydraulic ram was used to apply a cyclic lateral force to each of these pile caps until
failure occurred. Load-displacement curves were developed for each pile cap and
strain gauge measurements were used to evaluate tension and bending moments in the
pile caps. Comparisons are presented regarding the effect of the connection on pile
cap response. An analysis has been conducted to best understand possible failure
modes; two computer modeling programs were used and their respective results have
been presented and compared to the observed readings.
This report provides test data supporting the theory that a proper embedment
length acts as an adequate connection in place of a specialized reinforced detail. A
pile cap with piles embedded two diameters into the cap performed successfully. In
contrast, a cap with piles embedded only one diameter failed after developing a large
crack through the entire cap. For the two pile caps with a reinforcing cage connection;
the performance was essentially the same for the piles embedded either six inches (.5
diameter) or twelve inches (one diameter) into the cap. The data produced was found
to be very similar to what was estimated by the two programs used for analysis
(GROUP 4.0 and LPILE 4.0).

ACKNOWLEDGMENTS
Funding for this project was provided by Contract No 069148 “Dynamic
Passive Pressure of Abutments and Pile Cap” with the Utah Department of
Transportation as part of a pooled-fund study supported by Departments of
Transportation from California, Oregon, Montana, New York and Utah. Daniel Hsiao
served as the project manager for UDOT. This support is gratefully acknowledged.
Nevertheless, the opinions, interpretations and recommendations in this report are
those of the author and do not necessarily reflect those of the sponsors.
iiix
TABLE OF CONTENTS 1 INTRODUCTION .....................................................................................................1
1.1 Background......................................................................................................1
1.2 Objective and Scope ........................................................................................2
2 DESCRIPTION OF PROBLEM..............................................................................3
2.1 Behavior of Laterally Loaded Pile Groups......................................................3
2.2 Literature Review ............................................................................................4
2.3 H Pile to Pile Cap Connections .......................................................................4
2.4 Pipe Pile to Pile Cap Connections ...................................................................9
2.5 Prestressed Pile to Pile Cap Connections ......................................................14
2.6 Timber Pile to Pile Cap Connections ............................................................18
2.7 Related Testing and Analysis Papers ............................................................19
2.8 Summary of Literature Review .....................................................................23
3 TEST SETUP...........................................................................................................31
3.1 General Remarks ...........................................................................................31
3.2 Site Description .............................................................................................32
3.3 Pile and Cap Description ...............................................................................34
3.4 Instrumentation..............................................................................................39
4 ANALYTICAL STUDY..........................................................................................54
4.1 Introduction ...................................................................................................54
4.2 Failure in the Piles .........................................................................................55
iix
4.3 Failure in the Cap ..........................................................................................56
4.4 Failure in the Surrounding Soil .....................................................................58
4.5 Failure in the Connection ..............................................................................59
4.6 Rotational Restraint .......................................................................................66
4.7 Summary of Predictions ................................................................................67
5 TEST RESULTS......................................................................................................68
5.1 General Remarks ...........................................................................................68
5.2 Pile Cap Test Results.....................................................................................69
5.3 Analysis of Longer Piles ...............................................................................89
5.4 Comparison of Observed Strain ....................................................................91
5.5 Comparison of Observed Moments...............................................................97
5.6 Comparison of Test Results.........................................................................101
6 CONCLUSIONS....................................................................................................105
6.1 Summary......................................................................................................105
6.2 Conclusions .................................................................................................106
6.3 Recommendation for Future Research ........................................................108
6.4 Implementation of Results...........................................................................108
7 REFERENCES ......................................................................................................110
Appendix A.....................................................................................................................113
xi
SYMBOLS AND NOTATION
a = eccentricity of load or distance from last row of trailing piles to point of rotation Ac = cross sectional area of concrete under consideration As = area of reinforcement b = width of member b’ = pile spacing bf = flange width of steel pile section c = clear cover of concrete typically 2 to 3inches Cm = modified characteristic moment parameter d = distance to extreme fiber D = pile diameter db = bar diameter e = eccentricity from point of zero moment to the center of the effective embedment E = modulus of elasticity F = the applied force f’c = compressive strength of concrete (psi) fy = yield strength of steel Fy = yield strength of steel h = distance between strain gages I = moment of inertia Kmθ = rotational restraint coefficient KΔc = axial stiffness at the top of the piles in compression KΔt = axial stiffness at the top of the piles in tension L = distance between string potentiometers L* = distance from lateral loads point of application to the neutral axis of the joint le = Le = le embedment length M = observed moment during testing M’c = modified characteristic moment Mc = original characteristic moment Mf = experimental moment resistance Mj = nominal moment capacity of concrete pile cap Mp = plastic moment Mr = theoretical moment resistance Mrc = moment capacity of a concrete filled circular steel pipe Nu = factored axial load normal to cross section s = distance between symmetrically placed As and A’s Su = soil undrained shear strength t = thickness of pipe y = distance from the neutral axis to the compression fiber Vu = shear capacity X1 = amount of deflection observed from string potentiometers at location 1 X2 = amount of deflection observed from string potentiometers at location 2
xii
xi = distance from last row of trailing piles to center of pile z = embedment depth of pile top below ground surface Z = plastic modulus of steel section alone α = concrete factor for reinforcement location β = concrete factor for coating σ = calculated stress δv = vertical translation γ = concrete factor for unit weight γ' = effective unit weight of soil γ = unit weight of soil εc = observed strain in compression εt = observed strain in tension Φ = reduction value phi (.75 for shear) ω = reinforcement index equal to As/(ble)
1
1 INTRODUCTION
1.1 Background
Piles are a very common foundation choice for bridges, high-rise buildings and
other large structures. These piles must be capable of resisting large lateral forces
brought on by earthquakes, wind and wave action. Research has shown that the pile
cap connection itself can significantly increase the lateral resistance provided by the
foundation against these forces. For example, a pile cap providing a fixed-head
boundary will produce a stiffer load-deflection curve than a pile cap which allows
rotation. However, relatively little research and testing has been performed to
evaluate the effect of the pile to pile cap connection on the degree of fixity and overall
response of the pile cap.
This research study has focused on the connection detail between the pile and
pile cap and its effect on pile cap stiffness and rotation. In order to analyze a pile head
under lateral loading it must be determined whether the connection is in a fixed or
pinned condition. From a stiffness standpoint, it is desirable to have a pure fixed head
connection yet this is seldom achievable in the field. A design assuming a truly fixed
head connection would likely result in underestimated values of deflection, as well as
incorrect estimates of the magnitudes and locations of bending moments. On the other
2
hand a design assuming a pinned connection which fails to resist moments could result
in a very costly over design.
Previous research and testing has shown that piles embedded a limited depth
into the pile cap will resist only shear and axial loads while piles embedded an
adequate depth will resist moments as well and significantly reduce lateral deflections.
It has been determined that this boundary condition is a function of the pile-to-cap
embedment length with less importance on the connecting steel reinforcement. This
report focuses on this connection as a function of reinforced steel and the embedment
length. This design must include a connection able to fully develop the piles’ capacity
while resisting lateral forces and the accompanying moment.
1.2 Objective and Scope
This research has been undertaken to better understand the importance of pile
cap connections on lateral pile cap and abutment behavior. The goal in connection
design is to provide a connection capable of developing moment capacity equal to the
moment demands on the pile while remaining essentially rigid. Ideally, it is desired
to eliminate the special reinforcement details and rather provide a proper pile
embedment length. This would result in a simpler construction process and lower
overall cost. In this study, four pile cap connections involving 12 inch ID pipe piles
were tested in the field under full-scale conditions. Connnection details included pile
embedments of 6 and 12 inches with reinforcing cages extending into the pile cap
along with pile embedments of 12 and 24 inches without any reinforcing connection.
3
2 DESCRIPTION OF PROBLEM
2.1 Behavior of Laterally Loaded Pile Groups
Piles are most often placed in groups with a variety of alignment and spacing
arrangements. The piles are then capped with a concrete pile cap which encases the
piles. On occasion, individual piles are used, though this is less common in the field.
Driven pile foundations typically consist of steel pipes filled with concrete, steel H
sections or pre-stressed concrete. Pile groups perform differently than single piles, due
to the soil-pile-soil interaction which is a function of pile spacing. The larger the
spacing, the less the overlapping of shear zones and the greater the lateral pile
resistance.
Typically, the foundation system is designed so that its capacity will exceed
that of the column or structural system above ground. This approach ensures that
damage will occur above ground where it can more easily be detected and repaired.
Therefore, the designer must be certain that the foundation system will develop its full
design capacity. For lateral load conditions, the moment capacity of the pile
foundation will typically govern the pile section properties. For a fixed-head pile
group the maximum negative moment occurs at the base of the pile cap while the
maximum positive moment occurs in the pile at a short depth below the base. It is,
therefore, desirable to construct a pile cap that will be strong enough so that the pile
4
can achieve its full moment capacity. In this regard, the connection must be able to
resist the large negative moment for the foundation system to be considered efficient.
As indicated previously, the moment capacity at the connection depends on both the
depth of embedment of the pile and the reinforcement arrangement. This research and
testing, which focuses on these issues, is therefore very important to future design and
construction of pile systems.
2.2 Literature Review
Due to the extensive use of piles in foundation systems, a number of
publications relating to pile cap connections are available in the literature. A literature
review was conducted to obtain all available research and/or testing concerning
laterally loaded pile caps and their connections. Most of the publications involve
laboratory tests on different pile to pile cap connection details; however some of the
papers also involve numerical modeling or analytical models based on the test results.
The publications reviewed have been divided into five groups: (1) H pile to pile cap
connections, (2) Pipe pile to pile cap connections, (3) Pre-stressed pile to pile cap
connections, (4) Timber pile to pile cap connections, and (5) Related testing and
analysis papers
2.3 H Pile to Pile Cap Connections
Marcakis and Mitchell (1980) developed an analytical model considered to be
conservative in determining the capacity of a pile-pile cap connection based on the
results of a series of 25 tests involving steel members embedded in reinforced concrete
sections. Steel members ranged from welded or embedded H piles, pipe piles filled
5
cLe
cLbfV
e
ecu
−+
−= 6.31
)(85.0 ''
with concrete and empty, to standard steel plates. The design method outlined in the
1971 PCI Design Handbook for connections incorporating embedded structural steel
was shown to have several inconsistencies. Multiple design charts were then
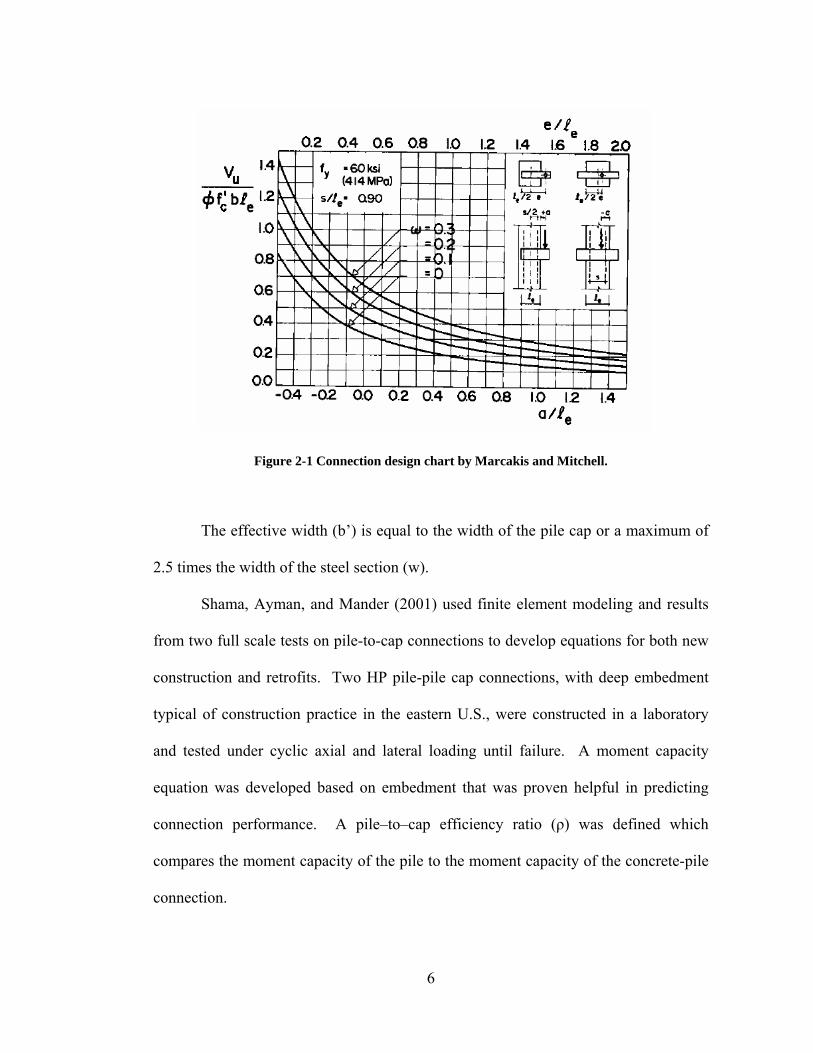
developed with varying material properties, Figure 2-1 shows an example of one of
those charts. With most material properties and member dimensions known the
designer would choose suitable values of the embedment length (Le), width (b),
eccentricity (e), and be able to enter the appropriate design chart to determine a proper
reinforcement connection.
Marcakis and Mitchell (1980) proposed equation 2-1 to compute the ultimate
shear force (Vu) that can be carried by a pile-pile cap connection. The equation is
based on a strut-and-tie approach and uses uniform stress distributions along the
embedment zone to determine the required embedment length (Le). The moment
capacity of a connection can be determined by multiplying the shear capacity as
determined in equation 2-1 by the eccentricity (e) from the point of zero moment to
the center of the effective embedment (embedment minus cover depth) as shown in
Fig. 2-1.
( 2-1)
6
Figure 2-1 Connection design chart by Marcakis and Mitchell.
The effective width (b’) is equal to the width of the pile cap or a maximum of
2.5 times the width of the steel section (w).
Shama, Ayman, and Mander (2001) used finite element modeling and results
from two full scale tests on pile-to-cap connections to develop equations for both new
construction and retrofits. Two HP pile-pile cap connections, with deep embedment
typical of construction practice in the eastern U.S., were constructed in a laboratory
and tested under cyclic axial and lateral loading until failure. A moment capacity
equation was developed based on embedment that was proven helpful in predicting
connection performance. A pile–to–cap efficiency ratio (ρ) was defined which
compares the moment capacity of the pile to the moment capacity of the concrete-pile
connection.
7
*
2'
6LLLbf
Me
efcp
+=
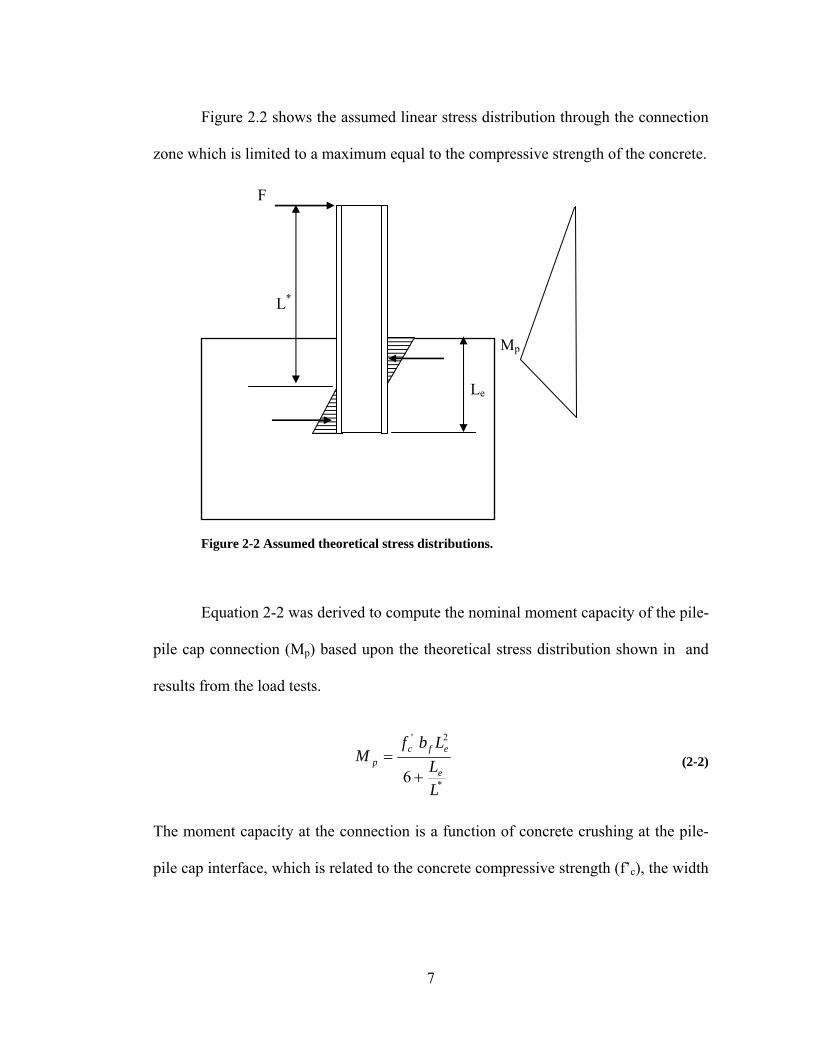
Figure 2.2 shows the assumed linear stress distribution through the connection
zone which is limited to a maximum equal to the compressive strength of the concrete.
Figure 2-2 Assumed theoretical stress distributions.
Equation 2-2 was derived to compute the nominal moment capacity of the pile-
pile cap connection (Mp) based upon the theoretical stress distribution shown in and
results from the load tests.
( 2-2)
The moment capacity at the connection is a function of concrete crushing at the pile-
pile cap interface, which is related to the concrete compressive strength (f’c), the width
Le
L*
F
Mp
8
of the H pile (bf), and the length of pile embedment (Le). As the embedment length is
increased, the bearing area of concrete increases leading to larger moment capacity.
Shama, Mander and Chen (2002a) investigated the connection capacity of H
piles embedded into bent pier caps which are typically located 12 to 15 above the
ground surface. Initially, cyclic lateral load tests were performed on five HP 10 x 42
pile sections embedded 1 ft into reinforced concrete pile cap which was 2 ft deep and
2.3 ft wide. Lateral load was applied at 10 ft above the pile cap. The pile caps were
reinforced with 4 #9 bars in the top and bottom along with stirrups consisting of #4
bars at 8 inch spacing. Tests were performed about the strong axis on 3 piles and
about the weak axis on 2 piles. The 1 ft embedment was sufficient to develop the full
moment capacity of the pile in the weak direction, but non-ductile failure eventually
occurred for the pile cap for the tests in the strong direction.
Based on the test results, a simplified analytical model was developed to
compute moment capacity as a function of embedment depth along with pile and pile
cap material properties. These analyses suggested that the embedment depth would
need to be increased to a depth between 1.5 and 2 pile widths. Subsequently, another
set of lateral cyclic load tests were performed on the same HP sections described
previously with embedment of 2 ft into a deeper pile cap. With this embedment depth,
the moment capacity of the connection exceeded that of the pile and a ductile failure
was observed.
While previous studies involved tests on H piles embedded 1 to 2 ft into the pile
cap, engineering practice in the Western US has often designed the pile-pile cap
connection to act as a pinned connection. The embedment is only 5 inches deep and
9
the pile is connected to the pile cap using some type of reinforcing detail. Xiao et al
(2006) conducted experimental studies to evaluate the behavior of these shallow
embedment connection details. The tests involved cyclic vertical and lateral load tests
on five HP 14x89 piles which were embedded 5 inches into the pile cap. Two 2 inch
diameter holes were drilled through the web of the H piles and V-shaped reinforcing
bars (#8 bars, 2.5 ft long, 60º interior angle) were threaded through the H pile and into
the pile cap. The pile cap was 4 ft thick, 4 ft long and 3.5 ft wide and was reinforced
top and bottom with a grid of #8 bars at 6 inch spacing in one direction and 7 inches in
the other. Vertical stirrups consisting of #5 bars were installed at 12 inch spacing in
one direction and 14 inch psapcing in the other.
The vertical tests indicated that the V-shaped reinforcing provided only 40 to
70% of the computed ultimate capacity and less than the tensile capacity of the H pile.
In addition, the lateral testing showed that the connection did not act as a pinned
connection as designed, but sustained a moment ranging from 25 to 66 percent of the
ultimate moment capacity of the H pile. To provide any reasonable agreement with
the observed moment capacity of the section, consideration had to be given to capacity
from both embedment and flexure mechanisms.
2.4 Pipe Pile to Pile Cap Connections
Steunenberg et al (1998) performed lateral cyclic load tests on a 12 ID steel
pipe pile with a 0.5 inch wall thickness which was welded to a 25 x 24 inch x 2 inch
thick steel plate. The steel plate was attached to the base of a reinforced concrete pile
cap using 30 deformed studs, each 0.59 inches in diameter and 23.6 inches long. The
10
moment capacity of the connection exceeded that of the pipe pile and the pile failed in
a ductile manner.
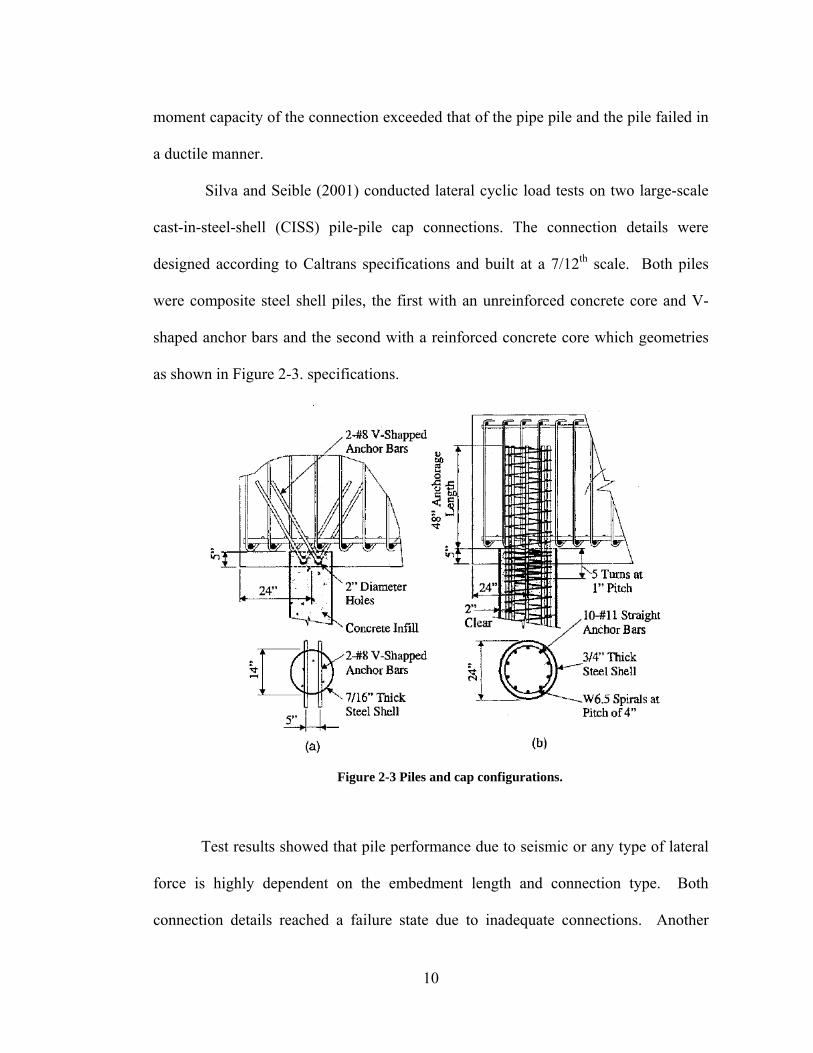
Silva and Seible (2001) conducted lateral cyclic load tests on two large-scale
cast-in-steel-shell (CISS) pile-pile cap connections. The connection details were
designed according to Caltrans specifications and built at a 7/12th scale. Both piles
were composite steel shell piles, the first with an unreinforced concrete core and V-
shaped anchor bars and the second with a reinforced concrete core which geometries
as shown in Figure 2-3. specifications.
Figure 2-3 Piles and cap configurations.
Test results showed that pile performance due to seismic or any type of lateral
force is highly dependent on the embedment length and connection type. Both
connection details reached a failure state due to inadequate connections. Another
11
important observation was that when piles are subjected to combined axial and lateral
loads, fracture can occur within the connection reinforcement below the design tension
load. Observations from both the tests and analytical data were collected in order to
develop limit states and better define and predict damage levels.
The following six limit states were defined by Silva and Seible;
• Pile elastic limit – defined based on a performance level such that any
noticeable damage does not require repair. This was the first limit state
noticed for both tests and was indicated by the development of thin cracks
which emanated at 45 degrees from the pile base to the sides of the cap.
• Pile cap concrete cover spalling – occurs due to rotation and prying and is
evidenced by extensive damage to the pile cap concrete cover. Unlike the first
test this limit state occurred near failure in test two.
• Pile cap joint region cracking – defined as an onset of joint shear cracking
typically occurring simultaneously with the pile elastic limit state and visible in
both tests by cracks emanating from the seating region. Also defined when
principal stresses in the joint region exceed '5.3 cf .
• Pile functional evaluation limit state – moderate damage occurs at this limit
state yet the structure does not lose strength and no exposure to reinforcement
occurs. Also defined when the anchor bars exceed a strain of 0.0325.
• Pile cap joint shear failure – defined when the principal tensile stresses
exceed '5 cf , which correspond to poorly reinforced concrete. This was
found to occur only in test two.
12
• Pile safety evaluation limit state – significant damage occurs, requiring repair
or replacement of the structure. This was found to be the limit state in test one
with the strain in the anchor bars exceeding the maximum allowable of 0.065.
Test two failed due to large rotations causing exposure to the pile cap
reinforcement along the bottom layer.
A better understanding of the limit states defined above will allow the designer
to account for inelastic deformations in the piles, thus reducing the number of piles
required and the size of the pile cap. This will also reduce the stiffness in the
foundation system thus decreasing the column displacement ductility demand. These
significant changes will lead to a more economical foundation design and reduce the
damage in the column under a seismic event.
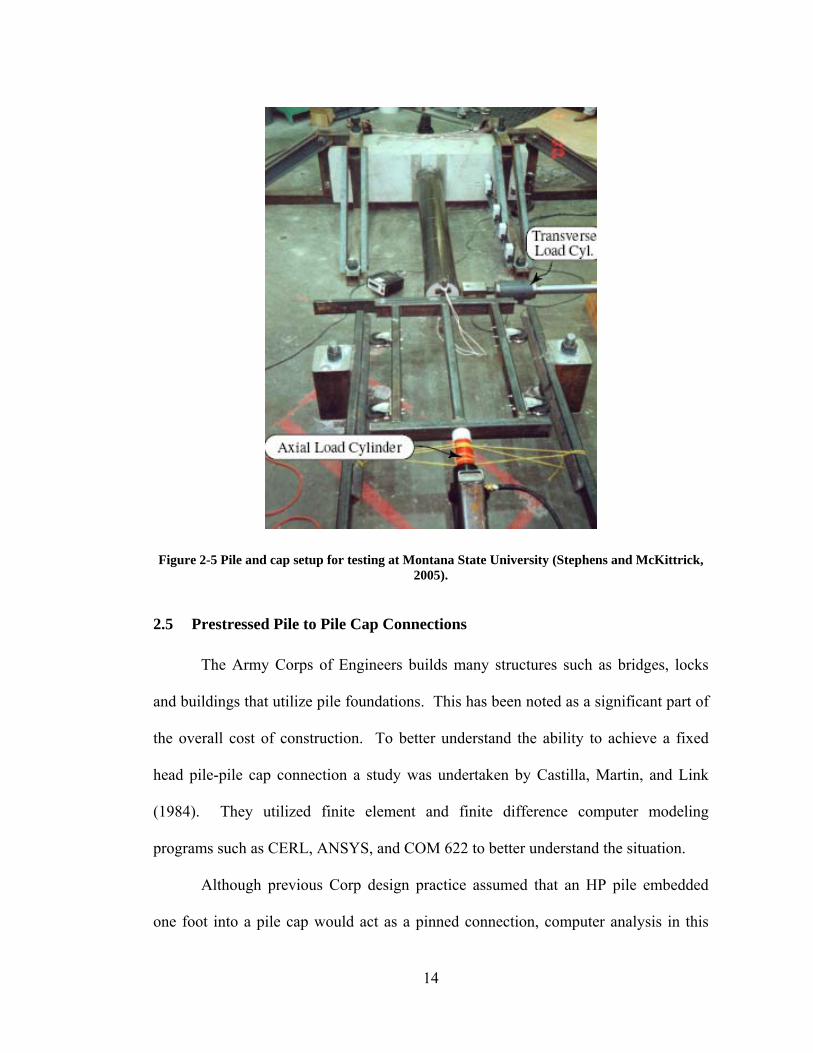
Stephens and McKittrick (2005) performed laboratory tests on five one-half
scale steel pipe columns embedded in a concrete pile cap and filled with unreinforced
concrete. For each test the pile was embedded 9 inches into the cap with no other
reinforcing details provided. A photograph of the test setup is presented in Figure 2-5.
With each additional test the amount of steel in the cap, both in the longitudinal and
transverse directions, was increased in an effort to evaluate the importance of
reinforcing steel in the pile cap to the moment capacity of the pile-pile cap connection.
By using one-half scale models there was only 4.5 inches of concrete cover provided
around the pile although design guidelines often call for at least one foot of concrete
surround each pile.
Tests 1 and 2 had pile cap reinforcing steel ratios in the longitudinal and
transverse directions of 0.41 and 0.09%, respectively. With increasing lateral loads
13
the caps failed through concrete cracking in the cap and it appeared that the
reinforcing steel was unable to carry the tension forces. Tests 3 and 3a had increased
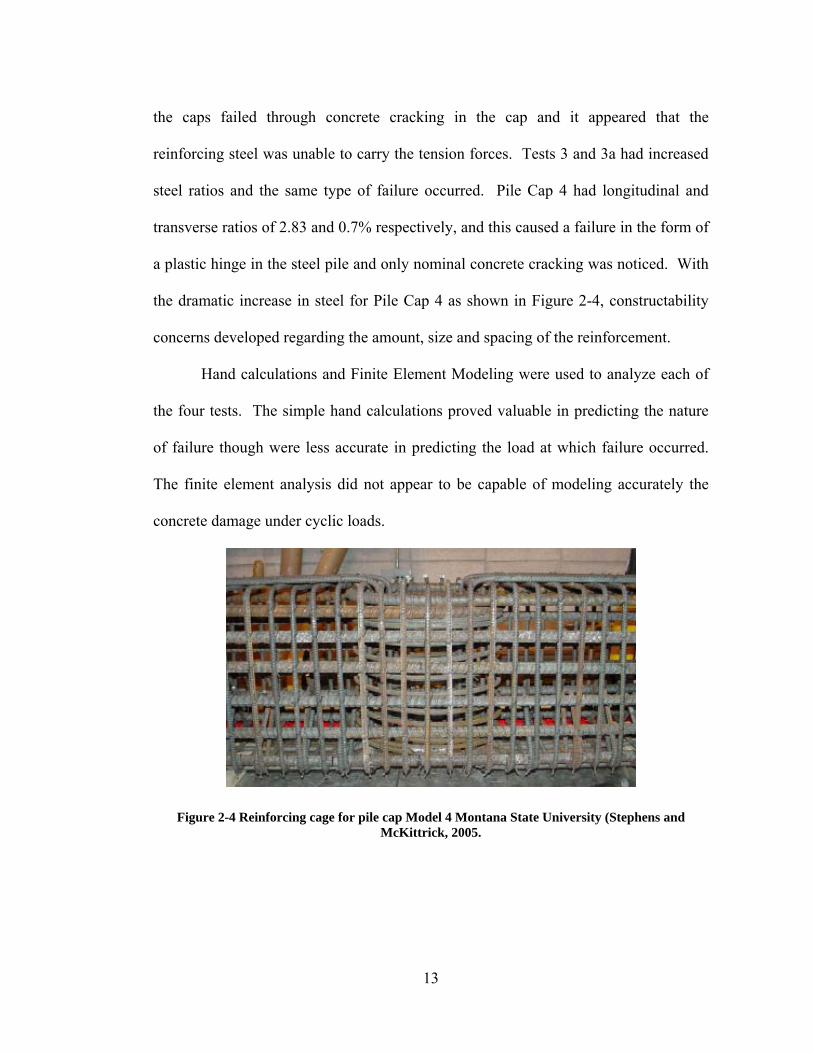
steel ratios and the same type of failure occurred. Pile Cap 4 had longitudinal and
transverse ratios of 2.83 and 0.7% respectively, and this caused a failure in the form of
a plastic hinge in the steel pile and only nominal concrete cracking was noticed. With
the dramatic increase in steel for Pile Cap 4 as shown in Figure 2-4, constructability
concerns developed regarding the amount, size and spacing of the reinforcement.
Hand calculations and Finite Element Modeling were used to analyze each of
the four tests. The simple hand calculations proved valuable in predicting the nature
of failure though were less accurate in predicting the load at which failure occurred.
The finite element analysis did not appear to be capable of modeling accurately the
concrete damage under cyclic loads.
Figure 2-4 Reinforcing cage for pile cap Model 4 Montana State University (Stephens and McKittrick, 2005.
14
Figure 2-5 Pile and cap setup for testing at Montana State University (Stephens and McKittrick, 2005).
2.5 Prestressed Pile to Pile Cap Connections
The Army Corps of Engineers builds many structures such as bridges, locks
and buildings that utilize pile foundations. This has been noted as a significant part of
the overall cost of construction. To better understand the ability to achieve a fixed
head pile-pile cap connection a study was undertaken by Castilla, Martin, and Link
(1984). They utilized finite element and finite difference computer modeling
programs such as CERL, ANSYS, and COM 622 to better understand the situation.
Although previous Corp design practice assumed that an HP pile embedded
one foot into a pile cap would act as a pinned connection, computer analysis in this
15
study indicated that such a value was unrealistic. According to the analysis, a 1 foot
embedment length actually developed between 61 and 83% of the fixed-head moment
and therefore could be considered partially fixed. The study concluded that for HP
piles the ratio of embedment length to pile width should be greater than two in order to
obtain full fixity.
Joen and Pak (1990) investigated a variety of approaches for connecting cast-
in-place concrete pile caps to prestressed piles. The piles were 15.7 inch octagonal
prestressed concrete piles and the pile cap was 3 feet square in plan. Steel
reinforcement ratios in the pile cap were 0.55 and 0.09 percent in the longitudinal and
transverse direction, respectively. The connection details included (a) embedding the
piles in the cap with an embedment length of 31. 5 inch and a spiral encircling the pile
along the embedment length, (b) breaking away the concrete on the end of the the pile
over a 2 ft length and embedding it in the cap to this depth, and (c) simply embedding
dowel bars in the pile that extended into the pile cap. During cyclic loading failure
occurred by the formation of a plastic hinge in the precast pile at the face of the pile
cap and only minor cracking was observed in the pile cap. With the exception of one
test, a minimum ductility ratio of eight was observed.
Harries and Petrou (2001) noted the difficulty, time and expense required to
provide special connection details for prestressed pile such as those tested by Joen and
Park (1990). Their objective was to determine if adequate capacity could be provided
by simply embedding the prestressed pile without an special connection detail. The
study combined previous test results with results from two new lab tests on full-scale
pile-to-pile caps with different connection details to provide evidence that no special
16
details are necessary if the proper embedment length is provided. The pile-to-cap
assembly was tested as a cantilever beam in a horizontal position. Two separate tests
were performed using an 18 inch square precast concrete pile embedded 18 inches and
24 inches into a 7 feet x 7 feet x 3 feet pile cap. The precast piles were 18 ft long.
Each cap was reinforced with No. 7 longitudinal bars on the top and bottom at 6
inches spacing and No. 3 ties at 6 inches spacing in the transverse direction and
through the depth of the pile cap.
Both piles first began to crack at the interface with a moment of 169 ft-kips
and yield displacement at the interface was measured to be 1 inch, which occurred at a
moment of 246 ft-kips. Harris and Petrou concluded that the embedment lengths were
sufficient to develop the moment capacity without a special connection detail. They
concluded that an embedment length equal to the pile width would be sufficient to
develop the moment capacity of the pile. This condition would provide a “weak pile,
strong pile cap” behavior that permits easier inspection and repair in the event of an
earthquake.
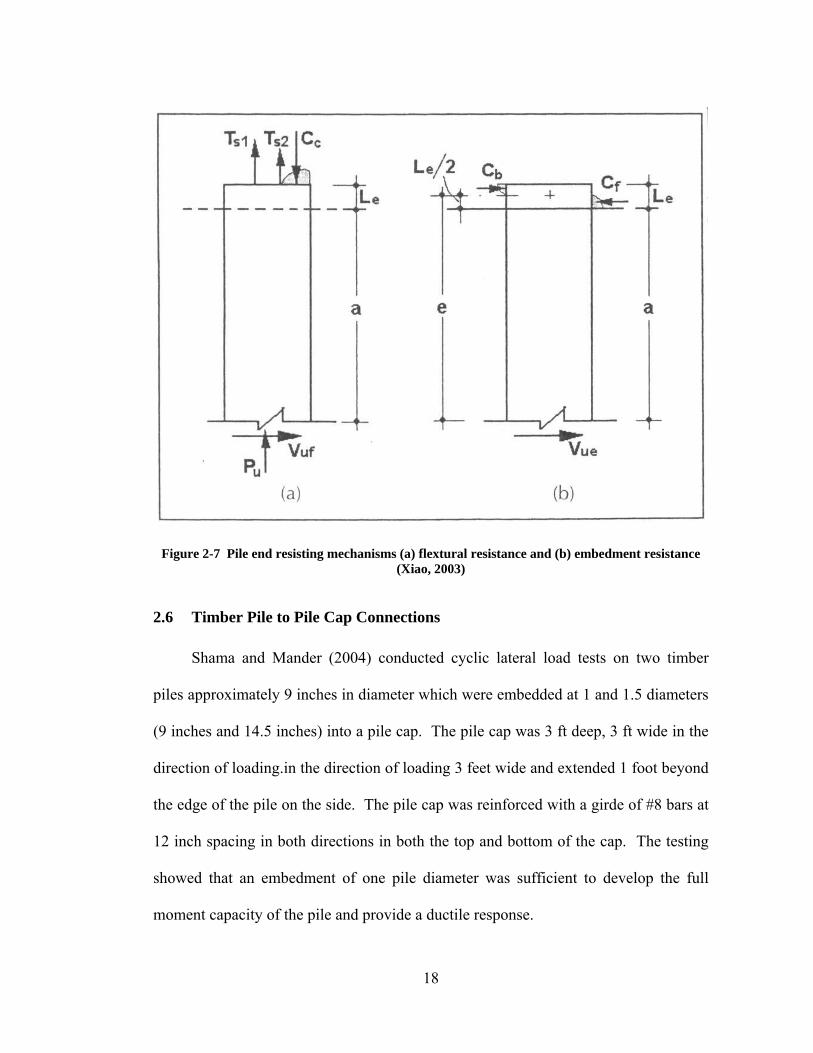
In contrast to previous tests on prestressed concrete piles where embedment or
special connection details were tested, Xiao (2003) conducted large-scale cyclic axial
and lateral load tests on prestressed piles with very shallow embedments. The piles
represented Caltrans Class 70 full-scale pile. They were 14 inch square and were 67
inches long, with a compressive strength of the concrete was 8.6 ksi. Six 0.5 inch
diameter seven wire strands were used for prestressing. The pile segements were
confined by ASTM grade A82 w11 wire spirals with a nominal diameter of 9.5 mm
spaced at 2 inches. Four #6 bar dowels were cast full-length inside the pile and
17
extended 34 inches beyond the end of the pile. The end of the pile cap was embedded
3 inches into the pile cap which was 3.16 ft deep x 2.84 ft wide and 5 ft long. The pile
cap reinforcement consisted of a top and bottom mat of #8 bars spaced at 5.3 inches in
the top and 10.6 inches, respectively.
Despite the shallow embedment, the connection detail was able to resist
considerable moment. In order to compute a moment capacity near the measured
value, it was necessary to consider moment from bearing on the embedded portion of
the pile and moment from flexure at the top of the pile as illustrated in Fig. 2-4.
These results are in good agreement with tests on H piles with shallow embedment
reported by Xiao et al (2006). Xiao (2003) also found that the moment capacity due
to embedment was predicted best by the the PCI Design handbook (PCI, 1999)
equation given by
e
ecu Le
LbfV/6.31
85.0 ''
+= (2-4)
Finally, the dowel connection detail was sufficient to provide the full compressive and
tensile capacity of the pile section.
18
Figure 2-7 Pile end resisting mechanisms (a) flextural resistance and (b) embedment resistance (Xiao, 2003)
2.6 Timber Pile to Pile Cap Connections
Shama and Mander (2004) conducted cyclic lateral load tests on two timber
piles approximately 9 inches in diameter which were embedded at 1 and 1.5 diameters
(9 inches and 14.5 inches) into a pile cap. The pile cap was 3 ft deep, 3 ft wide in the
direction of loading.in the direction of loading 3 feet wide and extended 1 foot beyond
the edge of the pile on the side. The pile cap was reinforced with a girde of #8 bars at
12 inch spacing in both directions in both the top and bottom of the cap. The testing
showed that an embedment of one pile diameter was sufficient to develop the full
moment capacity of the pile and provide a ductile response.
19
2.7 Related Testing and Analysis Papers
In assessing the ultimate moment capacity of a concrete filled pipe, several
methods can be employed. Since the goal of the design is for the pile cap connection
to exceed the moment capacity of the pile, an accurate assessment of the pile’s
moment capacity is desired. Bruneau and Marson (2004) conducted full-scale
laboratory tests on steel pipe with reinforced concrete infill in an effort to evaluate
existing design codes used throughout the world to compute moment capacity.
Multiple codes exist throughout the world and each has its own equations and
assumptions to determine proper design limits. Unfortunately, the accuracy of the
various methods and their relative differences are largely unknown. Four specimens
were tested with the load applied laterally at the end of the pipe and the failure
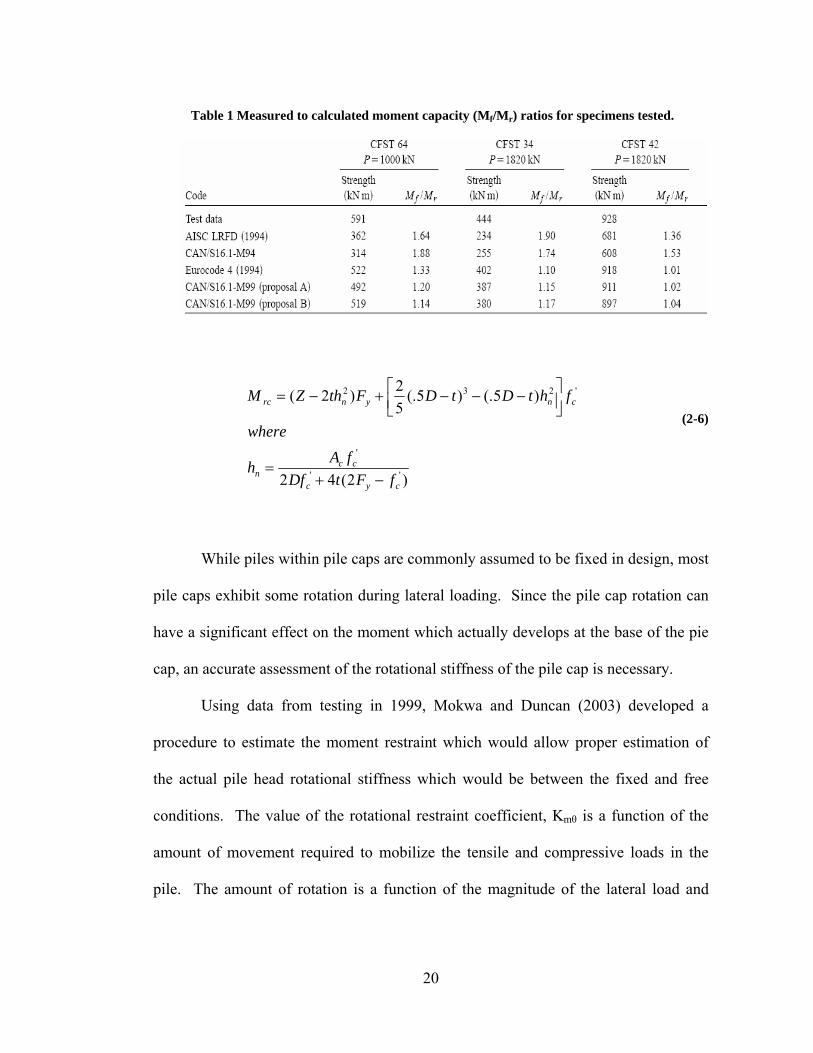
occurring at the concrete foundation. Table 1 shows the moment capacity from test
data and predictions from five separate codes. It was noted that the AISC LRFD 1994
edition underestimated strength capacities by a significant margin while the Eurocode
4 (1994) proved to be the most accurate.
Equation 2-6 was developed to better calculate the moment capacity of a pipe
pile with concrete fill. It was also shown that whether the concrete in the pipe is
strengthened with reinforcement or not it still provides confinement and delays local
buckling.
20
)2(42
)5(.)5(.52)2(
''
'
'232
cyc
ccn
cnynrc
fFtDffAh
where
fhtDtDFthZM
−+=
⎥⎦⎤
⎢⎣⎡ −−−+−=
Table 1 Measured to calculated moment capacity (Mf/Mr) ratios for specimens tested.
( 2-6)
While piles within pile caps are commonly assumed to be fixed in design, most
pile caps exhibit some rotation during lateral loading. Since the pile cap rotation can
have a significant effect on the moment which actually develops at the base of the pie
cap, an accurate assessment of the rotational stiffness of the pile cap is necessary.
Using data from testing in 1999, Mokwa and Duncan (2003) developed a
procedure to estimate the moment restraint which would allow proper estimation of
the actual pile head rotational stiffness which would be between the fixed and free
conditions. The value of the rotational restraint coefficient, Kmθ is a function of the
amount of movement required to mobilize the tensile and compressive loads in the
pile. The amount of rotation is a function of the magnitude of the lateral load and
21
( )[ ] ( )[ ]∑ ∑= =
ΔΔ −+−=ΔΔ
=n
i
n
iiticM axKaxKMK
1 1
22
θθ
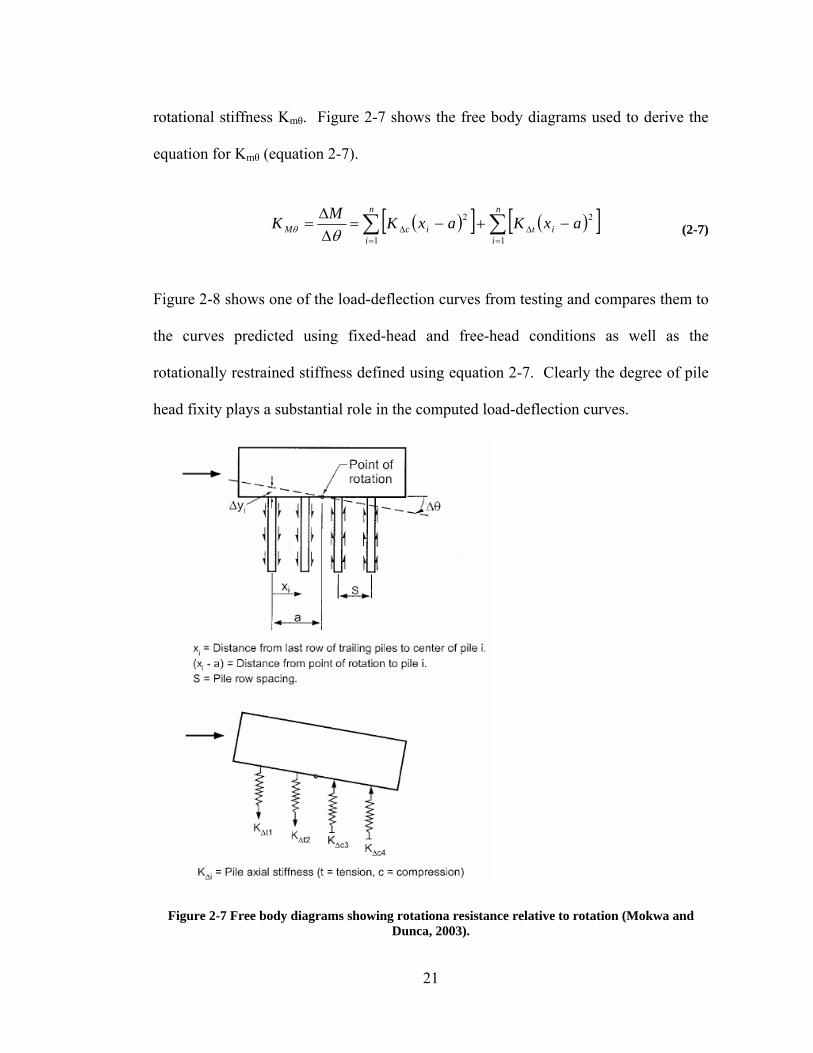
rotational stiffness Kmθ. Figure 2-7 shows the free body diagrams used to derive the
equation for Kmθ (equation 2-7).
( 2-7)
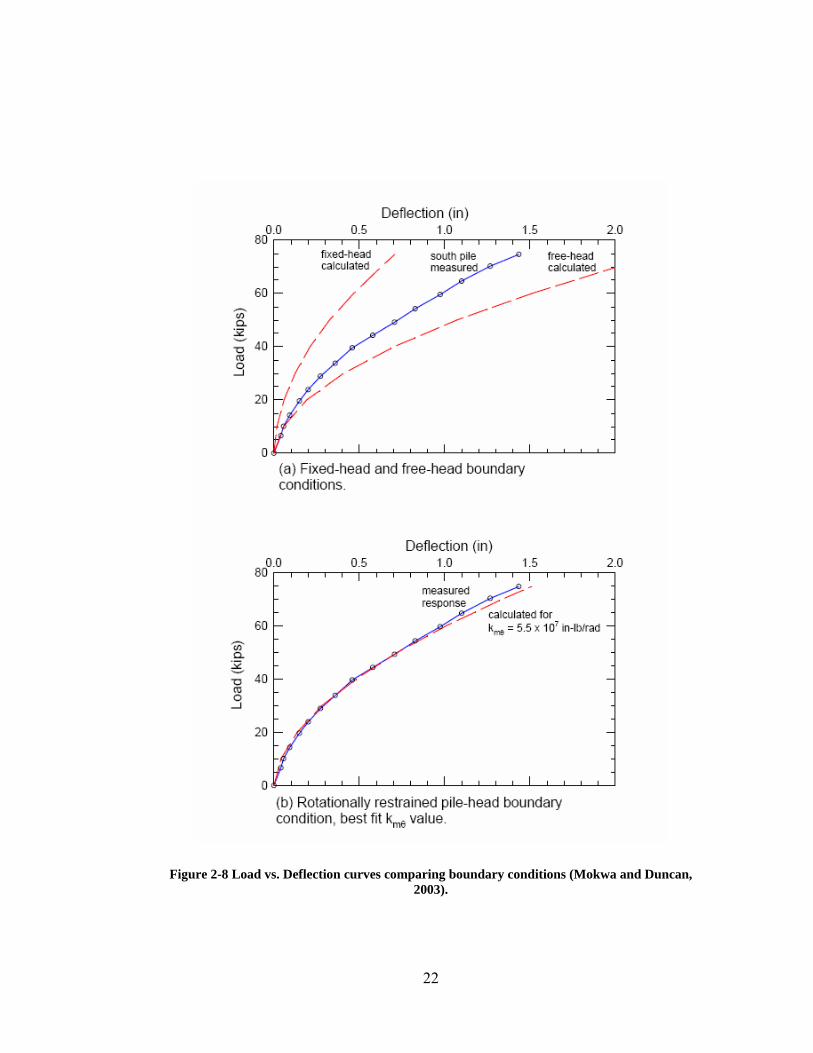
Figure 2-8 shows one of the load-deflection curves from testing and compares them to
the curves predicted using fixed-head and free-head conditions as well as the
rotationally restrained stiffness defined using equation 2-7. Clearly the degree of pile
head fixity plays a substantial role in the computed load-deflection curves.
Figure 2-7 Free body diagrams showing rotationa resistance relative to rotation (Mokwa and Dunca, 2003).
22
Figure 2-8 Load vs. Deflection curves comparing boundary conditions (Mokwa and Duncan, 2003).
23
2.8 Summary of Literature Review
There has been a significant amount of research conducted pertaining to the
lateral resistance of the pile foundation system. There has also been a considerable
amount of testing conducted aimed at developing equations to evaluate the moment
capacity at the pile to pile cap connection. All of the research and testing reviewed
has established the connection detail as a crucial element in developing the piles
capacity. Some of the most valuable points are presented here:
1. Rather than relying on rules-of-thumb which specify some minimum
embedment length, embedment length and reinforcement details should
be designed such that the moment capacity of the connection exceeds
that of the pile. As a result, embedment requirements will increase
with pile size and pile moment capacity. (e.g. the embedment length of
a steel pipe pile would be greater than for a timber pile)
2. Marcakis and Mitchell (1980) produced multiple design charts based on
testing which enable the designer to determine proper embedment for
steel piles. An example of these charts is presented in Figure 2-1.
Equation 2-1 was developed incorporating the importance of the
embedment length by calculating the stresses at the connection face.
3. Shama et al (2001) derived Equation 2-2 to predict required
embedment lengths based upon the theoretical stress distributions
shown in and results from load tests. They found that moment
capacity at the connection is a function of the concrete crushing
strength at the pile-pile cap interface.
24
4. Although tests conducted by Joen and Park (1990) highlight the
successful performance of precast prestressed piles with special
connection details, Harries and Petrou (2001) contend that an adequate
connection can be provided more economically by simpy increasing the
embedment length. Parametric studies with prestressed piles suggest
that the embedment length should be taken as the larger of the pile
diameter or 12 inches.
5. A number of studies (Joen and Park 1990, Shama et al 2002a, Xiao
2003, Xiao et al 2006) have found that piles with shallow embedment
do not normally act as “pinned” connections, but provide considerable
moment capacity. Accurate assessment of moment capacity requires
consideration of shear and moment capacity from embedment and
flexure mechanism. These findings also suggest that an economical
connection detail could be achieved with shallow reinforcement and
some type of reinforcement cage
6. Two testing programs found that standard connection details used by
Caltrans involving shallow pile embedment and V-bar anchors, did not
provide adequate tensile or compression capacity (Silva and Seible
2001, Xiao et al 2006). These details were also insufficient to develop
full moment capacity. .
7. One-half scale single piles were tested at Montana State University
(Stephens and McKittrick 2005) with various amounts of steel in the
cap which showed that the moment capacity of the pile system is also a
25
function of reinforcement ratio in the pile cap. Premature failure of the
cap can prevent development of the moment capacity of the pile.
8. A number of design equations have been proposed to estimate the
moment capacity of a pile-pile cap connection; however, the available
inventory of test data is insufficient to validate the equations for
anything but a very limited set of connections. As a result,
recommendations on required embedment length vary widely.
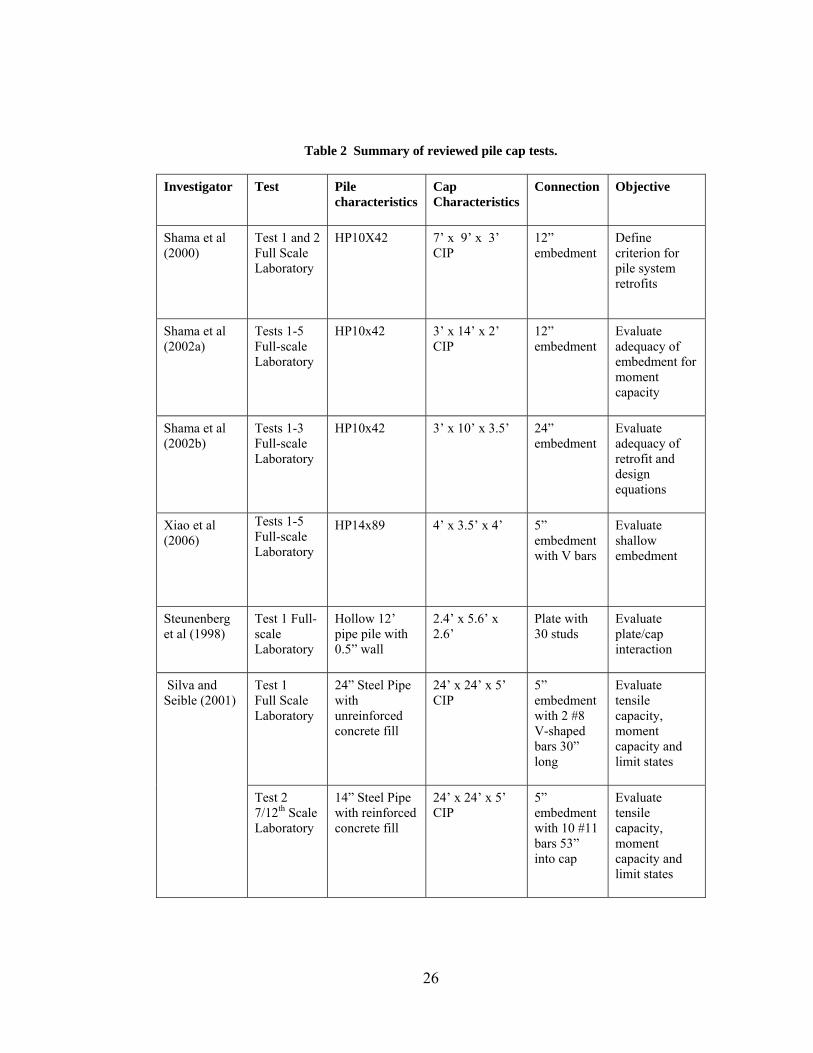
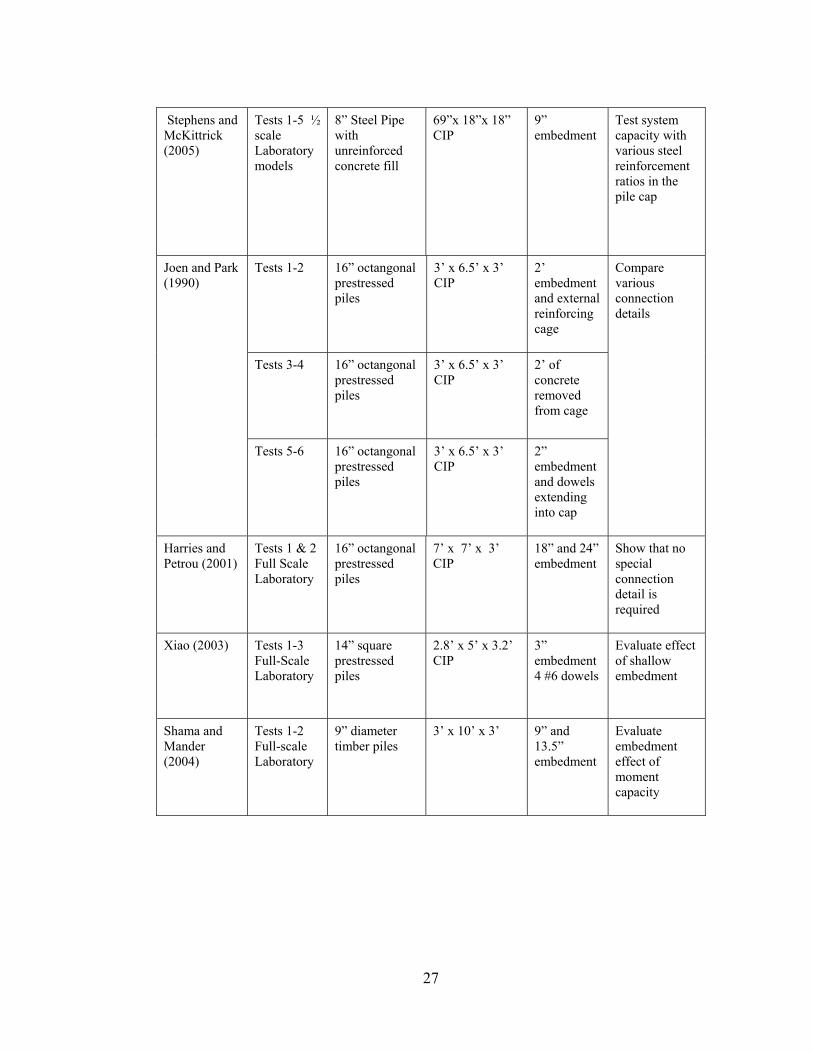
Table 2 summarizes the publications reviewed that directly pertain to a pile
caps connection under lateral loads. While much research and testing has been
conducted on pile groups, only a few are related to the connection between the pile
and pile cap; those that have been reviewed are summarized in this table. By
preparing this table it is noted that only a few tests have been performed all of which
have been conducted in a laboratory with a similar test setup.
2.8.1 Limitations of Current Understanding
Because relatively few tests have been performed on pile to pile cap
connections, significant uncertainty exists regarding appropriate embedment lengths to
achieve a given moment capacity. This is particularly true when flexure at the top of
the pile cap do to dowels or other reinforcements may provide some increase in
moment capacity. Although several equations have been developed, the existing data
set is insufficient to validate these equations generally. Furthermore, the connection
type for which the least testing has been performed is the concrete filled pipe pile.
26
Table 2 Summary of reviewed pile cap tests.
Investigator Test Pile characteristics
Cap Characteristics
Connection Objective
Shama et al (2000)
Test 1 and 2 Full Scale Laboratory
HP10X42 7’ x 9’ x 3’ CIP
12” embedment
Define criterion for pile system retrofits
Shama et al (2002a)
Tests 1-5 Full-scale Laboratory
HP10x42 3’ x 14’ x 2’ CIP
12” embedment
Evaluate adequacy of embedment for moment capacity
Shama et al (2002b)
Tests 1-3 Full-scale Laboratory
HP10x42 3’ x 10’ x 3.5’ 24” embedment
Evaluate adequacy of retrofit and design equations
Xiao et al (2006)
Tests 1-5 Full-scale Laboratory
HP14x89 4’ x 3.5’ x 4’ 5” embedment with V bars
Evaluate shallow embedment
Steunenberg et al (1998)
Test 1 Full-scale Laboratory
Hollow 12’ pipe pile with 0.5” wall
2.4’ x 5.6’ x 2.6’
Plate with 30 studs
Evaluate plate/cap interaction
Test 1 Full Scale Laboratory
24” Steel Pipe with unreinforced concrete fill
24’ x 24’ x 5’ CIP
5” embedment with 2 #8 V-shaped bars 30” long
Evaluate tensile capacity, moment capacity and limit states
Silva and Seible (2001)
Test 2 7/12th Scale Laboratory
14” Steel Pipe with reinforced concrete fill
24’ x 24’ x 5’ CIP
5” embedment with 10 #11 bars 53” into cap
Evaluate tensile capacity, moment capacity and limit states
27
Stephens and McKittrick (2005)
Tests 1-5 ½ scale Laboratory models
8” Steel Pipe with unreinforced concrete fill
69”x 18”x 18” CIP
9” embedment
Test system capacity with various steel reinforcement ratios in the pile cap
Tests 1-2 16” octangonal prestressed piles
3’ x 6.5’ x 3’ CIP
2’ embedment and external reinforcing cage
Tests 3-4 16” octangonal prestressed piles
3’ x 6.5’ x 3’ CIP
2’ of concrete removed from cage
Joen and Park (1990)
Tests 5-6 16” octangonal prestressed piles
3’ x 6.5’ x 3’ CIP
2” embedment and dowels extending into cap
Compare various connection details
Harries and Petrou (2001)
Tests 1 & 2 Full Scale Laboratory
16” octangonal prestressed piles
7’ x 7’ x 3’ CIP
18” and 24” embedment
Show that no special connection detail is required
Xiao (2003) Tests 1-3 Full-Scale Laboratory
14” square prestressed piles
2.8’ x 5’ x 3.2’ CIP
3” embedment 4 #6 dowels
Evaluate effect of shallow embedment
Shama and Mander (2004)
Tests 1-2 Full-scale Laboratory
9” diameter timber piles
3’ x 10’ x 3’ 9” and 13.5” embedment
Evaluate embedment effect of moment capacity
28
Previous research has been conducted exclusively under lab conditions with
the load applied at some distance from the base of the pile cap. Under field conditions
the load is not all applied at one location but is distributed along the length of the pile
due to soil-pile interaction. This factor, which may effect connection capacity, has not
been investigated (Xiao et al, 2003, Xiao 2006). In addition, the pile caps in the
laboratory testing have been completely fixed against rotation, while under field
conditions, the cap may rotate to some degree decreasing the moments which develop.
These limitations indicate the need to better understand how a pile group will react
under field conditions. This study addresses these limitations by applying the force on
the pile cap while the pile remains in the ground.
Some laboratory tests highlight the potential for eliminating special reinforcing
details and developing moment capacity in the connection exlusively with embedment.
Eliminating special reinforced connections has not yet been accepted in design. In
fact much of the current pile group design includes not only a special reinforced
connection detail but also a significant embedment length. Alternatively, recent
laboratory test suggest that successful performance can potentially be achieved with
minimal embedment and an appropriate reinforcing segment.
The current research involves full scale field tests which will consider soil-pile
interaction effects and allow the cap to move and rotate as it might in an actual seismic
event. The research will involve pile-pile cap connections with varying embedment
depths and reinforcement details which can be compared for cost and effectiveness.
This research is designed to contribute to a better understanding of how pile groups act

29
under large lateral forces where shear, bending and axial forces are all acting on the
connection.

31
3 TEST SETUP
3.1 General Remarks
A total of four pile caps were tested each supported by two piles driven to a
depth of 40 feet. These four pile caps were laterally loaded independent of each other
using a hydraulic ram. As indicated in the literature review, the majority of tests
involving pile caps have been performed on either scale models or on laboratory
specimens. These tests are significant in that they consider the complete pile/pile
cap/soil system under in-situ conditions rather than a laboratory setting. Also, prior
testing has fixed the pile cap and applied the lateral force to the tip of the piles without
soil involved. However, under in-service load conditions, the pile cap would not be
fully fixed. This test setup also takes into account the pile group interaction effects
while the prior testing typically included only single piles.
The purpose of this study is to compare the performance of four connection
details between the piles and the pile cap. There are two basic details involved with
the connection between the pile and the pile-cap. The first detail involves the length
to which the pile is embedded into the pile cap and the second is the reinforcement
connection extending from the pile cap a proper development length into the pile.
Therefore, each of the four pile caps were configured with the same geometry with the
exception of the connection.
32
Prior research has shown that a proper embedment length alone can be
sufficient to develop the moment capacity of the pile and it may suffice to ignore any
type of reinforcement connection which can be very costly to both fabricate and
construct in the field. Another type of practice, although less common, involves
leaving the piles hollow. The lack of concrete makes a reinforced connection more
difficult to fabricate and analyze. As shown in the literature review section, a length
equal to at least one pile diameter should be embedded into the pile cap to fully
develop the moment capacity of the pile. To evaluate this finding under field
conditions, it was decided to test a pile cap with piles embedded one pile diameter and
compare its performance with pile caps that have shorter as well as longer embedment
lengths.
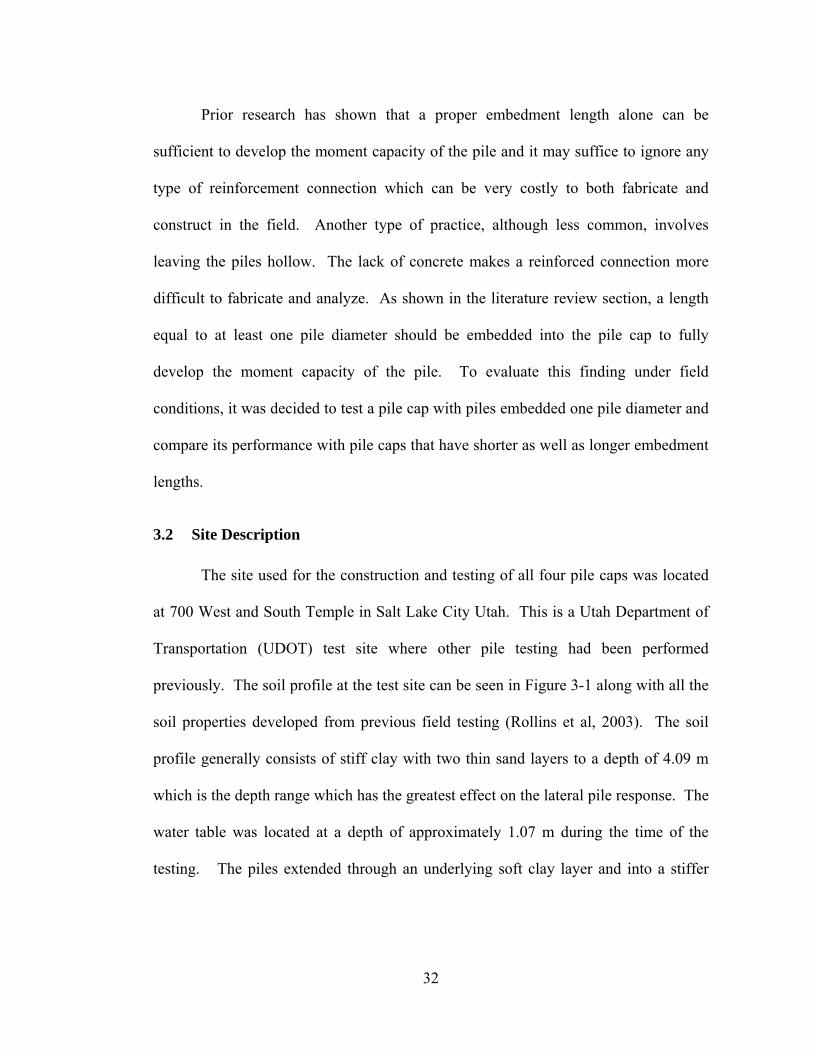
3.2 Site Description
The site used for the construction and testing of all four pile caps was located
at 700 West and South Temple in Salt Lake City Utah. This is a Utah Department of
Transportation (UDOT) test site where other pile testing had been performed
previously. The soil profile at the test site can be seen in Figure 3-1 along with all the
soil properties developed from previous field testing (Rollins et al, 2003). The soil
profile generally consists of stiff clay with two thin sand layers to a depth of 4.09 m
which is the depth range which has the greatest effect on the lateral pile response. The
water table was located at a depth of approximately 1.07 m during the time of the
testing. The piles extended through an underlying soft clay layer and into a stiffer
33
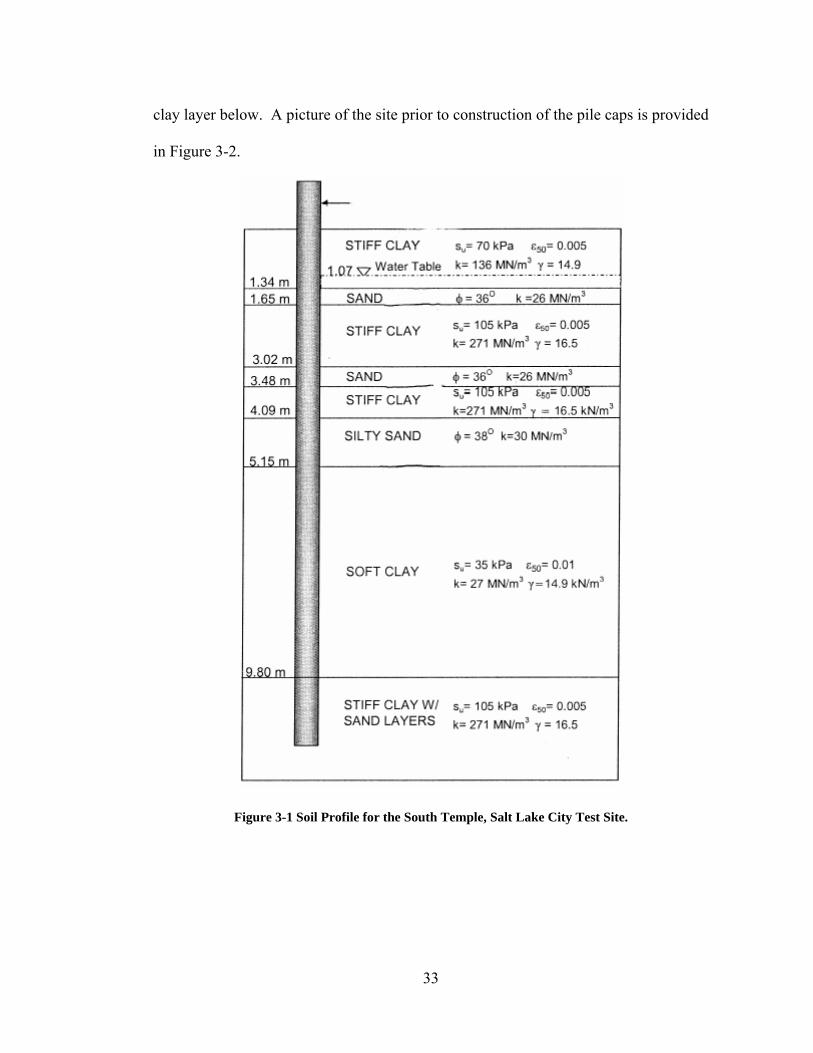
clay layer below. A picture of the site prior to construction of the pile caps is provided
in Figure 3-2.
Figure 3-1 Soil Profile for the South Temple, Salt Lake City Test Site.
34
Figure 3-2 Photograph of the South Temple, Salt Lake City Test Site.
3.3 Pile and Cap Description
The pile caps for all of the tests consisted of a 6 ½ foot long x 3 ft high x 3 ft
wide concrete block. Each pile cap was connected to two circular steel pipe piles
which had been driven to a depth of 40 feet and were spaced at 3 ½ feet on centers.
Each pile had an inside diameter of 12 inches with a 3/8 inch wall thickness. All pile
caps were reinforcing with grids of #7 bars spaced at 6 inches on centers in the
longitudinal and transverse directions both top and bottom with a minimum 3 inches
of clear cover on the top and 3 inches on the bottom. The materials used in the
construction of all four pile caps were consistent with what is typically used in the
field, that is: concrete with a 4,000 psi compressive strength and rebar with a yield
35
strength of 60,000 psi. The steel pipe piles had a modulus of elasticity of 29,000 ksi
and a yield stress of 57,000 psi.
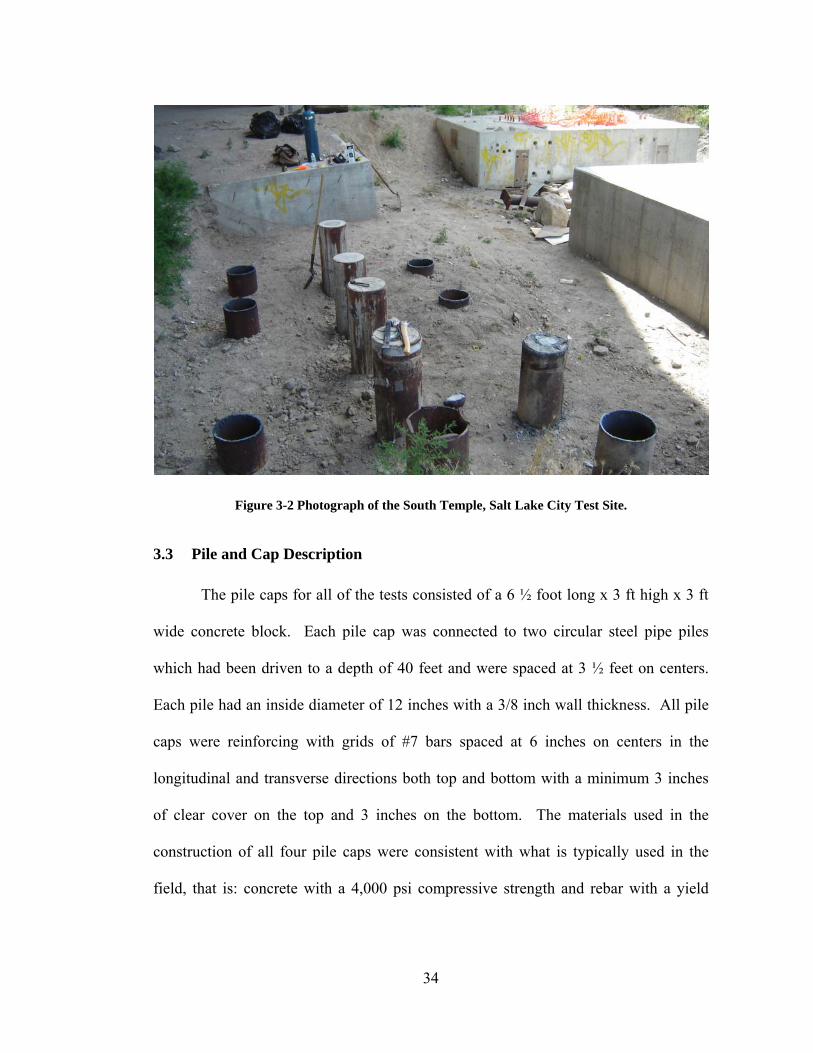
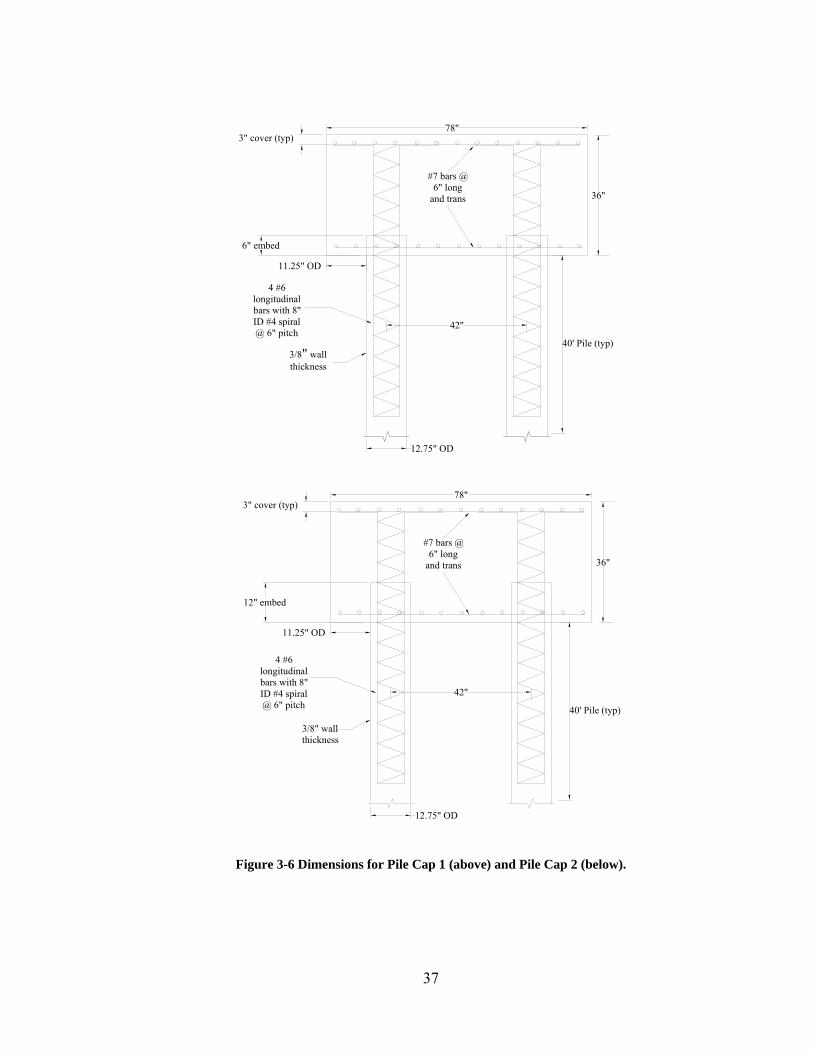
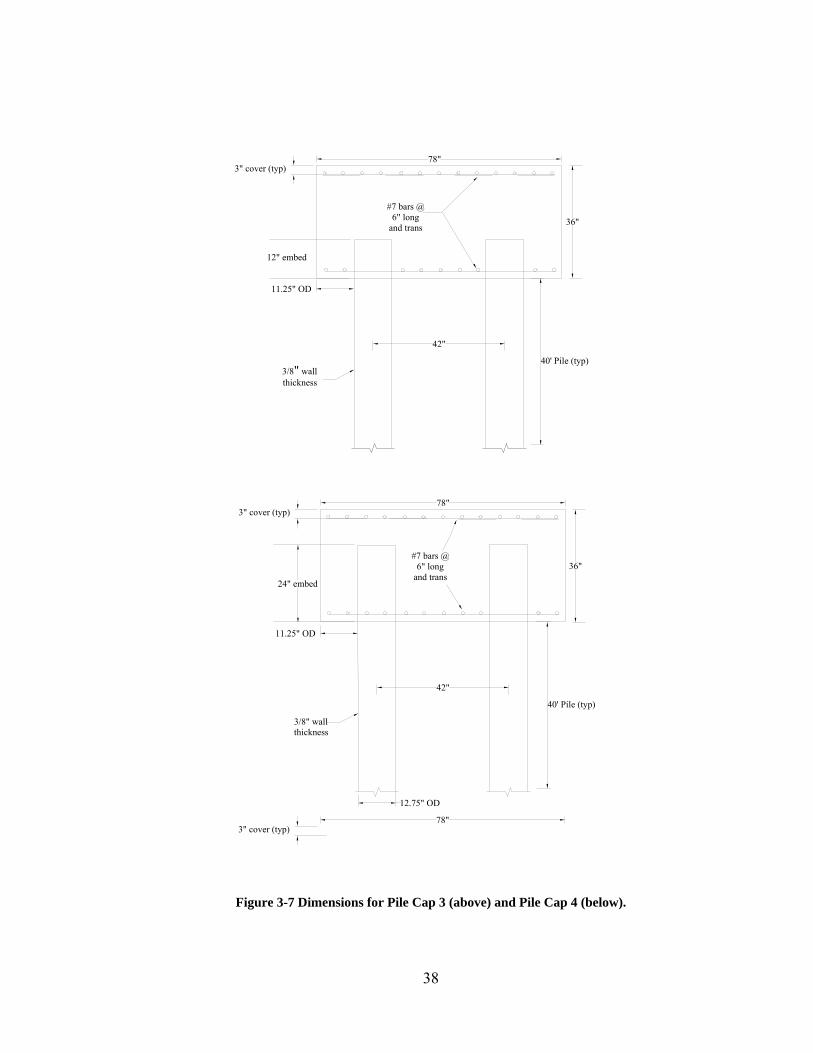
Figure 3-4 through Figure 3-8 show the piles and caps for each test and Table 3
summarizes the connection details for each cap. Small holes were cut in the piles so
that the longitudinal bars from the bottom reinforcement grid could extend through the
piles; however, the transverse bars were cut off to prevent an excessive amount of
holes in the piles. Figure 3-3 is an isometric view of the piles and cap. This drawing
shows an embedment length of 12 inches which varies with each test.
Table 3 Summary of connection details for each pile cap test.
Pile Cap
Pile Embedment Connection Steel Cap Steel
1 6 inches 4-#6 bars, 6.25 ft long, #4 Spiral @ 6” pitch #8 @ 6” grids top and bottom
2 12 inches 4-#6 bars, 6.25 ft long, #4 Spiral @ 6” pitch “ 3 12 inches None and no concrete in pile “
4 24 inches None, but concrete fill in pile “
Figure 3-3 Isometric view of typical pile cap configuration.
36
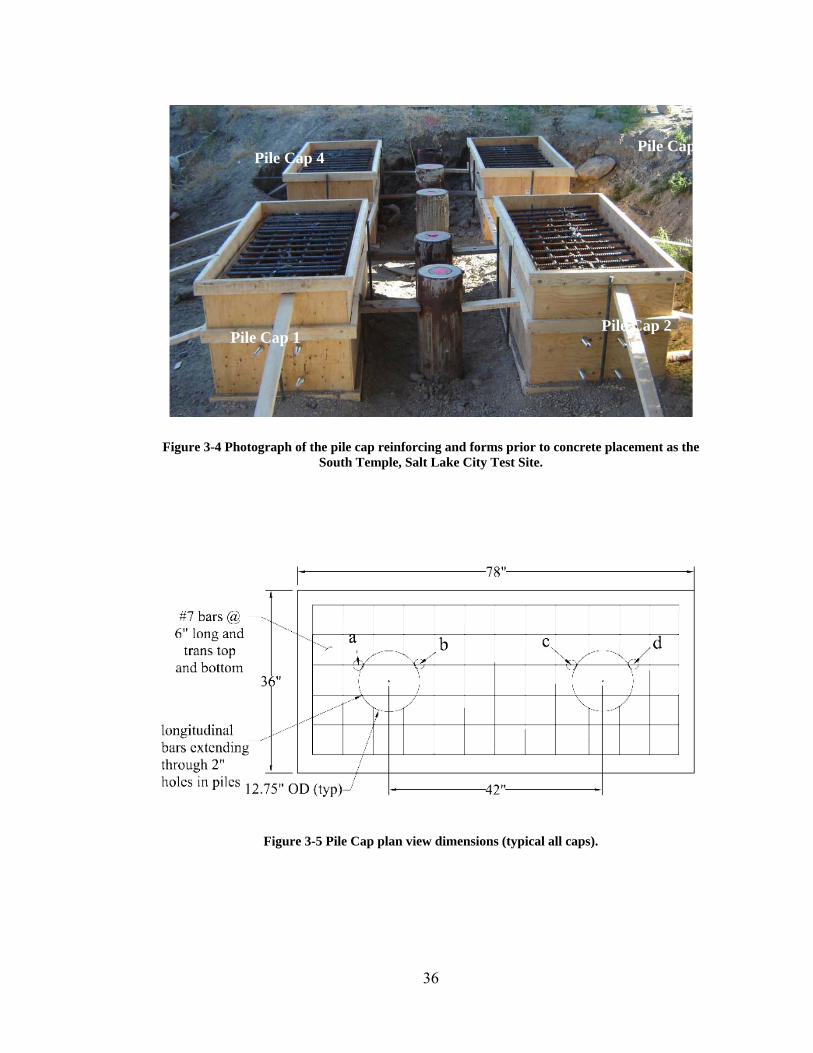
Figure 3-4 Photograph of the pile cap reinforcing and forms prior to concrete placement as the South Temple, Salt Lake City Test Site.
Figure 3-5 Pile Cap plan view dimensions (typical all caps).
Pile Cap 1 Pile Cap 2
Pile Cap 3 Pile Cap 4
37
36"
78"3" cover (typ)
42"
#7 bars @ 6" long
and trans
4 #6 longitudinal bars with 8" ID #4 spiral @ 6" pitch
3/8" wall thickness
40' Pile (typ)
6" embed
12.75" OD
36"
78"3" cover (typ)
42"
4 #6 longitudinal bars with 8" ID #4 spiral @ 6" pitch
3/8" wall thickness
40' Pile (typ)
12" embed
12.75" OD
#7 bars @ 6" long
and trans
11.25" OD
11.25" OD
Figure 3-6 Dimensions for Pile Cap 1 (above) and Pile Cap 2 (below).
38
36"
78"3" cover (typ)
42"
#7 bars @ 6" long
and trans
3/8" wall thickness
40' Pile (typ)
36"
78"3" cover (typ)
42"
3/8" wall thickness
40' Pile (typ)
12.75" OD
78"3" cover (typ)
24" embed
12" embed
#7 bars @ 6" long
and trans
11.25" OD
11.25" OD
Figure 3-7 Dimensions for Pile Cap 3 (above) and Pile Cap 4 (below).
39
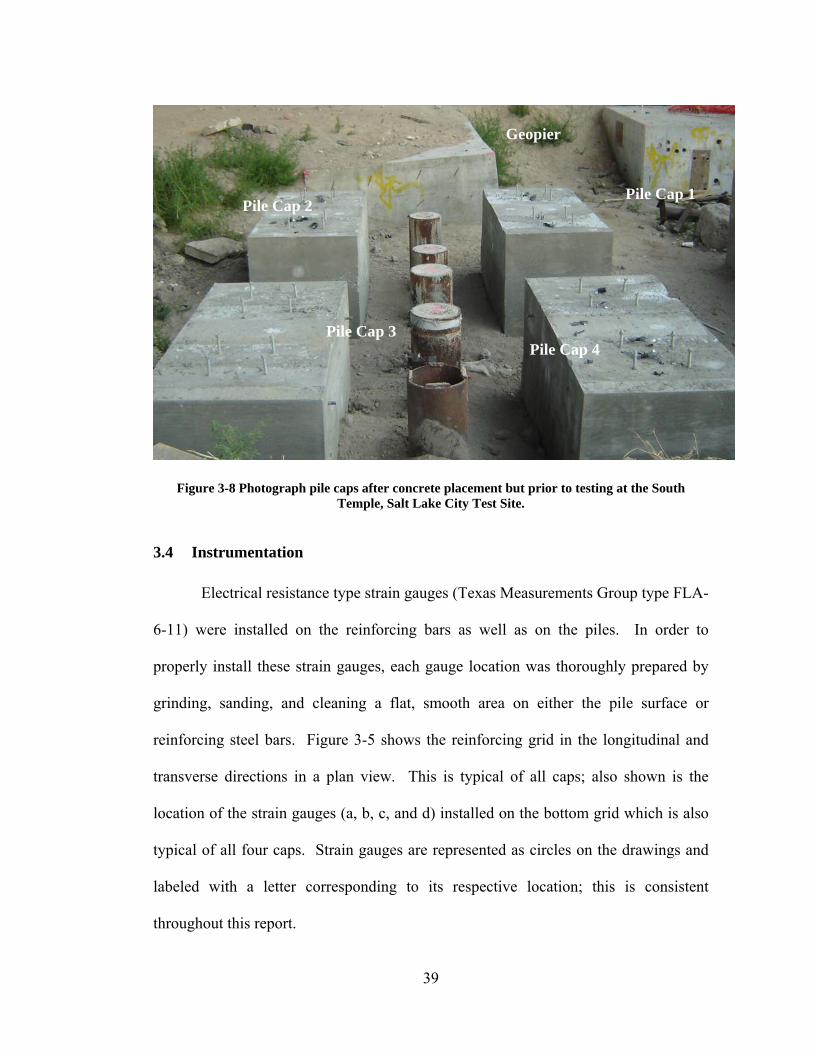
Figure 3-8 Photograph pile caps after concrete placement but prior to testing at the South Temple, Salt Lake City Test Site.
3.4 Instrumentation
Electrical resistance type strain gauges (Texas Measurements Group type FLA-
6-11) were installed on the reinforcing bars as well as on the piles. In order to
properly install these strain gauges, each gauge location was thoroughly prepared by
grinding, sanding, and cleaning a flat, smooth area on either the pile surface or
reinforcing steel bars. Figure 3-5 shows the reinforcing grid in the longitudinal and
transverse directions in a plan view. This is typical of all caps; also shown is the
location of the strain gauges (a, b, c, and d) installed on the bottom grid which is also
typical of all four caps. Strain gauges are represented as circles on the drawings and
labeled with a letter corresponding to its respective location; this is consistent
throughout this report.
Pile Cap 4 Pile Cap 3
Pile Cap 2 Pile Cap 1
Geopier
40
36"
78"
12.75" OD (typ)
#7 bars @ 6" long and
trans top and bottom
longitudinal bars extending through 2" holes in piles 42"
a b c d
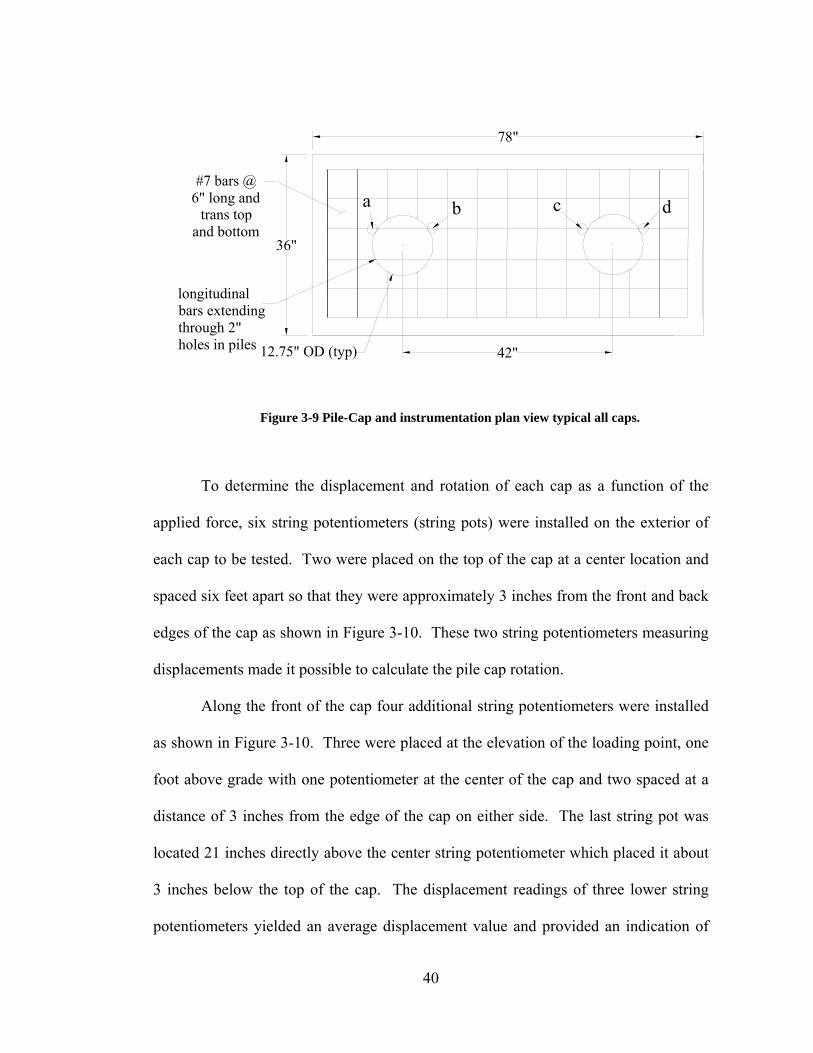
Figure 3-9 Pile-Cap and instrumentation plan view typical all caps.
To determine the displacement and rotation of each cap as a function of the
applied force, six string potentiometers (string pots) were installed on the exterior of
each cap to be tested. Two were placed on the top of the cap at a center location and
spaced six feet apart so that they were approximately 3 inches from the front and back
edges of the cap as shown in Figure 3-10. These two string potentiometers measuring
displacements made it possible to calculate the pile cap rotation.
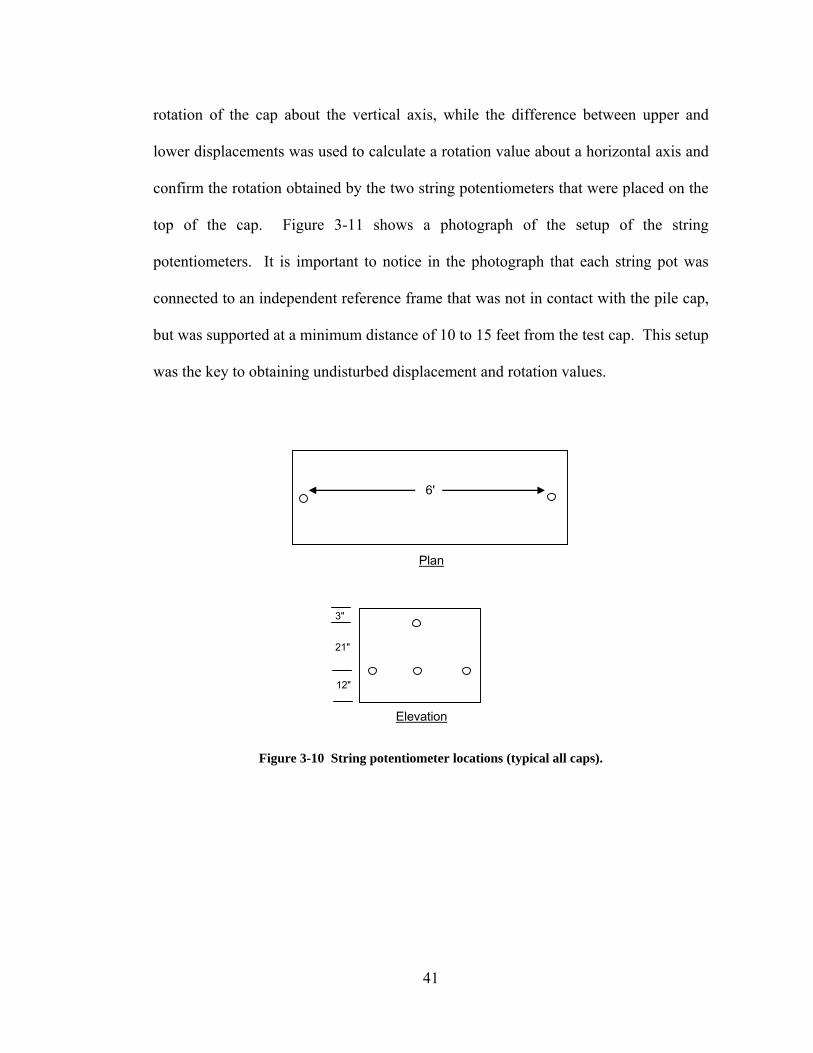
Along the front of the cap four additional string potentiometers were installed
as shown in Figure 3-10. Three were placed at the elevation of the loading point, one
foot above grade with one potentiometer at the center of the cap and two spaced at a
distance of 3 inches from the edge of the cap on either side. The last string pot was
located 21 inches directly above the center string potentiometer which placed it about
3 inches below the top of the cap. The displacement readings of three lower string
potentiometers yielded an average displacement value and provided an indication of
41
rotation of the cap about the vertical axis, while the difference between upper and
lower displacements was used to calculate a rotation value about a horizontal axis and
confirm the rotation obtained by the two string potentiometers that were placed on the
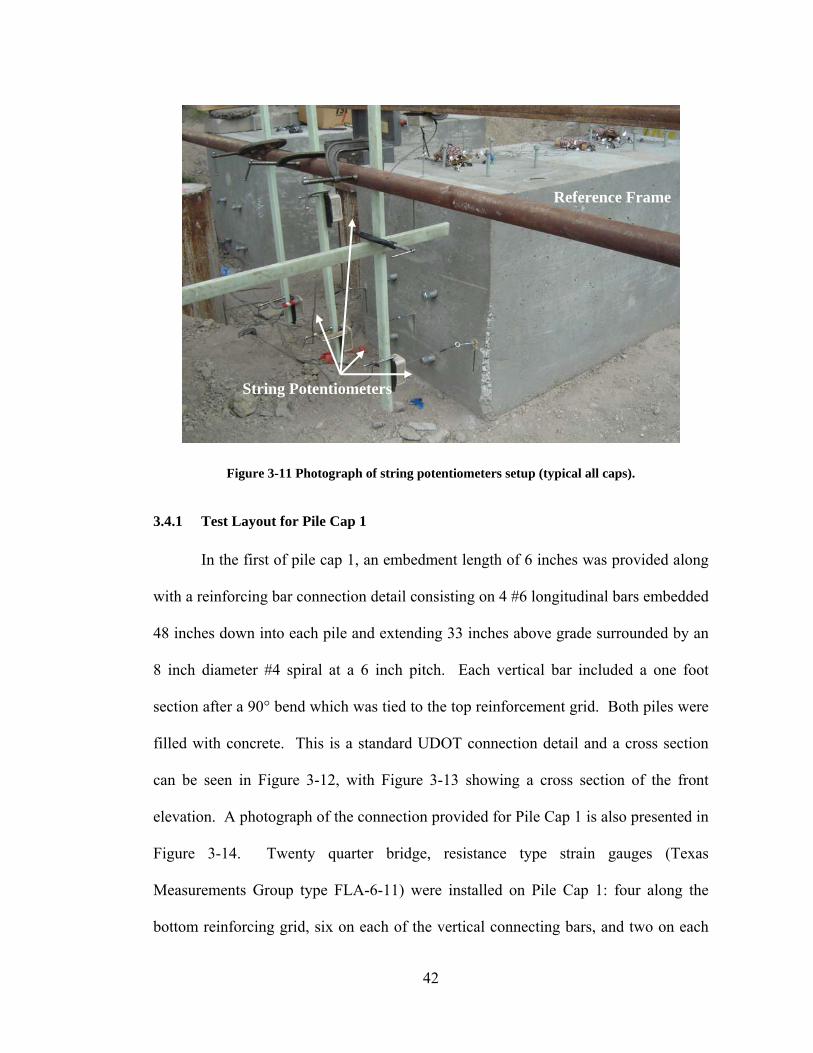
top of the cap. Figure 3-11 shows a photograph of the setup of the string
potentiometers. It is important to notice in the photograph that each string pot was
connected to an independent reference frame that was not in contact with the pile cap,
but was supported at a minimum distance of 10 to 15 feet from the test cap. This setup
was the key to obtaining undisturbed displacement and rotation values.
3"
21"
12"
Plan
Elevation
6'
Figure 3-10 String potentiometer locations (typical all caps).
42
Figure 3-11 Photograph of string potentiometers setup (typical all caps).
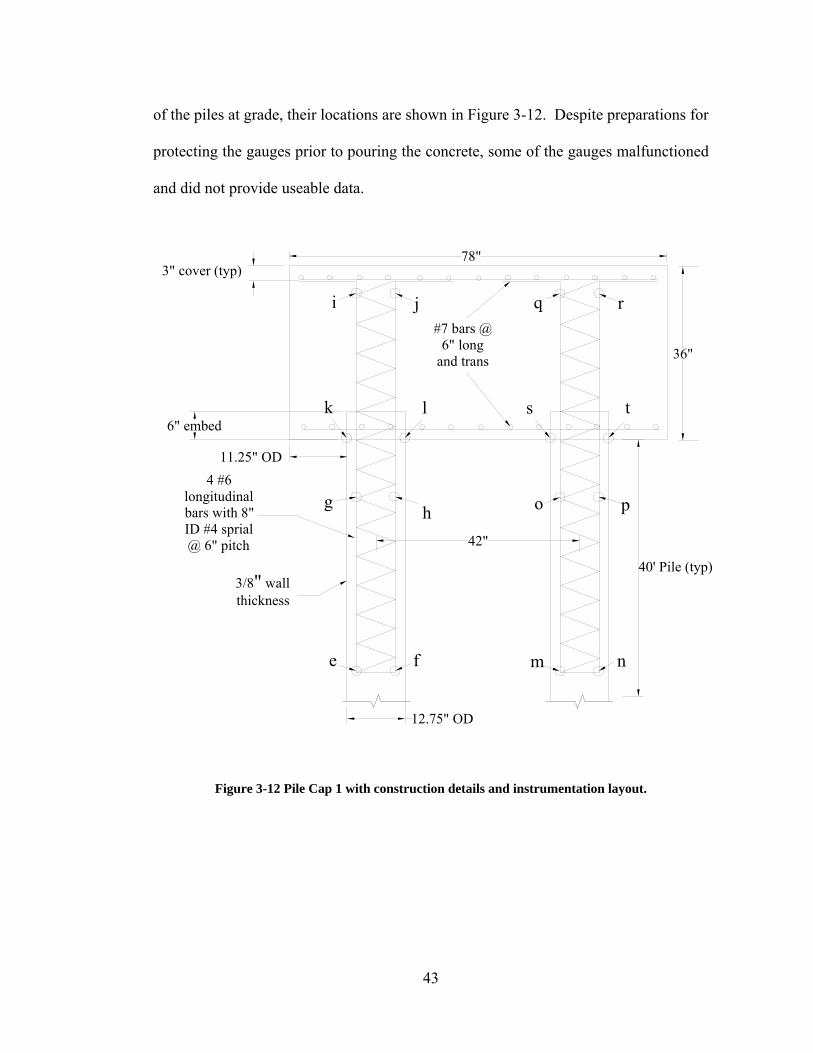
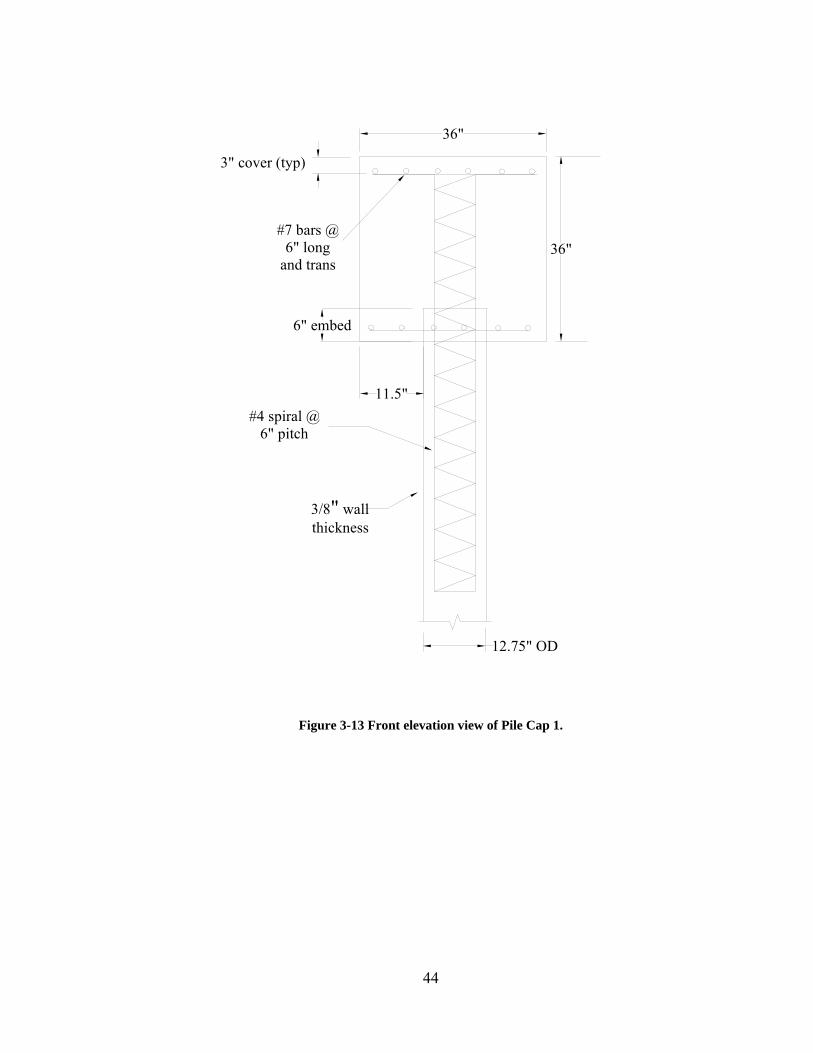
3.4.1 Test Layout for Pile Cap 1
In the first of pile cap 1, an embedment length of 6 inches was provided along
with a reinforcing bar connection detail consisting on 4 #6 longitudinal bars embedded
48 inches down into each pile and extending 33 inches above grade surrounded by an
8 inch diameter #4 spiral at a 6 inch pitch. Each vertical bar included a one foot
section after a 90° bend which was tied to the top reinforcement grid. Both piles were
filled with concrete. This is a standard UDOT connection detail and a cross section
can be seen in Figure 3-12, with Figure 3-13 showing a cross section of the front
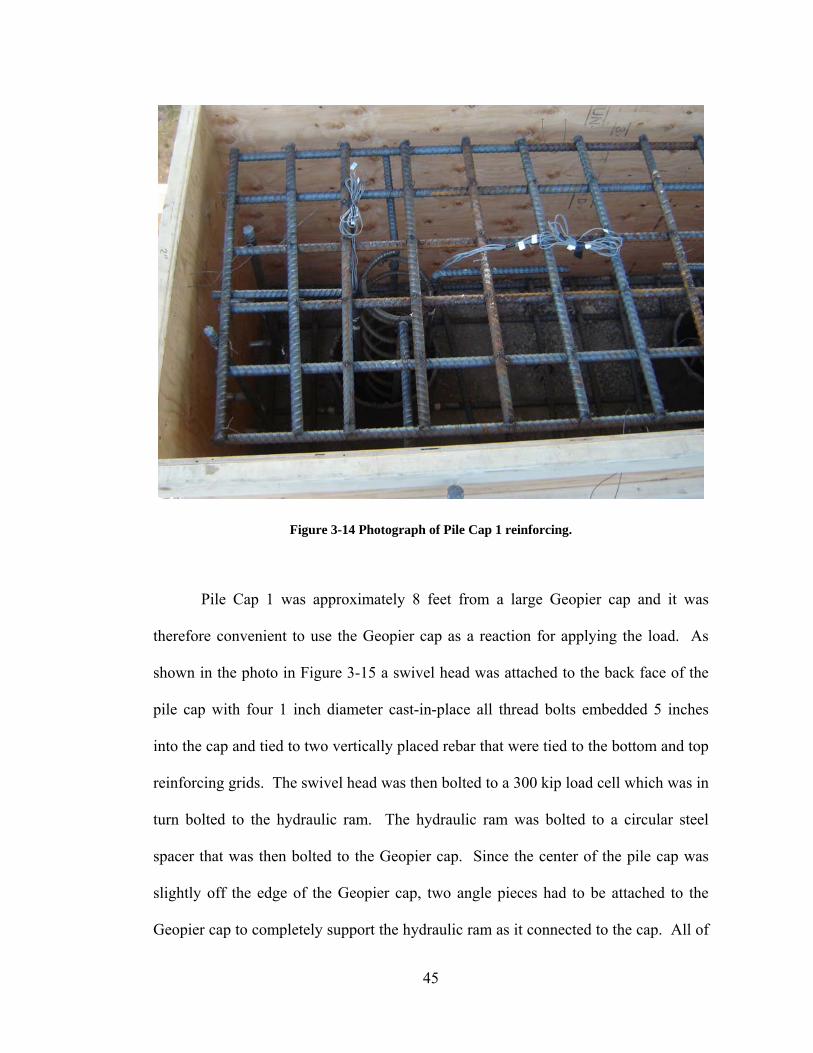
elevation. A photograph of the connection provided for Pile Cap 1 is also presented in
Figure 3-14. Twenty quarter bridge, resistance type strain gauges (Texas
Measurements Group type FLA-6-11) were installed on Pile Cap 1: four along the
bottom reinforcing grid, six on each of the vertical connecting bars, and two on each
Reference Frame
String Potentiometers
43
of the piles at grade, their locations are shown in Figure 3-12. Despite preparations for
protecting the gauges prior to pouring the concrete, some of the gauges malfunctioned
and did not provide useable data.
36"
78"3" cover (typ)
42"
#7 bars @ 6" long
and trans
4 #6 longitudinal bars with 8" ID #4 sprial @ 6" pitch
3/8" wall thickness
40' Pile (typ)
6" embed
12.75" OD
i j q r
k l s t
g h po
e f m n
11.25" OD
Figure 3-12 Pile Cap 1 with construction details and instrumentation layout.
44
36"
3" cover (typ)
#7 bars @ 6" long
and trans
#4 spiral @ 6" pitch
3/8" wall thickness
12.75" OD
6" embed
11.5"
36"
Figure 3-13 Front elevation view of Pile Cap 1.
45
Figure 3-14 Photograph of Pile Cap 1 reinforcing.
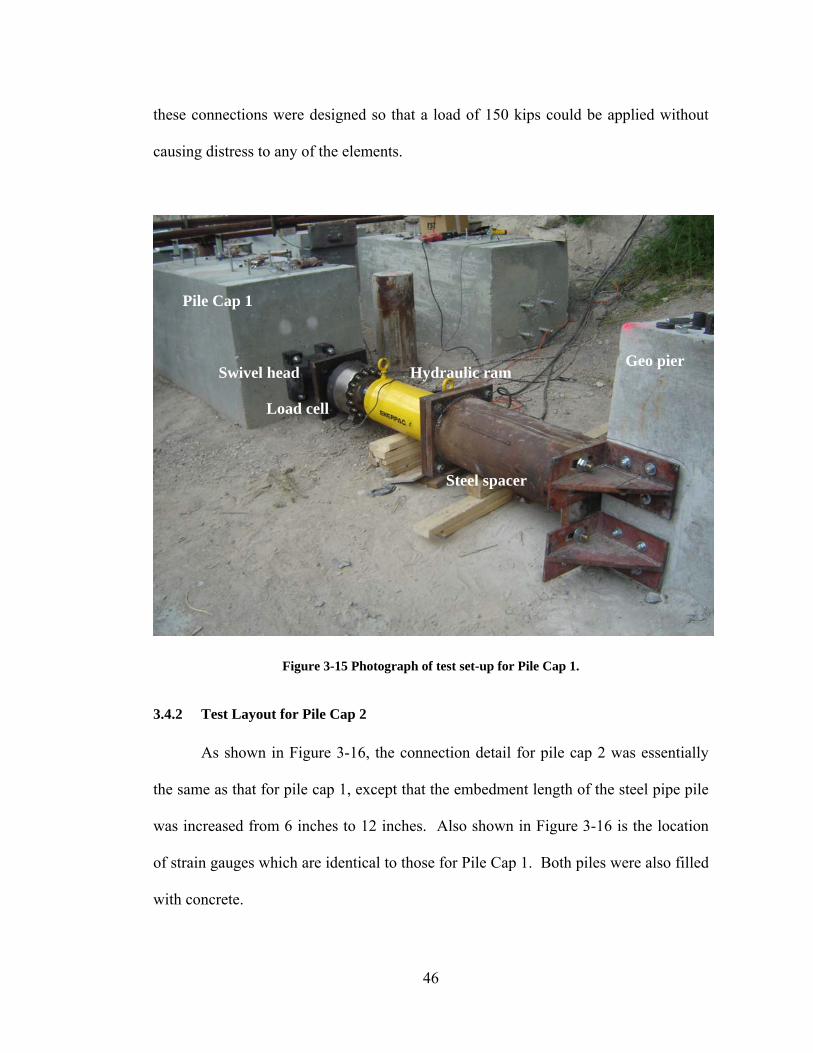
Pile Cap 1 was approximately 8 feet from a large Geopier cap and it was
therefore convenient to use the Geopier cap as a reaction for applying the load. As
shown in the photo in Figure 3-15 a swivel head was attached to the back face of the
pile cap with four 1 inch diameter cast-in-place all thread bolts embedded 5 inches
into the cap and tied to two vertically placed rebar that were tied to the bottom and top
reinforcing grids. The swivel head was then bolted to a 300 kip load cell which was in
turn bolted to the hydraulic ram. The hydraulic ram was bolted to a circular steel
spacer that was then bolted to the Geopier cap. Since the center of the pile cap was
slightly off the edge of the Geopier cap, two angle pieces had to be attached to the
Geopier cap to completely support the hydraulic ram as it connected to the cap. All of
46
these connections were designed so that a load of 150 kips could be applied without
causing distress to any of the elements.
Figure 3-15 Photograph of test set-up for Pile Cap 1.
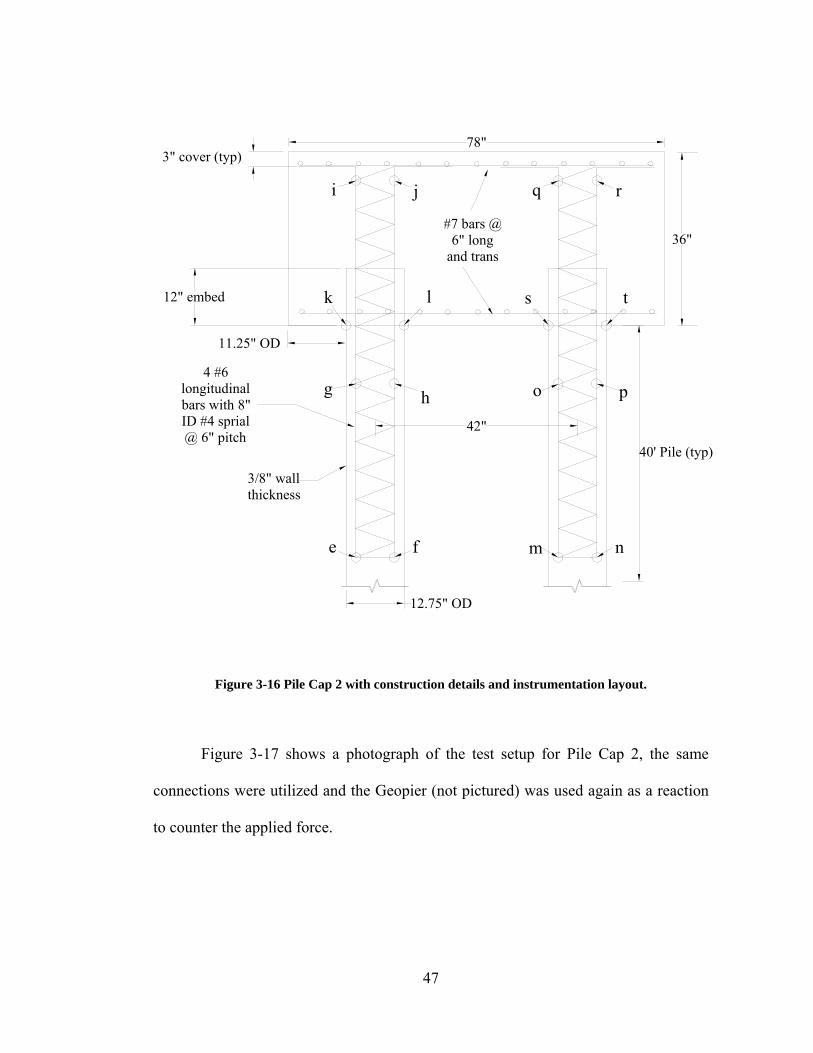
3.4.2 Test Layout for Pile Cap 2
As shown in Figure 3-16, the connection detail for pile cap 2 was essentially
the same as that for pile cap 1, except that the embedment length of the steel pipe pile
was increased from 6 inches to 12 inches. Also shown in Figure 3-16 is the location
of strain gauges which are identical to those for Pile Cap 1. Both piles were also filled
with concrete.
Geo pier
Steel spacer
Hydraulic ram Swivel head
Load cell
Pile Cap 1
47
36"
78"3" cover (typ)
42"
#7 bars @ 6" long
and trans
3/8" wall thickness
40' Pile (typ)
i j q r
k l s t
g h po
e f m n
12" embed
12.75" OD
11.25" OD
4 #6 longitudinal bars with 8" ID #4 sprial @ 6" pitch
Figure 3-16 Pile Cap 2 with construction details and instrumentation layout.
Figure 3-17 shows a photograph of the test setup for Pile Cap 2, the same
connections were utilized and the Geopier (not pictured) was used again as a reaction
to counter the applied force.
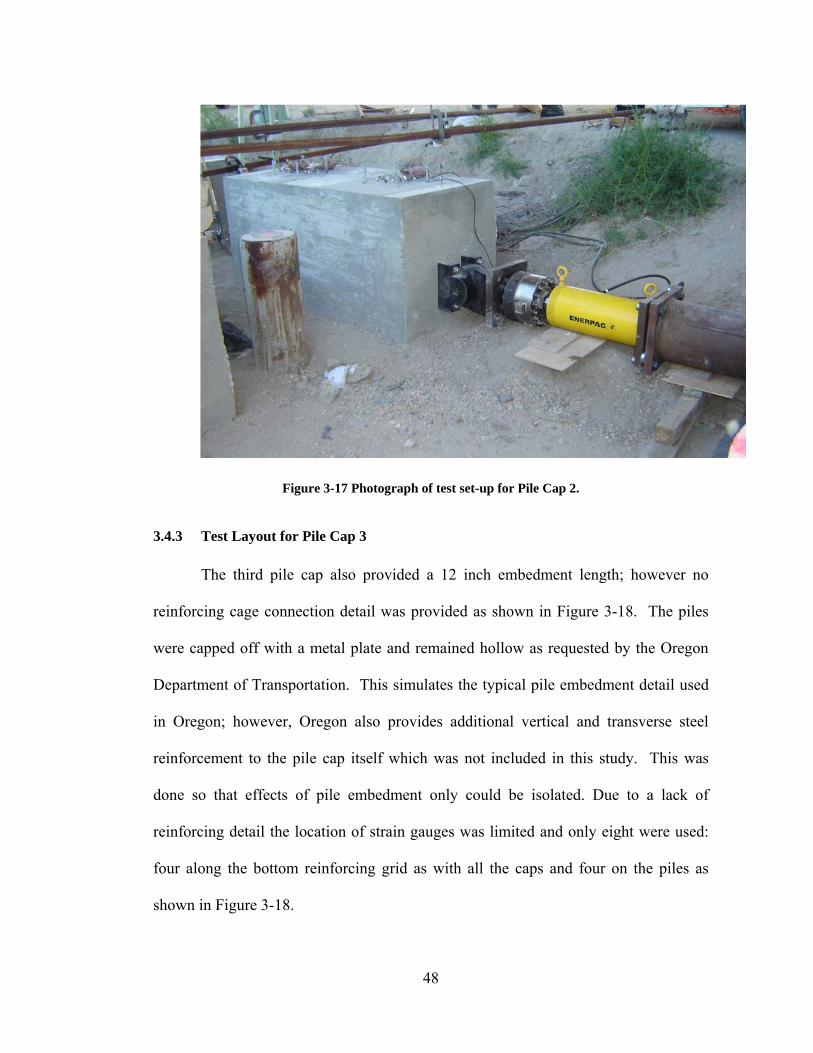
48
Figure 3-17 Photograph of test set-up for Pile Cap 2.
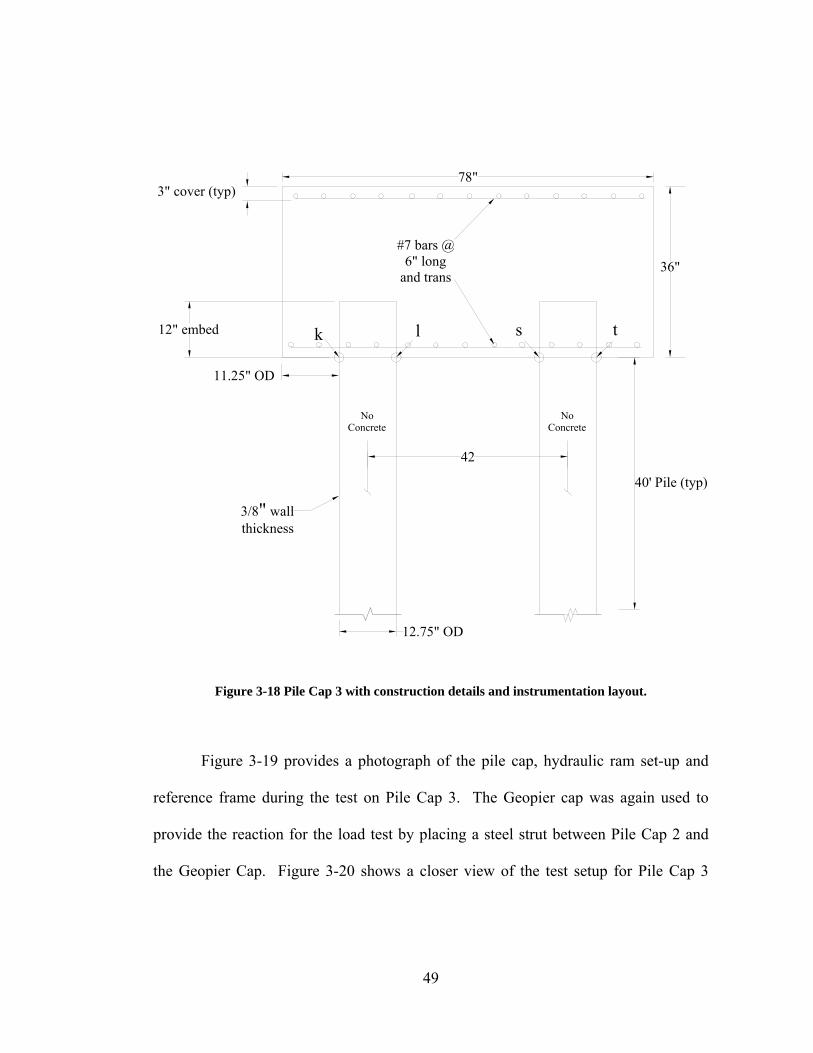
3.4.3 Test Layout for Pile Cap 3
The third pile cap also provided a 12 inch embedment length; however no
reinforcing cage connection detail was provided as shown in Figure 3-18. The piles
were capped off with a metal plate and remained hollow as requested by the Oregon
Department of Transportation. This simulates the typical pile embedment detail used
in Oregon; however, Oregon also provides additional vertical and transverse steel
reinforcement to the pile cap itself which was not included in this study. This was
done so that effects of pile embedment only could be isolated. Due to a lack of
reinforcing detail the location of strain gauges was limited and only eight were used:
four along the bottom reinforcing grid as with all the caps and four on the piles as
shown in Figure 3-18.
49
#7 bars @ 6" long
and trans
3/8" wall thickness
40' Pile (typ)
k l s t12" embed
12.75" OD
No Concrete
No Concrete
11.25" OD
36"
78"3" cover (typ)
42
Figure 3-18 Pile Cap 3 with construction details and instrumentation layout.
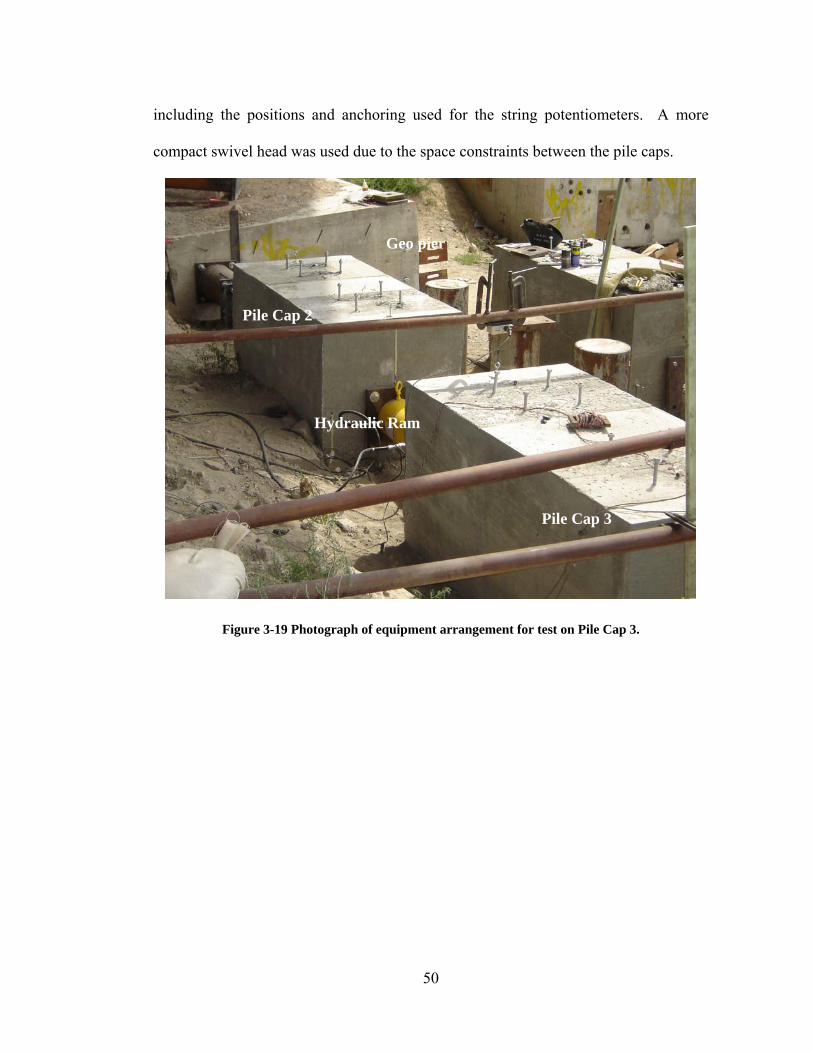
Figure 3-19 provides a photograph of the pile cap, hydraulic ram set-up and
reference frame during the test on Pile Cap 3. The Geopier cap was again used to
provide the reaction for the load test by placing a steel strut between Pile Cap 2 and
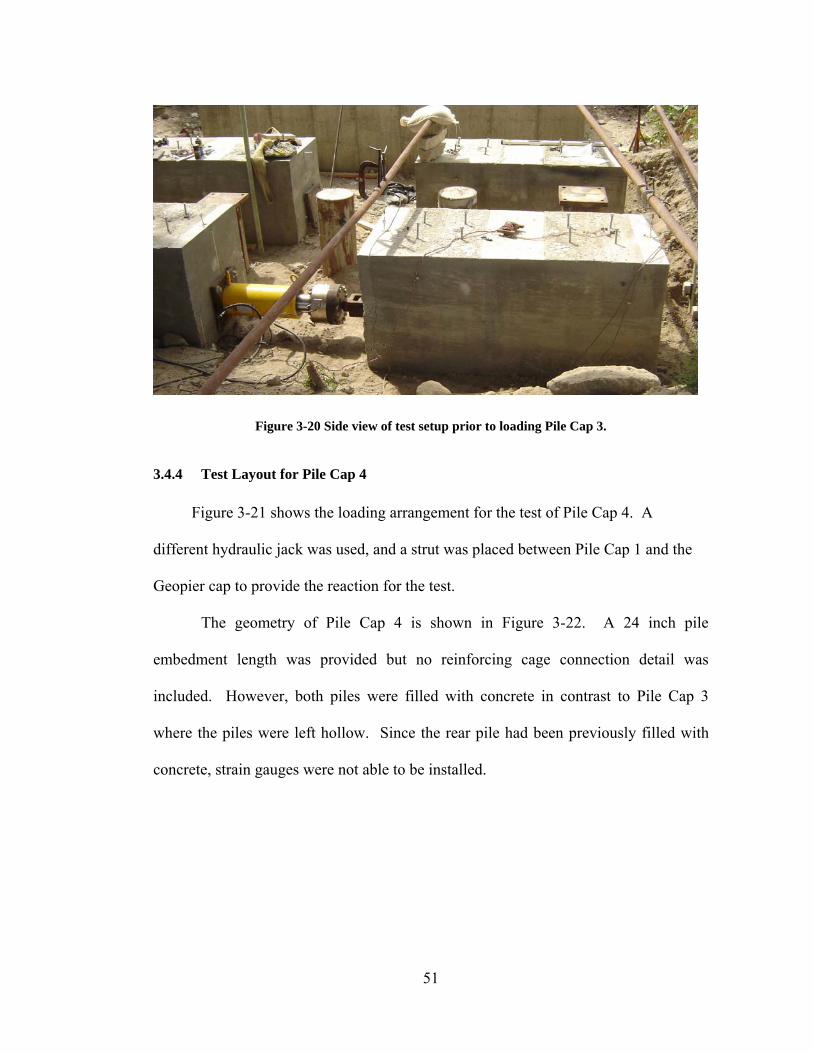
the Geopier Cap. Figure 3-20 shows a closer view of the test setup for Pile Cap 3
50
including the positions and anchoring used for the string potentiometers. A more
compact swivel head was used due to the space constraints between the pile caps.
Figure 3-19 Photograph of equipment arrangement for test on Pile Cap 3.
Pile Cap 3
Hydraulic Ram
Pile Cap 2
Geo pier
51
Figure 3-20 Side view of test setup prior to loading Pile Cap 3.
3.4.4 Test Layout for Pile Cap 4
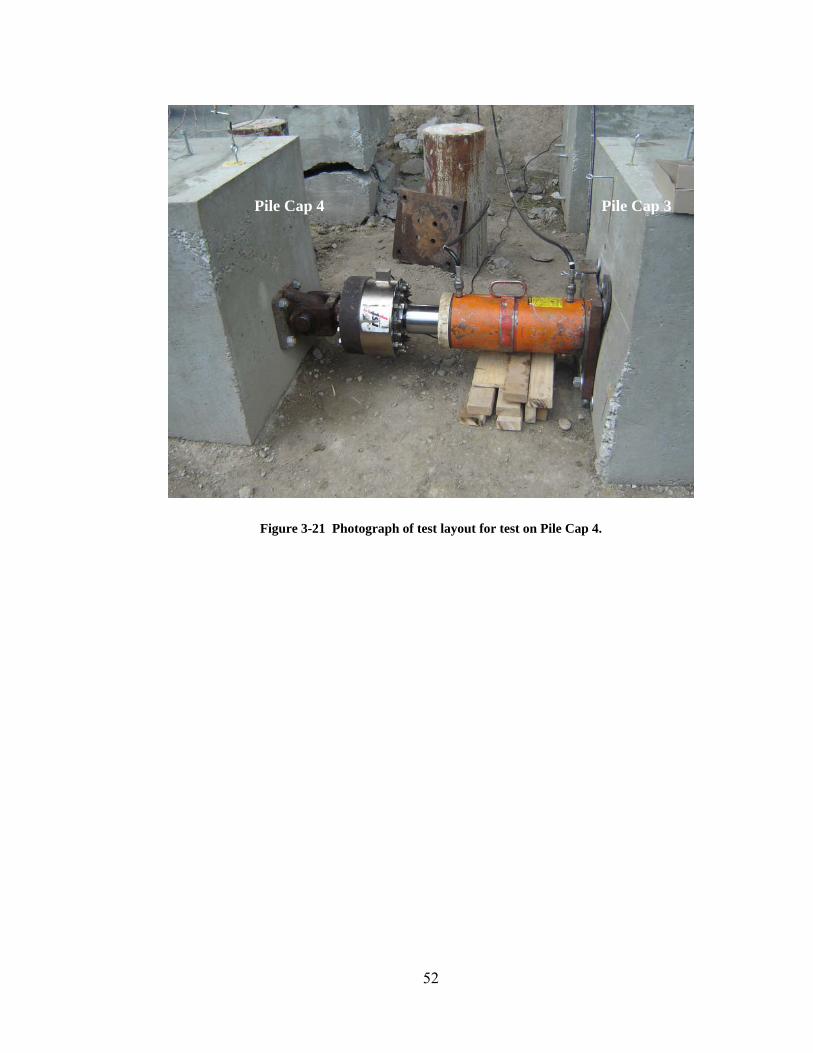
Figure 3-21 shows the loading arrangement for the test of Pile Cap 4. A
different hydraulic jack was used, and a strut was placed between Pile Cap 1 and the
Geopier cap to provide the reaction for the test.
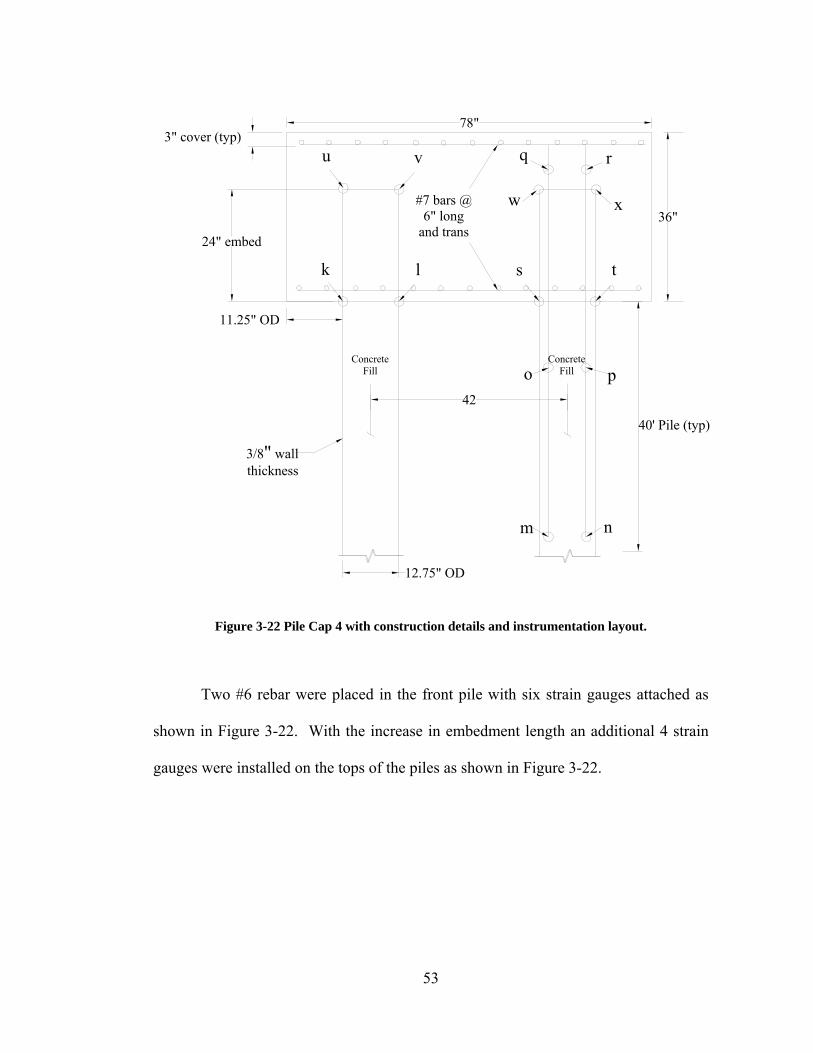
The geometry of Pile Cap 4 is shown in Figure 3-22. A 24 inch pile
embedment length was provided but no reinforcing cage connection detail was
included. However, both piles were filled with concrete in contrast to Pile Cap 3
where the piles were left hollow. Since the rear pile had been previously filled with
concrete, strain gauges were not able to be installed.
52
Figure 3-21 Photograph of test layout for test on Pile Cap 4.
Pile Cap 4 Pile Cap 3
53
36"
78"3" cover (typ)
42
#7 bars @ 6" long
and trans
3/8" wall thickness
40' Pile (typ)
k l s t
24" embed
12.75" OD
u v
w x
Concrete
Fill
Concrete
Fill
q r
po
m n
11.25" OD
Figure 3-22 Pile Cap 4 with construction details and instrumentation layout.
Two #6 rebar were placed in the front pile with six strain gauges attached as
shown in Figure 3-22. With the increase in embedment length an additional 4 strain
gauges were installed on the tops of the piles as shown in Figure 3-22.
54
4 ANALYTICAL STUDY
4.1 Introduction
Hand calculations and computer modeling were used to better understand how
the pile caps would perform under lateral loads. Hand calculations were used to
evaluate the potential for failure of individual elements and the computer models were
used to explain the configuration as a system. Multiple failure scenarios were
developed and their respective capacities determined by either hand calculations or
computer modeling. In some cases, results were available from both methods and
could be compared. There were two computer modeling programs available for
calculations; LPILE 4.0, and GROUP 4.0. LPILE analyzes a single pile with user-
defined soil and pile parameters. GROUP analyzes a group of piles with their
respective soil and pile properties. Both programs account for group interaction
effects as well as the pile head boundary conditions. Neither program considers the
size, placement, or strength characteristics of the cap or the embedment length of the
pile.
There were four major areas of concern: failure in the pile, failure in the cap,
failure in the surrounding soil, and failure in the connection between the cap and pile.
It was intended that failure would occur in the connection; therefore the pile and cap
details were designed to both fit the criteria specified by the Utah and Oregon
55
Departments of Transportation as well as allow the failure modes to occur in the
connection. It was predicted that even though the pile caps were to be laterally loaded
that there would also be large tensile and compression forces acting on the piles and
cap as well as large moments. It was therefore necessary to estimate multiple failure
scenarios which will be discussed in this chapter.
4.2 Failure in the Piles
Generally, all the piles had the same material properties and geometries. The
only variance was test piles for Pile Cap 3 that remained hollow while the test piles for
the other pile caps were filled with concrete. Areas of concern regarding failure in the
piles alone were that of excessive moments; this being the most common type of
failure from testing conducted at Montana State University. The shear strength of a
hollow pile was estimated to be approximately 484 kips therefore shear strength
calculations with concrete and/or rebar were not necessary.
According to analyses using LPILE, the hollow pile would have a 3,100 kip-in
moment capacity while the concrete filled pile would have over a 3,500 kip-in
moment capacity.. Moment capacities obtained from equation 2-3 (Bruneau and
Marson 2004) showed little variation from these values. Although filling the piles
with concrete only increased its moment capacity by 13% it is still recommended that
piles be filled with concrete to delay local buckling GROUP estimated that the largest
moment would occur at grade on the front pile, and would not exceed 2,000 kip-in for
a lateral load of 130 kips. GROUP accounts for rotation effects due to the pile
geometry and loading. LPILE, on the other hand, estimated that with a lateral load of
56
⎟⎟⎠
⎞⎜⎜⎝
⎛−=
bffA
dfAMc
ysysu '7.1
9.
ccn AfV '2φ=
130 kips the moment would exceed 3,500 kip-in assuming that the pile was in a fixed-
head condition.
4.3 Failure in the Cap
The caps themselves are also subject to moments as well as tension,
compression and shear forces. Calculations using equation 4-1 estimated the cap
moment capacity to be approximately 6,000 in-kips which greatly exceeded the
moment to be applied. The one way shear strength of Pile Caps 1, 2, and 4 were also
predicted to exceed the stresses applied during loading and to not be a concern, the
one way shear strength equation is presented in equation 4-2.
( 4-1)
( 4-2)
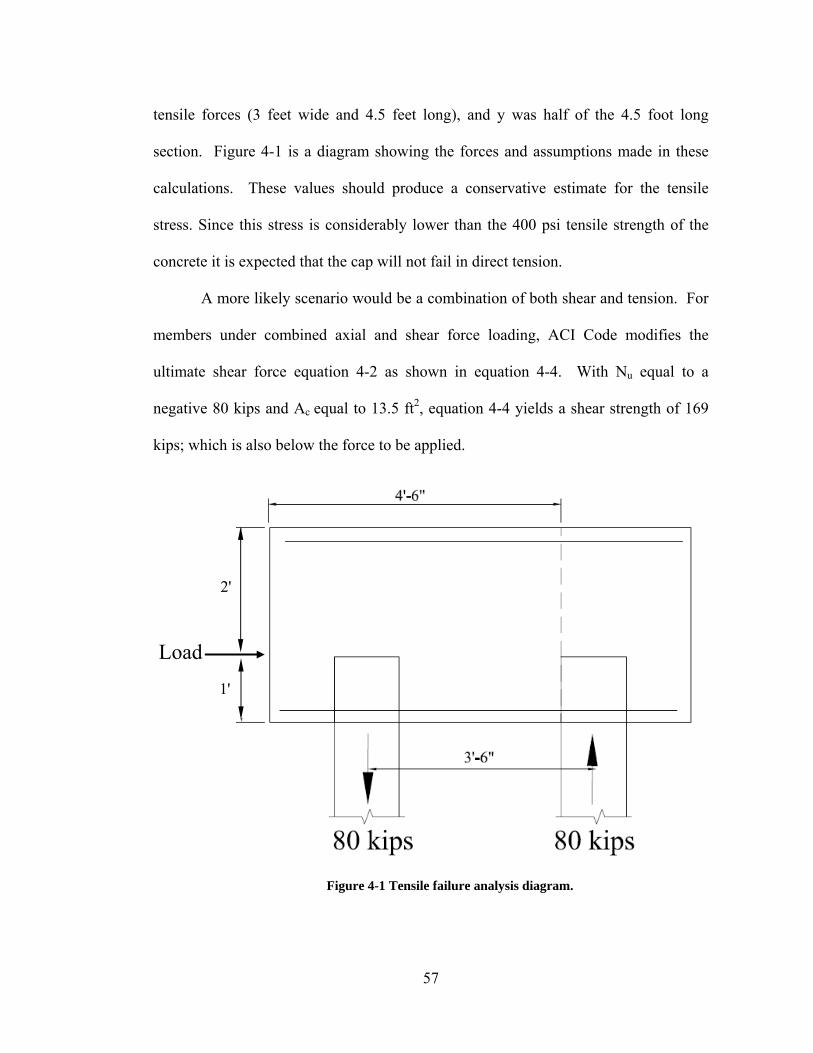
However, questions remained as to how Pile Cap 3 would respond with the
applied force acting in a direct line with the connection and with no vertical
reinforcement to hold the cap to the pile. GROUP estimated that tensile forces within
the cap would reach 80 kips. The tensile capacity of the pile cap was estimated to be
192 psi by equation 4-3. In this equation the moment (M) was taken as 280 ft-kips, I
as 22.8 ft4 and y as 2.25 feet. The moment was determined conservatively by
multiplying 80 kips by the pile spacing of 3.5 feet, the moment of inertia (I) was
determined by considering the concrete that was in direct assistance to resist the
57
tensile forces (3 feet wide and 4.5 feet long), and y was half of the 4.5 foot long
section. Figure 4-1 is a diagram showing the forces and assumptions made in these
calculations. These values should produce a conservative estimate for the tensile
stress. Since this stress is considerably lower than the 400 psi tensile strength of the
concrete it is expected that the cap will not fail in direct tension.
A more likely scenario would be a combination of both shear and tension. For
members under combined axial and shear force loading, ACI Code modifies the
ultimate shear force equation 4-2 as shown in equation 4-4. With Nu equal to a
negative 80 kips and Ac equal to 13.5 ft2, equation 4-4 yields a shear strength of 169
kips; which is also below the force to be applied.
Figure 4-1 Tensile failure analysis diagram.
Load
1'
2'
58
ccc
un Af
AN
V ')500
1(2 += φ
IMy
=σ
( 4-3)
( 4-4)
Although not supported on the opposite face as load is applied, the pile cap
most closely resembles a deep beam. If modeled as a deep beam there is inadequate
reinforcement to resist the large tensile and shear forces that may develop and a one-
way shear failure is possible. There is a large amount of steel located within the cap,
yet this steel including the piles are not in locations to provide direct assistance to
resist a one-way shear failure.
Cracks in deep beams have been observed to occur at stresses somewhere
between one-third to one-half of the ultimate strength (MacGregor and Wight 2005).
To fit the criteria of a deep beam it can be assumed that the front pile is the location of
the support and therefore the area of concern is only 4.5 feet long and 3 feet wide
which yields a one-way shear capacity of 184 kips; one-third to one-half of this value
is less then the load to be applied, and one way shear is of concern.
4.4 Failure in the Surrounding Soil
The computer modeling program GROUP proved invaluable in analyzing each
test. By inputting the soil profile and each layers’ respective thickness and strength
properties an estimation of the soil reaction vs. length along the piles was obtained.
The soil profile and properties used in analyses are presented in Figure 3-1. When
59
ys fAT =
piles are driven at relatively close spacing the shear zones for adjacent piles overlap
reducing the lateral resistance. Such group interaction effects are often accounted for
using p–multipliers to reduce the soil resistance of p value. Using relationships
developed by Rollins et al (2006) p-multipliers were estimated to be 0.82 and 0.61 for
the front and trailing row piles, respectively. The unit side resistance along the length
of the pile was estimated based on the undrained shear strength in the clay or the
penetration resistance in the sand. Group analyses indicated that the trailing row pile
would begin to pull-out of the ground when the lateral force reached about 80 kips. At
a load of about 130 kips the pile cap would deflect significantly and the pile cap would
have essentially failed at that point. Once a pile has displaced vertically more than 0.1
to 0.2 inch the majority of side friction is mobilized and additional loading would
cause a magnification of both deflection and rotation. This appears to be an important
failure mode for pile caps 1, 2, and 4.
4.5 Failure in the Connection
It was desired that failure in the connection would occur prior to any other type
of failure such that a comparison between all four of the tested connections would be
possible. There were also multiple types of possible failures within the connections to
be considered.
4.5.1 Tensile Failure of the Reinforcement
The tensile capacity, T, of the reinforcement is given by the equation,
( 4-5)
60
'25 c
byd
f
dfl
αβλ=
where As is the cross sectional area of the reinforcement and fy is the yield strength.
The connection design, consisting of 4 #6 bars with a yield strength of 60 ksi would be
able to resist over 106 kips of tensile force. As shown previously, the pile would pull
out of the ground at an axial load of 80 to 90 kips and therefore the reinforcement
design was considered adequate.
4.5.2 Reinforcement Pull-Out Failure in Pile
To develop the full tensile capacity of the reinforcing steel, the embedment
length must be sufficient so that the bond strength between the concrete and the
reinforcement is not exceeded. The required embedment length is known as the
development length. Pile Caps 1 and 2 were considered within this scope and Pile
Cap 3 and 4 while having no reinforcement connection were clearly not considered.
According to ACI code provisions, the development length, ld, is given by the
equation
( 4-6)
with variables as defined at the beginning of the report. UDOT has specified a
development length of 4 feet for #6 bars in their connection detail; however,
calculations using the ACI equation indicate that only 29 inches of embedment are
required. Therefore, the 4 foot embedment depth specified by UDOT was used and
considered more than sufficient.
61
'
1200
c
bdh
fdl =
4.5.3 Reinforcement Pull-Out of Cap
After determining that the reinforcement embedment into the pile exceeded the
required development length it was then necessary to check the development length
into the pile cap to ensure that this connection would also be adequate. Pile Caps 1
and 2 had both reinforced connections and a hook in the rebar as shown in the profile
drawings. Using equation 4-7 with a #6 bar and 4000 psi concrete, the development
length provided by the hook, ldh, was 14 inches which is based on a bend of at least 12
bar diameters, therefore only 15 inches of additional development length is required.
In order to fully develop the reinforcement the bars must extend from the piles into the
pile cap 15 inches and then hook at a 90 degree angle a distance of 12 bar diameters.
The design specifications that Utah DOT provides for embedment into the cap is 27
inches from the top of the pile which excludes any type of hook, therefore once again
the provided details are more than adequate.
( 4-7)
4.5.4 Concrete Pull-Out of the Pile
Another potential failure mechanism to be considered for Pile Caps 1 and 2 is
if the tensile forces within the pile exceed the bond strength between the steel pipe and
the concrete infill so that the reinforced concrete section pulls out of the pile. Using a
bond strength of 45 psi between a steel pipe pile and concrete infill, this failure type
was predicted not to be a concern provided a monolithic pour of a minimum of 4.5
62
feet. The worst case to consider would be Pile Cap 1 with only 6 inches embedment
which still provides 6 inches on the exterior of the pile and 54 inches on the interior
extending to the tip of the reinforcing bars. This analysis indicates that before the
concrete can be pulled out of the pile the reinforcing steel will yield.
4.5.5 Bond Strength between Exterior of Pile and Concrete
Pile Caps 3 and 4 did not have a reinforced connection detail and with such
high axial loads to be considered it was necessary to calculate a possible slipping to
occur between the exterior of the pile and the surrounding concrete. Pile Cap 4 had
two differences compared to Pile Cap 3. First, the concrete in the pile and cap were
poured monolithically providing added strength and second the embedment length was
24 inches which was twice as long as for Pile Cap 3. Using the same conservative
value of 45 psi for the steel to concrete bond strength, the capacity of the interface for
Pile Cap 4 was found to be 90 kips; this includes the bond strength around the
perimeter of the pile. This load is close to the ultimate side friction capacity of the
pile although with the very low bond strength value of 45 psi used in the calculation,
this failure mode is not considered to be of high concern. These same calculations
suggest that the interface capacity for Pile Cap 3 would be only be 50 kips. Therefore,
failure at this interface could occur before the pile pulls out of the ground. However,
these calculations did not account for the influence from the bottom reinforcing grid
which includes the pile cap longitudinal bars extending into the piles through 2 inch
holes; this is expected to provide additional pull-out resistance.
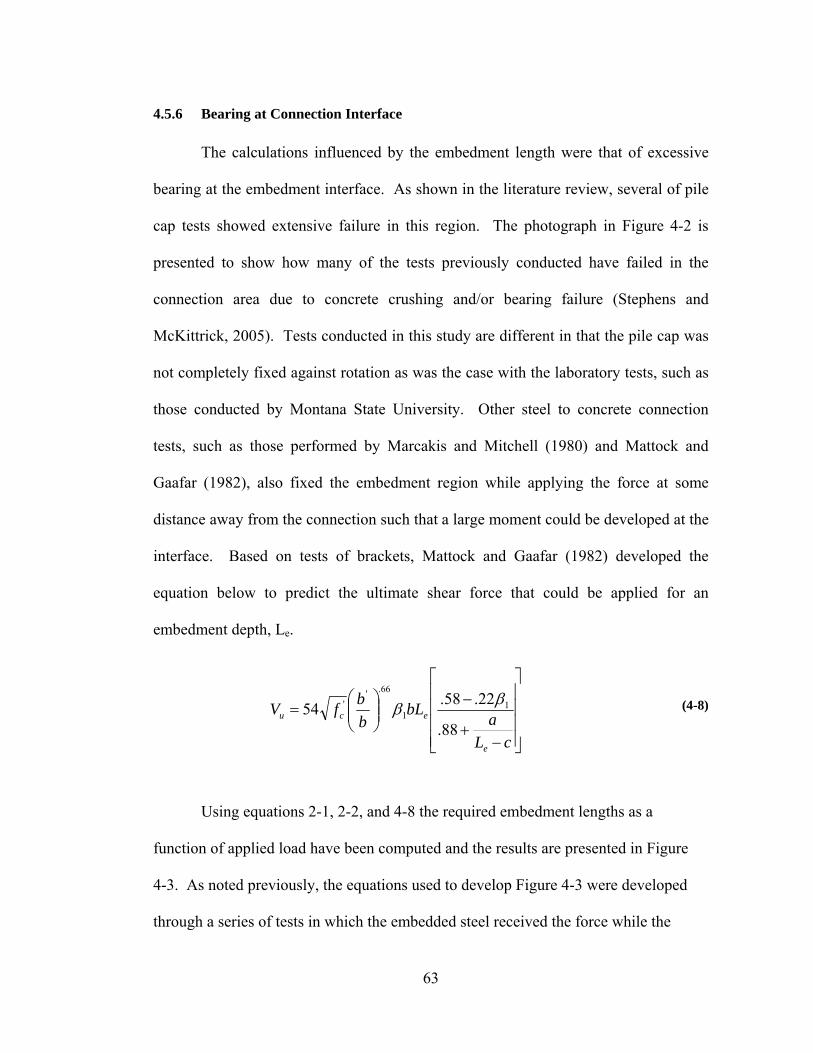
63
⎥⎥⎥⎥
⎦
⎤
⎢⎢⎢⎢
⎣
⎡
−+
−⎟⎟⎠
⎞⎜⎜⎝
⎛=
cLabL
bbfV
e
ecu
88.
22.58.54 11
66.'' ββ
4.5.6 Bearing at Connection Interface
The calculations influenced by the embedment length were that of excessive
bearing at the embedment interface. As shown in the literature review, several of pile
cap tests showed extensive failure in this region. The photograph in Figure 4-2 is
presented to show how many of the tests previously conducted have failed in the
connection area due to concrete crushing and/or bearing failure (Stephens and
McKittrick, 2005). Tests conducted in this study are different in that the pile cap was
not completely fixed against rotation as was the case with the laboratory tests, such as
those conducted by Montana State University. Other steel to concrete connection
tests, such as those performed by Marcakis and Mitchell (1980) and Mattock and
Gaafar (1982), also fixed the embedment region while applying the force at some
distance away from the connection such that a large moment could be developed at the
interface. Based on tests of brackets, Mattock and Gaafar (1982) developed the
equation below to predict the ultimate shear force that could be applied for an
embedment depth, Le.
( 4-8)
Using equations 2-1, 2-2, and 4-8 the required embedment lengths as a
function of applied load have been computed and the results are presented in Figure
4-3. As noted previously, the equations used to develop Figure 4-3 were developed
through a series of tests in which the embedded steel received the force while the

64
concrete in which the steel was embedded remained fixed. However, in the field tests
the load on the pile is actually distributed over a length rather than being applied at a
single point as in the lab testing. To provide an equivalent moment arm, the computer
program GROUP was used to compute the maximum moment and shear force at the
base of the pile cap and the maximum moment was divided by the shear force to
determine the point of action for the force. An alternative approach would be to use
the computer program to find the distance to the point of zero shear force in the pile.
As it turns out, both approaches yield a reasonably similar results.
As shown in Figure 4-3, all the equations show inadequate embedment for Pile
Cap 1, which only a 6 inch embedment length, when lateral load exceed 20 to 40 kips.
Therefore, a bearing failure in the pile cap would be expected. In addition, for applied
loads greater than about 80 kips the equations predict that Pile Caps 2 and 3, both with
12 inches of embedment length, would also be close to failure.
It should, however, be noted that these equations do not account for the
additional moment capacity which could be provided by a flexural mechanism as was
observed in several of the laboratory tests involving piles with shallow embedment
(Xiao 2003 and Xiao et al 2006).
65
Figure 4-2 Failure of pile caps tested at Montana State University.
0
5
10
15
20
25
0 20 40 60 80 100 120 140
Lateral Load (lbs)
Req
uire
d Em
bedm
ent L
engt
h, L
e (in
) Eq. 2-1 Marcakis and Mitchell (1980)
Eq. 2-2 Shama et al (2001)
Eq. 4-8 Mattlock and Gaafar (1982)
Figure 4-3 Required embedment using moment and load from GROUP.
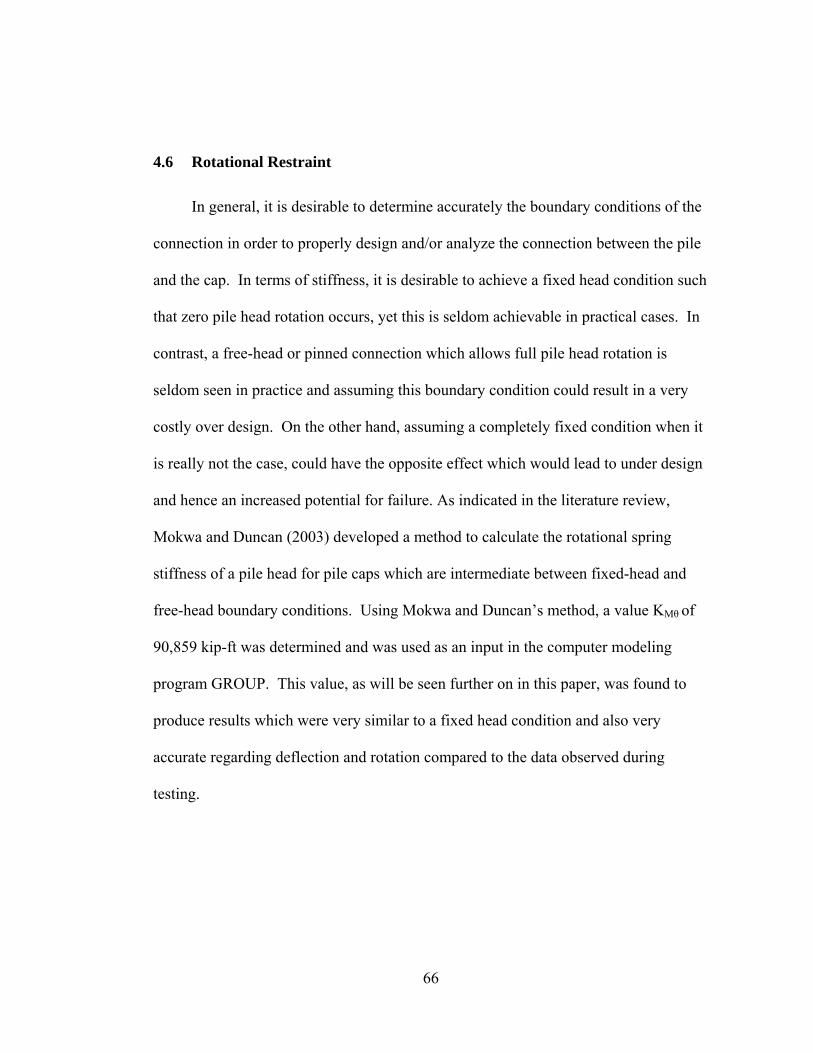
66
4.6 Rotational Restraint
In general, it is desirable to determine accurately the boundary conditions of the
connection in order to properly design and/or analyze the connection between the pile
and the cap. In terms of stiffness, it is desirable to achieve a fixed head condition such
that zero pile head rotation occurs, yet this is seldom achievable in practical cases. In
contrast, a free-head or pinned connection which allows full pile head rotation is
seldom seen in practice and assuming this boundary condition could result in a very
costly over design. On the other hand, assuming a completely fixed condition when it
is really not the case, could have the opposite effect which would lead to under design
and hence an increased potential for failure. As indicated in the literature review,
Mokwa and Duncan (2003) developed a method to calculate the rotational spring
stiffness of a pile head for pile caps which are intermediate between fixed-head and
free-head boundary conditions. Using Mokwa and Duncan’s method, a value KMθ of
90,859 kip-ft was determined and was used as an input in the computer modeling
program GROUP. This value, as will be seen further on in this paper, was found to
produce results which were very similar to a fixed head condition and also very
accurate regarding deflection and rotation compared to the data observed during
testing.
67
4.7 Summary of Predictions
After conducting this analytical review, predictions can be made regarding
each pile cap test. A failure would be expected in the connection for Pile Cap 1 at a
relatively small lateral load ranging from 20 to 40 kips, assuming that the concrete
cover spalls off. Connection failures would also be expected in Pile Caps 2 and 3 at
higher lateral loads just about the time that the rear piles start pulling upward.
Although flexural capacity might help increase the moment capacity of Pile Caps 1
and 2, there is no reinforcement to increase moment capacity in Pile Cap 3. In
addition, if Pile Cap 3 acts as a deep beam, shear failure could occur at the elevation of
the tops of the pile. The pile embedment of 24 inches for Pile Cap 4 should be
sufficient to prevent failure in the pile cap; however, the back pile would be expected
to pull out of the ground at higher load levels.
68
5 TEST RESULTS
5.1 General Remarks
All of the full-scale pile to pile cap tests conducted previously have been
laboratory tests where most problems can be observed and corrected relatively easily.
Field testing is more challenging, yet can potentially produce more valuable data
because the test conditions are closer to actual conditions. Each lateral load test
utilized a hydraulic ram to produce the lateral force which pushed the pile cap at a
predetermined location one foot above grade. Five load cycles were applied at each
deflection increment with slight variances that are noted. Three types of
instrumentation were used for gathering data: string potentiometers to measure the
amount of displacement, strain gauges to measure the amount of strain, and a load cell
to determine the applied force. Each test lasted an average of 90 minutes due to the
loading sequence as well as inspections of equipment and the pile cap.
The behavior of each pile group was predicted using the computer programs
LPILE and GROUP. The soil input parameters used in the analyses were summarized
in Section 3.1 and the pile material properties were defined in Sections 3.2. Analyses
were performed using free-head, fixed-head and elastically restrained pile head
boundary conditions. Because GROUP does not account for connection stiffness, the
computed pile group response was the same for all four pile caps.
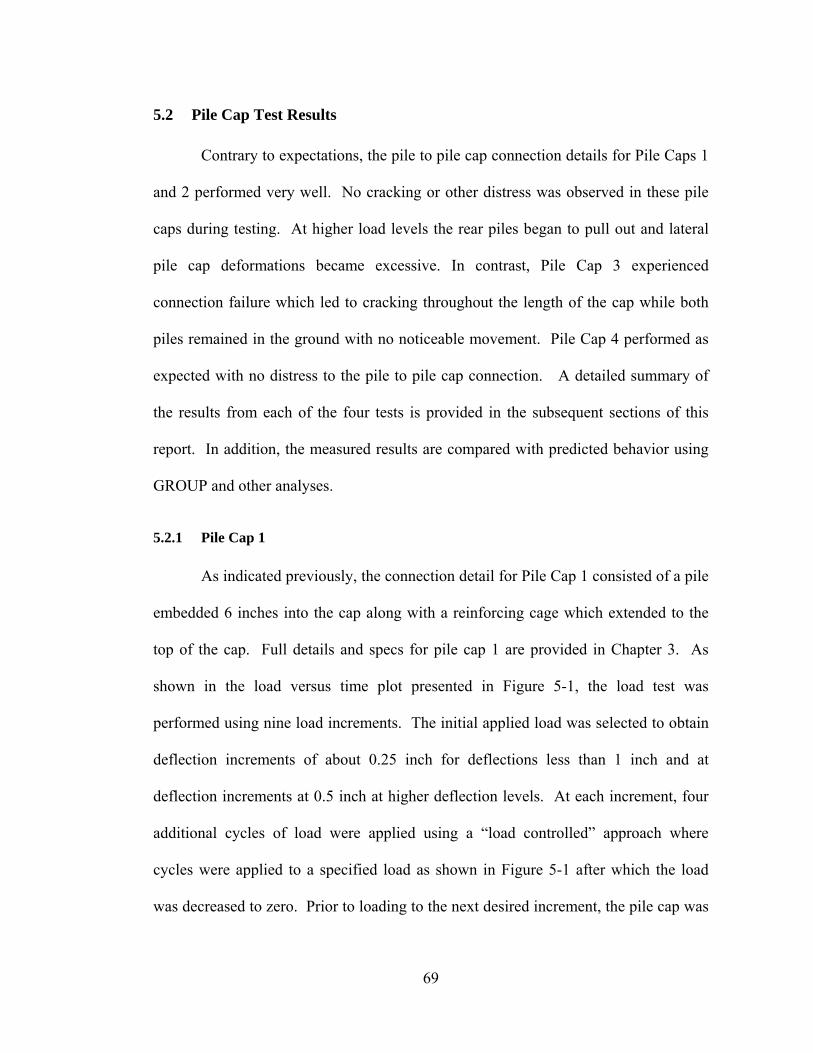
69
5.2 Pile Cap Test Results
Contrary to expectations, the pile to pile cap connection details for Pile Caps 1
and 2 performed very well. No cracking or other distress was observed in these pile
caps during testing. At higher load levels the rear piles began to pull out and lateral
pile cap deformations became excessive. In contrast, Pile Cap 3 experienced
connection failure which led to cracking throughout the length of the cap while both
piles remained in the ground with no noticeable movement. Pile Cap 4 performed as
expected with no distress to the pile to pile cap connection. A detailed summary of
the results from each of the four tests is provided in the subsequent sections of this
report. In addition, the measured results are compared with predicted behavior using
GROUP and other analyses.
5.2.1 Pile Cap 1
As indicated previously, the connection detail for Pile Cap 1 consisted of a pile
embedded 6 inches into the cap along with a reinforcing cage which extended to the
top of the cap. Full details and specs for pile cap 1 are provided in Chapter 3. As
shown in the load versus time plot presented in Figure 5-1, the load test was
performed using nine load increments. The initial applied load was selected to obtain
deflection increments of about 0.25 inch for deflections less than 1 inch and at
deflection increments at 0.5 inch at higher deflection levels. At each increment, four
additional cycles of load were applied using a “load controlled” approach where
cycles were applied to a specified load as shown in Figure 5-1 after which the load
was decreased to zero. Prior to loading to the next desired increment, the pile cap was

70
pulled back, as close as possible, to its initial position. This general cyclic loading
procedure was continued on all four tests.
-20-10
0102030405060708090
100110120130
0 500 1000 1500 2000 2500 3000 3500 4000 4500
Time (sec)
Load
(kip
s)
`
Figure 5-1 Pile Cap 1 load vs time plot showing loading sequence.
Figure 5-2 shows a plot of the complete load-deflection curve during the load
testing. In the test on Pile Cap 1, the pile cap was repeatedly loaded to a specified
load with each cycle at a given increment. Unfortunately, progressively higher
deflections were achieved with each load cycle and eventually the load would produce
a deflection which exceeded the subsequent target deflection level for the next
increment. The progressively increasing deflection at a given load is evident in Figure
5-2 particularly at higher levels. To prevent this from occurring in future tests, a
deflection control approach was adopted for subsequent tests in which cycles were
applied to a given deflection rather than a given load.
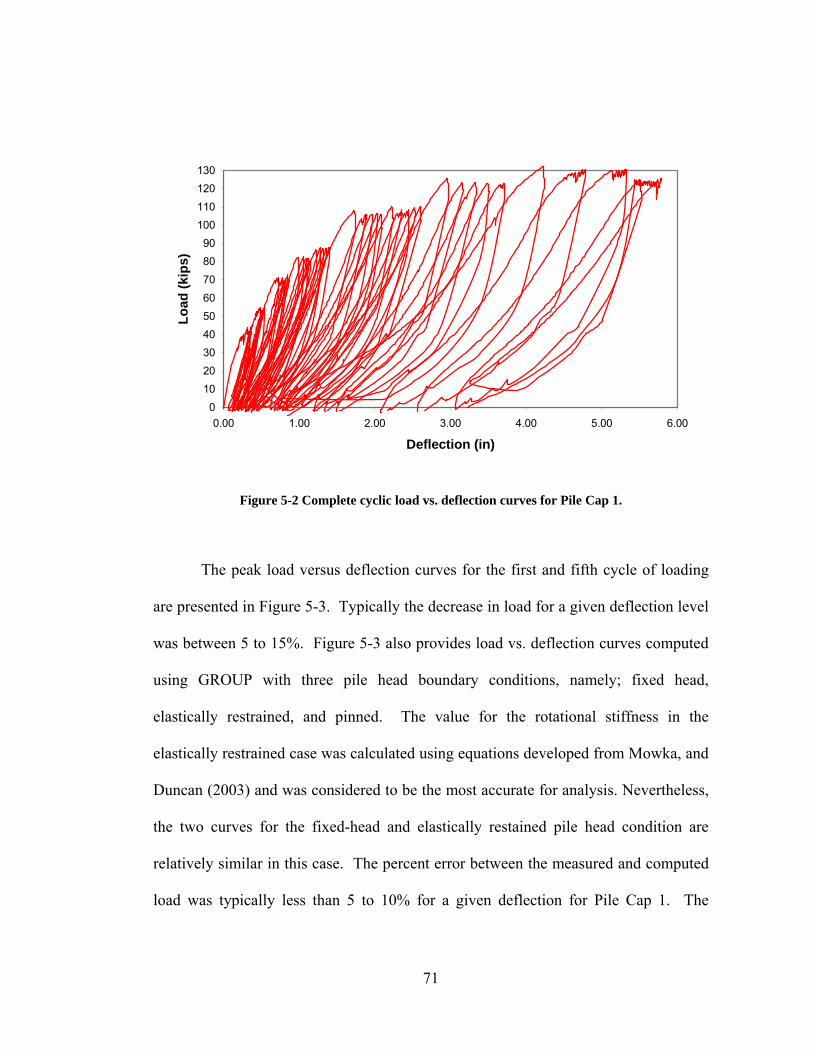
71
0102030405060
708090
100110120130
0.00 1.00 2.00 3.00 4.00 5.00 6.00
Deflection (in)
Load
(kip
s)
Figure 5-2 Complete cyclic load vs. deflection curves for Pile Cap 1.
The peak load versus deflection curves for the first and fifth cycle of loading
are presented in Figure 5-3. Typically the decrease in load for a given deflection level
was between 5 to 15%. Figure 5-3 also provides load vs. deflection curves computed
using GROUP with three pile head boundary conditions, namely; fixed head,
elastically restrained, and pinned. The value for the rotational stiffness in the
elastically restrained case was calculated using equations developed from Mowka, and
Duncan (2003) and was considered to be the most accurate for analysis. Nevertheless,
the two curves for the fixed-head and elastically restained pile head condition are
relatively similar in this case. The percent error between the measured and computed
load was typically less than 5 to 10% for a given deflection for Pile Cap 1. The
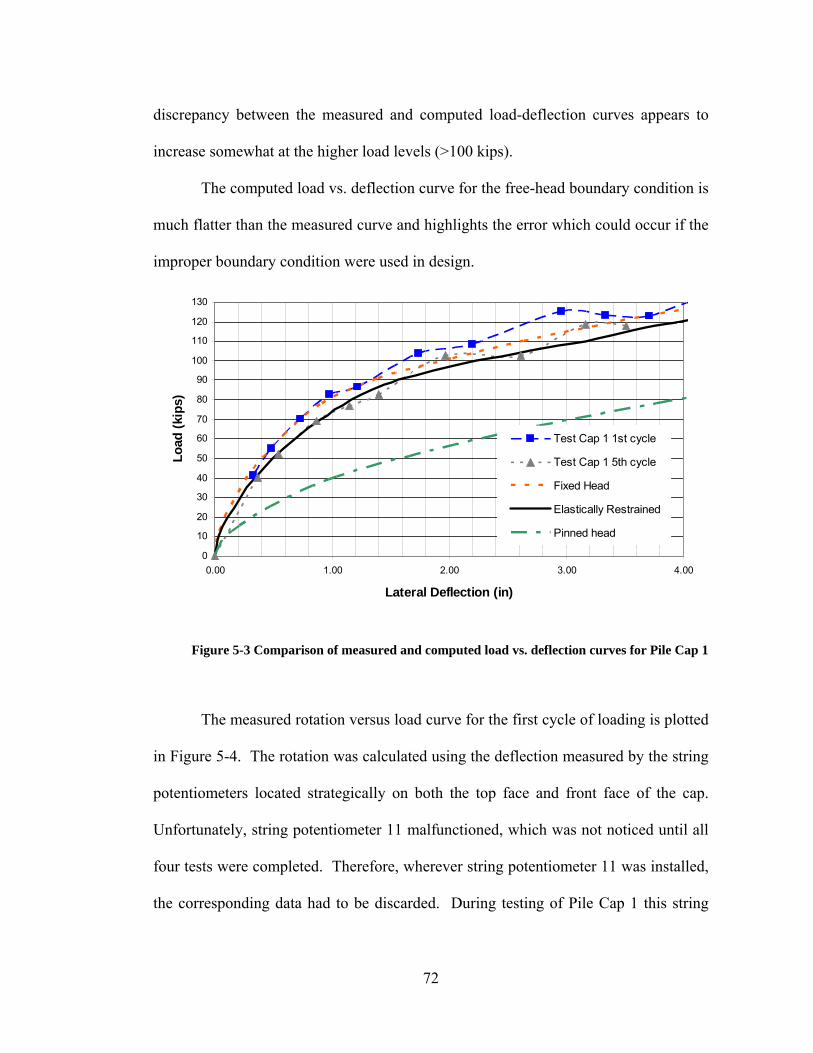
72
discrepancy between the measured and computed load-deflection curves appears to
increase somewhat at the higher load levels (>100 kips).
The computed load vs. deflection curve for the free-head boundary condition is
much flatter than the measured curve and highlights the error which could occur if the
improper boundary condition were used in design.
0
10
20
30
40
50
60
70
80
90
100
110
120
130
0.00 1.00 2.00 3.00 4.00
Lateral Deflection (in)
Load
(kip
s)
Test Cap 1 1st cycle
Test Cap 1 5th cycle
Fixed Head
Elastically Restrained
Pinned head
Figure 5-3 Comparison of measured and computed load vs. deflection curves for Pile Cap 1
The measured rotation versus load curve for the first cycle of loading is plotted
in Figure 5-4. The rotation was calculated using the deflection measured by the string
potentiometers located strategically on both the top face and front face of the cap.
Unfortunately, string potentiometer 11 malfunctioned, which was not noticed until all
four tests were completed. Therefore, wherever string potentiometer 11 was installed,
the corresponding data had to be discarded. During testing of Pile Cap 1 this string
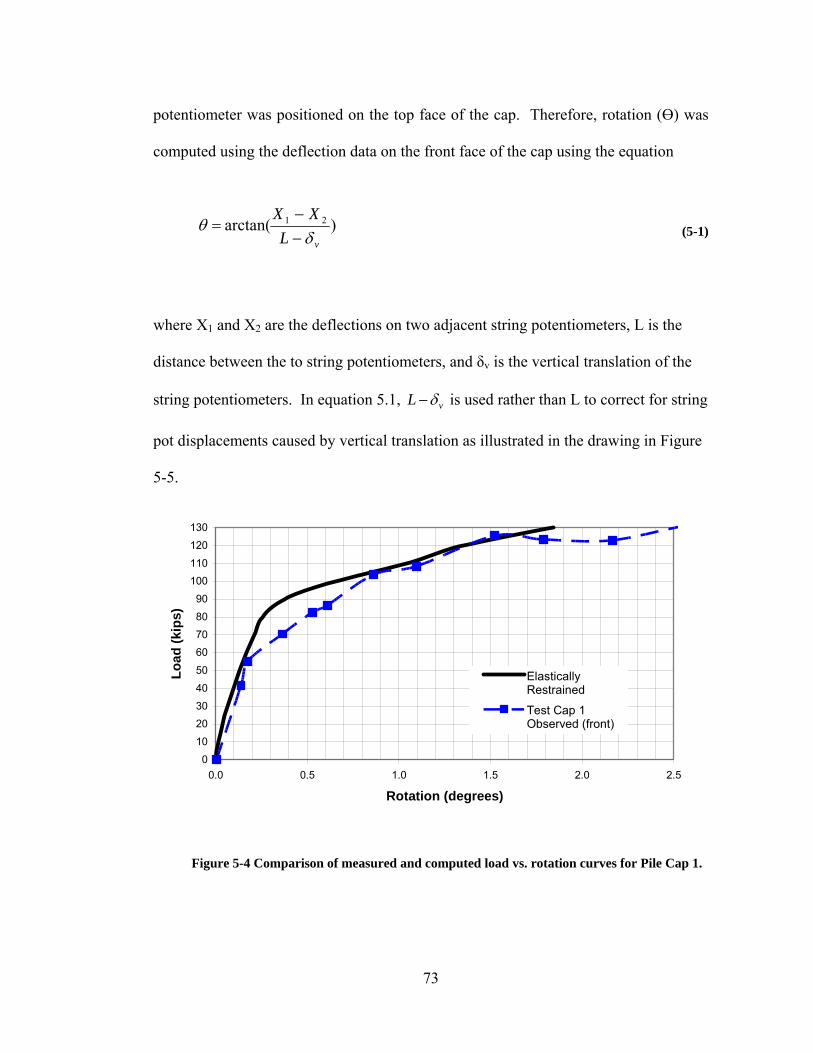
73
)arctan( 21
vLXXδ
θ−−
=
potentiometer was positioned on the top face of the cap. Therefore, rotation (Ө) was
computed using the deflection data on the front face of the cap using the equation
( 5-1)
where X1 and X2 are the deflections on two adjacent string potentiometers, L is the
distance between the to string potentiometers, and δv is the vertical translation of the
string potentiometers. In equation 5.1, vL δ− is used rather than L to correct for string
pot displacements caused by vertical translation as illustrated in the drawing in Figure
5-5.
0
10
2030
40
50
6070
80
90
100110
120
130
0.0 0.5 1.0 1.5 2.0 2.5
Rotation (degrees)
Load
(kip
s)
ElasticallyRestrained
Test Cap 1Observed (front)
Figure 5-4 Comparison of measured and computed load vs. rotation curves for Pile Cap 1.
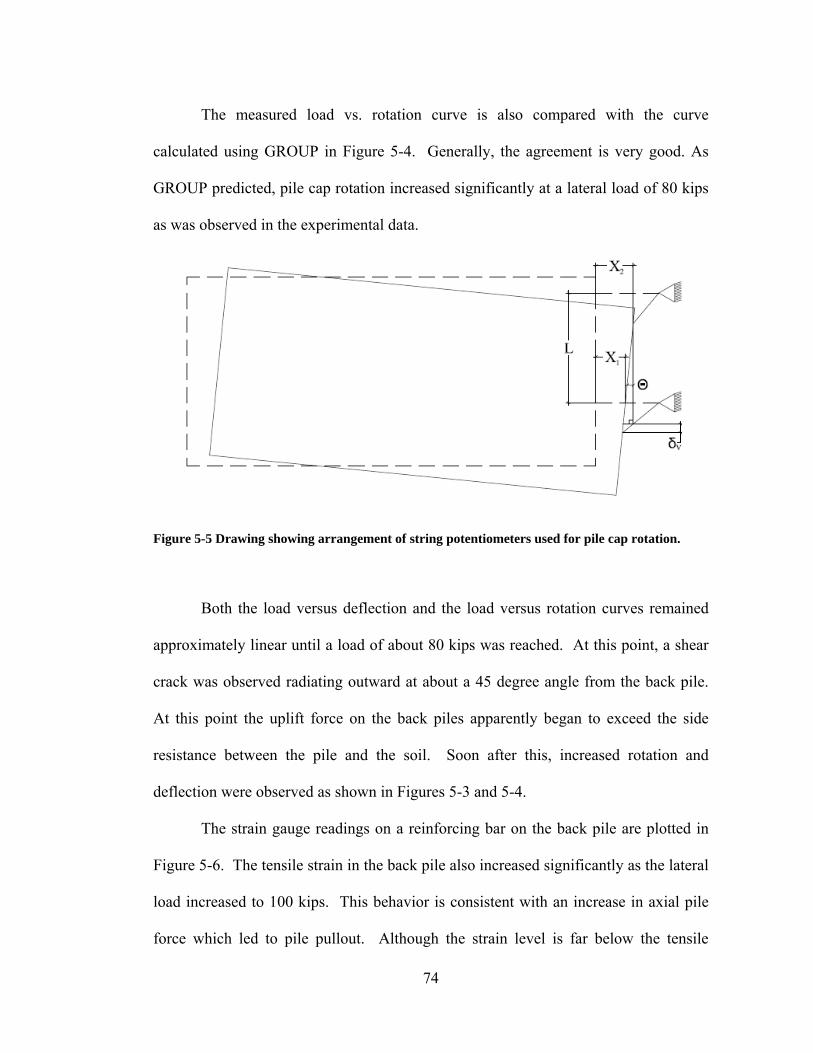
74
The measured load vs. rotation curve is also compared with the curve
calculated using GROUP in Figure 5-4. Generally, the agreement is very good. As
GROUP predicted, pile cap rotation increased significantly at a lateral load of 80 kips
as was observed in the experimental data.
Figure 5-5 Drawing showing arrangement of string potentiometers used for pile cap rotation.
Both the load versus deflection and the load versus rotation curves remained
approximately linear until a load of about 80 kips was reached. At this point, a shear
crack was observed radiating outward at about a 45 degree angle from the back pile.
At this point the uplift force on the back piles apparently began to exceed the side
resistance between the pile and the soil. Soon after this, increased rotation and
deflection were observed as shown in Figures 5-3 and 5-4.
The strain gauge readings on a reinforcing bar on the back pile are plotted in
Figure 5-6. The tensile strain in the back pile also increased significantly as the lateral
load increased to 100 kips. This behavior is consistent with an increase in axial pile
force which led to pile pullout. Although the strain level is far below the tensile
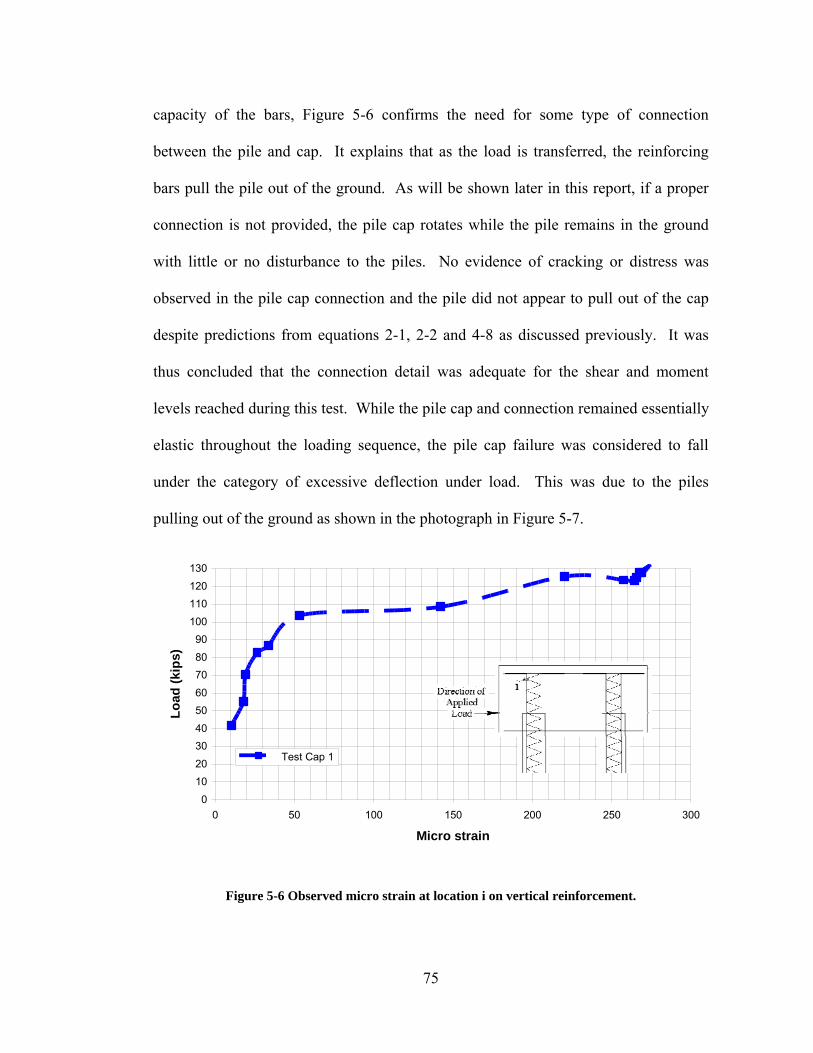
75
capacity of the bars, Figure 5-6 confirms the need for some type of connection
between the pile and cap. It explains that as the load is transferred, the reinforcing
bars pull the pile out of the ground. As will be shown later in this report, if a proper
connection is not provided, the pile cap rotates while the pile remains in the ground
with little or no disturbance to the piles. No evidence of cracking or distress was
observed in the pile cap connection and the pile did not appear to pull out of the cap
despite predictions from equations 2-1, 2-2 and 4-8 as discussed previously. It was
thus concluded that the connection detail was adequate for the shear and moment
levels reached during this test. While the pile cap and connection remained essentially
elastic throughout the loading sequence, the pile cap failure was considered to fall
under the category of excessive deflection under load. This was due to the piles
pulling out of the ground as shown in the photograph in Figure 5-7.
0
1020
3040
5060
7080
90100
110120
130
0 50 100 150 200 250 300
Micro strain
Load
(kip
s)
Test Cap 1
Figure 5-6 Observed micro strain at location i on vertical reinforcement.
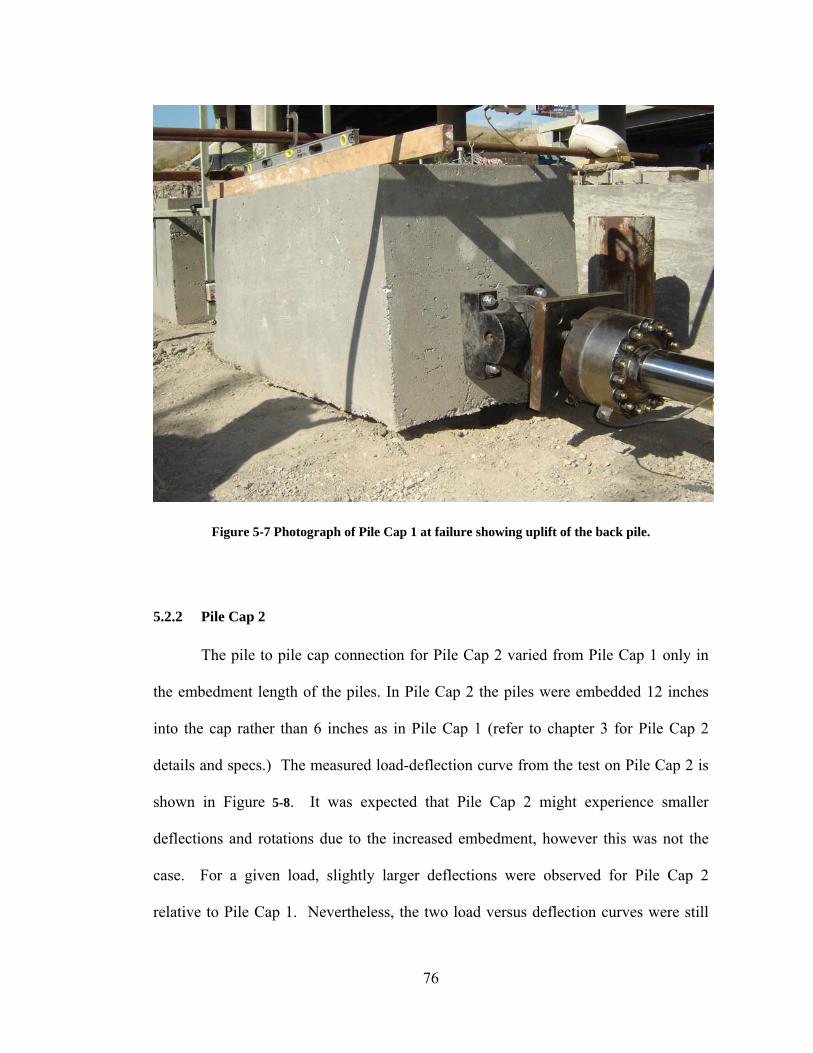
76
Figure 5-7 Photograph of Pile Cap 1 at failure showing uplift of the back pile.
5.2.2 Pile Cap 2
The pile to pile cap connection for Pile Cap 2 varied from Pile Cap 1 only in
the embedment length of the piles. In Pile Cap 2 the piles were embedded 12 inches
into the cap rather than 6 inches as in Pile Cap 1 (refer to chapter 3 for Pile Cap 2
details and specs.) The measured load-deflection curve from the test on Pile Cap 2 is
shown in Figure 5-8. It was expected that Pile Cap 2 might experience smaller
deflections and rotations due to the increased embedment, however this was not the
case. For a given load, slightly larger deflections were observed for Pile Cap 2
relative to Pile Cap 1. Nevertheless, the two load versus deflection curves were still
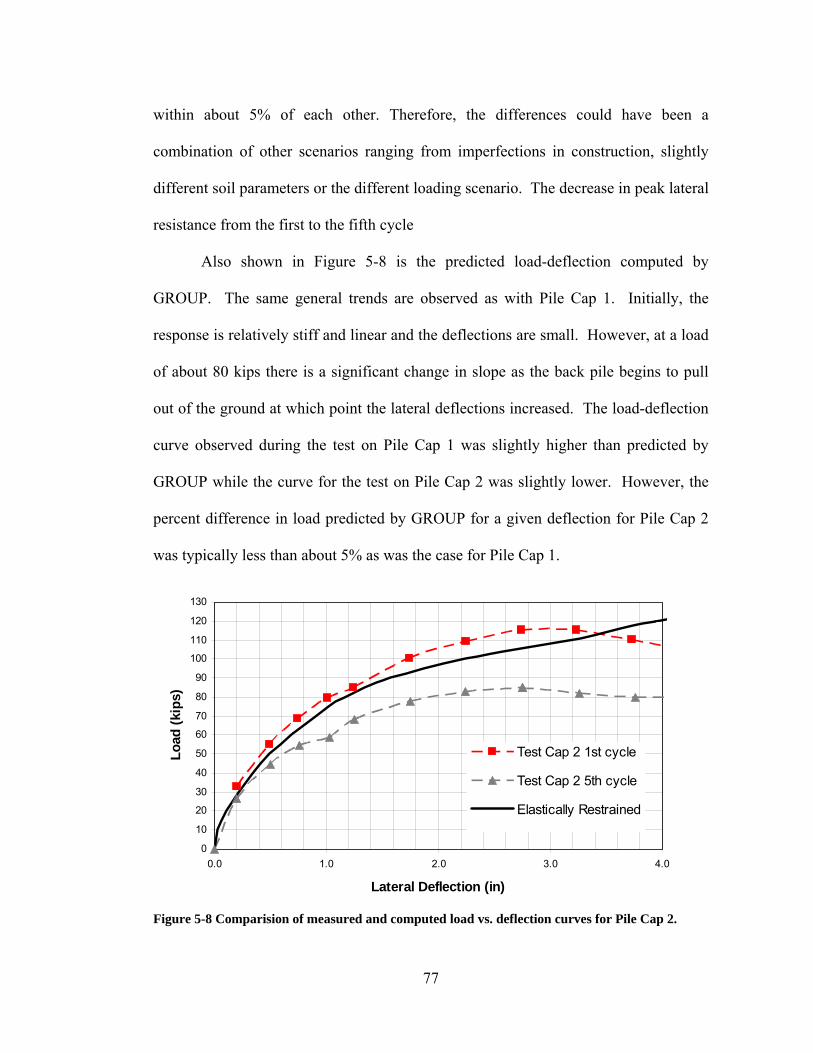
77
within about 5% of each other. Therefore, the differences could have been a
combination of other scenarios ranging from imperfections in construction, slightly
different soil parameters or the different loading scenario. The decrease in peak lateral
resistance from the first to the fifth cycle
Also shown in Figure 5-8 is the predicted load-deflection computed by
GROUP. The same general trends are observed as with Pile Cap 1. Initially, the
response is relatively stiff and linear and the deflections are small. However, at a load
of about 80 kips there is a significant change in slope as the back pile begins to pull
out of the ground at which point the lateral deflections increased. The load-deflection
curve observed during the test on Pile Cap 1 was slightly higher than predicted by
GROUP while the curve for the test on Pile Cap 2 was slightly lower. However, the
percent difference in load predicted by GROUP for a given deflection for Pile Cap 2
was typically less than about 5% as was the case for Pile Cap 1.
0
10
20
30
40
50
60
70
80
90
100
110
120
130
0.0 1.0 2.0 3.0 4.0
Lateral Deflection (in)
Load
(kip
s)
Test Cap 2 1st cycle
Test Cap 2 5th cycle
Elastically Restrained
Figure 5-8 Comparision of measured and computed load vs. deflection curves for Pile Cap 2.
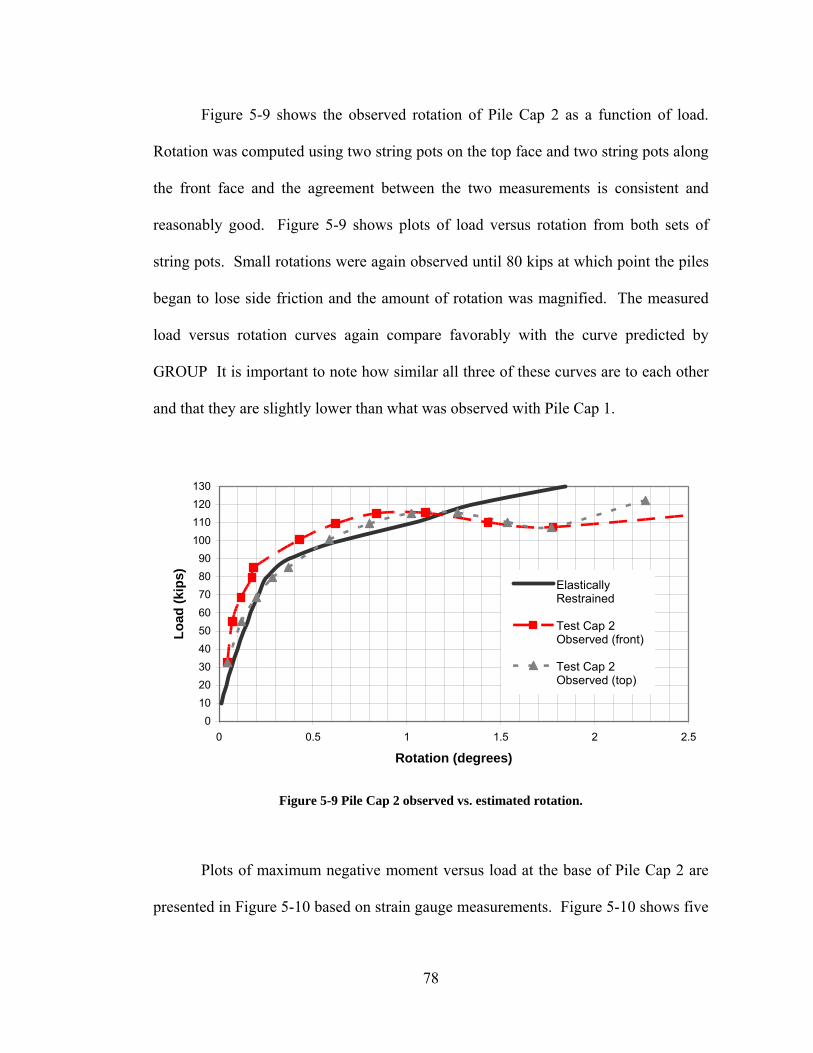
78
Figure 5-9 shows the observed rotation of Pile Cap 2 as a function of load.
Rotation was computed using two string pots on the top face and two string pots along
the front face and the agreement between the two measurements is consistent and
reasonably good. Figure 5-9 shows plots of load versus rotation from both sets of
string pots. Small rotations were again observed until 80 kips at which point the piles
began to lose side friction and the amount of rotation was magnified. The measured
load versus rotation curves again compare favorably with the curve predicted by
GROUP It is important to note how similar all three of these curves are to each other
and that they are slightly lower than what was observed with Pile Cap 1.
0102030405060708090
100110120130
0 0.5 1 1.5 2 2.5
Rotation (degrees)
Load
(kip
s)
ElasticallyRestrained
Test Cap 2Observed (front)
Test Cap 2Observed (top)
Figure 5-9 Pile Cap 2 observed vs. estimated rotation.
Plots of maximum negative moment versus load at the base of Pile Cap 2 are
presented in Figure 5-10 based on strain gauge measurements. Figure 5-10 shows five
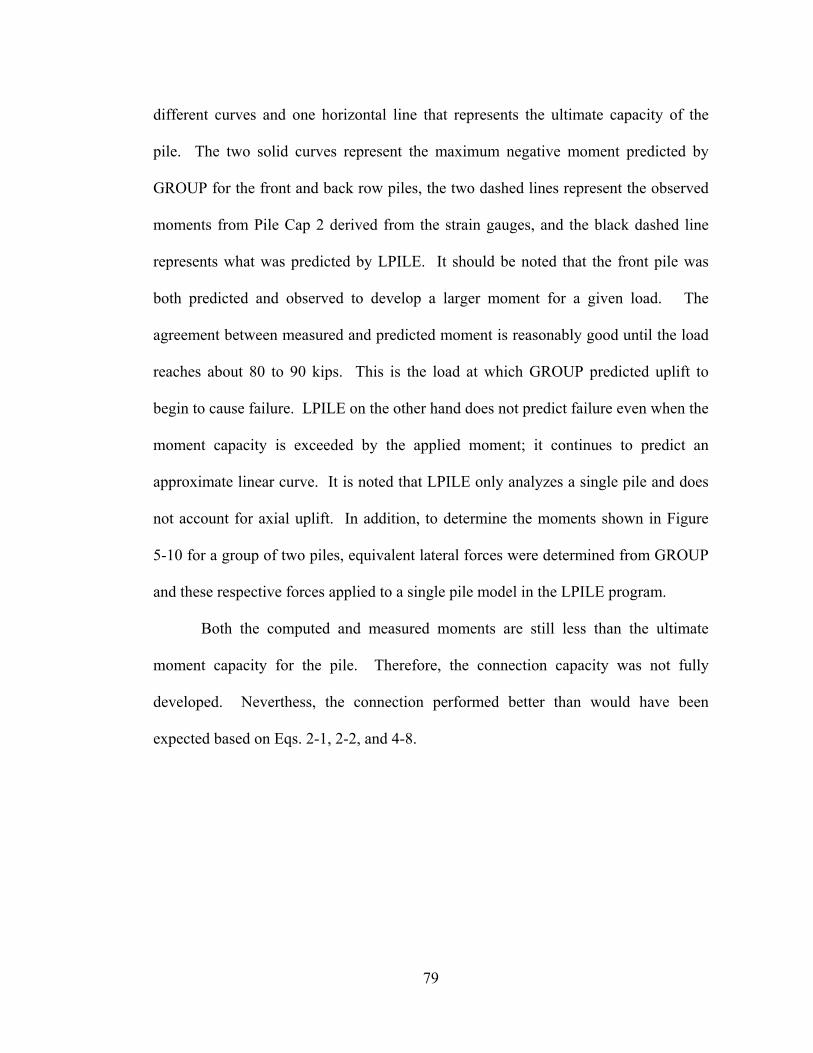
79
different curves and one horizontal line that represents the ultimate capacity of the
pile. The two solid curves represent the maximum negative moment predicted by
GROUP for the front and back row piles, the two dashed lines represent the observed
moments from Pile Cap 2 derived from the strain gauges, and the black dashed line
represents what was predicted by LPILE. It should be noted that the front pile was
both predicted and observed to develop a larger moment for a given load. The
agreement between measured and predicted moment is reasonably good until the load
reaches about 80 to 90 kips. This is the load at which GROUP predicted uplift to
begin to cause failure. LPILE on the other hand does not predict failure even when the
moment capacity is exceeded by the applied moment; it continues to predict an
approximate linear curve. It is noted that LPILE only analyzes a single pile and does
not account for axial uplift. In addition, to determine the moments shown in Figure
5-10 for a group of two piles, equivalent lateral forces were determined from GROUP
and these respective forces applied to a single pile model in the LPILE program.
Both the computed and measured moments are still less than the ultimate
moment capacity for the pile. Therefore, the connection capacity was not fully
developed. Neverthess, the connection performed better than would have been
expected based on Eqs. 2-1, 2-2, and 4-8.
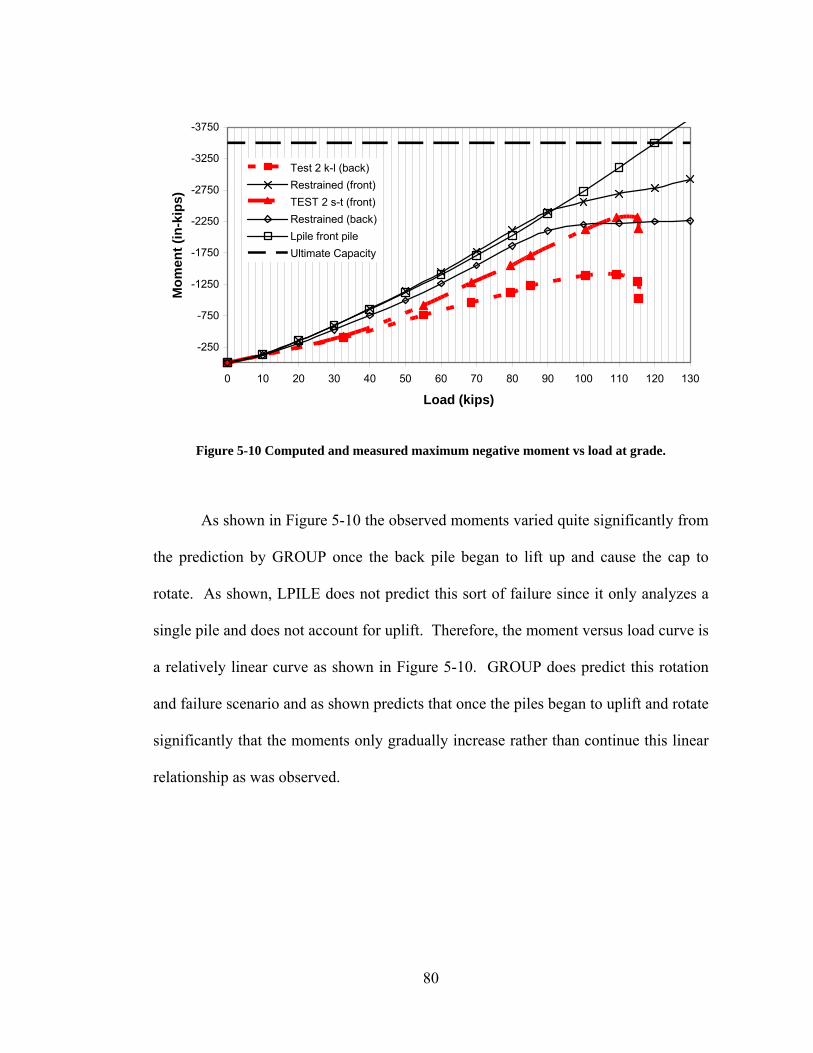
80
-3750
-3250
-2750
-2250
-1750
-1250
-750
-250
0 10 20 30 40 50 60 70 80 90 100 110 120 130
Load (kips)
Mom
ent (
in-k
ips)
Test 2 k-l (back)Restrained (front)TEST 2 s-t (front)Restrained (back)Lpile front pileUltimate Capacity
Figure 5-10 Computed and measured maximum negative moment vs load at grade.
As shown in Figure 5-10 the observed moments varied quite significantly from
the prediction by GROUP once the back pile began to lift up and cause the cap to
rotate. As shown, LPILE does not predict this sort of failure since it only analyzes a
single pile and does not account for uplift. Therefore, the moment versus load curve is
a relatively linear curve as shown in Figure 5-10. GROUP does predict this rotation
and failure scenario and as shown predicts that once the piles began to uplift and rotate
significantly that the moments only gradually increase rather than continue this linear
relationship as was observed.
81
Figure 5-11 Pile Cap 2 failure in pullout.
There was some question on the mode of failure. While it was considered that
the piles pulled out of the ground, another possibility was that the piles remained in
the ground and the concrete lost its friction with the pile and slipped. Figure 5-11
shows a close up of the back pile for Pile Cap 2. It is seen here that a cavity was
formed around the pile and that it did indeed pull out of the ground. There is no
evidence of slippage between the pile and the cap. It was observed during both the
loading and unloading parts of each cycle that the pile and cap remained completely
connected with one another.
5.2.3 Pile Cap 3
As explained in Chapter 3; Pile Cap 3 and Pile Cap 4 did not have a
reinforcing bar connection detail; rather, their connection capacities were dependent
upon their respective pile embedment lengths. For Pile Cap 3 the pile was embedded
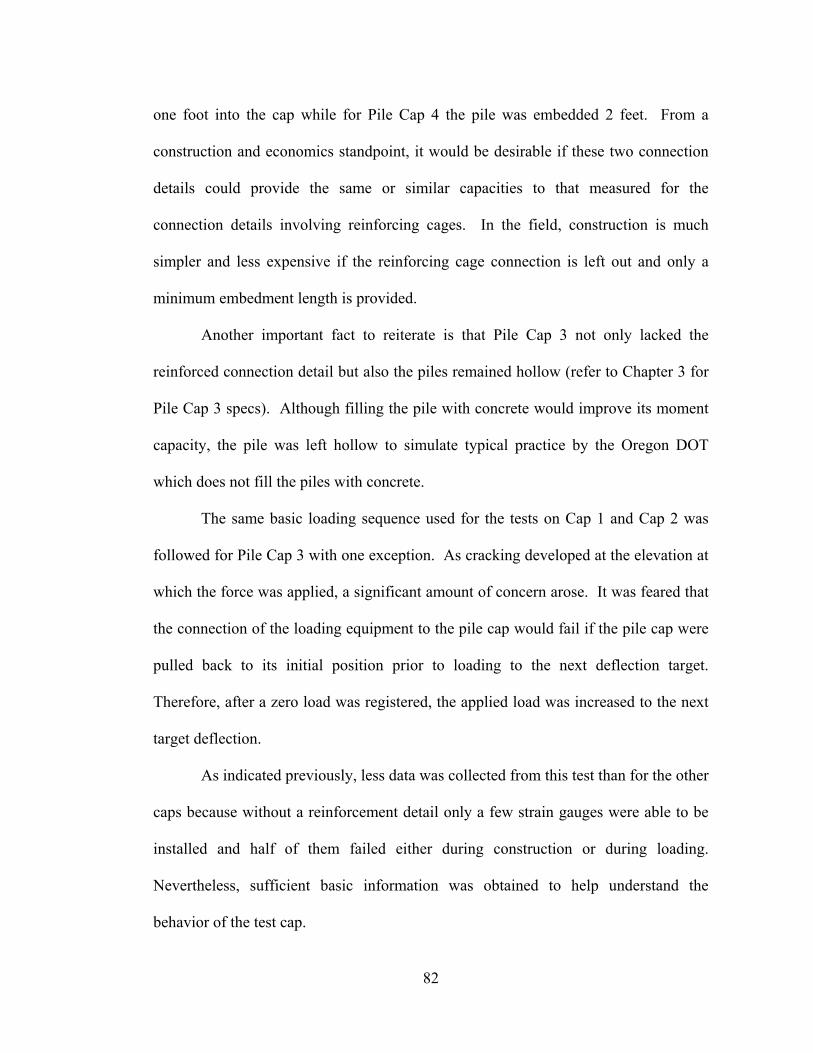
82
one foot into the cap while for Pile Cap 4 the pile was embedded 2 feet. From a
construction and economics standpoint, it would be desirable if these two connection
details could provide the same or similar capacities to that measured for the
connection details involving reinforcing cages. In the field, construction is much
simpler and less expensive if the reinforcing cage connection is left out and only a
minimum embedment length is provided.
Another important fact to reiterate is that Pile Cap 3 not only lacked the
reinforced connection detail but also the piles remained hollow (refer to Chapter 3 for
Pile Cap 3 specs). Although filling the pile with concrete would improve its moment
capacity, the pile was left hollow to simulate typical practice by the Oregon DOT
which does not fill the piles with concrete.
The same basic loading sequence used for the tests on Cap 1 and Cap 2 was
followed for Pile Cap 3 with one exception. As cracking developed at the elevation at
which the force was applied, a significant amount of concern arose. It was feared that
the connection of the loading equipment to the pile cap would fail if the pile cap were
pulled back to its initial position prior to loading to the next deflection target.
Therefore, after a zero load was registered, the applied load was increased to the next
target deflection.
As indicated previously, less data was collected from this test than for the other
caps because without a reinforcement detail only a few strain gauges were able to be
installed and half of them failed either during construction or during loading.
Nevertheless, sufficient basic information was obtained to help understand the
behavior of the test cap.
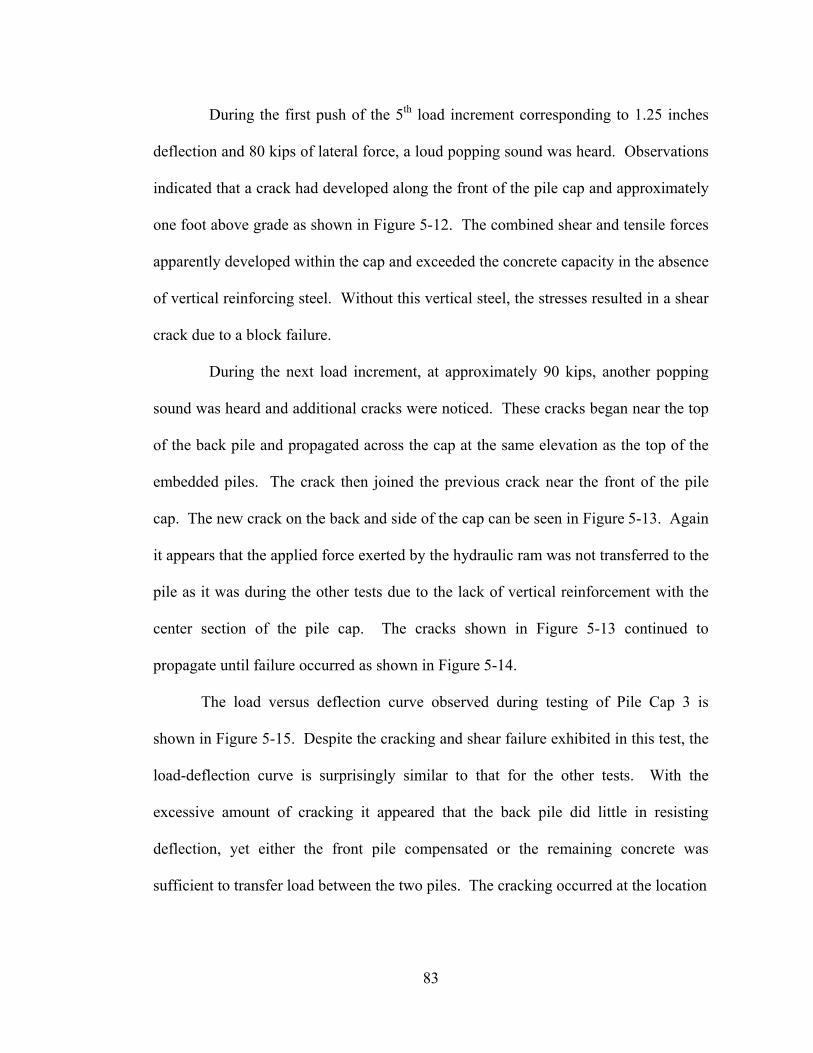
83
During the first push of the 5th load increment corresponding to 1.25 inches
deflection and 80 kips of lateral force, a loud popping sound was heard. Observations
indicated that a crack had developed along the front of the pile cap and approximately
one foot above grade as shown in Figure 5-12. The combined shear and tensile forces
apparently developed within the cap and exceeded the concrete capacity in the absence
of vertical reinforcing steel. Without this vertical steel, the stresses resulted in a shear
crack due to a block failure.
During the next load increment, at approximately 90 kips, another popping
sound was heard and additional cracks were noticed. These cracks began near the top
of the back pile and propagated across the cap at the same elevation as the top of the
embedded piles. The crack then joined the previous crack near the front of the pile
cap. The new crack on the back and side of the cap can be seen in Figure 5-13. Again
it appears that the applied force exerted by the hydraulic ram was not transferred to the
pile as it was during the other tests due to the lack of vertical reinforcement with the
center section of the pile cap. The cracks shown in Figure 5-13 continued to
propagate until failure occurred as shown in Figure 5-14.
The load versus deflection curve observed during testing of Pile Cap 3 is
shown in Figure 5-15. Despite the cracking and shear failure exhibited in this test, the
load-deflection curve is surprisingly similar to that for the other tests. With the
excessive amount of cracking it appeared that the back pile did little in resisting
deflection, yet either the front pile compensated or the remaining concrete was
sufficient to transfer load between the two piles. The cracking occurred at the location
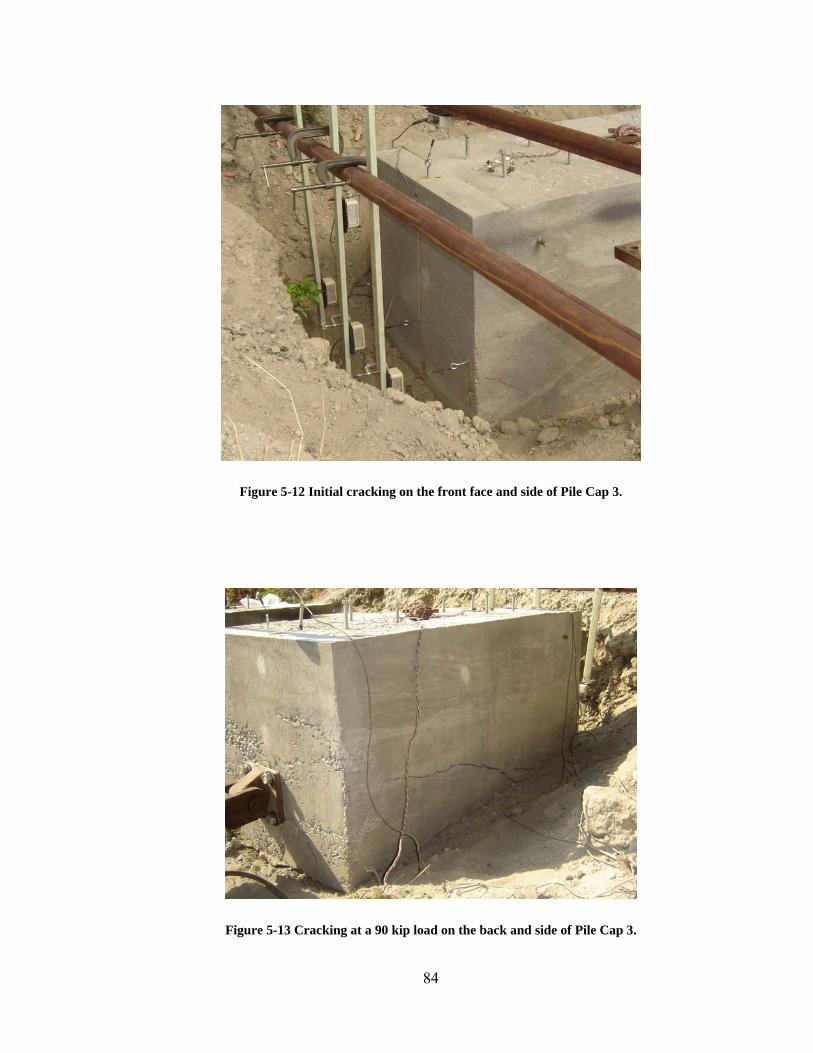
84
Figure 5-12 Initial cracking on the front face and side of Pile Cap 3.
Figure 5-13 Cracking at a 90 kip load on the back and side of Pile Cap 3.
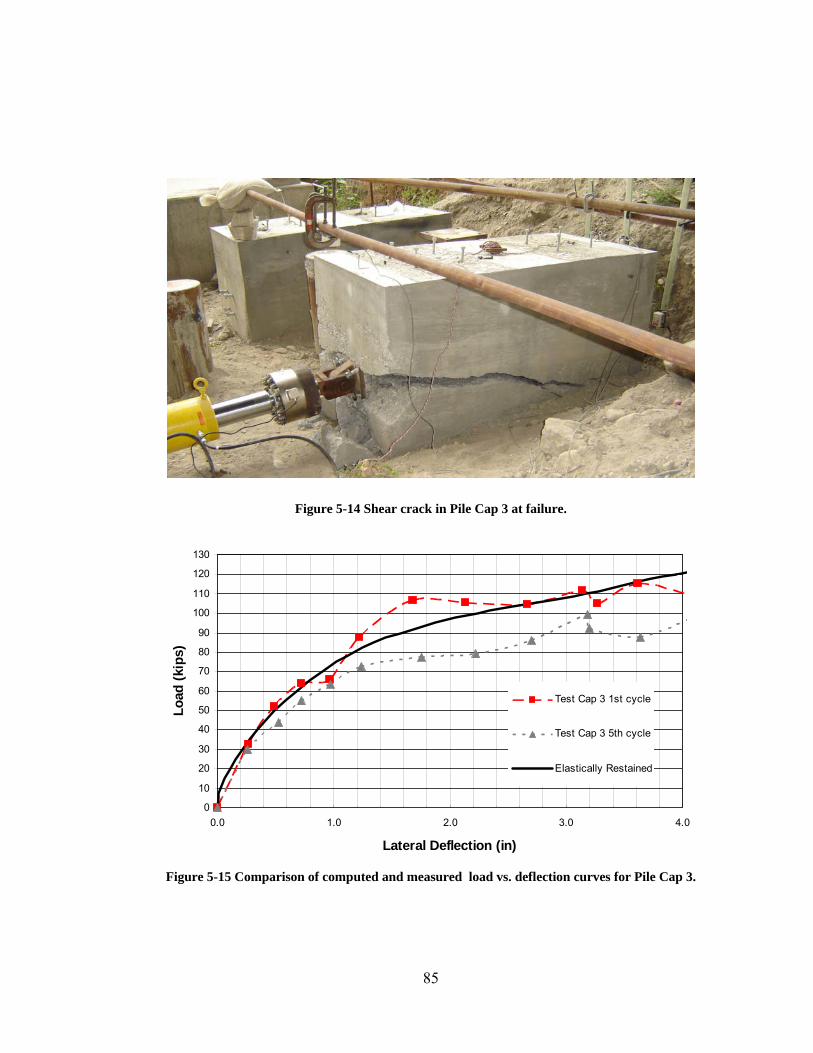
85
Figure 5-14 Shear crack in Pile Cap 3 at failure.
0
10
20
30
40
50
60
70
80
90
100
110
120
130
0.0 1.0 2.0 3.0 4.0
Lateral Deflection (in)
Load
(kip
s)
Test Cap 3 1st cycle
Test Cap 3 5th cycle
Elastically Restained
Figure 5-15 Comparison of computed and measured load vs. deflection curves for Pile Cap 3.
86
where the front face string pots were located, therefore, their respective data may not
be entirely accurate. The load-deflection curves for the 1st and 5th cycles of loading
are relatively close together until the load level at which cracking developed in the pile
cap. However, after cracking the drop in lateral force from the 1st to the 5th cycle
became more pronounced.
5.2.4 Pile Cap 4
As explained in Chapter 3 of this report, Pile Cap 4 included a pile embedment
length of 24 inches which is twice as long as the embedment for the prior two tests.
However, Pile Cap 4 did not include a reinforcing steel connection detail. The test
was conducted to determine if the embedment length would be long enough to act as a
reinforced connection such that the full capacity of the piles could be developed.
Because the first two tests both had adequate connections and the back piles pulled out
of the ground, it was concluded that if the connection were adequate, Pile Cap 4 would
also fail by having the back pile pull out of the ground.
The loading sequence followed the same pattern as was followed in the prior
two tests. The measured load versus deflection and load versus rotation curves are
presented in Figure 5-16 and Figure 5-17, respectively. Once again the measured
curves are compared with the curves predicted by GROUP. In general, the measured
load versus deflection curve is 5 to 10% higher than the curve predicted by GROUP.
However, the measured curve is still very similar to that obtained for Pile Caps 1 and 2
where vertical reinforcing steel was used in the connection detail.
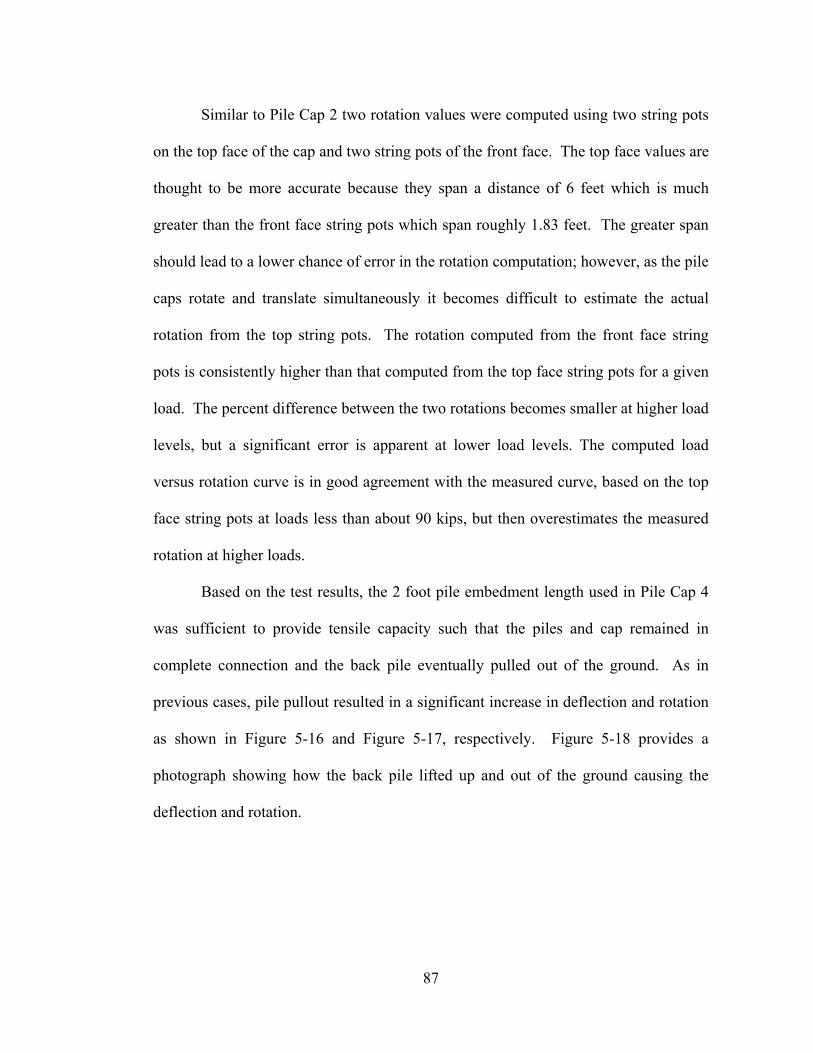
87
Similar to Pile Cap 2 two rotation values were computed using two string pots
on the top face of the cap and two string pots of the front face. The top face values are
thought to be more accurate because they span a distance of 6 feet which is much
greater than the front face string pots which span roughly 1.83 feet. The greater span
should lead to a lower chance of error in the rotation computation; however, as the pile
caps rotate and translate simultaneously it becomes difficult to estimate the actual
rotation from the top string pots. The rotation computed from the front face string
pots is consistently higher than that computed from the top face string pots for a given
load. The percent difference between the two rotations becomes smaller at higher load
levels, but a significant error is apparent at lower load levels. The computed load
versus rotation curve is in good agreement with the measured curve, based on the top
face string pots at loads less than about 90 kips, but then overestimates the measured
rotation at higher loads.
Based on the test results, the 2 foot pile embedment length used in Pile Cap 4
was sufficient to provide tensile capacity such that the piles and cap remained in
complete connection and the back pile eventually pulled out of the ground. As in
previous cases, pile pullout resulted in a significant increase in deflection and rotation
as shown in Figure 5-16 and Figure 5-17, respectively. Figure 5-18 provides a
photograph showing how the back pile lifted up and out of the ground causing the
deflection and rotation.
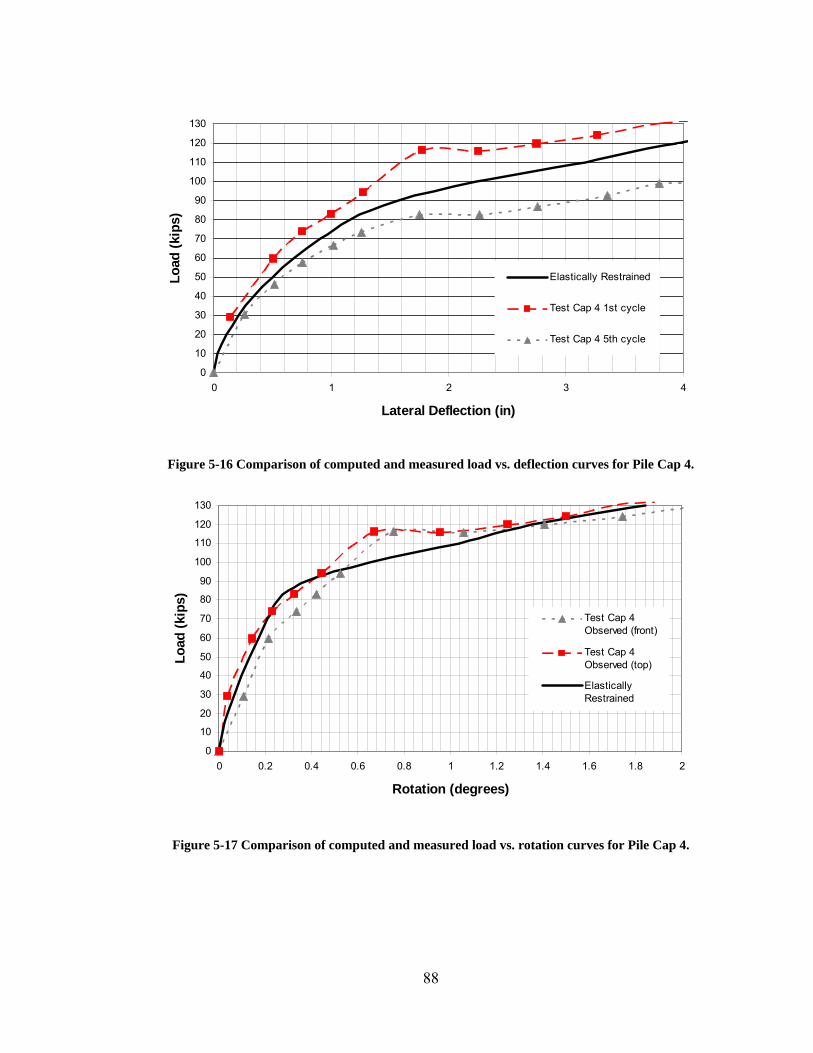
88
0
10
20
30
40
50
60
70
80
90
100
110
120
130
0 1 2 3 4
Lateral Deflection (in)
Load
(kip
s)
Elastically Restrained
Test Cap 4 1st cycle
Test Cap 4 5th cycle
Figure 5-16 Comparison of computed and measured load vs. deflection curves for Pile Cap 4.
0
10
20
30
40
50
60
70
80
90
100
110
120
130
0 0.2 0.4 0.6 0.8 1 1.2 1.4 1.6 1.8 2
Rotation (degrees)
Load
(kip
s)
Test Cap 4Observed (front)
Test Cap 4Observed (top)
ElasticallyRestrained
Figure 5-17 Comparison of computed and measured load vs. rotation curves for Pile Cap 4.
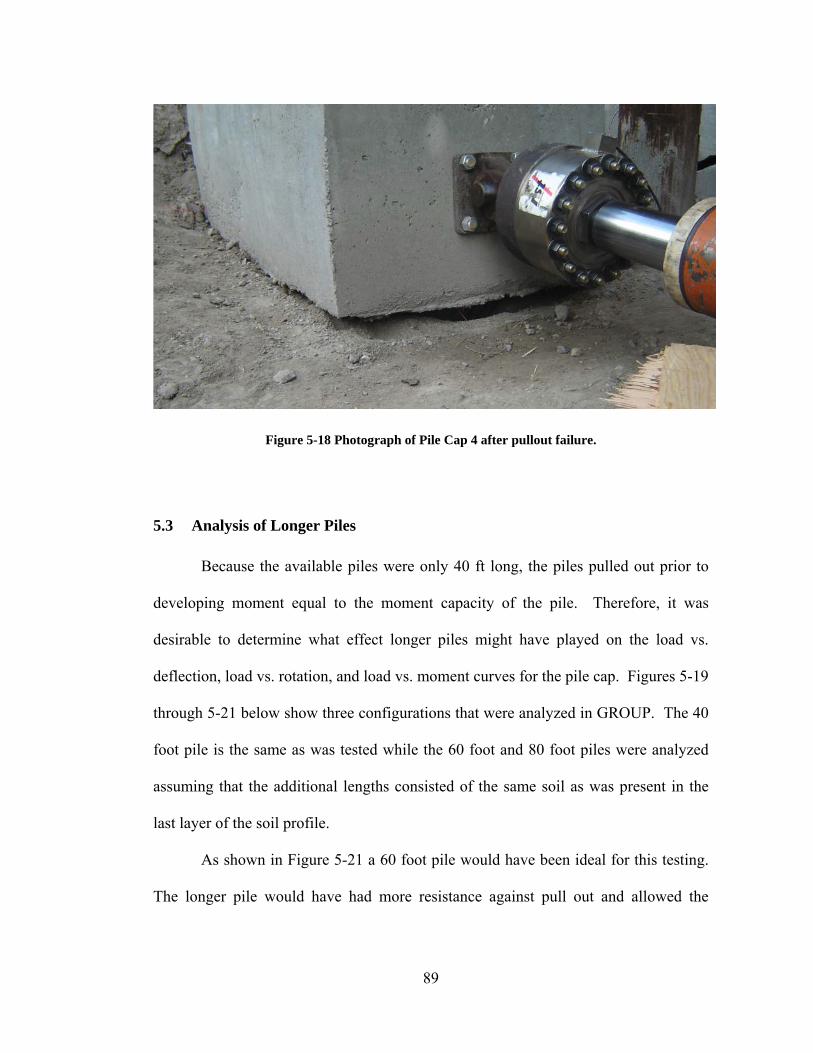
89
Figure 5-18 Photograph of Pile Cap 4 after pullout failure.
5.3 Analysis of Longer Piles
Because the available piles were only 40 ft long, the piles pulled out prior to
developing moment equal to the moment capacity of the pile. Therefore, it was
desirable to determine what effect longer piles might have played on the load vs.
deflection, load vs. rotation, and load vs. moment curves for the pile cap. Figures 5-19
through 5-21 below show three configurations that were analyzed in GROUP. The 40
foot pile is the same as was tested while the 60 foot and 80 foot piles were analyzed
assuming that the additional lengths consisted of the same soil as was present in the
last layer of the soil profile.
As shown in Figure 5-21 a 60 foot pile would have been ideal for this testing.
The longer pile would have had more resistance against pull out and allowed the
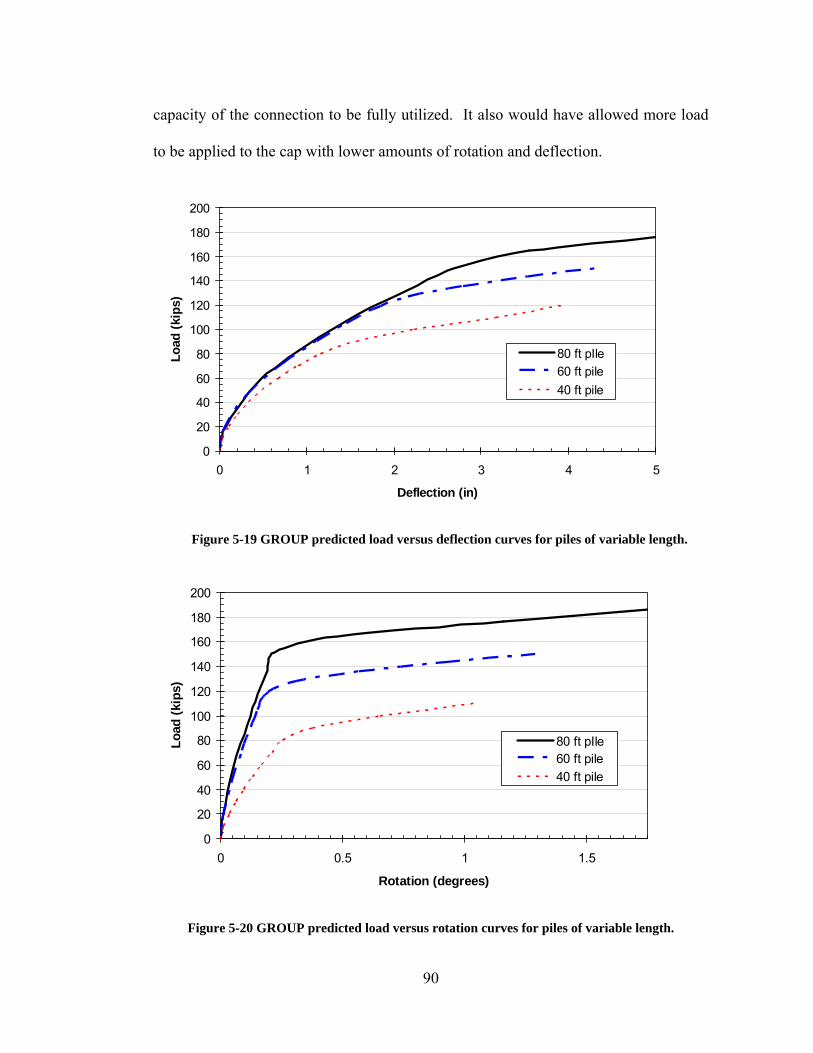
90
capacity of the connection to be fully utilized. It also would have allowed more load
to be applied to the cap with lower amounts of rotation and deflection.
0
20
40
60
80
100
120
140
160
180
200
0 1 2 3 4 5
Deflection (in)
Load
(kip
s)
80 ft pIle60 ft pile40 ft pile
Figure 5-19 GROUP predicted load versus deflection curves for piles of variable length.
0
20
40
60
80
100
120
140
160
180
200
0 0.5 1 1.5
Rotation (degrees)
Load
(kip
s)
80 ft pIle60 ft pile40 ft pile
Figure 5-20 GROUP predicted load versus rotation curves for piles of variable length.
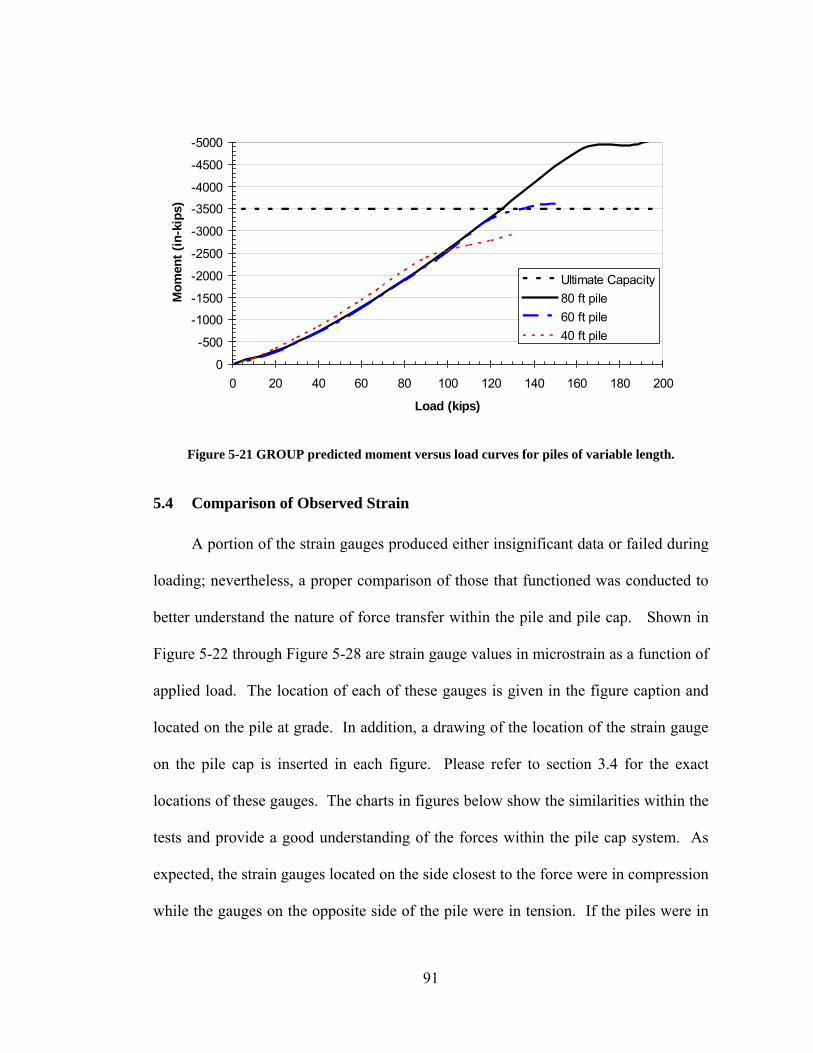
91
-5000
-4500
-4000
-3500
-3000
-2500
-2000
-1500
-1000
-500
00 20 40 60 80 100 120 140 160 180 200
Load (kips)
Mom
ent (
in-k
ips)
Ultimate Capacity80 ft pile60 ft pile40 ft pile
Figure 5-21 GROUP predicted moment versus load curves for piles of variable length.
5.4 Comparison of Observed Strain
A portion of the strain gauges produced either insignificant data or failed during
loading; nevertheless, a proper comparison of those that functioned was conducted to
better understand the nature of force transfer within the pile and pile cap. Shown in
Figure 5-22 through Figure 5-28 are strain gauge values in microstrain as a function of
applied load. The location of each of these gauges is given in the figure caption and
located on the pile at grade. In addition, a drawing of the location of the strain gauge
on the pile cap is inserted in each figure. Please refer to section 3.4 for the exact
locations of these gauges. The charts in figures below show the similarities within the
tests and provide a good understanding of the forces within the pile cap system. As
expected, the strain gauges located on the side closest to the force were in compression
while the gauges on the opposite side of the pile were in tension. If the piles were in
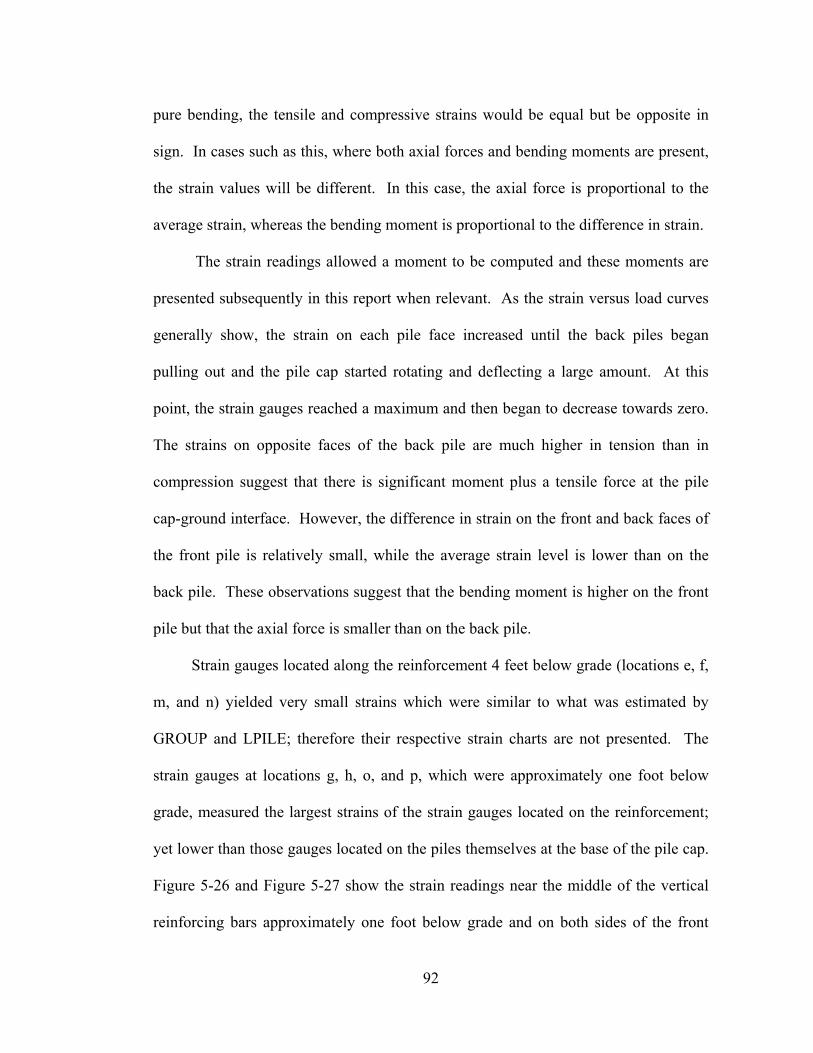
92
pure bending, the tensile and compressive strains would be equal but be opposite in
sign. In cases such as this, where both axial forces and bending moments are present,
the strain values will be different. In this case, the axial force is proportional to the
average strain, whereas the bending moment is proportional to the difference in strain.
The strain readings allowed a moment to be computed and these moments are
presented subsequently in this report when relevant. As the strain versus load curves
generally show, the strain on each pile face increased until the back piles began
pulling out and the pile cap started rotating and deflecting a large amount. At this
point, the strain gauges reached a maximum and then began to decrease towards zero.
The strains on opposite faces of the back pile are much higher in tension than in
compression suggest that there is significant moment plus a tensile force at the pile
cap-ground interface. However, the difference in strain on the front and back faces of
the front pile is relatively small, while the average strain level is lower than on the
back pile. These observations suggest that the bending moment is higher on the front
pile but that the axial force is smaller than on the back pile.
Strain gauges located along the reinforcement 4 feet below grade (locations e, f,
m, and n) yielded very small strains which were similar to what was estimated by
GROUP and LPILE; therefore their respective strain charts are not presented. The
strain gauges at locations g, h, o, and p, which were approximately one foot below
grade, measured the largest strains of the strain gauges located on the reinforcement;
yet lower than those gauges located on the piles themselves at the base of the pile cap.
Figure 5-26 and Figure 5-27 show the strain readings near the middle of the vertical
reinforcing bars approximately one foot below grade and on both sides of the front
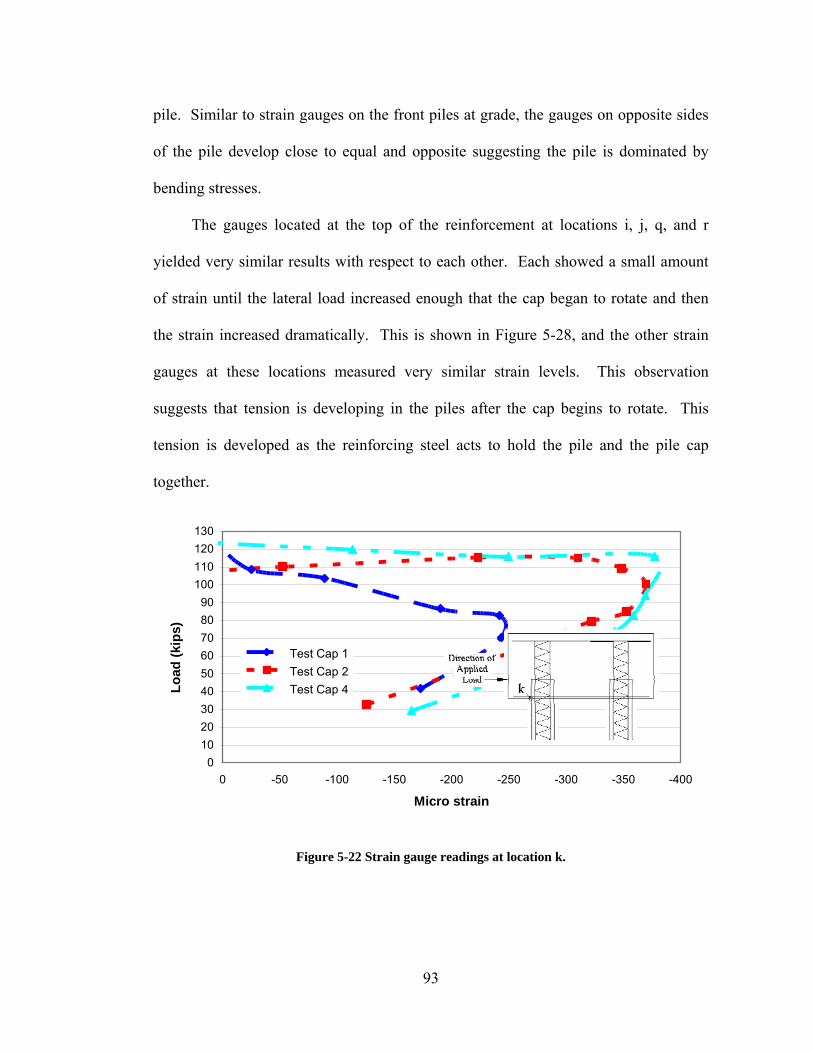
93
pile. Similar to strain gauges on the front piles at grade, the gauges on opposite sides
of the pile develop close to equal and opposite suggesting the pile is dominated by
bending stresses.
The gauges located at the top of the reinforcement at locations i, j, q, and r
yielded very similar results with respect to each other. Each showed a small amount
of strain until the lateral load increased enough that the cap began to rotate and then
the strain increased dramatically. This is shown in Figure 5-28, and the other strain
gauges at these locations measured very similar strain levels. This observation
suggests that tension is developing in the piles after the cap begins to rotate. This
tension is developed as the reinforcing steel acts to hold the pile and the pile cap
together.
0102030405060708090
100110120130
-400-350-300-250-200-150-100-500
Micro strain
Load
(kip
s)
Test Cap 1Test Cap 2Test Cap 4
Figure 5-22 Strain gauge readings at location k.
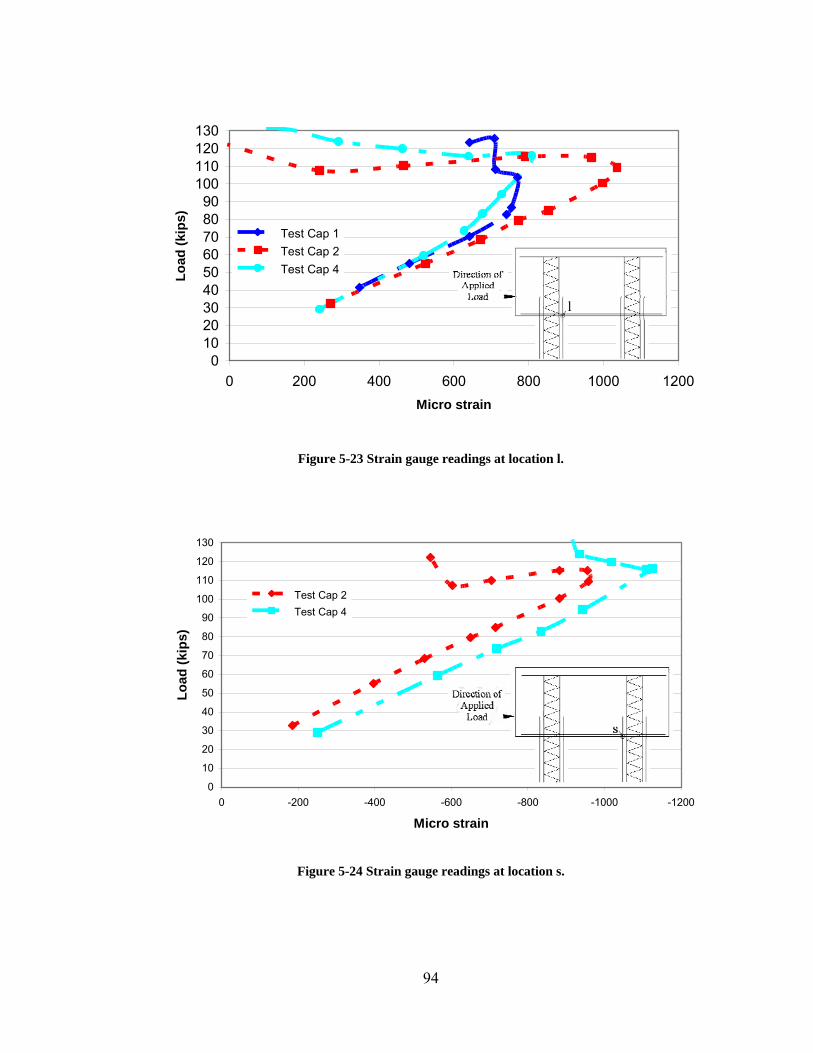
94
0102030405060708090
100110120130
0 200 400 600 800 1000 1200Micro strain
Load
(kip
s)
Test Cap 1Test Cap 2Test Cap 4
Figure 5-23 Strain gauge readings at location l.
0
10
20
30
40
50
60
70
80
90
100
110
120
130
-1200-1000-800-600-400-2000
Micro strain
Load
(kip
s)
Test Cap 2Test Cap 4
Figure 5-24 Strain gauge readings at location s.
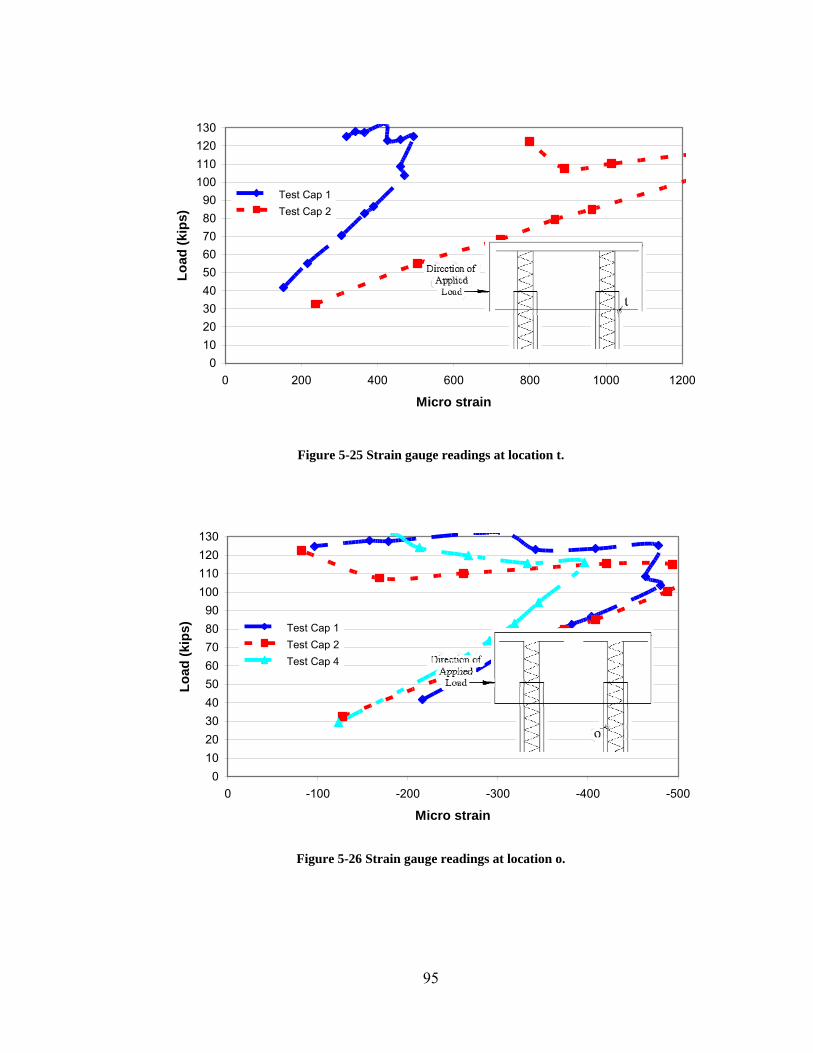
95
0102030405060708090
100110120130
0 200 400 600 800 1000 1200
Micro strain
Load
(kip
s)Test Cap 1Test Cap 2
Figure 5-25 Strain gauge readings at location t.
0102030405060708090
100110120130
-500-400-300-200-1000
Micro strain
Load
(kip
s) Test Cap 1Test Cap 2Test Cap 4
Figure 5-26 Strain gauge readings at location o.
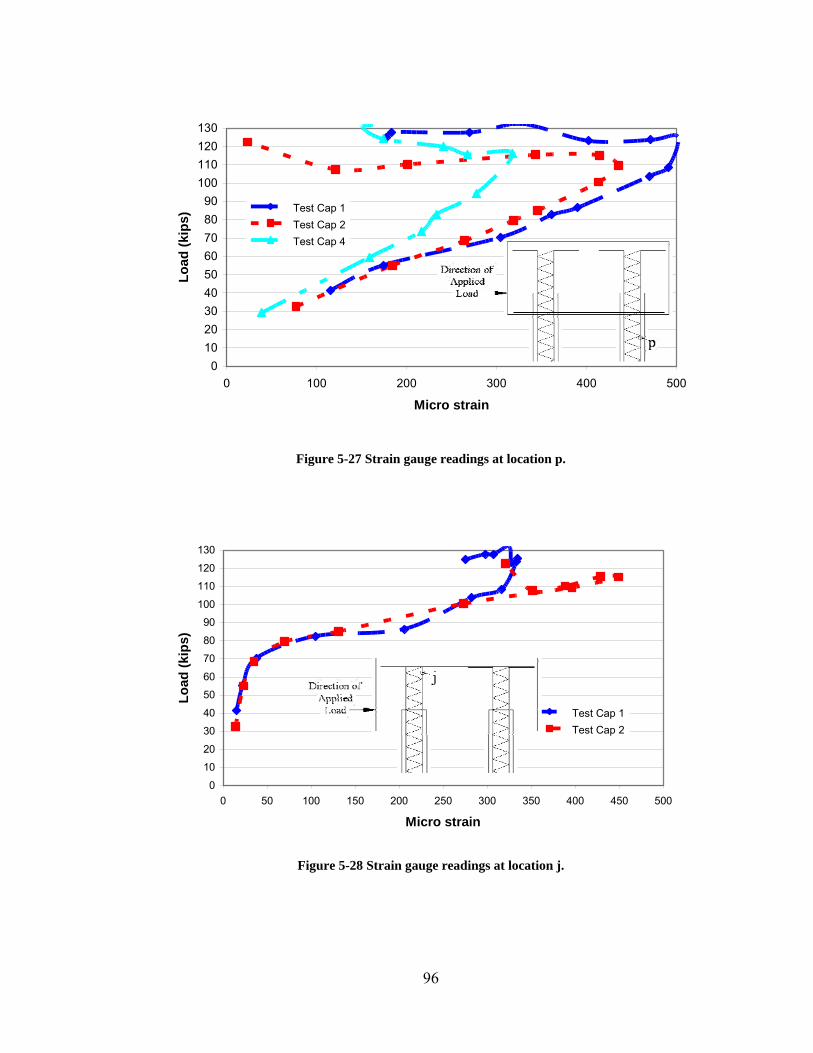
96
0102030405060708090
100110120130
0 100 200 300 400 500
Micro strain
Load
(kip
s)
Test Cap 1Test Cap 2Test Cap 4
Figure 5-27 Strain gauge readings at location p.
0
10
20
30
40
50
60
70
80
90
100
110
120
130
0 50 100 150 200 250 300 350 400 450 500
Micro strain
Load
(kip
s)
Test Cap 1Test Cap 2
Figure 5-28 Strain gauge readings at location j.
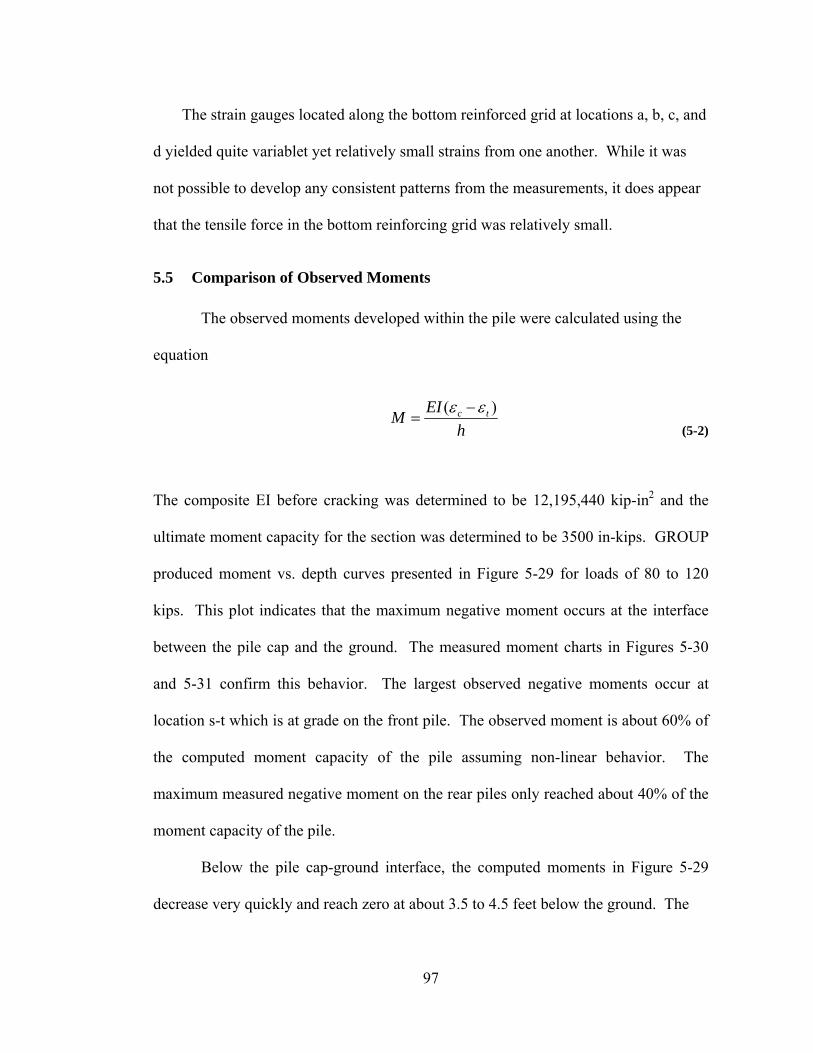
97
hEIM tc )( εε −
=
The strain gauges located along the bottom reinforced grid at locations a, b, c, and
d yielded quite variablet yet relatively small strains from one another. While it was
not possible to develop any consistent patterns from the measurements, it does appear
that the tensile force in the bottom reinforcing grid was relatively small.
5.5 Comparison of Observed Moments
The observed moments developed within the pile were calculated using the
equation
( 5-2)
The composite EI before cracking was determined to be 12,195,440 kip-in2 and the
ultimate moment capacity for the section was determined to be 3500 in-kips. GROUP
produced moment vs. depth curves presented in Figure 5-29 for loads of 80 to 120
kips. This plot indicates that the maximum negative moment occurs at the interface
between the pile cap and the ground. The measured moment charts in Figures 5-30
and 5-31 confirm this behavior. The largest observed negative moments occur at
location s-t which is at grade on the front pile. The observed moment is about 60% of
the computed moment capacity of the pile assuming non-linear behavior. The
maximum measured negative moment on the rear piles only reached about 40% of the
moment capacity of the pile.
Below the pile cap-ground interface, the computed moments in Figure 5-29
decrease very quickly and reach zero at about 3.5 to 4.5 feet below the ground. The
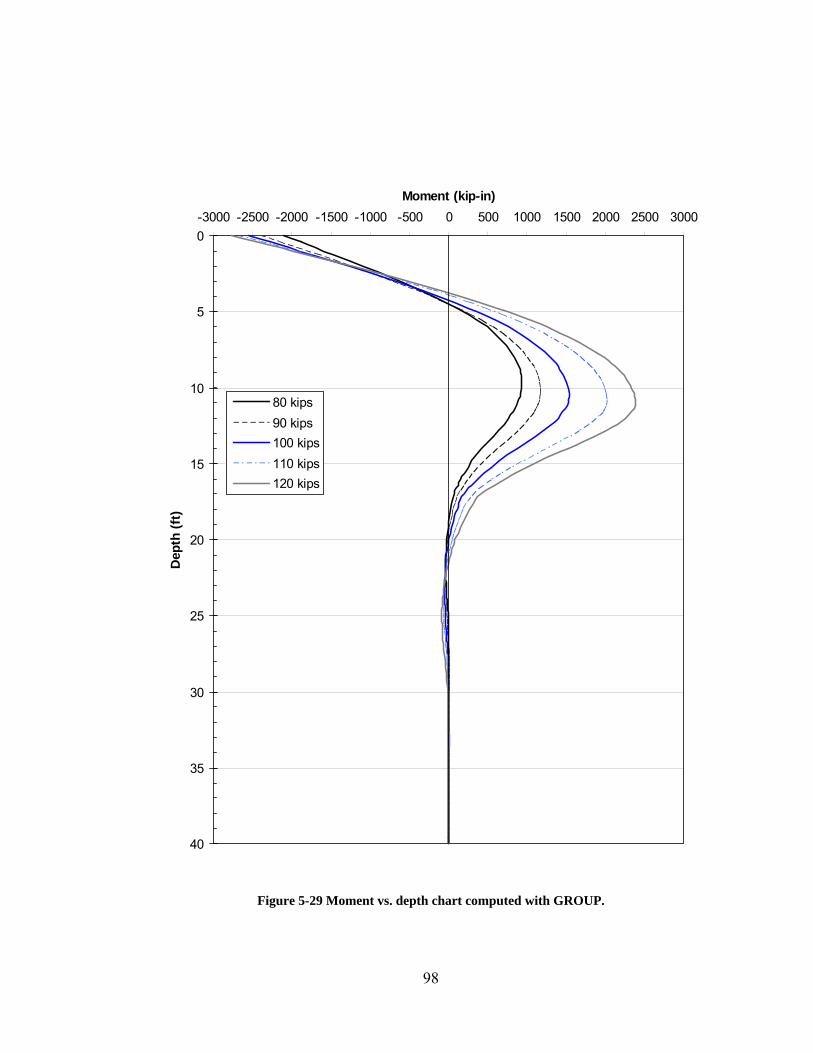
98
0
5
10
15
20
25
30
35
40
-3000 -2500 -2000 -1500 -1000 -500 0 500 1000 1500 2000 2500 3000Moment (kip-in)
Dep
th (f
t)
80 kips90 kips100 kips110 kips120 kips
Figure 5-29 Moment vs. depth chart computed with GROUP.
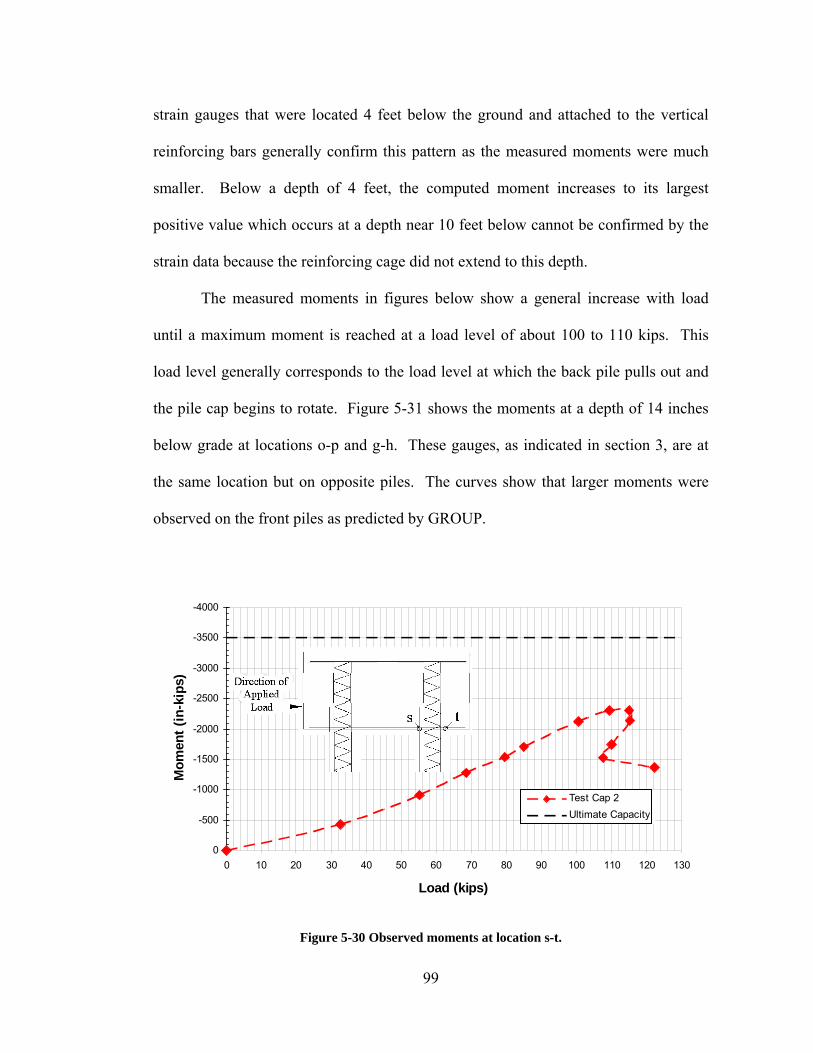
99
strain gauges that were located 4 feet below the ground and attached to the vertical
reinforcing bars generally confirm this pattern as the measured moments were much
smaller. Below a depth of 4 feet, the computed moment increases to its largest
positive value which occurs at a depth near 10 feet below cannot be confirmed by the
strain data because the reinforcing cage did not extend to this depth.
The measured moments in figures below show a general increase with load
until a maximum moment is reached at a load level of about 100 to 110 kips. This
load level generally corresponds to the load level at which the back pile pulls out and
the pile cap begins to rotate. Figure 5-31 shows the moments at a depth of 14 inches
below grade at locations o-p and g-h. These gauges, as indicated in section 3, are at
the same location but on opposite piles. The curves show that larger moments were
observed on the front piles as predicted by GROUP.
-4000
-3500
-3000
-2500
-2000
-1500
-1000
-500
00 10 20 30 40 50 60 70 80 90 100 110 120 130
Load (kips)
Mom
ent (
in-k
ips)
Test Cap 2Ultimate Capacity
Figure 5-30 Observed moments at location s-t.
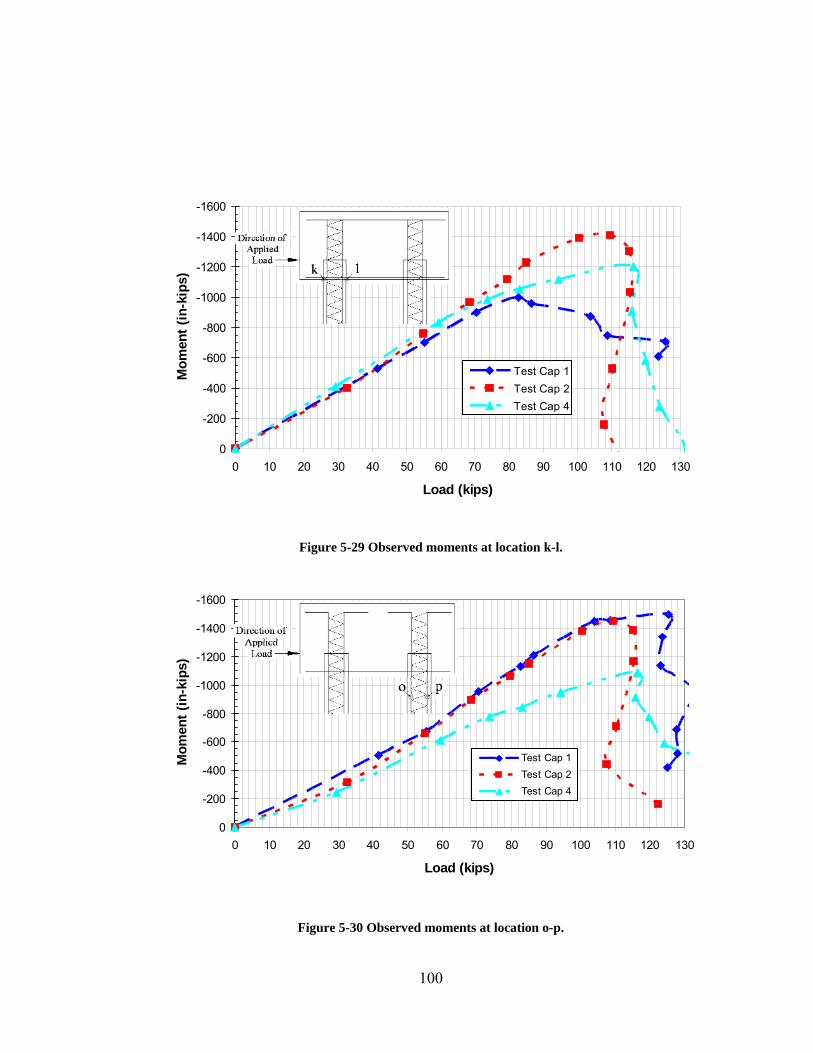
100
-1600
-1400
-1200
-1000
-800
-600
-400
-200
00 10 20 30 40 50 60 70 80 90 100 110 120 130
Load (kips)
Mom
ent (
in-k
ips)
Test Cap 1Test Cap 2Test Cap 4
Figure 5-29 Observed moments at location k-l.
-1600
-1400
-1200
-1000
-800
-600
-400
-200
00 10 20 30 40 50 60 70 80 90 100 110 120 130
Load (kips)
Mom
ent (
in-k
ips)
Test Cap 1Test Cap 2Test Cap 4
Figure 5-30 Observed moments at location o-p.

101
-2000
-1800
-1600
-1400
-1200
-1000
-800
-600
-400
-200
00 20 40 60 80 100 120
Load (kips)
Mom
ent (
in-k
ips)
Test Cap 2 o-p (front pile)Test Cap 2 g-h (back pile)Restrained front @ 14"Restrained back @ 14"
Figure 5-31 Observed and predicted moment vs. load at 14" below grade.
5.6 Comparison of Test Results
Each of the four tests were designed such that a proper comparison would be
beneficial for future design. In current design with steel pipe piles it is typical to both
embed the piles a sufficient depth into the pile cap as well as to provide a reinforcing
cage extending from the top of the pile cap and into the piles. Figure 5-32 and Figure
5-33 plot load-deflection and load-rotation curves, respectively for all four lateral pile
cap load tests to facilitate comparisons.
Comparing the performance of Pile Cap 1 with Pile Cap 2 shows that the
additional pile embedment length may not be necessary for applied lateral loads. The
reinforcement did an adequate job in connecting the piles to the cap even when the
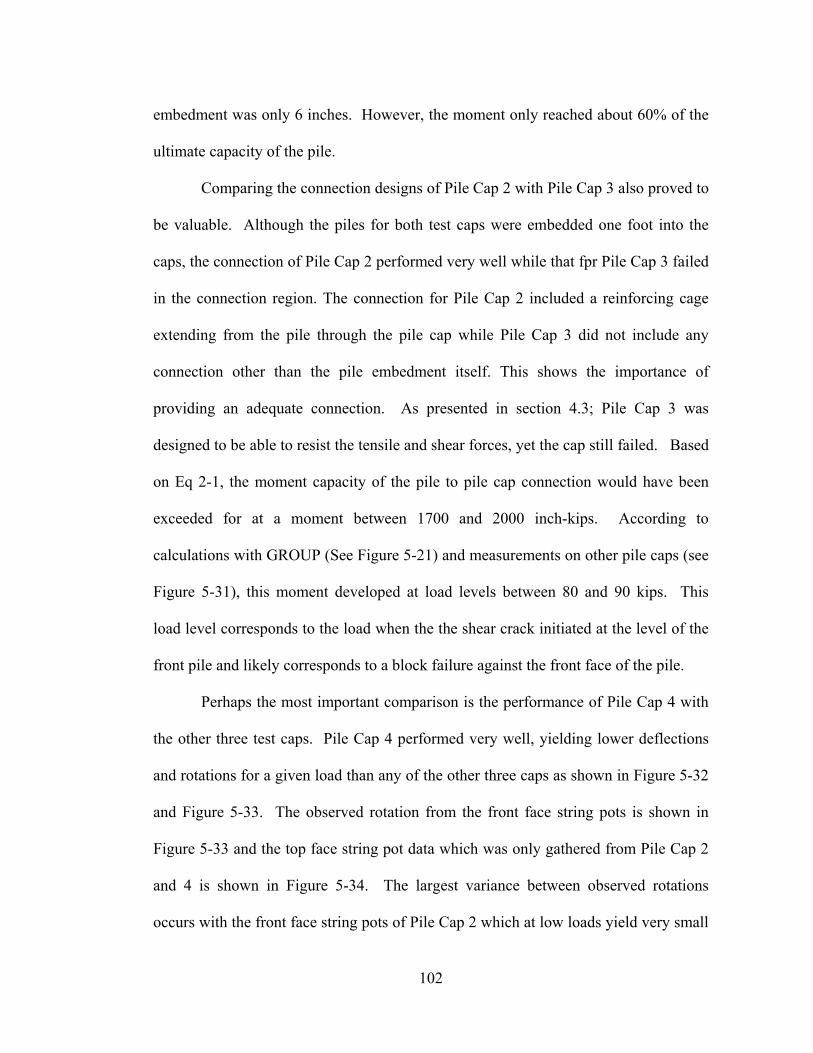
102
embedment was only 6 inches. However, the moment only reached about 60% of the
ultimate capacity of the pile.
Comparing the connection designs of Pile Cap 2 with Pile Cap 3 also proved to
be valuable. Although the piles for both test caps were embedded one foot into the
caps, the connection of Pile Cap 2 performed very well while that fpr Pile Cap 3 failed
in the connection region. The connection for Pile Cap 2 included a reinforcing cage
extending from the pile through the pile cap while Pile Cap 3 did not include any
connection other than the pile embedment itself. This shows the importance of
providing an adequate connection. As presented in section 4.3; Pile Cap 3 was
designed to be able to resist the tensile and shear forces, yet the cap still failed. Based
on Eq 2-1, the moment capacity of the pile to pile cap connection would have been
exceeded for at a moment between 1700 and 2000 inch-kips. According to
calculations with GROUP (See Figure 5-21) and measurements on other pile caps (see
Figure 5-31), this moment developed at load levels between 80 and 90 kips. This
load level corresponds to the load when the the shear crack initiated at the level of the
front pile and likely corresponds to a block failure against the front face of the pile.
Perhaps the most important comparison is the performance of Pile Cap 4 with
the other three test caps. Pile Cap 4 performed very well, yielding lower deflections
and rotations for a given load than any of the other three caps as shown in Figure 5-32
and Figure 5-33. The observed rotation from the front face string pots is shown in
Figure 5-33 and the top face string pot data which was only gathered from Pile Cap 2
and 4 is shown in Figure 5-34. The largest variance between observed rotations
occurs with the front face string pots of Pile Cap 2 which at low loads yield very small
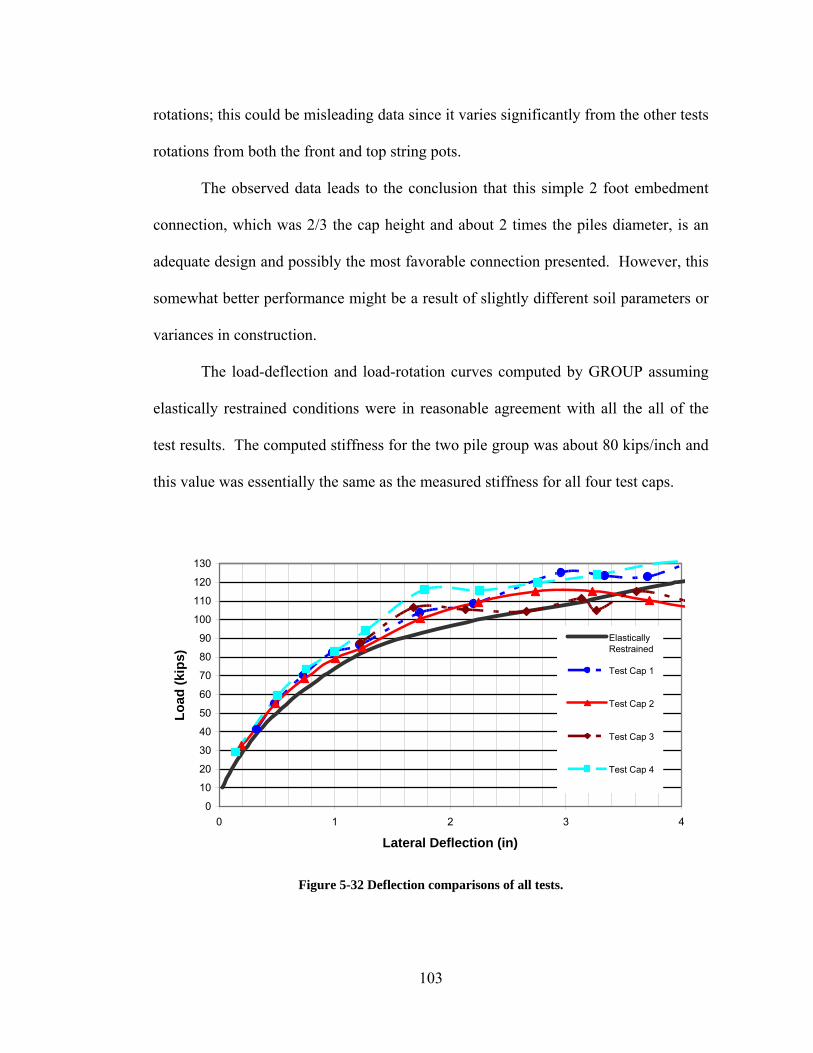
103
rotations; this could be misleading data since it varies significantly from the other tests
rotations from both the front and top string pots.
The observed data leads to the conclusion that this simple 2 foot embedment
connection, which was 2/3 the cap height and about 2 times the piles diameter, is an
adequate design and possibly the most favorable connection presented. However, this
somewhat better performance might be a result of slightly different soil parameters or
variances in construction.
The load-deflection and load-rotation curves computed by GROUP assuming
elastically restrained conditions were in reasonable agreement with all the all of the
test results. The computed stiffness for the two pile group was about 80 kips/inch and
this value was essentially the same as the measured stiffness for all four test caps.
0
10
20
30
40
50
60
70
80
90
100
110
120
130
0 1 2 3 4
Lateral Deflection (in)
Load
(kip
s)
ElasticallyRestrained
Test Cap 1
Test Cap 2
Test Cap 3
Test Cap 4
Figure 5-32 Deflection comparisons of all tests.
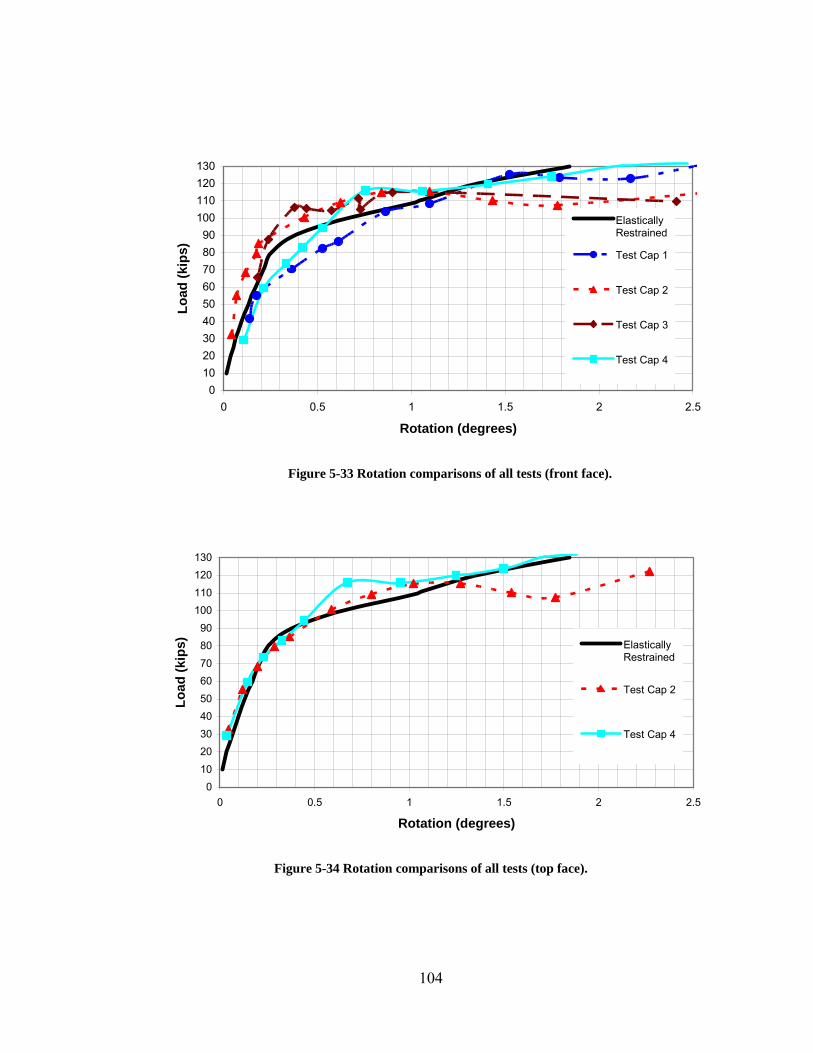
104
0102030405060708090
100110120130
0 0.5 1 1.5 2 2.5
Rotation (degrees)
Load
(kip
s)
ElasticallyRestrained
Test Cap 1
Test Cap 2
Test Cap 3
Test Cap 4
Figure 5-33 Rotation comparisons of all tests (front face).
0102030405060708090
100110120130
0 0.5 1 1.5 2 2.5
Rotation (degrees)
Load
(kip
s) ElasticallyRestrained
Test Cap 2
Test Cap 4
Figure 5-34 Rotation comparisons of all tests (top face).
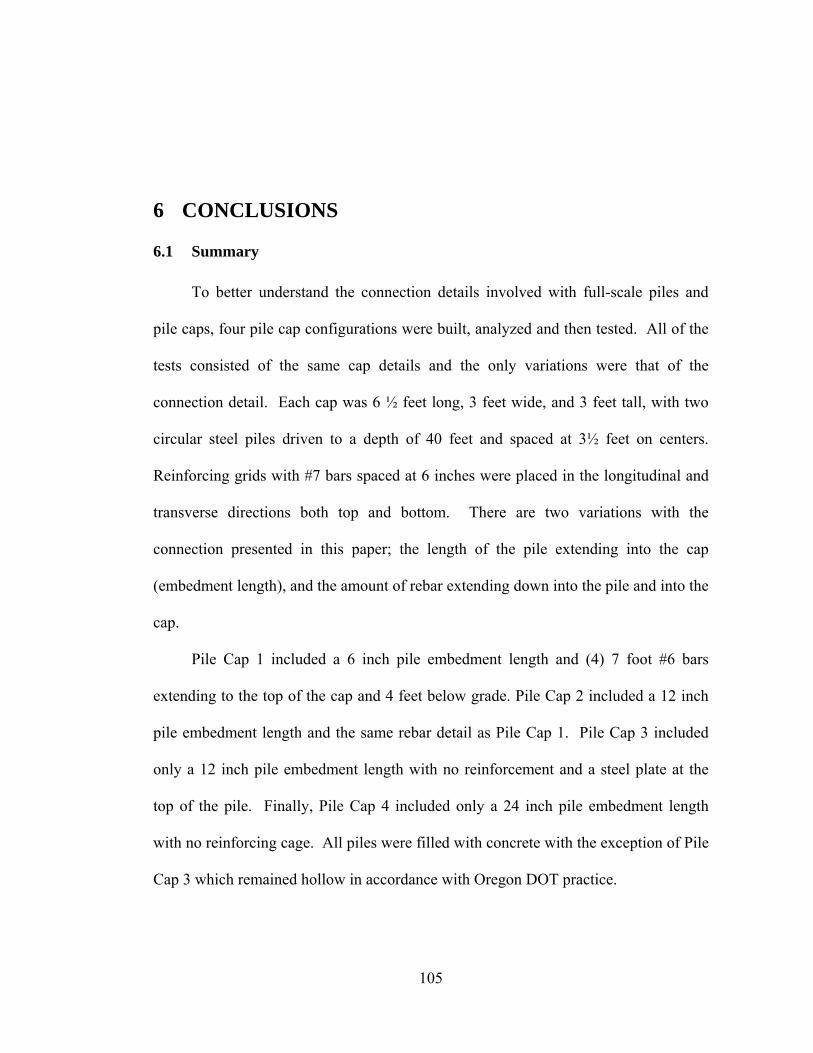
105
6 CONCLUSIONS
6.1 Summary
To better understand the connection details involved with full-scale piles and
pile caps, four pile cap configurations were built, analyzed and then tested. All of the
tests consisted of the same cap details and the only variations were that of the
connection detail. Each cap was 6 ½ feet long, 3 feet wide, and 3 feet tall, with two
circular steel piles driven to a depth of 40 feet and spaced at 3½ feet on centers.
Reinforcing grids with #7 bars spaced at 6 inches were placed in the longitudinal and
transverse directions both top and bottom. There are two variations with the
connection presented in this paper; the length of the pile extending into the cap
(embedment length), and the amount of rebar extending down into the pile and into the
cap.
Pile Cap 1 included a 6 inch pile embedment length and (4) 7 foot #6 bars
extending to the top of the cap and 4 feet below grade. Pile Cap 2 included a 12 inch
pile embedment length and the same rebar detail as Pile Cap 1. Pile Cap 3 included
only a 12 inch pile embedment length with no reinforcement and a steel plate at the
top of the pile. Finally, Pile Cap 4 included only a 24 inch pile embedment length
with no reinforcing cage. All piles were filled with concrete with the exception of Pile
Cap 3 which remained hollow in accordance with Oregon DOT practice.
106
String potentiometers, strain gauges and a load cell were attached to each pile
cap during testing to measure deflection, rotation, strain, and applied force. This data
has been collected and, when relevant, presented as graphs in this report. The pile
caps were analyzed by hand calculations and two computer modeling programs;
GROUP and LPILE. The results from these programs are presented and compared
with measured response. In general, GROUP yielded estimations very similar to the
observed data and therefore most of the data presented in this paper has been
compared to those estimations.
Testing produced some surprising results. Although design equations based on
embedment length predicted connection failure for Pile Caps 1, 2, and 3, only Pile Cap
3 experienced failure at the connection. Because Pile Caps 1 and 2 also contained a
reinforcing cage, attention has focused on the additional moment capacity provided by
this connection detail. Although the applied lateral force was sufficient to load the
connections for Pile Caps 1 and 2 beyond the anticipated failure moment, pile pullout
prevented a determination of the ultimate moment capacity of the connection. Failure
of the connection for Pile Cap 3 led to the development of a crack which eventually
propogated across the entire length of the pile cap. Pile Cap 4, with a 24 inch
embedment, did not experience connection failure and provided a load-deflection
curve that was slightly better than the other pile caps which were tested.
6.2 Conclusions
Based on the results of the testing and analysis conducted during this
investigation, the following conclusions can be drawn:
107
1. A pile embedded a sufficient depth into the cap can produce a connection with
an equivalent capacity to those with a reinforced detail. Pile Cap 4 which
relied solely upon its embedment length of 24 inches provided an adequate
connection and performed as well or better than comparable caps which relied
on a reinforced connection. This is consistent with predictions based on Eq. 2-
1 which predicts that the moment capacity of this connection would exceed
that of the pile.
2. Piles with inadequate embedment and no reinforcing dowels can result in an
early seismic failure at the connection. Pile Cap 3 lacked both an adequate
embedment length and reinforcement resulting in early failure due to large
shear and tensile cracks as predicted by Eq. 2-1.
3. Despite shallow embedment, a connection detail which includes a steel
reinforcing cage (typical of the UDOT standard design) can still develop
moments equal to 40 to 60% of the moment capacity of the pile. This finding
is consistent with test results on prestressed piles and H piles reported by Xiao
(2003) and Xiao (2006). Pile Caps 1 and 2 both included a reinforced
connection detail and performed successfully despite the fact that Pile Cap 1
had only six inches of embedment and Pile Cap 2 had only a twelve inch
embedment.
4. Equations which only account for embedment effects in assessing the shear
and moment capacity of a pile to pile cap connection (e.g. Eq. 2-1 or PCI
Handbook method), can significantly underestimate the capacity of the
108
connection. According to these equations (Eqs 2-1, 2-2, and 4-8), both Pile
Caps 1 and 2 should have experienced connection failures but did not.
5. Programs such as GROUP and LPILE are quite accurate when predicting
deflections and rotations of pile caps. As shown in the graphs presented in this
report the observed behavior was nearly identical to that predicted by GROUP
although accuracy decreased at higher deflection levels.
6.3 Recommendation for Future Research
Based on the experience from conducting these tests and a thorough literature
review, we recommend that additional pile to pile cap testing be carried out in a
laboratory setting. These tests should be aimed at evaluating the moment capacity of
pipe piles with variable depths of embedment and with connections involving
reinforcing cages as well as for piles without reinforcing cages. These tests in
combination with previous test results should make it possible to develop equations to
account for moment capacity provided by both embedment and flexure mechanisms.
While the field testing provided improved understanding of the role of soil-pile
interaction on the equations used to predict connection capacity, laboratory testing
would make it possible to better see the structural failure mechanisms and potential
spalling of the concrete cover.
6.4 Implementation of Results
Based on the available test results, we recommend that connection details for 12
inch diameter steel pipe piles involve a minimum of either (a) 2 ft of embedment
without additional steel dowels at the connection, or (b) at least 1 ft of embedment

109
with at least 4 #6 bars extending at least one development length into the concrete
filled pile and into the pile cap. For other pile diameters, conservative estimates of the
moment capacity of the connection can be obtained using the Marcakis and Mitchell
(1980) which has been adopted in the current PCI Handbook.
110
7 REFERENCES
Army Corps of Engineers (1984), Castilla, F, Martin, P. and Link, J. “Fixity of Members Embedded in Concrete.” Technical Report M-339, February 1984.
Beatty, C.I. (1970). “Lateral test on pile groups.” Foundation Facts, VI(1), 18-21.
Bruneau, M. and Marson, J. (2004). “Seismic Design of Concrete-Filled Circular Steel Bridge Piers.” Journal of Bridge Engineering, Vol. 9, No. 1, January 1, 2004.
Group (1996). “A program for the analysis of a group of piles subjected to axial and lateral loading.” Version 4.0, by Lymon Reese, Shin Tower Wang, Jose A. Arrellaga, and Joe Hendrix. ENSOFT, Inc., Austin, Texas.
Harris, K.A. Ph.D., and Petrou, M. F. Ph.D. (2001). “Behavior of Precast, Prestressed Concrete Pile to Cast-in-Place Pile Cap Connections.” PCI JOURNAL, V. 46, No. 4, July-August 2001, pp.82-92.
Joen, P.H. and Park, R. (1990). “Simulated seismic load tests on prestressed concrete piles and pile-pile cap connections.” PCI Journal, Vol. 35 No. 6, p. 892-900.
Kim, J.B., and Singh, L.P. (1974). “Effect of pile cap – soil interaction on lateral capacity of pile groups,” Master of Science, Bucknell University, Lewisburg, PA.
LPILE (1997). “A program for the analysis of piles and drilled shafts under lateral loads.” By Lymon Reese, Shin Tower Wang, JoseA. Arrellaga, and Joe Hendrix, ENSOFT, Inc., Houston, Texas.
MacGregor, J. G., Wight, J. K., (2005). Reinforced Concrete Mechanics and Design. Fourth Edition, Pearson Education Inc., Upper Saddle River, New Jersey.
Marcakis, K., and Mitchell, D. (1980). “Precast Concrete Connections with Embedded Steel Members,” PCI JORNAL, V.25, No. 4, July-August 1980, pp.88-116.
111
Mattock, A. H., and Gaafar, G. H., (1982). “Strength of Embedded Steel Sections as Brackets,” ACI Journal, V. 79, No. 2, March-April 1982, pp 83-93
Mokwa, R. L., (1999). “Investigation of the Resistance of Pile Caps to Lateral Loading.” Dissertation etd-093099-180817, Department of Civil Engineering Virginia Tech.
Mokwa, R. L., and Duncan, J.M. (2003). “Rotational Restraint of Pile Caps during Lateral Loading.” Journal of Geotechnical and Geoenvironmental Engineering, Vol. 129, No.9, September 1, 2003.
Ooi, P. S.K., Chang, B. K.F., and Wang, S. A. (2004). “Simplified Lateral Load Analyses of Fixed Head Piles and Pile Groups.” Journal of Geotechnical and Geoenvironmental Engineering, Vol. 130, No. 11, November 1, 2004.
Rollins, M., K, Weaver, T.J., and Peterson, K.T. (1997). “Statnamic lateral load testing of a full-scale fixed-head pile group.” Report, UDOT, FHWA.
Shama, A.A. and Mander, J.B. (2004 “Behavior of Timber Pile-to-Cap Connectiosn under Cyclic Lateral Loading.” J. of Strutural Engienering, ASCE, Vol. 130, No. 8, p. 1252-1262.
Shama, A.A., Mander, J.B. and Blabac, B.A. (2002a). “Seismic Investigation of Steel Pile Bents: I. Evaluation of Performance.” Earthquake Spectra, EERI, Vol. 18, No. 1, p. 121-142
Shama, A.A., Mander, J.B. and Chen, S.S. (2002b). “Seismic Investigation of Steel Pile Bents: II. Retrofit and Vulnerabilty Analysis.” Earthquake Spectra, EERI, Vol. 18, No. 1, p. 143-160.
Stephens, J. and McKittrick, L. (2005) “Performance of Steel Pipe Pile-to-Concrete Bent Cap Connections Subject to Seismic or High Transverse Loading: Phase II.” Report No. FHWA/MT-05-001/8144.
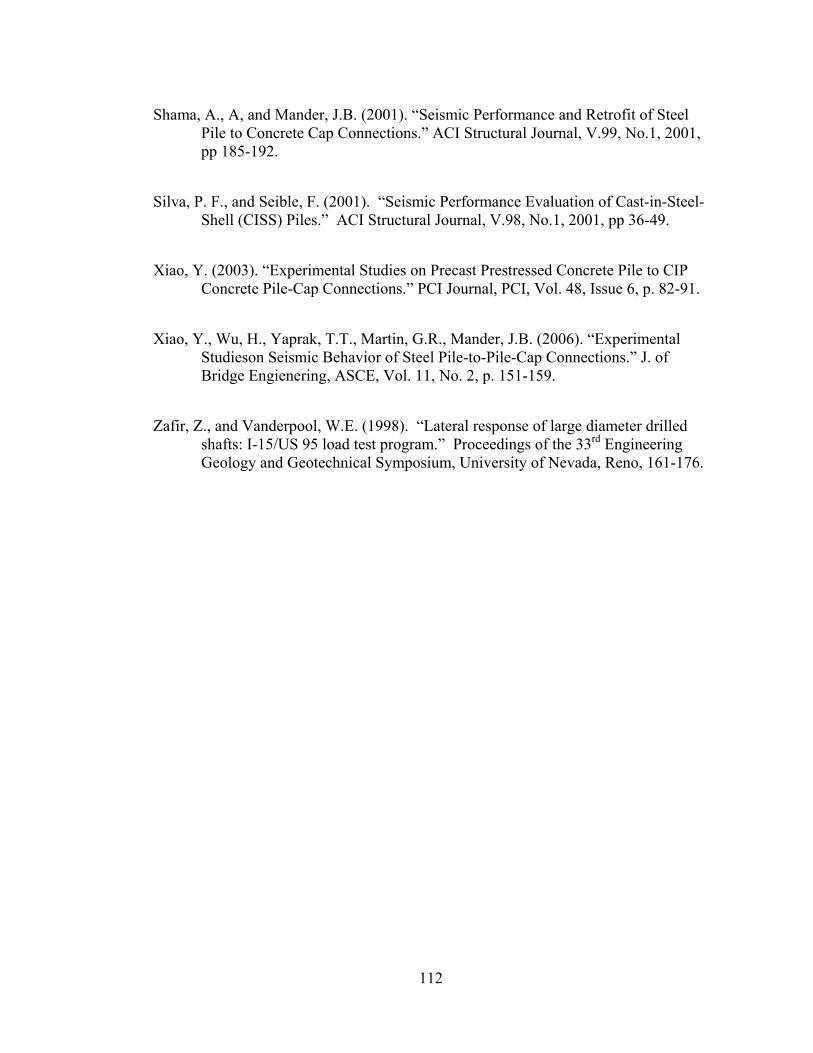
112
Shama, A., A, and Mander, J.B. (2001). “Seismic Performance and Retrofit of Steel Pile to Concrete Cap Connections.” ACI Structural Journal, V.99, No.1, 2001, pp 185-192.
Silva, P. F., and Seible, F. (2001). “Seismic Performance Evaluation of Cast-in-Steel-Shell (CISS) Piles.” ACI Structural Journal, V.98, No.1, 2001, pp 36-49.
Xiao, Y. (2003). “Experimental Studies on Precast Prestressed Concrete Pile to CIP Concrete Pile-Cap Connections.” PCI Journal, PCI, Vol. 48, Issue 6, p. 82-91.
Xiao, Y., Wu, H., Yaprak, T.T., Martin, G.R., Mander, J.B. (2006). “Experimental Studieson Seismic Behavior of Steel Pile-to-Pile-Cap Connections.” J. of Bridge Engienering, ASCE, Vol. 11, No. 2, p. 151-159.
Zafir, Z., and Vanderpool, W.E. (1998). “Lateral response of large diameter drilled shafts: I-15/US 95 load test program.” Proceedings of the 33rd Engineering Geology and Geotechnical Symposium, University of Nevada, Reno, 161-176.
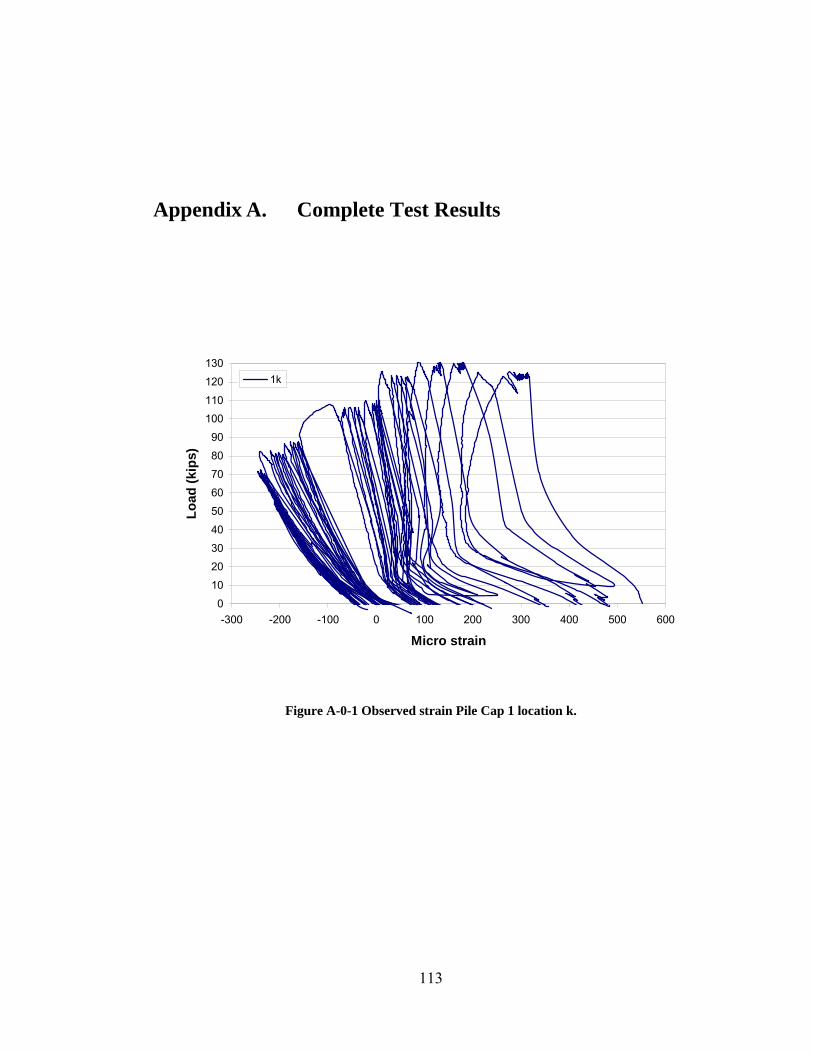
113
Appendix A. Complete Test Results
0
10
20
30
40
50
60
70
80
90
100
110
120
130
-300 -200 -100 0 100 200 300 400 500 600
Micro strain
Load
(kip
s)
1k
Figure A- 0-1 Observed strain Pile Cap 1 location k.
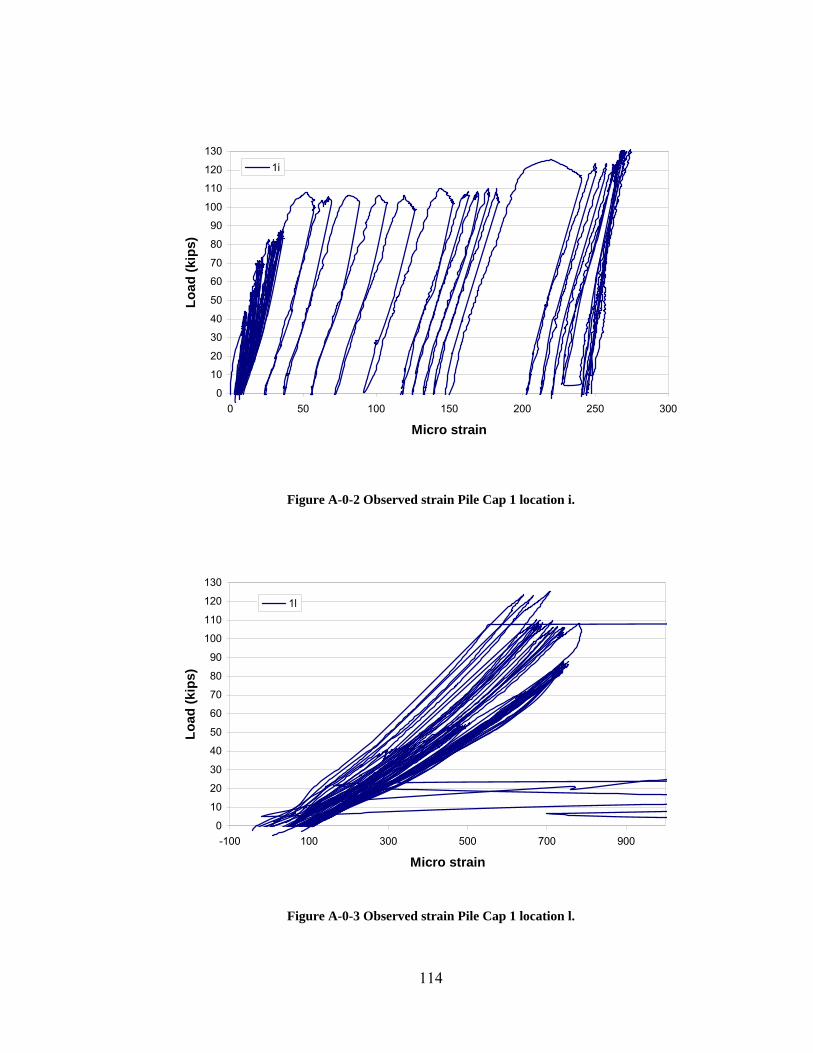
114
0
10
20
30
40
50
60
70
80
90
100
110
120
130
0 50 100 150 200 250 300
Micro strain
Load
(kip
s)
1i
Figure A- 0-2 Observed strain Pile Cap 1 location i.
0
10
20
30
40
50
60
70
80
90
100
110
120
130
-100 100 300 500 700 900
Micro strain
Load
(kip
s)
1l
Figure A- 0-3 Observed strain Pile Cap 1 location l.
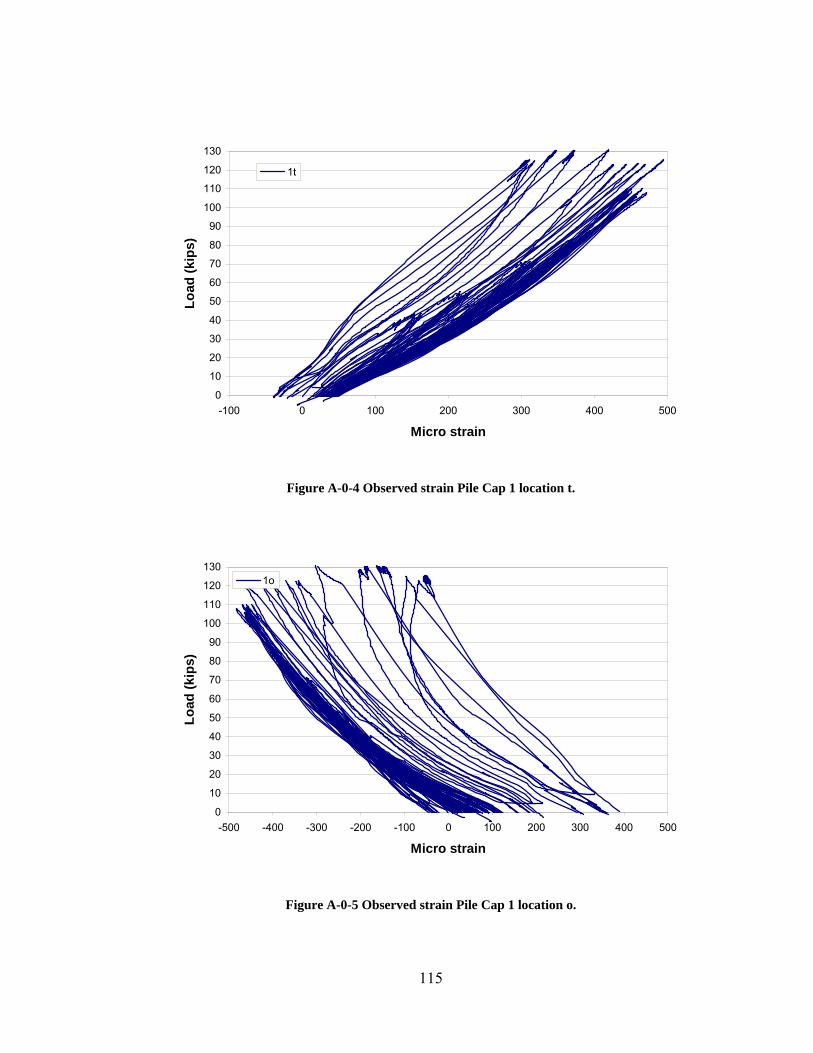
115
0
10
20
30
40
50
60
70
80
90
100
110
120
130
-100 0 100 200 300 400 500
Micro strain
Load
(kip
s)1t
Figure A- 0-4 Observed strain Pile Cap 1 location t.
0
10
20
30
40
50
60
70
80
90
100
110
120
130
-500 -400 -300 -200 -100 0 100 200 300 400 500
Micro strain
Load
(kip
s)
1o
Figure A- 0-5 Observed strain Pile Cap 1 location o.
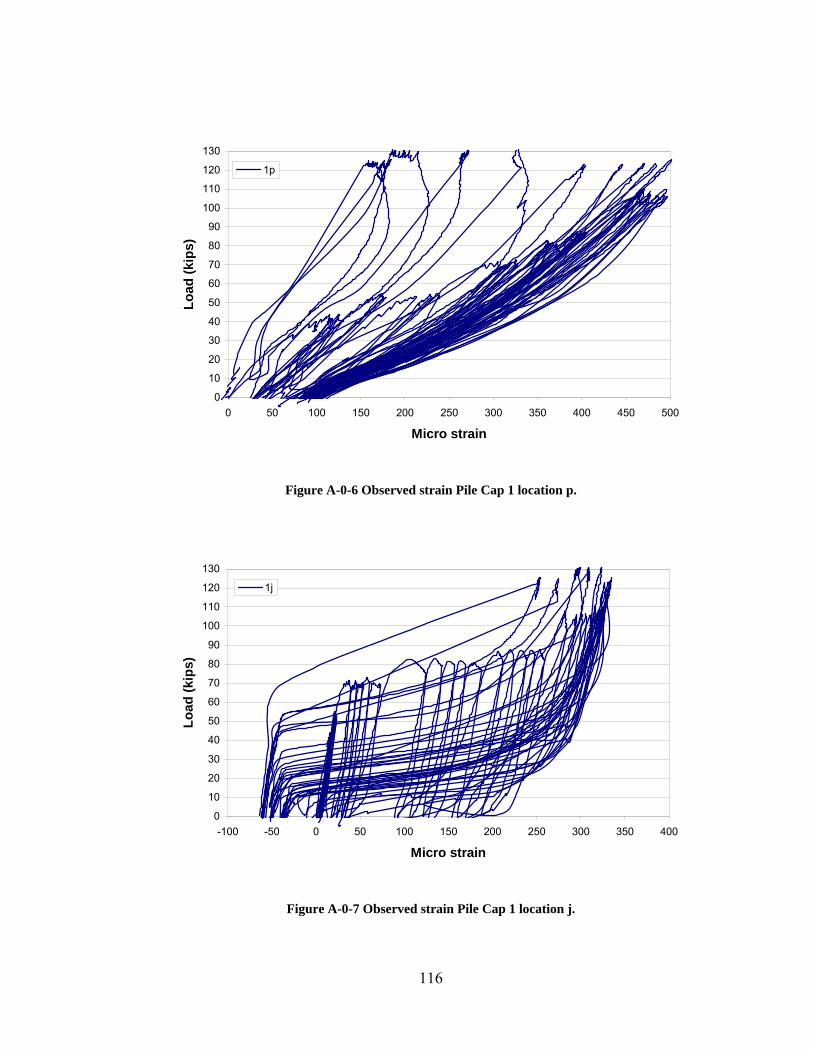
116
0
10
20
30
40
50
60
70
80
90
100
110
120
130
0 50 100 150 200 250 300 350 400 450 500
Micro strain
Load
(kip
s)1p
Figure A- 0-6 Observed strain Pile Cap 1 location p.
0
10
20
30
40
50
60
70
80
90
100
110
120
130
-100 -50 0 50 100 150 200 250 300 350 400
Micro strain
Load
(kip
s)
1j
Figure A- 0-7 Observed strain Pile Cap 1 location j.
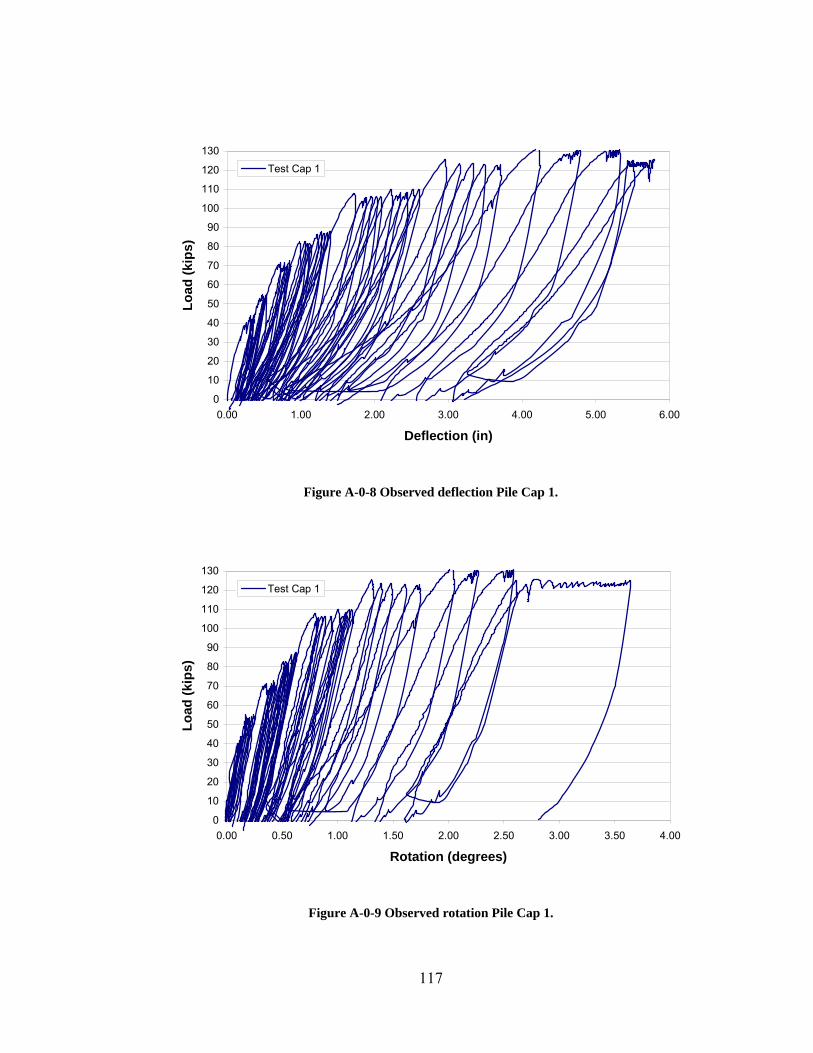
117
0
10
20
30
40
50
60
70
80
90
100
110
120
130
0.00 1.00 2.00 3.00 4.00 5.00 6.00
Deflection (in)
Load
(kip
s)Test Cap 1
Figure A- 0-8 Observed deflection Pile Cap 1.
0
10
20
30
40
50
60
70
80
90
100
110
120
130
0.00 0.50 1.00 1.50 2.00 2.50 3.00 3.50 4.00
Rotation (degrees)
Load
(kip
s)
Test Cap 1
Figure A- 0-9 Observed rotation Pile Cap 1.
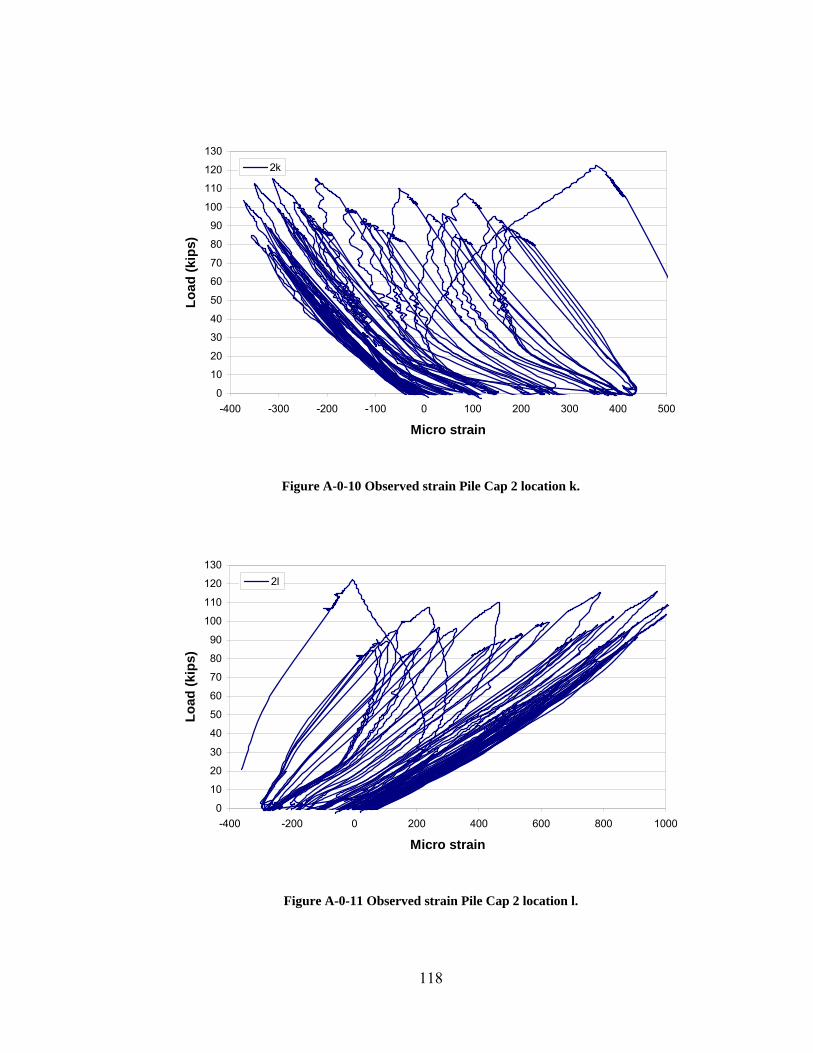
118
0
10
20
30
40
50
60
70
80
90
100
110
120
130
-400 -300 -200 -100 0 100 200 300 400 500
Micro strain
Load
(kip
s)
2k
Figure A- 0-10 Observed strain Pile Cap 2 location k.
0
10
20
30
40
50
60
70
80
90
100
110
120
130
-400 -200 0 200 400 600 800 1000
Micro strain
Load
(kip
s)
2l
Figure A- 0-11 Observed strain Pile Cap 2 location l.
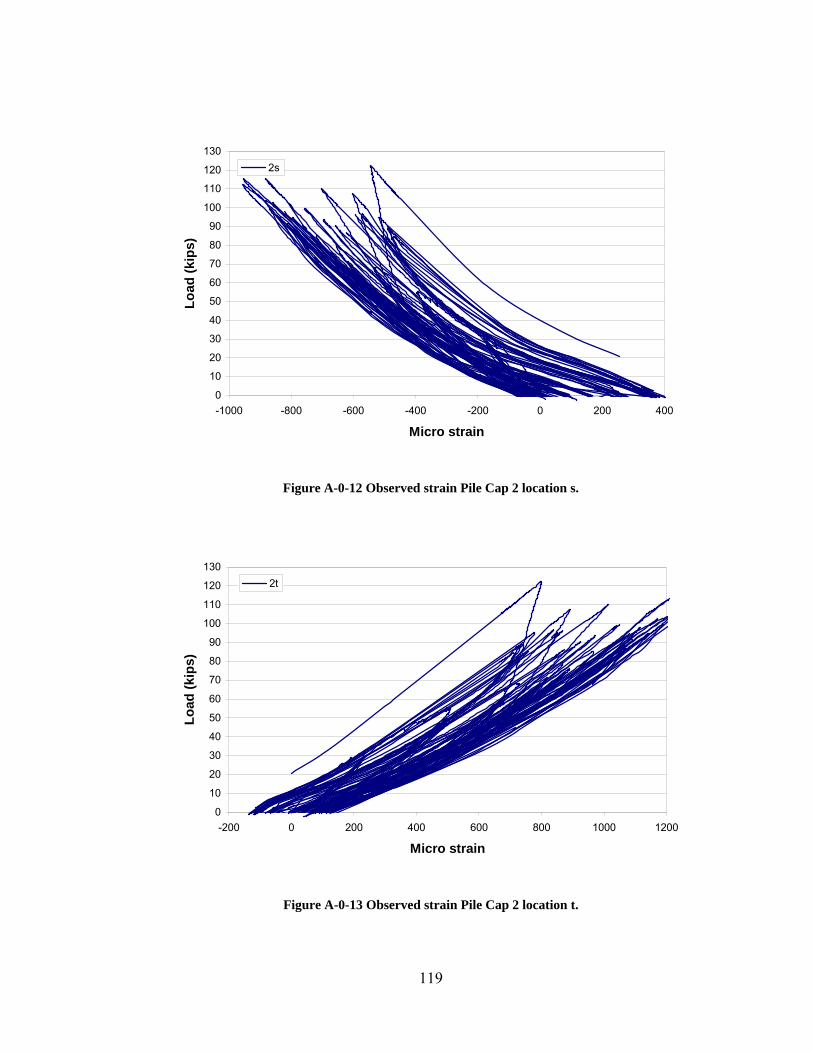
119
0
10
20
30
40
50
60
70
80
90
100
110
120
130
-1000 -800 -600 -400 -200 0 200 400
Micro strain
Load
(kip
s)2s
Figure A- 0-12 Observed strain Pile Cap 2 location s.
0
10
20
30
40
50
60
70
80
90
100
110
120
130
-200 0 200 400 600 800 1000 1200
Micro strain
Load
(kip
s)
2t
Figure A- 0-13 Observed strain Pile Cap 2 location t.
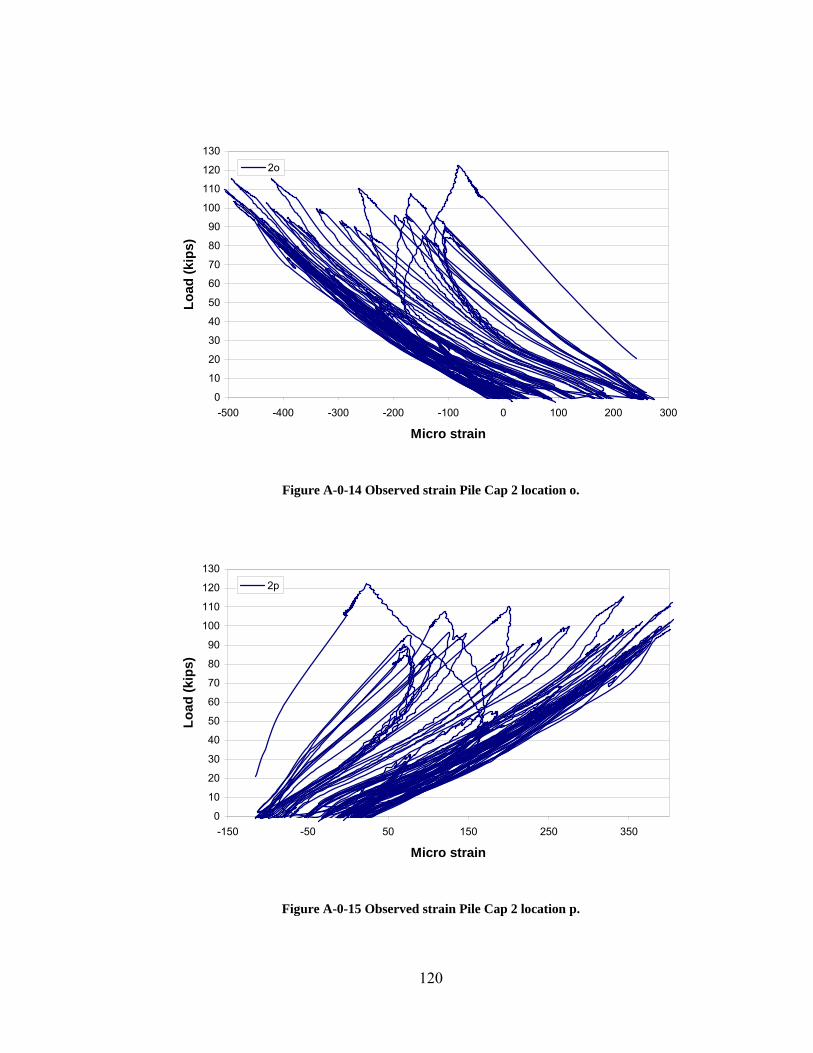
120
0
10
20
30
40
50
60
70
80
90
100
110
120
130
-500 -400 -300 -200 -100 0 100 200 300
Micro strain
Load
(kip
s)2o
Figure A- 0-14 Observed strain Pile Cap 2 location o.
0
10
20
30
40
50
60
70
80
90
100
110
120
130
-150 -50 50 150 250 350
Micro strain
Load
(kip
s)
2p
Figure A- 0-15 Observed strain Pile Cap 2 location p.
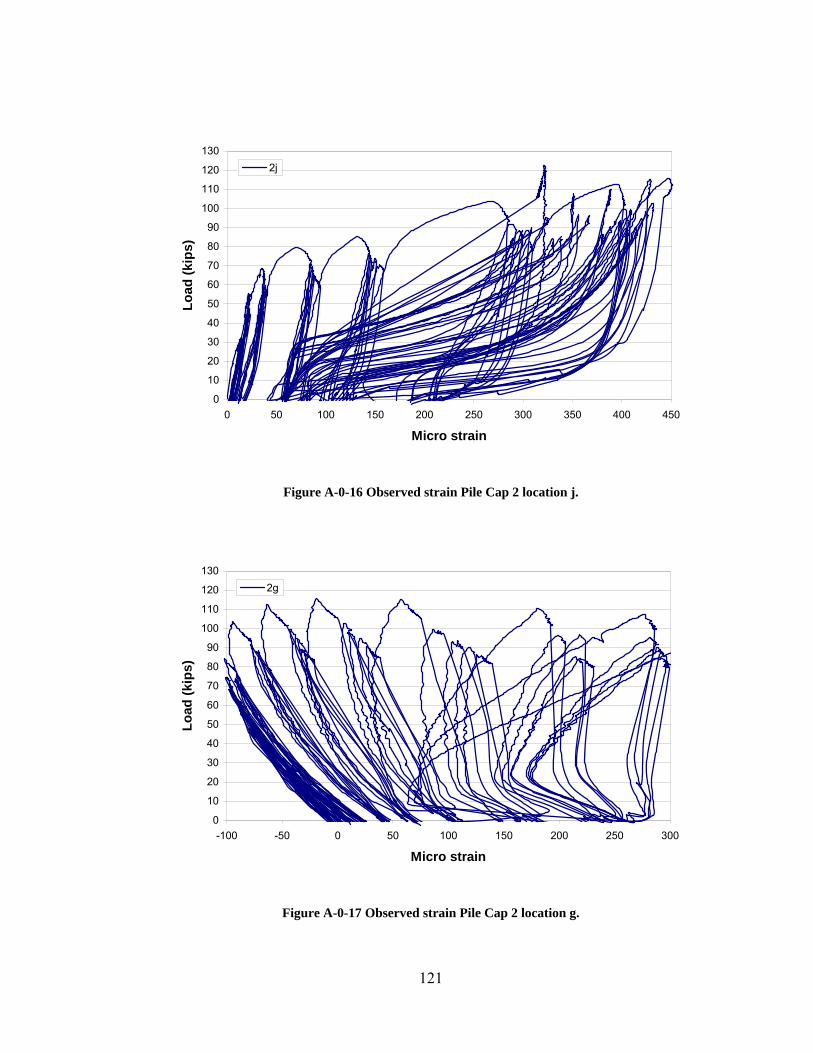
121
0
10
20
30
40
50
60
70
80
90
100
110
120
130
0 50 100 150 200 250 300 350 400 450
Micro strain
Load
(kip
s)2j
Figure A- 0-16 Observed strain Pile Cap 2 location j.
0
10
20
30
40
50
60
70
80
90
100
110
120
130
-100 -50 0 50 100 150 200 250 300
Micro strain
Load
(kip
s)
2g
Figure A- 0-17 Observed strain Pile Cap 2 location g.
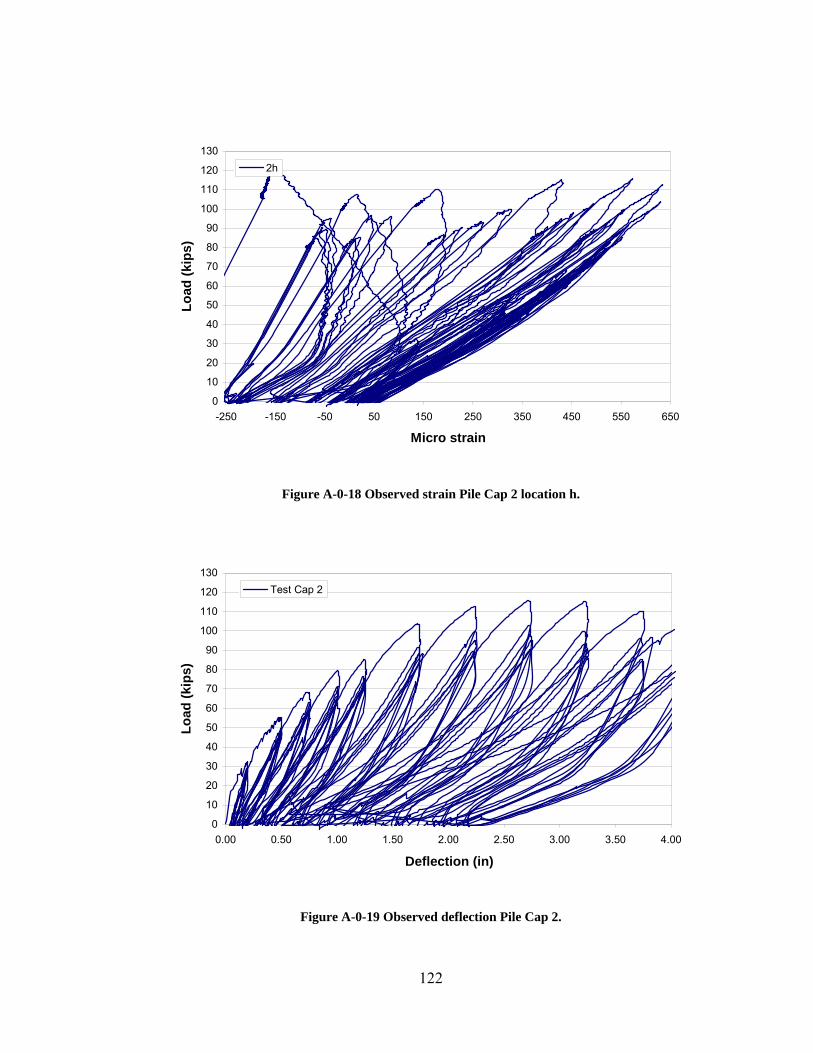
122
0
10
20
30
40
50
60
70
80
90
100
110
120
130
-250 -150 -50 50 150 250 350 450 550 650
Micro strain
Load
(kip
s)2h
Figure A- 0-18 Observed strain Pile Cap 2 location h.
0
10
20
30
40
50
60
70
80
90
100
110
120
130
0.00 0.50 1.00 1.50 2.00 2.50 3.00 3.50 4.00
Deflection (in)
Load
(kip
s)
Test Cap 2
Figure A- 0-19 Observed deflection Pile Cap 2.
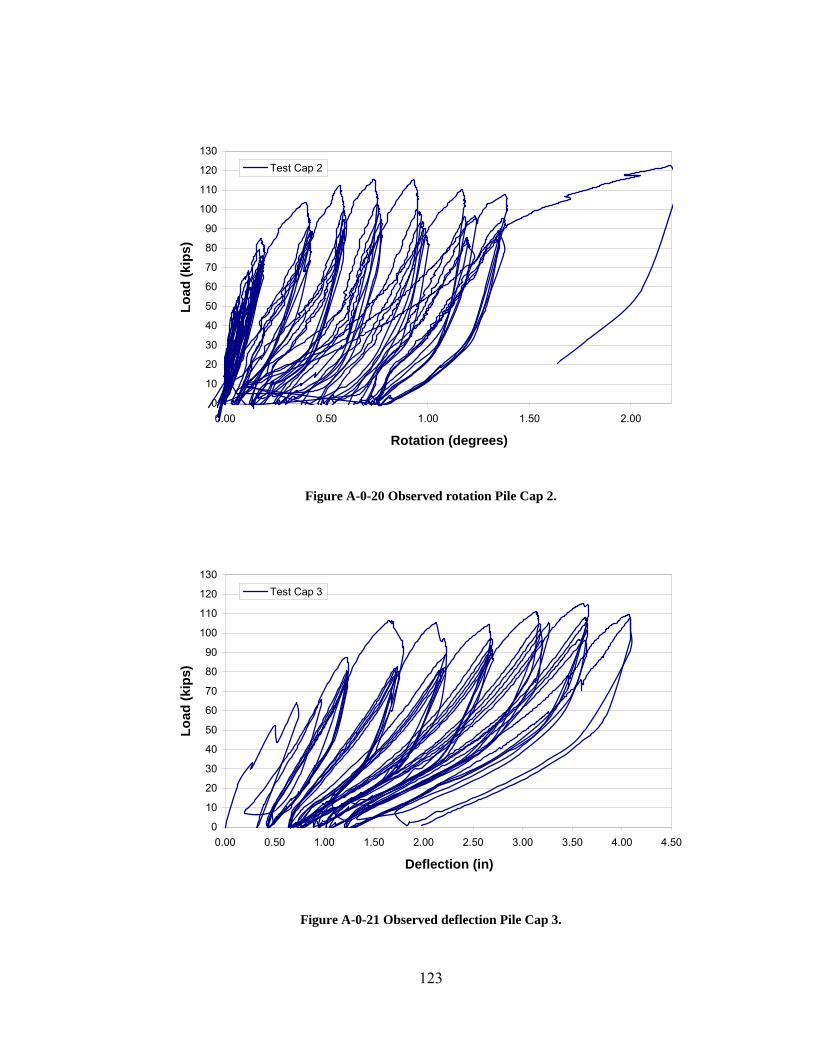
123
0
10
20
30
40
50
60
70
80
90
100
110
120
130
0.00 0.50 1.00 1.50 2.00
Rotation (degrees)
Load
(kip
s)Test Cap 2
Figure A- 0-20 Observed rotation Pile Cap 2.
0
10
20
30
40
50
60
70
80
90
100
110
120
130
0.00 0.50 1.00 1.50 2.00 2.50 3.00 3.50 4.00 4.50
Deflection (in)
Load
(kip
s)
Test Cap 3
Figure A- 0-21 Observed deflection Pile Cap 3.
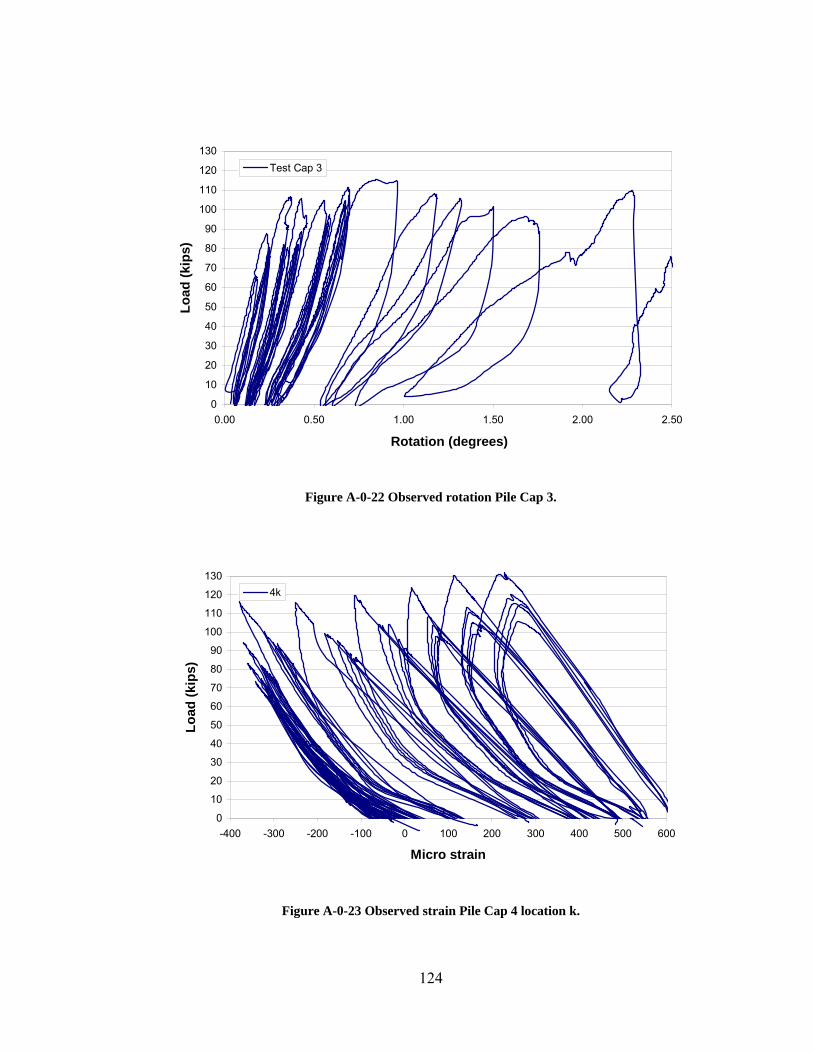
124
0
10
20
30
40
50
60
70
80
90
100
110
120
130
0.00 0.50 1.00 1.50 2.00 2.50
Rotation (degrees)
Load
(kip
s)Test Cap 3
Figure A- 0-22 Observed rotation Pile Cap 3.
0
10
20
30
40
50
60
70
80
90
100
110
120
130
-400 -300 -200 -100 0 100 200 300 400 500 600
Micro strain
Load
(kip
s)
4k
Figure A- 0-23 Observed strain Pile Cap 4 location k.
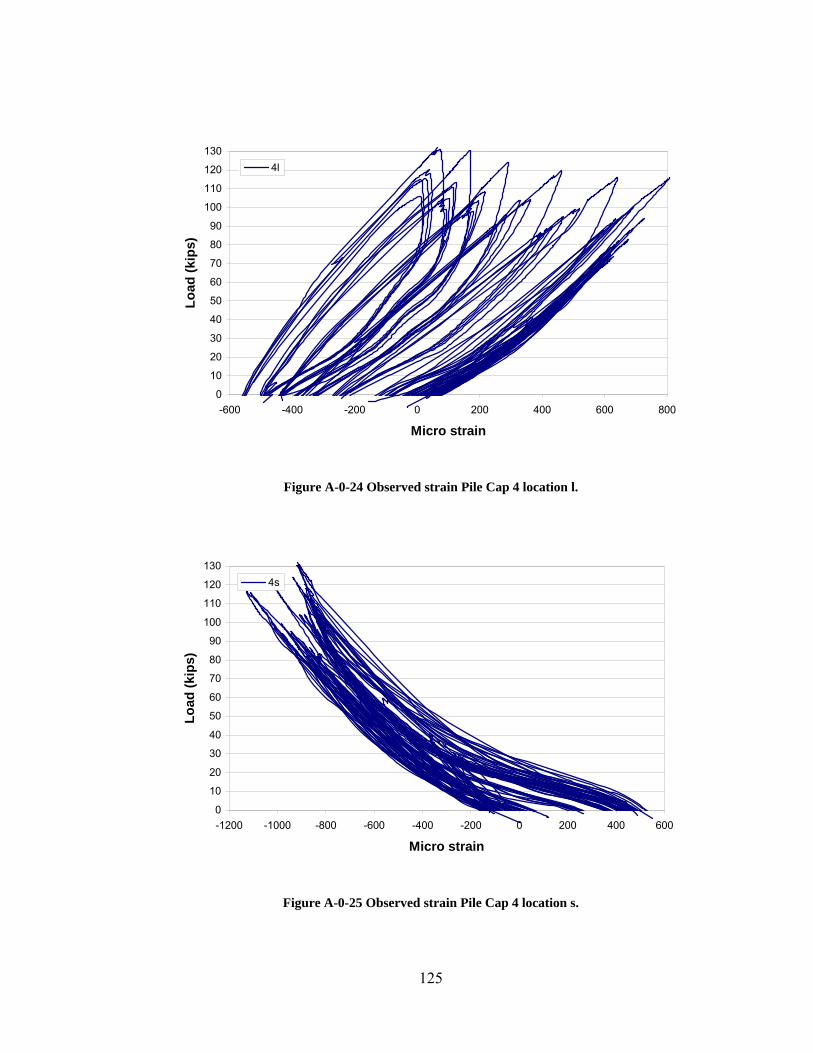
125
0
10
20
30
40
50
60
70
80
90
100
110
120
130
-600 -400 -200 0 200 400 600 800
Micro strain
Load
(kip
s)
4l
Figure A- 0-24 Observed strain Pile Cap 4 location l.
0
10
20
30
40
50
60
70
80
90
100
110
120
130
-1200 -1000 -800 -600 -400 -200 0 200 400 600
Micro strain
Load
(kip
s)
4s
Figure A- 0-25 Observed strain Pile Cap 4 location s.
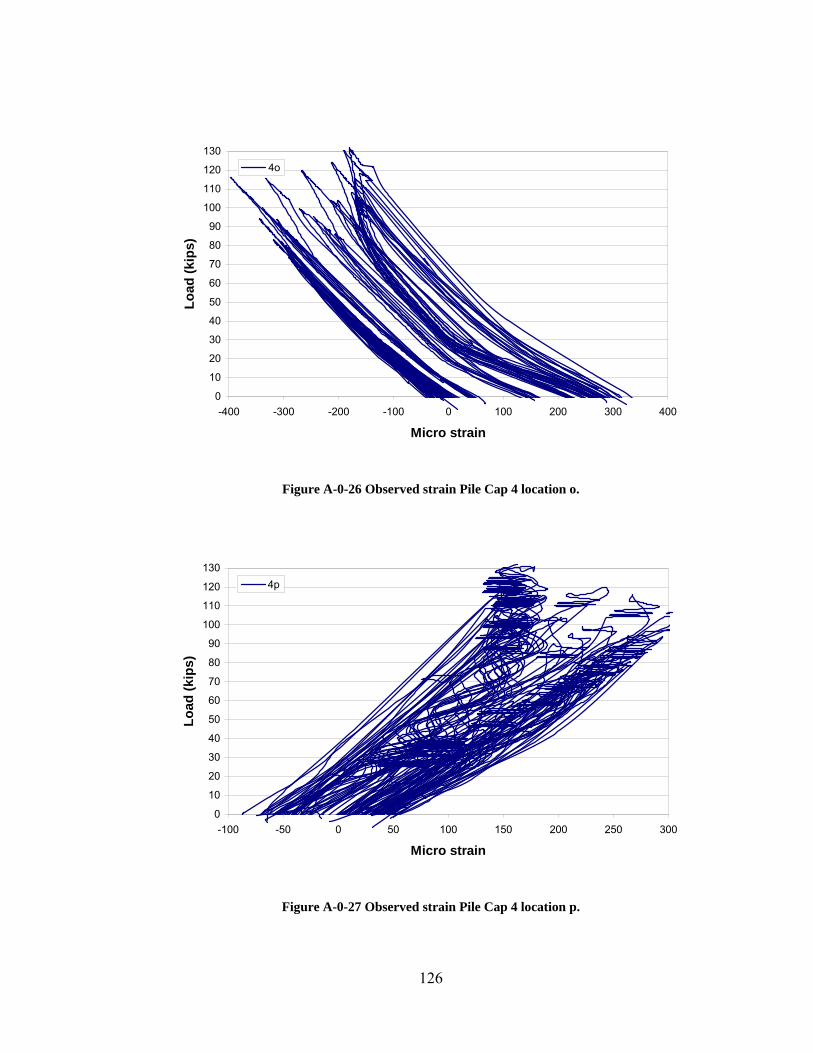
126
0
10
20
30
40
50
60
70
80
90
100
110
120
130
-400 -300 -200 -100 0 100 200 300 400
Micro strain
Load
(kip
s)4o
Figure A- 0-26 Observed strain Pile Cap 4 location o.
0
10
20
30
40
50
60
70
80
90
100
110
120
130
-100 -50 0 50 100 150 200 250 300
Micro strain
Load
(kip
s)
4p
Figure A- 0-27 Observed strain Pile Cap 4 location p.
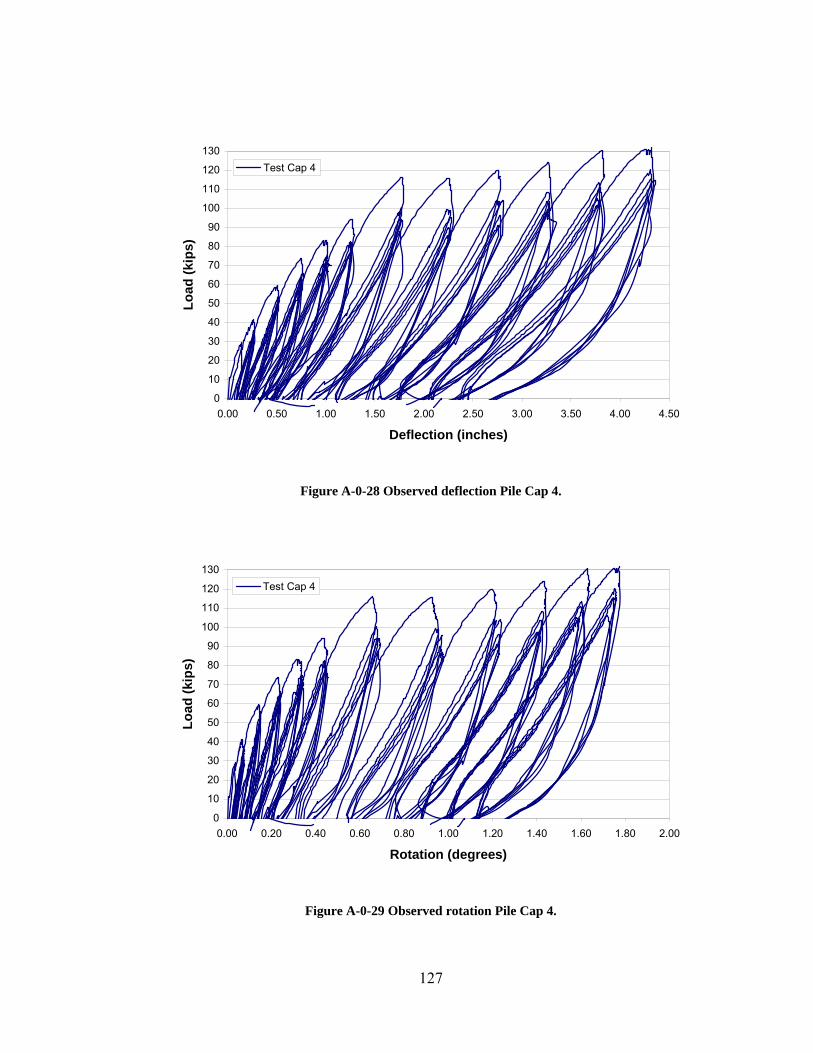
127
0
10
20
30
40
50
60
70
80
90
100
110
120
130
0.00 0.50 1.00 1.50 2.00 2.50 3.00 3.50 4.00 4.50
Deflection (inches)
Load
(kip
s)Test Cap 4
Figure A- 0-28 Observed deflection Pile Cap 4.
0
10
20
30
40
50
60
70
80
90
100
110
120
130
0.00 0.20 0.40 0.60 0.80 1.00 1.20 1.40 1.60 1.80 2.00
Rotation (degrees)
Load
(kip
s)
Test Cap 4
Figure A- 0-29 Observed rotation Pile Cap 4.