benchmarking the turkish apparel retail industry through dea and data visualization
DESCRIPTION
This paper presents a benchmarking study of the Turkish apparel retailing industry. We have applied the Data Envelopment Analysis (DEA) methodology to determine the efficiencies of the companies in the industry. In the DEA model the number of stores, number of corners, total sales area and number of employees were included as inputs and annual sales revenue was included as the output. The efficiency scores obtained through DEA were visualized for gaining insights about the industry and revealing guidelines that can aid in strategic decision making.TRANSCRIPT
1
Ertek, G., Can, M. A., and Ulus, F. (2007). "Benchmarking the Turkish apparel retail industry
through data envelopment analysis (DEA) and data visualization.” EUROMA 2007, Ankara,
Turkey.
Note: This is the final draft version of this paper. Please cite this paper (or this final draft) as
above. You can download this final draft from http://research.sabanciuniv.edu.
BENCHMARKING THE TURKISH APPAREL
RETAIL INDUSTRY THROUGH DATA
ENVELOPMENT ANALYSIS (DEA) AND
DATA VISUALIZATION
Gürdal Ertek, Merve Ayşe Can, Firdevs Ulus
Faculty of Engineering and Natural Sciences
Sabanci University, Orhanli, Tuzla, 34956, Istanbul, Turkey

2
ABSTRACT
This paper presents a benchmarking study of the Turkish apparel retailing
industry. We have applied the Data Envelopment Analysis (DEA) methodology to
determine the efficiencies of the companies in the industry. In the DEA model the
number of stores, number of corners, total sales area and number of employees
were included as inputs and annual sales revenue was included as the output. The
efficiency scores obtained through DEA were visualized for gaining insights about
the industry and revealing guidelines that can aid in strategic decision making.
Keywords: Data Envelopment Analysis (DEA), apparel retailing, industrial
benchmarking
INTRODUCTION
“Retailing consists of the sale of goods/merchandise for personal or household consumption
either from a fixed location or from a fixed location and related subordinated services.”
(Retailing, 2006). In order to survive in today’s highly competitive environment, companies
should find ways of continuously improving themselves and should regularly benchmark
themselves against their competitors to assess their standing and to revise their competitive
strategies if necessary.
In this paper, an existing benchmarking methodology is applied to the Turkish apparel
retailing industry. The used methodology employs data visualization to interpret the results of
Data Envelopment Analysis (DEA), and has been applied earlier by Ulus et al. (2006) to
benchmark the logistics companies whose stocks are traded in the New York Stock Exchange
(NYSE). DEA is a nonparametric mathematical technique that is frequently preferred against
other analytical methods since it requires few assumptions about the units and magnitudes of
input data (Weill, 2004). This technique uses data regarding the inputs and outputs of the

3
entities in a group, and represents the efficiencies of these entities as a single computed value
ranging from 0 to 1. The entities are referred to as Decision Making Units (DMUs) and the
values that denote efficiencies are referred to as the efficiency scores. The primary motivation of
our research is to prove that this methodology can be highly useful for benchmarking in the
retailing industry. In our study, the DMUs that are selected are the Turkish apparel retailers.
The efficiency scores of the DMUs are visualized in commercial software products, enabling us
to gain some crucial insights about this industry.
METHODOLOGIES
Data Envelopment Analysis (DEA)
Data Envelopment Analysis (DEA) is a technique that can be employed in the measurement of
the efficiencies of a set of Decision Making Units (DMUs) by using multiple inputs and outputs.
There are different possible cases when using the technique, such as single input & output case,
two inputs & one output case, etc. In the cases of multiple inputs and multiple outputs, the
weights have to be determined. The weights can be classified into two main groups, which are
fixed weights and variable weights. In the fixed weights approach, the same weights are used for
the input and outputs of all the DMUs and, in the variable weights approach, the best weights
are selected as a part of the DEA. DEA methodology varies also with respect to orientation,
being input oriented or output oriented. In the case of input oriented DEA, one explores how the
inputs can be reduced while still obtaining the same output levels. In the case of output oriented
model, one explores how the outputs can be increased with given fixed levels of inputs. The
inputs and outputs themselves are chosen according to the nature and the focus of the research.
DMUs which have smaller values and larger outputs are preferable. The data used for the DMUs
can be integer, rational or real as long as they are nonnegative. The efficient frontier is formed
by the efficient DMUs that have efficiency score 1, and the efficiency scores of the other
inefficient DMUs are calculated accordingly (Cooper, 2006). In our study we decided to apply
the BCC Input Oriented Model.
4
Data Visualization
The visualization of the data is a crucial part of the analysis methodology, since it enables the
analyst to view the patterns and gain fundamental insights. With the emergence of information
visualization, it is now possible to employ new styles of visualizations in the data analysis
process. Information visualization is the growing field of computer science that combines data
mining, computer graphics and explanatory data analysis in pursuit of visually understanding
data (Keim 2002, Spence 2001). In our paper, input and output data, the efficiency scores and
other relevant data are visualized through colored scatter plots in Miner3D software (Miner3D)
and tile visualizations in Omniscope software (Visokio).
DATA COLLECTION
The data used in our study was obtained mainly from the August 2006 issue of the Turkishtime
magazine (Turkishtime) and was extended throughout the project by acquiring data from other
sources. The data in the Turkishtime magazine included the following fields for the retail
companies: number of stores, number of corners, sales areas (m²), number of employees and
the annual sales revenue. The gathering of the missing data and extending the data with new
fields were the most challenging parts of the project and required a number of contacts with
companies through telephone and e-mail. The data regarding the number of visitors was not
used in the DEA study, since these values were missing for too many companies. Meanwhile, we
assumed that the number of corners for some (mostly small) companies (such as BARCIN) were
zero. Finally, data for 39 retailers was included in the DEA. The data for the 39 retailers was
compiled in a Microsoft Excel spreadsheet, and the correctness and the consistency of the data
was checked. We have used the DEA-Solver software to compute the efficiency scores for the
selected DMUs. This software was developed by Kaoru Tone and comes with the DEA book by
Cooper et al. (2006). The data that is categorized as input and output are represented as headers
and the prefix (i) is inserted at the beginning of the input column headers and the prefix (o) is
inserted at the beginning of the output column headers. In applying the DEA, we selected the
inputs as the number of stores, number of corners, total sales area (m²) and number of
employees. The only output of our model was selected to be the total annual sales revenue for
5
each retailer. The analysis was carried out through enabling macros to be run in Microsoft Excel
and by selecting the BCC input oriented model of DEA within the DEA-Solver software. After
running the DEA-Solver, we obtained the efficiency scores of the DMUs (companies). We
analyzed these efficiency scores together with relevant data for the companies, such as the years
in which the companies were founded and the product categories that the companies sell.
ANALYSIS
The provided efficiency scores were combined with the retail data for visualizations in the
Miner3D software. 12 out of the 39 companies were observed to have the efficiency score of
1.The data was visualized in scatter plots and colored scatter plots which enabled us to discover
hidden patterns and to come up with several insights. Our analysis of the visualization are
explained in the following section.
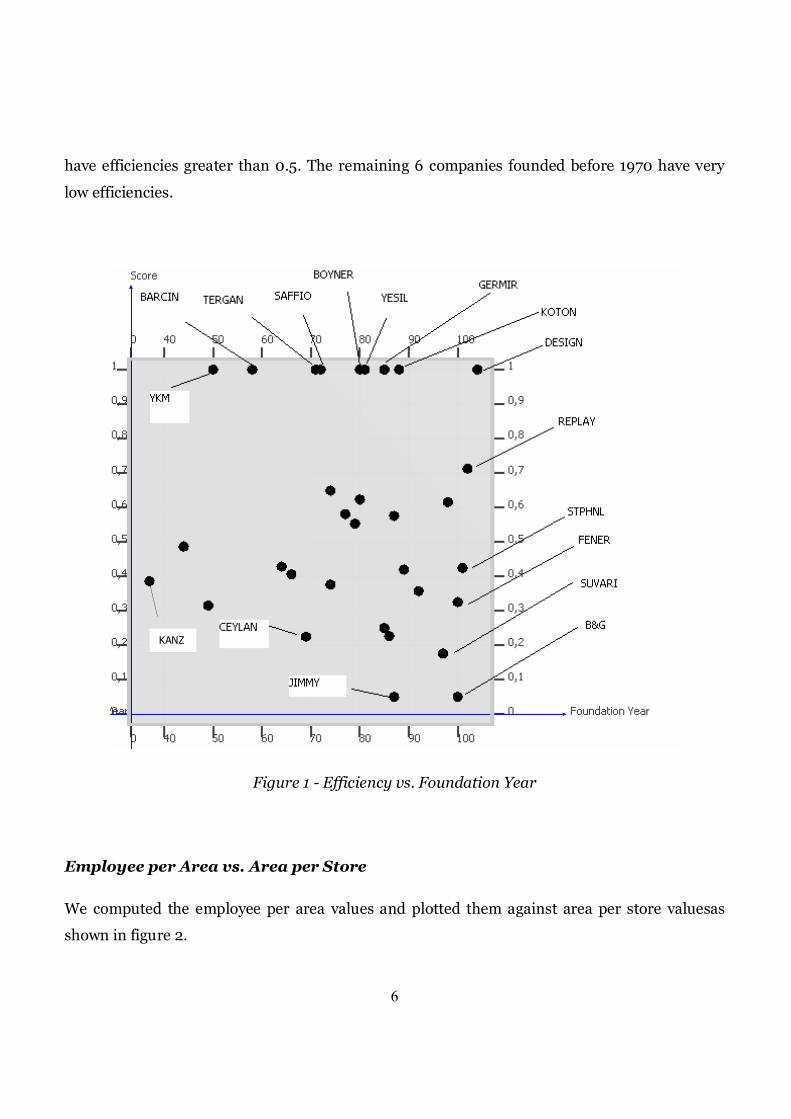
Efficiency vs. Foundation Year
The data related to the year of foundation of each company was collected in order to detect any
relations between the efficiency scores and the foundation years. The x axis is plotted as the
foundation year and the y axis is plotted as efficiency score (30 represents 1930 and 100
represents 2000 on the x axis).
A close examination of figure 1 provides an important insight: efficiency scores of the
companies do not display a visible increase or decrease based on the year of foundation. Thus,
for example one cannot state by looking at the plot that older, well-established companies are
more efficient compared to younger ones. For example, KANZ, which was founded in 1949, is
observed to have the efficiency score of 0.32, whereas DESIGN, which was founded in 2004, has
the perfect efficiency score of 1. However, it is observed that the efficiency scores exhibit much
larger variation for companies established in more recent years. One other pattern in figure 1 is
that out of companies founded before 1970 (with x values less than 70) only YKM and BARCIN
6
have efficiencies greater than 0.5. The remaining 6 companies founded before 1970 have very
low efficiencies.
Figure 1 - Efficiency vs. Foundation Year
Employee per Area vs. Area per Store
We computed the employee per area values and plotted them against area per store valuesas
shown in figure 2.
KANZ
7
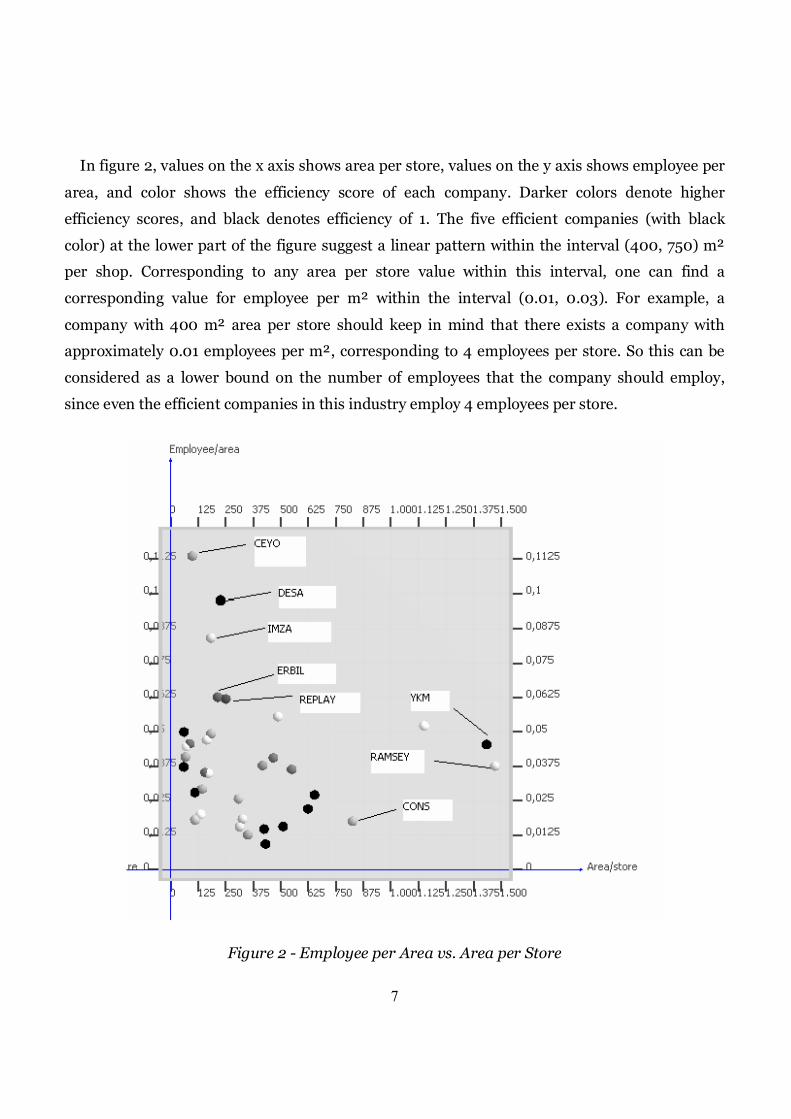
In figure 2, values on the x axis shows area per store, values on the y axis shows employee per
area, and color shows the efficiency score of each company. Darker colors denote higher
efficiency scores, and black denotes efficiency of 1. The five efficient companies (with black
color) at the lower part of the figure suggest a linear pattern within the interval (400, 750) m²
per shop. Corresponding to any area per store value within this interval, one can find a
corresponding value for employee per m² within the interval (0.01, 0.03). For example, a
company with 400 m² area per store should keep in mind that there exists a company with
approximately 0.01 employees per m², corresponding to 4 employees per store. So this can be
considered as a lower bound on the number of employees that the company should employ,
since even the efficient companies in this industry employ 4 employees per store.
Figure 2 - Employee per Area vs. Area per Store
8
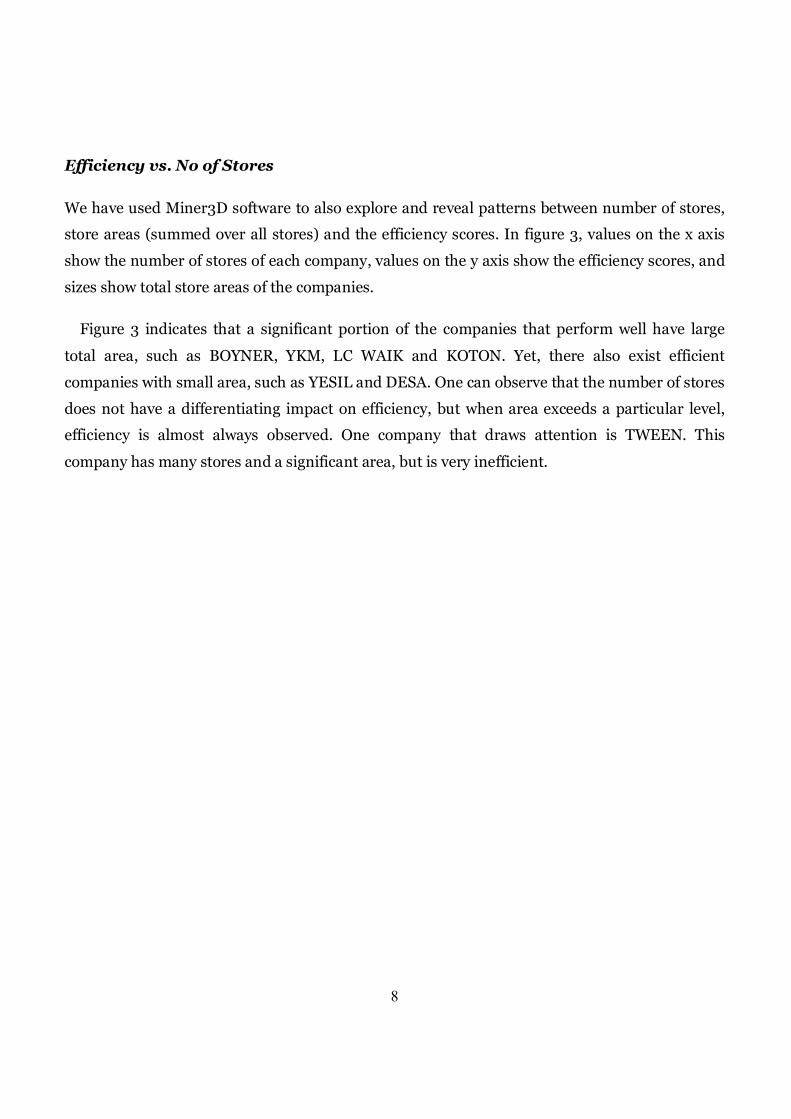
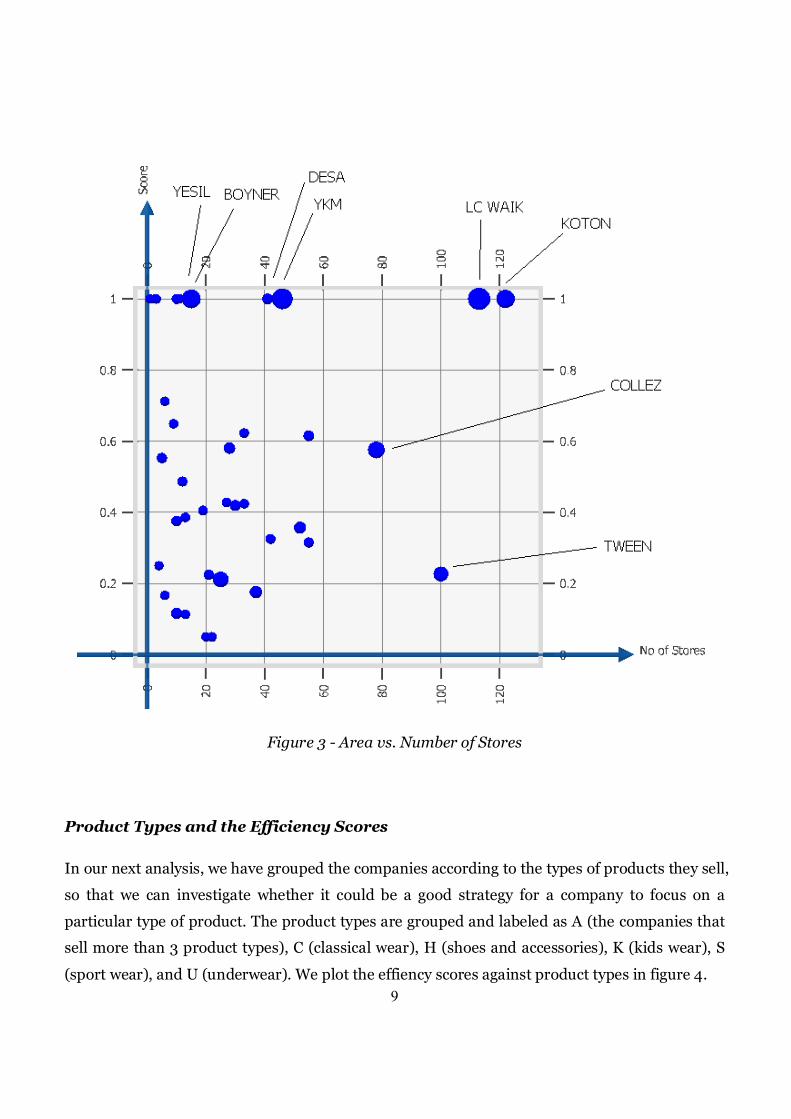
Efficiency vs. No of Stores
We have used Miner3D software to also explore and reveal patterns between number of stores,
store areas (summed over all stores) and the efficiency scores. In figure 3, values on the x axis
show the number of stores of each company, values on the y axis show the efficiency scores, and
sizes show total store areas of the companies.
Figure 3 indicates that a significant portion of the companies that perform well have large
total area, such as BOYNER, YKM, LC WAIK and KOTON. Yet, there also exist efficient
companies with small area, such as YESIL and DESA. One can observe that the number of stores
does not have a differentiating impact on efficiency, but when area exceeds a particular level,
efficiency is almost always observed. One company that draws attention is TWEEN. This
company has many stores and a significant area, but is very inefficient.
9
Figure 3 - Area vs. Number of Stores
Product Types and the Efficiency Scores
In our next analysis, we have grouped the companies according to the types of products they sell,
so that we can investigate whether it could be a good strategy for a company to focus on a
particular type of product. The product types are grouped and labeled as A (the companies that
sell more than 3 product types), C (classical wear), H (shoes and accessories), K (kids wear), S
(sport wear), and U (underwear). We plot the effiency scores against product types in figure 4.
10
Figure 4 shows that all four companies in company group A, namely BOYNER, YKM, KOTON
and DESIGN, are efficient. So it can be concluded that retailing a wide variety of apparel
product types is viable strategy. Increasing the product range and serving customers in larger
centrally located stores (as the four companies mentioned above do) could be winning strategies.
All but one of the companies in the classical wear (C) group have low efficiency scores, almost
uniformly dispersed within the interval (0.1, 0.63). The obvious leader in this group is GERMIR,
which is the only efficient firm within group C. Both of the two companies that sell only kids’
apparel (in the group K) have efficiency scores below 0.4, indicating that restricting the product
range to only kids’ apparel is not a good strategy. Meanwhile, it is observed that the retailers
which focus on underwear (within the group U) perform better with respect to the ones that
focus on kids’ apparel.
One striking insight of the figure is that there does not exist even a single company that has an
efficiency score within the range (0.75, 0.9). All the companies in the dataset have efficiency
scores of exactly 1 or scores below ~0.7.

11
Figure 4 – Efficiency vs. Product Ranges
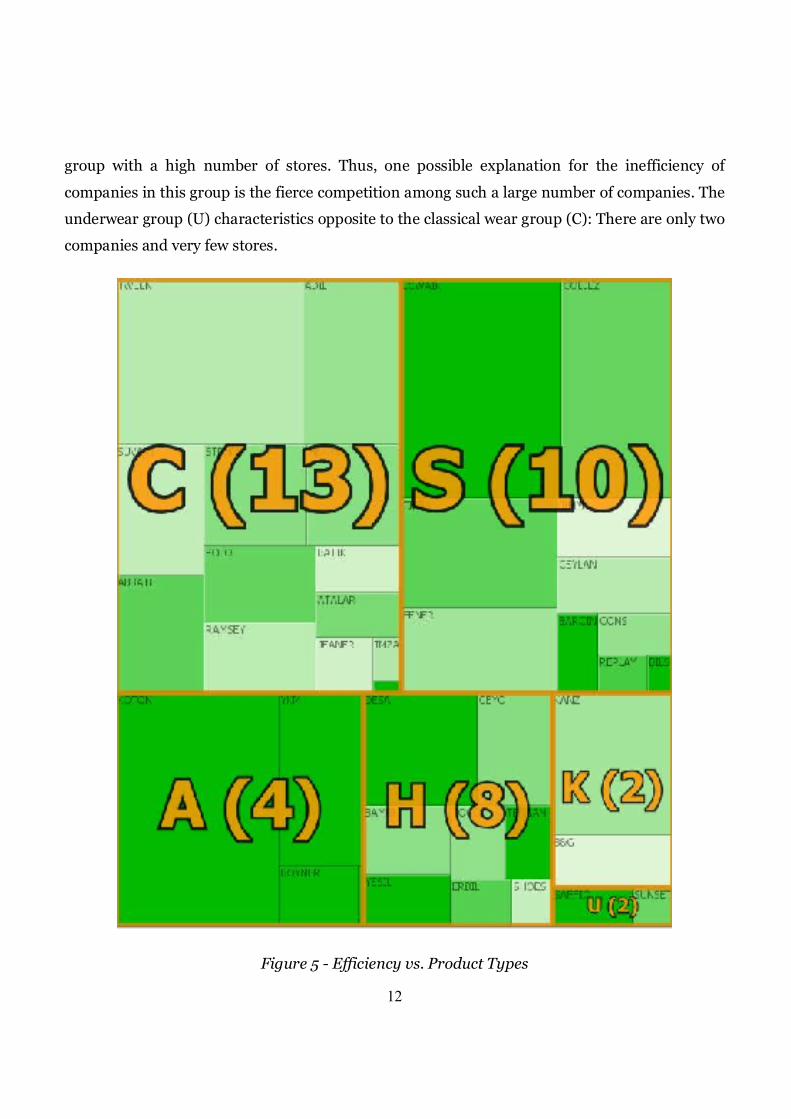
The relation between the efficiency scores and the product range was also examined by using
the Omniscope software: In figure 5, size denotes number of stores and color denotes efficiency
score. . Darker tones of green indicate that the companies have higher efficiency scores. The
company groups are as in figure 4, labeled with letters of C, S, A, H, K and U.
As we had observed in figure 4, we again observe that the companies in group C exhibit very
low efficiency scores as a whole, whereas the companies in group A all have the efficiency score
of 1. In figure 5, we also observe that there exist too many companies in the classical wear (C)
12
group with a high number of stores. Thus, one possible explanation for the inefficiency of
companies in this group is the fierce competition among such a large number of companies. The
underwear group (U) characteristics opposite to the classical wear group (C): There are only two
companies and very few stores.
Figure 5 - Efficiency vs. Product Types
13
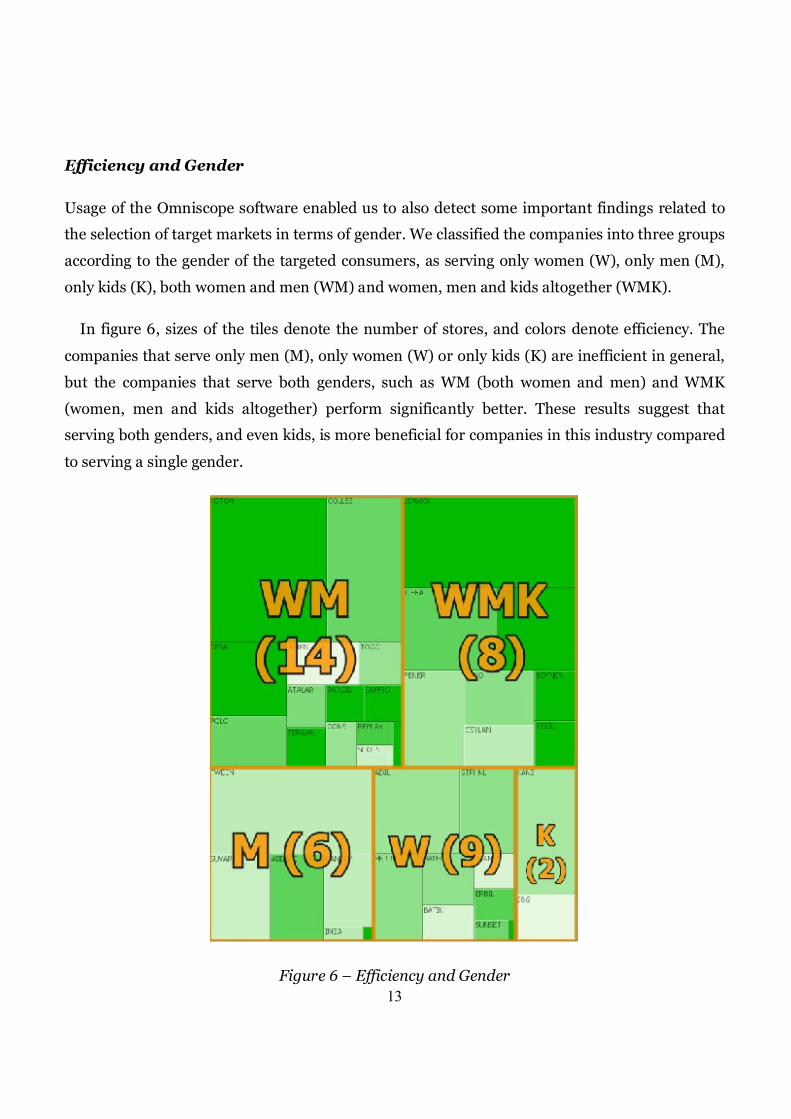
Efficiency and Gender
Usage of the Omniscope software enabled us to also detect some important findings related to
the selection of target markets in terms of gender. We classified the companies into three groups
according to the gender of the targeted consumers, as serving only women (W), only men (M),
only kids (K), both women and men (WM) and women, men and kids altogether (WMK).
In figure 6, sizes of the tiles denote the number of stores, and colors denote efficiency. The
companies that serve only men (M), only women (W) or only kids (K) are inefficient in general,
but the companies that serve both genders, such as WM (both women and men) and WMK
(women, men and kids altogether) perform significantly better. These results suggest that
serving both genders, and even kids, is more beneficial for companies in this industry compared
to serving a single gender.
Figure 6 – Efficiency and Gender
14
CONCLUSION
Benchmarking of Turkish apparel industry is carried out by using the DEA in this study and data
visualization. Our study presents many patterns that have not been observed before, and arms
managers in this subsector of the retail industry with actionable insights. We thus conclude that
the methodology that we employ is appropriate for benchmarking the companies in the selected
industry, and can be tested for benchmarking companies in other retailing sectors and in retail
industries of other countries.
REFERENCES
Cooper, W. W., Seiford, L. M., and Tone, K. (2006), Introduction to Data Envelopment Analysis
and its Uses, Springer, New York.
Keim, D. A. (2002), “Information visualization and data mining,” IEEE Transactions on
Visualization and Computer Graphics, Vol.8, No.1, pp. 1-8.
Miner3D. http://www.miner3d.com
Retailing. (2006, December 27). In Wikipedia, The Free Encylopedia. Retrieved 23:42,
December 28, 2006, from
http://en.wikipedia.org/w/index.php?title=Retailing&oldid=9672425
Spence, R. (2001), Information Visualization, ACM Press, Essex, England.
Ulus, F., Kose, O, Ertek, G. and Sen, S. (2006), "Financial benchmarking of transportation
companies in the New York Stock Exchange (NYSE) through data envelopment analysis
(DEA) and visualization". 4th International Logistics and Supply Chain Congress, Izmir,
Turkey. Available under http://www.ertek.info
Weill, L. (2004), “Measuring cost efficiency in European banking: a comparison of frontier
techniques,” Journal of Productivity Analysis, Vol.21, No.2, pp. 133-152.
Visokio. http://www.visokio.com