berrigan- nitrate-removal_april-7-2016-minnesota-awwa-metro-district
TRANSCRIPT

Nitrate Removal TechnologiesAlternatives and Costs
John K. Berrigan Jr., PEManager Water/Wastewater
April 6, 2016

Nitrate Removal Technologies
• Alternatives
• Ion Exchange
• Reverse Osmosis
• Electrodialysis
• Biological treatment
• Nontreatment alternatives
• Conclusion

AlternativesBest Available Technologies

Alternatives
• Best Available Technologies
– Ion Exchange
– Reverse Osmosis
– Electrodialysis
• Additional Technologies
– Biological Treatment

Ion ExchangeBest Available Technology

Ion exchange
• A process in
which ions are
exchanged
between a
solution and an
insoluble solid.
McCook NE, two-stage ion exchange removal
Courtesy Tonka Water
Ion Exchange Applications
• Calcium
• Magnesium
• Radium
• Nitrate
• Arsenic
• Uranium
• TOC

Ion Exchange Selectivity
• Cation (positive) exchange selectivity:
Fe3+ > Ra2+ > Fe2+ > Mn2+ > Ca2+ > Mg2+ > Na+
• Anion (negative) exchange selectivity:
U > DOC > SO42- > NO3
- > As5- > Cl- > HCO3-

Ion Exchange Resin
Courtesy Thermax

Ideal Resins for Nitrate Removal
• Macroporous (large pore size)
• Strong base anion exchange resin
• Certified to the ASTM/NSF 61 standard
• Nitrate selectivity
• Examples
– Purolite 520E @ $310/cubic foot.
– Thermax A-62 MP @ $240/cubic

Macroporous Ion Exchange Bead
Courtesy Dow Chemical

Ion Exchange Beads
Courtesy Dow Chemical

Ion Exchange Vessel
• Distributor
• Collector
• Brine System
• Shell
Courtesy Tonka Water

Ion Exchange Process
• Service Mode
• Regeneration Mode
– Backwash
– Brine
– Slow Rinse
– Fast Rinse

Resin Regeneration - Brining
Background photo courtesy Dow

Service
• Each vessel operates for a pre-determined amount of
water
• Determined by batched effluent meter

In Service Mode
Background photo courtesy Dow

Backwash
• Up-flow
• Expands resin bed and removes accumulated
solids
• Breaks up any bridging of resin
• “Fluffs” resin exposing new sites for ion exchange
• 100% feed water
• Can be recycled/reclaimed

Brine/Slow Rinse
• Brine
– Replenishes exchange sites with Cl-
– Drives out adsorbed organics
• Slow Rinse
– 100% treated water
– Brine moves evenly out of the bed
– Maintains slow brine rate

Brine
Background photo courtesy Dow

Fast Rinse/Return to Service
• Washes away residual salinity
• 100% feed water
• Return to service at conductivity setpoint

Ion Exchange Process
• Service Mode
– Each vessel operates for predetermined amount of
water treated (typically 1,000 – 1,500 gallons/cubic ft.
of resin).
– Nitrate exchanged for chloride ions on the resin
• Regeneration Mode
– Accumulated nitrates are removed
– Resin bed is rejuvenated
– Approximately 80-100 minutes

Ion Exchange Process
• Nitrate Specific Requirements
– Regeneration is counter-current
– Two stages if nitrates are above MCL

Case Study - Hastings
Courtesy City of Hastings, MN
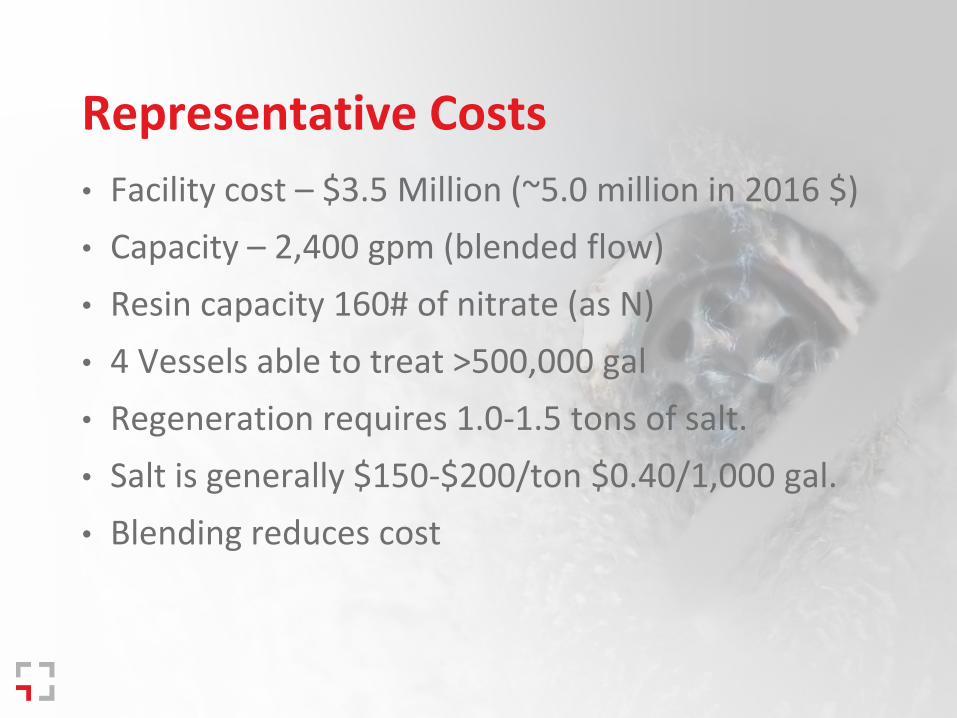
Representative Costs
• Facility cost – $3.5 Million (~5.0 million in 2016 $)
• Capacity – 2,400 gpm (blended flow)
• Resin capacity 160# of nitrate (as N)
• 4 Vessels able to treat >500,000 gal
• Regeneration requires 1.0-1.5 tons of salt.
• Salt is generally $150-$200/ton $0.40/1,000 gal.
• Blending reduces cost

Equipment
• Ion exchange system
– Vessels
– Resin
– Salt storage, brine pumping
– Valves, actuators, compressor
– Instruments and controls
• Chemical feed
• Pumping equipment
• Building and property
Courtesy City of Hastings, MN

Reverse OsmosisBest Available Technologies

RO – Membrane Introduction
• Membrane - a thin piece of material that has no
visible holes.
• From the Latin “membrana”, meaning “skin”.
• Examples
– Roofing membranes
– Reverse osmosis membranes
– Cell membranes

RO – Membrane Introduction
Every operator has a working knowledge of at least five membrane systems operating in this room:
• Blood vessels
• Kidneys
• Lungs
• Stomach
• Skin

RO – Membrane Introduction
Circulatory System is a complex membrane filtration
system.
• Blood vessels, arteries, veins, capillaries
• Red blood cells, platelets, white blood cells
• Plasma
• Valves (heart, veins)
• Pumps (heart)
Photo courtesy of Medtronic®

RO – Membrane Introduction
Kidneys are a membrane
separation system
(micro & nanofiltration)
• Selective separation of
nitrogen compounds
• Foundation for treatment
for nitrates
Photos courtesy of Medivators®

RO – Membrane Introduction
• Filtration of Particles
– Microfiltration (MF)
– Ultrafiltration (UF)
• Selective Separation of Solubles
– Nanofiltration (NF)
– Reverse Osmosis (RO)


Photo Courtesy of GE
RO – Membrane Introduction
Courtesy Osmonics

RO – Membrane Introduction
• Feed = The water pumped into the membrane
system, after pretreatment.
Feed Permeate
Concentrate
Membrane

RO – Membrane Introduction
• Permeate = The portion of the feed which passes
through a membrane.
Feed Permeate
Concentrate
Membrane

RO – Membrane Introduction
• Concentrate = The portion of the feed which does
not pass through a membrane.
Feed Permeate
Concentrate
Membrane

Operating Fundamentals
• Recovery = The proportion of the feed which passes
through a membrane.
• Recovery = QPermeate/QFeed
Feed Permeate
Concentrate
Membrane
QFeed QPermeate
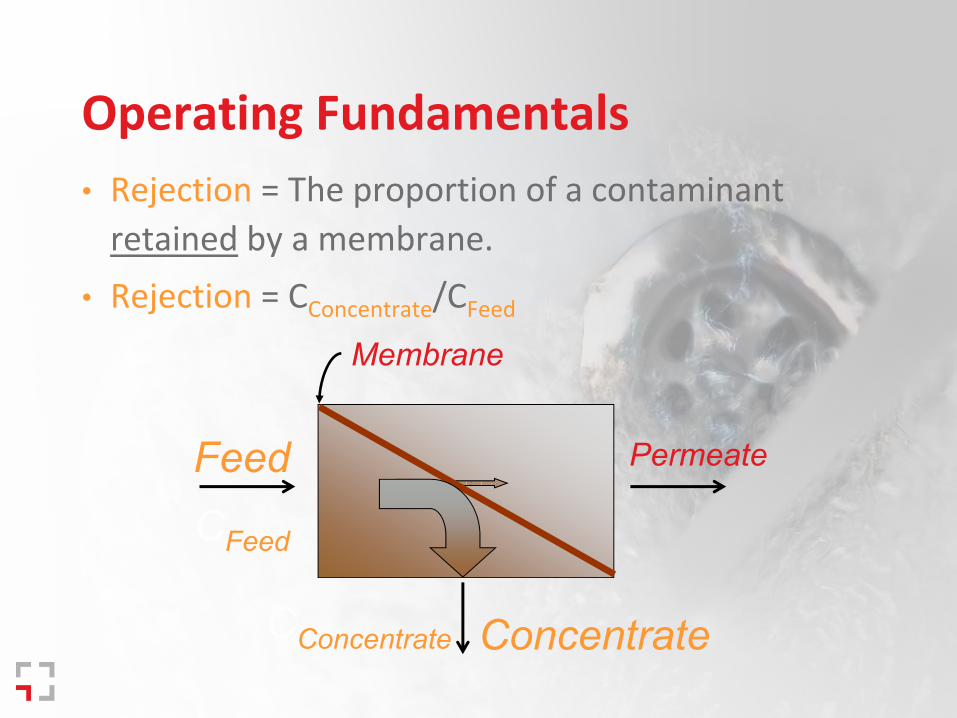
Operating Fundamentals
• Rejection = The proportion of a contaminant
retained by a membrane.
• Rejection = CConcentrate/CFeed
Feed Permeate
Concentrate
Membrane
CFeed
CConcentrate

RO – Membrane Introduction
• TMP = Transmembrane pressure, the pressure
differential across a membrane.
• TMP = PFeed - PPermeate
Feed Permeate
Concentrate
Membrane
PFeed PPermeate

RO – Membrane Introduction
• Flux = Flowrate of the permeate through a
specific unit area of membrane.
• Flux = J = Qpermeate/AMembrane
Feed
Concentrate
Membrane
PermeateAMembrane
QPermeate

RO – Membrane Introduction
• Flux – rate of flow per unit membrane area (similar to
filtration rate).
• Transmembrane pressure – feed pressure minus permeate
pressure (direct mode) (analogous to filter head loss).
• Rejection – percent of contaminant excluded.
• Recovery – percent of feed flow produced by the system.
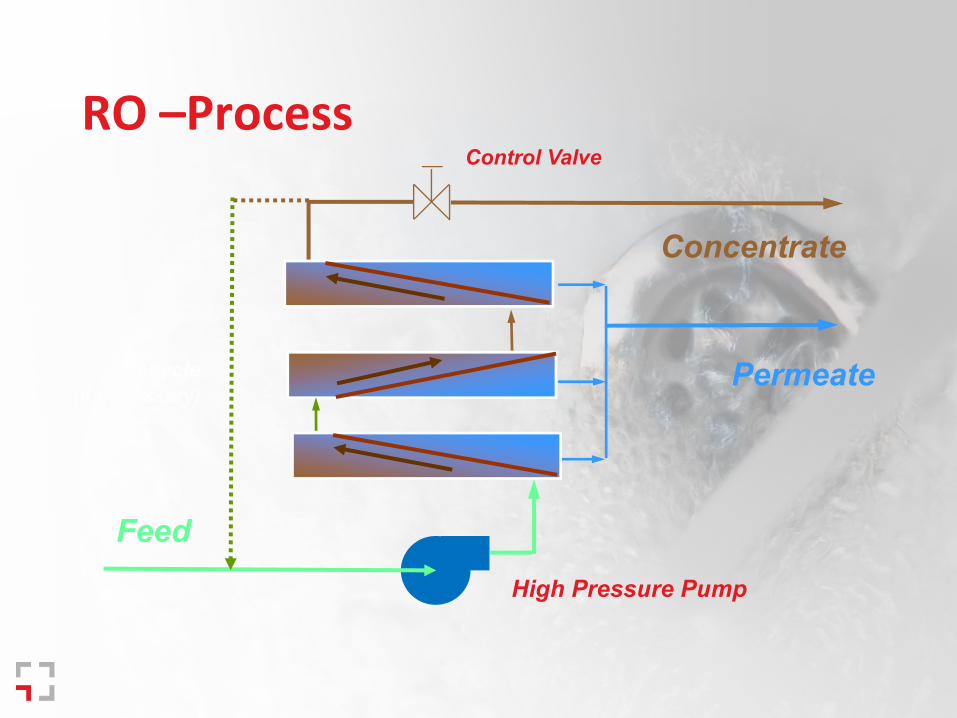
High Pressure Pump
Permeate
Concentrate
Recycle
(if necessary)
Control Valve
Feed
RO –Process

RO – Capital Cost Components
• Power (Pumping against 60 Δpsi - 90 Δpsi)
• Pretreatment Chemicals (acid and antiscalents)
• Prefiltration materials (1μ - 5μ cartridge filters)
• Membrane replacement @$300 - $500/cartridge
• Concentrate disposal
– May be technically infeasible
– May influence the cost of treatment by limiting recovery.
– Within separate sanitary districts, often cost prohibitive.

RO – Operating Components
• Power (antiscalent, preoxidation)
• Prefiltration (5μ)
• Pumps (60 Δpsi - 90 Δpsi)
• Membrane Skids (assemblies of cartridges)
• Cleaning and flushing systems
• Post-treatment equipment (Cl2, CO2 etc.)
• High service pumps
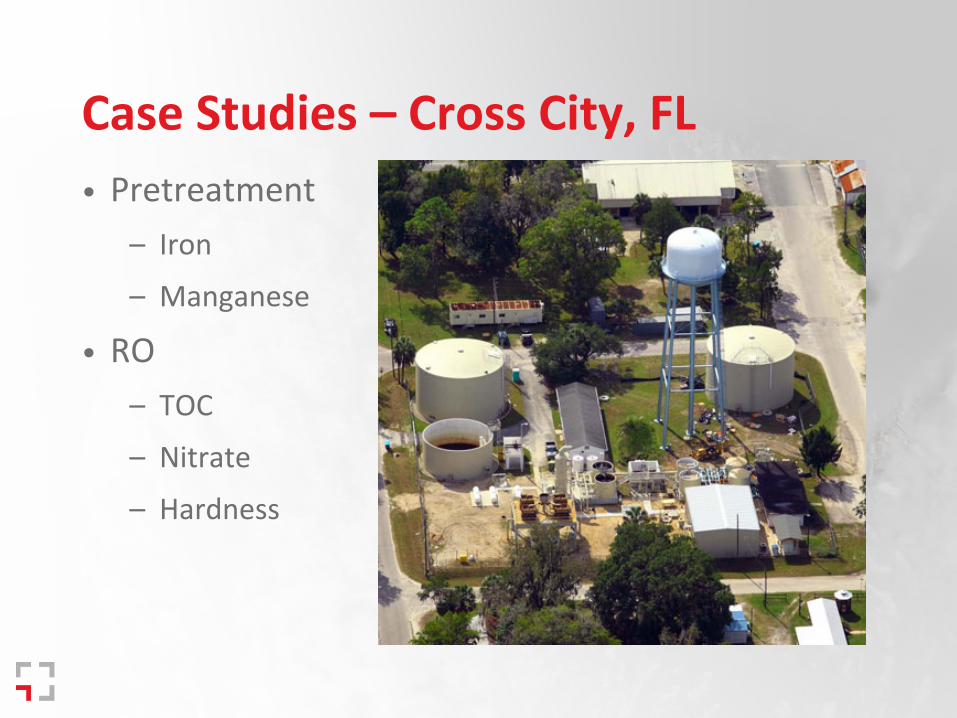
Case Studies – Cross City, FL
• Pretreatment
– Iron
– Manganese
• RO
– TOC
– Nitrate
– Hardness

Case Studies – Cross City, FL
• 2 mgd plant
• $3,500,000
• Gravity filters
• RO Trains
• Chemical feed
• Controls
Photo courtesy of WPC Contractors

Case Studies – Cross City, FL
• $3,000,000
• Concentrate
blended with
WWTP effluent
• Pumps
• 2 mile pipeline
• Spray field
• Controls
Photo courtesy of Wet Engineering

Case Studies – Council Bluffs, IA
Map Courtesy Google

Case Studies – Council Bluffs, IA
Capital Cost 5 10 20 PW
($ millions) mgd mgd mgd
Lime Softening 28.6 31.7 48.7 126
UF/RO 22.7* 28.5 42.4 106
• UF/RO pilot on the Missouri River source water
• Source water from collector wells under the river bed.
• Pilot report submitted to Iowa DNR for approval
• Based on pilot results, the UF/RO facility constructed.
* Estimated and actual construction costs the same. Cost estimates developed independently by HDR

Case Studies – Council Bluffs, IA
Operating Cost 5 10 20 PW
($ millions) mgd mgd mgd
Lime Softening 2.1 3.6 6.8 126
UF/RO 1.5 2.7 5.4 106
• Difference in operating costs influenced heavily by
solid waste handling and disposal.
Cost estimates developed independently by HDR

ElectrodialysisBest Available Technologies (Iowa, California)

Electrodialysis Reversal
• Uses electric field to reduce ion content
• Recoveries of 85%-95%
• Less sensitive to turbidity than RO or ion exchange
• Roughly 10 plants in Iowa
Diagram Courtesy GE

Electrodialysis Reversal
• Washington, IA
• Installed 1997
• Fairfield, IA
• Installed 2003
• Capital costs similar to RO
• Disposal options are a
deciding factor
Photos Courtesy GE

Biological TreatmentAvailable soon?

Non-treatment Alternatives

Nontreatment alternatives
• Drill a new well
• Connect to another utility

Nitrate Removal Technologies
• Alternatives
• Ion Exchange
• Reverse Osmosis
• Electrodialysis
• Biological treatment
• Nontreatment alternatives
• Conclusion

Thank you!