better quality through better measurement: run charts · walter a. shewhart - early 1920’s, bell...
TRANSCRIPT
Better Quality Through Better Measurement:
Run Charts Robert Lloyd, Ph.D.
Executive Director Performance Improvement Institute for Healthcare Improvement

• The Quality Measurement Journey
• Understanding variation conceptually
• Understanding variation with Run Charts
• Linking measurement to improvement
Discussion Topics

©Copyright 2012 IHI/R. Lloyd
AIM (Why are you measuring?)
Concept Measures Operational Definitions Data Collection Plan Data Collection Analysis ACTION
The Quality Measurement Journey
Source: R. Lloyd. Quality Health Care: A Guide to Developing and Using Indicators. Jones and Bartlett, 2004.

©Copyright 2012 IHI/R. Lloyd
AIM (Why are you measuring?)
Concept Measures Operational Definitions Data Collection Plan Data Collection Analysis ACTION
The Quality Measurement Journey
Source: R. Lloyd. Quality Health Care: A Guide to Developing and Using Indicators. Jones and Bartlett, 2004.

©Copyright 2012 IHI/R. Lloyd
5
You have performance data!
Now, what the heck do you do with it?
©Copyright 2012 IHI/R. Lloyd
“If I had to reduce my message for management to just a few words, I’d say it all had to do with reducing variation.” W. Edwards Deming

©Copyright 2012 IHI/R. Lloyd
The Problem
Aggregated data presented in tabular formats or with summary
statistics, will not help you measure the impact of process improvement/redesign efforts.
Aggregated data can only lead to judgment, not to improvement.

©Copyright 2012 IHI/R. Lloyd
“What is the variation in one system over time?” Walter A. Shewhart - early 1920’s, Bell Laboratories
time
UCL
Every process displays variation: • Controlled variation
stable, consistent pattern of variation “chance”, constant causes
• Special cause variation “assignable” pattern changes over time
LCL
Static View Static View
Dynamic View

©Copyright 2012 IHI/R. Lloyd
Types of Variation Common Cause Variation • Is inherent in the design of the
process
• Is due to regular, natural or ordinary causes
• Affects all the outcomes of a process
• Results in a “stable” process that is predictable
• Also known as random or unassignable variation
Special Cause Variation • Is due to irregular or unnatural
causes that are not inherent in the design of the process
• Affect some, but not necessarily all aspects of the process
• Results in an “unstable” process that is not predictable
• Also known as non-random or assignable variation

©Copyright 2012 IHI/R. Lloyd
Appropriate Responses to Common & Special Causes of Variation
Type of variation
Right Choice
Wrong Choice
Consequences of making the wrong
choice
Is the process stable? YES NO
Only Common
Change the process
Treat normal variation as a special cause (tampering)
Increased variation!
Special + Common
Change the process
Wasted resources!
Investigate the origin of the special cause
©Copyright 2012 IHI/R. Lloyd
11
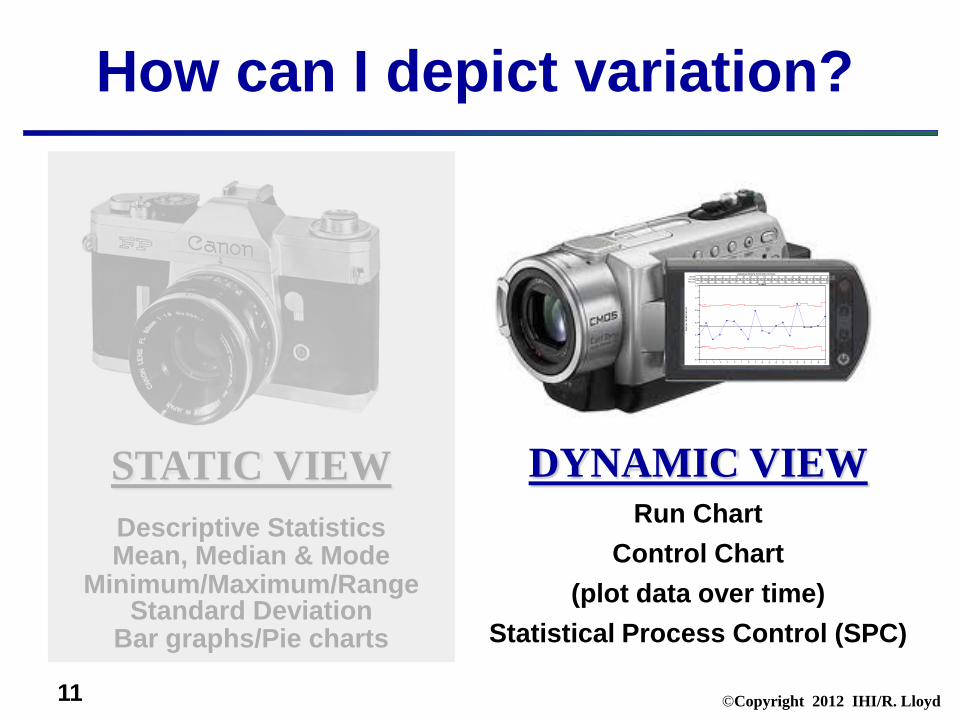
How can I depict variation?
STATIC VIEW
Descriptive Statistics Mean, Median & Mode
Minimum/Maximum/Range Standard Deviation
Bar graphs/Pie charts
DYNAMIC VIEW Run Chart
Control Chart (plot data over time)
Statistical Process Control (SPC) R
ate
per 1
00 E
D P
atie
nts
Unplanned Returns to Ed w/in 72 HoursM
41.7817
A43.89
26
M39.86
13
J40.03
16
J38.01
24
A43.43
27
S39.21
19
O41.90
14
N41.78
33
D43.00
20
J39.66
17
F40.03
22
M48.21
29
A43.89
17
M39.86
36
J36.21
19
J41.78
22
A43.89
24
S31.45
22
MonthED/100Returns
u chart
1 2 3 4 5 6 7 8 9 10 11 12 13 14 15 16 17 18 190.0
0.2
0.4
0.6
0.8
1.0
1.2
UCL = 0.88
Mean = 0.54
LCL = 0.19
©Copyright 2012 IHI/R. Lloyd
12
How do we analyze variation for quality improvement?
Run and Control Charts are the best tools to
determine if our improvement strategies have had the desired
effect.

©Copyright 2012 IHI/R. Lloyd
How many data points? Typically you should have
between 15 – 20 data points before constructing a chart
15 – 20 patients
15 – 20 days
15 – 20 weeks
15 – 20 months
15 - 20 quarters…?

©Copyright 2012 IHI/R. Lloyd
Elements of a Run Chart
160
180
200
220
240
260
280
300
320
LO
S (m
inut
es)
2/16/11 3/16 4/13 5/11 6/8
Week
Mea
sure
Time
The centerline (CL) on a Run Chart is the
Median
Four simple run rules are used to determine if special cause variation is present
X (CL) ~
©Copyright 2012 IHI/R. Lloyd
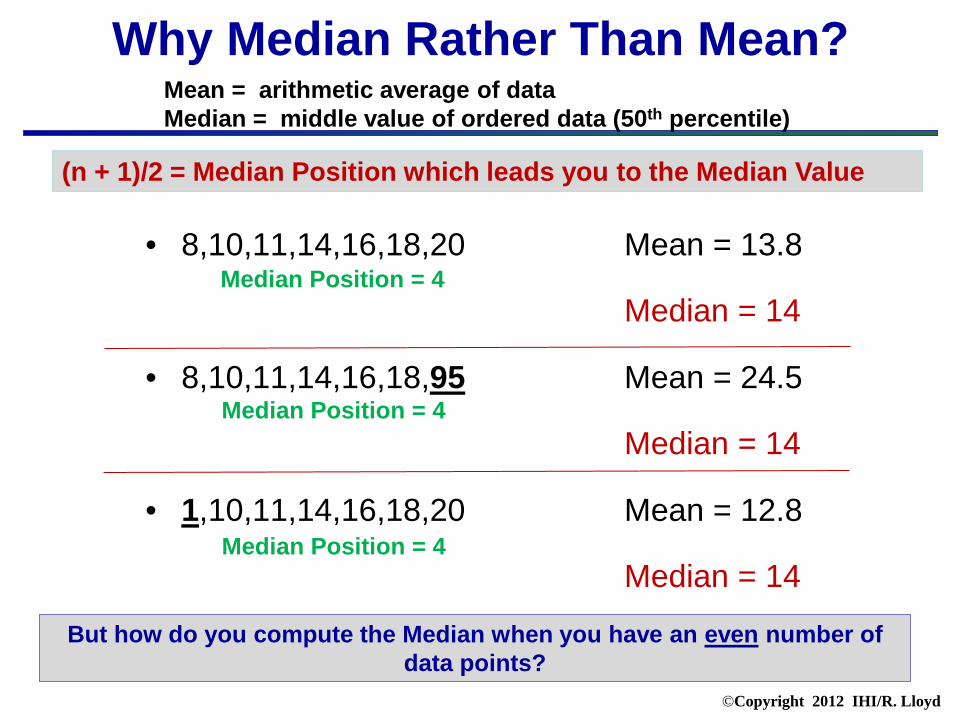
Why Median Rather Than Mean?
• 8,10,11,14,16,18,20 Mean = 13.8
Median = 14
• 8,10,11,14,16,18,95 Mean = 24.5
Median = 14
• 1,10,11,14,16,18,20 Mean = 12.8
Median = 14
Mean = arithmetic average of data Median = middle value of ordered data (50th percentile)
(n + 1)/2 = Median Position which leads you to the Median Value
Median Position = 4
Median Position = 4
Median Position = 4
But how do you compute the Median when you have an even number of data points?

©Copyright 2012 IHI/R. Lloyd
• 8,10,11,14,16,18,20,35 Mean = 16.5
Median = 15
• 8,10,11,14,16,18,30,95 Mean = 25.3
Median = 15
• 1,10,11,14,14,18,19,20 Mean = 13.4
Median = 14
(n + 1)/2 = Median Position which leads you to the Median Value
Median Position = 4.5
The Median with an even number of data points?
Median Position = 4.5
Median Position = 4.5

©Copyright 2012 IHI/R. Lloyd
1 2 3 4 5 6 7 8 9 10 11 12 13 14 15 16 17 18 19 20 21 22 23 24 25 26 27 28 29
Point Number
Pou
nds
of R
ed B
ag W
aste
3.25
3.50
3.75
4.00
4.25
4.50
4.75
5.00
5.25
5.50
5.75
6.00
Median=4.610
When you slide a piece of paper down, you reveal the dots in descending order.
When you have revealed the 15th data point you have found where the median lives.
Run Chart: Medical Waste How do you find the media?
(n + 1)/2 (29 + 1)/2 = 30/2 = 15
The Median Lives
here at the 15th
data point
But, the Median
Value= 4.6
©Copyright 2012 IHI/R. Lloyd
There are 4 simple run chart rules that help you decide if your data reflect a
random or non-random pattern.
How do we analyze a Run Chart
“How will I know what the Run Chart is trying
to tell me?”

©Copyright 2012 IHI/R. Lloyd
How do we count the number of runs?
What is a Run? • One or more consecutive data points on the same
side of the Median • Do not include data points that fall on the Median
First, you need to determine the number of Runs
• Draw a circle around each run and count the number of circles you have drawn
• Count the number of times the sequence of data points crosses the Median and add “1”
©Copyright 2012 IHI/R. Lloyd
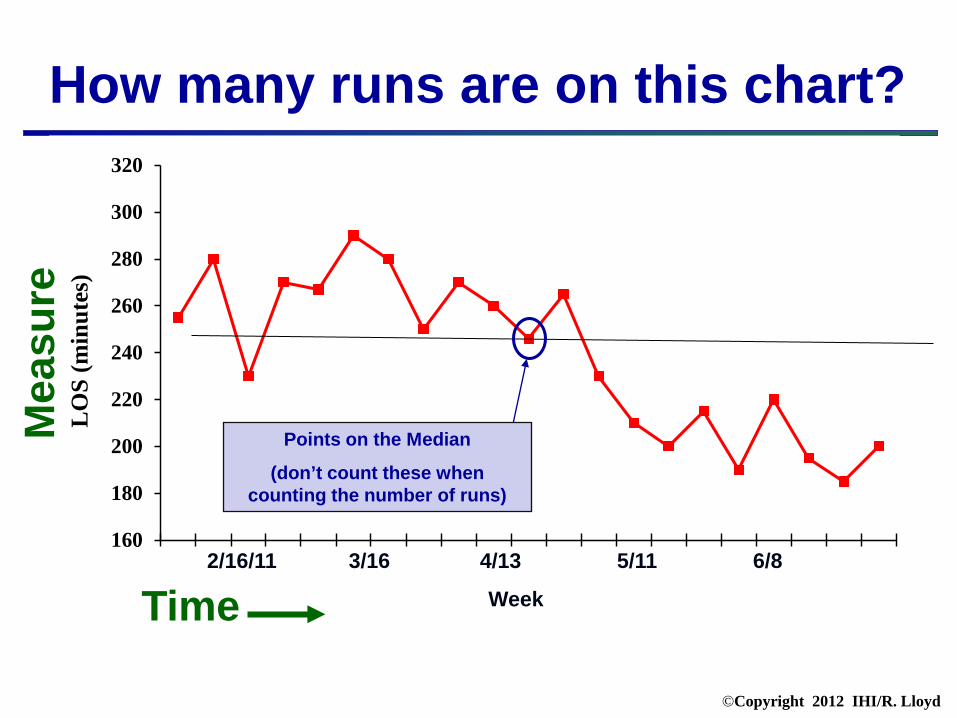
How many runs are on this chart?
160
180
200
220
240
260
280
300
320
LO
S (m
inut
es)
2/16/11 3/16 4/13 5/11 6/8
Week
Mea
sure
Time
Points on the Median
(don’t count these when counting the number of runs)
©Copyright 2012 IHI/R. Lloyd
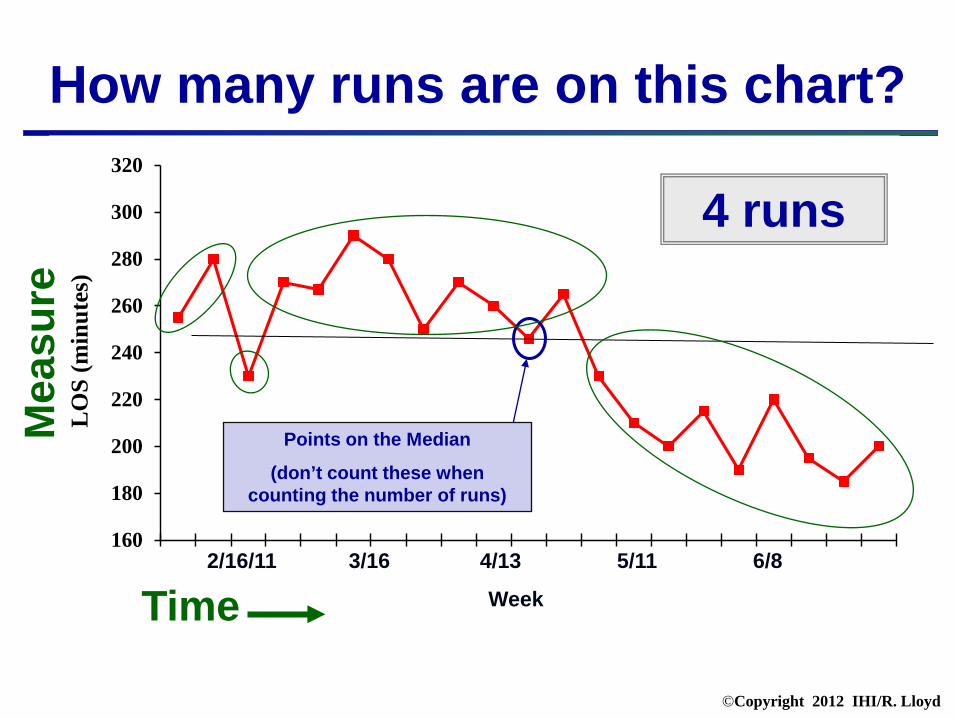
How many runs are on this chart?
160
180
200
220
240
260
280
300
320
LO
S (m
inut
es)
2/16/11 3/16 4/13 5/11 6/8
Week
Mea
sure
Time
Points on the Median
(don’t count these when counting the number of runs)
4 runs
©Copyright 2012 IHI/R. Lloyd
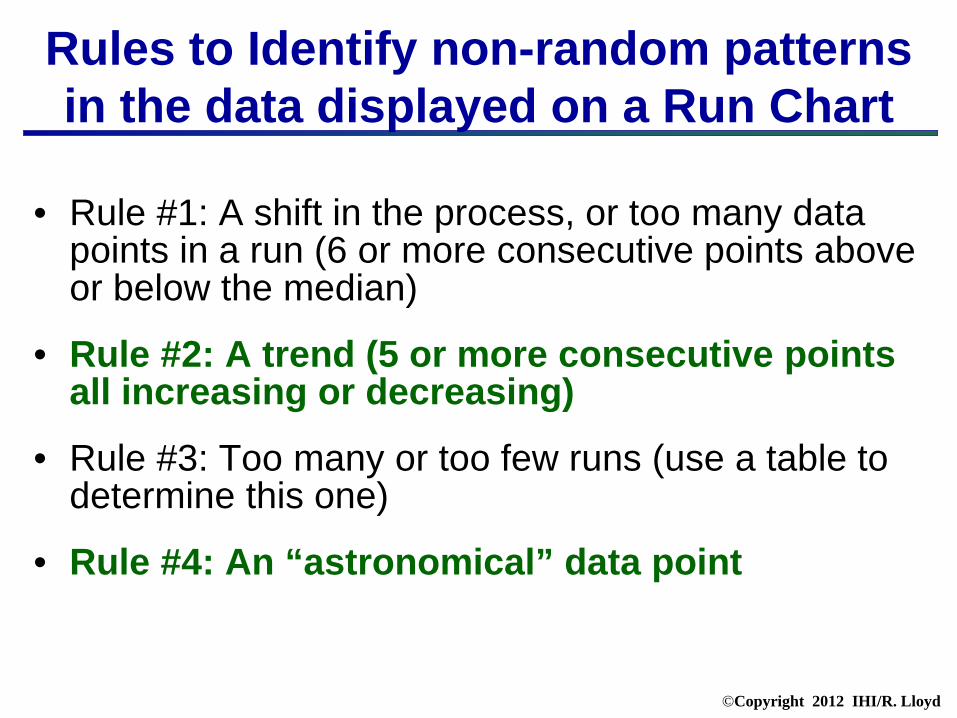
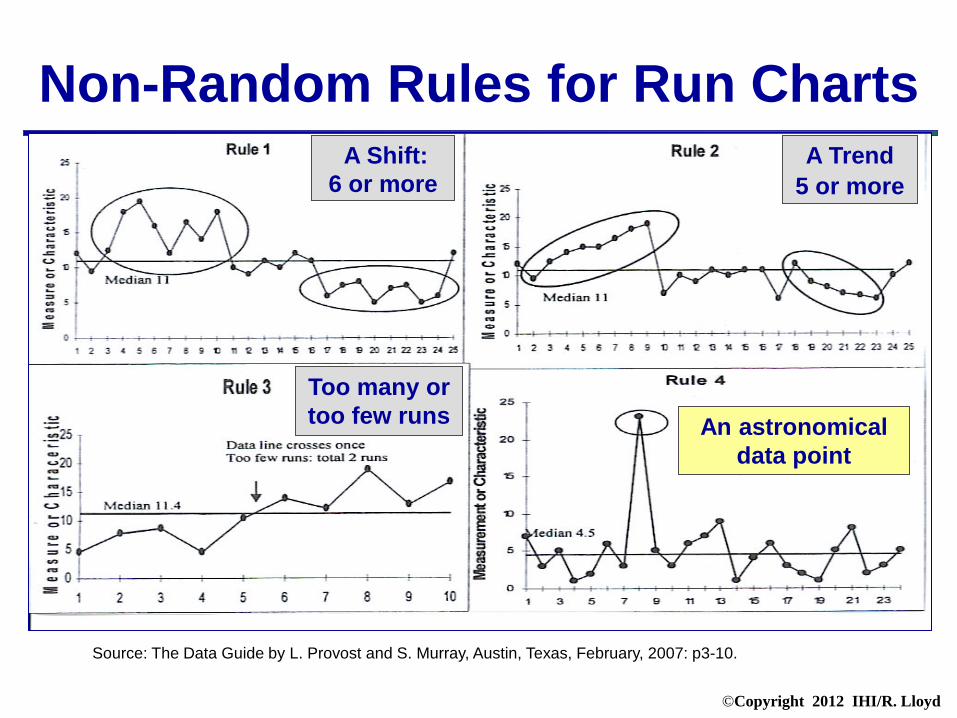
Rules to Identify non-random patterns in the data displayed on a Run Chart
• Rule #1: A shift in the process, or too many data points in a run (6 or more consecutive points above or below the median)
• Rule #2: A trend (5 or more consecutive points all increasing or decreasing)
• Rule #3: Too many or too few runs (use a table to determine this one)
• Rule #4: An “astronomical” data point

©Copyright 2012 IHI/R. Lloyd
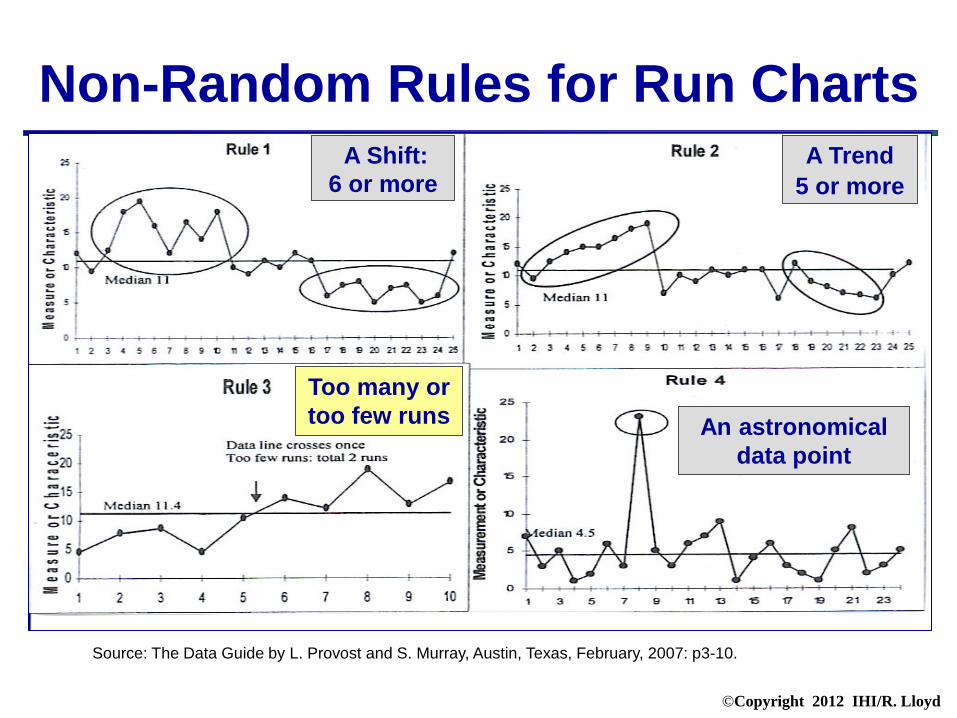
Non-Random Rules for Run Charts
Source: The Data Guide by L. Provost and S. Murray, Austin, Texas, February, 2007: p3-10.
A Shift: 6 or more
An astronomical data point
Too many or too few runs
A Trend 5 or more
©Copyright 2012 IHI/R. Lloyd
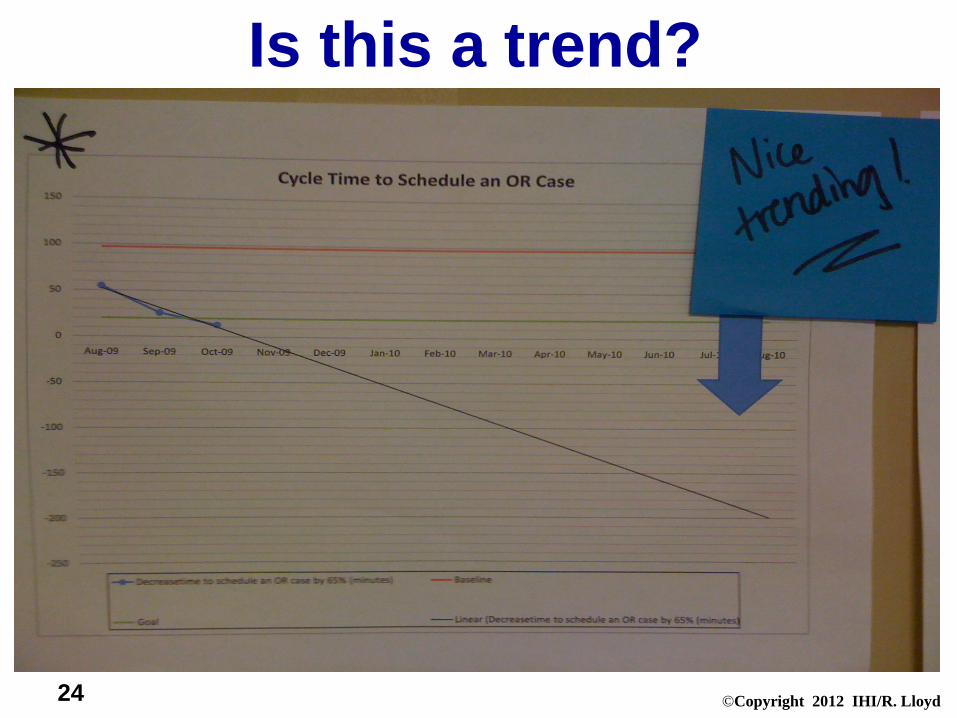
24
Is this a trend?
©Copyright 2012 IHI/R. Lloyd
Non-Random Rules for Run Charts
Source: The Data Guide by L. Provost and S. Murray, Austin, Texas, February, 2007: p3-10.
A Shift: 6 or more
An astronomical data point
Too many or too few runs
A Trend 5 or more

©Copyright 2012 IHI/R. Lloyd
Rule #3: Too few or too many runs Use this table by first calculating the number of "useful observations" in your data set. This is done by subtracting the number of data points on the median from the total number of data points. Then, find this number in the first column. The lower number of runs is found in the second column. The upper number of runs can be found in the third column. If the number of runs in your data falls below the lower limit or above the upper limit then this is a signal of a special cause. # of Useful Lower Number Upper Number Observations of Runs of Runs
15 5 12 16 5 13 17 5 13 18 6 14 19 6 15 20 6 16 21 7 16 22 7 17 23 7 17 24 8 18 25 8 18 26 9 19 27 10 19 28 10 20 29 10 20 30 11 21
©Copyright 2011 IHI/R. Lloyd
©Copyright 2012 IHI/R. Lloyd
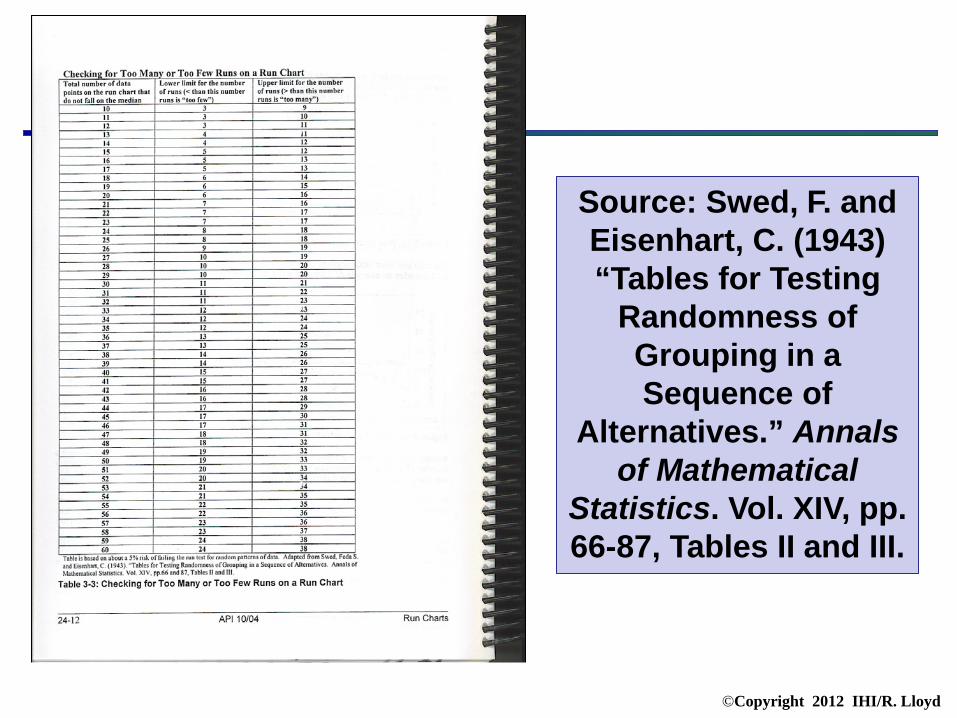
Source: Swed, F. and Eisenhart, C. (1943) “Tables for Testing
Randomness of Grouping in a Sequence of
Alternatives.” Annals of Mathematical
Statistics. Vol. XIV, pp. 66-87, Tables II and III.
©Copyright 2012 IHI/R. Lloyd
Non-Random Rules for Run Charts
Source: The Data Guide by L. Provost and S. Murray, Austin, Texas, February, 2007: p3-10.
A Shift: 6 or more
An astronomical data point
Too many or too few runs
A Trend 5 or more

©Copyright 2012 IHI/R. Lloyd
25 Men and a Test
0
5
10
15
20
25
1 3 5 7 9 11 13 15 17 19 21 23 25
Individuals
Sco
reRule #4: An Astronomical Data Point
What do you think about this data point?
Is it astronomical?

©Copyright 2011 IHI/R. Lloyd

©Copyright 2012 IHI/R. Lloyd
160
180
200
220
240
260
280
300
320
LO
S (m
inut
es)
2/16/11 3/16 4/13 5/11 6/8
Week
Mea
sure
Time
Points on the Median
(don’t count these when counting the number of runs)
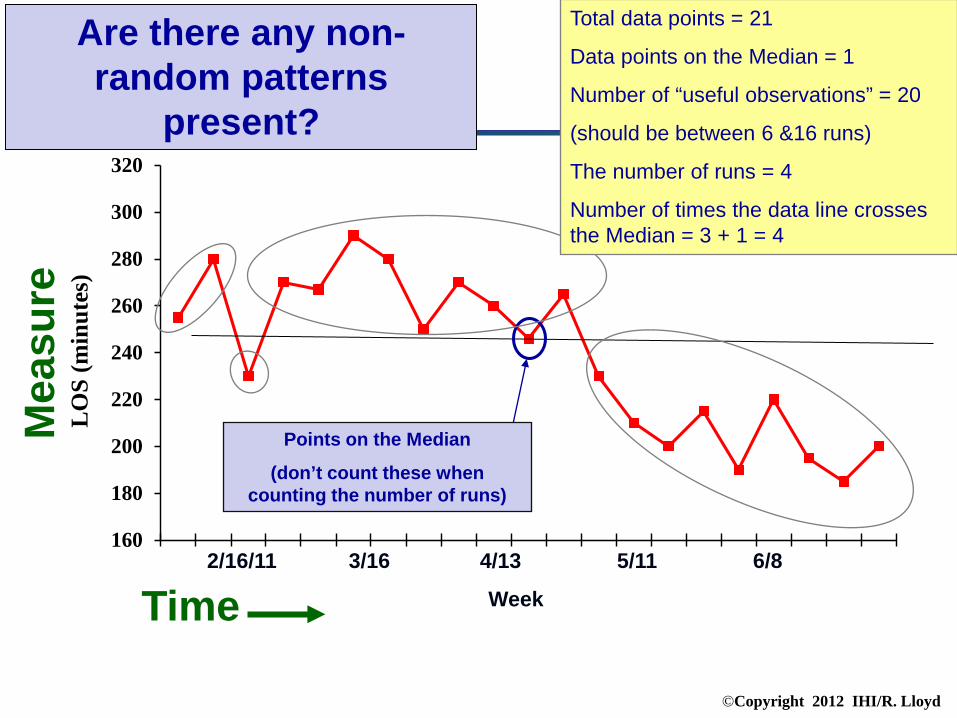
Are there any non-random patterns
present?
Total data points = 21
Data points on the Median = 1
Number of “useful observations” = 20
(should be between 6 &16 runs)
The number of runs = 4
Number of times the data line crosses the Median = 3 + 1 = 4

©Copyright 2012 IHI/R. Lloyd
Rule #3: Too few or too many runs Use this table by first calculating the number of "useful observations" in your data set. This is done by subtracting the number of data points on the median from the total number of data points. Then, find this number in the first column. The lower number of runs is found in the second column. The upper number of runs can be found in the third column. If the number of runs in your data falls below the lower limit or above the upper limit then this is a signal of a special cause. # of Useful Lower Number Upper Number Observations of Runs of Runs
15 5 12 16 5 13 17 5 13 18 6 14 19 6 15 20 6 16 21 7 16 22 7 17 23 7 17 24 8 18 25 8 18 26 9 19 27 10 19 28 10 20 29 10 20 30 11 21
Total data points Total useful observations
©Copyright 2012 IHI/R. Lloyd
160
180
200
220
240
260
280
300
320
LO
S (m
inut
es)
2/16/11 3/16 4/13 5/11 6/8
Week
Mea
sure
Time
Points on the Median
(don’t count these when counting the number of runs)
Are there any non-random patterns
present?
Total data points = 21
Data points on the Median = 1
Number of “useful observations” = 20
(should be between 6 &16 runs)
The number of runs = 4
Number of times the data line crosses the Median = 3 + 1 = 4

©Copyright 2012 IHI/R. Lloyd
Grundläggande statistik och analys
Exercise Interpreting Run Charts
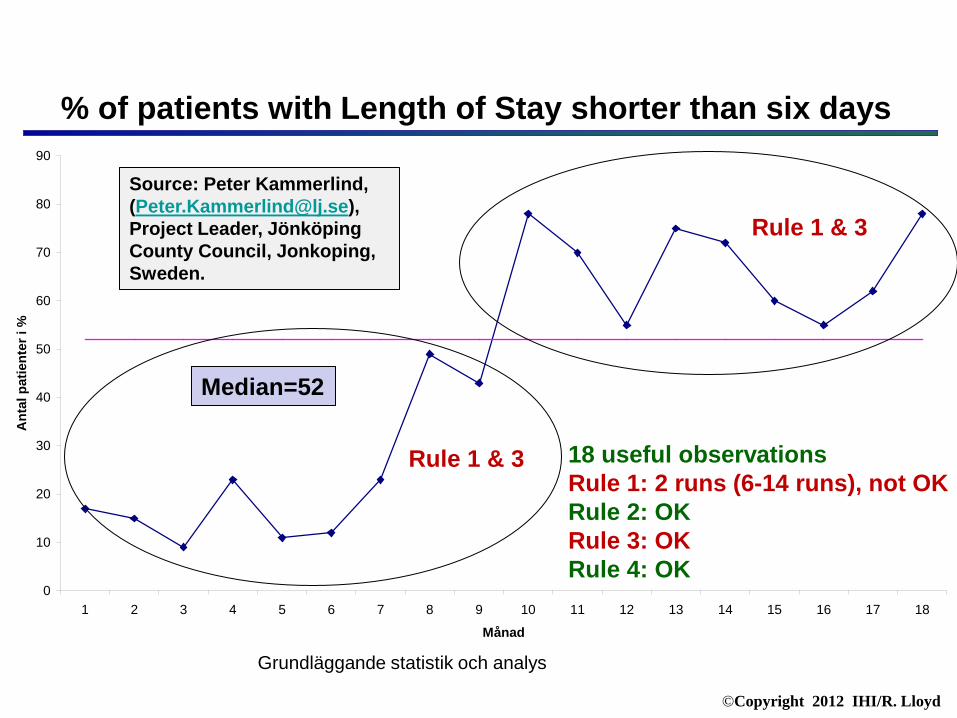
1. % of patients with Length of Stay shorter than six days
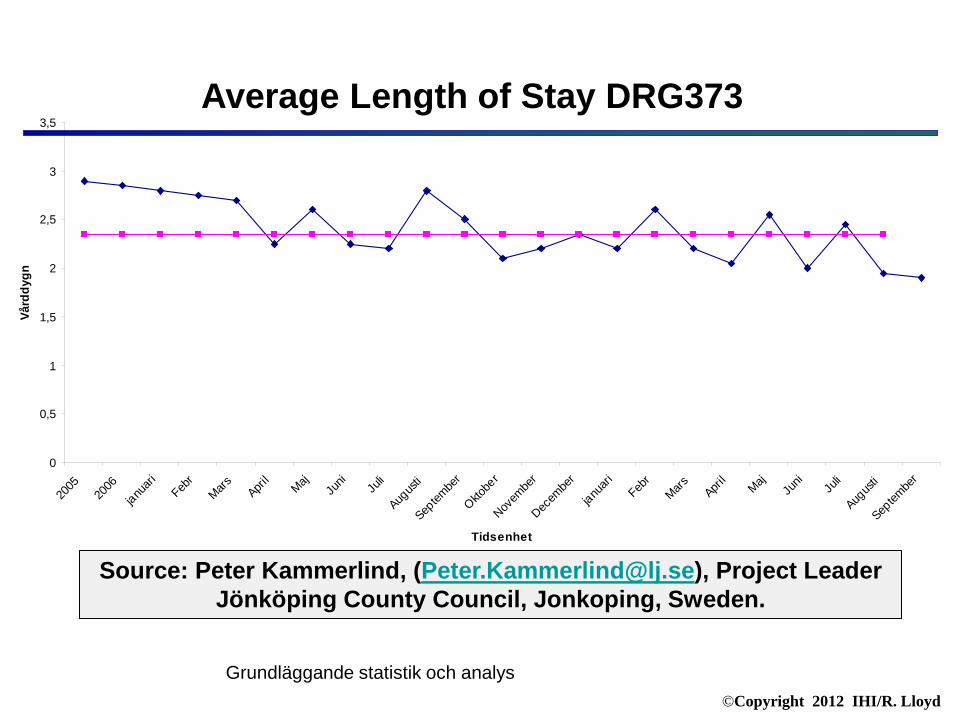
2. Average Length of Stay DRG373
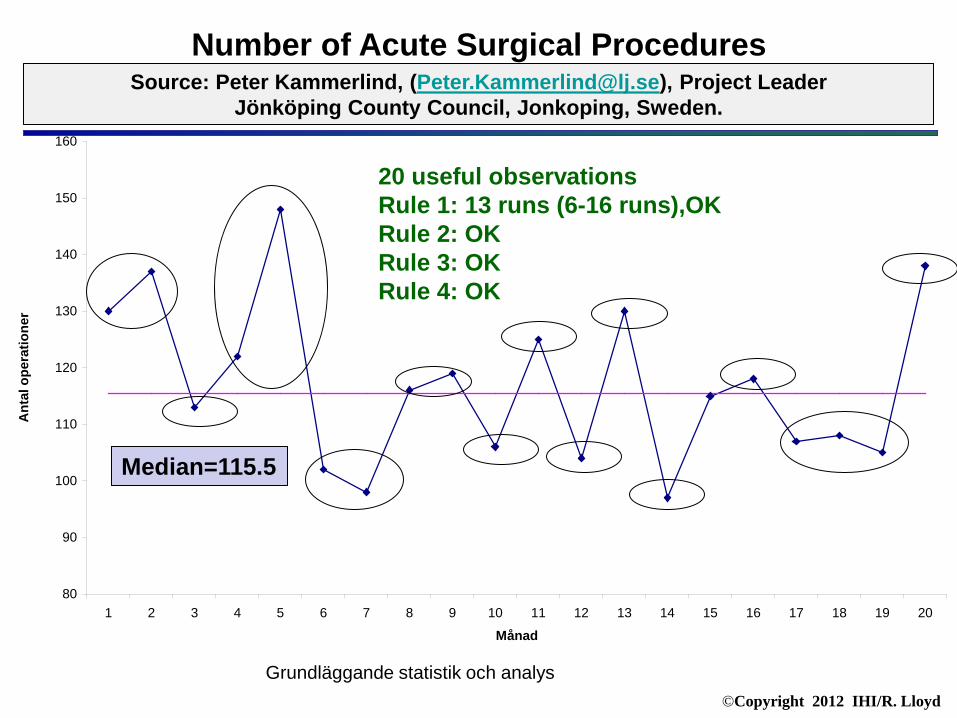
3. Number of Acute Surgical Procedures
Source: Peter Kammerlind, ([email protected]), Project Leader Jönköping County Council, Jonkoping, Sweden.

©Copyright 2012 IHI/R. Lloyd
Mäta för att leda
Antal patienter med vårdtid < 6dygn i % vid primär elektiv knäplastik(operationsdag= dag1)
0
10
20
30
40
50
60
70
80
90
1 2 3 4 5 6 7 8 9 10 11 12 13 14 15 16 17 18
Månad
Ant
al p
atie
nter
i %
Source: Peter Kammerlind, ([email protected]), Project Leader Jönköping County Council, Jonkoping, Sweden.
% of patients with Length of Stay shorter than six days
©Copyright 2012 IHI/R. Lloyd
Grundläggande statistik och analys
Antal patienter med vårdtid < 6dygn i % vid primär elektiv knäplastik(operationsdag= dag1)
0
10
20
30
40
50
60
70
80
90
1 2 3 4 5 6 7 8 9 10 11 12 13 14 15 16 17 18
Månad
Ant
al p
atie
nter
i %
Median=52
18 useful observations Rule 1: 2 runs (6-14 runs), not OK Rule 2: OK Rule 3: OK Rule 4: OK
Rule 1 & 3
% of patients with Length of Stay shorter than six days
Source: Peter Kammerlind, ([email protected]), Project Leader, Jönköping County Council, Jonkoping, Sweden.
Rule 1 & 3
©Copyright 2012 IHI/R. Lloyd
Grundläggande statistik och analys
Sekvensdiagram DRG 373
0
0,5
1
1,5
2
2,5
3
3,5
2005
2006
januari
Febr
Mars April
MajJu
ni Juli
Augus
ti
Septem
ber
Oktobe
r
Novem
ber
Decem
ber
januari
Febr
Mars April
MajJu
ni Juli
Augus
ti
Septem
ber
Tidsenhet
Vård
dygn
Average Length of Stay DRG373
Source: Peter Kammerlind, ([email protected]), Project Leader Jönköping County Council, Jonkoping, Sweden.

©Copyright 2012 IHI/R. Lloyd
Grundläggande statistik och analys
Sekvensdiagram DRG 373
0
0,5
1
1,5
2
2,5
3
3,5
2005
2006
januari
Febr
Mars April
MajJu
ni Juli
Augus
ti
Septem
ber
Oktobe
r
Novem
ber
Decem
ber
januari
Febr
Mars April
MajJu
ni Juli
Augus
ti
Septem
ber
Tidsenhet
Vård
dygn
Median=2.35 22 useful observations Rule 1: 12 runs (7-17 runs), OK Rule 2: not OK Rule 3: OK Rule 4: OK
Rule 3
Source: Peter Kammerlind, ([email protected]), Project Leader Jönköping County Council, Jonkoping, Sweden.
Average Length of Stay DRG373

©Copyright 2012 IHI/R. Lloyd
Mäta för att leda
Akut kirurgi
80
90
100
110
120
130
140
150
160
1 2 3 4 5 6 7 8 9 10 11 12 13 14 15 16 17 18 19 20
Månad
Ant
al o
pera
tione
r
Source: Peter Kammerlind, ([email protected]), Project Leader Jönköping County Council, Jonkoping, Sweden.
Number of Acute Surgical Procedures
©Copyright 2012 IHI/R. Lloyd
Grundläggande statistik och analys
Median=115.5
Akut kirurgi
80
90
100
110
120
130
140
150
160
1 2 3 4 5 6 7 8 9 10 11 12 13 14 15 16 17 18 19 20
Månad
Ant
al o
pera
tione
r
20 useful observations Rule 1: 13 runs (6-16 runs),OK Rule 2: OK Rule 3: OK Rule 4: OK
Number of Acute Surgical Procedures Source: Peter Kammerlind, ([email protected]), Project Leader
Jönköping County Council, Jonkoping, Sweden.

©Copyright 2012 IHI/R. Lloyd
Your next move…
…to gain more knowledge about Shewhart Charts
(a.k.a. control charts)

©Copyright 2012 IHI/R. Lloyd
Why are Shewhart Charts preferred over Run Charts?
Because Shewhart Charts… 1. Are more sensitive than run charts
A run chart cannot detect special causes that are due to point-to-point variation (median versus the mean)
Tests for detecting special causes can be used with Shewhart charts
2. Have the added feature of control limits, which allow us to determine if the process is stable (common cause variation) or not stable (special cause variation).
3. Can be used to define process capability.
4. Allow us to more accurately predict process behavior and future performance.

©Copyright 2012 IHI/R. Lloyd
Jan01 Mar01 May01 July01 Sept01 Nov01 Jan02 Mar02 May02 July02 Sept02 Nov02
Month
Num
ber o
f Com
plai
nts
5.0
10.0
15.0
20.0
25.0
30.0
35.0
40.0
45.0
50.0
A
B
C
C
B
A
UCL=44.855
CL=29.250
LCL=13.645
Elements of a Shewhart Chart
X (Mean)
Mea
sure
Time
An indication of a special cause
(Upper Control Limit)
(Lower Control Limit)

©Copyright 2012 IHI/R. Lloyd
©Copyright 2012 IHI/R. Lloyd
Run and Shewhart Charts don’t tell you
• The reasons(s) for a Special Cause
• Whether or not a Common Cause process should be improved (Is the performance of the process acceptable?)
• How the process should actually be improved or redesigned
©Copyright 2012 IHI/R. Lloyd
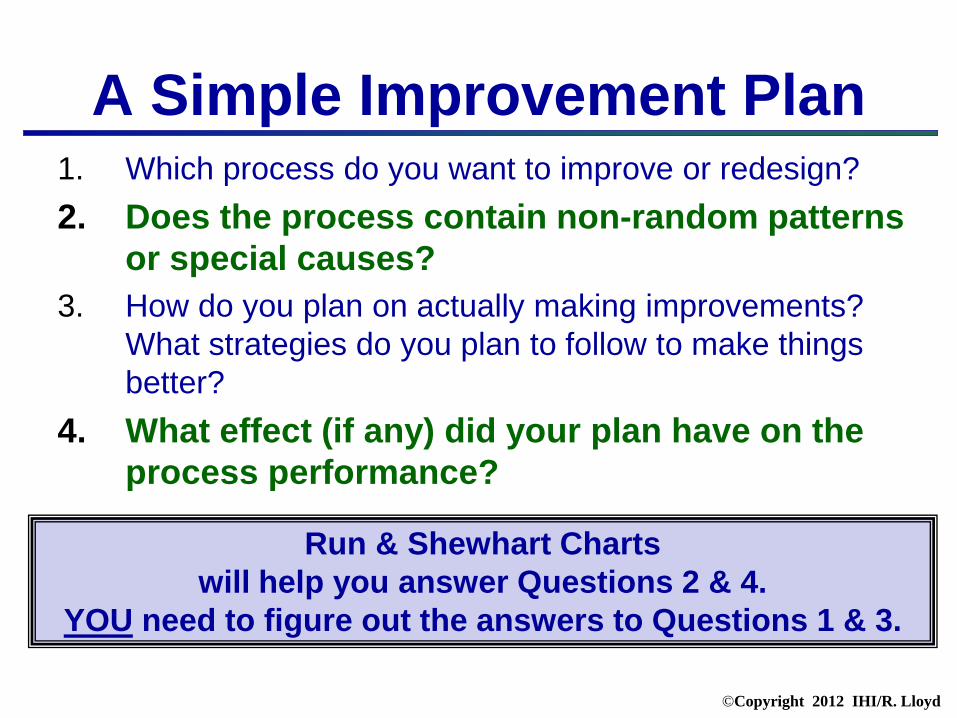
1. Which process do you want to improve or redesign? 2. Does the process contain non-random patterns
or special causes? 3. How do you plan on actually making improvements?
What strategies do you plan to follow to make things better?
4. What effect (if any) did your plan have on the process performance?
Run & Shewhart Charts will help you answer Questions 2 & 4.
YOU need to figure out the answers to Questions 1 & 3.
A Simple Improvement Plan

©Copyright 2012 IHI/R. Lloyd
The Sequence of Improvement
Sustaining and Spreading a change to other locations
Developing a change
Implementing a change
Testing a change
Act Plan
Study Do
Theory and Prediction
Test under a variety of conditions
Make part of routine operations

©Copyright 2012 IHI/R. Lloyd
“Quality begins with intent, which
is fixed by management.”
W. E. Deming, Out of the Crisis, p.5
©Copyright 2012 IHI/R. Lloyd
General References on Quality • The Improvement Guide: A Practical Approach to Enhancing Organizational
Performance. G. Langley, K. Nolan, T. Nolan, C. Norman, L. Provost. Jossey-Bass Publishers., San Francisco, 1996.
• Quality Improvement Through Planned Experimentation. 2nd edition. R. Moen, T. Nolan, L. Provost, McGraw-Hill, NY, 1998.
• The Improvement Handbook. Associates in Process Improvement. Austin, TX, January, 2005.
• A Primer on Leading the Improvement of Systems,” Don M. Berwick, BMJ, 312: pp 619-622, 1996.
• “Accelerating the Pace of Improvement - An Interview with Thomas Nolan,” Journal of Quality Improvement, Volume 23, No. 4, The Joint Commission, April, 1997.

©Copyright 2012 IHI/R. Lloyd
References on Measurement
• Brook, R. et. al. “Health System Reform and Quality.” Journal of the American Medical Association 276, no. 6 (1996): 476-480.
• Carey, R. and Lloyd, R. Measuring Quality Improvement in healthcare: A
Guide to Statistical Process Control Applications. ASQ Press, Milwaukee, WI, 2001.
• Lloyd, R. Quality Health Care: A Guide to Developing and Using
Indicators. Jones and Bartlett Publishers, Sudbury, MA, 2004.
• Nelson, E. et al, “Report Cards or Instrument Panels: Who Needs What? Journal of Quality Improvement, Volume 21, Number 4, April, 1995.
• Solberg. L. et. al. “The Three Faces of Performance Improvement: Improvement, Accountability and Research.” Journal of Quality Improvement 23, no.3 (1997): 135-147.

©Copyright 2012 IHI/R. Lloyd
References on Measurement (continued)
Benneyan, J., Lloyd, R. and Plsek, P. “Statistical process control as a tool for research and healthcare improvement” Quality and Safety in Health Care 2003;12:458–464 Berwick, Donald M., 1991, Controlling Variation in Health Care: A Consultation from Walter Shewhart, Medical Care, Vol. 29, No. 12, December 1991. Carey, Raymond G. 2003. Improving Healthcare with Control Charts. ASQ Press, Milwaukee. Nolan, Tom W. and Provost, Lloyd P., 1990. "Understanding Variation." Quality Progress. May, 1990. Norman, Clifford and Provost, Lloyd, 1990, "Variation Through the Ages," Quality Progress, Special Variation Issue, ASQC, Milwaukee, December, 1990. p 39-44. Shewhart, W. A. (1931). Economic Control of Quality of Manufactured Product. New York: D. Van Nostrand Company (reprinted by the American Society for Quality Control, 1980). Shewhart, W. A. 1939. Statistical Method from the Viewpoint of Quality Control. Washington, D.C.: The Graduate School of the Department of Agriculture.

Robert Lloyd, Ph.D. Executive Director Performance Improvement
can be reached at:
The Institute for Healthcare Improvement (630) 717-5383 Chicago office
(630) 717-8564 fax