walter a shewhart
TRANSCRIPT
1
Apparel Quality Management
Presentation onWalter A. Shewhart
National Institute of Fashion Technology, Gandhinagar
Copyright 2010: Esha Gupta || Nandini Gaur || Preksha Sharma || Saumya Mehrotra
2
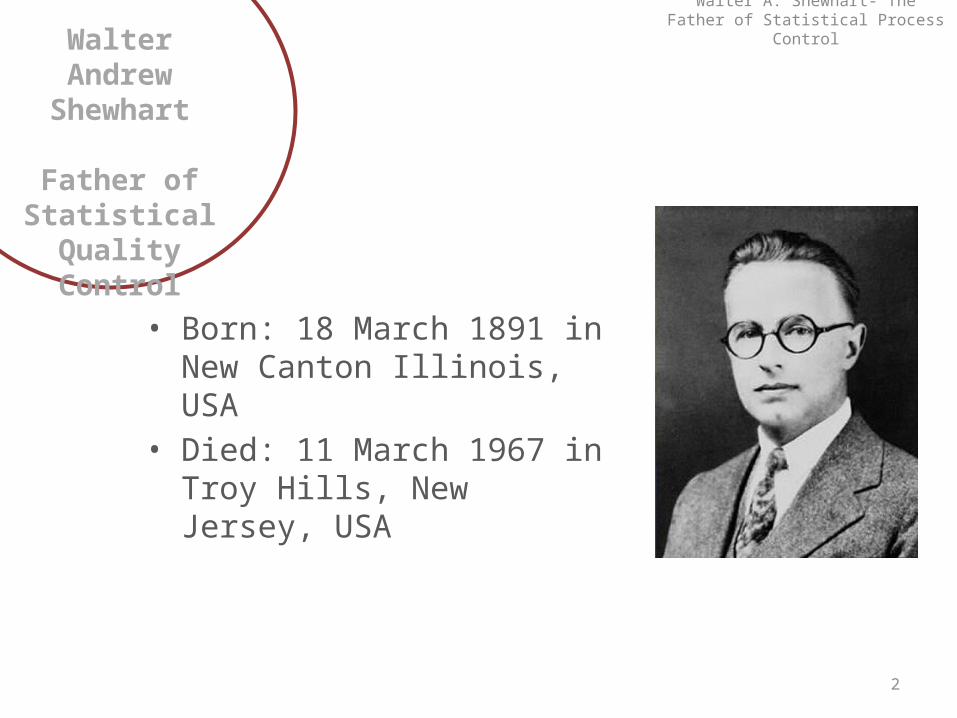
Walter Andrew
Shewhart
Father of Statistical
Quality Control
• Born: 18 March 1891 in New Canton Illinois, USA
• Died: 11 March 1967 in Troy Hills, New Jersey, USA
Walter A. Shewhart- The Father of Statistical Process Control

3
Brief
One of the most notable contributors to modern industry is
Walter Shewhart, a quality control pioneer. He started his rise
to guru status as a Bell Telephone employee in 1918. Born in
New Canton, Illinois in 1891, Shewhart set precedents that
would be referenced for years to come in establishing the
importance of information distribution among quality
managers and production personnel.
Walter A. Shewhart- The Father of Statistical Process Control
4
In 1918 Shewhart joined the Western Electric Company to assist
their engineers in improving the quality of telephone hardware.
Western Electric produced hardware for the Bell Telephone
Company, which became the American Telephone and Telegraph
Company (AT&T). The Western Electric Company manufactured
telephone equipment for them and since 1905 its major plant was
the Hawthorne Plant in Cicero, a suburb of Chicago. The company
and its factory grew rapidly with the need for telephones. By 1913
there were 14000 employees and by 1930 there were 43000. It
was one of the largest manufacturing plants in the country.
Shewart worked at Hawthorne until 1925 when he moved to the
Bell Telephone Research Laboratories where he remained until his
retirement in 1956.
Cont.Walter A. Shewhart- The Father of
Statistical Process Control
5
Shewhart, Juran & Deming
While at Hawthorne, Shewhart met and influenced W
Edwards Deming who went on to champion Shewhart's
methods. Joseph Juran also worked at Hawthorne from 1924
to 1941 and was influenced by Shewhart. Shewhart, Deming,
and Juran are often considered to be the three founders of
the quality improvement movement.
Walter A. Shewhart- The Father of Statistical Process Control

6
Achievements & Honors
In his obituary for the American Statistical Association, Deming wrote of
Shewhart:
“As a man, he was gentle, genteel, never ruffled, never off his dignity. He
knew disappointment and frustration, through failure of many writers in
mathematical statistics to understand his point of view.”
He was founding editor of the Wiley Series in Mathematical Statistics, a
role that he maintained for twenty years, always championing freedom
of speech and confident to publish views at variance with his own.
Walter A. Shewhart- The Father of Statistical Process Control

7
His Honours included:
•Founding member, fellow and president of
the Institute of Mathematical Statistics;
•Founding member, first honorary member and
first Shewhart Medalist of the American Society
for Quality;
•Fellow and President of the American Statistical
Association;
•Fellow of the International Statistical Institute;
•Honorary fellow of the Royal Statistical Society;
•Holley medal of the American Society of
Mechanical Engineers;
•Honorary Doctor of Science, Indian Statistical
Institute, Calcutta.
Achievements & Honors
Walter A. Shewhart- The Father of Statistical Process Control
8
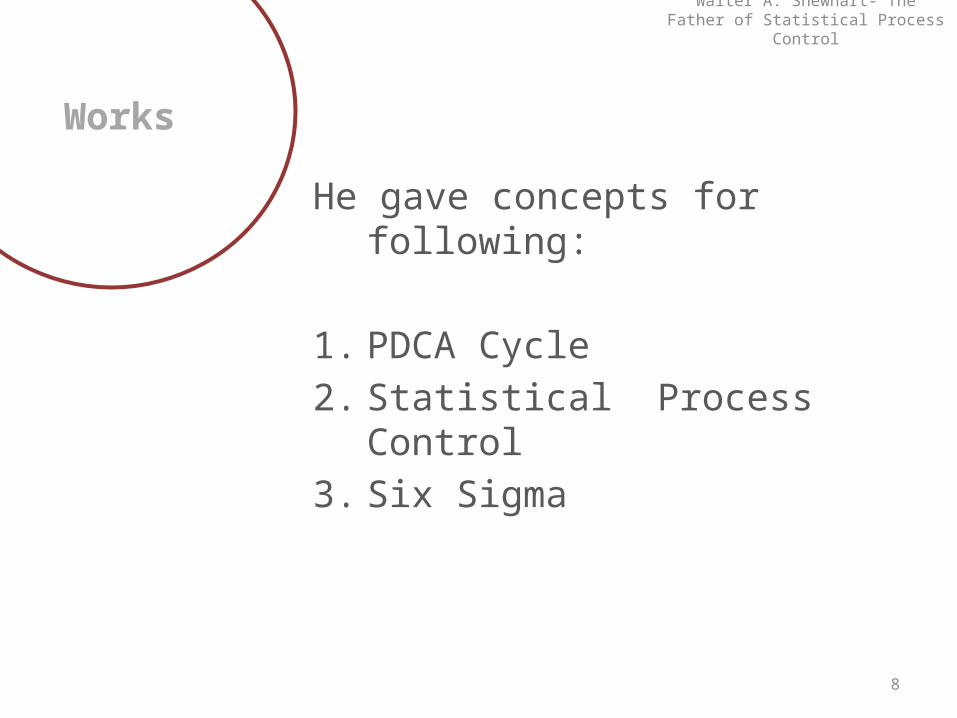
Works
He gave concepts for following:
1. PDCA Cycle2. Statistical Process Control3. Six Sigma
Walter A. Shewhart- The Father of Statistical Process Control
9
PDCA Cycle
The concept of the PDCA Cycle was originally developed by
Walter Shewhart, the pioneering statistician who developed
statistical process control in the Bell Laboratories in the US
during the 1930's. It is often referred to as `the Shewhart
Cycle'. It was taken up and promoted very effectively from the
1950s on by the famous Quality Management authority, W.
Edwards Deming, and is consequently known by many as `the
Deming Wheel'.
Walter A. Shewhart- The Father of Statistical Process Control

10
PDCA Cycle-Uses
PDCA Cycle is used to coordinate your continuous improvement
efforts. It both emphasizes and demonstrates that improvement
programs must start with careful planning, must result in
effective action, and must move on again to careful planning in a
continuous cycle.
The PDCA Cycle diagram is also used in team meetings to take
stock of what stage improvement initiatives are at, and to choose
the appropriate tools to see each stage through to successful
completion.
Walter A. Shewhart- The Father of Statistical Process Control

11
Plan-Do-Check-Act
Four stages of the Cycle:1. Plan to improve your operations
first by finding out what things are going wrong (that is identify the problems faced), and come up with ideas for solving these problems.
2. Do changes designed to solve the problems on a small or experimental scale first. This minimises disruption to routine activity while testing whether the changes will work or not.
Walter A. Shewhart- The Father of Statistical Process Control
12
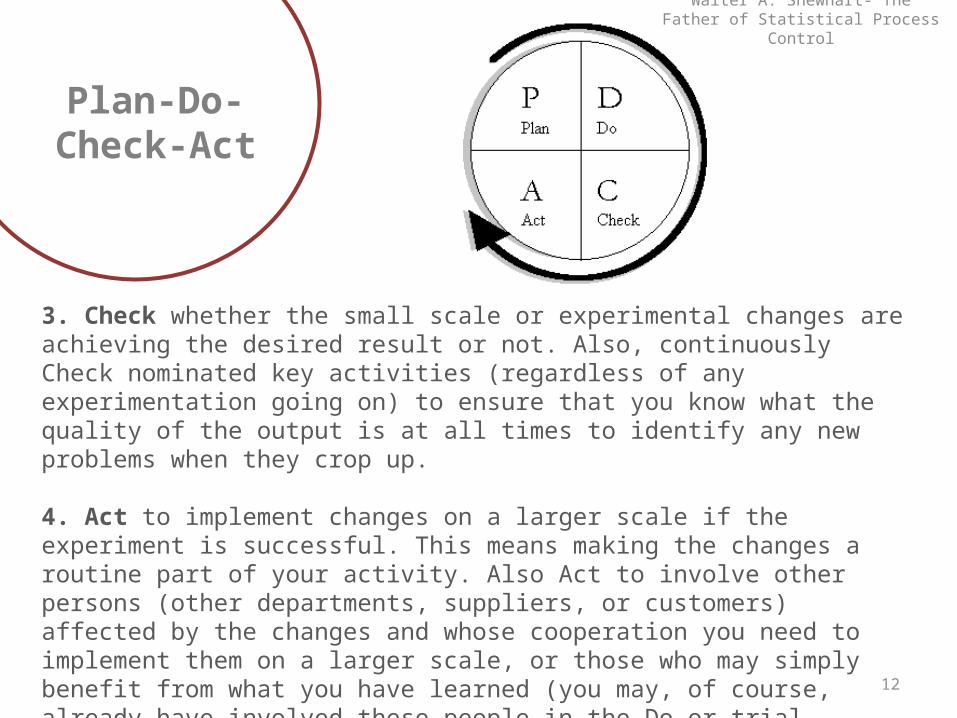
Plan-Do-Check-Act
3. Check whether the small scale or experimental changes are achieving the desired result or not. Also, continuously Check nominated key activities (regardless of any experimentation going on) to ensure that you know what the quality of the output is at all times to identify any new problems when they crop up.
4. Act to implement changes on a larger scale if the experiment is successful. This means making the changes a routine part of your activity. Also Act to involve other persons (other departments, suppliers, or customers) affected by the changes and whose cooperation you need to implement them on a larger scale, or those who may simply benefit from what you have learned (you may, of course, already have involved these people in the Do or trial stage).
Walter A. Shewhart- The Father of Statistical Process Control

13
PDCA Cycle Tools and techniques which can be used to complete each stage of the
PDCA Cycle.
Walter A. Shewhart- The Father of Statistical Process Control

14
Statistical Process Control (SPC)
Walter A. Shewhart defined control as follows:
"A phenomenon will be said to be controlled when, through the use of past experience, we can predict, at least within limits, how the phenomenon may be expected to vary in the future. Here it is understood that prediction within limits means that we can state, at least approximately, the probability that the observed phenomenon will fall within the given limits."
This definition means that control is not equivalent to a complete absence of variation but rather that the system is in a state where variation is predictable within some fixed limit.
Walter A. Shewhart- The Father of Statistical Process Control

15
Statistical Process Control (SPC)
Shewhart also realized that frequent process-adjustment in reaction to non-conformance actually increased variation and degraded quality. That's why he expressed the fundamental rule of statistical process control in this way:
"Variation from common-cause systems should be left to chance, but special causes of variation should be identified and eliminated."
Walter A. Shewhart- The Father of Statistical Process Control

16
Basics of SPC
• Statistical Process Control (SPC)– monitoring production process to
detect and prevent poor quality• Sample
– subset of items produced to use for inspection
• Control Charts– process is within statistical control
limits
UCL
LCL
Walter A. Shewhart- The Father of Statistical Process Control

17
Variability•comm
on causes
•inherent in a process
•can be eliminated only through improvements in the system
Random
•special causes
•due to identifiable factors
•can be modified through operator or management action
Non-Random
Walter A. Shewhart- The Father of Statistical Process Control
18
Example
0Subgroup 5 10 15
5
6
7
8
9
10
Sam
ple
Mean
15
X=7.613
3.0SL=9.844
-3.0SL=5.383
0123456789
Sam
ple
Range
R=3.867
3.0SL=8.176
-3.0SL=0.00E+00
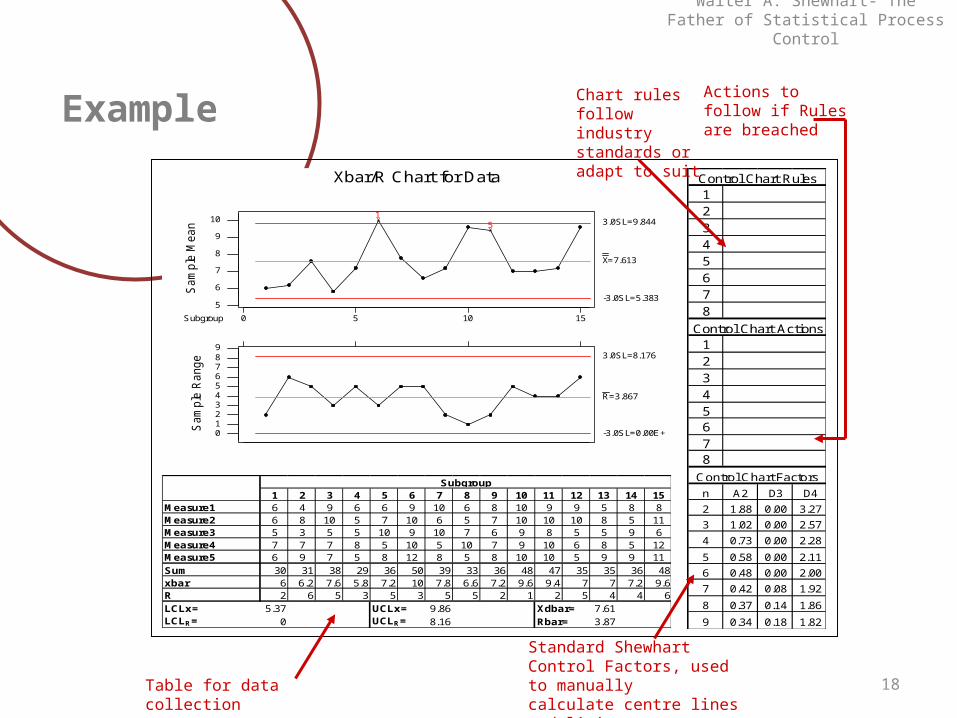
Xbar/R Chart for Data
1 2 3 4 5 6 7 8 9 10 11 12 13 14 15Measure1 6 4 9 6 6 9 10 6 8 10 9 9 5 8 8Measure2 6 8 10 5 7 10 6 5 7 10 10 10 8 5 11Measure3 5 3 5 5 10 9 10 7 6 9 8 5 5 9 6Measure4 7 7 7 8 5 10 5 10 7 9 10 6 8 5 12Measure5 6 9 7 5 8 12 8 5 8 10 10 5 9 9 11Sum 30 31 38 29 36 50 39 33 36 48 47 35 35 36 48xbar 6 6.2 7.6 5.8 7.2 10 7.8 6.6 7.2 9.6 9.4 7 7 7.2 9.6R 2 6 5 3 5 3 5 5 2 1 2 5 4 4 6LCLx= 5.37 UCLx= 9.86 Xdbar= 7.61LCLR= 0 UCLR= 8.16 Rbar= 3.87
Subgroup
12345678
12345678
n A2 D3 D4
2 1.88 0.00 3.27
3 1.02 0.00 2.57
4 0.73 0.00 2.28
5 0.58 0.00 2.11
6 0.48 0.00 2.00
7 0.42 0.08 1.92
8 0.37 0.14 1.86
9 0.34 0.18 1.82
Control Chart Rules
Control Chart Actions
Control Chart Factors
Chart rulesfollow industrystandards oradapt to suit
Actions to follow if Rules are breached
Standard Shewhart Control Factors, used to manuallycalculate centre linesand limits.
Table for data collection
Walter A. Shewhart- The Father of Statistical Process Control
19
SPC in TQM
• Tool for identifying problems and make improvements
• Contributes to the TQM goal of continuous improvements
Walter A. Shewhart- The Father of Statistical Process Control

20
Quality Measures
•a product characteristic that can be evaluated with a discrete response
•good – bad; yes - no
Attribute
•a product characteristic that is continuous and can be measured
•weight - length
Variable
Walter A. Shewhart- The Father of Statistical Process Control
21
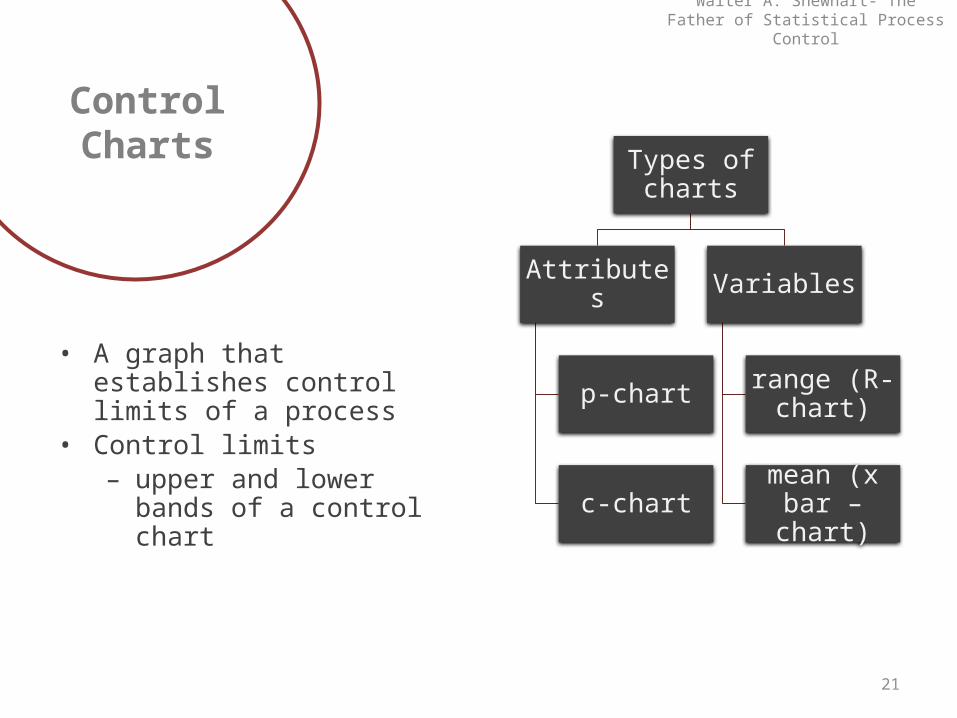
Control Charts
• A graph that establishes control limits of a process
• Control limits– upper and lower bands
of a control chart
Types of charts
Attributes
p-chart
c-chart
Variables
range (R-chart)
mean (x bar – chart)
Walter A. Shewhart- The Father of Statistical Process Control

22
Where to use Control
Charts
• Process has a tendency to go out of control• Process is particularly harmful and costly if it goes out of control• Examples
– at the beginning of a process because it is a waste of time and money to begin production process with bad supplies
– before a costly or irreversible point, after which product is difficult to rework or correct
– before and after assembly or painting operations that might cover defects
– before the outgoing final product or service is delivered
Walter A. Shewhart- The Father of Statistical Process Control

23
Developing Control Charts
Prepare• Choose Measurement• Determine how to collect
data, sample size, and frequency of sampling
• Set up an initial control chart
Collect data• Record data• Calculate appropriate
statistics• Plot statistics on chart
Walter A. Shewhart- The Father of Statistical Process Control
24
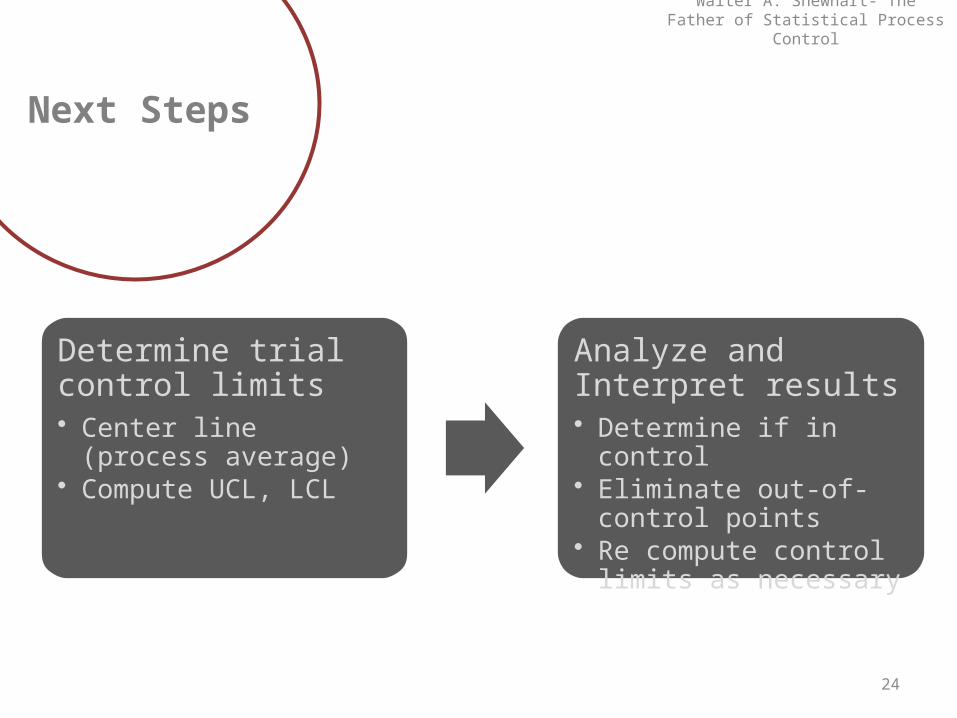
Next Steps
Determine trial control limits• Center line (process
average)• Compute UCL, LCL
Analyze and Interpret results• Determine if in control• Eliminate out-of-control
points• Re compute control
limits as necessary
Walter A. Shewhart- The Father of Statistical Process Control

25
Process Control Charts
1 2 3 4 5 6 7 8 9 10Sample number
Uppercontrol
limit
Processaverage
Lowercontrol
limit
Out of control
Walter A. Shewhart- The Father of Statistical Process Control

26
Normal Distributio
n
=0 1 2 3-1-2-3
95%
99.74%
Walter A. Shewhart- The Father of Statistical Process Control

27
A process is in
control if..
1. No sample points outside limits2. Most points near process average3. About equal number of points
above and below centerline4. Points appear randomly distributed
Walter A. Shewhart- The Father of Statistical Process Control

28
Control Charts for Attributes
• Attribute refers to those quality characteristics that
confirm to specification or do not confirm to specification
• When an attribute does not confirm to specification, diff.
descriptive terms are used.
• A nonconformity is a departure of a quality characteristic
from its product or service not to meet the specification
requirement.
Walter A. Shewhart- The Father of Statistical Process Control
29
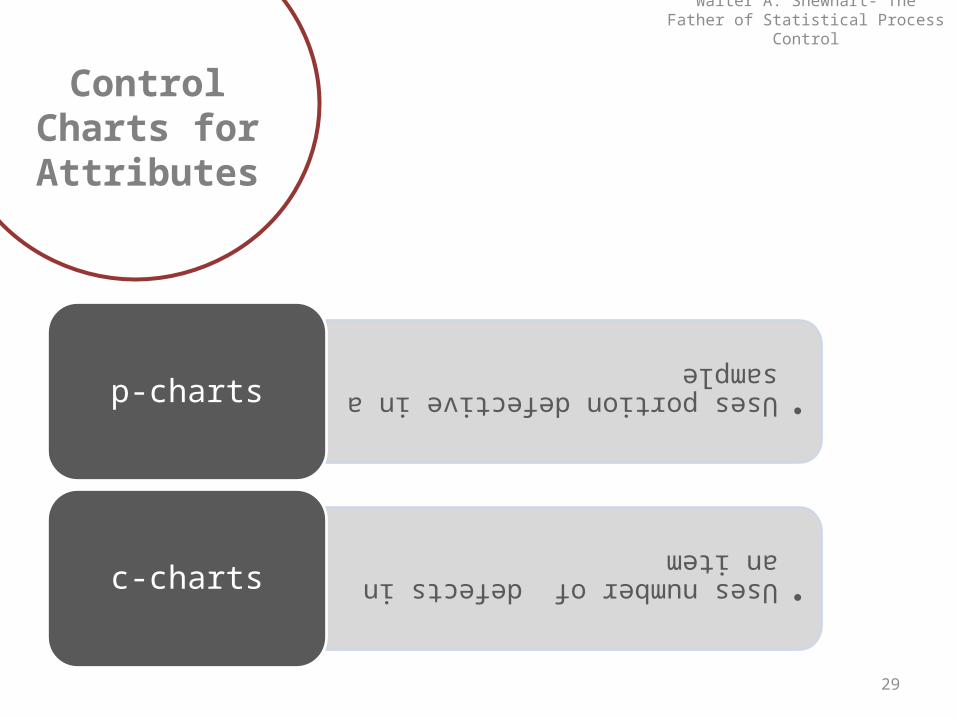
Control Charts for Attributes
•Uses portion defective in a sample
p-charts
•Uses number of defects in an item
c-charts
Walter A. Shewhart- The Father of Statistical Process Control
30
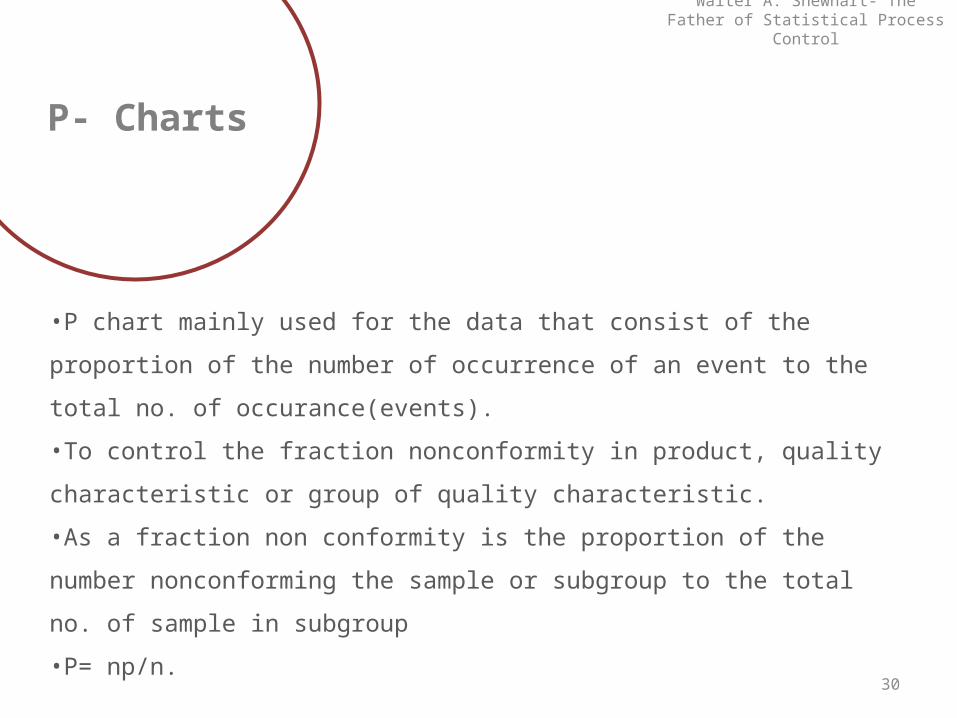
P- Charts
•P chart mainly used for the data that consist of the proportion of the
number of occurrence of an event to the total no. of
occurance(events).
•To control the fraction nonconformity in product, quality characteristic
or group of quality characteristic.
•As a fraction non conformity is the proportion of the number
nonconforming the sample or subgroup to the total no. of sample in
subgroup
•P= np/n.
Walter A. Shewhart- The Father of Statistical Process Control

31
P- Charts
UCL = p + zp
LCL = p - zp
z = number of standard deviations from process averagep = sample proportion defective; an estimate of process averagep = standard deviation of sample proportion
p = p(1 - p)n
Walter A. Shewhart- The Father of Statistical Process Control

32
P- Charts Example
20 samples of 100 pairs of jeans
NUMBER OF PROPORTIONSAMPLE DEFECTIVES DEFECTIVE
1 6 .062 0 .003 4 .04: : :: : :
20 18 .18200
Walter A. Shewhart- The Father of Statistical Process Control

33
P- Chart Example
Cont.
UCL = p + z = 0.10 + 3p(1 - p)n
0.10(1 - 0.10)100
UCL = 0.190
LCL = 0.010
LCL = p - z = 0.10 - 3p(1 - p)n
0.10(1 - 0.10)100
= 200 / 20(100) = 0.10total defectivestotal sample observations
p =
Walter A. Shewhart- The Father of Statistical Process Control

34
P- Chart Example
Cont.
0.02
0.04
0.06
0.08
0.10
0.12
0.14
0.16
0.18
0.20
Pro
port
ion d
efe
ctiv
e
Sample number2 4 6 8 10 12 14 16 18 20
UCL = 0.190
LCL = 0.010
p = 0.10
Walter A. Shewhart- The Father of Statistical Process Control

35
c- Charts
The c-Chart monitors the number of times a condition occurs, relative
to a constant sample size. In this case, a given sample can have more
than one instance of the condition, in which case we count all the
times it occurs in the sample. For our example, we would sample a set
number of transactions each month from all the transactions that
occurred, and from this sample count the total number of errors in all
the transactions. We would then track on the control chart the number
of errors in all the sampled transactions per month.
Walter A. Shewhart- The Father of Statistical Process Control
36
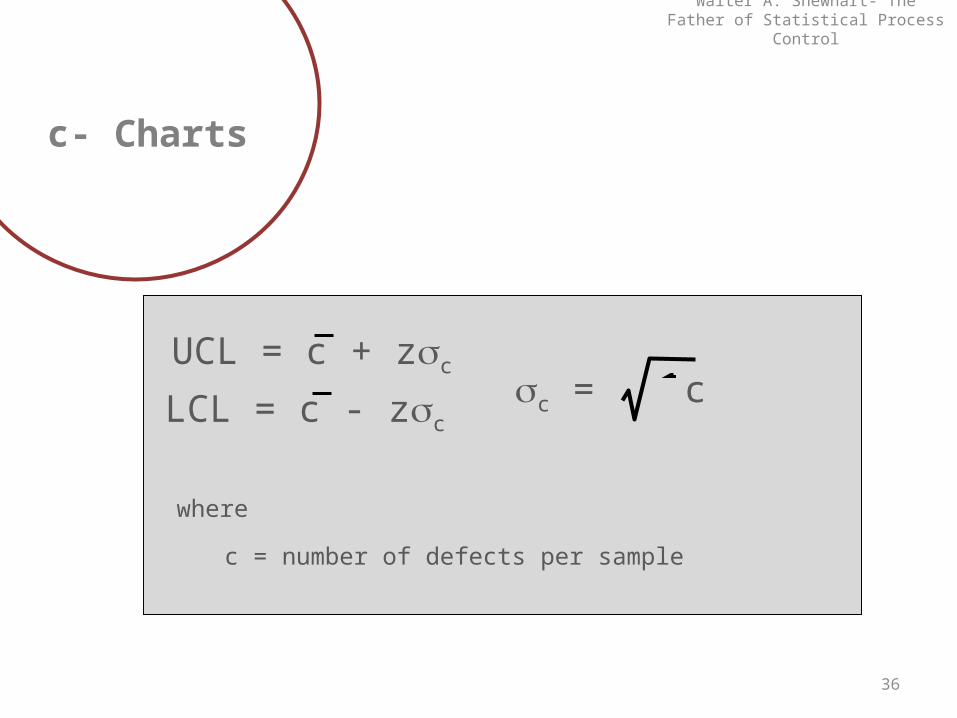
c- Charts
UCL = c + zc
LCL = c - zc
where
c = number of defects per sample
c = c
Walter A. Shewhart- The Father of Statistical Process Control

37
c- Charts cont.
Number of defects in 15 sample rooms
1 122 83 16
: :: :15 15
190
SAMPLE
c = = 12.6719015
UCL = c + zc
= 12.67 + 3 12.67= 23.35
LCL = c + zc
= 12.67 - 3 12.67= 1.99
NUMBER OF DEFECTS
Walter A. Shewhart- The Father of Statistical Process Control

38
c- Charts cont.
3
6
9
12
15
18
21
24N
um
ber
of
defe
cts
Sample number
2 4 6 8 10 12 14 16
UCL = 23.35
LCL = 1.99
c = 12.67
Walter A. Shewhart- The Father of Statistical Process Control

39
Control Charts for Variables
Mean chart ( x -Chart ) uses average of a sample
Range chart ( R-Chart ) uses amount of dispersion
in a sample
Walter A. Shewhart- The Father of Statistical Process Control

40
X- bar chart
x = x1 + x2 + ... xk
k=
UCL = x + A2R LCL = x - A2R= =
where
x = average of sample means
=
Walter A. Shewhart- The Father of Statistical Process Control
41
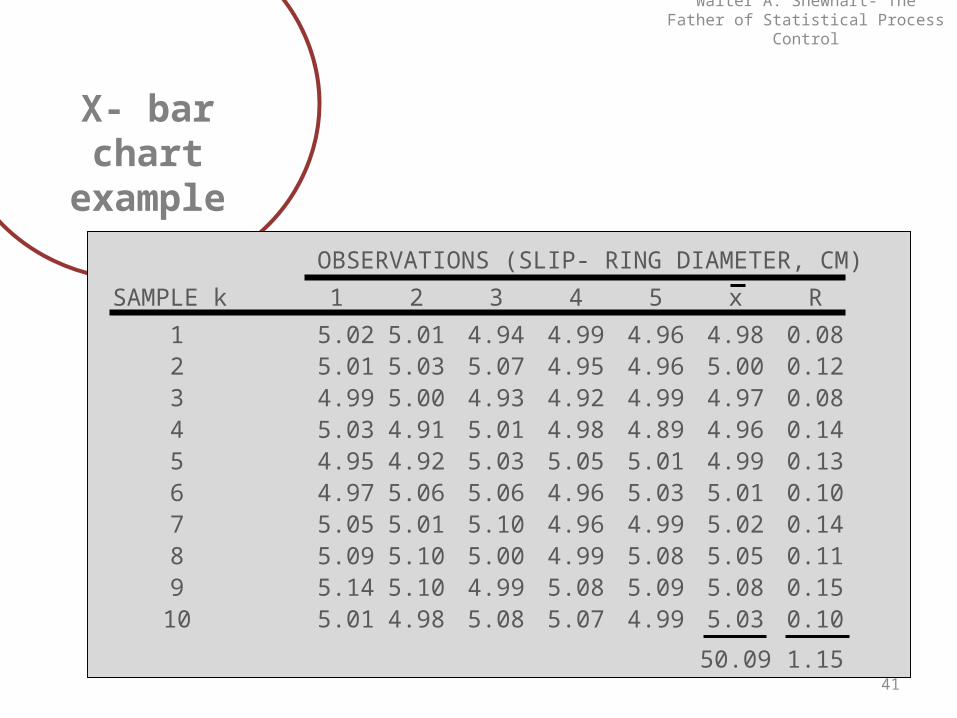
X- bar chart
example
OBSERVATIONS (SLIP- RING DIAMETER, CM)
SAMPLE k 1 2 3 4 5 x R
1 5.02 5.01 4.94 4.99 4.96 4.98 0.082 5.01 5.03 5.07 4.95 4.96 5.00 0.123 4.99 5.00 4.93 4.92 4.99 4.97 0.084 5.03 4.91 5.01 4.98 4.89 4.96 0.145 4.95 4.92 5.03 5.05 5.01 4.99 0.136 4.97 5.06 5.06 4.96 5.03 5.01 0.107 5.05 5.01 5.10 4.96 4.99 5.02 0.148 5.09 5.10 5.00 4.99 5.08 5.05 0.119 5.14 5.10 4.99 5.08 5.09 5.08 0.1510 5.01 4.98 5.08 5.07 4.99 5.03 0.10
50.09 1.15
Walter A. Shewhart- The Father of Statistical Process Control

42
X- bar chart
example cont.
UCL = x + A2R = 5.01 + (0.58)(0.115) =
5.08
LCL = x - A2R = 5.01 - (0.58)(0.115) =
4.94
=
=
x = = = 5.01 cm= åxk
50.0910
Walter A. Shewhart- The Father of Statistical Process Control

43
Retrieve Factor Value A2
X- bar chart
example cont.
UCL = x + A2R = 5.01 + (0.58)(0.115) = 5.08
LCL = x - A2R = 5.01 - (0.58)(0.115) = 4.94
=
=
x = = = = 5.01 cm= åxk
50.0910
Walter A. Shewhart- The Father of Statistical Process Control

44
X- bar chart
example cont.
UCL = 5.08
LCL = 4.94
Mea
n
Sample number
|1
|2
|3
|4
|5
|6
|7
|8
|9
|10
5.10 –
5.08 –
5.06 –
5.04 –
5.02 –
5.00 –
4.98 –
4.96 –
4.94 –
4.92 –
x = 5.01=
Walter A. Shewhart- The Father of Statistical Process Control

45
R- chart
OBSERVATIONS (SLIP-RING DIAMETER, CM)
SAMPLE k 1 2 3 4 5 x R
1 5.02 5.01 4.94 4.99 4.96 4.98 0.082 5.01 5.03 5.07 4.95 4.96 5.00 0.123 4.99 5.00 4.93 4.92 4.99 4.97 0.084 5.03 4.91 5.01 4.98 4.89 4.96 0.145 4.95 4.92 5.03 5.05 5.01 4.99 0.136 4.97 5.06 5.06 4.96 5.03 5.01 0.107 5.05 5.01 5.10 4.96 4.99 5.02 0.148 5.09 5.10 5.00 4.99 5.08 5.05 0.119 5.14 5.10 4.99 5.08 5.09 5.08 0.1510 5.01 4.98 5.08 5.07 4.99 5.03 0.10
50.09 1.15
Walter A. Shewhart- The Father of Statistical Process Control
46
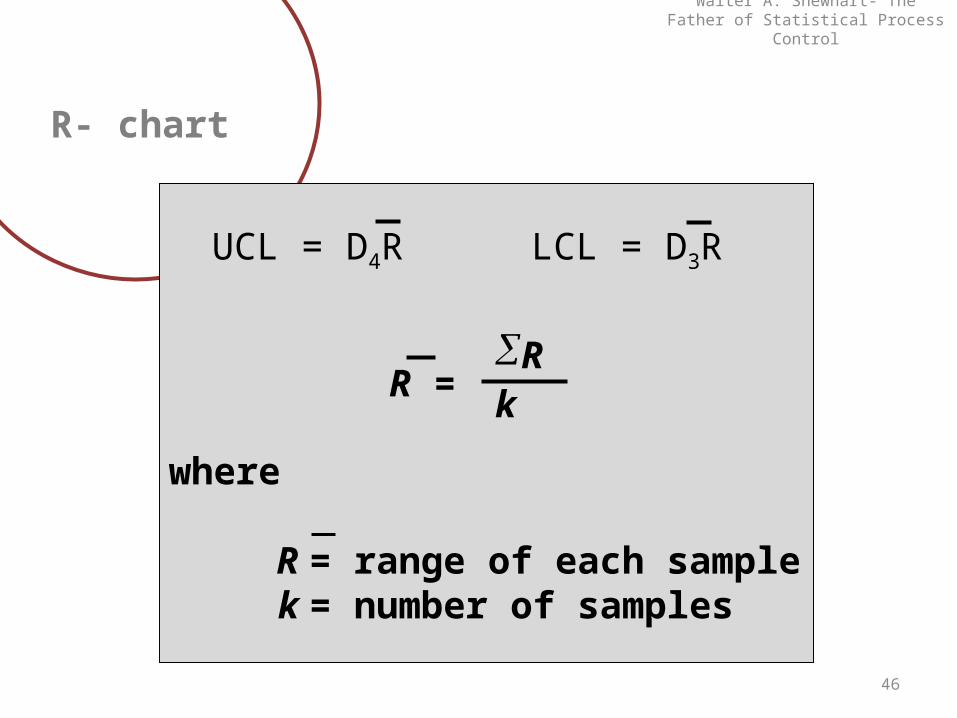
R- chart
UCL = D4R LCL = D3R
R = åRk
where
R = range of each samplek = number of samples
Walter A. Shewhart- The Father of Statistical Process Control
47
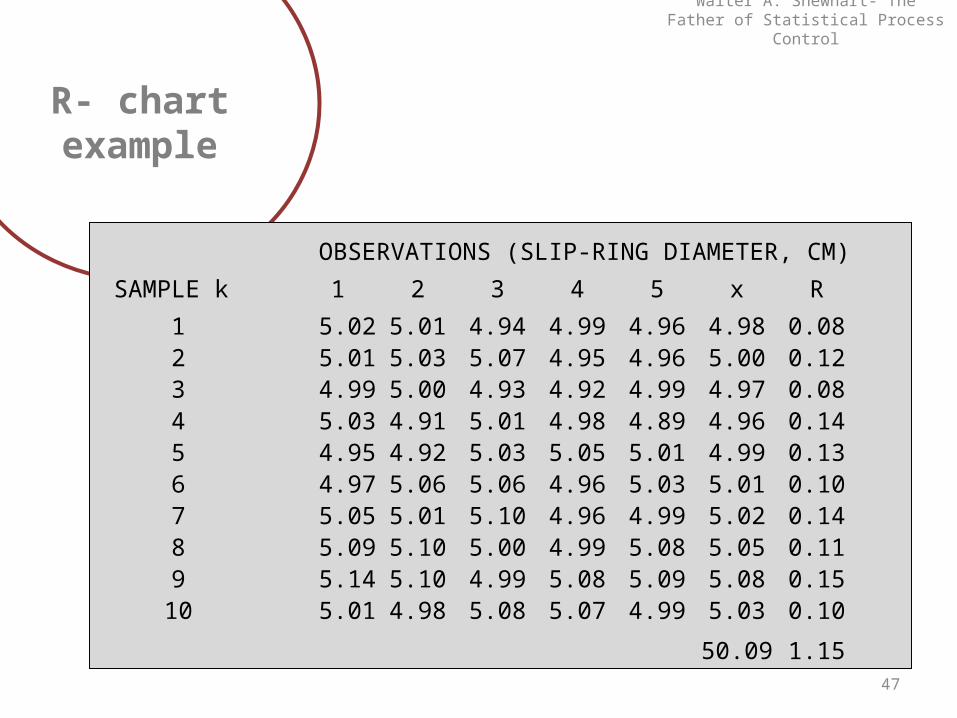
R- chart example
OBSERVATIONS (SLIP-RING DIAMETER, CM)
SAMPLE k 1 2 3 4 5 x R
1 5.02 5.01 4.94 4.99 4.96 4.98 0.082 5.01 5.03 5.07 4.95 4.96 5.00 0.123 4.99 5.00 4.93 4.92 4.99 4.97 0.084 5.03 4.91 5.01 4.98 4.89 4.96 0.145 4.95 4.92 5.03 5.05 5.01 4.99 0.136 4.97 5.06 5.06 4.96 5.03 5.01 0.107 5.05 5.01 5.10 4.96 4.99 5.02 0.148 5.09 5.10 5.00 4.99 5.08 5.05 0.119 5.14 5.10 4.99 5.08 5.09 5.08 0.1510 5.01 4.98 5.08 5.07 4.99 5.03 0.10
50.09 1.15
Walter A. Shewhart- The Father of Statistical Process Control

48
R- chart example
cont.
åRk
R = = = 0.115 1.1510
UCL = D4R = 2.11(0.115) = 0.243
LCL = D3R = 0(0.115) = 0
Retrieve Factor Values D3 and D4
Walter A. Shewhart- The Father of Statistical Process Control

49
R- chart example
cont.
UCL = 0.243
LCL = 0
Ran
ge
Sample number
R = 0.115
|1
|2
|3
|4
|5
|6
|7
|8
|9
|10
0.28 –
0.24 –
0.20 –
0.16 –
0.12 –
0.08 –
0.04 –
0 –
Walter A. Shewhart- The Father of Statistical Process Control
50
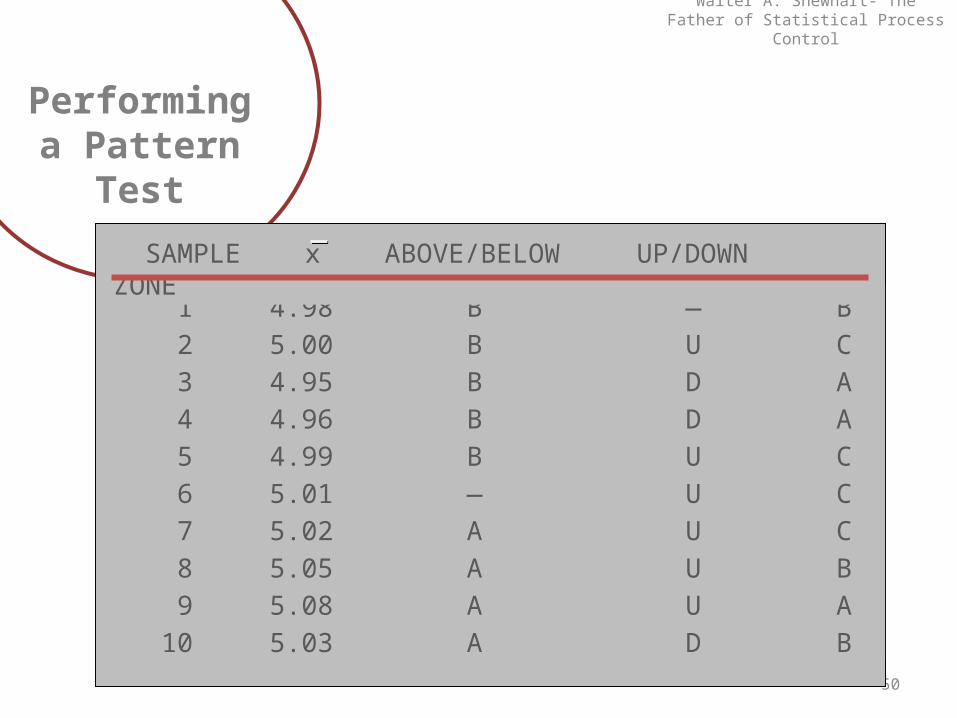
Performing a Pattern
Test
1 4.98 B — B2 5.00 B U C3 4.95 B D A4 4.96 B D A5 4.99 B U C6 5.01 — U C7 5.02 A U C8 5.05 A U B9 5.08 A U A
10 5.03 A D B
SAMPLE x ABOVE/BELOW UP/DOWNZONE
Walter A. Shewhart- The Father of Statistical Process Control

51
Sample Test
• Attribute charts require larger sample sizes- 50 to 100 parts in a sample
• Variable charts require smaller samples- 2 to 10 parts in a sample
Walter A. Shewhart- The Father of Statistical Process Control

52
Appendix
n A2 D3 D4
SAMPLE SIZE FACTOR FOR x-CHART FACTORS FOR R-CHART
2 1.88 0.00 3.273 1.02 0.00 2.574 0.73 0.00 2.285 0.58 0.00 2.116 0.48 0.00 2.007 0.42 0.08 1.928 0.37 0.14 1.869 0.44 0.18 1.82
10 0.11 0.22 1.7811 0.99 0.26 1.7412 0.77 0.28 1.7213 0.55 0.31 1.6914 0.44 0.33 1.6715 0.22 0.35 1.6516 0.11 0.36 1.6417 0.00 0.38 1.6218 0.99 0.39 1.6119 0.99 0.40 1.6120 0.88 0.41 1.59
Walter A. Shewhart- The Father of Statistical Process Control

53
Selected aspects of the work of Shewhart and Deming can be compared witha common element of various six-sigma programs.
Shewhart & Six Sigma
Walter A. Shewhart- The Father of Statistical Process Control

54
• Shewhart explains in the opening paragraph of Statistical Method:“Corresponding to these three steps there are three senses in which statistical control [i.e. process behavior charts] may play an important part in attaining uniformity in the quality of manufactured product: (a) as a concept of a statistical state constituting a limit to
which one may hope to go in improving the uniformity of quality;
(b) as an operation or technique of attaining uniformity; and
(c) as a judgment.”
Shewhart & Six Sigma
Walter A. Shewhart- The Father of Statistical Process Control

55
• The three-sigma limits of a process behavior chart characterize the potential of your process. They define what a predictable process will do, and they approximate what an unpredictable process can be made to do.
Shewhart & Six Sigma
Walter A. Shewhart- The Father of Statistical Process Control

56
Shewhart & Six Sigma
Walter A. Shewhart- The Father of Statistical Process Control

57
Timeline
19941920's 1931 1940's 1943 1950 1960 1970 1980 1990 2000
Shewhart's studies into variation at Bell Telephone LabsShewhart publishes book, "Economic Control of Quality of Manufactured Product Widespread adoption of Shewhart's principles for War-time Production in the US
Ishikawa develops Ishikawa diagram and pioneers use of 7-toolsWidespread abandonment of Shewhart's principles in Post-War US.
Deming teaches Shewhart principles to JapaneseDeming develops management philosophy based on Shewhart concepts own ideas
Japanese extend Deming's teachings, develop the "Total Quality” conceptUSA starts to copy Japan, called TQC (Total Quality Control) eventually the term TQM (Total Quality Management) is used as the label.
US discovers DemingRapid spread TQM principles to US service industries
Pacific basin countries, excluding Australia commence adopting TQMWestern Europe discovers TQM
Developing countries rapidly adopting TQM
Australian services sector copies US with adoption of TQMAustralian manufacturing commences with TQM
Business Process Reengineering
Team based approaches to work gaining broad acceptance in industry
Organisational learning emerging as a key competitive issue
1996
Renewed focus on Process Management
Widespread emergence of Balanced Scorecard
6-sigma goes mainstream
2002
Walter A. Shewhart- The Father of Statistical Process Control

58
Publications
• The Bell Telephone Laboratories were founded in 1925 and
Shewhart moved to them when the Laboratories opened and
worked there until his retirement in 1956.
• He expanded his interests to a broader use of statistics over this
period. During this period he published many articles papers in
the Bell System Technical Journal.
• In addition, he published Random sampling in the American
Mathematical Monthly in 1931. In 1939 he published the
important book Statistical Method from the Viewpoint of Quality
Control.
Walter A. Shewhart- The Father of Statistical Process Control

59
Societies
Shewhart was a founder of the Institute of Mathematical Statistics, being elected a fellow and serving a term as vice-president in 1936 and president from 1936 to 1944. He was also a founder of the American Society for Quality Control. He was elected to a fellowship of the American Statistical Association, of the International Statistical Institute, and of the Royal Statistical Society. He was also elected to the American Association for the Advancement of Science (serving on the council during 1942-49), the Econometric Society, and the New York Academy of Science. He served a term as president of the American Statistical Association in 1945, and was awarded the Holley medal of the American Society of Mechanical Engineers in 1954. The Indian Statistical Institute in Calcutta awarded him an honorary doctorate.
Walter A. Shewhart- The Father of Statistical Process Control
60
Shewhart Medal
The Shewhart Medal is awarded for technical leadership: “The
Shewhart Medal committee may designate, not more often than
once each year, that nominee, not previously so designated,
who is deemed by it to have demonstrated the most
outstanding technical leadership in the field of modern quality
control, especially through the development to its theory,
principles, and techniques...”(ASQ bylaws)
The Society made him their first honorary member in 1947 and
also made him the first to receive their Shewhart Medal.
Walter A. Shewhart- The Father of Statistical Process Control

61
Shewhart’s visit to India
The ISI also played a pioneering role in starting the Statistical
Quality Control (SQC) movement in India by organising a visit of
Professor W.A. Shewhart, the father of SQC, to India in
November 1947
Walter A. Shewhart- The Father of Statistical Process Control

62
References
•http://www-groups.dcs.st-and.ac.uk/~history/Biographies/Shewhart.html
•http://mospi.nic.in/arep0003_chapter7.pdf
http://walter-a-shewart.blogspot.com/
•http://asq.org/about-asq/who-we-are/bio_shewhart.html
•http://www.jstor.org/pss/25047976
•http://www.eolss.net/ebooks/Sample%20Chapters/C02/E6-02-05-04.pdf
•http://www-groups.dcs.st-and.ac.uk/~history/Biographies/Shewhart.html
Walter A. Shewhart- The Father of Statistical Process Control

63
Walter A. Shewhart- The Father of Statistical Process Control
Thank You