“what is the variation in one system over time?” · pdf file“what is the...
TRANSCRIPT

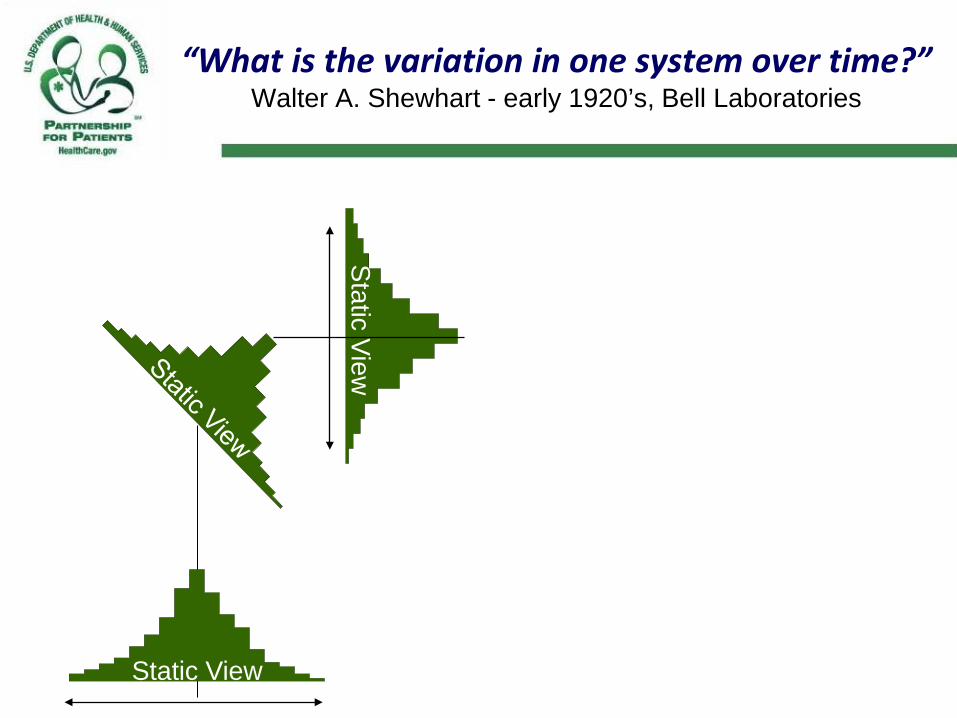
“What is the variation in one system over time?” Walter A. Shewhart - early 1920’s, Bell Laboratories
Static View

“What is the variation in one system over time?” Walter A. Shewhart - early 1920’s, Bell Laboratories
Static View
“What is the variation in one system over time?” Walter A. Shewhart - early 1920’s, Bell Laboratories
Static View
Static View
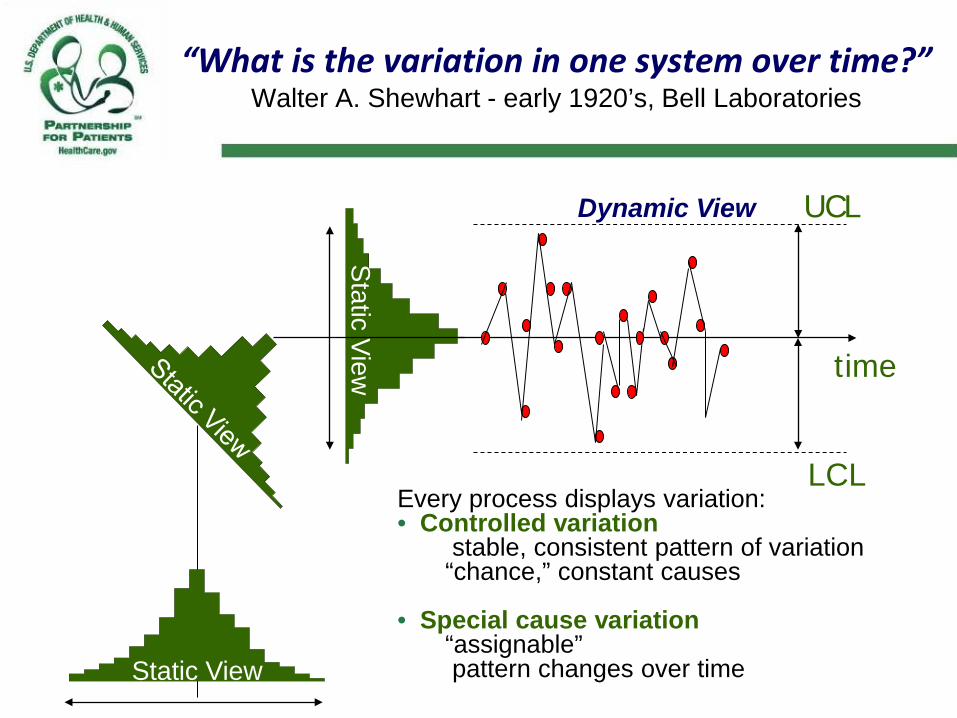
“What is the variation in one system over time?” Walter A. Shewhart - early 1920’s, Bell Laboratories
Every process displays variation: • Controlled variation
stable, consistent pattern of variation “chance,” constant causes
• Special cause variation “assignable” pattern changes over time
time
UCL Dynamic View
LCL
Static View
Static View

Types of Variation
Common Cause Variation • Is inherent in the design of the
process
• Is due to regular, natural or ordinary causes
• Affects all the outcomes of a process
• Results in a “stable” process that is predictable
• Also known as random or unassignable variation
Special Cause Variation • Is due to irregular or unnatural
causes that are not inherent in the design of the process
• Affect some, but not necessarily all aspects of the process
• Results in an “unstable” process that is not predictable
• Also known as non-random or assignable variation

A Stable Process
A predictable (thus manageable) process exhibits a stable distribution,
when viewed across time.
Successive samples from a stable or random process
differ only by chance
Courtesy of Richard Scoville, PhD, IHI Improvement Advisor

Common Cause Variation
• Points equally likely above or below center line • There will be a high data point and a low, but this is expected • No trends or shifts or other patterns
0
10
20
30
40
50
60
70
80
90
100
3/1/200
8
3/8/200
8
3/15/2
008
3/22/2
008
3/29/2
008
4/5/200
8
4/12/2
008
4/19/2
008
4/26/2
008
5/3/200
8
5/10/2
008
5/17/2
008
5/24/2
008
5/31/2
008
6/7/200
8
Courtesy of Richard Scoville, PhD, IHI Improvement Advisor

A Successful Change is a Special Cause
Intervention
0%10%20%30%40%50%60%70%80%90%
100%
1 2 3 4 5 6 7 8 9 10 11 12 13 14 15
New samples from a successfully changed
process display more than chance variation
Courtesy of Richard Scoville, PhD, IHI Improvement
Advisor

Decision Tree for Managing with Data
Are specialcauses
present?
Are outcomesacceptable?
Do nothingChange the
process
Investigate &eliminate
special causes
No
Yes
Yes No
© Richard Scoville & IHI

Attributes of a Leader Who Understands Variation
Leaders understand the different ways that variation is viewed. They explain changes in terms of common causes and special
causes. They use graphical methods to learn from data and expect
others to consider variation in their decisions and actions. They understand the concept of stable and unstable processes
and the potential losses due to tampering. Capability of a process or system is understood before changes
are attempted.

Week
Num
ber o
f Med
icat
ions
Erro
rs p
er 1
000
Pat
ient
Day
s
0.0
2.5
5.0
7.5
10.0
12.5
15.0
17.5
20.0
22.5
UCL=13.39461
CL=4.42048
LCL=0.00000
Medication Error Rate
Exercise Common and Special Causes of Variation
• Select several measures your organization is tracking for the HEN Collaborative.
• Do you and the leaders of your organization evaluate these measures according the criteria for common and special causes of variation?
• If not, what criteria do you use to determine if data are improving or getting worse?
12/9
5
2/96
4/96
6/96
8/96
10/9
6
12/9
6
2/97
4/97
6/97
8/97
10/9
7
12/9
7
2/98
4/98
6/98
8/98
10/9
8
12/9
8
2/99
4/99
6/99
month
Per
cent
C-s
ectio
ns
0.0
5.0
10.0
15.0
20.0
25.0
30.0
35.0
UCL=27.7018
CL=18.0246
LCL=8.3473
Percent of Cesarean Sections Performed Dec 95 - Jun 99
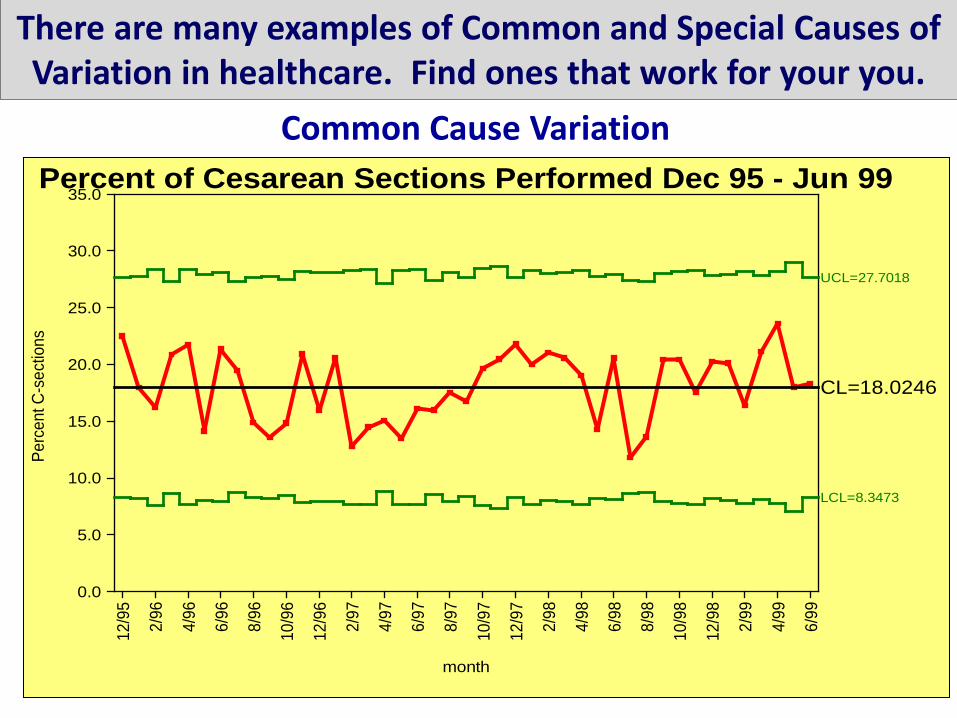
There are many examples of Common and Special Causes of Variation in healthcare. Find ones that work for your you.
Common Cause Variation 12
/95
2/96
4/96
6/96
8/96
10/9
6
12/9
6
2/97
4/97
6/97
8/97
10/9
7
12/9
7
2/98
4/98
6/98
8/98
10/9
8
12/9
8
2/99
4/99
6/99
month
Perc
ent C
-sec
tions
0.0
5.0
10.0
15.0
20.0
25.0
30.0
35.0
UCL=27.7018
CL=18.0246
LCL=8.3473
Percent of Cesarean Sections Performed Dec 95 - Jun 99

Special Cause Variation
Week
Num
ber o
f Med
icatio
ns E
rrors
per
100
0 Pa
tient
Day
s
0.0
2.5
5.0
7.5
10.0
12.5
15.0
17.5
20.0
22.5
UCL=13.39461
CL=4.42048
LCL=0.00000
Medication Error Rate
There are many examples of Common and Special Causes of Variation in healthcare. Find ones that work for your you.
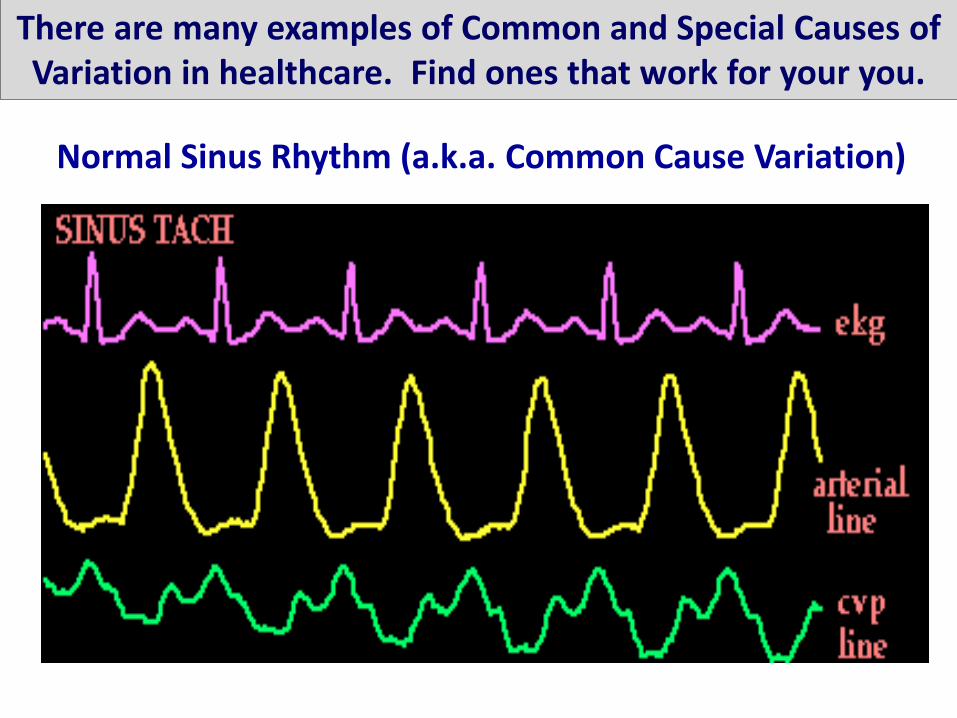
Normal Sinus Rhythm (a.k.a. Common Cause Variation)
There are many examples of Common and Special Causes of Variation in healthcare. Find ones that work for your you.

Atrial Flutter Rhythm (a.k.a. Special Cause Variation)
There are many examples of Common and Special Causes of Variation in healthcare. Find ones that work for your you.

How do we analyze variation for quality improvement?
Run and Control Charts are the best tools to determine
if our improvement strategies have had the
desired effect.
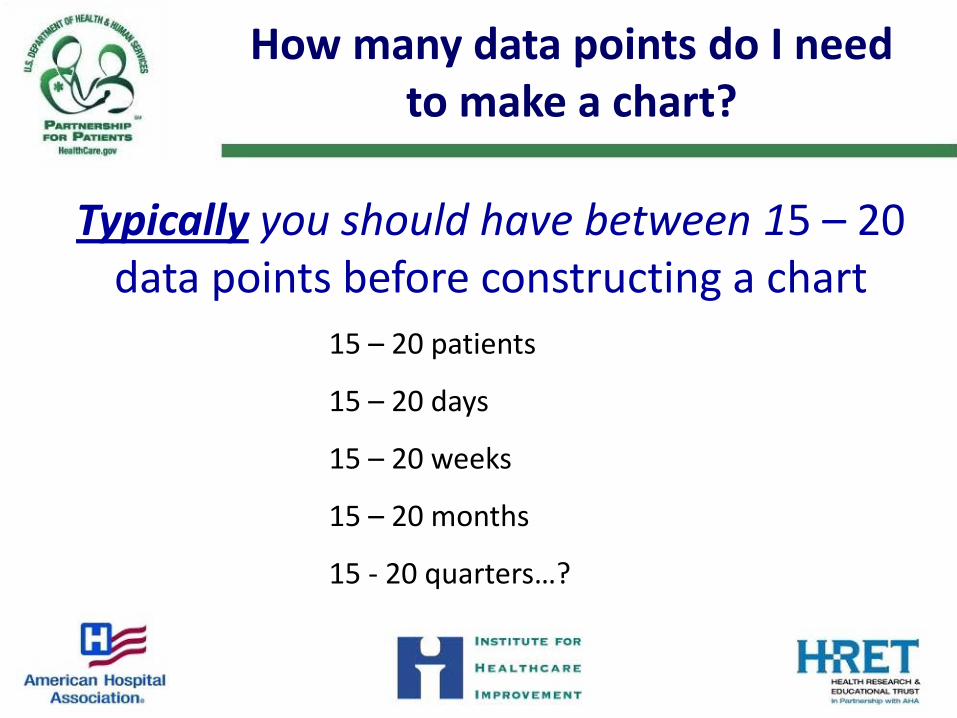
How many data points do I need to make a chart?
Typically you should have between 15 – 20 data points before constructing a chart
15 – 20 patients
15 – 20 days
15 – 20 weeks
15 – 20 months
15 - 20 quarters…?

Guiding Principles for Creating Charts
• If you have less than 10 data points, make a simple line graph to see where the data points are going.
• If you have 10 and 12 data points you can convert the simple line graph to a run chart (place the median on the line graph and apply the run chart rules).
• When you have 12 -15 data points you can calculate a control chart but you should note that the control limits are “trial control limits.”
©Copyright 2012 IHI/R. Lloyd
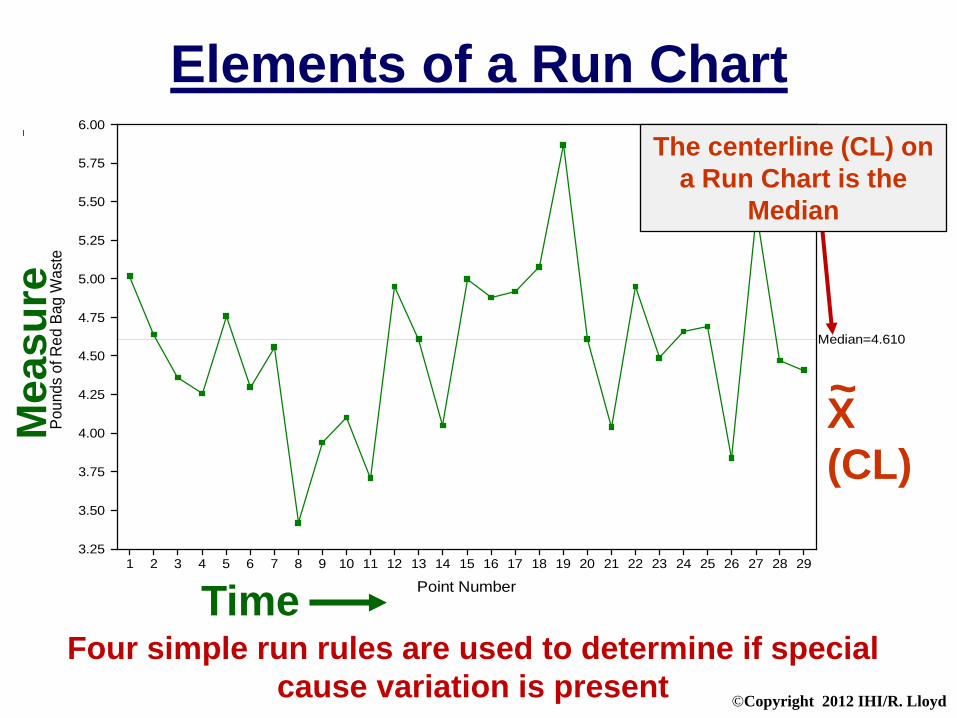
1 2 3 4 5 6 7 8 9 10 11 12 13 14 15 16 17 18 19 20 21 22 23 24 25 26 27 28 29
Point Number
Poun
ds o
f Red
Bag
Was
te
3.25
3.50
3.75
4.00
4.25
4.50
4.75
5.00
5.25
5.50
5.75
6.00
Median=4.610
Elements of a Run Chart M
easu
re
Time
The centerline (CL) on a Run Chart is the
Median
X (CL)
~
Four simple run rules are used to determine if special cause variation is present

©Copyright 2012 IHI/R. Lloyd
Non-Random Rules for Run Charts
Source: The Data Guide by L. Provost and S. Murray, Austin, Texas, February, 2007: p3-10.
A Shift: 6 or more
An astronomical data point
Too many or too few runs
A Trend 5 or more

©Copyright 2012 IHI/R. Lloyd
Now, let’s go…

©Copyright 2012 IHI/R. Lloyd
Why are Control Charts preferred over Run Charts?
Because Control Charts… 1. Are more sensitive than run charts
A run chart cannot detect special causes that are due to point-to-point variation (median versus the mean)
Tests for detecting special causes can be used with control charts
2. Have the added feature of control limits, and zones which allow us to determine if the process is stable (common cause variation) or not stable (special cause variation).
3. Can be used to define process capability.
4. Allow us to more accurately predict process behavior and future performance.

©Copyright 2012 IHI/R. Lloyd
Jan01 Mar01 May01 July01 Sept01 Nov01 Jan02 Mar02 May02 July02 Sept02 Nov02
Month
Num
ber o
f Com
plai
nts
5.0
10.0
15.0
20.0
25.0
30.0
35.0
40.0
45.0
50.0
A
B
C
C
B
A
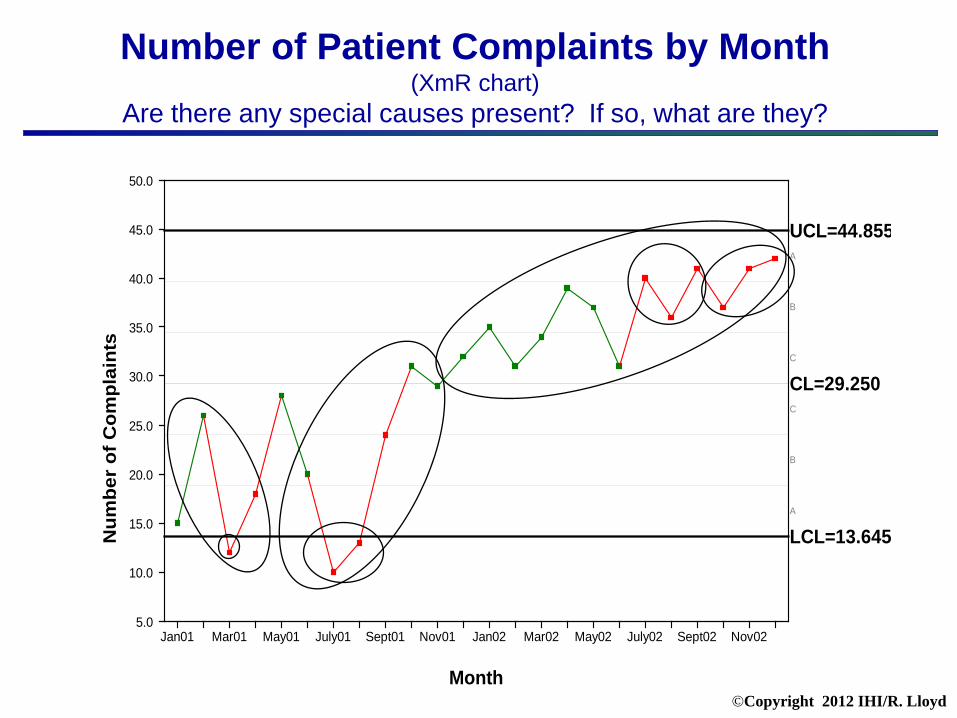
UCL=44.855
CL=29.250
LCL=13.645
Elements of a Control (Shewhart) Chart
Mea
sure
Time
(Upper Control Limit)
X (Mean)
An indication of a special cause
(Lower Control Limit)

©Copyright 2012 IHI/R. Lloyd
A single point outside the control limits
Six consecutive points increasing (trend up) ordecreasing (trend down)
Two our of three consecutive points near a controllimit (outer one-third)
Eight or more consecutive points above or belowthe centerline
Fifteen consecutive points close to the centerline(inner one-third)
Rules for Detecting
Special Causes
1.
5.
4.
3.
2.

©Copyright 2012 IHI/R. Lloyd
Notes on Special Cause Rules
Rule #1: 1 point outside the +/- 3 sigma limits A point exactly on a control limit is not considered outside the limit . When there is not a lower or upper control limit Rule 1 does not apply to the side missing the limit.
Rule #2: 8 successive consecutive points above (or below) the centerline
A point exactly on the centerline does not cancel or count towards a shift. Rule #3: 6 or more consecutive points steadily increasing or decreasing
Ties between two consecutive points do not cancel or add to a trend. When control charts have varying limits due to varying numbers of measurements within subgroups, then rule #3 should not be applied.
Rule #4: 2 out of 3 successive points in Zone A or beyond
When there is not a lower or upper control limit Rule 4 does not apply to the side missing a limit.
Rule #5: 15 consecutive points in Zone C on either side of the centerline
This is known as “hugging the centerline”
©Copyright 2012 IHI/R. Lloyd
A Quick Test to Identify Special Causes
©Copyright 2012 IHI/R. Lloyd
Rat
e pe
r 100
ED
Pat
ient
s
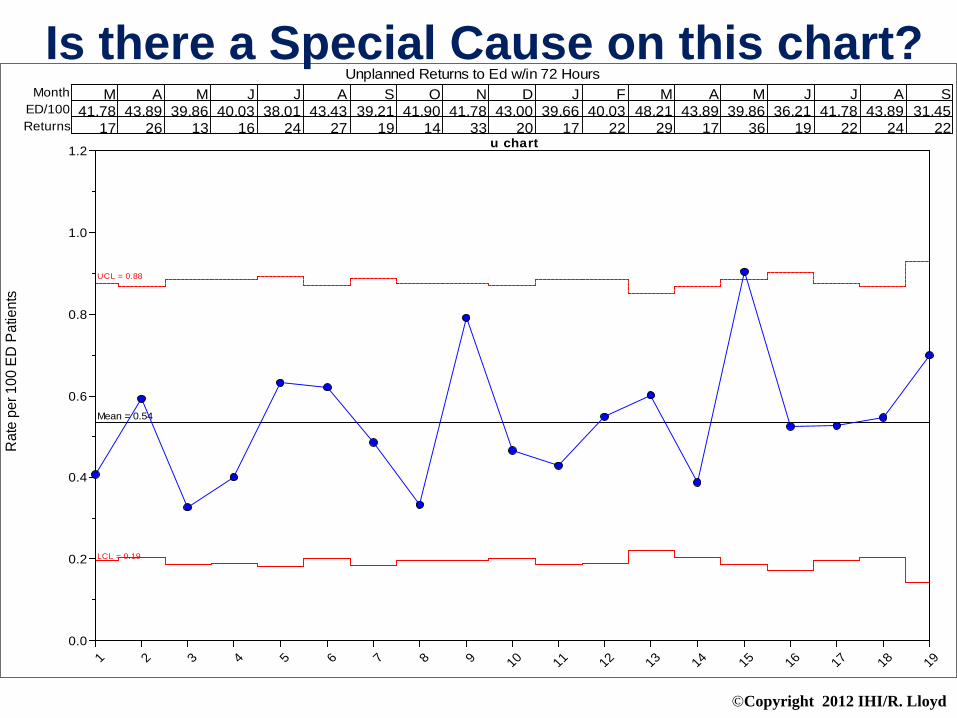
Unplanned Returns to Ed w/in 72 HoursM
41.7817
A43.89
26
M39.86
13
J40.03
16
J38.01
24
A43.43
27
S39.21
19
O41.90
14
N41.78
33
D43.00
20
J39.66
17
F40.03
22
M48.21
29
A43.89
17
M39.86
36
J36.21
19
J41.78
22
A43.89
24
S31.45
22
MonthED/100Returns
u chart
1 2 3 4 5 6 7 8 9 10 11 12 13 14 15 16 17 18 190.0
0.2
0.4
0.6
0.8
1.0
1.2
UCL = 0.88
Mean = 0.54
LCL = 0.19
Is there a Special Cause on this chart?

©Copyright 2012 IHI/R. Lloyd
Special Cause: Point Outside the UCL R
ate
per 1
00 E
D P
atie
nts
Unplanned Returns to Ed w/in 72 HoursM
41.7817
A43.89
26
M39.86
13
J40.03
16
J38.01
24
A43.43
27
S39.21
19
O41.90
14
N41.78
33
D43.00
20
J39.66
17
F40.03
22
M48.21
29
A43.89
17
M39.86
36
J36.21
19
J41.78
22
A43.89
24
S31.45
22
MonthED/100Returns
u chart
1 2 3 4 5 6 7 8 9 10 11 12 13 14 15 16 17 18 190.0
0.2
0.4
0.6
0.8
1.0
1.2
UCL = 0.88
Mean = 0.54
LCL = 0.19
©Copyright 2012 IHI/R. Lloyd
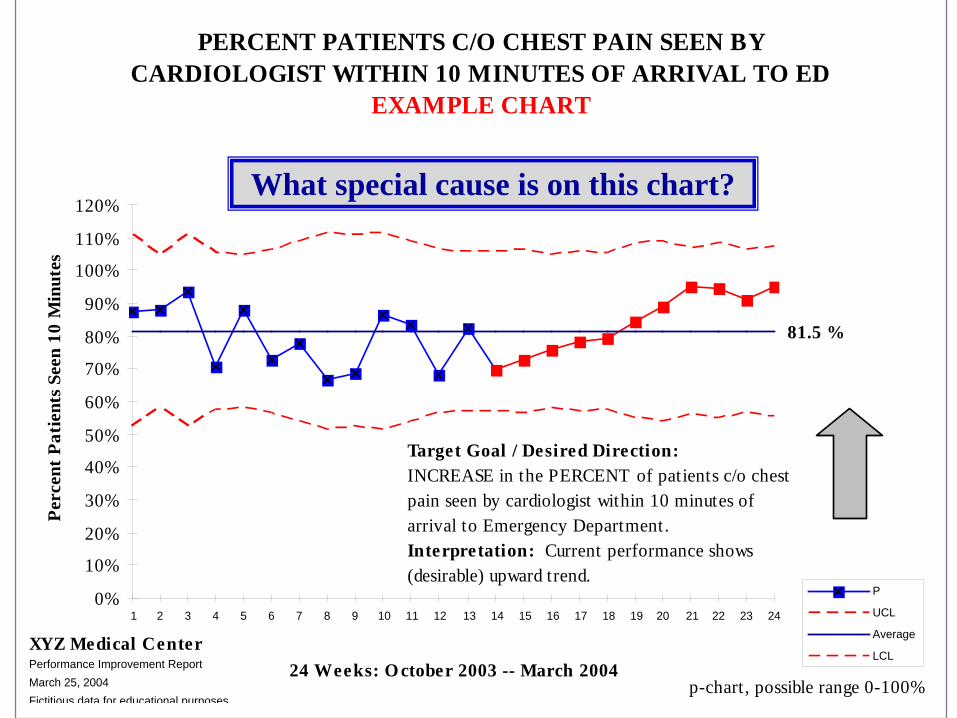
PERCENT PATIENTS C/O CHEST PAIN SEEN BY CARDIOLOGIST WITHIN 10 MINUTES OF ARRIVAL TO ED
EXAMPLE CHART
81.5 %
0%
10%
20%
30%
40%
50%
60%
70%
80%
90%
100%
110%
120%
1 2 3 4 5 6 7 8 9 10 11 12 13 14 15 16 17 18 19 20 21 22 23 24
24 Weeks: O ctober 2003 -- March 2004
Perc
ent P
atie
nts S
een
10 M
inut
es
P
UCL
Average
LCLXYZ Medical CenterPerformance Improvement ReportMarch 25, 2004Fictitious data for educational purposes
Target Goal / Desired Direction:INCREASE in the PERCENT of patients c/o chest pain seen by cardiologist within 10 minutes of arrival to Emergency Department. Interpretation: Current performance shows (desirable) upward trend.
p-chart, possible range 0-100%
What special cause is on this chart?

©Copyright 2012 IHI/R. Lloyd
Number of Patient Complaints by Month (XmR chart)
Are there any special causes present? If so, what are they?
Jan01 Mar01 May01 July01 Sept01 Nov01 Jan02 Mar02 May02 July02 Sept02 Nov02
Month
Num
ber o
f Com
plai
nts
5.0
10.0
15.0
20.0
25.0
30.0
35.0
40.0
45.0
50.0
A
B
C
C
B
A
UCL=44.855
CL=29.250
LCL=13.645
©Copyright 2012 IHI/R. Lloyd
Number of Patient Complaints by Month (XmR chart)
Are there any special causes present? If so, what are they?
Jan01 Mar01 May01 July01 Sept01 Nov01 Jan02 Mar02 May02 July02 Sept02 Nov02
Month
Num
ber
of C
ompl
aint
s
5.0
10.0
15.0
20.0
25.0
30.0
35.0
40.0
45.0
50.0
A
B
C
C
B
A
UCL=44.855
CL=29.250
LCL=13.645
©Copyright 2012 IHI/R. Lloyd
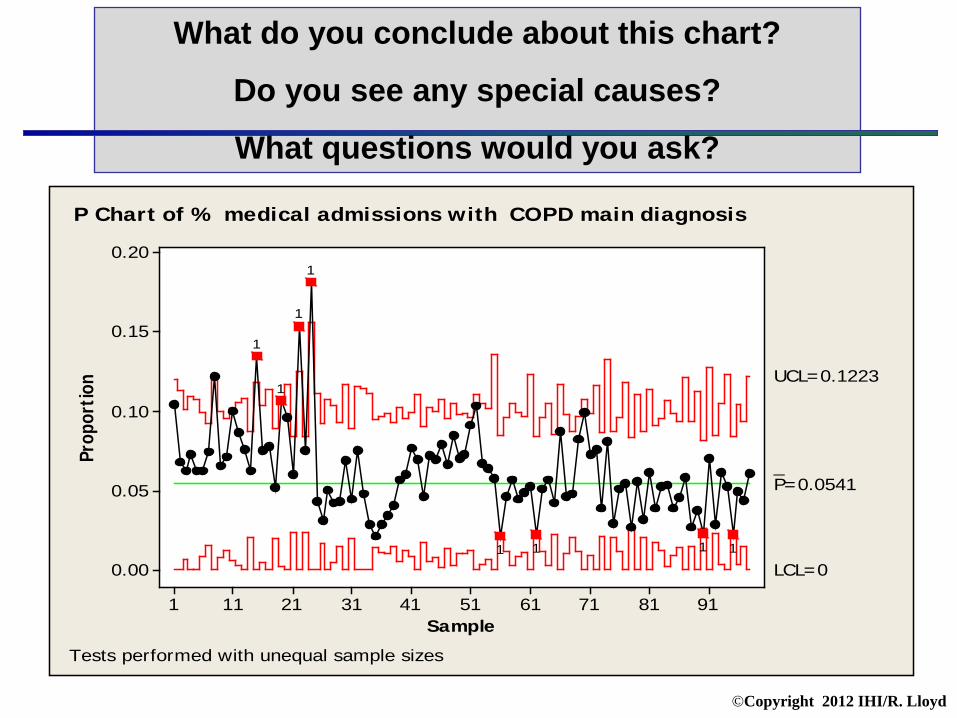
What do you conclude about this chart?
Do you see any special causes?
What questions would you ask?
Sample
Prop
ortio
n
9181716151413121111
0.20
0.15
0.10
0.05
0.00
_P=0.0541
UCL=0.1223
LCL=01111
1
1
1
1
Tests performed with unequal sample sizes
P Chart of % medical admissions with COPD main diagnosis

©Copyright 2012 IHI/R. Lloyd
Sample
Prop
ortio
n
9181716151413121111
0.20
0.15
0.10
0.05
0.00
_P=0.0385
UCL=0.0965
LCL=0
1 2 3 4
P Chart of No COPD by stage
Tests performed with unequal sample sizes
This is actually four different charts. The data should have been stratified by severity.

©Copyright 2012 IHI/R. Lloyd
SPC Sphere of
Knowledge
I know the right chart has to be hiding in here somewhere!
©Copyright 2012 IHI/R. Lloyd
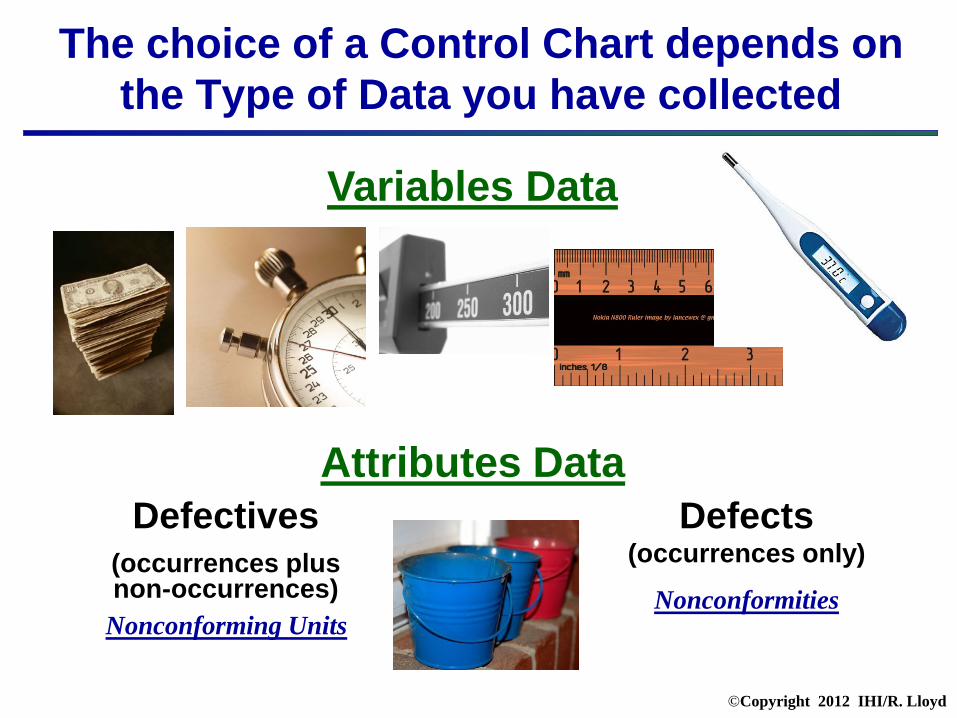
The choice of a Control Chart depends on the Type of Data you have collected
Variables Data
Attributes Data Defectives
(occurrences plus non-occurrences)
Nonconforming Units
Defects (occurrences only)
Nonconformities

©Copyright 2012 IHI/R. Lloyd
There Are 7 Basic Control Charts
Variables Charts Attributes Charts • X & R chart (average & range chart)
• X & S chart (average & SD chart)
• XmR chart (individuals & moving range chart)
• p-chart (proportion or percent of defectives)
• np-chart (number of defectives)
• c-chart (number of defects) • u-chart (defect rate)

The Control Chart Decision Tree Source: Carey, R. and Lloyd, R. Measuring Quality Improvement in Healthcare: A
Guide to Statistical Process Control Applications. ASQ Press, Milwaukee, WI, 2001.
©Copyright 2012 IHI/R. Lloyd
Variables Data Attributes Data
More than one
observation per
subgroup?
< than 10 observatio
ns per subgroup
?
X bar & R X bar & S XmR
Are the subgroups of equal
size?
Is there an equal area
of opportunity
?
Occurrences & Non-
occurrences?
np-chart p-chart u-chart c-chart
Decide on the type of
data
Yes
Yes Yes
Yes
Yes No No No
No No
The percent of Defective
Units
The number of
Defects
The Defect Rate
Individual Measurement
Average and Standard Deviation
Average and
Range
The number of Defective
Units

©Copyright 2012 IHI/R. Lloyd
Key Terms for Control Chart Selection
Subgroup How you organize you data (e.g., by day, week or month) The label of your horizontal axis Can be patients in chronological order Can be of equal or unequal sizes Applies to all the charts
Observation The actual value (data) you collect The label of your vertical axis May be single or multiple data points Applies to all the charts
Area of Opportunity Applies to all attributes or counts charts Defines the area or frame in which a defective or defect can occur Can be of equal or unequal sizes

©Copyright 2012 IHI/R. Lloyd
Exercise You Make the Call on these HEN Measures
Measure
Subgroup? Type of Data?
Type of Chart?
The daily total number of ED patients who have at least one medication order entered using computerized provider order entry (CPOE).
V or A
The number of central line insertions each week during which all elements of the bundle were followed divided by the total number of central line insertions that week
V or A
The weekly number of catheter-associated urinary tract infections per 1000 urinary catheter days
V or A
The total number of patient falls each month (with or without injury to the patient and whether or not assisted by a staff member) divided by the total patient days for the month
V or A
The number of hand hygiene performed consistent with guidelines divided by the total number of hand hygiene observation opportunities
V or A

©Copyright 2012 IHI/R. Lloyd
Measure
Subgroup? Type of Data?
Type of Chart?
The daily total number of ED patients who have at least one medication order entered using computerized provider order entry (CPOE).
Day
V or A
XmR
The number of central line insertions each week during which all elements of the bundle were followed divided by the total number of central line insertions that week
Week
V or A
p-chart
The weekly number of catheter-associated urinary tract infections per 1000 urinary catheter days
Week
V or A
u-chart
The total number of patient falls each month (with or without injury to the patient and whether or not assisted by a staff member) divided by the total patient days for the month
Month
V or A
u-chart
The number of hand hygiene performed consistent with guidelines divided by the total number of hand hygiene observation opportunities
?
V or A
?
Exercise You Make the Call on these HEN Measures
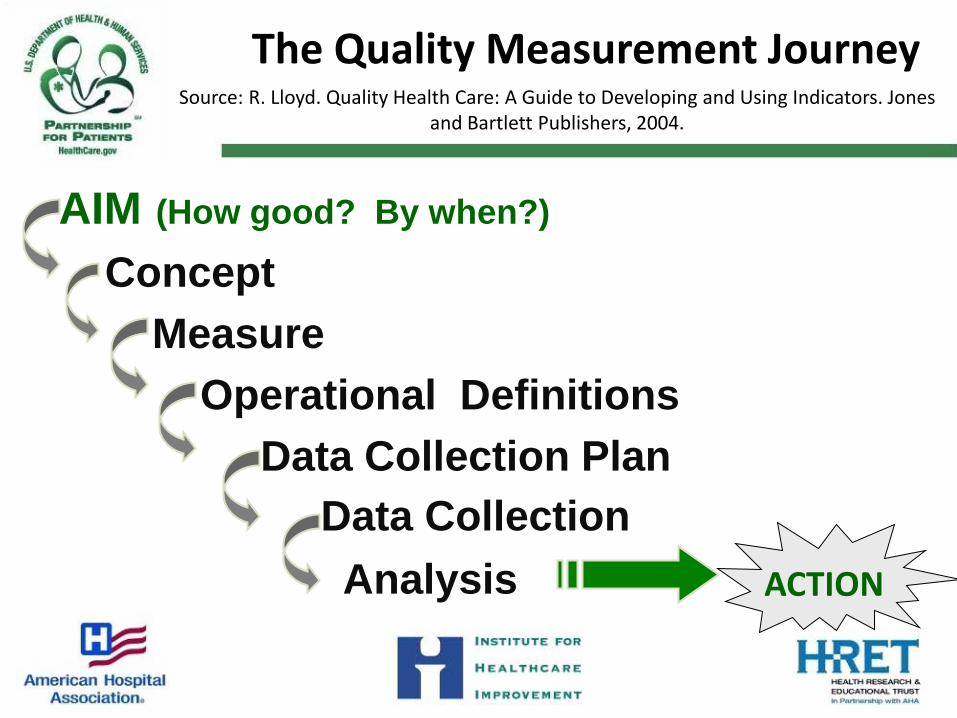
The Quality Measurement Journey Source: R. Lloyd. Quality Health Care: A Guide to Developing and Using Indicators. Jones
and Bartlett Publishers, 2004.
AIM (How good? By when?)
Concept Measure Operational Definitions Data Collection Plan Data Collection Analysis ACTION

When will we know that a change produces an improvement?
PrimaryDriversOutcome
SecondaryDrivers
Ideas for ProcessChanges
AIM:A New
ME!
Calories In
Limit dailyintake
TrackCalories
CaloriesOut
Substitutelow calorie
foods
Avoidalcohol
Work out 5days
Bike towork
PlanMeals
Drink H2ONot Soda
drives
drives
drives
drives
drives
drives
drives
drives
• Weight• BMI• Body Fat• Waist size
• Daily caloriecount
• Exercisecalorie count
• Days betweenworkouts
• Avg drinks/week
• Runningcalorie total
• % ofopportunitiesused
• Sodas/week
• Meals off-plan/week
• Avg cal/day
Exercise
Fidgiting
HackySack inoffice
Percent of dayson bike
Etc...
Outcomes
Outcome measures
change more slowly
Processes
Process measures change more quickly
© Richard Scoville & I.H.I.

The Sequence of Improvement
Spread throughout the system
Develop a change
Implement a change
Prototype a change
Test under a variety of conditions
Embed in daily operations
`
AP
DS
APD
S
AP
DS
A P
DS
Prerequisites for change
Conf
iden
ce th
at c
hang
e is
effe
ctiv
e

The Formula for Improvement
Structure
+ Process
+ Culture*=Outcome
Donabedian, A. (1966). "Evaluating the quality of medical care." Milbank Memorial Fund Quarterly 44(3): Suppl:166-206.
*Added to Donabedian’s original formulation by R. Lloyd and R. Scoville.
A closing thought… It must be remembered that there is nothing more difficult to plan, more doubtful of success, nor more dangerous to manage than the creation of a new system. For the initiator has the enmity of all who would profit by the preservation of the old institution and merely lukewarm defenders in those who would gain by the new one.
A closing thought… It must be remembered that there is nothing more difficult to plan, more doubtful of success, nor more dangerous to manage than the creation of a new system. For the initiator has the enmity of all who would profit by the preservation of the old institution and merely lukewarm defenders in those who would gain by the new one. Machiavelli, The Prince, 1513