bi survey 12 - microstrategy
TRANSCRIPT

The BI Survey is the Most Comprehensive Independent Survey
of the On-Line Analytical Processing and Business Intelligence Market
SUMMARY RESULTS FROMTHE BI SURVEY 12
THEBI SURVEY 12
This summary of the major result categories of The BI Survey 12 results was produced by MicroStrategy with full approval by BARC.

For more information about The BI Survey 12, please visit:
www.bi-survey.com
Overview of The BI Survey 12 . . . . . . . . . . . . . . . . . . . . . . . . . . . . . . . . . . . . . . . . . . . . . . . . . . . . . . . . . . . . . . . . . . . . . . . . . . . . . . . . . . . . . . . . . . . . . . . . . . . . . . . . . . 3
Are The BI Survey 12 results consistent with the trends from the prior 10 years? . . . . . . . . . . . . . . . . . . . . . . . . . . . . . . . . 4
Are the differences between the mega-vendors and an independent
vendor like MicroStrategy significant? . . . . . . . . . . . . . . . . . . . . . . . . . . . . . . . . . . . . . . . . . . . . . . . . . . . . . . . . . . . . . . . . . . . . . . . . . . . . . . . . . . . . . . . . . . 4
How important is product response time and performance? . . . . . . . . . . . . . . . . . . . . . . . . . . . . . . . . . . . . . . . . . . . . . . . . . . . . . . . . . . . . 4
How should organizations select products? . . . . . . . . . . . . . . . . . . . . . . . . . . . . . . . . . . . . . . . . . . . . . . . . . . . . . . . . . . . . . . . . . . . . . . . . . . . . . . . . . . . 4
What should organizations look for in a product? . . . . . . . . . . . . . . . . . . . . . . . . . . . . . . . . . . . . . . . . . . . . . . . . . . . . . . . . . . . . . . . . . . . . . . . . . . 5
The BI Document Summary Results . . . . . . . . . . . . . . . . . . . . . . . . . . . . . . . . . . . . . . . . . . . . . . . . . . . . . . . . . . . . . . . . . . . . . . . . . . . . . . . . . . . . . . . . . . . . . . 5
VENDOR RELATIONSHIP . . . . . . . . . . . . . . . . . . . . . . . . . . . . . . . . . . . . . . . . . . . . . . . . . . . . . . . . . . . . . . . . . . . . . . . . . . . . . . . . . . . . . . . . . . . . . . . . . . . . . . . . . . . . . . . . . . . 6
Overall Satisfaction . . . . . . . . . . . . . . . . . . . . . . . . . . . . . . . . . . . . . . . . . . . . . . . . . . . . . . . . . . . . . . . . . . . . . . . . . . . . . . . . . . . . . . . . . . . . . . . . . . . . . . . . . . . . . . . . . . . . 6
Vendor Support . . . . . . . . . . . . . . . . . . . . . . . . . . . . . . . . . . . . . . . . . . . . . . . . . . . . . . . . . . . . . . . . . . . . . . . . . . . . . . . . . . . . . . . . . . . . . . . . . . . . . . . . . . . . . . . . . . . . . . . . 6
Implementer Support . . . . . . . . . . . . . . . . . . . . . . . . . . . . . . . . . . . . . . . . . . . . . . . . . . . . . . . . . . . . . . . . . . . . . . . . . . . . . . . . . . . . . . . . . . . . . . . . . . . . . . . . . . . . . . . . . 8
BUSINESS VALUE . . . . . . . . . . . . . . . . . . . . . . . . . . . . . . . . . . . . . . . . . . . . . . . . . . . . . . . . . . . . . . . . . . . . . . . . . . . . . . . . . . . . . . . . . . . . . . . . . . . . . . . . . . . . . . . . . . . . . . . . . . . . . 9
Business Benefit . . . . . . . . . . . . . . . . . . . . . . . . . . . . . . . . . . . . . . . . . . . . . . . . . . . . . . . . . . . . . . . . . . . . . . . . . . . . . . . . . . . . . . . . . . . . . . . . . . . . . . . . . . . . . . . . . . . . . . . . . 9
Functional Usage . . . . . . . . . . . . . . . . . . . . . . . . . . . . . . . . . . . . . . . . . . . . . . . . . . . . . . . . . . . . . . . . . . . . . . . . . . . . . . . . . . . . . . . . . . . . . . . . . . . . . . . . . . . . . . . . . . . . . .11
Innovation . . . . . . . . . . . . . . . . . . . . . . . . . . . . . . . . . . . . . . . . . . . . . . . . . . . . . . . . . . . . . . . . . . . . . . . . . . . . . . . . . . . . . . . . . . . . . . . . . . . . . . . . . . . . . . . . . . . . . . . . . . . . . . .12
Mobile BI . . . . . . . . . . . . . . . . . . . . . . . . . . . . . . . . . . . . . . . . . . . . . . . . . . . . . . . . . . . . . . . . . . . . . . . . . . . . . . . . . . . . . . . . . . . . . . . . . . . . . . . . . . . . . . . . . . . . . . . . . . . . . . . . .13
Chosen As Standard . . . . . . . . . . . . . . . . . . . . . . . . . . . . . . . . . . . . . . . . . . . . . . . . . . . . . . . . . . . . . . . . . . . . . . . . . . . . . . . . . . . . . . . . . . . . . . . . . . . . . . . . . . . . . . . . . .14
PRODUCT PERFORMANCE . . . . . . . . . . . . . . . . . . . . . . . . . . . . . . . . . . . . . . . . . . . . . . . . . . . . . . . . . . . . . . . . . . . . . . . . . . . . . . . . . . . . . . . . . . . . . . . . . . . . . . . . . . . . . . .15
Performance . . . . . . . . . . . . . . . . . . . . . . . . . . . . . . . . . . . . . . . . . . . . . . . . . . . . . . . . . . . . . . . . . . . . . . . . . . . . . . . . . . . . . . . . . . . . . . . . . . . . . . . . . . . . . . . . . . . . . . . . . . . .15
Query Performance . . . . . . . . . . . . . . . . . . . . . . . . . . . . . . . . . . . . . . . . . . . . . . . . . . . . . . . . . . . . . . . . . . . . . . . . . . . . . . . . . . . . . . . . . . . . . . . . . . . . . . . . . . . . . . . . . . .16
Data Volume . . . . . . . . . . . . . . . . . . . . . . . . . . . . . . . . . . . . . . . . . . . . . . . . . . . . . . . . . . . . . . . . . . . . . . . . . . . . . . . . . . . . . . . . . . . . . . . . . . . . . . . . . . . . . . . . . . . . . . . . . . .17
Big Data . . . . . . . . . . . . . . . . . . . . . . . . . . . . . . . . . . . . . . . . . . . . . . . . . . . . . . . . . . . . . . . . . . . . . . . . . . . . . . . . . . . . . . . . . . . . . . . . . . . . . . . . . . . . . . . . . . . . . . . . . . . . . . . . .18
Product Satisfaction . . . . . . . . . . . . . . . . . . . . . . . . . . . . . . . . . . . . . . . . . . . . . . . . . . . . . . . . . . . . . . . . . . . . . . . . . . . . . . . . . . . . . . . . . . . . . . . . . . . . . . . . . . . . . . . . . .19
Recommendation . . . . . . . . . . . . . . . . . . . . . . . . . . . . . . . . . . . . . . . . . . . . . . . . . . . . . . . . . . . . . . . . . . . . . . . . . . . . . . . . . . . . . . . . . . . . . . . . . . . . . . . . . . . . . . . . . . . . .19
Conclusion . . . . . . . . . . . . . . . . . . . . . . . . . . . . . . . . . . . . . . . . . . . . . . . . . . . . . . . . . . . . . . . . . . . . . . . . . . . . . . . . . . . . . . . . . . . . . . . . . . . . . . . . . . . . . . . . . . . . . . . . . . . . . . . . . . . . . .21
TABLE OF CONTENTS

The BI Survey 12 – Summary Results
2 |
The BI Survey 12 – Summary Results
| 3
OVERVIEW OF THE BI SURVEY 12
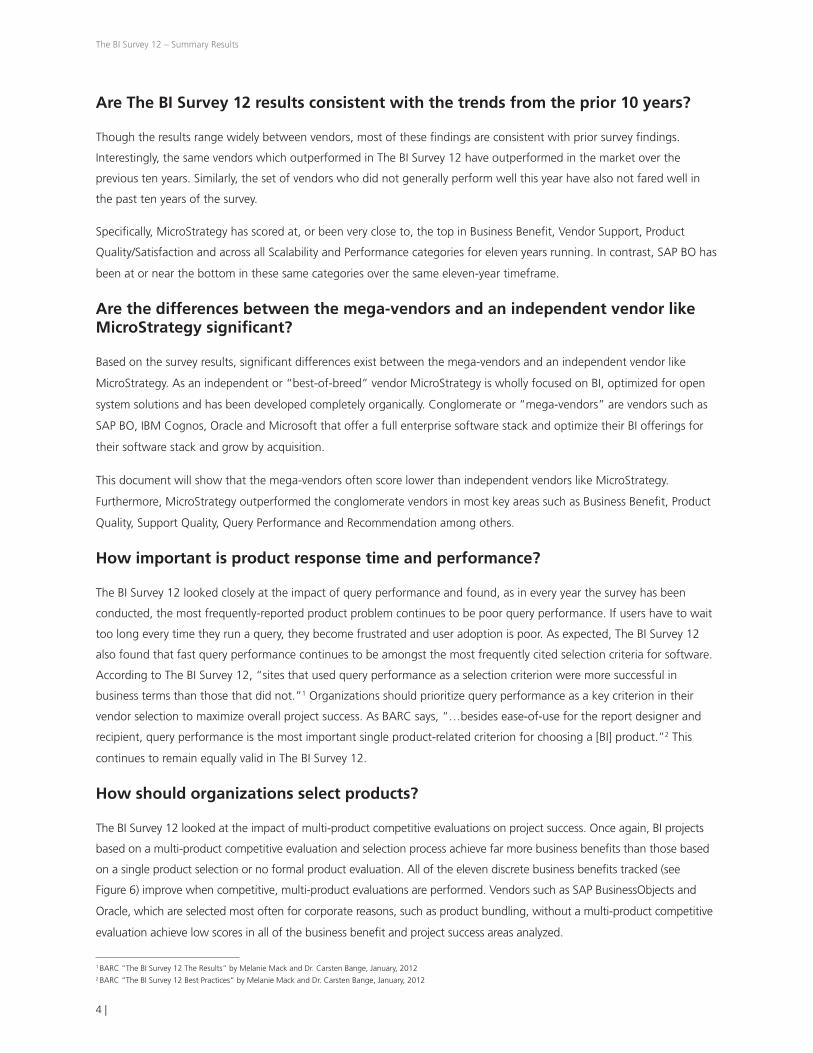
The BI Survey is the world’s most comprehensive independent survey of the business intelligence (BI) market space and
products and is conducted annually by the Business Application Research Center (BARC). The BI Survey 12 follows ten
successful editions of The BI Survey. It is important to note that this year the numbering of The BI Survey has changed so
that The Survey number now aligns with the year in which the data was collected.
The survey compiles real-world BI experiences of nearly 3,000 organizations from over 85 countries. The BI Survey 12
was conducted with the following geographic split: North America 24%, Europe 60%, and rest-of-world 16%. Survey
respondents were from a number of varied industries with the largest, as in past surveys, being represented by the
Manufacturing, Retail, and Service industries. Regarding company size, the median employee count was 955 with 52% of
respondent organizations having between 100 and 2,500 employees and 32% having more than 2,500.
The BI Surveys provide insight into actual BI implementation experiences as well as the usage patterns and technical
characteristics of the most popular BI products. The BI Surveys examine how companies choose their BI products, how
they use these products, and how successful they are with them. The Survey is also notable in that it takes on challenging
issues not covered by typical BI product reviews, such as barriers to wider deployments and factors leading to product
discontinuance. As a result, the Survey is uniquely positioned to detail BI purchasing and deployment best practices.
While other BI product surveys and analyst product reviews exist, they are largely based on the perceptions of the
reviewer and do not have the statistical rigor of The BI Survey. The BI Survey conclusions are solely based on statistical
analysis of information provided by respondents. This year, statistically-significant data was collected for 27 different BI
products. Each of these 27 BI products was analyzed across 30 Key Performance Indicators (KPIs). Products analyzed in
The BI Survey 12, listed in alphabetical order and including the number of responses per product, were: Arcplan (70),
Bissantz (61), BOARD (67), Cubeware (60), Cyberscience (74), Decisyon (30), Dimensional Insight (57), Evidanza (29), IBM
Cognos BI (71), IBM Cognos TM1 (39), Infor (68), Information Builders (44), Jedox (132), Microsoft Excel (47), Microsoft
SSAS (113), Microsoft SSRS (49), MicroStrategy (116), Oracle Essabase (29), Oracle OBIEE (50), Pentaho (37), Phocas
(156), QlikTech (169), SAP BO Webl (71), SAP BW (85), Tableau (76), TARGIT (62), Yellowfin (34) and Others (217).
This BI Survey 12 Summary, prepared by MicroStrategy, focuses on the six largest BI platform vendors, including
MicroStrategy, SAP BusinessObjects, SAP BW, Oracle BIEE, IBM Cognos, and Microsoft SSRS to make direct comparisons
within a like group of vendors typically considered for similar types of BI applications and to account for multiple product
offerings within a product suite.
The BI Survey is 100% independent of any BI vendor influence and is not commissioned, funded, suggested, or sponsored
by vendors in any way. Vendors have no input into the questions or into the analysis of Survey results. Therefore, business
intelligence consumers can be reassured that the survey accurately reflects real-world experiences of individuals in
companies like theirs and is free from vendor influence and author bias.
While The BI Survey 12 asked many of the same questions as in previous years to allow for year-over-year comparisons,
some KPIs have changed. These changes are indicated below as appropriate. All survey KPIs are based on the values
of the peer group being assessed, where each KPI is normalized so that each peer group product sample always has a
weighted average value of 1.0. Each KPI chart runs from the lowest performing product, at the bottom, to the highest
performing product at the top. KPIs above 1 are above the average of the entire vendor set and those below 1 are below
the average.
The BI Survey 12 – Summary Results
4 |
Are The BI Survey 12 results consistent with the trends from the prior 10 years?
Though the results range widely between vendors, most of these findings are consistent with prior survey findings.
Interestingly, the same vendors which outperformed in The BI Survey 12 have outperformed in the market over the
previous ten years. Similarly, the set of vendors who did not generally perform well this year have also not fared well in
the past ten years of the survey.
Specifically, MicroStrategy has scored at, or been very close to, the top in Business Benefit, Vendor Support, Product
Quality/Satisfaction and across all Scalability and Performance categories for eleven years running. In contrast, SAP BO has
been at or near the bottom in these same categories over the same eleven-year timeframe.
Are the differences between the mega-vendors and an independent vendor like MicroStrategy significant?
Based on the survey results, significant differences exist between the mega-vendors and an independent vendor like
MicroStrategy. As an independent or “best-of-breed” vendor MicroStrategy is wholly focused on BI, optimized for open
system solutions and has been developed completely organically. Conglomerate or “mega-vendors” are vendors such as
SAP BO, IBM Cognos, Oracle and Microsoft that offer a full enterprise software stack and optimize their BI offerings for
their software stack and grow by acquisition.
This document will show that the mega-vendors often score lower than independent vendors like MicroStrategy.
Furthermore, MicroStrategy outperformed the conglomerate vendors in most key areas such as Business Benefit, Product
Quality, Support Quality, Query Performance and Recommendation among others.
How important is product response time and performance?
The BI Survey 12 looked closely at the impact of query performance and found, as in every year the survey has been
conducted, the most frequently-reported product problem continues to be poor query performance. If users have to wait
too long every time they run a query, they become frustrated and user adoption is poor. As expected, The BI Survey 12
also found that fast query performance continues to be amongst the most frequently cited selection criteria for software.
According to The BI Survey 12, “sites that used query performance as a selection criterion were more successful in
business terms than those that did not.”1 Organizations should prioritize query performance as a key criterion in their
vendor selection to maximize overall project success. As BARC says, “…besides ease-of-use for the report designer and
recipient, query performance is the most important single product-related criterion for choosing a [BI] product.”2 This
continues to remain equally valid in The BI Survey 12.
How should organizations select products?
The BI Survey 12 looked at the impact of multi-product competitive evaluations on project success. Once again, BI projects
based on a multi-product competitive evaluation and selection process achieve far more business benefits than those based
on a single product selection or no formal product evaluation. All of the eleven discrete business benefits tracked (see
Figure 6) improve when competitive, multi-product evaluations are performed. Vendors such as SAP BusinessObjects and
Oracle, which are selected most often for corporate reasons, such as product bundling, without a multi-product competitive
evaluation achieve low scores in all of the business benefit and project success areas analyzed.
1 BARC “The BI Survey 12 The Results” by Melanie Mack and Dr. Carsten Bange, January, 20122 BARC “The BI Survey 12 Best Practices” by Melanie Mack and Dr. Carsten Bange, January, 2012
The BI Survey 12 – Summary Results
| 5
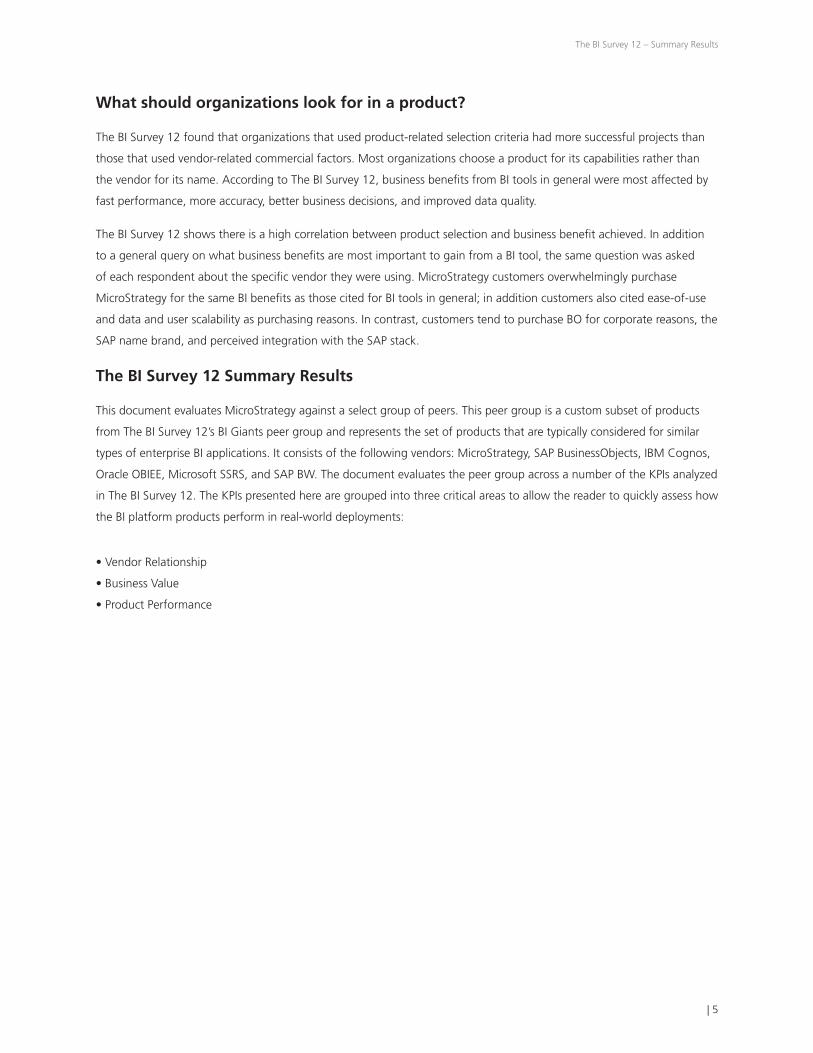
What should organizations look for in a product?
The BI Survey 12 found that organizations that used product-related selection criteria had more successful projects than
those that used vendor-related commercial factors. Most organizations choose a product for its capabilities rather than
the vendor for its name. According to The BI Survey 12, business benefits from BI tools in general were most affected by
fast performance, more accuracy, better business decisions, and improved data quality.
The BI Survey 12 shows there is a high correlation between product selection and business benefit achieved. In addition
to a general query on what business benefits are most important to gain from a BI tool, the same question was asked
of each respondent about the specific vendor they were using. MicroStrategy customers overwhelmingly purchase
MicroStrategy for the same BI benefits as those cited for BI tools in general; in addition customers also cited ease-of-use
and data and user scalability as purchasing reasons. In contrast, customers tend to purchase BO for corporate reasons, the
SAP name brand, and perceived integration with the SAP stack.
The BI Survey 12 Summary Results
This document evaluates MicroStrategy against a select group of peers. This peer group is a custom subset of products
from The BI Survey 12’s BI Giants peer group and represents the set of products that are typically considered for similar
types of enterprise BI applications. It consists of the following vendors: MicroStrategy, SAP BusinessObjects, IBM Cognos,
Oracle OBIEE, Microsoft SSRS, and SAP BW. The document evaluates the peer group across a number of the KPIs analyzed
in The BI Survey 12. The KPIs presented here are grouped into three critical areas to allow the reader to quickly assess how
the BI platform products perform in real-world deployments:
• Vendor Relationship
• Business Value
• Product Performance

The BI Survey 12 – Summary Results
6 |
VENDOR RELATIONSHIP
Overall Satisfaction
This KPI, previously called Quality and Support, now referred to as Overall Satisfaction is an aggregate of product
satisfaction, vendor support, and implementer support. These KPIs are clearly related as each one affects the other two.
On this important KPI, MicroStrategy leads the pack with the second contender, Microsoft SSRS, behind by 16%. IBM
Cognos was behind by 42% and SAP BO behind by over 50%. Outperforming its peers by such a significant margin in
this KPI clearly illustrates that MicroStrategy offers a higher quality product with stronger support.
OVERALL SATISFACTION
MicroStrategy
Microsoft SSRS
SAP BW
IBM Cognos BI
SAP BO WebI
Oracle OBIEE
0.70 0.75 0.80 0.85 0.90 0.95 1.00 1.05 1.10 1.15 1.20
1.15
0.99
0.90
0.81
0.75
0.73
Source: The BI Survey 12 KPI Dashboard
Key: Normalized score relative to the weighted average of 1.0 for the BI Giants peer group; higher numbers indicate greater overall score.
Figure 1: Overall Satisfaction KPI for the Select Peer Group
Vendor Support
The level and depth of vendor support is becoming increasingly critical as BI becomes more integrated into organizations’
operations. Better product support often results in higher application success rates and helps to ensure customers get full
value from their BI investments. A consistent finding throughout the BI Surveys is that companies striving to maximize the
business benefits of a BI project should prioritize customer support quality as a key evaluation criterion.
The BI Survey 12 – Summary Results
| 7
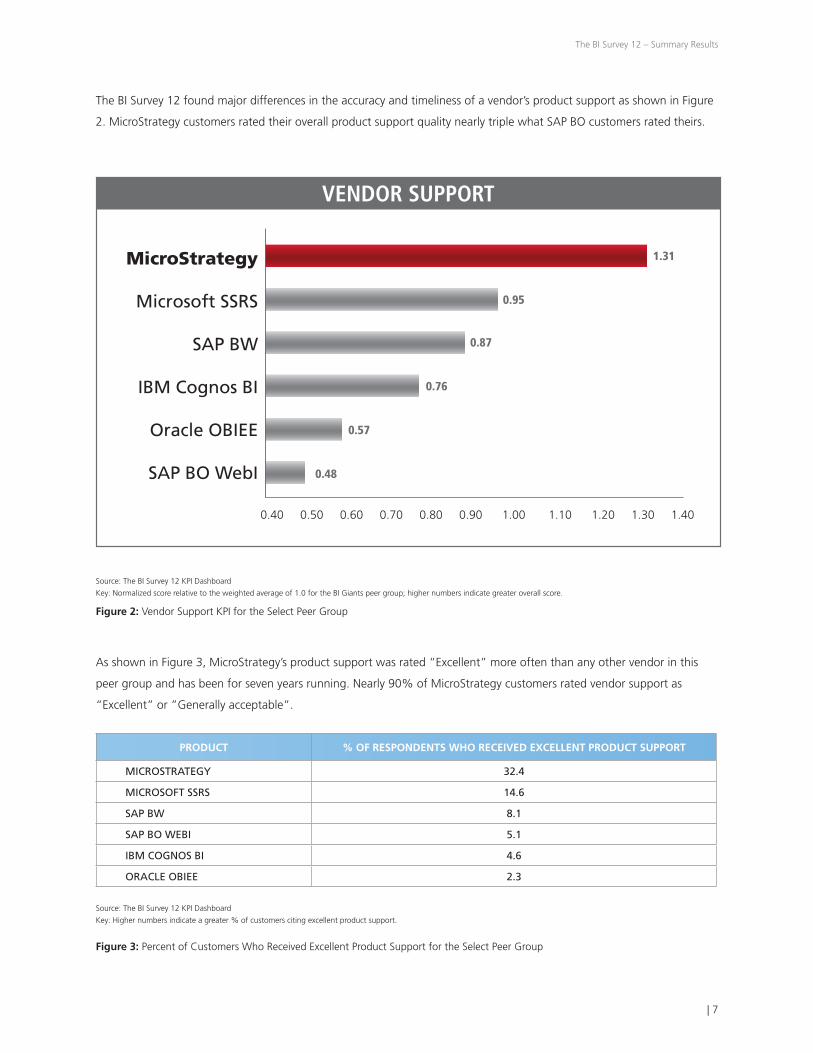
The BI Survey 12 found major differences in the accuracy and timeliness of a vendor’s product support as shown in Figure
2. MicroStrategy customers rated their overall product support quality nearly triple what SAP BO customers rated theirs.
VENDOR SUPPORT
MicroStrategy
Microsoft SSRS
SAP BW
IBM Cognos BI
Oracle OBIEE
SAP BO WebI
0.40 0.50 0.60 0.70 0.80 0.90 1.00 1.10 1.20 1.30 1.40
1.31
0.95
0.87
0.76
0.57
0.48
Source: The BI Survey 12 KPI Dashboard
Key: Normalized score relative to the weighted average of 1.0 for the BI Giants peer group; higher numbers indicate greater overall score.
Figure 2: Vendor Support KPI for the Select Peer Group
As shown in Figure 3, MicroStrategy’s product support was rated “Excellent” more often than any other vendor in this
peer group and has been for seven years running. Nearly 90% of MicroStrategy customers rated vendor support as
“Excellent” or ”Generally acceptable”.
PRODUCT % OF RESPONDENTS WHO RECEIVED EXCELLENT PRODUCT SUPPORT
MICROSTRATEGY 32.4
MICROSOFT SSRS 14.6
SAP BW 8.1
SAP BO WEBI 5.1
IBM COGNOS BI 4.6
ORACLE OBIEE 2.3
Source: The BI Survey 12 KPI Dashboard
Key: Higher numbers indicate a greater % of customers citing excellent product support.
Figure 3: Percent of Customers Who Received Excellent Product Support for the Select Peer Group
The BI Survey 12 – Summary Results
8 |
The three mega vendors’ (Oracle, IBM and SAP) customers have traditionally been the least satisfied with the quality of
support. MicroStrategy speculates that low overall product support quality ratings for these vendors likely stems from
their strategy to acquire rather than to organically develop their products. Given the historically poorly rated support
of acquired technologies, it is likely that customers of all BI platforms resulting from large mergers will see continued
ongoing support challenges.
“Once again, MicroStrategy was the top performing BI vendor among their peer group when it comes to quality
and timeliness of product support,” said Dr. Carsten Bange, founder and CEO of BARC. “Among this group,
MicroStrategy had more top ratings for support and the fewest customers complaining of poor support. This could
be related to the stability and consistency of MicroStrategy’s products, which were all developed by one company
using a single architecture, rather than being assembled from multiple origins. MicroStrategy remains fully focused
on a single product line, unlike the large, general-purpose vendors who provide the least product support.”
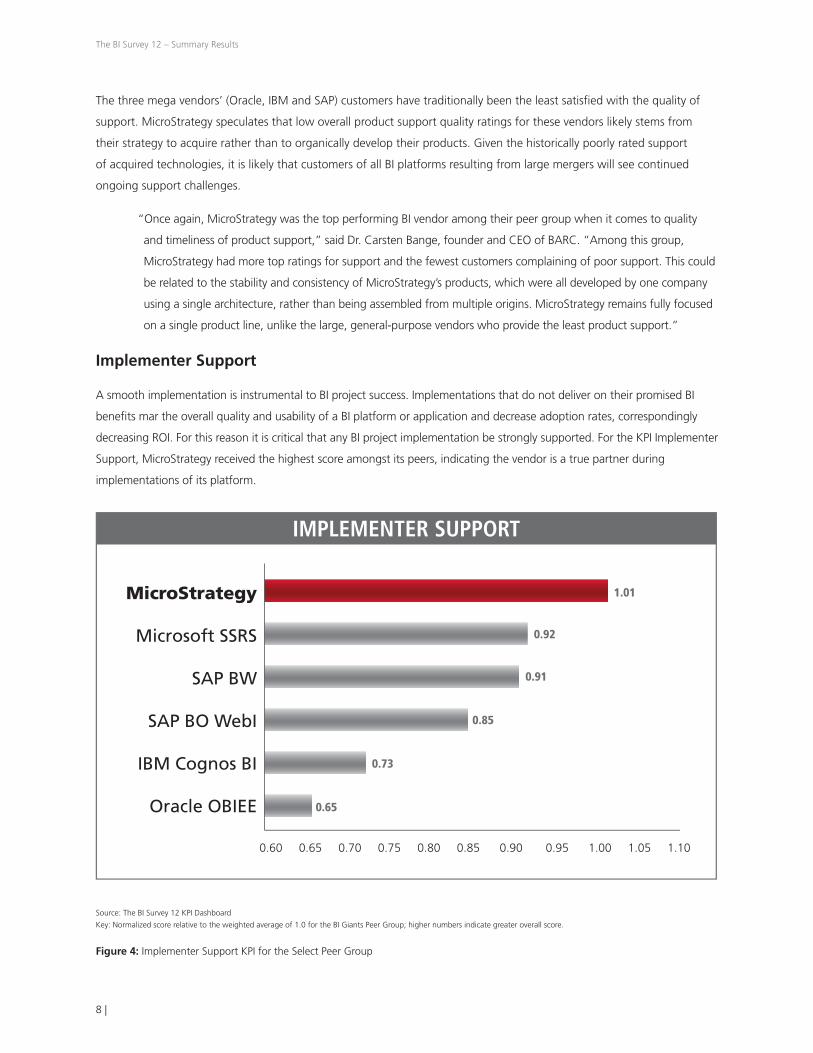
Implementer Support
A smooth implementation is instrumental to BI project success. Implementations that do not deliver on their promised BI
benefits mar the overall quality and usability of a BI platform or application and decrease adoption rates, correspondingly
decreasing ROI. For this reason it is critical that any BI project implementation be strongly supported. For the KPI Implementer
Support, MicroStrategy received the highest score amongst its peers, indicating the vendor is a true partner during
implementations of its platform.
IMPLEMENTER SUPPORT
MicroStrategy
Microsoft SSRS
SAP BW
SAP BO WebI
IBM Cognos BI
Oracle OBIEE
0.60 0.65 0.70 0.75 0.80 0.85 0.90 0.95 1.00 1.05 1.10
1.01
0.92
0.91
0.85
0.73
0.65
Source: The BI Survey 12 KPI Dashboard
Key: Normalized score relative to the weighted average of 1.0 for the BI Giants Peer Group; higher numbers indicate greater overall score.
Figure 4: Implementer Support KPI for the Select Peer Group
The BI Survey 12 – Summary Results
| 9
BUSINESS VALUE
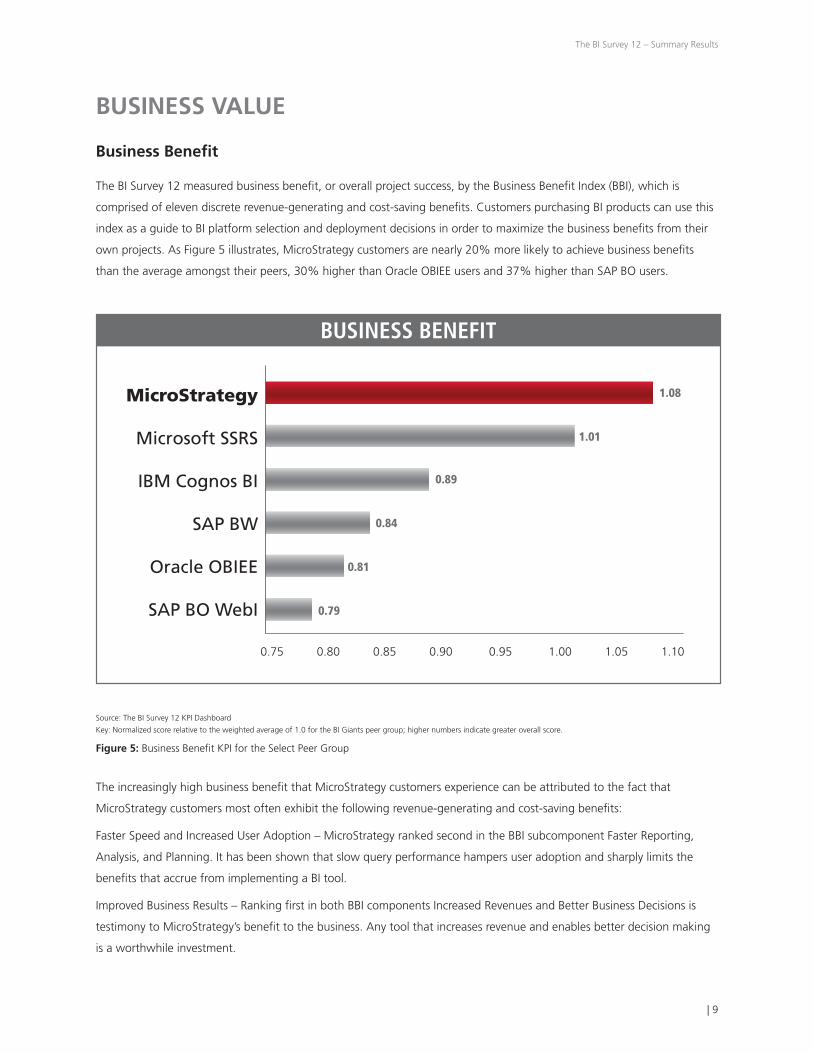
Business Benefit
The BI Survey 12 measured business benefit, or overall project success, by the Business Benefit Index (BBI), which is
comprised of eleven discrete revenue-generating and cost-saving benefits. Customers purchasing BI products can use this
index as a guide to BI platform selection and deployment decisions in order to maximize the business benefits from their
own projects. As Figure 5 illustrates, MicroStrategy customers are nearly 20% more likely to achieve business benefits
than the average amongst their peers, 30% higher than Oracle OBIEE users and 37% higher than SAP BO users.
BUSINESS BENEFIT
MicroStrategy
Microsoft SSRS
IBM Cognos BI
SAP BW
Oracle OBIEE
SAP BO WebI
0.75 0.80 0.85 0.90 0.95 1.00 1.05 1.10
1.08
1.01
0.89
0.84
0.81
0.79
Source: The BI Survey 12 KPI Dashboard
Key: Normalized score relative to the weighted average of 1.0 for the BI Giants peer group; higher numbers indicate greater overall score.
Figure 5: Business Benefit KPI for the Select Peer Group
The increasingly high business benefit that MicroStrategy customers experience can be attributed to the fact that
MicroStrategy customers most often exhibit the following revenue-generating and cost-saving benefits:
Faster Speed and Increased User Adoption – MicroStrategy ranked second in the BBI subcomponent Faster Reporting,
Analysis, and Planning. It has been shown that slow query performance hampers user adoption and sharply limits the
benefits that accrue from implementing a BI tool.
Improved Business Results – Ranking first in both BBI components Increased Revenues and Better Business Decisions is
testimony to MicroStrategy’s benefit to the business. Any tool that increases revenue and enables better decision making
is a worthwhile investment.
The BI Survey 12 – Summary Results
10 |
Improved Satisfaction – MicroStrategy ranked first in both Improved Employee and Improved Customer Satisfaction.
Satisfied users lead to higher adoption rates and overall usage of the BI platform, translating into a higher ROI.
Efficiency – MicroStrategy is shown to require less overhead and reduce costs. In the peer group, MicroStrategy had the
highest or second highest scores in the following BBI components: Reduced External IT Costs, Saved IT Headcount, Saved
Business Headcount, and Saved Other Non-IT Costs.
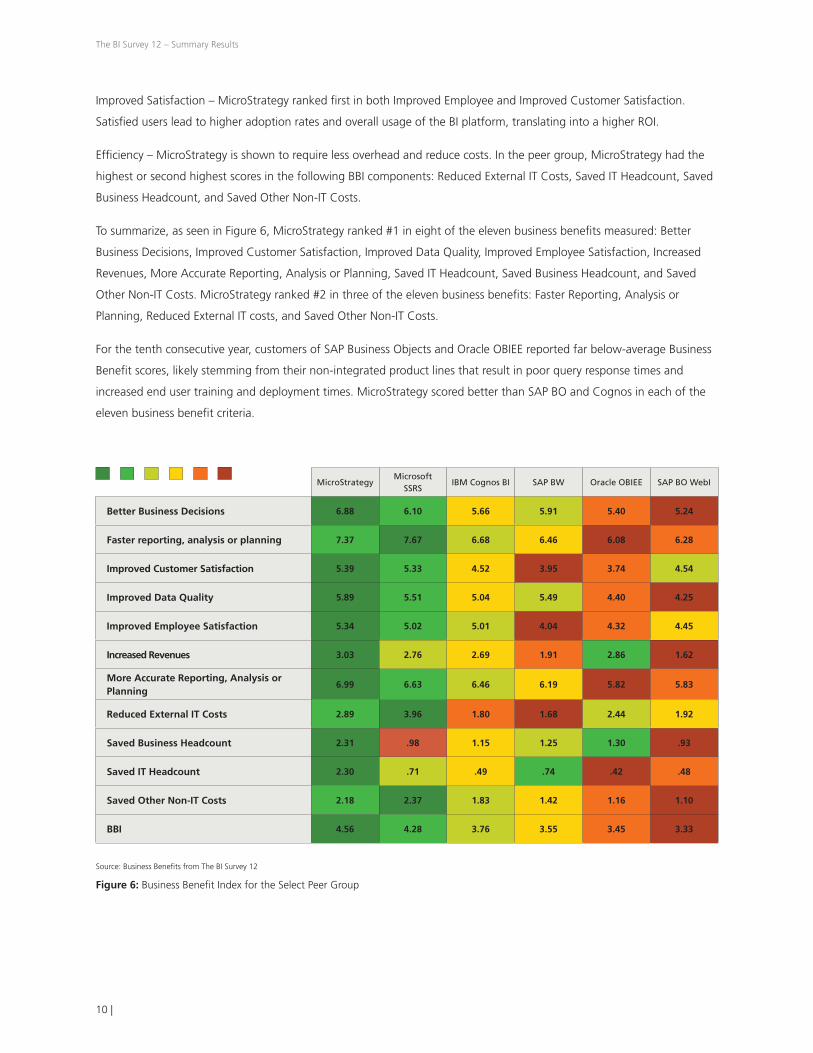
To summarize, as seen in Figure 6, MicroStrategy ranked #1 in eight of the eleven business benefits measured: Better
Business Decisions, Improved Customer Satisfaction, Improved Data Quality, Improved Employee Satisfaction, Increased
Revenues, More Accurate Reporting, Analysis or Planning, Saved IT Headcount, Saved Business Headcount, and Saved
Other Non-IT Costs. MicroStrategy ranked #2 in three of the eleven business benefits: Faster Reporting, Analysis or
Planning, Reduced External IT costs, and Saved Other Non-IT Costs.
For the tenth consecutive year, customers of SAP Business Objects and Oracle OBIEE reported far below-average Business
Benefit scores, likely stemming from their non-integrated product lines that result in poor query response times and
increased end user training and deployment times. MicroStrategy scored better than SAP BO and Cognos in each of the
eleven business benefit criteria.
MicroStrategyMicrosoft
SSRSIBM Cognos BI SAP BW Oracle OBIEE SAP BO WebI
Better Business Decisions 6.88 6.10 5.66 5.91 5.40 5.24
Faster reporting, analysis or planning 7.37 7.67 6.68 6.46 6.08 6.28
Improved Customer Satisfaction 5.39 5.33 4.52 3.95 3.74 4.54
Improved Data Quality 5.89 5.51 5.04 5.49 4.40 4.25
Improved Employee Satisfaction 5.34 5.02 5.01 4.04 4.32 4.45
Increased Revenues 3.03 2.76 2.69 1.91 2.86 1.62
More Accurate Reporting, Analysis or Planning
6.99 6.63 6.46 6.19 5.82 5.83
Reduced External IT Costs 2.89 3.96 1.80 1.68 2.44 1.92
Saved Business Headcount 2.31 .98 1.15 1.25 1.30 .93
Saved IT Headcount 2.30 .71 .49 .74 .42 .48
Saved Other Non-IT Costs 2.18 2.37 1.83 1.42 1.16 1.10
BBI 4.56 4.28 3.76 3.55 3.45 3.33
Source: Business Benefits from The BI Survey 12
Figure 6: Business Benefit Index for the Select Peer Group
The BI Survey 12 – Summary Results
| 11
“For the tenth consecutive year, customers have rated MicroStrategy highly in attaining business benefits as
measured across a spectrum of important revenue-generating and cost-saving criteria,” said Dr. Carsten Bange,
founder and CEO of BARC. He also noted, “The fact that MicroStrategy customers have the largest and most
successful BI applications, as measured by the business benefit criteria we evaluated, confirms MicroStrategy’s
high functionality and strong suitability for highly scalable and highly performant Web deployments – key drivers
in delivering tangible business value.”
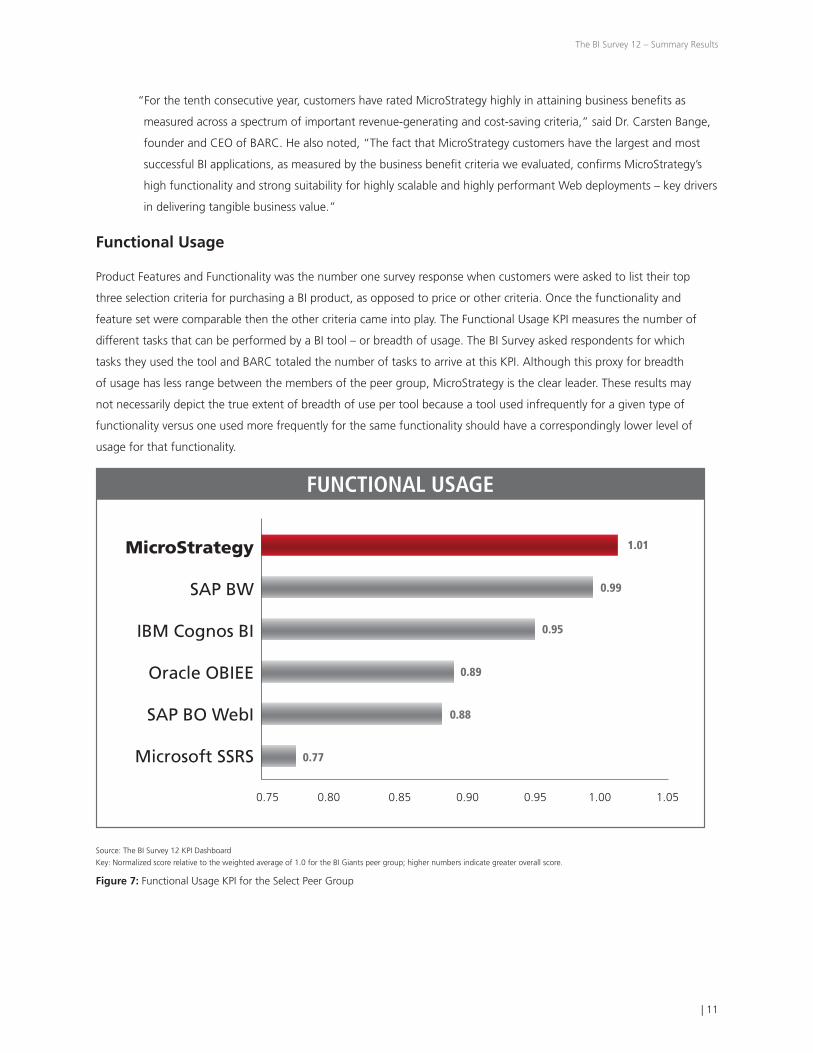
Functional Usage
Product Features and Functionality was the number one survey response when customers were asked to list their top
three selection criteria for purchasing a BI product, as opposed to price or other criteria. Once the functionality and
feature set were comparable then the other criteria came into play. The Functional Usage KPI measures the number of
different tasks that can be performed by a BI tool – or breadth of usage. The BI Survey asked respondents for which
tasks they used the tool and BARC totaled the number of tasks to arrive at this KPI. Although this proxy for breadth
of usage has less range between the members of the peer group, MicroStrategy is the clear leader. These results may
not necessarily depict the true extent of breadth of use per tool because a tool used infrequently for a given type of
functionality versus one used more frequently for the same functionality should have a correspondingly lower level of
usage for that functionality.
FUNCTIONAL USAGE
MicroStrategy
SAP BW
IBM Cognos BI
Oracle OBIEE
SAP BO WebI
Microsoft SSRS
0.75 0.80 0.85 0.90 0.95 1.00 1.05
1.01
0.99
0.95
0.89
0.88
0.77
Source: The BI Survey 12 KPI Dashboard
Key: Normalized score relative to the weighted average of 1.0 for the BI Giants peer group; higher numbers indicate greater overall score.
Figure 7: Functional Usage KPI for the Select Peer Group
The BI Survey 12 – Summary Results
12 |
“MicroStrategy not only has more than the required functionality and features for a BI platform, but they
continue to be on the forefront of innovation from year to year, always early to add the newest functionality.”
said Dr. Carsten Bange.
Dr. Bange added, “In my view, MicroStrategy’s consistent success on The BI Survey is due to their focus on
continuing to broaden and improve its BI platform and the fact that MicroStrategy has resisted the temptation
to build a technology portfolio through acquisitions.”
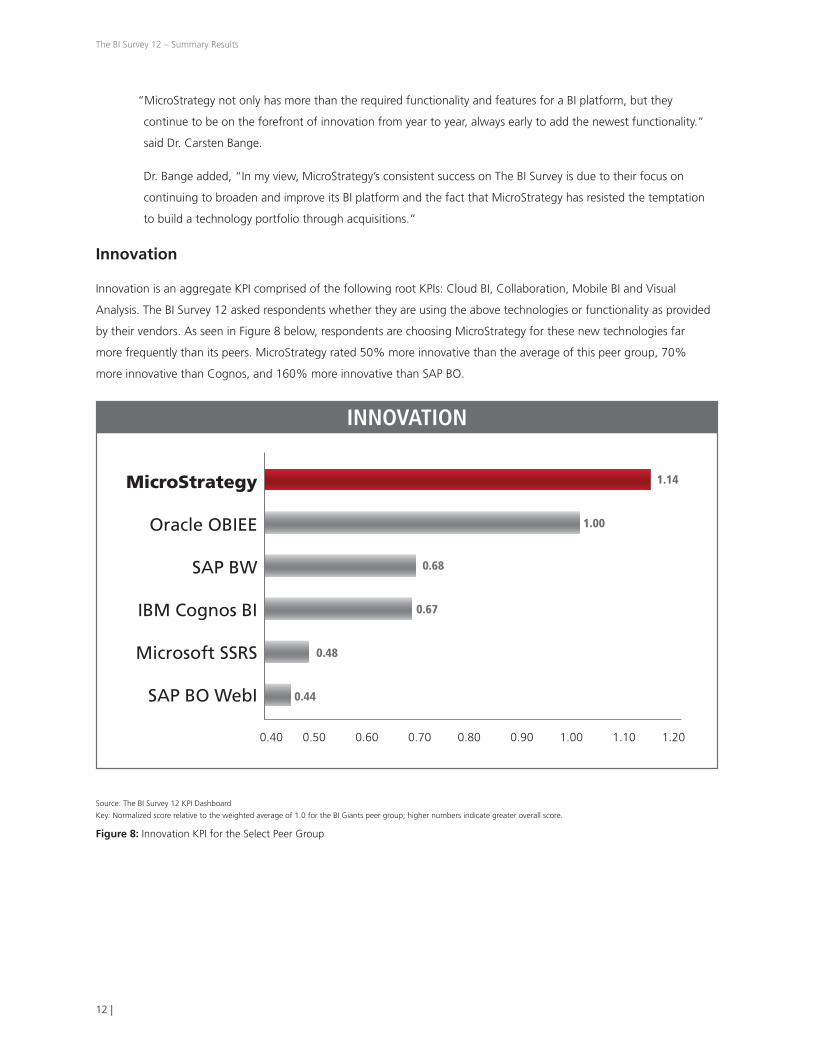
Innovation
Innovation is an aggregate KPI comprised of the following root KPIs: Cloud BI, Collaboration, Mobile BI and Visual
Analysis. The BI Survey 12 asked respondents whether they are using the above technologies or functionality as provided
by their vendors. As seen in Figure 8 below, respondents are choosing MicroStrategy for these new technologies far
more frequently than its peers. MicroStrategy rated 50% more innovative than the average of this peer group, 70%
more innovative than Cognos, and 160% more innovative than SAP BO.
INNOVATION
MicroStrategy
Oracle OBIEE
SAP BW
IBM Cognos BI
Microsoft SSRS
SAP BO WebI
0.40 0.50 0.60 0.70 0.80 0.90 1.00 1.10 1.20
1.14
1.00
0.68
0.67
0.48
0.44
Source: The BI Survey 12 KPI Dashboard
Key: Normalized score relative to the weighted average of 1.0 for the BI Giants peer group; higher numbers indicate greater overall score.
Figure 8: Innovation KPI for the Select Peer Group
The BI Survey 12 – Summary Results
| 13
MOBILE BI
MicroStrategy
Oracle OBIEE
SAP BW
SAP BO WebI
IBM Cognos BI
Microsoft SSRS
0.00 0.50 1.00 1.50 2.00 2.50
2.16
1.03
0.69
0.42
0.31
0.15
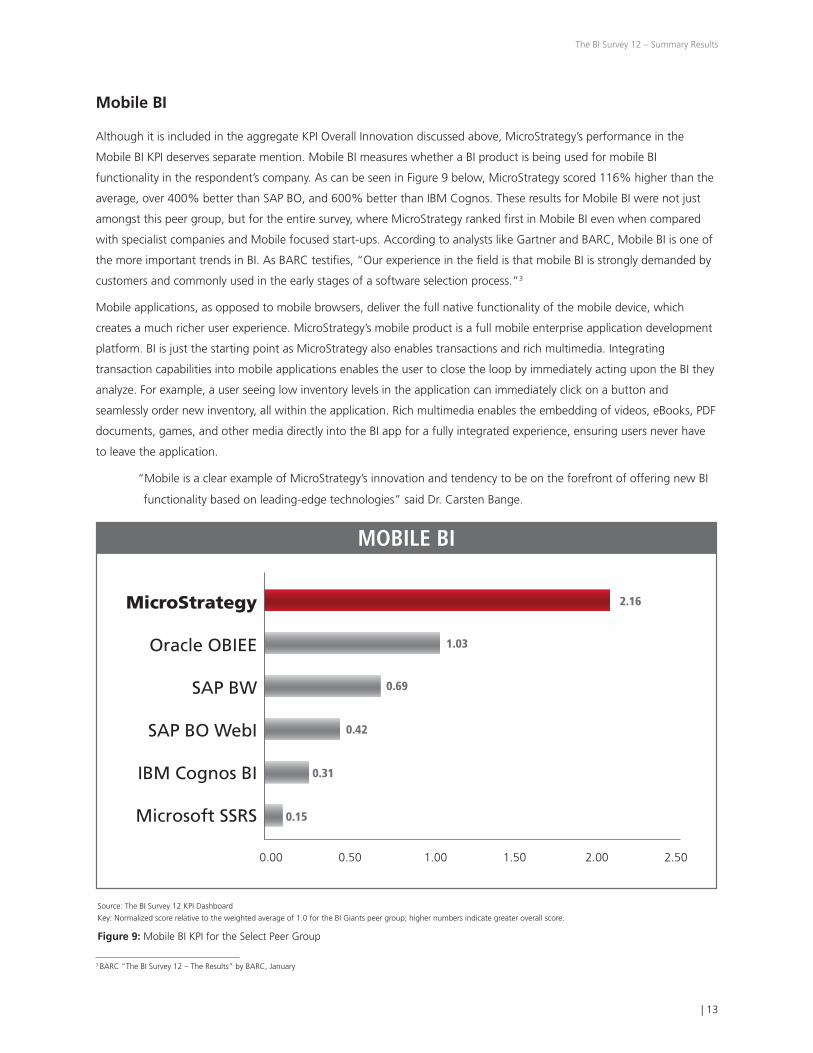
Mobile BI
Although it is included in the aggregate KPI Overall Innovation discussed above, MicroStrategy’s performance in the
Mobile BI KPI deserves separate mention. Mobile BI measures whether a BI product is being used for mobile BI
functionality in the respondent’s company. As can be seen in Figure 9 below, MicroStrategy scored 116% higher than the
average, over 400% better than SAP BO, and 600% better than IBM Cognos. These results for Mobile BI were not just
amongst this peer group, but for the entire survey, where MicroStrategy ranked first in Mobile BI even when compared
with specialist companies and Mobile focused start-ups. According to analysts like Gartner and BARC, Mobile BI is one of
the more important trends in BI. As BARC testifies, “Our experience in the field is that mobile BI is strongly demanded by
customers and commonly used in the early stages of a software selection process.”3
Mobile applications, as opposed to mobile browsers, deliver the full native functionality of the mobile device, which
creates a much richer user experience. MicroStrategy’s mobile product is a full mobile enterprise application development
platform. BI is just the starting point as MicroStrategy also enables transactions and rich multimedia. Integrating
transaction capabilities into mobile applications enables the user to close the loop by immediately acting upon the BI they
analyze. For example, a user seeing low inventory levels in the application can immediately click on a button and
seamlessly order new inventory, all within the application. Rich multimedia enables the embedding of videos, eBooks, PDF
documents, games, and other media directly into the BI app for a fully integrated experience, ensuring users never have
to leave the application.
“Mobile is a clear example of MicroStrategy’s innovation and tendency to be on the forefront of offering new BI
functionality based on leading-edge technologies” said Dr. Carsten Bange.
3 BARC “The BI Survey 12 – The Results” by BARC, January
Source: The BI Survey 12 KPI Dashboard
Key: Normalized score relative to the weighted average of 1.0 for the BI Giants peer group; higher numbers indicate greater overall score.
Figure 9: Mobile BI KPI for the Select Peer Group
The BI Survey 12 – Summary Results
14 |
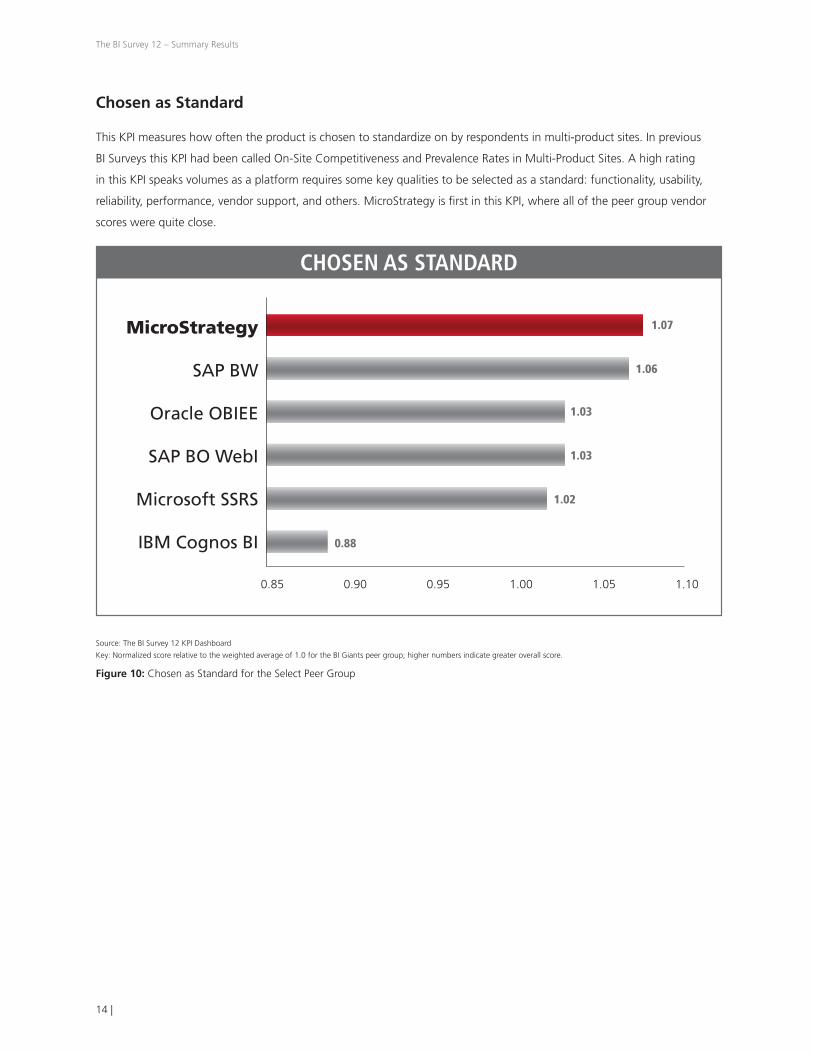
Chosen as Standard
This KPI measures how often the product is chosen to standardize on by respondents in multi-product sites. In previous
BI Surveys this KPI had been called On-Site Competitiveness and Prevalence Rates in Multi-Product Sites. A high rating
in this KPI speaks volumes as a platform requires some key qualities to be selected as a standard: functionality, usability,
reliability, performance, vendor support, and others. MicroStrategy is first in this KPI, where all of the peer group vendor
scores were quite close.
CHOSEN AS STANDARD
MicroStrategy
SAP BW
Oracle OBIEE
SAP BO WebI
Microsoft SSRS
IBM Cognos BI
0.85 0.90 0.95 1.00 1.05 1.10
1.07
1.06
1.03
1.03
1.02
0.88
Source: The BI Survey 12 KPI Dashboard
Key: Normalized score relative to the weighted average of 1.0 for the BI Giants peer group; higher numbers indicate greater overall score.
Figure 10: Chosen as Standard for the Select Peer Group
The BI Survey 12 – Summary Results
| 15
PRODUCT PERFORMANCE
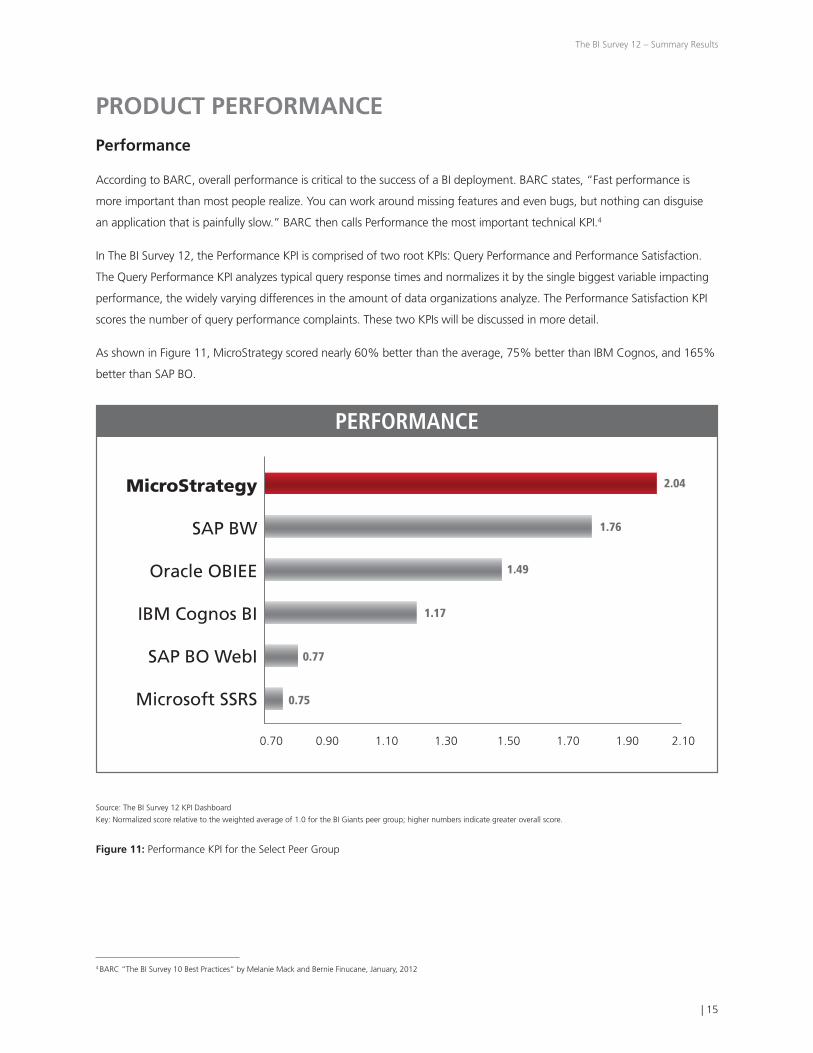
Performance
According to BARC, overall performance is critical to the success of a BI deployment. BARC states, “Fast performance is
more important than most people realize. You can work around missing features and even bugs, but nothing can disguise
an application that is painfully slow.” BARC then calls Performance the most important technical KPI.4
In The BI Survey 12, the Performance KPI is comprised of two root KPIs: Query Performance and Performance Satisfaction.
The Query Performance KPI analyzes typical query response times and normalizes it by the single biggest variable impacting
performance, the widely varying differences in the amount of data organizations analyze. The Performance Satisfaction KPI
scores the number of query performance complaints. These two KPIs will be discussed in more detail.
As shown in Figure 11, MicroStrategy scored nearly 60% better than the average, 75% better than IBM Cognos, and 165%
better than SAP BO.
PERFORMANCE
MicroStrategy
SAP BW
Oracle OBIEE
IBM Cognos BI
SAP BO WebI
Microsoft SSRS
0.70 0.90 1.10 1.30 1.50 1.70 1.90 2.10
2.04
1.76
1.49
1.17
0.77
0.75
Source: The BI Survey 12 KPI Dashboard
Key: Normalized score relative to the weighted average of 1.0 for the BI Giants peer group; higher numbers indicate greater overall score.
Figure 11: Performance KPI for the Select Peer Group
4 BARC “The BI Survey 10 Best Practices” by Melanie Mack and Bernie Finucane, January, 2012

The BI Survey 12 – Summary Results
16 |
Query Performance
Throughout the prior ten years The BI Survey has been administered, query performance has been found to be of utmost
importance to survey respondents. This has not changed in The BI Survey 2012. According to BARC, besides ease of
use for the report designer and recipient, query performance is the “most important single product-related criterion for
choosing a product” and cites that companies that used this as a selection criterion were more successful in business
terms than those that did not. Yet survey data shows that most organizations do not thoroughly evaluate performance
during the product selection stage by benchmarking against real-world customer experiences. 5
As Figure 12 shows, when Query Performance is adjusted for data volumes, MicroStrategy has the highest performance
of any product suite at over 200% the weighted average of all products in the survey. MicroStrategy performed more
than 100% better than IBM Cognos and more than 500% better than SAP BO.
QUERY PERFORMANCE
MicroStrategy
SAP BW
Oracle OBIEE
IBM Cognos BI
SAP BO WebI
Microsoft SSRS
0.30 0.80 1.30 1.80 2.30 2.80 3.30
3.09
2.92
1.95
1.51
0.50
0.34
Source: The BI Survey 12 KPI Dashboard
Key: Normalized score relative to the weighted average of 1.0 for the BI Giants peer Group; higher numbers indicate greater overall score.
Figure 12: Query Performance KPI Adjusted For Data Volumes for the Select Peer Group
“It is particularly impressive that MicroStrategy’s query performance, as measured by a number of KPIs, but
particularly when accounting for data volumes, has scored extremely well each year The BI Survey has been
conducted,” said Dr. Carsten Bange. “Their continued focus on performance throughout their platform, such as
on their In-Memory ROLAP, seems to be successful.”
MicroStrategy’s In-memory ROLAP technology uses the multi-gigabytes of memory space available in 64-bit servers as
“multi-dimensional memory” in which both data and calculations can reside as multi-dimensional datasets called ROLAP
cubes. MicroStrategy reports and dashboards automatically direct their queries to in-memory ROLAP cubes whenever
5 BARC “The BI Survey 12 – The Results” by BARC, January, 2012
The BI Survey 12 – Summary Results
| 17
possible to take advantage of the much faster query performance available with in-memory data as compared to
database-resident storage. If the analysis cannot be satisfied from an in-memory ROLAP cube, MicroStrategy’s Analytical
Engine automatically and dynamically directs queries to the underlying data source using highly optimized SQL.
However, even without the use of In-Memory computing, MicroStrategy’s ROLAP engine has optimized SQL generation
that dramatically enhances performance. The engine is programmed to create unique queries for all major databases
that specifically tap into and take advantage of the strengths and unique SQL variations of those databases. The
engine pushes as much computing as possible down to the databases, minimizing the volume of data sent back over
the network thus increasing the speed of queries. Additional design features like multi-pass SQL and temp tables raise
performance to another level.
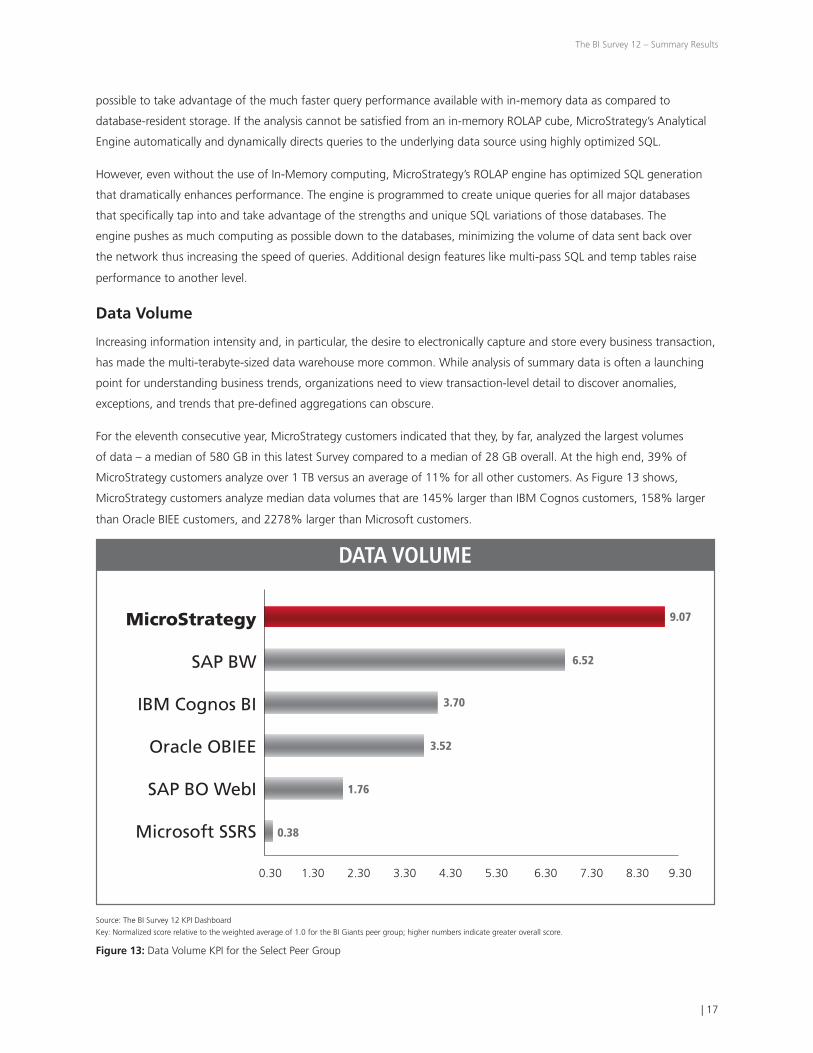
Data Volume
Increasing information intensity and, in particular, the desire to electronically capture and store every business transaction,
has made the multi-terabyte-sized data warehouse more common. While analysis of summary data is often a launching
point for understanding business trends, organizations need to view transaction-level detail to discover anomalies,
exceptions, and trends that pre-defined aggregations can obscure.
For the eleventh consecutive year, MicroStrategy customers indicated that they, by far, analyzed the largest volumes
of data – a median of 580 GB in this latest Survey compared to a median of 28 GB overall. At the high end, 39% of
MicroStrategy customers analyze over 1 TB versus an average of 11% for all other customers. As Figure 13 shows,
MicroStrategy customers analyze median data volumes that are 145% larger than IBM Cognos customers, 158% larger
than Oracle BIEE customers, and 2278% larger than Microsoft customers.
DATA VOLUME
MicroStrategy
SAP BW
IBM Cognos BI
Oracle OBIEE
SAP BO WebI
Microsoft SSRS
0.30 1.30 2.30 3.30 4.30 5.30 6.30 7.30 8.30 9.30
9.07
6.52
3.70
3.52
1.76
0.38
Source: The BI Survey 12 KPI Dashboard
Key: Normalized score relative to the weighted average of 1.0 for the BI Giants peer group; higher numbers indicate greater overall score.
Figure 13: Data Volume KPI for the Select Peer Group

The BI Survey 12 – Summary Results
18 |
“For the eleventh consecutive year, MicroStrategy sites have reported the largest data volumes of all regardless
of peer group with a substantial gap between MicroStrategy and the second-place product,” said Dr. Carsten
Bange He added “Many of MicroStrategy’s customers are implementing transaction-level BI databases resulting
in extremely large data warehouses. MicroStrategy continues to be the clear leader in handling large data
volumes in the enterprise-scale BI segment.”
Cube-based OLAP products, such as those employed by some of the Microsoft and Cognos products, inherently limit the
level of detail that can be analyzed as their speed is based on their data being pre-aggregated. These products are optimized
for analysis of summary-level or small volumes of data, but are not suitable for the more valuable, transaction-level BI
applications. In contrast, MicroStrategy’s proprietary Relational OLAP (ROLAP) technology allows interactive analysis of
multiple terabyte-sized data warehouses, including hundreds of TBs – and at the speed of thought so analyses feel natural.
Big Data
This is an aggregate KPI comprised of the KPIs Data Volume and Variety of Data Types. MicroStrategy scored 110% higher
than Oracle OBIEE, 268% higher than SAP BO, and 609% higher than Microsoft SSRS.
BIG DATA
MicroStrategy
SAP BW
IBM Cognos BI
Oracle OBIEE
SAP BO WebI
Microsoft SSRS
0.50 1.00 1.50 2.00 2.50 3.00 3.50 4.00 4.50 5.00
4.96
3.75
2.35
2.32
1.35
0.70
Source: The BI Survey 12 KPI Dashboard
Key: Normalized score relative to the weighted average of 1.0 for the BI Giants peer group; higher numbers indicate greater overall score.
Figure 14: Big Data KPI for the Select Peer Group
MicroStrategy’s high score on this KPI is testament to two key aspects of the company’s DNA: performance at scale (large
data volumes) and innovation. MicroStrategy’s capabilities with large data volumes have been discussed previously. Although

The BI Survey 12 – Summary Results
| 19
Big Data does not necessarily require Hadoop it is often associated with Hadoop. MicroStrategy has made a substantial
investment to address the innovation being done around Hadoop, including its own. The company has connectors to all
the various Hadoop distributions. Hive is an open source data warehouse capability built to provide some structure on top
of Hadoop. MicroStrategy has built a Hive query engine, akin to its SQL query engine, enabling MicroStrategy users to
seamlessly query those Hadoop implementations with Hive built on top of them. Improving upon Hive, leading Hadoop
vendor Cloudera, built their own data warehousing tool called Impala on top of the Cloudera distribution. MicroStrategy has
developed a real time query engine for Cloudera’s Impala.
Product Satisfaction
The Product Satisfaction KPI measures product problems. As this is a negative measure, the KPI is lower with a larger
number of problems and increases as the number of problems decreases. MicroStrategy’s lead in product satisfaction is
clear from Figure 15. MicroStrategy’s Product Satisfaction score is 20% better then IBM Cognos and nearly 30% better
then SAP BO.
The MicroStrategy platform has been organically designed and built from the ground up with no part of it having been
acquired externally. It’s one of the most unified and organic BI platforms in the market. The result is a higher level of quality.
In contrast, mega-vendor BI platforms like Oracle OBIEE, IBM Cognos, and SAP BO have been cobbled together from
numerous acquisitions. Users see substantial differences in quality between products organically designed and developed by
a single company and products that are the result of numerous acquisitions, some of which cause redundancy and others
that just add complexity.
PRODUCTION SATISFACTION
MicroStrategy
Microsoft SSRS
Oracle OBIEE
IBM Cognos BI
SAP BW
SAP BO WebI
0.80 0.85 0.90 0.95 1.00 1.05 1.10 1.15
1.14
1.09
0.97
0.94
0.91
0.90
Source: The BI Survey 12 KPI Dashboard
Key: Normalized score relative to the weighted average of 1.0 for the BI Giants peer group; higher numbers indicate greater overall score
Figure 15: Production Satisfaction KPI for the Select Peer Group

The BI Survey 12 – Summary Results
20 |
Recommendation
This KPI measures whether existing customers would recommend MicroStrategy. In previous BI Surveys, this KPI was referred
to as Plans for More Licenses. This customer loyalty measure is the basis for the famous Net Promoter Score, which has
become one of the most important measures of customer satisfaction and marketing success in the past ten years. If a
customer is willing to recommend a product, it testifies to their high level of satisfaction and even the mindshare of the
brand. It might be possible to summarize the result of the entire BI Survey down to just this one KPI. On this all important
measure, MicroStrategy came in first amongst its peer group, scoring 11% better than the average and 25% better than
SAP BO.
RECOMMENDATION
MicroStrategy
Microsoft SSRS
Oracle OBIEE
IBM Cognos BI
SAP BO WebI
SAP BW
0.80 0.85 0.90 0.95 1.00 1.05 1.10
1.06
1.02
0.96
0.95
0.88
0.85
Source: The BI Survey 12 KPI Dashboard
Key: Normalized score relative to the weighted average of 1.0 for the BI Giants peer group; higher numbers indicate greater overall score
Figure 16: Recommendation KPI for the Select Peer Group

The BI Survey 12 – Summary Results
| 21
CONCLUSION
The BI Survey 12, the leading independent survey of real-world BI implementations provides unique, statistically significant
insight into actual BI implementations and customer experiences with various BI products. The results of the survey
provide an important guide to the product capabilities and support that users can expect from the various vendors. Survey
respondents are both critical and candid in their assessments. Since the choice of a BI product has a significant impact on
overall BI project success, it is recommended that meaningful product evaluations, starting with a close review of the product
benchmarks in The BI Survey 12, should be conducted when embarking on new BI projects.
Notable in The BI Survey 12 results are the widely varying customer experiences and product results among the BI products.
Some of the many categories in which clear vendor trends have emerged over the past ten years include:
• Overall Satisfaction
• Vendor Support
• Business Benefit
• Functional Usage (Features or Bought for Features)
• Innovation
• Mobile BI
• Chosen as a Standard
• Performance
• Query Performance
• Data Volume
• Product Satisfaction
• Recommendation (Plans for More Licenses)
In the above categories, for the select peer group, MicroStrategy has consistently been a leader, sometimes by a wide
margin, in the eleven years The BI Survey has been conducted. Furthermore, in categories such as Query Performance,
Mobile BI, and Functional Usage (Bought for Features), the gap between MicroStrategy’s leadership position and the
positions of the other vendors continues to grow at an increasing rate.
“MicroStrategy’s consistently strong performance in The BI Survey is indicative of their focus on continuing to
broaden and improve its BI platform and the fact that MicroStrategy has resisted the temptation to build a
technology portfolio through acquisitions. Vendors with less focus on their core BI offering who have branched
out to ancillary BI areas, such as ETL, data quality, and financial applications, are increasingly finding that their
customer base is deterred from broader deployments because of the complexity of the resulting portfolio.”


COPYRIGHT INFORMATION
ALL CONTENTS COPYRIGHT © 2013 MICROSTRATEGY INCORPORATED. ALL RIGHTS RESERVED.
TRADEMARK INFORMATION
MICROSTRATEGY, MICROSTRATEGY 6, MICROSTRATEGY 7, MICROSTRATEGY 7I, MICROSTRATEGY 7I EVALUATION EDITION, MICROSTRATEGY 7I OLAP SERVICES, MICROSTRATEGY 8, MICROSTRATEGY 9, MICROSTRATEGY DISTRIBUTION SERVICES, MICROSTRATEGY MULTISOURCE OPTION, MICROSTRATEGY COMMAND MANAGER, MICROSTRATEGY ENTERPRISE MANAGER, MICROSTRATEGY OBJECT MANAGER, MICROSTRATEGY REPORTING SUITE, MICROSTRATEGY POWER USER, MICROSTRATEGY ANALYST, MICROSTRATEGY CONSUMER, MICROSTRATEGY EMAIL DELIVERY, MICROSTRATEGY BI AUTHOR, MICROSTRATEGY BI MODELER, MICROSTRATEGY EVALUATION EDITION, MICROSTRATEGY ADMINISTRATOR, MICROSTRATEGY AGENT, MICROSTRATEGY ARCHITECT, MICROSTRATEGY BI DEVELOPER KIT, MICROSTRATEGY BROADCAST SERVER, MICROSTRATEGY BROADCASTER, MICROSTRATEGY BROADCASTER SERVER, MICROSTRATEGY BUSINESS INTELLIGENCE PLATFORM, MICROSTRATEGY CONSULTING, MICROSTRATEGY CRM APPLICATIONS, MICROSTRATEGY CUSTOMER ANALYZER, MICROSTRATEGY DESKTOP, MICROSTRATEGY DESKTOP ANALYST, MICROSTRATEGY DESKTOP DESIGNER, MICROSTRATEGY ECRM 7, MICROSTRATEGY EDUCATION, MICROSTRATEGY ETRAINER, MICROSTRATEGY EXECUTIVE, MICROSTRATEGY INFOCENTER, MICROSTRATEGY INTELLIGENCE SERVER, MICROSTRATEGY INTELLIGENCE SERVER UNIVERSAL EDITION, MICROSTRATEGY MDX ADAPTER, MICROSTRATEGY NARROWCAST SERVER, MICROSTRATEGY OBJECTS, MICROSTRATEGY OLAP PROVIDER, MICROSTRATEGY SDK, MICROSTRATEGY SUPPORT, MICROSTRATEGY TELECASTER, MICROSTRATEGY TRANSACTOR, MICROSTRATEGY WEB, MICROSTRATEGY WEB BUSINESS ANALYZER, MICROSTRATEGY WORLD, APPLICATION DEVELOPMENT AND SOPHISTICATED ANALYSIS, BEST IN BUSINESS INTELLIGENCE, CENTRALIZED APPLICATION MANAGEMENT, INFORMATION LIKE WATER, INTELLIGENCE THROUGH EVERY PHONE, INTELLIGENCE TO EVERY DECISION MAKER, INTELLIGENT E-BUSINESS, PERSONALIZED INTELLIGENCE PORTAL, QUERY TONE, RAPID APPLICATION DEVELOPMENT, MICROSTRATEGY INTELLIGENT CUBES, THE FOUNDATION FOR INTELLIGENT E-BUSINESS, THE INTEGRATED BUSINESS INTELLIGENCE PLATFORM BUILT FOR THE ENTERPRISE, THE PLATFORM FOR INTELLIGENT E-BUSINESS, THE SCALABLE BUSINESS INTELLIGENCE PLATFORM BUILT FOR THE INTERNET, OFFICE INTELLIGENCE, MICROSTRATEGY OFFICE, MICROSTRATEGY REPORT SERVICES, MICROSTRATEGY WEB MMT, MICROSTRATEGY WEB SERVICES, PIXEL PERFECT, PIXEL-PERFECT, MICROSTRATEGY MOBILE, MICROSTRATEGY INTEGRITY MANAGER AND MICROSTRATEGY DATA MINING SERVICES ARE ALL REGISTERED TRADEMARKS OR TRADEMARKS OF MICROSTRATEGY INCORPORATED.
ALL OTHER COMPANY AND PRODUCT NAMES MAY BE TRADEMARKS OF THE RESPECTIVE COMPANIES WITH WHICH THEY ARE ASSOCIATED. SPECIFICATIONS SUBJECT TO CHANGE WITHOUT NOTICE. MICROSTRATEGY IS NOT RESPONSIBLE FOR ERRORS OR OMISSIONS. MICROSTRATEGY MAKES NO WARRANTIES OR COMMITMENTS CONCERNING THE AVAILABILITY OF FUTURE PRODUCTS OR VERSIONS THAT MAY BE PLANNED OR UNDER DEVELOPMENT.
PATENT INFORMATION
THIS PRODUCT IS PATENTED. ONE OR MORE OF THE FOLLOWING PATENTS MAY APPLY TO THE PRODUCT SOLD HEREIN: U.S. PATENT NOS. 6,154,766, 6,173,310, 6,260,050, 6,263,051, 6,269,393, 6,279,033, 6,567,796, 6,587,547, 6,606,596, 6,658,093, 6,658,432, 6,662,195, 6,671,715, 6,691,100, 6,694,316, 6,697,808, 6,704,723, 6,741,980, 6,765,997, 6,768,788, 6,772,137, 6,788,768, 6,798,867, 6,801,910, 6,820,073, 6,829,334, 6,836,537, 6,850,603, 6,859,798, 6,873,693, 6,885,734, 6,940,953, 6,964,012, 6,977,992, 6,996,568, 6,996,569, 7,003,512, 7,010,518, 7,016,480, 7,020,251, 7,039,165, 7,082,422, 7,113,993, 7,127,403, 7,174,349, 7,181,417, 7,194,457, 7,197,461, 7,228,303, 7,260,577, 7,266,181, 7,272,212, 7,302,639, 7,324,942, 7,330,847, 7,340,040, 7,356,758, 7,356,840, 7,415,438, 7,428,302, 7,430,562, 7,440,898, 7,486,780, 7,509,671, 7,516,181, 7,559,048, 7,574,376, 7,617,201, 7,725,811, 7,801,967, 7,836,178, 7,861,161, 7,861,253, 7,881,443, 7,925,616, 7,945,584, 7,970,782, 8,005,870, 8,051,168, 8,051,369, 8,094,788 AND 8,130,918. OTHER PATENT APPLICATIONS ARE PENDING.
COLL-1114 0113