bilateral trade between the dominican republic …pdf.usaid.gov/pdf_docs/pnado435.pdf · bilateral...
TRANSCRIPT
BILATERAL TRADE BETWEEN THE DOMINICAN REPUBLIC AND THE UNITED STATES OF AMERICA
August 2005 This report was written by Araujo Ibarra & Asociados S.A. for Chemonics International Inc., under Contract No. PCE-I-19-98-00015-00.
BILATERAL TRADE BETWEEN THE DOMINICAN REPUBLIC AND THE UNITED STATES OF AMERICA
WAIVER The opinions expressed by the author in this publication do not necessarily reflect those of either the United States Agency for International Development or the United States Government.
TABLE OF CONTENTS Acronyms ii Executive Summary iii SECTION I INTRODUCTION I-1 SECTION II INTERNATIONAL ENVIRONMENT AND ECONOMY OF THE RD
FOR 2004 II-1 SECTION III RELATIONS OF THE U.S.A. AND THE DOMINICAN REPUBLIC III-1 SECTION IV U.S. TRADE BALANCE WITH THE DOMINICAN REPUBLIC IV-1 SECTION V ANALYSIS OF THE TRADE BALANCE TO TWO DIGITS OF THE CUSTOMS TARIFF V-1
A. Primary Exports of DR to the U.S.A. V-2 B. Primary DR Imports Coming from the U.S. V-5
SECTION VI ANALYSIS BY SECTOR VI-1 A. DR Imports from the U.S. VI-2
B. Exports from the DR to the U.S. by Sectors VI-5 C. Trade Balance by Sector VI-7
SECTION VII BILATERAL TRADE – 10 DIGITS OF THE CUSTOMS TARIFF VII-1 A. Primary Imports of the DR from the U.S. to 10 Digits VII-2 B. Primary Imports from the DR to the U.S. to 10 Digits VII-6 SECTION VIII BIBLIOGRAPHY VIII-1 APPENDIX A DESCRIPTION OF CUSTOMS TARIFF CHAPTERS A-1
ACRONYMS AMCHAM American Chamber of Commerce CEPAL United Nations Economic Commission for Latin America and
the Caribbean DR Dominican Republic DR-CAFTA U.S. Free Trade Agreement with Central America and the
Dominican Republic
NAFTA North American Free Trade Agreement SEGIR Support for Economic Growth and Institutional Reform USA United States of America USAID United States Agency for International Development
BILATERAL TRADE BETWEEN THE DOMINICAN REPUBIC AND THE UNITED STATES OF AMERICA II
Executive Summary
Executive Summary This report is part of a group of studies financed by the U.S. Agency for International Development (USAID) though the Support for Economic Growth and Institutional Reform Project (SEGIR, by its English acronym), which are intended to support the National Competitiveness Council and the American Chamber of Commerce of the Dominican Republic (AMCHAM) in the preparation, identification and development of a strategy to take advantage of commerce and investment opportunities presented by CAFTA-DR for the Dominican Republic (DR). The set of studies consists of the following five modules. Module 1: Bilateral Trade between the Dominican Republic and the United States Module 2: Dominican Republic Exports and Investment Guide Module 3: Logistics Guide for the Dominican Republic Module 4: Analysis of imports and exports with the corresponding selling prices. Module 5: Identification of 200 Dominican Republic products with greater potential in
the United States (U.S.A.) analyzed to 10 customs tariff digits Design of computer software for this purpose.
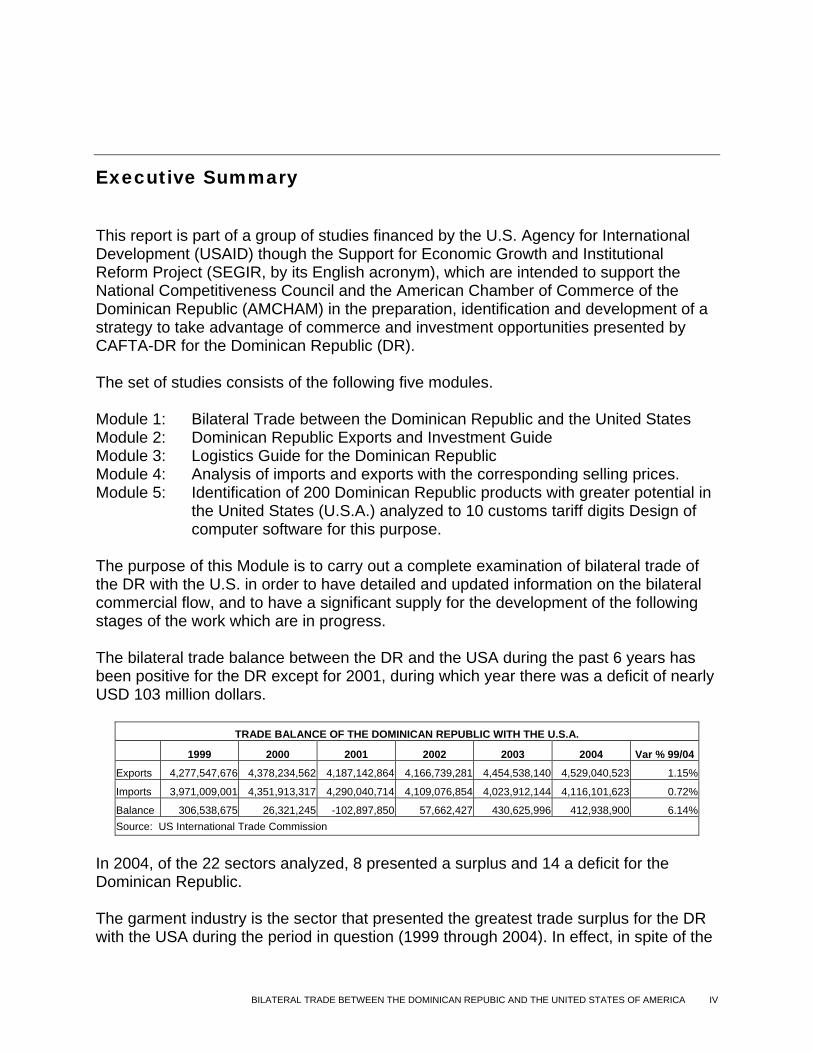
The purpose of this Module is to carry out a complete examination of bilateral trade of the DR with the U.S. in order to have detailed and updated information on the bilateral commercial flow, and to have a significant supply for the development of the following stages of the work which are in progress. The bilateral trade balance between the DR and the USA during the past 6 years has been positive for the DR except for 2001, during which year there was a deficit of nearly USD 103 million dollars.
TRADE BALANCE OF THE DOMINICAN REPUBLIC WITH THE U.S.A. 1999 2000 2001 2002 2003 2004 Var % 99/04
Exports 4,277,547,676 4,378,234,562 4,187,142,864 4,166,739,281 4,454,538,140 4,529,040,523 1.15%
Imports 3,971,009,001 4,351,913,317 4,290,040,714 4,109,076,854 4,023,912,144 4,116,101,623 0.72%
Balance 306,538,675 26,321,245 -102,897,850 57,662,427 430,625,996 412,938,900 6.14%Source: US International Trade Commission
In 2004, of the 22 sectors analyzed, 8 presented a surplus and 14 a deficit for the Dominican Republic. The garment industry is the sector that presented the greatest trade surplus for the DR with the USA during the period in question (1999 through 2004). In effect, in spite of the
BILATERAL TRADE BETWEEN THE DOMINICAN REPUBIC AND THE UNITED STATES OF AMERICA IV
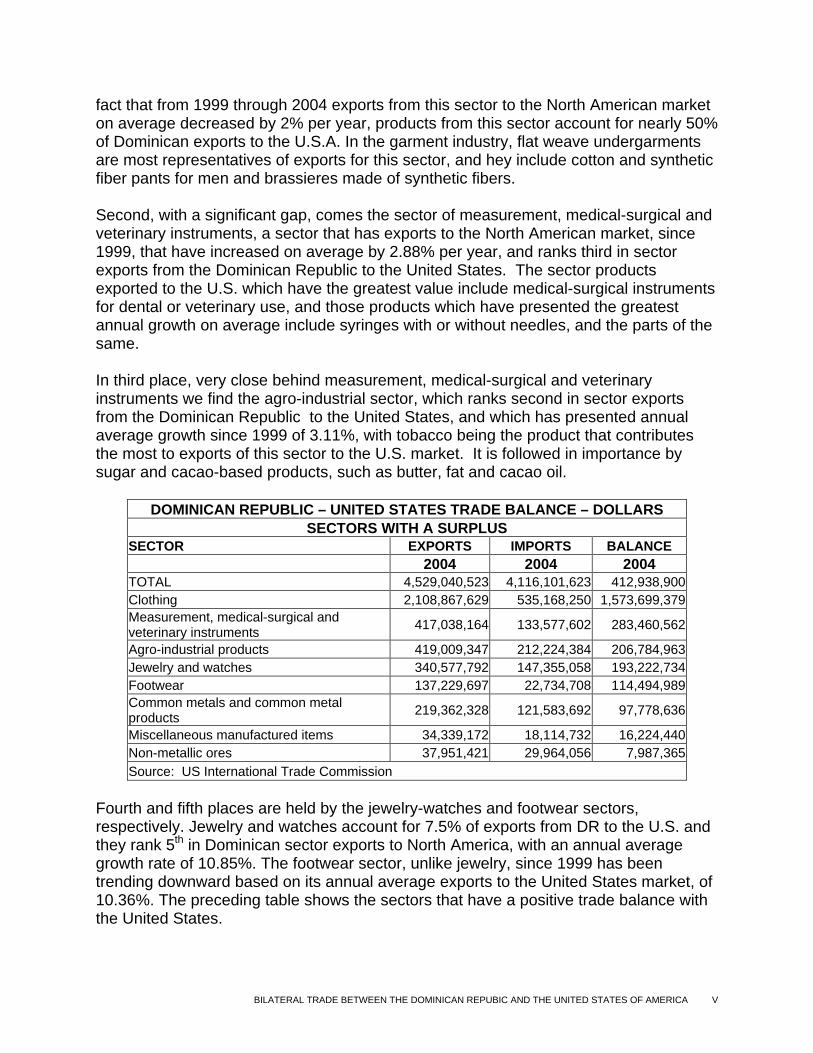
fact that from 1999 through 2004 exports from this sector to the North American market on average decreased by 2% per year, products from this sector account for nearly 50% of Dominican exports to the U.S.A. In the garment industry, flat weave undergarments are most representatives of exports for this sector, and hey include cotton and synthetic fiber pants for men and brassieres made of synthetic fibers. Second, with a significant gap, comes the sector of measurement, medical-surgical and veterinary instruments, a sector that has exports to the North American market, since 1999, that have increased on average by 2.88% per year, and ranks third in sector exports from the Dominican Republic to the United States. The sector products exported to the U.S. which have the greatest value include medical-surgical instruments for dental or veterinary use, and those products which have presented the greatest annual growth on average include syringes with or without needles, and the parts of the same. In third place, very close behind measurement, medical-surgical and veterinary instruments we find the agro-industrial sector, which ranks second in sector exports from the Dominican Republic to the United States, and which has presented annual average growth since 1999 of 3.11%, with tobacco being the product that contributes the most to exports of this sector to the U.S. market. It is followed in importance by sugar and cacao-based products, such as butter, fat and cacao oil.
DOMINICAN REPUBLIC – UNITED STATES TRADE BALANCE – DOLLARS SECTORS WITH A SURPLUS
SECTOR EXPORTS IMPORTS BALANCE 2004 2004 2004 TOTAL 4,529,040,523 4,116,101,623 412,938,900Clothing 2,108,867,629 535,168,250 1,573,699,379Measurement, medical-surgical and veterinary instruments 417,038,164 133,577,602 283,460,562
Agro-industrial products 419,009,347 212,224,384 206,784,963Jewelry and watches 340,577,792 147,355,058 193,222,734Footwear 137,229,697 22,734,708 114,494,989Common metals and common metal products 219,362,328 121,583,692 97,778,636
Miscellaneous manufactured items 34,339,172 18,114,732 16,224,440Non-metallic ores 37,951,421 29,964,056 7,987,365Source: US International Trade Commission
Fourth and fifth places are held by the jewelry-watches and footwear sectors, respectively. Jewelry and watches account for 7.5% of exports from DR to the U.S. and they rank 5th in Dominican sector exports to North America, with an annual average growth rate of 10.85%. The footwear sector, unlike jewelry, since 1999 has been trending downward based on its annual average exports to the United States market, of 10.36%. The preceding table shows the sectors that have a positive trade balance with the United States.
BILATERAL TRADE BETWEEN THE DOMINICAN REPUBIC AND THE UNITED STATES OF AMERICA V
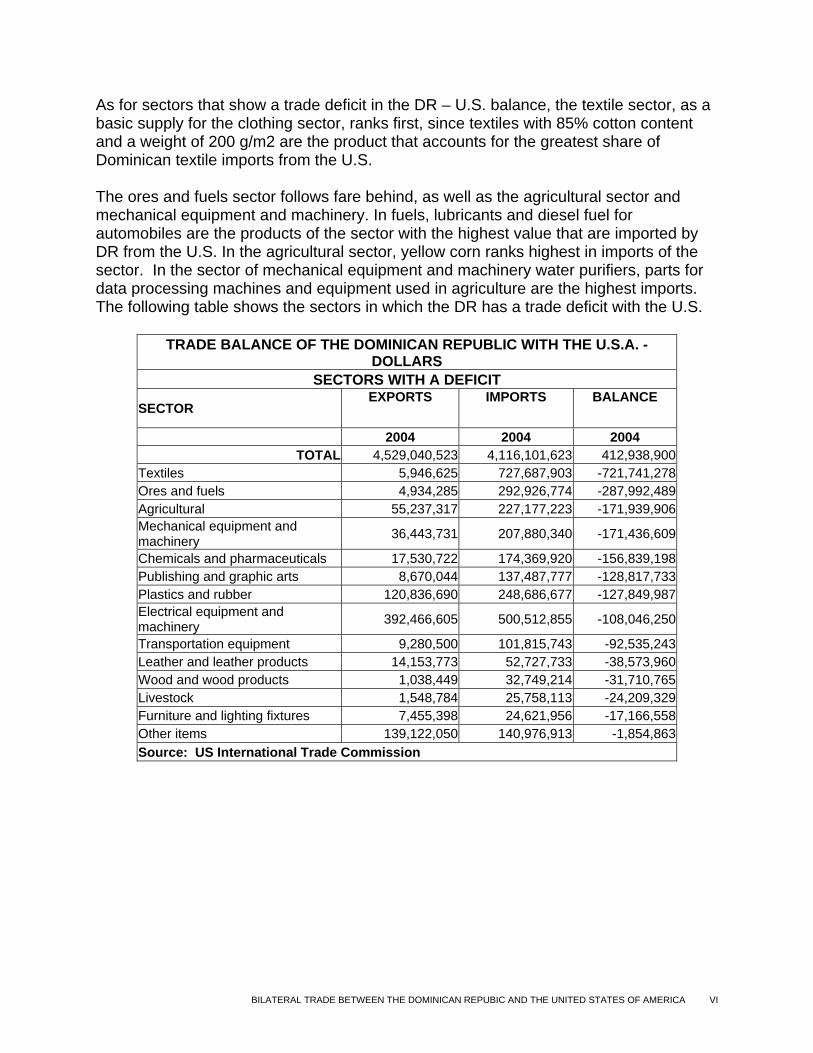
As for sectors that show a trade deficit in the DR – U.S. balance, the textile sector, as a basic supply for the clothing sector, ranks first, since textiles with 85% cotton content and a weight of 200 g/m2 are the product that accounts for the greatest share of Dominican textile imports from the U.S. The ores and fuels sector follows fare behind, as well as the agricultural sector and mechanical equipment and machinery. In fuels, lubricants and diesel fuel for automobiles are the products of the sector with the highest value that are imported by DR from the U.S. In the agricultural sector, yellow corn ranks highest in imports of the sector. In the sector of mechanical equipment and machinery water purifiers, parts for data processing machines and equipment used in agriculture are the highest imports. The following table shows the sectors in which the DR has a trade deficit with the U.S. TRADE BALANCE OF THE DOMINICAN REPUBLIC WITH THE U.S.A. -
DOLLARS SECTORS WITH A DEFICIT
SECTOR EXPORTS
IMPORTS
BALANCE
2004 2004 2004
TOTAL 4,529,040,523 4,116,101,623 412,938,900Textiles 5,946,625 727,687,903 -721,741,278Ores and fuels 4,934,285 292,926,774 -287,992,489Agricultural 55,237,317 227,177,223 -171,939,906Mechanical equipment and machinery 36,443,731 207,880,340 -171,436,609
Chemicals and pharmaceuticals 17,530,722 174,369,920 -156,839,198Publishing and graphic arts 8,670,044 137,487,777 -128,817,733Plastics and rubber 120,836,690 248,686,677 -127,849,987Electrical equipment and machinery 392,466,605 500,512,855 -108,046,250
Transportation equipment 9,280,500 101,815,743 -92,535,243Leather and leather products 14,153,773 52,727,733 -38,573,960Wood and wood products 1,038,449 32,749,214 -31,710,765Livestock 1,548,784 25,758,113 -24,209,329Furniture and lighting fixtures 7,455,398 24,621,956 -17,166,558Other items 139,122,050 140,976,913 -1,854,863Source: US International Trade Commission
BILATERAL TRADE BETWEEN THE DOMINICAN REPUBIC AND THE UNITED STATES OF AMERICA VI
SECTION I
INTRODUCTION
SECTION I INTRODUCTION This report is part of a group of studies financed by the U.S. Agency for International Development (USAID) though the Support for Economic Growth and Institutional Reform Project (SEGIR, by its English acronym), which are intended to support the National Competitiveness Council and the American Chamber of Commerce of the Dominican Republic (AMCHAM) in the preparation, identification and development of a strategy to take advantage of commerce and investment opportunities presented by CAFTA-DR for the Dominican Republic (DR). The set of studies consists of the following five modules. Module 1: Bilateral Trade between the Dominican Republic and the United States Module 2: Dominican Republic Exports and Investment Guide Module 3: Logistics Guide for the Dominican Republic Module 4: Analysis of imports and exports with the corresponding selling prices. Module 5: Identification of 200 Dominican Republic products with greater potential in
the United States (U.S.A.) analyzed to 10 customs tariff digits Design of computer software for this purpose.
The purpose of this Module is to carry out a complete examination of bilateral trade of the DR with the U.S. in order to have detailed and updated information on the bilateral commercial flow, and to have a significant supply for the development of the following stages of the work which are in progress. This document conducts the following analyses:
• Study of the Trade Balance between the U.S. and the Dominican Republic. • Study of the 99 customs tariff classifications, analysis to two (2) digits of all
foreign trade between the two countries • Study of bilateral trade by sectors (22), identifying the most dynamic and
representative products from each sector. • Study of the primary imports and exports to ten (10) customs tariff digits.
By way of introduction, the international environment and economy of the Dominican Republic during 2004 will be examined briefly, as well as the possible effects of the implementation of CAFTA-DR for the country.
BILATERAL TRADE BETWEEN THE DOMINICAN REPUBIC AND THE UNITED STATES OF AMERICA I-2 2
SECTION II ECONOMY AND THE INTERNATIONAL ENVIRONMENT IN THE DOMINICAN REPUBLIC FOR 2004
SECTION II ECONOMY AND THE INTERNATIONAL ENVIRONMENT IN THE DOMINICAN REPUBLIC FOR 2004 According to CEPAL1, in 2004 economic activity in the Dominican Republic grew by 2%, which allowed the decrease of 1.9% from 2003 to be offset. This exceeded the results predicted at the beginning of the year. So the international environment was favorable, and therefore the export sector showed positive, though moderate, growth. As for exports of goods and services, this category’s dynamics tapered off, and only increased by 3.8% in comparison to 8.5% in 2003. Sales of domestic goods, which represented 23% of the total, achieved their best performance by maintaining a high growth rate (25%). In particular, iron-nickel (63% and tobacco (116%) are noteworthy, as they were driven by the considerable exchange depreciation and high international prices. Other categories in which increases occurred were the sale of fuels at ports, and a diverse set of non-traditional goods of lesser relative importance. The adverse climatic conditions affected coffee and cacao production, therefore exports of these items fell. For the fourth year in a row, exporters in free trade zones faced difficulties recovering the high degree of dynamism that typified their activities during the second half of the nineties. In 2004, they increased only 0.2%, as a result of the intensification of competition from Asian producers in the U.S. markets, a situation which also affected other countries in the northern Latin America region. Traditional exports of clothing and footwear decreased their foreign shipments by 5.5% and 3.4% respectively. Other items, in contrast, improved their performance. In this category we must make special mention of jewelry and related items (19.2%), tobacco manufactured products (12.7%) and pharmaceutical products (8.3%). In spite of this overview, new companies came into the free trade zones in 2004, therefore the number of the same went from 531 to 569, and there was a perceptible increase in occupation, which totaled 189,853 persons. 1 CEPAL STUDY. “DOMINICAN REPUBLIC. ECONOMIC PROGRESS DURING 2004 AND PROSPECTS FOR 2005.” LC/MEX/L.670 – July 21, 2005
BILATERAL TRADE BETWEEN THE DOMINICAN REPUBIC AND THE UNITED STATES OF AMERICA II-2
The value of exported services experienced a setback, increasing only 1.8%, after having increased by 13.1% in 2003. The impact of hurricane Jean during the last quarter of 2004 caused some damage to the hotel infrastructure, a phenomena that temporarily reduced employment in certain areas. Two point eight million tourists came to the DR, which is an increase of 4.1% over the previous year, which generated revenue of 3.18 billion dollars. In general, the sector faced better external conditions, taking into consideration that international tourism rallied significantly based on the world economic recovery. The devaluation of the Dominican peso also influenced the tourism sector and the greater buying power of the Euro vis-à-vis the dollar favored European tourists, who represent 44.9% of all tourism. Nevertheless, average daily expenditures were practically level (0.7%), while the average stay fell by 3.3%. So, the traditional surplus in the balance of services totaled 2.328 million dollars, a figure that moderately exceeded the goods trade deficit. Imports of goods recovered only 2.9%, after a decline of 13.7% in the previous year, caused by the fall in domestic demand, which caused the banking crisis. The recovery of productive activity intended for the domestic market caused imports to grow by 5.4%, after declining 18.3% in 2003. So, purchases of intermediate goods rose 10.9%, but this change was affected by the increase in international prices for oil and oil by-products. Excluding oil, supplies rose by 2.8%, in the face of higher activity in the industries of food, chemical products and plastic materials, and purchases of cast iron and steel materials. The gradual strengthening of buying power of the people drove higher imports of consumer goods (5.9%), with an especially marked increase in durable goods, although one must also consider the replacement of inventories. Lastly, the persistent decline in investment explains the drop in imports of capital goods (4.9%), compared to 29% in the previous year. Purchases of construction and transport equipment were particularly low.
BILATERAL TRADE BETWEEN THE DOMINICAN REPUBIC AND THE UNITED STATES OF AMERICA II-3
SECTION III RELATIONS BETWEEN THE UNITED STATES AND THE DOMINICAN REPUBLIC
SECTION III RELATIONS BETWEEN THE UNITED STATES AND THE DOMINICAN REPUBLIC It is apparent that the entry into force of the Free Trade Agreement (CAFTA-DR) will have significant consequences for the DR, in the short-, as well as the medium- and long-term. The effects of the treaty are primarily due to two aspects: - As a first measure, a marked disparity of size and degree of development is noted between the United States economy and that of the DR. - Furthermore, the strong integration and economic dependency that Central America and the DR has historically had with the U.S., which has become deeper during the past few decades as a result of:
• Mass migrations to the U.S. • The policy of external opening of Central America since the beginning of
the nineties, that has caused a substantive increase in North American imports to the region.
The application of unilateral commercial regimens by the U.S. that have favored non-traditional exports of an industrial (assembly) and agricultural origin from Central America to the U.S.2
In this manner expert Jorge Máttar3 ensured that the CAFTA-DR treaty will increase the dependence of Central American countries and the DR, with the world economic power. The expert warned that now it will no longer be just Mexico that gets a cold when the U.S. sneezes, but rather is effects will also be strong in these countries, although with each favorable economic stage experienced by the U.S., the region will also benefit. It is for this reason that if we follow the same path as Mexico, which has been a partner with the U.S. and Canada since 1994 through the North American Free Trade Agreement (NAFTA), the signatory counties could increase heir vulnerability to the economic dynamic of the U.S.
Taking into consideration that Mexico focused its trade even more on the U.S. with the signing of the Treaty, Central American countries and the DR are going down the same
2 THE IMPACT OF CAFTA ON THE CENTRAL AMERICAN DEVELOPMENT MODEL (ON-GOING RESEARCH) AUGUST 2004 INVESTIGATOR: ALEXANDER SEGOVIA 3 ASSISTANT DIRECTOR OF THE CEPAL HEADQUARTERS IN MEXICO.
BILATERAL TRADE BETWEEN THE DOMINICAN REPUBIC AND THE UNITED STATES OF AMERICA III-2
path, since to date the U.S. has between 45 and 55 percent of their trade, depending on the country.
Unlike the case wit Mexico, Central American countries have strong trade with their neighbors, based on small manufacturing, such as machinery parts and spares, automobiles and chemical products. At the same time sales t the U.S. basically consist of raw materials such as coffee, meat and sugar, in addition to textiles.
In light of the Mexican experience, the DR must attempt to diversify its trade, seeking out other market niches and generated a higher added value, taking into consideration that it may not come up against difficult competitive factors, as is the case of China with its cheap labor, or as climatic factors that are a considerable factor on its economy, and therefore its exports, such as the case with coffee.
From the positive point of view, CAFTA-DR will bring benefits to the various countries, since it will reinforce the new model of economic development that the majority of Central American countries have adopted since the nineties, causing the private sector to have an increasing presence in the economy, and causing the governments to orient their economies towards abroad, thus considering external opening as the central element, so that they may achieve greater growth and development.
Taking into account these prospects, the DR must take advantage of the benefits of CAFTA-DR, in order to be able to increase its exports to the U.S., but at the same time, it must diversify its trade with other countries and offer a higher added value for its goods and services.
BILATERAL TRADE BETWEEN THE DOMINICAN REPUBIC AND THE UNITED STATES OF AMERICA III-3
SECTION IV TRADE BALANCE OF THE UNITED STATES WITH THE DOMINICAN REPUBLIC
SECTION IV TRADE BALANCE OF THE UNITED STATES WITH THE DOMINICAN REPUBLIC
DOMINICAN REPUBLIC – U.S. TRADE BALANCE COMERCIAL REPUBLICA DOMINICANA EU
-1,000,000,000
0
1,000,000,000
2,000,000,000
3,000,000,000
4,000,000,000
5,000,000,000
1999 2000 2001 2002 2003 2004
US$
EXPORTS IMPORTS BALANCE
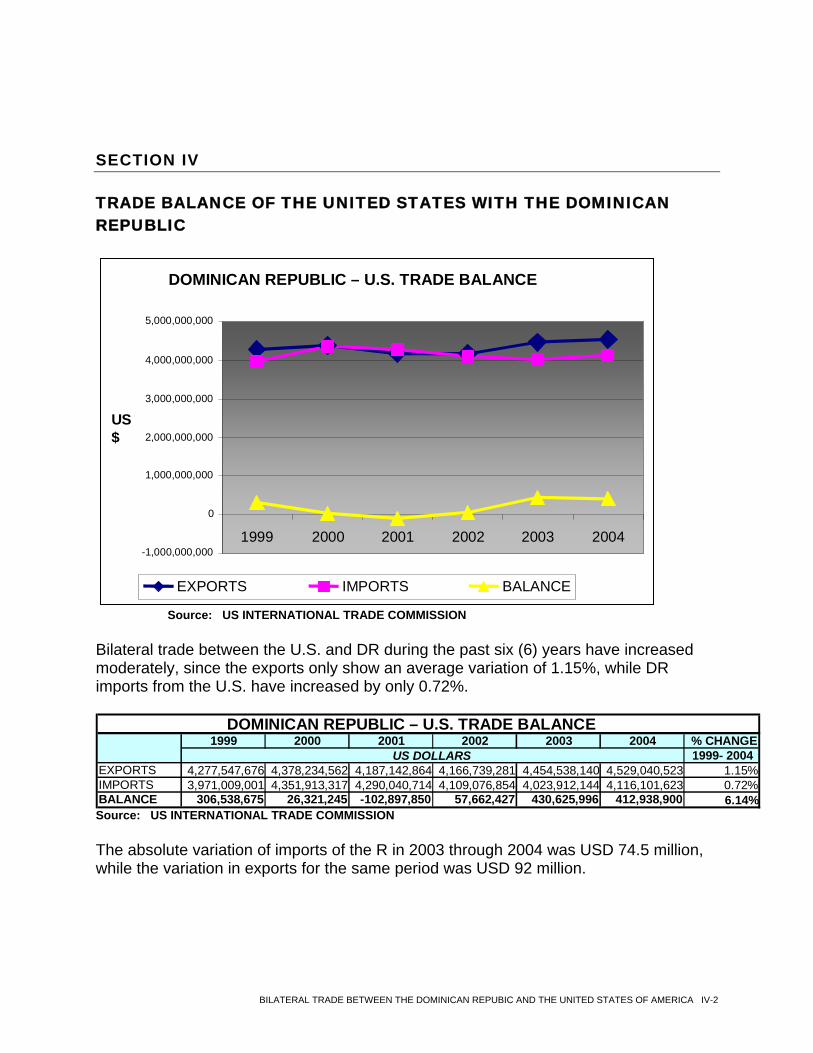
Source: US INTERNATIONAL TRADE COMMISSION Bilateral trade between the U.S. and DR during the past six (6) years have increased moderately, since the exports only show an average variation of 1.15%, while DR imports from the U.S. have increased by only 0.72%.
1999 2000 2001 2002 2003 2004 % CHANGE1999- 2004
EXPORTS 4,277,547,676 4,378,234,562 4,187,142,864 4,166,739,281 4,454,538,140 4,529,040,523 1.15%IMPORTS 3,971,009,001 4,351,913,317 4,290,040,714 4,109,076,854 4,023,912,144 4,116,101,623 0.72%BALANCE 306,538,675 26,321,245 -102,897,850 57,662,427 430,625,996 412,938,900 6.14%
DOMINICAN REPUBLIC – U.S. TRADE BALANCE
US DOLLARS
Source: US INTERNATIONAL TRADE COMMISSION The absolute variation of imports of the R in 2003 through 2004 was USD 74.5 million, while the variation in exports for the same period was USD 92 million.
BILATERAL TRADE BETWEEN THE DOMINICAN REPUBIC AND THE UNITED STATES OF AMERICA IV-2
SECTION V ANALYSIS OF THE TRADE BALANCE TO TWO DIGITS OF THE CUSTOMS TARIFF CODE
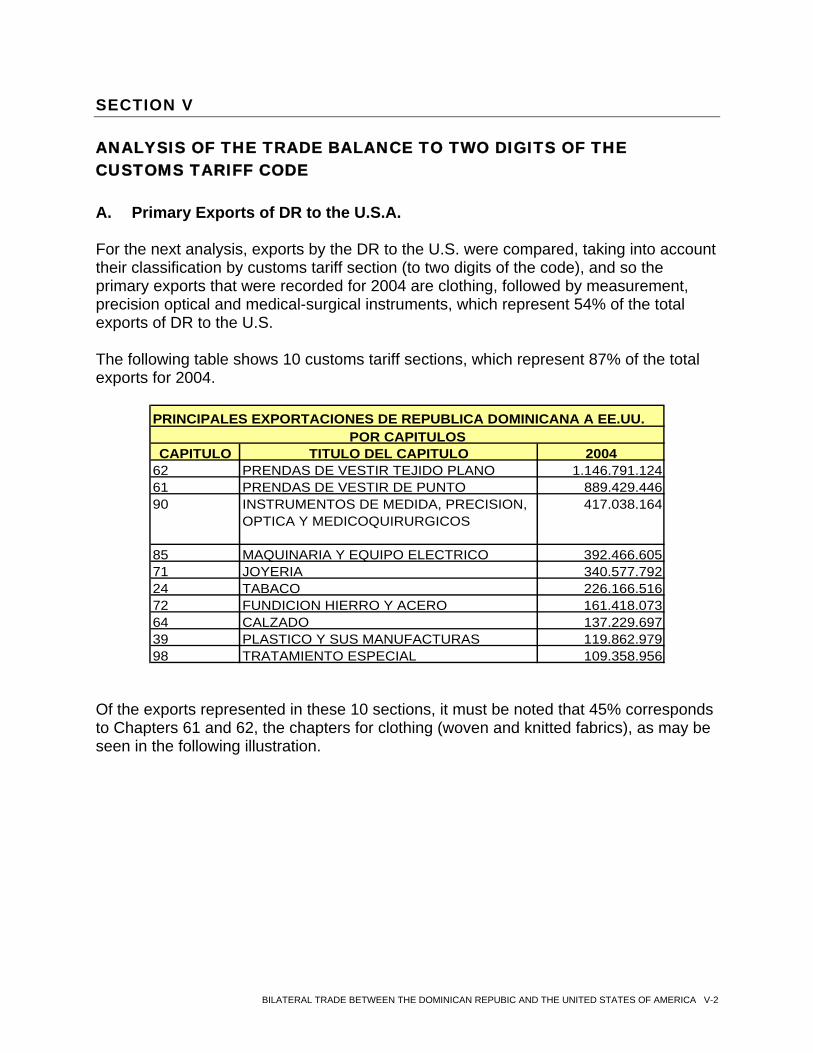
SECTION V ANALYSIS OF THE TRADE BALANCE TO TWO DIGITS OF THE CUSTOMS TARIFF CODE A. Primary Exports of DR to the U.S.A. For the next analysis, exports by the DR to the U.S. were compared, taking into account their classification by customs tariff section (to two digits of the code), and so the primary exports that were recorded for 2004 are clothing, followed by measurement, precision optical and medical-surgical instruments, which represent 54% of the total exports of DR to the U.S. The following table shows 10 customs tariff sections, which represent 87% of the total exports for 2004.
PRINCIPALES EXPORTACIONES DE REPUBLICA DOMINICANA A EE.UU.
CAPITULO TITULO DEL CAPITULO 200462 PRENDAS DE VESTIR TEJIDO PLANO 1.146.791.12461 PRENDAS DE VESTIR DE PUNTO 889.429.44690 INSTRUMENTOS DE MEDIDA, PRECISION,
OPTICA Y MEDICOQUIRURGICOS417.038.164
85 MAQUINARIA Y EQUIPO ELECTRICO 392.466.60571 JOYERIA 340.577.79224 TABACO 226.166.51672 FUNDICION HIERRO Y ACERO 161.418.07364 CALZADO 137.229.69739 PLASTICO Y SUS MANUFACTURAS 119.862.97998 TRATAMIENTO ESPECIAL 109.358.956
POR CAPITULOS
Of the exports represented in these 10 sections, it must be noted that 45% corresponds to Chapters 61 and 62, the chapters for clothing (woven and knitted fabrics), as may be seen in the following illustration.
BILATERAL TRADE BETWEEN THE DOMINICAN REPUBIC AND THE UNITED STATES OF AMERICA V-2
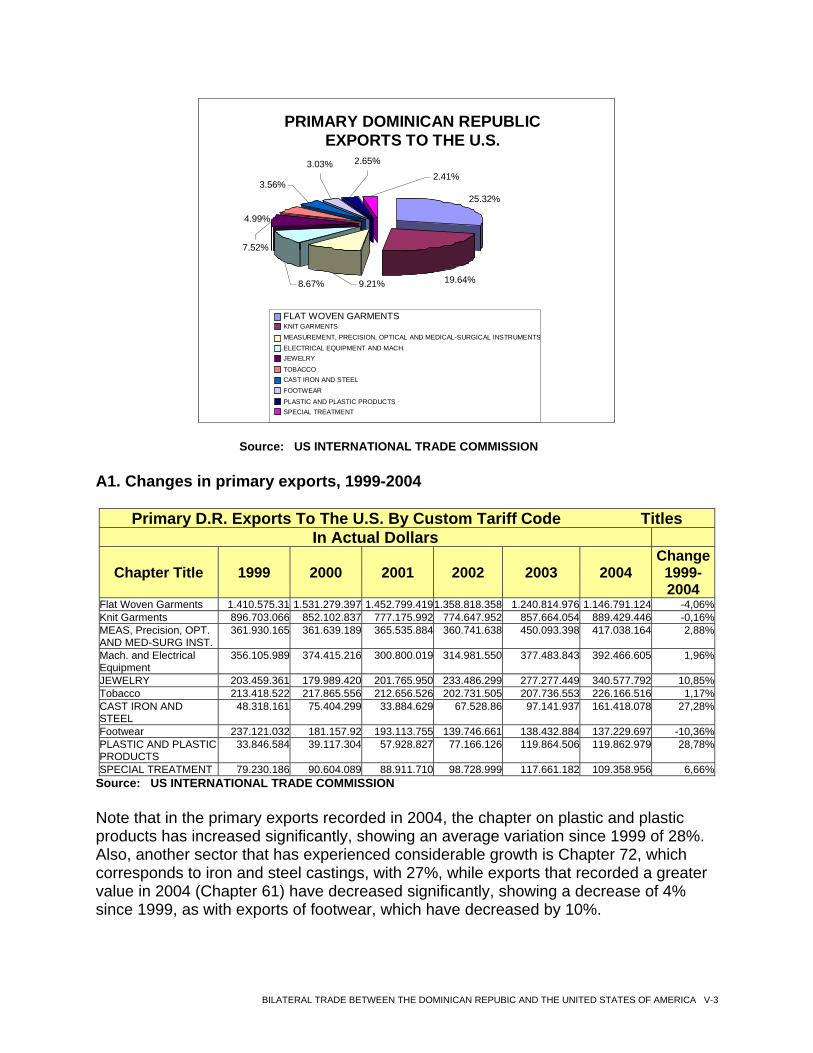
PRIMARY DOMINICAN REPUBLIC
EXPORTS TO THE U.S.
25.32%
19.64%9.21%8.67%
7.52%
4.99%
2.41%
2.65%3.03%
3.56%
FLAT WOVEN GARMENTSKNIT GARMENTSMEASUREMENT, PRECISION, OPTICAL AND MEDICAL-SURGICAL INSTRUMENTSELECTRICAL EQUIPMENT AND MACH.JEWELRY TOBACCO CAST IRON AND STEELFOOTWEAR PLASTIC AND PLASTIC PRODUCTSSPECIAL TREATMENT
Source: US INTERNATIONAL TRADE COMMISSION A1. Changes in primary exports, 1999-2004
Primary D.R. Exports To The U.S. By Custom Tariff Code Titles In Actual Dollars
Chapter Title 1999 2000 2001 2002 2003 2004 Change1999-2004
Flat Woven Garments 1.410.575.31 1.531.279.397 1.452.799.4191.358.818.358 1.240.814.976 1.146.791.124 -4,06%Knit Garments 896.703.066 852.102.837 777.175.992 774.647.952 857.664.054 889.429.446 -0,16%MEAS, Precision, OPT. AND MED-SURG INST.
361.930.165 361.639.189 365.535.884 360.741.638 450.093.398 417.038.164 2,88%
Mach. and Electrical Equipment
356.105.989 374.415.216 300.800.019 314.981.550 377.483.843 392.466.605 1,96%
JEWELRY 203.459.361 179.989.420 201.765.950 233.486.299 277.277.449 340.577.792 10,85%Tobacco 213.418.522 217.865.556 212.656.526 202.731.505 207.736.553 226.166.516 1,17%CAST IRON AND STEEL
48.318.161 75.404.299 33.884.629 67.528.86 97.141.937 161.418.078 27,28%
Footwear 237.121.032 181.157.92 193.113.755 139.746.661 138.432.884 137.229.697 -10,36%PLASTIC AND PLASTIC PRODUCTS
33.846.584 39.117.304 57.928.827 77.166.126 119.864.506 119.862.979 28,78%
SPECIAL TREATMENT 79.230.186 90.604.089 88.911.710 98.728.999 117.661.182 109.358.956 6,66%Source: US INTERNATIONAL TRADE COMMISSION Note that in the primary exports recorded in 2004, the chapter on plastic and plastic products has increased significantly, showing an average variation since 1999 of 28%. Also, another sector that has experienced considerable growth is Chapter 72, which corresponds to iron and steel castings, with 27%, while exports that recorded a greater value in 2004 (Chapter 61) have decreased significantly, showing a decrease of 4% since 1999, as with exports of footwear, which have decreased by 10%.
BILATERAL TRADE BETWEEN THE DOMINICAN REPUBIC AND THE UNITED STATES OF AMERICA V-3
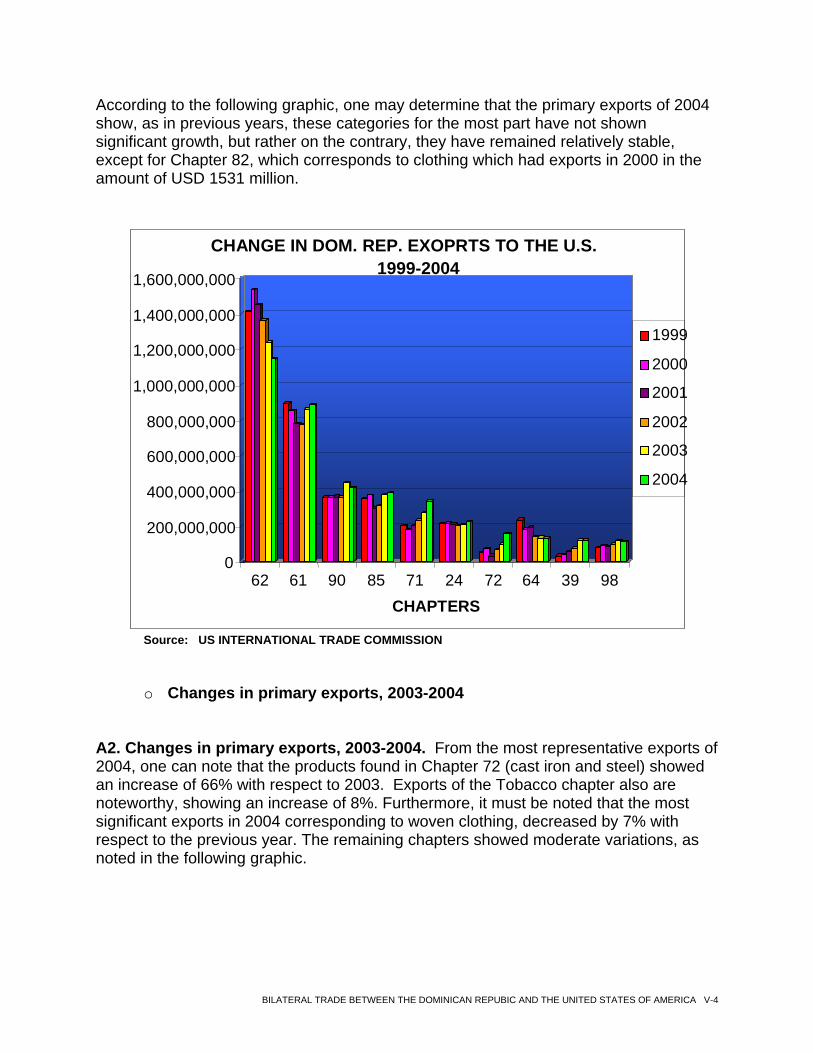
According to the following graphic, one may determine that the primary exports of 2004 show, as in previous years, these categories for the most part have not shown significant growth, but rather on the contrary, they have remained relatively stable, except for Chapter 82, which corresponds to clothing which had exports in 2000 in the amount of USD 1531 million.
0
200,000,000
400,000,000
600,000,000
800,000,000
1,000,000,000
1,200,000,000
1,400,000,000
1,600,000,000
62 61 90 85 71 24 72 64 39 98 CHAPTERS
CHANGE IN DOM. REP. EXOPRTS TO THE U.S. 1999-2004
1999
2000
2001
2002
2003
2004
Source: US INTERNATIONAL TRADE COMMISSION
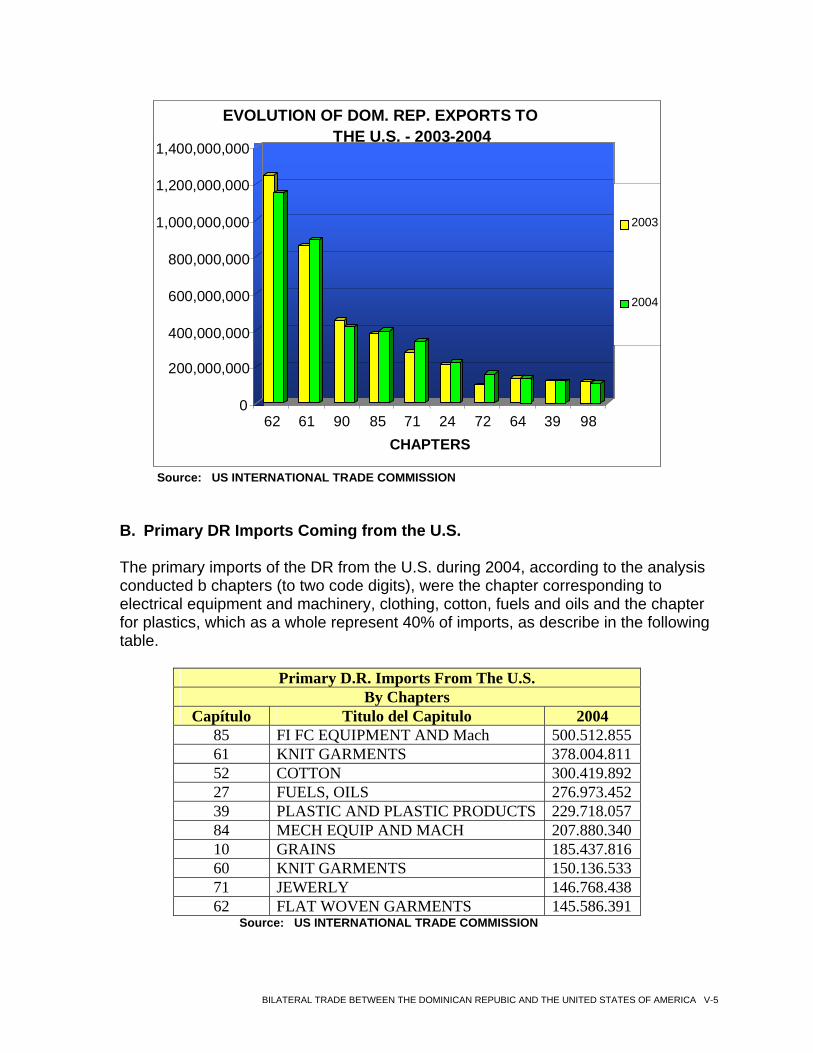
o Changes in primary exports, 2003-2004 A2. Changes in primary exports, 2003-2004. From the most representative exports of 2004, one can note that the products found in Chapter 72 (cast iron and steel) showed an increase of 66% with respect to 2003. Exports of the Tobacco chapter also are noteworthy, showing an increase of 8%. Furthermore, it must be noted that the most significant exports in 2004 corresponding to woven clothing, decreased by 7% with respect to the previous year. The remaining chapters showed moderate variations, as noted in the following graphic.
BILATERAL TRADE BETWEEN THE DOMINICAN REPUBIC AND THE UNITED STATES OF AMERICA V-4
0
200,000,000
400,000,000
600,000,000
800,000,000
1,000,000,000
1,200,000,000
1,400,000,000
62 61 90 85 71 24 72 64 39 98 CHAPTERS
EVOLUTION OF DOM. REP. EXPORTS TO THE U.S. - 2003-2004
2003
2004
Source: US INTERNATIONAL TRADE COMMISSION
B. Primary DR Imports Coming from the U.S. The primary imports of the DR from the U.S. during 2004, according to the analysis conducted b chapters (to two code digits), were the chapter corresponding to electrical equipment and machinery, clothing, cotton, fuels and oils and the chapter for plastics, which as a whole represent 40% of imports, as describe in the following table.
Primary D.R. Imports From The U.S. By Chapters
Capítulo Titulo del Capitulo 2004 85 FI FC EQUIPMENT AND Mach 500.512.855 61 KNIT GARMENTS 378.004.811 52 COTTON 300.419.892 27 FUELS, OILS 276.973.452 39 PLASTIC AND PLASTIC PRODUCTS 229.718.057 84 MECH EQUIP AND MACH 207.880.340 10 GRAINS 185.437.816 60 KNIT GARMENTS 150.136.533 71 JEWERLY 146.768.438 62 FLAT WOVEN GARMENTS 145.586.391
Source: US INTERNATIONAL TRADE COMMISSION
BILATERAL TRADE BETWEEN THE DOMINICAN REPUBIC AND THE UNITED STATES OF AMERICA V-5
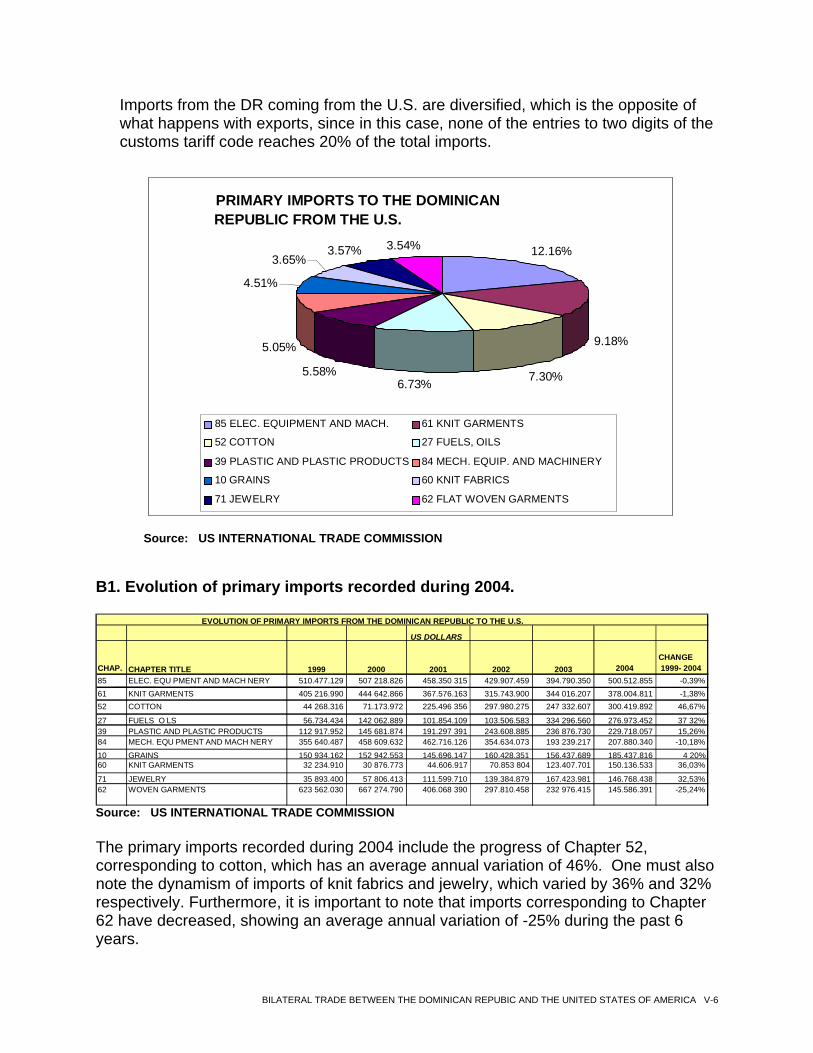
Imports from the DR coming from the U.S. are diversified, which is the opposite of what happens with exports, since in this case, none of the entries to two digits of the customs tariff code reaches 20% of the total imports.
PRIMARY IMPORTS TO THE DOMINICANREPUBLIC FROM THE U.S.
12.16%
9.18%
7.30%6.73%5.58%
5.05%
4.51% 3.65% 3.57% 3.54%
85 ELEC. EQUIPMENT AND MACH. 61 KNIT GARMENTS
52 COTTON 27 FUELS, OILS
39 PLASTIC AND PLASTIC PRODUCTS 84 MECH. EQUIP. AND MACHINERY 10 GRAINS 60 KNIT FABRICS
71 JEWELRY 62 FLAT WOVEN GARMENTS
Source: US INTERNATIONAL TRADE COMMISSION
B1. Evolution of primary imports recorded during 2004.
US DOLLARS
CHAP. CHAPTER TITLE 1999 2000 2001 2002 2003 2004 CHANGE1999- 2004
85 ELEC. EQU PMENT AND MACH NERY 510.477.129 507 218.826 458.350 315 429.907.459 394.790.350 500.512.855 -0,39%61 KNIT GARMENTS 405 216.990 444 642.866 367.576.163 315.743.900 344 016.207 378.004.811 -1,38%52 COTTON 44 268.316 71.173.972 225.496 356 297.980.275 247 332.607 300.419.892 46,67%
27 FUELS O LS 56.734.434 142 062.889 101.854.109 103.506.583 334 296.560 276.973.452 37 32%39 PLASTIC AND PLASTIC PRODUCTS 112 917.952 145 681.874 191.297 391 243.608.885 236 876.730 229.718.057 15,26%84 MECH. EQU PMENT AND MACH NERY 355 640.487 458 609.632 462.716.126 354.634.073 193 239.217 207.880.340 -10,18%
10 GRAINS 150 934.162 152 942.553 145.696.147 160.428.351 156.437.689 185.437.816 4 20%60 KNIT GARMENTS 32 234.910 30 876.773 44.606.917 70.853 804 123.407.701 150.136.533 36,03%
71 JEWELRY 35 893.400 57 806.413 111.599.710 139.384.879 167.423.981 146.768.438 32,53%62 WOVEN GARMENTS 623 562.030 667 274.790 406.068 390 297.810.458 232 976.415 145.586.391 -25,24%
EVOLUTION OF PRIMARY IMPORTS FROM THE DOMINICAN REPUBLIC TO THE U.S.
Source: US INTERNATIONAL TRADE COMMISSION
The primary imports recorded during 2004 include the progress of Chapter 52, corresponding to cotton, which has an average annual variation of 46%. One must also note the dynamism of imports of knit fabrics and jewelry, which varied by 36% and 32% respectively. Furthermore, it is important to note that imports corresponding to Chapter 62 have decreased, showing an average annual variation of -25% during the past 6 years.
BILATERAL TRADE BETWEEN THE DOMINICAN REPUBIC AND THE UNITED STATES OF AMERICA V-6
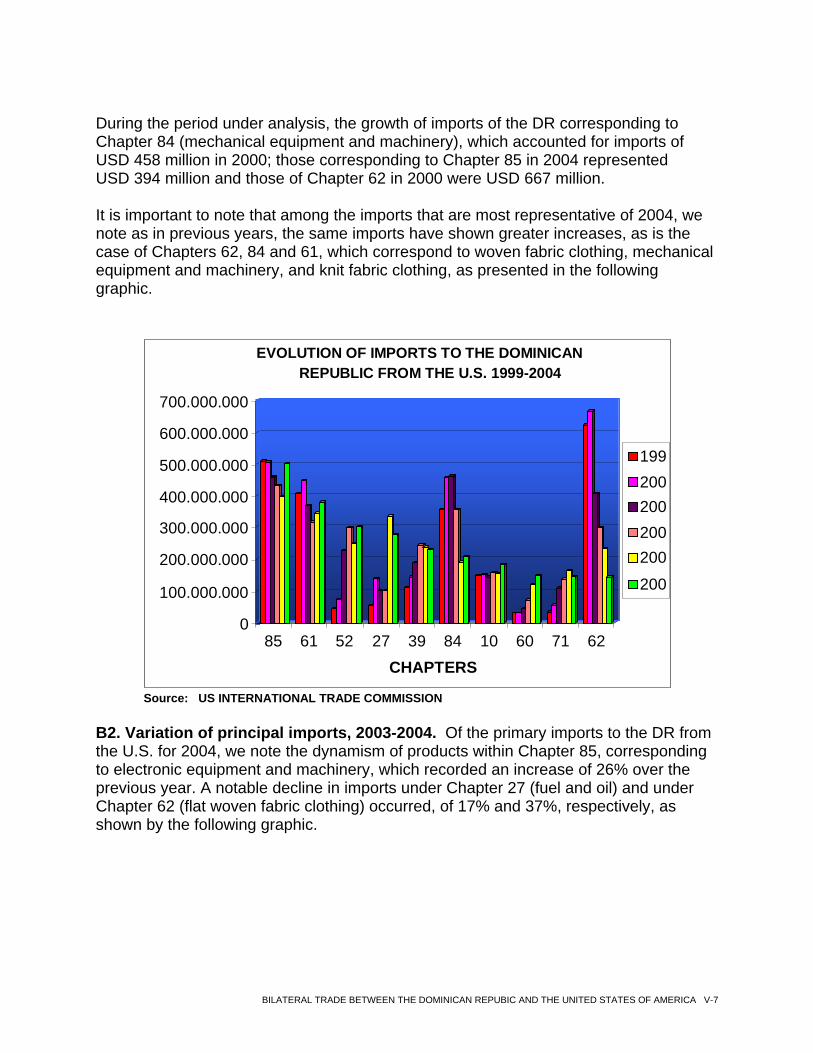
During the period under analysis, the growth of imports of the DR corresponding to Chapter 84 (mechanical equipment and machinery), which accounted for imports of USD 458 million in 2000; those corresponding to Chapter 85 in 2004 represented USD 394 million and those of Chapter 62 in 2000 were USD 667 million. It is important to note that among the imports that are most representative of 2004, we note as in previous years, the same imports have shown greater increases, as is the case of Chapters 62, 84 and 61, which correspond to woven fabric clothing, mechanical equipment and machinery, and knit fabric clothing, as presented in the following graphic.
0
100.000.000
200.000.000
300.000.000
400.000.000
500.000.000
600.000.000
700.000.000
85 61 52 27 39 84 10 60 71 62 CHAPTERS
EVOLUTION OF IMPORTS TO THE DOMINICAN REPUBLIC FROM THE U.S. 1999-2004
199200200200200
200
Source: US INTERNATIONAL TRADE COMMISSION
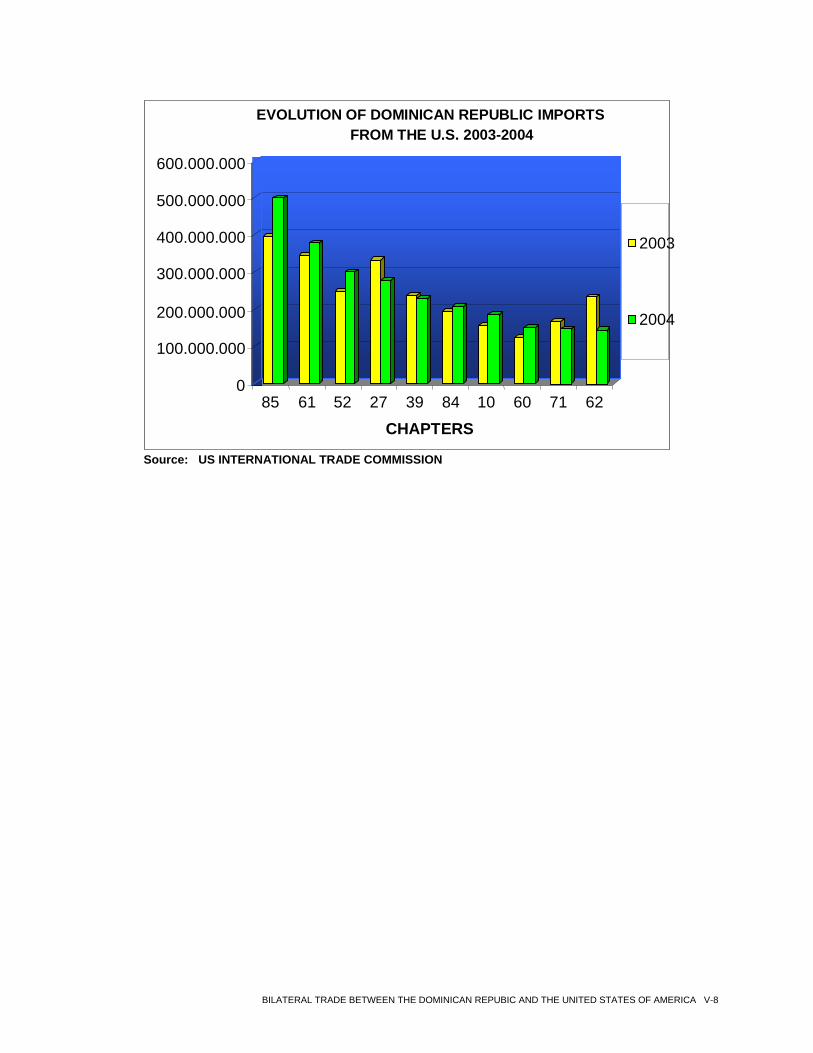
B2. Variation of principal imports, 2003-2004. Of the primary imports to the DR from the U.S. for 2004, we note the dynamism of products within Chapter 85, corresponding to electronic equipment and machinery, which recorded an increase of 26% over the previous year. A notable decline in imports under Chapter 27 (fuel and oil) and under Chapter 62 (flat woven fabric clothing) occurred, of 17% and 37%, respectively, as shown by the following graphic.
BILATERAL TRADE BETWEEN THE DOMINICAN REPUBIC AND THE UNITED STATES OF AMERICA V-7
0
100.000.000
200.000.000
300.000.000
400.000.000
500.000.000
600.000.000
85 61 52 27 39 84 10 60 71 62
CHAPTERS
EVOLUTION OF DOMINICAN REPUBLIC IMPORTS FROM THE U.S. 2003-2004
2003
2004
Source: US INTERNATIONAL TRADE COMMISSION
BILATERAL TRADE BETWEEN THE DOMINICAN REPUBIC AND THE UNITED STATES OF AMERICA V-8
SECTION VI ANALYSIS BY SECTOR
SECTION VI ANALYSIS BY SECTOR
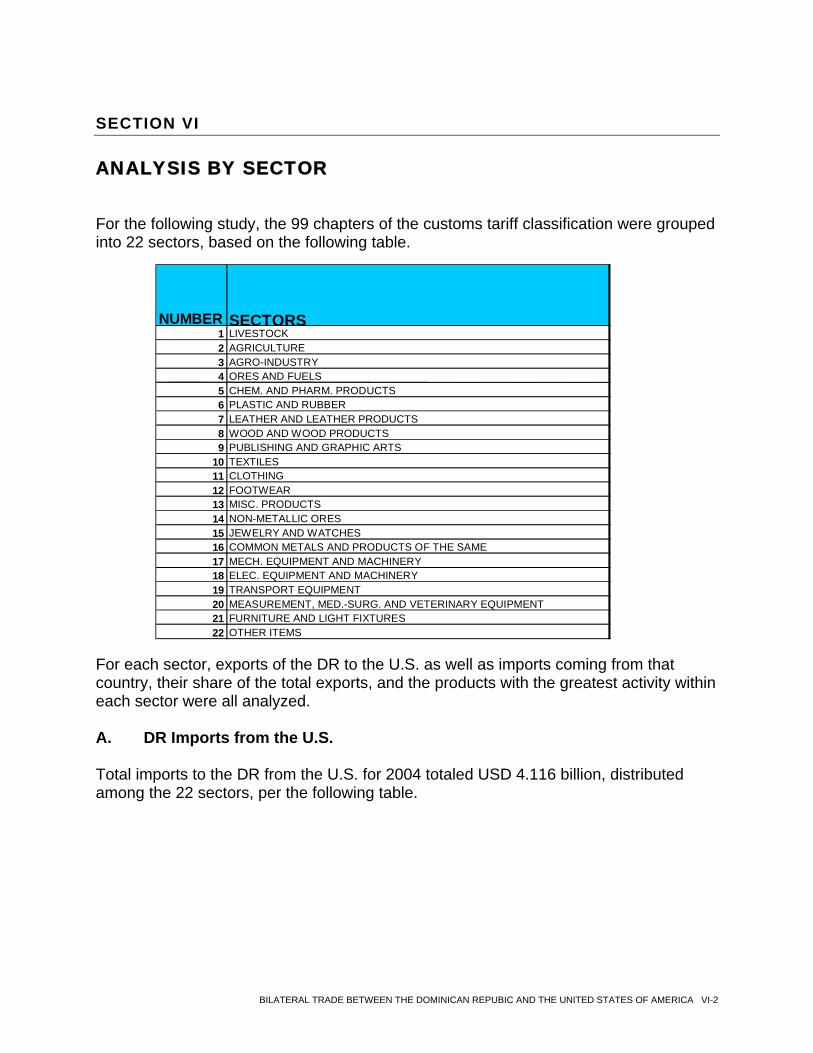
For the following study, the 99 chapters of the customs tariff classification were grouped into 22 sectors, based on the following table.
NUMBER SECTORS 1 LIVESTOCK 2 AGRICULTURE 3 AGRO-INDUSTRY 4 ORES AND FUELS 5 CHEM. AND PHARM. PRODUCTS6 PLASTIC AND RUBBER7 LEATHER AND LEATHER PRODUCTS8 WOOD AND WOOD PRODUCTS9 PUBLISHING AND GRAPHIC ARTS
10 TEXTILES 11 CLOTHING 12 FOOTWEAR 13 MISC. PRODUCTS 14 NON-METALLIC ORES15 JEWELRY AND WATCHES16 COMMON METALS AND PRODUCTS OF THE SAME17 MECH. EQUIPMENT AND MACHINERY18 ELEC. EQUIPMENT AND MACHINERY19 TRANSPORT EQUIPMENT20 MEASUREMENT, MED.-SURG. AND VETERINARY EQUIPMENT21 FURNITURE AND LIGHT FIXTURES22 OTHER ITEMS
For each sector, exports of the DR to the U.S. as well as imports coming from that country, their share of the total exports, and the products with the greatest activity within each sector were all analyzed. A. DR Imports from the U.S. Total imports to the DR from the U.S. for 2004 totaled USD 4.116 billion, distributed among the 22 sectors, per the following table.
BILATERAL TRADE BETWEEN THE DOMINICAN REPUBIC AND THE UNITED STATES OF AMERICA VI-2
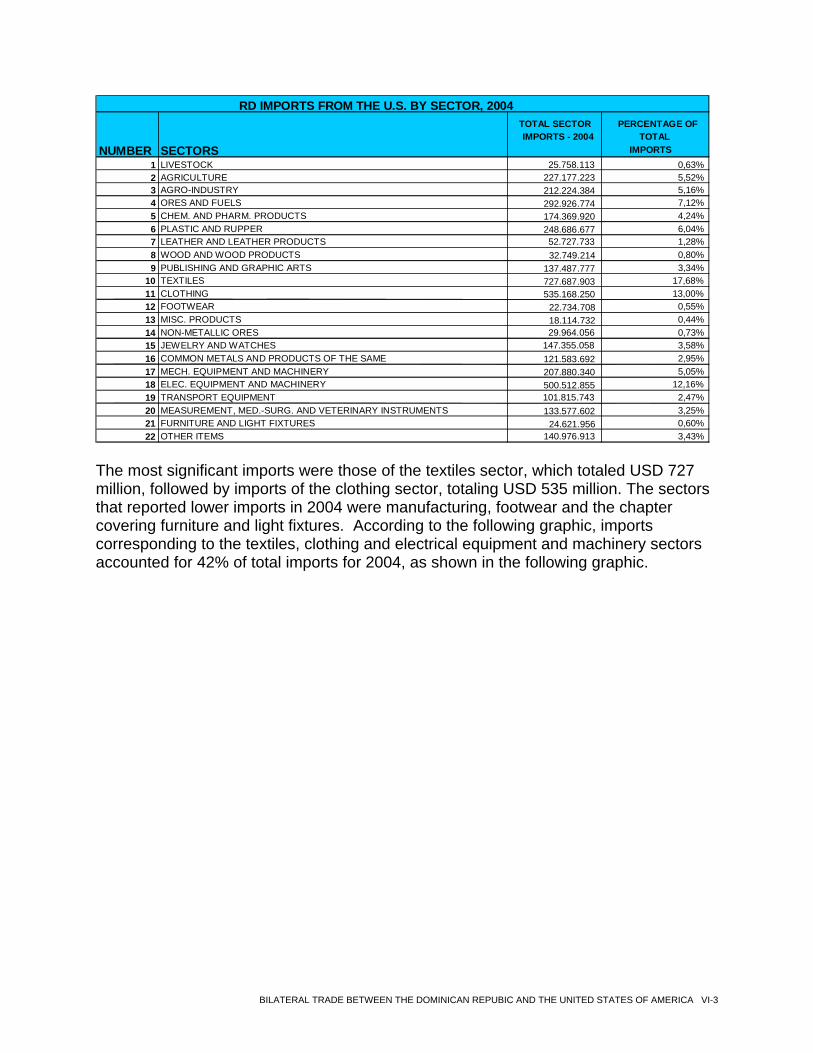
NUMBER SECTORS
TOTAL SECTOR IMPORTS - 2004
PERCENTAGE OF TOTAL
IMPORTS 1 LIVESTOCK 25.758.113 0,63%2 AGRICULTURE 227.177.223 5,52%3 AGRO-INDUSTRY 212.224.384 5,16%4 ORES AND FUELS 292.926.774 7,12%5 CHEM. AND PHARM. PRODUCTS 174.369.920 4,24%6 PLASTIC AND RUPPER 248.686.677 6,04%7 LEATHER AND LEATHER PRODUCTS 52.727.733 1,28%8 WOOD AND WOOD PRODUCTS 32.749.214 0,80%9 PUBLISHING AND GRAPHIC ARTS 137.487.777 3,34%
10 TEXTILES 727.687.903 17,68%11 CLOTHING 535.168.250 13,00%12 FOOTWEAR 22.734.708 0,55%13 MISC. PRODUCTS 18.114.732 0,44%14 NON-METALLIC ORES 29.964.056 0,73%15 JEWELRY AND WATCHES 147.355.058 3,58%16 COMMON METALS AND PRODUCTS OF THE SAME 121.583.692 2,95%17 MECH. EQUIPMENT AND MACHINERY 207.880.340 5,05%18 ELEC. EQUIPMENT AND MACHINERY 500.512.855 12,16%19 TRANSPORT EQUIPMENT 101.815.743 2,47%20 MEASUREMENT, MED.-SURG. AND VETERINARY INSTRUMENTS 133.577.602 3,25%21 FURNITURE AND LIGHT FIXTURES 24.621.956 0,60%22 OTHER ITEMS 140.976.913 3,43%
RD IMPORTS FROM THE U.S. BY SECTOR, 2004
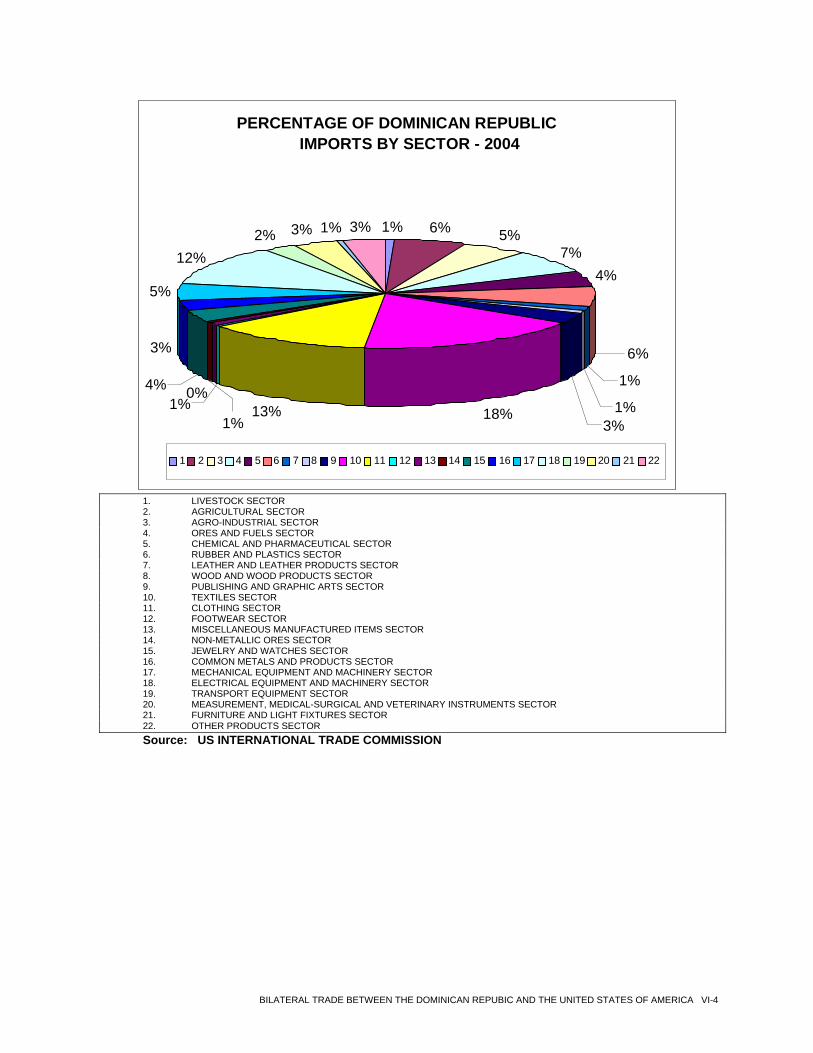
The most significant imports were those of the textiles sector, which totaled USD 727 million, followed by imports of the clothing sector, totaling USD 535 million. The sectors that reported lower imports in 2004 were manufacturing, footwear and the chapter covering furniture and light fixtures. According to the following graphic, imports corresponding to the textiles, clothing and electrical equipment and machinery sectors accounted for 42% of total imports for 2004, as shown in the following graphic.
BILATERAL TRADE BETWEEN THE DOMINICAN REPUBIC AND THE UNITED STATES OF AMERICA VI-3
PERCENTAGE OF DOMINICAN REPUBLIC
IMPORTS BY SECTOR - 2004
1% 6% 5%7%
4%
6%
1%
1% 18%13%
5%
12% 2% 3% 1% 3%
1% 4%
3%
0%
3%
1%
1 2 3 4 5 6 7 8 9 10 11 12 13 14 15 16 17 18 19 20 21 22
1. LIVESTOCK SECTOR 2. AGRICULTURAL SECTOR 3. AGRO-INDUSTRIAL SECTOR 4. ORES AND FUELS SECTOR 5. CHEMICAL AND PHARMACEUTICAL SECTOR 6. RUBBER AND PLASTICS SECTOR 7. LEATHER AND LEATHER PRODUCTS SECTOR 8. WOOD AND WOOD PRODUCTS SECTOR 9. PUBLISHING AND GRAPHIC ARTS SECTOR 10. TEXTILES SECTOR 11. CLOTHING SECTOR 12. FOOTWEAR SECTOR 13. MISCELLANEOUS MANUFACTURED ITEMS SECTOR 14. NON-METALLIC ORES SECTOR 15. JEWELRY AND WATCHES SECTOR 16. COMMON METALS AND PRODUCTS SECTOR 17. MECHANICAL EQUIPMENT AND MACHINERY SECTOR 18. ELECTRICAL EQUIPMENT AND MACHINERY SECTOR 19. TRANSPORT EQUIPMENT SECTOR 20. MEASUREMENT, MEDICAL-SURGICAL AND VETERINARY INSTRUMENTS SECTOR 21. FURNITURE AND LIGHT FIXTURES SECTOR 22. OTHER PRODUCTS SECTOR Source: US INTERNATIONAL TRADE COMMISSION
BILATERAL TRADE BETWEEN THE DOMINICAN REPUBIC AND THE UNITED STATES OF AMERICA VI-4
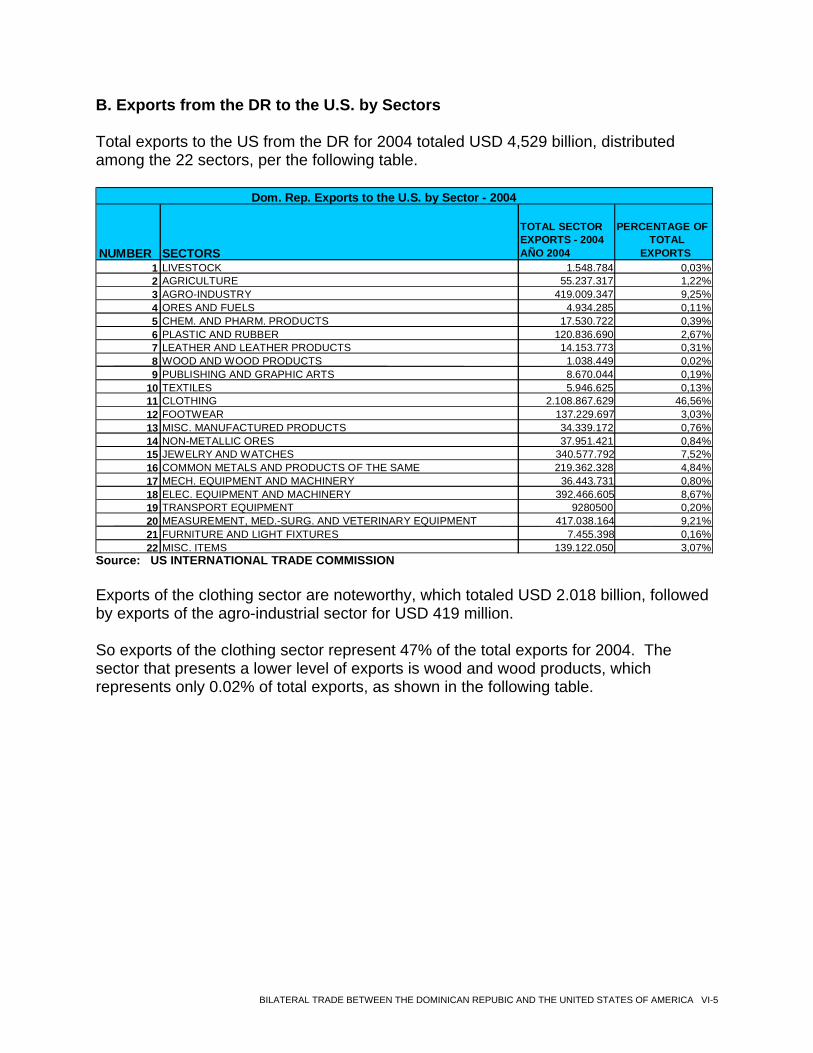
B. Exports from the DR to the U.S. by Sectors
Total exports to the US from the DR for 2004 totaled USD 4,529 billion, distributed among the 22 sectors, per the following table.
NUMBER SECTORS
TOTAL SECTOR EXPORTS - 2004 AÑO 2004
PERCENTAGE OF TOTAL
EXPORTS 1 LIVESTOCK 1.548.784 0,03%2 AGRICULTURE 55.237.317 1,22%3 AGRO-INDUSTRY 419.009.347 9,25%4 ORES AND FUELS 4.934.285 0,11%5 CHEM. AND PHARM. PRODUCTS 17.530.722 0,39%6 PLASTIC AND RUBBER 120.836.690 2,67%7 LEATHER AND LEATHER PRODUCTS 14.153.773 0,31%8 WOOD AND WOOD PRODUCTS 1.038.449 0,02%9 PUBLISHING AND GRAPHIC ARTS 8.670.044 0,19%
10 TEXTILES 5.946.625 0,13%11 CLOTHING 2.108.867.629 46,56%12 FOOTWEAR 137.229.697 3,03%13 MISC. MANUFACTURED PRODUCTS 34.339.172 0,76%14 NON-METALLIC ORES 37.951.421 0,84%15 JEWELRY AND WATCHES 340.577.792 7,52%16 COMMON METALS AND PRODUCTS OF THE SAME 219.362.328 4,84%17 MECH. EQUIPMENT AND MACHINERY 36.443.731 0,80%18 ELEC. EQUIPMENT AND MACHINERY 392.466.605 8,67%19 TRANSPORT EQUIPMENT 9280500 0,20%20 MEASUREMENT, MED.-SURG. AND VETERINARY EQUIPMENT 417.038.164 9,21%21 FURNITURE AND LIGHT FIXTURES 7.455.398 0,16%22 MISC. ITEMS 139.122.050 3,07%
Dom. Rep. Exports to the U.S. by Sector - 2004
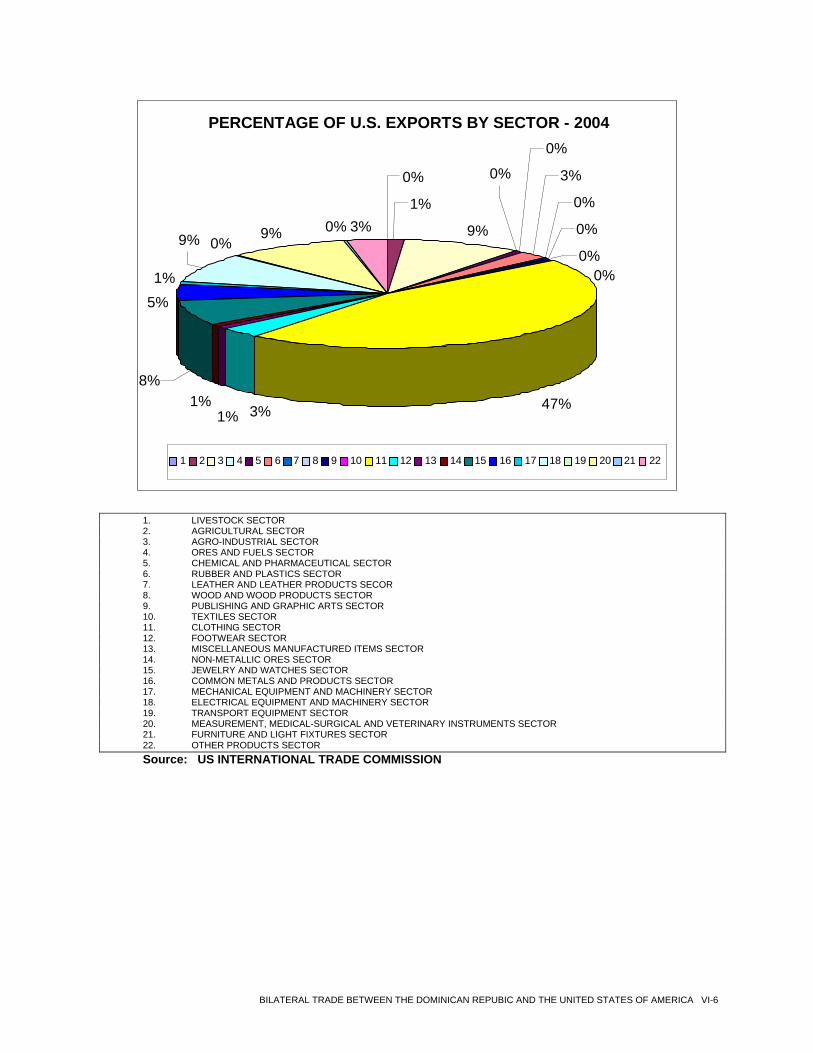
Source: US INTERNATIONAL TRADE COMMISSION Exports of the clothing sector are noteworthy, which totaled USD 2.018 billion, followed by exports of the agro-industrial sector for USD 419 million. So exports of the clothing sector represent 47% of the total exports for 2004. The sector that presents a lower level of exports is wood and wood products, which represents only 0.02% of total exports, as shown in the following table.
BILATERAL TRADE BETWEEN THE DOMINICAN REPUBIC AND THE UNITED STATES OF AMERICA VI-5
PERCENTAGE OF U.S. EXPORTS BY SECTOR - 2004
0%
1%
9%
0%
3%
0%
0%
0%
47%
0% 9% 0% 3%9%
1%
0%
1%
5%
1%
0%
8%
3%
1 2 3 4 5 6 7 8 9 10 11 12 13 14 15 16 17 18 19 20 21 22
1. LIVESTOCK SECTOR 2. AGRICULTURAL SECTOR 3. AGRO-INDUSTRIAL SECTOR 4. ORES AND FUELS SECTOR 5. CHEMICAL AND PHARMACEUTICAL SECTOR 6. RUBBER AND PLASTICS SECTOR 7. LEATHER AND LEATHER PRODUCTS SECOR 8. WOOD AND WOOD PRODUCTS SECTOR 9. PUBLISHING AND GRAPHIC ARTS SECTOR 10. TEXTILES SECTOR 11. CLOTHING SECTOR 12. FOOTWEAR SECTOR 13. MISCELLANEOUS MANUFACTURED ITEMS SECTOR 14. NON-METALLIC ORES SECTOR 15. JEWELRY AND WATCHES SECTOR 16. COMMON METALS AND PRODUCTS SECTOR 17. MECHANICAL EQUIPMENT AND MACHINERY SECTOR 18. ELECTRICAL EQUIPMENT AND MACHINERY SECTOR 19. TRANSPORT EQUIPMENT SECTOR 20. MEASUREMENT, MEDICAL-SURGICAL AND VETERINARY INSTRUMENTS SECTOR 21. FURNITURE AND LIGHT FIXTURES SECTOR 22. OTHER PRODUCTS SECTOR Source: US INTERNATIONAL TRADE COMMISSION
BILATERAL TRADE BETWEEN THE DOMINICAN REPUBIC AND THE UNITED STATES OF AMERICA VI-6
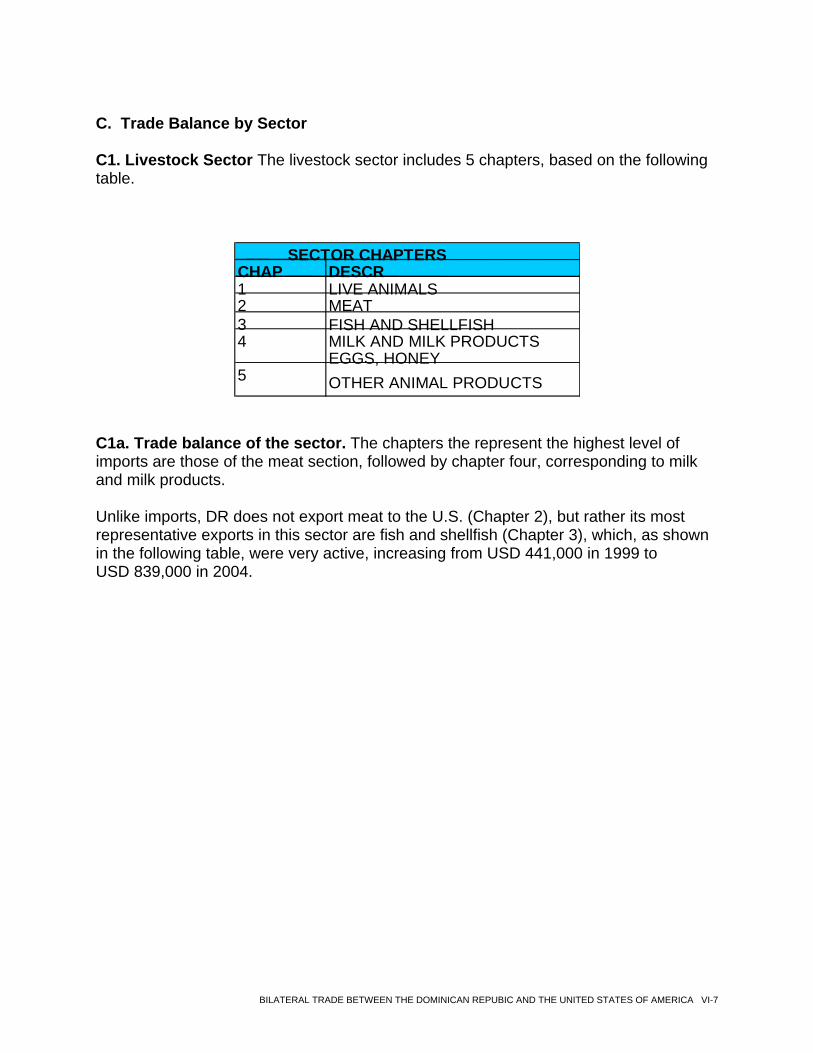
C. Trade Balance by Sector C1. Livestock Sector The livestock sector includes 5 chapters, based on the following table.
CHAP DESCR 1 LIVE ANIMALS 2 MEAT 3 FISH AND SHELLFISH 4 MILK AND MILK PRODUCTS
EGGS, HONEY 5 OTHER ANIMAL PRODUCTS
SECTOR CHAPTERS
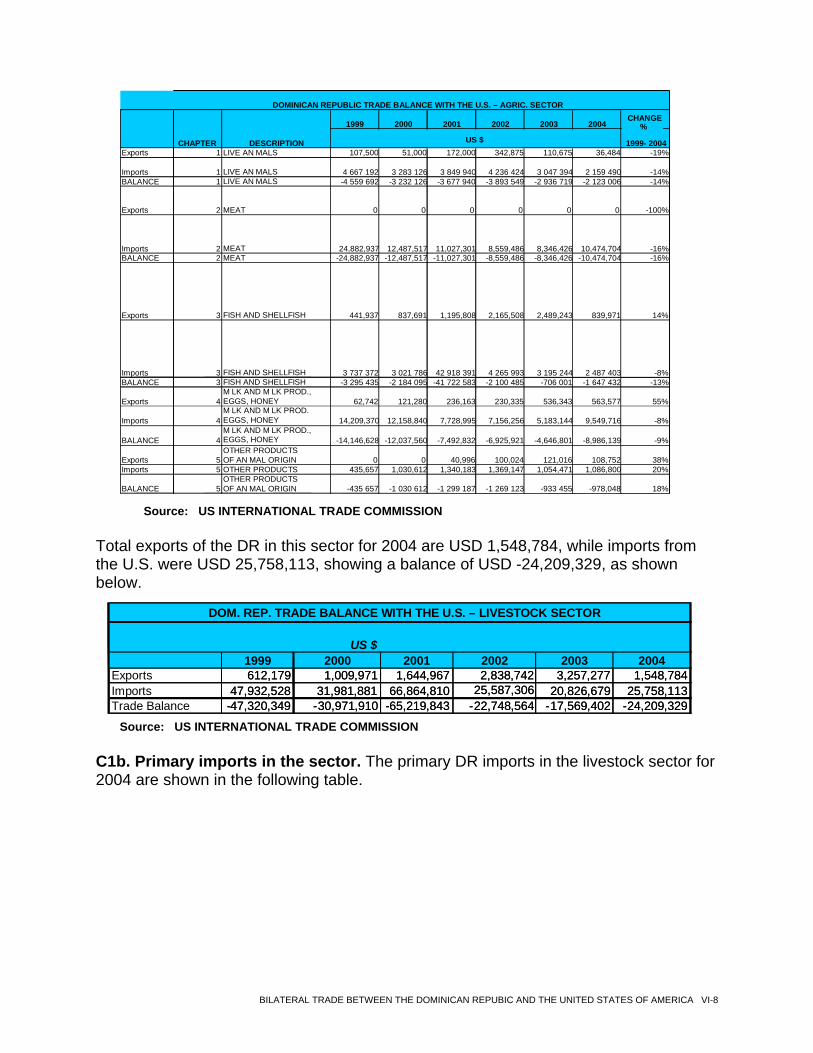
C1a. Trade balance of the sector. The chapters the represent the highest level of imports are those of the meat section, followed by chapter four, corresponding to milk and milk products. Unlike imports, DR does not export meat to the U.S. (Chapter 2), but rather its most representative exports in this sector are fish and shellfish (Chapter 3), which, as shown in the following table, were very active, increasing from USD 441,000 in 1999 to USD 839,000 in 2004.
BILATERAL TRADE BETWEEN THE DOMINICAN REPUBIC AND THE UNITED STATES OF AMERICA VI-7
1999 2000 2001 2002 2003 2004
1999- 2004Exports 1 LIVE AN MALS 107,500 51,000 172,000 342,875 110,675 36,484 -19%
Imports 1 LIVE AN MALS 4 667 192 3 283 126 3 849 940 4 236 424 3 047 394 2 159 490 -14%BALANCE 1 LIVE AN MALS -4 559 692 -3 232 126 -3 677 940 -3 893 549 -2 936 719 -2 123 006 -14%
Exports 2 MEAT 0 0 0 0 0 0 -100%
Imports 2 MEAT 24,882,937 12,487,517 11,027,301 8,559,486 8,346,426 10,474,704 -16%BALANCE 2 MEAT -24,882,937 -12,487,517 -11,027,301 -8,559,486 -8,346,426 -10,474,704 -16%
Exports 3 FISH AND SHELLFISH 441,937 837,691 1,195,808 2,165,508 2,489,243 839,971 14%
Imports 3 FISH AND SHELLFISH 3 737 372 3 021 786 42 918 391 4 265 993 3 195 244 2 487 403 -8%BALANCE 3 FISH AND SHELLFISH -3 295 435 -2 184 095 -41 722 583 -2 100 485 -706 001 -1 647 432 -13%
Exports 4 M LK AND M LK PROD., EGGS, HONEY 62,742 121,280 236,163 230,335 536,343 563,577 55%
Imports 4 M LK AND M LK PROD. EGGS, HONEY 14,209,370 12,158,840 7,728,995 7,156,256 5,183,144 9,549,716 -8%
BALANCE 4 M LK AND M LK PROD., EGGS, HONEY -14,146,628 -12,037,560 -7,492,832 -6,925,921 -4,646,801 -8,986,139 -9%
Exports 5 OTHER PRODUCTS OF AN MAL ORIGIN 0 0 40,996 100,024 121,016 108,752 38%
Imports 5 OTHER PRODUCTS 435,657 1,030,612 1,340,183 1,369,147 1,054,471 1,086,800 20%
BALANCE 5 OTHER PRODUCTS OF AN MAL ORIGIN -435 657 -1 030 612 -1 299 187 -1 269 123 -933 455 -978,048 18%
CHAPTER
DOMINICAN REPUBLIC TRADE BALANCE WITH THE U.S. – AGRIC. SECTOR
DESCRIPTION US $
CHANGE%
Source: US INTERNATIONAL TRADE COMMISSION Total exports of the DR in this sector for 2004 are USD 1,548,784, while imports from the U.S. were USD 25,758,113, showing a balance of USD -24,209,329, as shown below.
1999 2000 2001 2002 2003 2004Exports 612,179 1,009,971 1,644,967 2,838,742 3,257,277 1,548,784Imports 47,932,528 31,981,881 66,864,810 25,587,306 20,826,679 25,758,113Trade Balance - 47,320,349 - 30,971,910 -65,219,843 -22,748,564 -17,569,402 - 24,209,329
US $
1999 2000 2001 2002 2003 2004612,179 1,009,971 1,644,967 2,838,742 3,257,277 1,548,784
47,932,528 31,981,881 66,864,810 25,587,306 20,826,679 25,758,113- 47,320,349 - 30,971,910 -65,219,843 -22,748,564 -17,569,402 - 24,209,329
US $
DOM. REP. TRADE BALANCE WITH THE U.S. – LIVESTOCK SECTOR
Source: US INTERNATIONAL TRADE COMMISSION
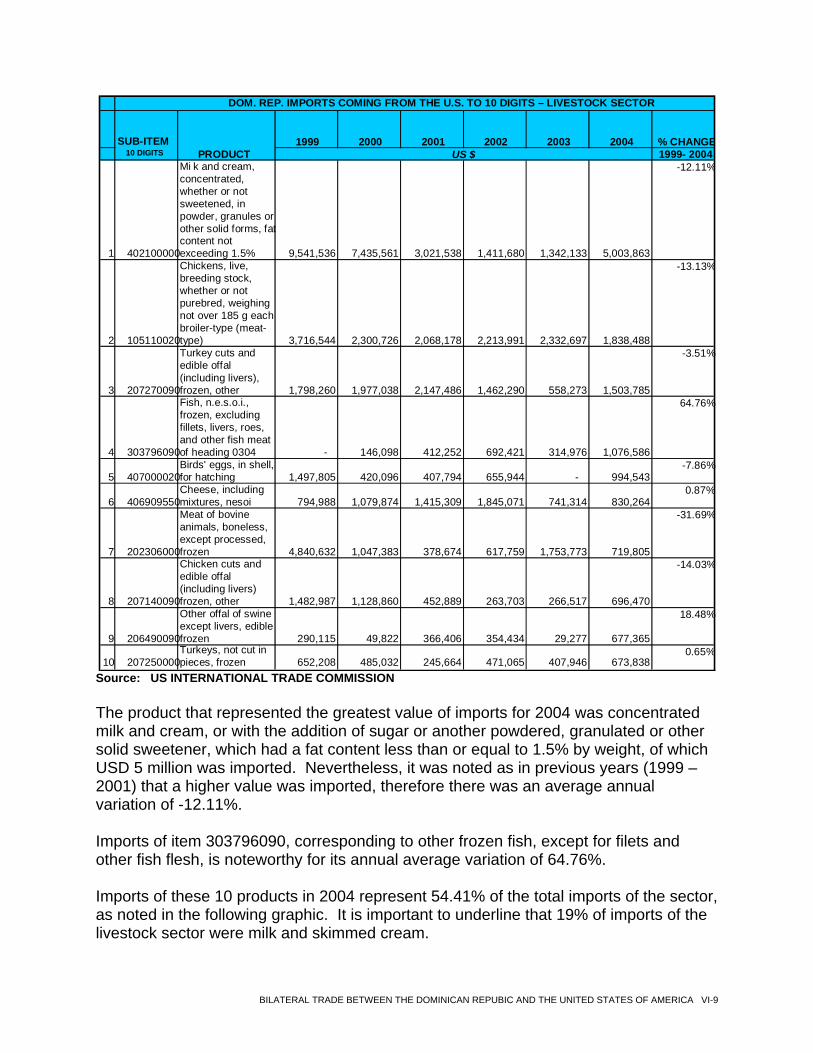
C1b. Primary imports in the sector. The primary DR imports in the livestock sector for 2004 are shown in the following table.
BILATERAL TRADE BETWEEN THE DOMINICAN REPUBIC AND THE UNITED STATES OF AMERICA VI-8
1999 2000 2001 2002 2003 2004 % CHANGE1999- 2004
1 402100000
Mi k and cream, concentrated, whether or not sweetened, in powder, granules or other solid forms, fat content not exceeding 1.5% 9,541,536 7,435,561 3,021,538 1,411,680 1,342,133 5,003,863
-12.11%
2 105110020
Chickens, live, breeding stock, whether or not purebred, weighing not over 185 g each broiler-type (meat- type) 3,716,544 2,300,726 2,068,178 2,213,991 2,332,697 1,838,488
-13.13%
3 207270090
Turkey cuts and edible offal (including livers), frozen, other 1,798,260 1,977,038 2,147,486 1,462,290 558,273 1,503,785
-3.51%
4 303796090
Fish, n.e.s.o.i., frozen, excluding fillets, livers, roes, and other fish meat of heading 0304 - 146,098 412,252 692,421 314,976 1,076,586
64.76%
5 407000020 Birds' eggs, in shell, for hatching 1,497,805 420,096 407,794 655,944 - 994,543
-7.86%
6 406909550 Cheese, including mixtures, nesoi 794,988 1,079,874 1,415,309 1,845,071 741,314 830,264
0.87%
7 202306000
Meat of bovine animals, boneless, except processed, frozen 4,840,632 1,047,383 378,674 617,759 1,753,773 719,805
-31.69%
8 207140090
Chicken cuts and edible offal (including livers) frozen, other 1,482,987 1,128,860 452,889 263,703 266,517 696,470
-14.03%
9 206490090 Other offal of swine except livers, edible frozen 290,115 49,822 366,406 354,434 29,277 677,365
18.48%
10 207250000 Turkeys, not cut in pieces, frozen 652,208 485,032 245,664 471,065 407,946 673,838
0.65%
DOM. REP. IMPORTS COMING FROM THE U.S. TO 10 DIGITS – LIVESTOCK SECTOR
SUB-ITEM 10 DIGITS PRODUCT US $
Source: US INTERNATIONAL TRADE COMMISSION
The product that represented the greatest value of imports for 2004 was concentrated milk and cream, or with the addition of sugar or another powdered, granulated or other solid sweetener, which had a fat content less than or equal to 1.5% by weight, of which USD 5 million was imported. Nevertheless, it was noted as in previous years (1999 – 2001) that a higher value was imported, therefore there was an average annual variation of -12.11%. Imports of item 303796090, corresponding to other frozen fish, except for filets and other fish flesh, is noteworthy for its annual average variation of 64.76%. Imports of these 10 products in 2004 represent 54.41% of the total imports of the sector, as noted in the following graphic. It is important to underline that 19% of imports of the livestock sector were milk and skimmed cream.
BILATERAL TRADE BETWEEN THE DOMINICAN REPUBIC AND THE UNITED STATES OF AMERICA VI-9
Source: US INTERNATIONAL TRADE COMMISSION C1c. Primary exports in the sector. The primary DR exports to the U.S. in the livestock sector for 2004 are shown in the following table.
BILATERAL TRADE BETWEEN THE DOMINICAN REPUBIC AND THE UNITED STATES OF AMERICA VI-10
1999 2000 2001 2002 2003 2004 % CHANGE
1999- 2004
1
306110000 Rock lobster and other sea crawfish (palinurus spp., panulirus spp., jasus spp.) Including in shell, cooked by steaming or by boiling in water, frozen
132,760 6,120 29,240 377,032 174,748 534,759 32.14%
2 406901800 Cheese, edam and
gouda, nesoi 0 0 0 0 112,792 211,028 87.09%
3
406307100 Mixtures, processed cheese, containing or processed from american-type cheese (ex cheddar) not grated/powdered, nesoi
0 0 0 4,494 106,997 152,786 483.08%
4
302694099 Fish, excluding fillets, livers and roes, fresh or chilled, nesoi
0 0 2,348 2,370 14,351 147,218 297.27%
5
409000025 Comb honey and honey packaged for retail sale
5,179 9,860 0 2,246 36,728 101,991 81.49%
6
511992000 Parings and similar waste of raw hides or skins; glue stock, not elsewhere specified or included
0 0 40,996 88,938 121,016 70,412 19.76%
7
409000064 Natural honey, not packaged for retail sale, nesoi
55,488 111,420 229,965 111,447 213,503 53,840 -0.60%
8
303794097 Fish, frozen, nesoi, except fillets/livers/roes
0 26,319 40,320 0 0 40,704 11.52%
9
508000000 Coral & similar materials, shells of molluscs, crustaceans, echinoderms, cuttlebone, unworked or simply prepared, not cut to shape, powder and waste
0 0 0 0 0 38,340 0.00%
10
302691040 Fish nesoi excluding fillets, livers and roes, scaled, not otherwise processed, in containers weighing with contents 6.8 kg or less, fresh or chilled
0 0 0 0 0 22,164 0.00%
DOM. REP. EXPORTS TO THE U.S. TO 10 DIGITS – LIVESTOCK SECTOR SUB-ITEM
10 DIG PRODUCT US $
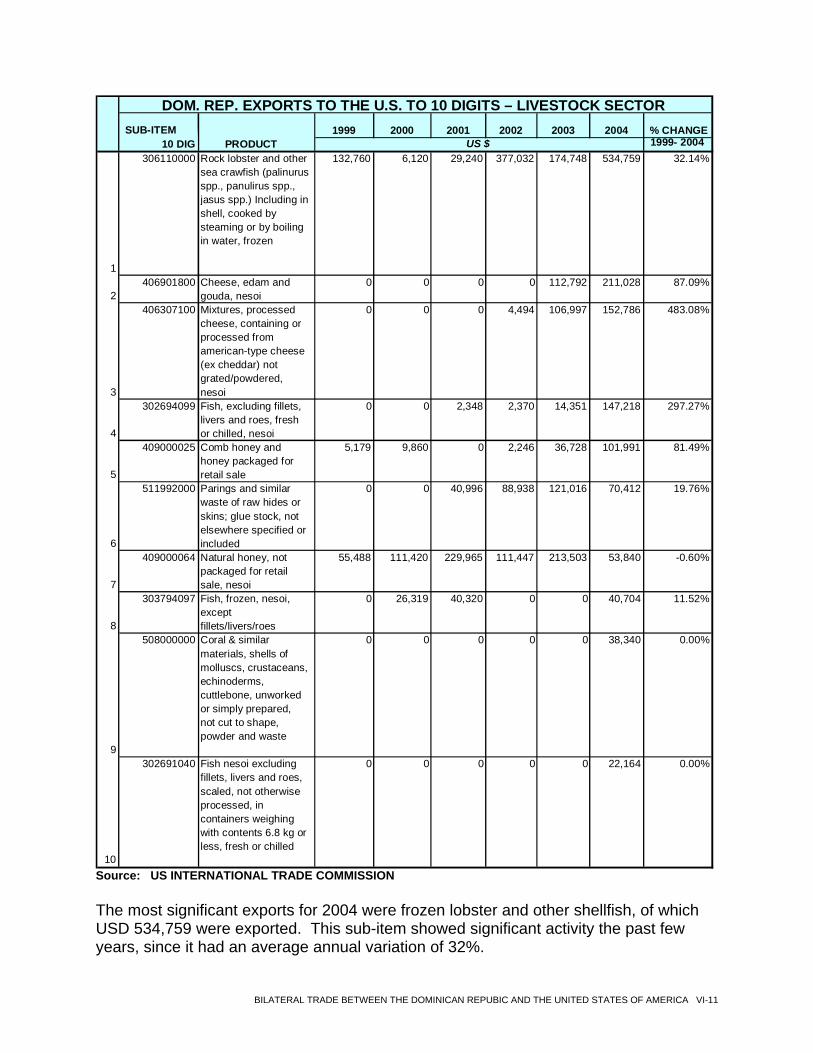
Source: US INTERNATIONAL TRADE COMMISSION The most significant exports for 2004 were frozen lobster and other shellfish, of which USD 534,759 were exported. This sub-item showed significant activity the past few years, since it had an average annual variation of 32%.
BILATERAL TRADE BETWEEN THE DOMINICAN REPUBIC AND THE UNITED STATES OF AMERICA VI-11
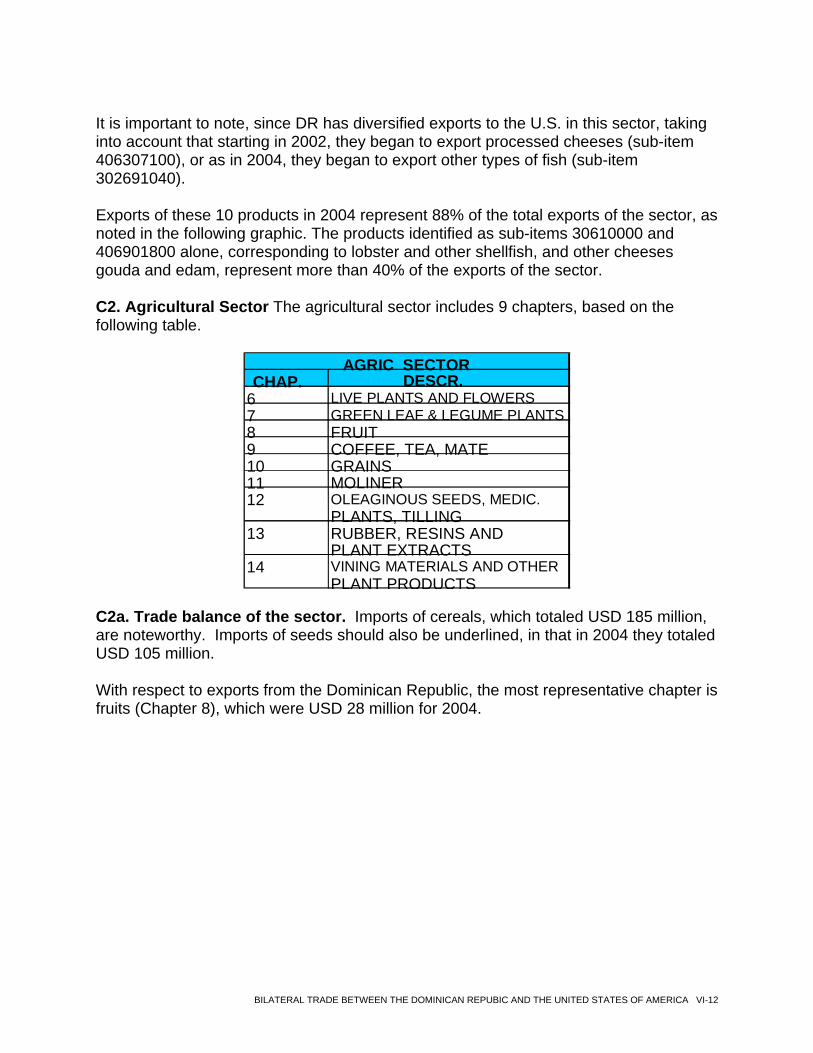
It is important to note, since DR has diversified exports to the U.S. in this sector, taking into account that starting in 2002, they began to export processed cheeses (sub-item 406307100), or as in 2004, they began to export other types of fish (sub-item 302691040). Exports of these 10 products in 2004 represent 88% of the total exports of the sector, as noted in the following graphic. The products identified as sub-items 30610000 and 406901800 alone, corresponding to lobster and other shellfish, and other cheeses gouda and edam, represent more than 40% of the exports of the sector. C2. Agricultural Sector The agricultural sector includes 9 chapters, based on the following table.
CHAP. DESCR.
6 LIVE PLANTS AND FLOWERS7 GREEN LEAF & LEGUME PLANTS8 FRUIT 9 COFFEE, TEA, MATE 10 GRAINS 11 MOLINER12 OLEAGINOUS SEEDS, MEDIC.
PLANTS, TILLING 13 RUBBER, RESINS AND
PLANT EXTRACTS 14 VINING MATERIALS AND OTHER
PLANT PRODUCTS
AGRIC SECTOR
C2a. Trade balance of the sector. Imports of cereals, which totaled USD 185 million, are noteworthy. Imports of seeds should also be underlined, in that in 2004 they totaled USD 105 million. With respect to exports from the Dominican Republic, the most representative chapter is fruits (Chapter 8), which were USD 28 million for 2004.
BILATERAL TRADE BETWEEN THE DOMINICAN REPUBIC AND THE UNITED STATES OF AMERICA VI-12
1999 2000 2001 2002 2003 2004 % CHANGE
DESCRIPTION 1999- 2004
Imports 6 LIVE PLANTS AND
FLOWERS 2.071.236 2 082.305 2.183.171 2.355.783 1.832.418 1.754 930 -3,26%
Exports 6 LIVE PLANTS AND
FLORES 259.944 315.254 258.098 388.302 283.052 274.393 1,09%
BALANCE 6 Live PLANTS and
FLOWERS
-1.811.292 -1.767.051 -1 925.073 -1.967.481 -1.549.366 -1.480.537 -3,95%
Imports 7 HORTALIZAS 16.709.788 17.692.649 19.649.664 16.097.441 14.239.522 19.428.943 3,06%Exports 7 HORTALIZAS 10 536.195 12.424.823 9.913.912 10.283.195 6.435.100 7.327 313 -7,01%BALANCE 7 HORTALIZAS -6.173.593 -5.267.826 -9.735.752 -5.814.246 -7.804.422 -12.101.630 14,41%Imports 8 FRUITS 26.662.928 24.574.025 25.661.827 26.309.436 27.583.313 28.147.534 1,09%Exports 8 FRUTAS 9.027.602 10.578.775 12.686.273 12.975.065 6.417.761 7.228 531 -4,35%BALANCE 8 FRUTAS -17.635.326 -13.995 250 -12.975.554 -13 334.371 -21.165.552 -20.919.003 3,47%
Imports 9 CAFÉ, TE, MATE
ESPECIAS 12.662.546 11.388.360 6.736.123 7.913.859 11.122.572 631.555 -45,10%
Exports 9 CAFÉ, TE, MATE
ESPECIAS 319.997 468.930 371.542 450.500 580.754 211.345 -7,96%
BALANCE 9 CAFÉ, TE, MATE
ESPECIAS -12 342.549 -10.919.430 -6 364.581 -7.463.359 -10.541.818 -420.210 -49,14%
Imports 10 CEREALES 0 0 0 0 0 0 -100,00%Exports 10 CEREALES 150.934.162 152.942.553 145.696.147 160.428.351 156.437.689 185.437.816 4,20%BALANCE 10 CEREALES 150 934.162 152.942.553 145.696.147 160.428.351 156.437.689 185.437.816 4,20%Imports 11 MOLINERIA 145.403 85.276 102.739 129.921 132.615 28.989 -27,57%Exports 11 MOLINERIA 15 825.732 2.724.397 2.095.597 2.872.389 1.765.921 13.347.546 -3,35%BALANCE 11 MOLINERIA 15.680.329 2.639.121 1.992 858 2.742.468 1.633.306 13.318.557 -3,21%
Imports
12 SEMILLAS OLEAGINOSAS, PLANTAS MEDICINALES, FORRAJE
18.321 42.513 48.893 304.749 81.273 105.554 41,94%
Exports
12 SEMILLAS OLEAGINOSAS, PLANTAS MEDICINALES, FORRAJE
2.057.330 2.626.436 3.337.108 1.908.907 1.433.265 12.307.379 43,01%
BALANCE
12 SEMILLAS OLEAGINOSAS, PLANTAS MEDICINALES, FORRAJE 2.039.009 2.583 923 3.288 215 1.604.158 1.351.992 12.201.825
43,02%
Imports
13 GOMAS, RESINAS, JUGOS Y EXTRACTOS VEGETALES
3.974.475 5 550.969 7.493.069 7.505.559 6.415.873 5.139 812 5,28%
Exports
13 GOMAS, RESINAS, JUGOS Y EXTRACTOS VEGETALES
2.634.445 2.705.690 2.792.237 1.384.230 1.817.051 992.274 -17,74%
BALANCE
13 GOMAS, RESINAS, JUGOS Y EXTRACTOS VEGETALES
-1.340.030 -2.845.279 -4.700.832 -6.121.329 -4.598.822 -4.147.538
25,35%
Imports
14 MATERIAL TRENZABLE Y DEMAS PRODUCTOS VEGETALES
0 0 3.960 0 2.600 0 -100,00%
Exports
14 MATERIAL TRENZABLE Y DEMAS PRODUCTOS VEGETALES
23.400 80.194 60.607 15.936 7.918 50.626 16,69%
BALANCE
14 MATERIAL TRENZABLE Y DEMAS PRODUCTOS VEGETALES 23.400 80.194 56.647 15.936 5.318 50.626
16,69%
U.S. TRADE BALANCE WITH DOMINICAN REPUBLIC: AGRICULTURAL SECTOR CHAPTER US $
Source: US INTERNATIONAL TRADE COMMISSION
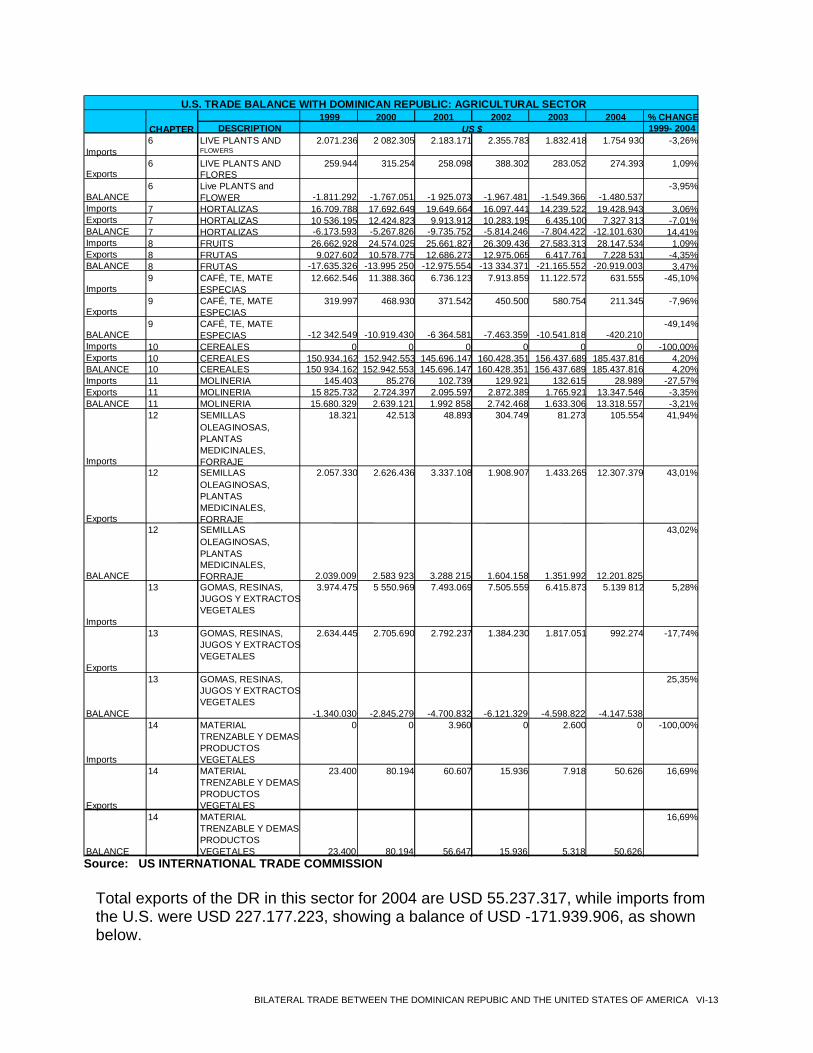
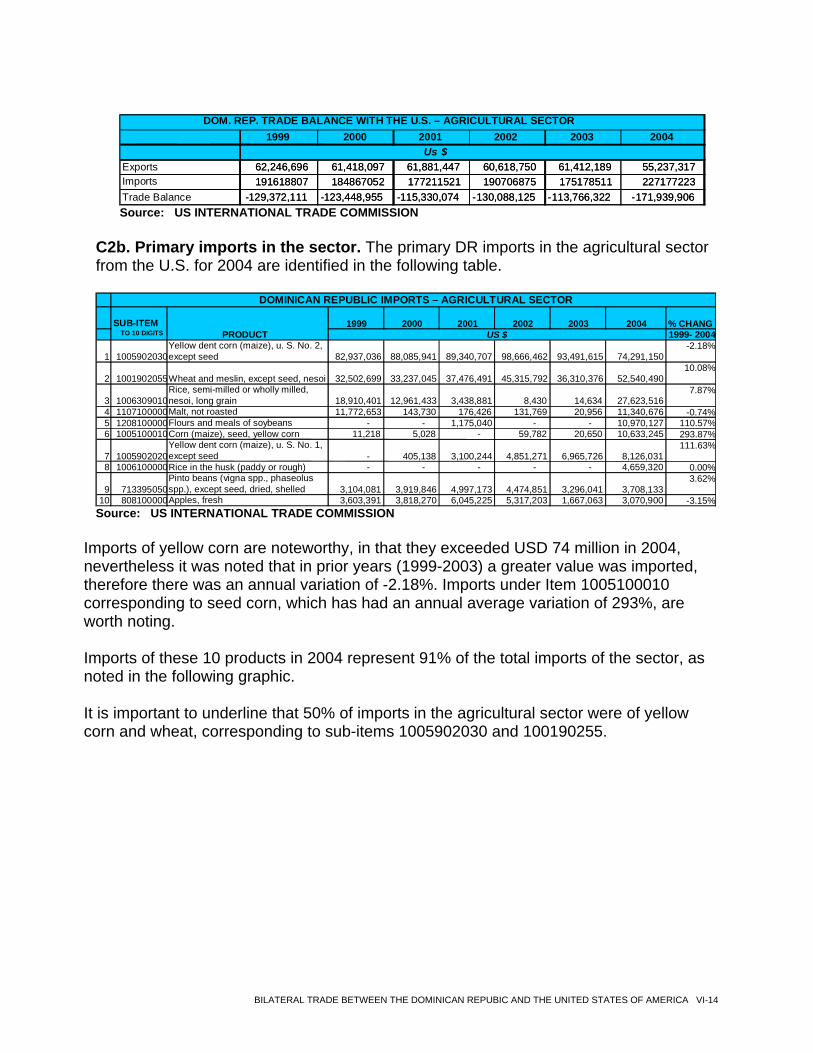
Total exports of the DR in this sector for 2004 are USD 55.237.317, while imports from the U.S. were USD 227.177.223, showing a balance of USD -171.939.906, as shown below.
BILATERAL TRADE BETWEEN THE DOMINICAN REPUBIC AND THE UNITED STATES OF AMERICA VI-13
Source: US INTERNATIONAL TRADE COMMISSION
1999 2000 2001 2002 2003 2004
Exports 62,246,696 61,418,097 61,881,447 60,618,750 61,412,189 55,237,317Imports 191618807 184867052 177211521 190706875 175178511 227177223Trade Balance - 129,372,111 - 123,448,955 -115,330,074 -130,088,125 -113,766,322 - 171,939,906
Us $
1999 2000 2001 2002 2003 2004
62,246,696 61,418,097 61,881,447 60,618,750 61,412,189 55,237,317191618807 184867052 177211521 190706875 175178511 227177223
- 129,372,111 - 123,448,955 -115,330,074 -130,088,125 -113,766,322 - 171,939,906
Us $
DOM. REP. TRADE BALANCE WITH THE U.S. – AGRICULTURAL SECTOR
C2b. Primary imports in the sector. The primary DR imports in the agricultural sector from the U.S. for 2004 are identified in the following table.
1999 2000 2001 2002 2003 2004 % CHANG1999- 2004
1 1005902030 Yellow dent corn (maize), u. S. No. 2, except seed 82,937,036 88,085,941 89,340,707 98,666,462 93,491,615 74,291,150
-2.18%
2 1001902055 Wheat and meslin, except seed, nesoi 32,502,699 33,237,045 37,476,491 45,315,792 36,310,376 52,540,49010.08%
3 1006309010 Rice, semi-milled or wholly milled, nesoi, long grain 18,910,401 12,961,433 3,438,881 8,430 14,634 27,623,516
7.87%
4 1107100000 Malt, not roasted 11,772,653 143,730 176,426 131,769 20,956 11,340,676 -0.74%5 1208100000 Flours and meals of soybeans - - 1,175,040 - - 10,970,127 110.57%6 1005100010 Corn (maize), seed, yellow corn 11,218 5,028 - 59,782 20,650 10,633,245 293.87%
7 1005902020 Yellow dent corn (maize), u. S. No. 1, except seed - 405,138 3,100,244 4,851,271 6,965,726 8,126,031
111.63%
8 1006100000 Rice in the husk (paddy or rough) - - - - - 4,659,320 0.00%
9 713395050 Pinto beans (vigna spp., phaseolus spp.), except seed, dried, shelled 3,104,081 3,919,846 4,997,173 4,474,851 3,296,041 3,708,133
3.62%
10 808100000 Apples, fresh 3,603,391 3,818,270 6,045,225 5,317,203 1,667,063 3,070,900 -3.15%
DOMINICAN REPUBLIC IMPORTS – AGRICULTURAL SECTOR
SUB-ITEM TO 10 DIGITS PRODUCT US $
Source: US INTERNATIONAL TRADE COMMISSION
Imports of yellow corn are noteworthy, in that they exceeded USD 74 million in 2004, nevertheless it was noted that in prior years (1999-2003) a greater value was imported, therefore there was an annual variation of -2.18%. Imports under Item 1005100010 corresponding to seed corn, which has had an annual average variation of 293%, are worth noting. Imports of these 10 products in 2004 represent 91% of the total imports of the sector, as noted in the following graphic. It is important to underline that 50% of imports in the agricultural sector were of yellow corn and wheat, corresponding to sub-items 1005902030 and 100190255.
BILATERAL TRADE BETWEEN THE DOMINICAN REPUBIC AND THE UNITED STATES OF AMERICA VI-14
PRIMARY IMPORTS OF THE DOM. REPUBLIC – TO 10 DIGITS
AGRICULTURAL SECTOR - 2004
32.70%
23.13% 12.16%
4.99%
4.83%
4.68%
3.58%
2.05% 1.63% 1.35%
8.90%
10059020301001902055100630901011071000001208100000100510001010059020201006100000713395050808100000OTROS
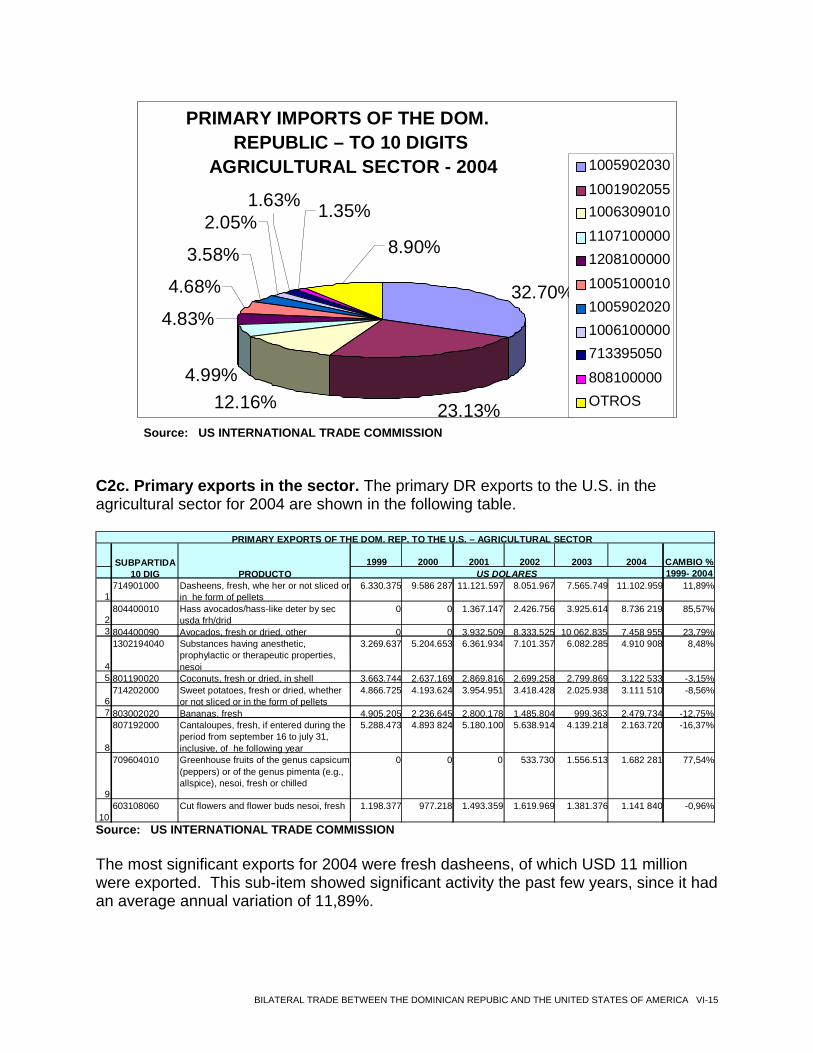
Source: US INTERNATIONAL TRADE COMMISSION C2c. Primary exports in the sector. The primary DR exports to the U.S. in the agricultural sector for 2004 are shown in the following table.
1999 2000 2001 2002 2003 2004 CAMBIO %1999- 2004
1 714901000 Dasheens, fresh, whe her or not sliced or
in he form of pellets 6.330.375 9.586 287 11.121.597 8.051.967 7.565.749 11.102.959 11,89%
2 804400010 Hass avocados/hass-like deter by sec
usda frh/drid 0 0 1.367.147 2.426.756 3.925.614 8.736 219 85,57%
3 804400090 Avocados, fresh or dried, other 0 0 3.932.509 8.333.525 10 062.835 7.458 955 23,79%
4 1302194040 Substances having anesthetic,
prophylactic or therapeutic properties, nesoi
3.269.637 5.204.653 6.361.934 7.101.357 6.082.285 4.910 908 8,48%
5 801190020 Coconuts, fresh or dried, in shell 3.663.744 2.637.169 2.869.816 2.699.258 2.799.869 3.122 533 -3,15%
6 714202000 Sweet potatoes, fresh or dried, whether
or not sliced or in the form of pellets4.866.725 4.193.624 3.954.951 3.418.428 2.025.938 3.111 510 -8,56%
7 803002020 Bananas, fresh 4.905.205 2.236.645 2.800.178 1.485.804 999.363 2.479.734 -12,75%
8 807192000 Cantaloupes, fresh, if entered during the
period from september 16 to july 31, inclusive, of he following year
5.288.473 4.893 824 5.180.100 5.638.914 4.139.218 2.163.720 -16,37%
9
709604010 Greenhouse fruits of the genus capsicum (peppers) or of the genus pimenta (e.g., allspice), nesoi, fresh or chilled
0 0 0 533.730 1.556.513 1.682 281 77,54%
10 603108060 Cut flowers and flower buds nesoi, fresh 1.198.377 977.218 1.493.359 1.619.969 1.381.376 1.141 840 -0,96%
SUBPARTIDA 10 DIG PRODUCTO US DOLARES
PRIMARY EXPORTS OF THE DOM. REP. TO THE U.S. – AGRICULTURAL SECTOR
Source: US INTERNATIONAL TRADE COMMISSION
The most significant exports for 2004 were fresh dasheens, of which USD 11 million were exported. This sub-item showed significant activity the past few years, since it had an average annual variation of 11,89%.
BILATERAL TRADE BETWEEN THE DOMINICAN REPUBIC AND THE UNITED STATES OF AMERICA VI-15
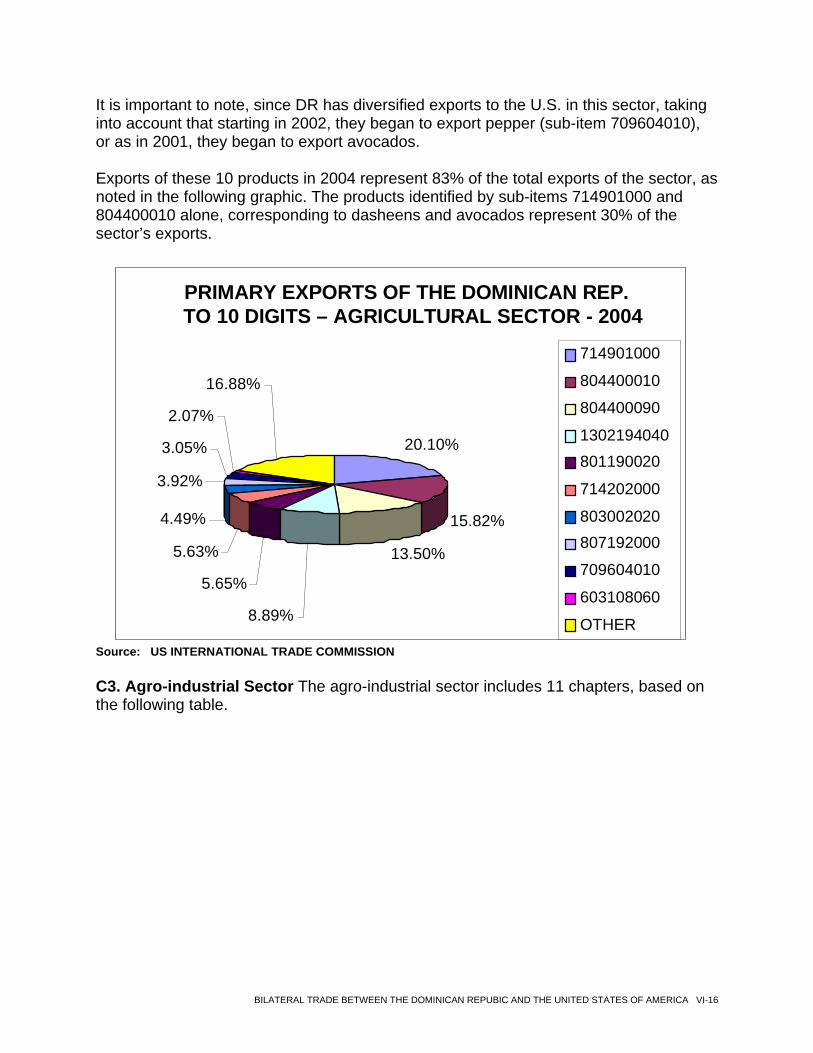
It is important to note, since DR has diversified exports to the U.S. in this sector, taking into account that starting in 2002, they began to export pepper (sub-item 709604010), or as in 2001, they began to export avocados. Exports of these 10 products in 2004 represent 83% of the total exports of the sector, as noted in the following graphic. The products identified by sub-items 714901000 and 804400010 alone, corresponding to dasheens and avocados represent 30% of the sector’s exports.
PRIMARY EXPORTS OF THE DOMINICAN REP. TO 10 DIGITS – AGRICULTURAL SECTOR - 2004
20.10%
15.82%
13.50%
8.89%
5.65%
5.63%
4.49%
3.92%
3.05%
2.07%
16.88%
714901000
804400010
804400090
1302194040 801190020
714202000
803002020 807192000
709604010
603108060
OTHER
Source: US INTERNATIONAL TRADE COMMISSION C3. Agro-industrial Sector The agro-industrial sector includes 11 chapters, based on the following table.
BILATERAL TRADE BETWEEN THE DOMINICAN REPUBIC AND THE UNITED STATES OF AMERICA VI-16
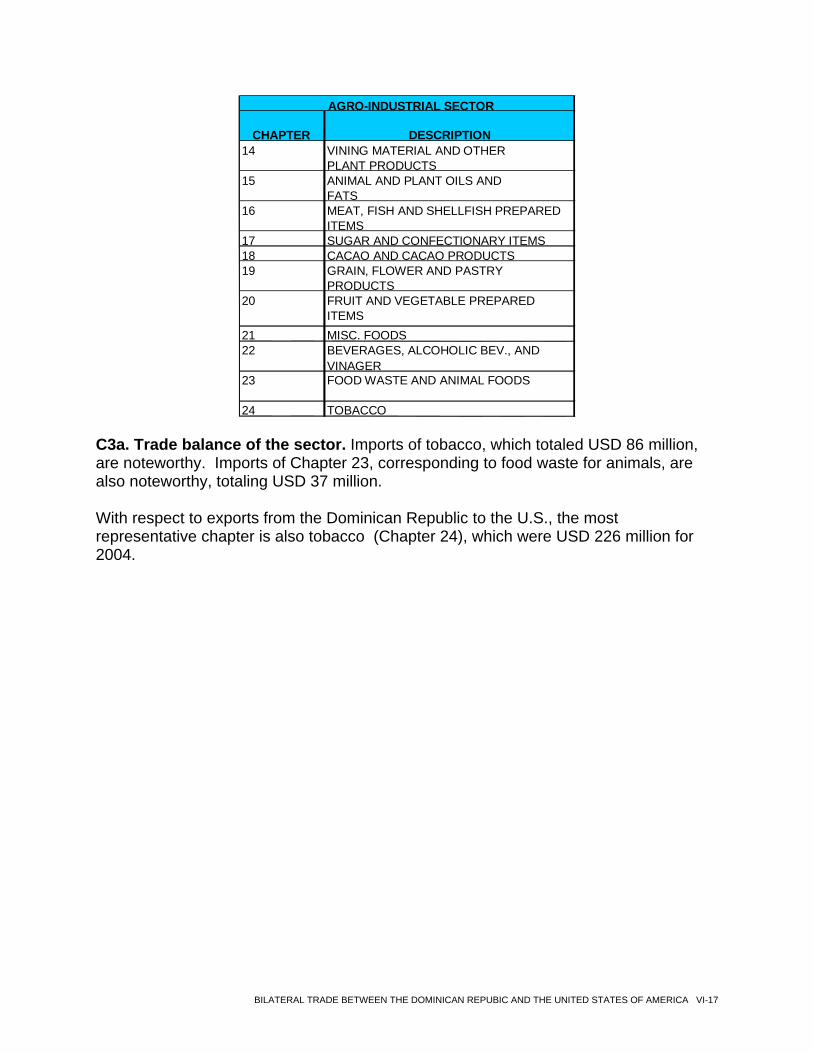
CHAPTER DESCRIPTION14 VINING MATERIAL AND OTHER
PLANT PRODUCTS15 ANIMAL AND PLANT OILS AND
FATS16 MEAT, FISH AND SHELLFISH PREPARED
ITEMS17 SUGAR AND CONFECTIONARY ITEMS18 CACAO AND CACAO PRODUCTS19 GRAIN, FLOWER AND PASTRY
PRODUCTS20 FRUIT AND VEGETABLE PREPARED
ITEMS21 MISC. FOODS22 BEVERAGES, ALCOHOLIC BEV., AND
VINAGER23 FOOD WASTE AND ANIMAL FOODS
24 TOBACCO
AGRO-INDUSTRIAL SECTOR
C3a. Trade balance of the sector. Imports of tobacco, which totaled USD 86 million, are noteworthy. Imports of Chapter 23, corresponding to food waste for animals, are also noteworthy, totaling USD 37 million. With respect to exports from the Dominican Republic to the U.S., the most representative chapter is also tobacco (Chapter 24), which were USD 226 million for 2004.
BILATERAL TRADE BETWEEN THE DOMINICAN REPUBIC AND THE UNITED STATES OF AMERICA VI-17
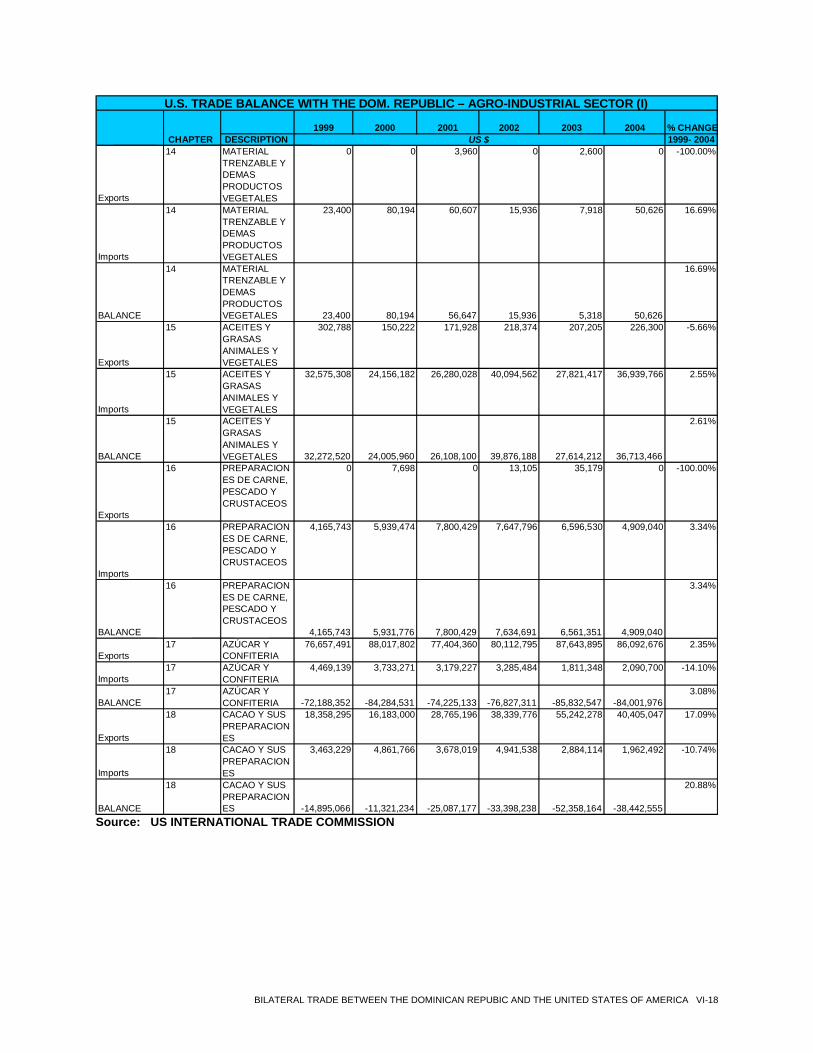
Source: US INTERNATIONAL TRADE COMMISSION
1999 2000 2001 2002 2003 2004 % CHANGE
DESCRIPTION 1999- 2004
Exports
14 MATERIAL TRENZABLE Y DEMAS PRODUCTOS VEGETALES
0 0 3,960 0 2,600 0 -100.00%
Imports
14 MATERIAL TRENZABLE Y DEMAS PRODUCTOS VEGETALES
23,400 80,194 60,607 15,936 7,918 50,626 16.69%
BALANCE
14 MATERIAL TRENZABLE Y DEMAS PRODUCTOS VEGETALES 23,400 80,194 56,647 15,936 5,318 50,626
16.69%
Exports
15 ACEITES Y GRASAS ANIMALES Y VEGETALES
302,788 150,222 171,928 218,374 207,205 226,300 -5.66%
Imports
15 ACEITES Y GRASAS ANIMALES Y VEGETALES
32,575,308 24,156,182 26,280,028 40,094,562 27,821,417 36,939,766 2.55%
BALANCE
15 ACEITES Y GRASAS ANIMALES Y VEGETALES 32,272,520 24,005,960 26,108,100 39,876,188 27,614,212 36,713,466
2.61%
Exports
16 PREPARACION ES DE CARNE, PESCADO Y CRUSTACEOS
0 7,698 0 13,105 35,179 0 -100.00%
Imports
16 PREPARACION ES DE CARNE, PESCADO Y CRUSTACEOS
4,165,743 5,939,474 7,800,429 7,647,796 6,596,530 4,909,040 3.34%
BALANCE
16 PREPARACION ES DE CARNE, PESCADO Y CRUSTACEOS
4,165,743 5,931,776 7,800,429 7,634,691 6,561,351 4,909,040
3.34%
Exports 17 AZÚCAR Y
CONFITERIA 76,657,491 88,017,802 77,404,360 80,112,795 87,643,895 86,092,676 2.35%
Imports 17 AZÚCAR Y
CONFITERIA 4,469,139 3,733,271 3,179,227 3,285,484 1,811,348 2,090,700 -14.10%
BALANCE 17 AZÚCAR Y
CONFITERIA -72,188,352 -84,284,531 -74,225,133 -76,827,311 -85,832,547 -84,001,9763.08%
Exports 18 CACAO Y SUS
PREPARACION ES
18,358,295 16,183,000 28,765,196 38,339,776 55,242,278 40,405,047 17.09%
Imports 18 CACAO Y SUS
PREPARACION ES
3,463,229 4,861,766 3,678,019 4,941,538 2,884,114 1,962,492 -10.74%
BALANCE 18 CACAO Y SUS
PREPARACION ES -14,895,066 -11,321,234 -25,087,177 -33,398,238 -52,358,164 -38,442,555
20.88%
U.S. TRADE BALANCE WITH THE DOM. REPUBLIC – AGRO-INDUSTRIAL SECTOR (I)
CHAPTER US $
BILATERAL TRADE BETWEEN THE DOMINICAN REPUBIC AND THE UNITED STATES OF AMERICA VI-18
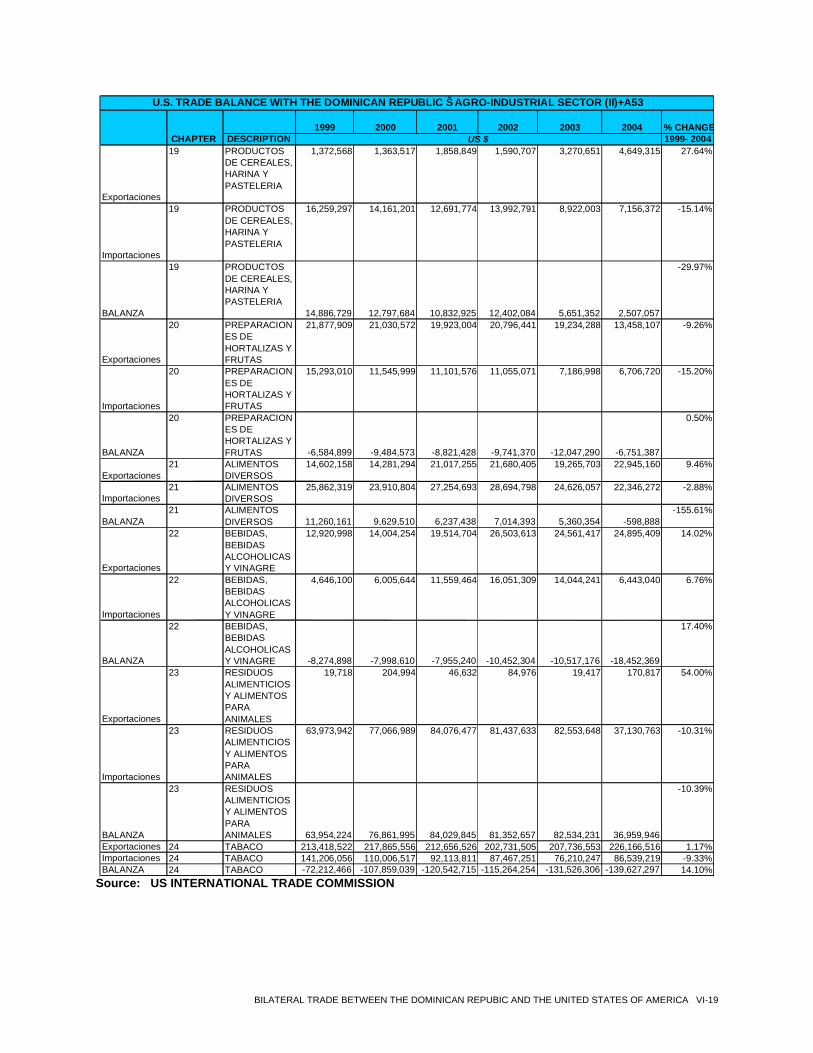
1999 2000 2001 2002 2003 2004 % CHANGE
DESCRIPTION 1999- 2004
Exportaciones
19 PRODUCTOS DE CEREALES, HARINA Y PASTELERIA
1,372,568 1,363,517 1,858,849 1,590,707 3,270,651 4,649,315 27.64%
Importaciones
19 PRODUCTOS DE CEREALES, HARINA Y PASTELERIA
16,259,297 14,161,201 12,691,774 13,992,791 8,922,003 7,156,372 -15.14%
BALANZA
19 PRODUCTOS DE CEREALES, HARINA Y PASTELERIA
14,886,729 12,797,684 10,832,925 12,402,084 5,651,352 2,507,057
-29.97%
Exportaciones
20 PREPARACION ES DE HORTALIZAS Y FRUTAS
21,877,909 21,030,572 19,923,004 20,796,441 19,234,288 13,458,107 -9.26%
Importaciones
20 PREPARACION ES DE HORTALIZAS Y FRUTAS
15,293,010 11,545,999 11,101,576 11,055,071 7,186,998 6,706,720 -15.20%
BALANZA
20 PREPARACION ES DE HORTALIZAS Y FRUTAS -6,584,899 -9,484,573 -8,821,428 -9,741,370 -12,047,290 -6,751,387
0.50%
Exportaciones 21 ALIMENTOS
DIVERSOS 14,602,158 14,281,294 21,017,255 21,680,405 19,265,703 22,945,160 9.46%
Importaciones 21 ALIMENTOS
DIVERSOS 25,862,319 23,910,804 27,254,693 28,694,798 24,626,057 22,346,272 -2.88%
BALANZA 21 ALIMENTOS
DIVERSOS 11,260,161 9,629,510 6,237,438 7,014,393 5,360,354 -598,888-155.61%
Exportaciones
22 BEBIDAS, BEBIDAS ALCOHOLICAS Y VINAGRE
12,920,998 14,004,254 19,514,704 26,503,613 24,561,417 24,895,409 14.02%
Importaciones
22 BEBIDAS, BEBIDAS ALCOHOLICAS Y VINAGRE
4,646,100 6,005,644 11,559,464 16,051,309 14,044,241 6,443,040 6.76%
BALANZA
22 BEBIDAS, BEBIDAS ALCOHOLICAS Y VINAGRE -8,274,898 -7,998,610 -7,955,240 -10,452,304 -10,517,176 -18,452,369
17.40%
Exportaciones
23 RESIDUOS ALIMENTICIOS Y ALIMENTOS PARA ANIMALES
19,718 204,994 46,632 84,976 19,417 170,817 54.00%
Importaciones
23 RESIDUOS ALIMENTICIOS Y ALIMENTOS PARA ANIMALES
63,973,942 77,066,989 84,076,477 81,437,633 82,553,648 37,130,763 -10.31%
BALANZA
23 RESIDUOS ALIMENTICIOS Y ALIMENTOS PARA ANIMALES 63,954,224 76,861,995 84,029,845 81,352,657 82,534,231 36,959,946
-10.39%
Exportaciones 24 TABACO 213,418,522 217,865,556 212,656,526 202,731,505 207,736,553 226,166,516 1.17%Importaciones 24 TABACO 141,206,056 110,006,517 92,113,811 87,467,251 76,210,247 86,539,219 -9.33%BALANZA 24 TABACO -72,212,466 -107,859,039 -120,542,715 -115,264,254 -131,526,306 -139,627,297 14.10%
U.S. TRADE BALANCE WITH THE DOMINICAN REPUBLIC Š AGRO-INDUSTRIAL SECTOR (II)+A53
CHAPTER US $
Source: US INTERNATIONAL TRADE COMMISSION
BILATERAL TRADE BETWEEN THE DOMINICAN REPUBIC AND THE UNITED STATES OF AMERICA VI-19
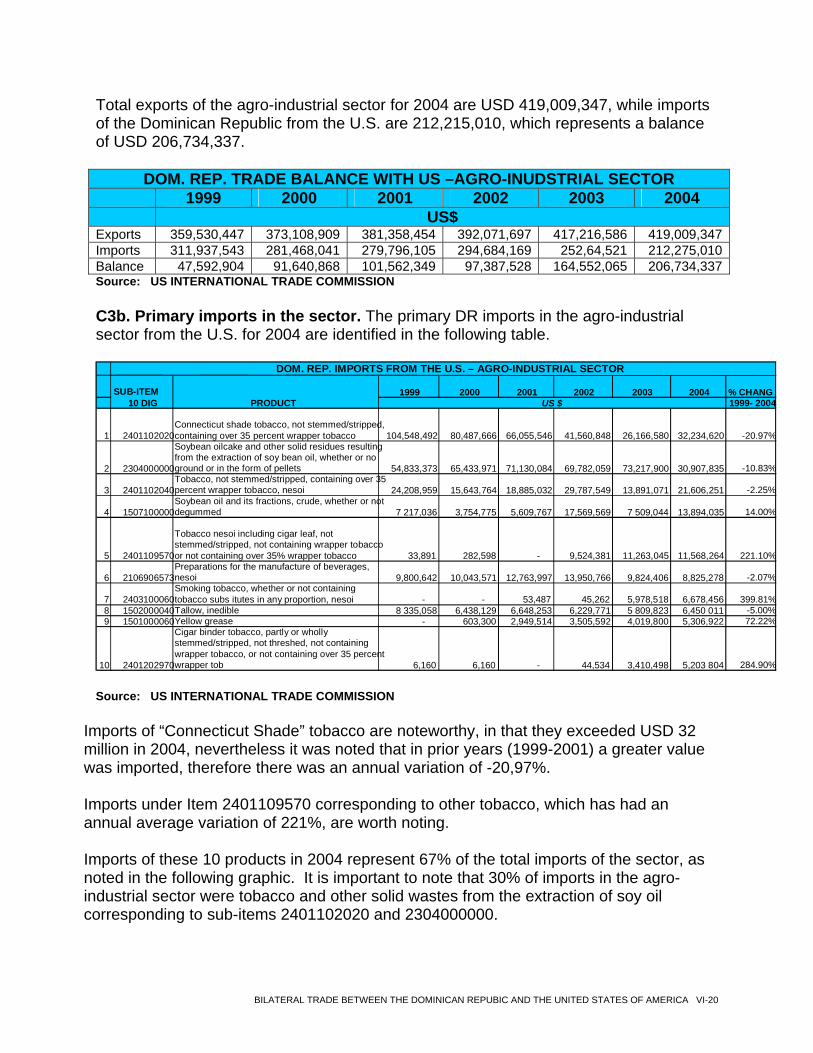
Total exports of the agro-industrial sector for 2004 are USD 419,009,347, while imports of the Dominican Republic from the U.S. are 212,215,010, which represents a balance of USD 206,734,337.
DOM. REP. TRADE BALANCE WITH US –AGRO-INUDSTRIAL SECTOR 1999 2000 2001 2002 2003 2004 US$ Exports 359,530,447 373,108,909 381,358,45 92,071,697 417,216,586 419,009,3474 3Imports 311,937,543 281,468,041 279,796,105 294,684,169 252,64,521 212,275,010Balance 47,592,904 91,640,868 101,562,349 97,387,528 164,552,065 206,734,337Source: US I AL MI
3b. Primary imports in the sector. The primary DR imports in the agro-industrial
NTERNATION TRADE COM SSION Csector from the U.S. for 2004 are identified in the following table.
1999 2000 2001 2002 2003 2004 % CHANG1999- 2004
1 2401102020 Connecticut shade tobacco, not stemmed/stripped, containing over 35 percent wrapper tobacco 104,548,492 80,487,666 66,055,546 41,560,848 26,166,580 32,234,620 -20.97%
2 2304000000 Soybean oilcake and other solid residues resulting from the extraction of soy bean oil, whether or no ground or in the form of pellets 54,833,373 65,433,971 71,130,084 69,782,059 73,217,900 30,907,835 -10.83%
3 2401102040 Tobacco, not stemmed/stripped, containing over 35 percent wrapper tobacco, nesoi 24,208,959 15,643,764 18,885,032 29,787,549 13,891,071 21,606,251 -2.25%
4 1507100000 Soybean oil and its fractions, crude, whether or not degummed 7 217,036 3,754,775 5,609,767 17,569,569 7 509,044 13,894,035 14.00%
5 2401109570 Tobacco nesoi including cigar leaf, not stemmed/stripped, not containing wrapper tobacco or not containing over 35% wrapper tobacco 33,891 282,598 - 9,524,381 11,263,045 11,568,264 221.10%
6 2106906573 Preparations for the manufacture of beverages, nesoi 9,800,642 10,043,571 12,763,997 13,950,766 9,824,406 8,825,278 -2.07%
7 2403100060 Smoking tobacco, whether or not containing tobacco subs itutes in any proportion, nesoi - - 53,487 45,262 5,978,518 6,678,456 399.81%
8 1502000040 Tallow, inedible 8 335,058 6,438,129 6,648,253 6,229,771 5 809,823 6,450 011 -5.00%9 1501000060 Yellow grease - 603,300 2,949,514 3,505,592 4,019,800 5,306,922 72.22%
10 2401202970
Cigar binder tobacco, partly or wholly stemmed/stripped, not threshed, not containing wrapper tobacco, or not containing over 35 percent wrapper tob 6,160 6,160 - 44,534 3,410,498 5,203 804 284.90%
SUB-ITEM 10 DIG PRODUCT US $
DOM. REP. IMPORTS FROM THE U.S. – AGRO-INDUSTRIAL SECTOR
ource: US INTERNATIONAL TRADE COMMISSION
ports of “Connecticut Shade” tobacco are noteworthy, in that they exceeded USD 32
ports under Item 2401109570 corresponding to other tobacco, which has had an
ports of these 10 products in 2004 represent 67% of the total imports of the sector, as
S
Immillion in 2004, nevertheless it was noted that in prior years (1999-2001) a greater valuewas imported, therefore there was an annual variation of -20,97%. Imannual average variation of 221%, are worth noting. Imnoted in the following graphic. It is important to note that 30% of imports in the agro-industrial sector were tobacco and other solid wastes from the extraction of soy oil corresponding to sub-items 2401102020 and 2304000000.
BILATERAL TRADE BETWEEN THE DOMINICAN REPUBIC AND THE UNITED STATES OF AMERICA VI-20
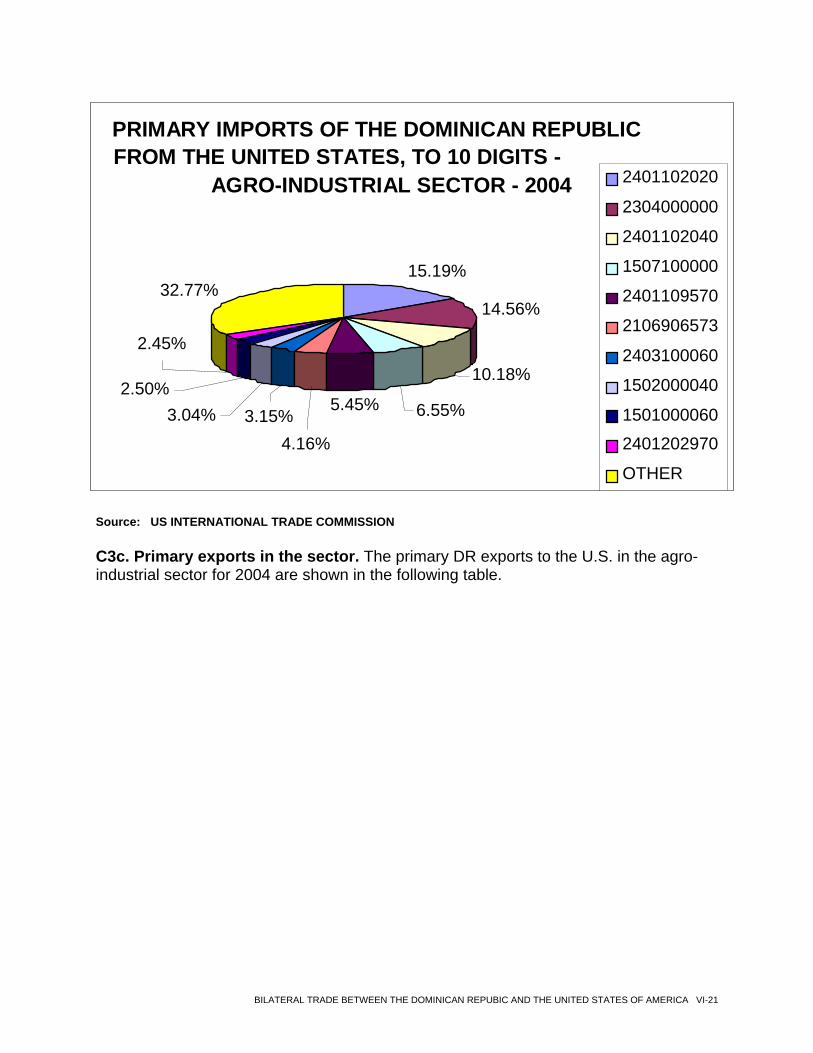
PRIMARY IMPORTS OF THE DOMINICAN REPUBLIC
FROM THE UNITED STATES, TO 10 DIGITS - AGRO-INDUSTRIAL SECTOR - 2004
15.19%
14.56%
10.18%
6.55% 5.45%
32.77%
4.16%
3.15% 3.04%
2.50%
2.45%
2401102020
2304000000
2401102040
1507100000
2401109570
2106906573
2403100060
1502000040
1501000060
2401202970
OTHER
Source: US INTERNATIONAL TRADE COMMISSION
C3c. Primary exports in the sector. The primary DR exports to the U.S. in the agro-
industrial sector for 2004 are shown in the following table.
BILATERAL TRADE BETWEEN THE DOMINICAN REPUBIC AND THE UNITED STATES OF AMERICA VI-21
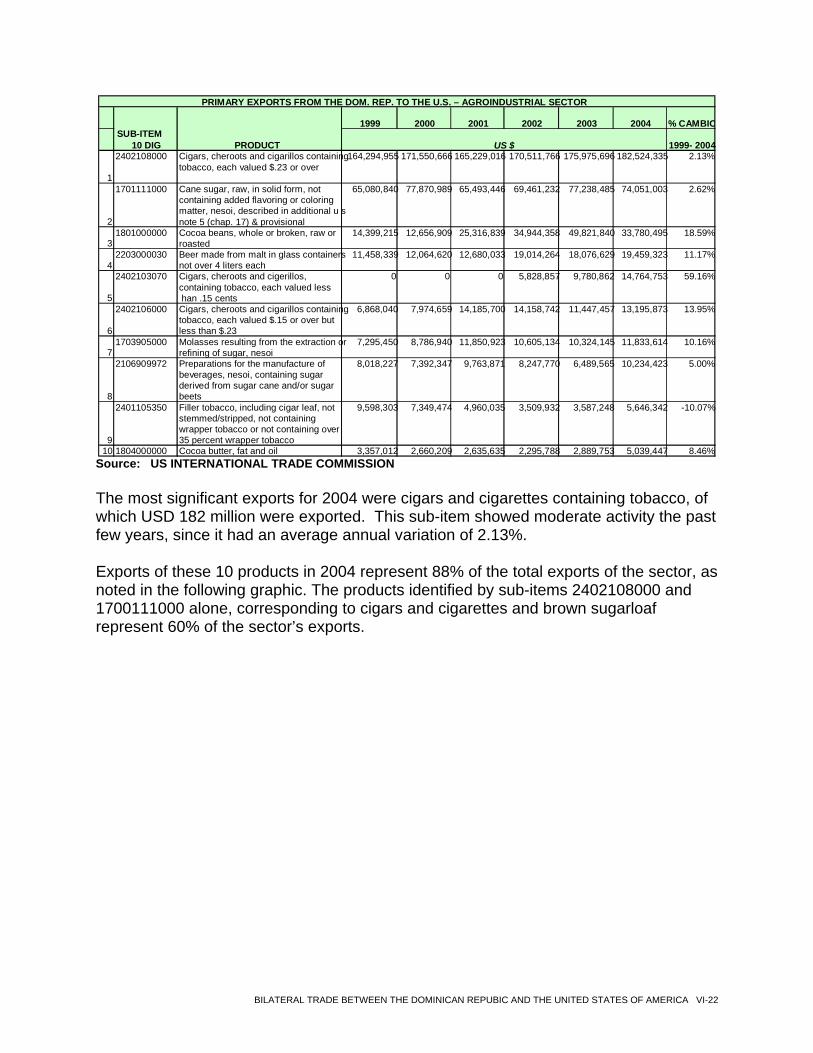
1999 2000 2001 2002 2003 2004 % CAMBIO
1999- 2004
1 2402108000 Cigars, cheroots and cigarillos containing
tobacco, each valued $.23 or over 164,294,955 171,550,666 165,229,016 170,511,766 175,975,696 182,524,335 2.13%
2
1701111000 Cane sugar, raw, in solid form, not containing added flavoring or coloring matter, nesoi, described in additional u s note 5 (chap. 17) & provisional
65,080,840 77,870,989 65,493,446 69,461,232 77,238,485 74,051,003 2.62%
3 1801000000 Cocoa beans, whole or broken, raw or
roasted 14,399,215 12,656,909 25,316,839 34,944,358 49,821,840 33,780,495 18.59%
4 2203000030 Beer made from malt in glass containers
not over 4 liters each 11,458,339 12,064,620 12,680,033 19,014,264 18,076,629 19,459,323 11.17%
5 2402103070 Cigars, cheroots and cigerillos,
containing tobacco, each valued less han .15 cents
0 0 0 5,828,857 9,780,862 14,764,753 59.16%
6 2402106000 Cigars, cheroots and cigarillos containing
tobacco, each valued $.15 or over but less than $.23
6,868,040 7,974,659 14,185,700 14,158,742 11,447,457 13,195,873 13.95%
7 1703905000 Molasses resulting from the extraction or
refining of sugar, nesoi 7,295,450 8,786,940 11,850,923 10,605,134 10,324,145 11,833,614 10.16%
8
2106909972 Preparations for the manufacture of beverages, nesoi, containing sugar derived from sugar cane and/or sugar beets
8,018,227 7,392,347 9,763,871 8,247,770 6,489,565 10,234,423 5.00%
9
2401105350 Filler tobacco, including cigar leaf, not stemmed/stripped, not containing wrapper tobacco or not containing over 35 percent wrapper tobacco
9,598,303 7,349,474 4,960,035 3,509,932 3,587,248 5,646,342 -10.07%
10 1804000000 Cocoa butter, fat and oil 3,357,012 2,660,209 2,635,635 2,295,788 2,889,753 5,039,447 8.46%
SUB-ITEM 10 DIG PRODUCT US $
PRIMARY EXPORTS FROM THE DOM. REP. TO THE U.S. – AGROINDUSTRIAL SECTOR
Source: US INTERNATIONAL TRADE COMMISSION
The most significant exports for 2004 were cigars and cigarettes containing tobacco, of which USD 182 million were exported. This sub-item showed moderate activity the past few years, since it had an average annual variation of 2.13%. Exports of these 10 products in 2004 represent 88% of the total exports of the sector, as noted in the following graphic. The products identified by sub-items 2402108000 and 1700111000 alone, corresponding to cigars and cigarettes and brown sugarloaf represent 60% of the sector’s exports.
BILATERAL TRADE BETWEEN THE DOMINICAN REPUBIC AND THE UNITED STATES OF AMERICA VI-22
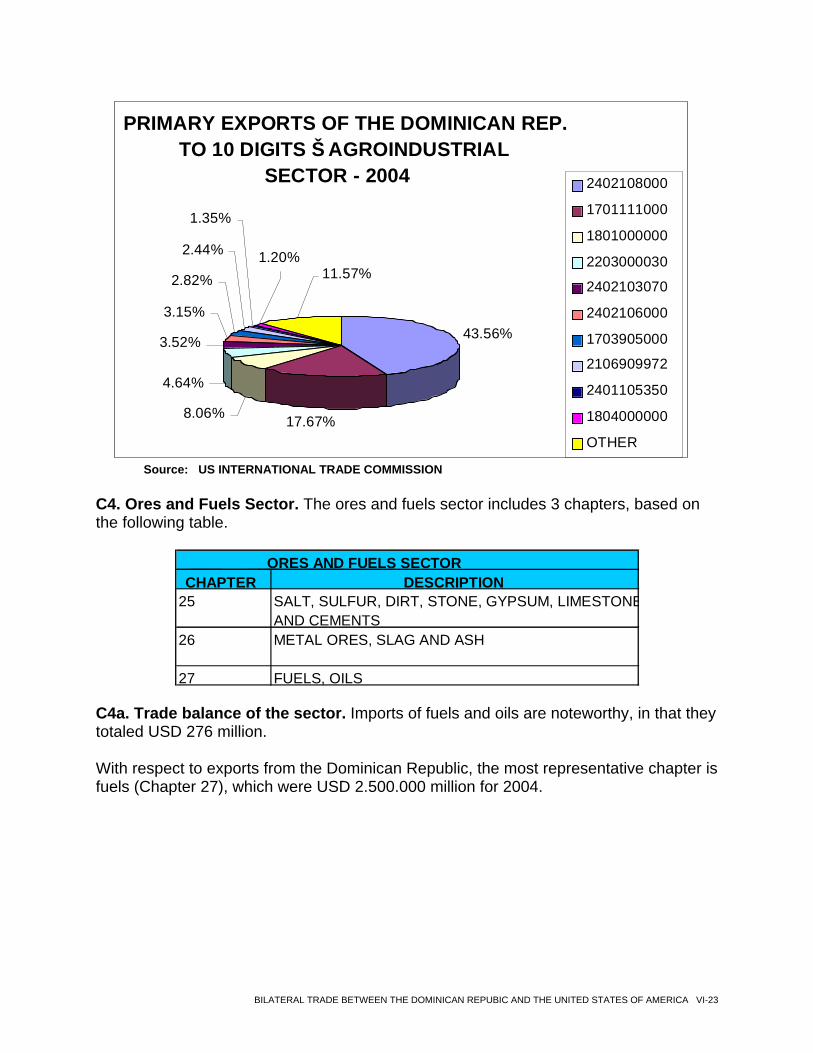
PRIMARY EXPORTS OF THE DOMINICAN REP.
TO 10 DIGITS Š AGROINDUSTRIAL SECTOR - 2004
43.56%
17.67%8.06%
4.64%
3.52%
3.15%
2.82%
2.44%
1.35%
1.20% 11.57%
2402108000
1701111000
1801000000
2203000030
2402103070
2402106000
1703905000
2106909972
2401105350
1804000000
OTHER
Source: US INTERNATIONAL TRADE COMMISSION C4. Ores and Fuels Sector. The ores and fuels sector includes 3 chapters, based on the following table.
CHAPTER DESCRIPTION
25 SALT, SULFUR, DIRT, STONE, GYPSUM, LIMESTONEAND CEMENTS
26 METAL ORES, SLAG AND ASH
27 FUELS, OILS
ORES AND FUELS SECTOR
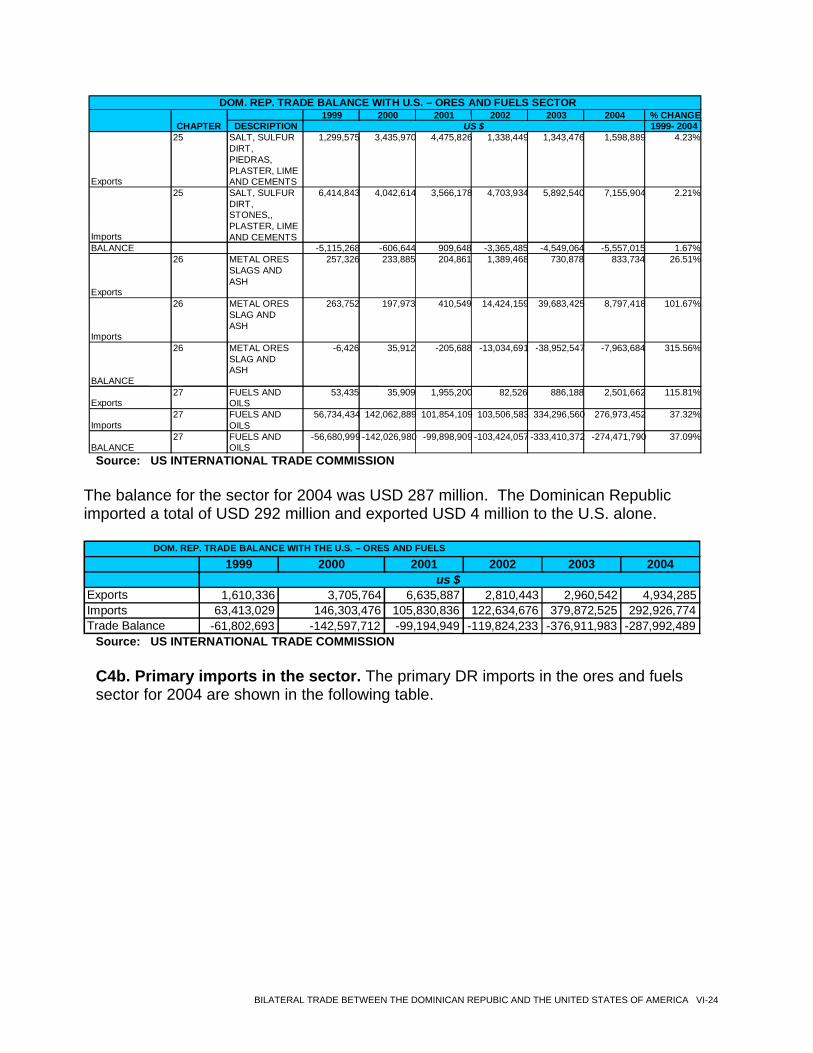
C4a. Trade balance of the sector. Imports of fuels and oils are noteworthy, in that they totaled USD 276 million. With respect to exports from the Dominican Republic, the most representative chapter is fuels (Chapter 27), which were USD 2.500.000 million for 2004.
BILATERAL TRADE BETWEEN THE DOMINICAN REPUBIC AND THE UNITED STATES OF AMERICA VI-23
1999 2000 2001 2002 2003 2004 % CHANGE
DESCRIPTION 1999- 2004
Exports
25 SALT, SULFUR DIRT, PIEDRAS, PLASTER, LIME AND CEMENTS
1,299,575 3,435,970 4,475,826 1,338,449 1,343,476 1,598,889 4.23%
Imports
25 SALT, SULFUR DIRT, STONES,, PLASTER, LIME AND CEMENTS
6,414,843 4,042,614 3,566,178 4,703,934 5,892,540 7,155,904 2.21%
BALANCE -5,115,268 -606,644 909,648 -3,365,485 -4,549,064 -5,557,015 1.67%
Exports
26 METAL ORES SLAGS AND ASH
257,326 233,885 204,861 1,389,468 730,878 833,734 26.51%
Imports
26 METAL ORES SLAG AND ASH
263,752 197,973 410,549 14,424,159 39,683,425 8,797,418 101.67%
BALANCE
26 METAL ORES SLAG AND ASH
-6,426 35,912 -205,688 -13,034,691 -38,952,547 -7,963,684 315.56%
Exports 27 FUELS AND
OILS 53,435 35,909 1,955,200 82,526 886,188 2,501,662 115.81%
Imports 27 FUELS AND
OILS 56,734,434 142,062,889 101,854,109 103,506,583 334,296,560 276,973,452 37.32%
BALANCE 27 FUELS AND
OILS -56,680,999 -142,026,980 -99,898,909 -103,424,057 -333,410,372 -274,471,790 37.09%
DOM. REP. TRADE BALANCE WITH U.S. – ORES AND FUELS SECTOR
CHAPTER US $
Source: US INTERNATIONAL TRADE COMMISSION
The balance for the sector for 2004 was USD 287 million. The Dominican Republic imported a total of USD 292 million and exported USD 4 million to the U.S. alone.
1999 2000 2001 2002 2003 2004
Exports 1,610,336 3,705,764 6,635,887 2,810,443 2,960,542 4,934,285Imports 63,413,029 146,303,476 105,830,836 122,634,676 379,872,525 292,926,774Trade Balance -61,802,693 -142,597,712 -99,194,949 -119,824,233 -376,911,983 -287,992,489
DOM. REP. TRADE BALANCE WITH THE U.S. – ORES AND FUELS
us $
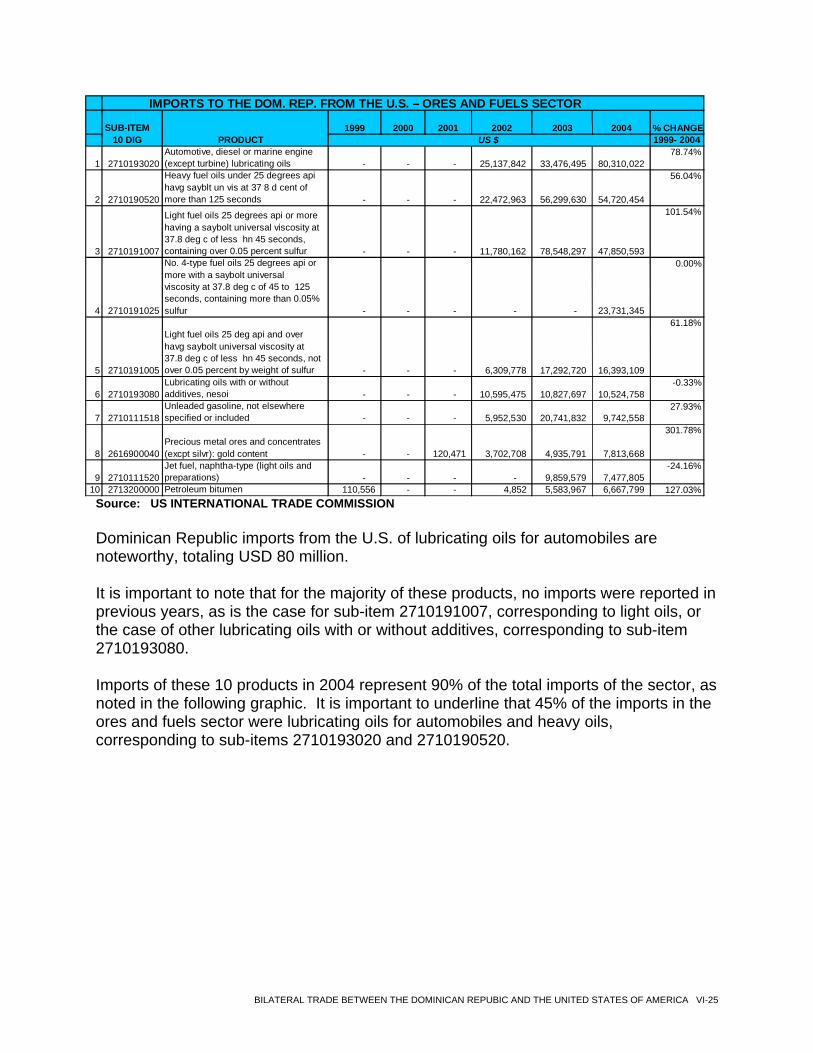
Source: US INTERNATIONAL TRADE COMMISSION C4b. Primary imports in the sector. The primary DR imports in the ores and fuels sector for 2004 are shown in the following table.
BILATERAL TRADE BETWEEN THE DOMINICAN REPUBIC AND THE UNITED STATES OF AMERICA VI-24
1999 2000 2001 2002 2003 2004 % CHANGE
1999- 2004
1 2710193020 Automotive, diesel or marine engine (except turbine) lubricating oils - - - 25,137,842 33,476,495 80,310,022
78.74%
2 2710190520 Heavy fuel oils under 25 degrees api havg sayblt un vis at 37 8 d cent of more than 125 seconds - - - 22,472,963 56,299,630 54,720,454
56.04%
3 2710191007
Light fuel oils 25 degrees api or more having a saybolt universal viscosity at 37.8 deg c of less hn 45 seconds, containing over 0.05 percent sulfur - - - 11,780,162 78,548,297 47,850,593
101.54%
4 2710191025
No. 4-type fuel oils 25 degrees api or more with a saybolt universal viscosity at 37.8 deg c of 45 to 125 seconds, containing more than 0.05% sulfur - - - - - 23,731,345
0.00%
5 2710191005
Light fuel oils 25 deg api and over havg saybolt universal viscosity at 37.8 deg c of less hn 45 seconds, not over 0.05 percent by weight of sulfur - - - 6,309,778 17,292,720 16,393,109
61.18%
6 2710193080 Lubricating oils with or without additives, nesoi - - - 10,595,475 10,827,697 10,524,758
-0.33%
7 2710111518 Unleaded gasoline, not elsewhere specified or included - - - 5,952,530 20,741,832 9,742,558
27.93%
8 2616900040 Precious metal ores and concentrates (excpt silvr): gold content - - 120,471 3,702,708 4,935,791 7,813,668
301.78%
9 2710111520 Jet fuel, naphtha-type (light oils and preparations) - - - - 9,859,579 7,477,805
-24.16%
10 2713200000 Petroleum bitumen 110,556 - - 4,852 5,583,967 6,667,799 127.03%
IMPORTS TO THE DOM. REP. FROM THE U.S. – ORES AND FUELS SECTOR SUB-ITEM
10 DIG PRODUCT US $
Source: US INTERNATIONAL TRADE COMMISSION
Dominican Republic imports from the U.S. of lubricating oils for automobiles are noteworthy, totaling USD 80 million.
It is important to note that for the majority of these products, no imports were reported in previous years, as is the case for sub-item 2710191007, corresponding to light oils, or the case of other lubricating oils with or without additives, corresponding to sub-item 2710193080. Imports of these 10 products in 2004 represent 90% of the total imports of the sector, as noted in the following graphic. It is important to underline that 45% of the imports in the ores and fuels sector were lubricating oils for automobiles and heavy oils, corresponding to sub-items 2710193020 and 2710190520.
BILATERAL TRADE BETWEEN THE DOMINICAN REPUBIC AND THE UNITED STATES OF AMERICA VI-25
PRIMARY DOM. REP. IMPORTS FROM THE U.S. TO 10 DIGITS
ORES AND FUELS SECTOR - 2004
27.43%
18.69%16.34% 8.10%
5.60%
3.59%
3.33%
2.67%
2.55% 9.42%
2.28%
2710193020271019052027101910072710191025271019100527101930802710111518261690004027101115202713200000OTHER
Source: US INTERNATIONAL TRADE COMMISSION
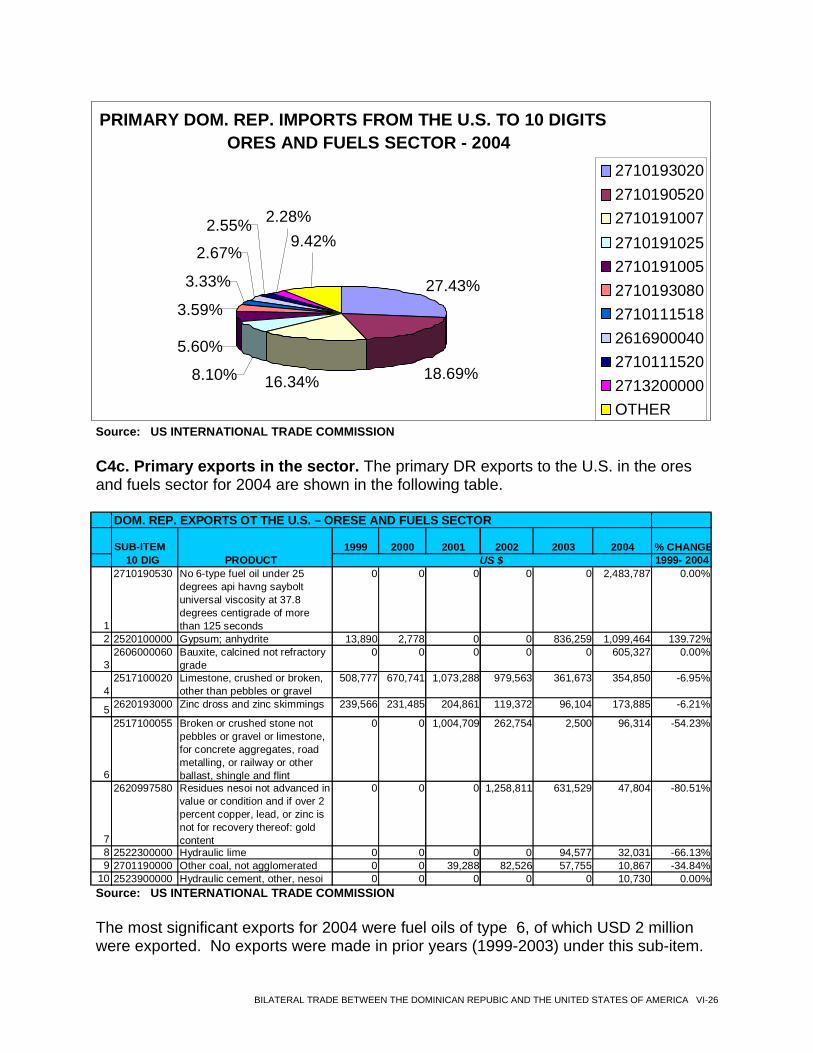
C4c. Primary exports in the sector. The primary DR exports to the U.S. in the ores and fuels sector for 2004 are shown in the following table.
DOM. REP. EXPORTS OT THE U.S. – ORESE AND FUELS SECTOR
1999 2000 2001 2002 2003 2004 % CHANGE1999- 2004
1
2710190530 No 6-type fuel oil under 25 degrees api havng saybolt universal viscosity at 37.8 degrees centigrade of more than 125 seconds
0 0 0 0 0 2,483,787 0.00%
2 2520100000 Gypsum; anhydrite 13,890 2,778 0 0 836,259 1,099,464 139.72%
3 2606000060 Bauxite, calcined not refractory
grade 0 0 0 0 0 605,327 0.00%
4 2517100020 Limestone, crushed or broken,
other than pebbles or gravel 508,777 670,741 1,073,288 979,563 361,673 354,850 -6.95%
5 2620193000 Zinc dross and zinc skimmings 239,566 231,485 204,861 119,372 96,104 173,885 -6.21%
6
2517100055 Broken or crushed stone not pebbles or gravel or limestone, for concrete aggregates, road metalling, or railway or other ballast, shingle and flint
0 0 1,004,709 262,754 2,500 96,314 -54.23%
7
2620997580 Residues nesoi not advanced in value or condition and if over 2 percent copper, lead, or zinc is not for recovery thereof: gold content
0 0 0 1,258,811 631,529 47,804 -80.51%
8 2522300000 Hydraulic lime 0 0 0 0 94,577 32,031 -66.13%9 2701190000 Other coal, not agglomerated 0 0 39,288 82,526 57,755 10,867 -34.84%
10 2523900000 Hydraulic cement, other, nesoi 0 0 0 0 0 10,730 0.00%
SUB-ITEM 10 DIG PRODUCT US $
Source: US INTERNATIONAL TRADE COMMISSION
The most significant exports for 2004 were fuel oils of type 6, of which USD 2 million were exported. No exports were made in prior years (1999-2003) under this sub-item.
BILATERAL TRADE BETWEEN THE DOMINICAN REPUBIC AND THE UNITED STATES OF AMERICA VI-26
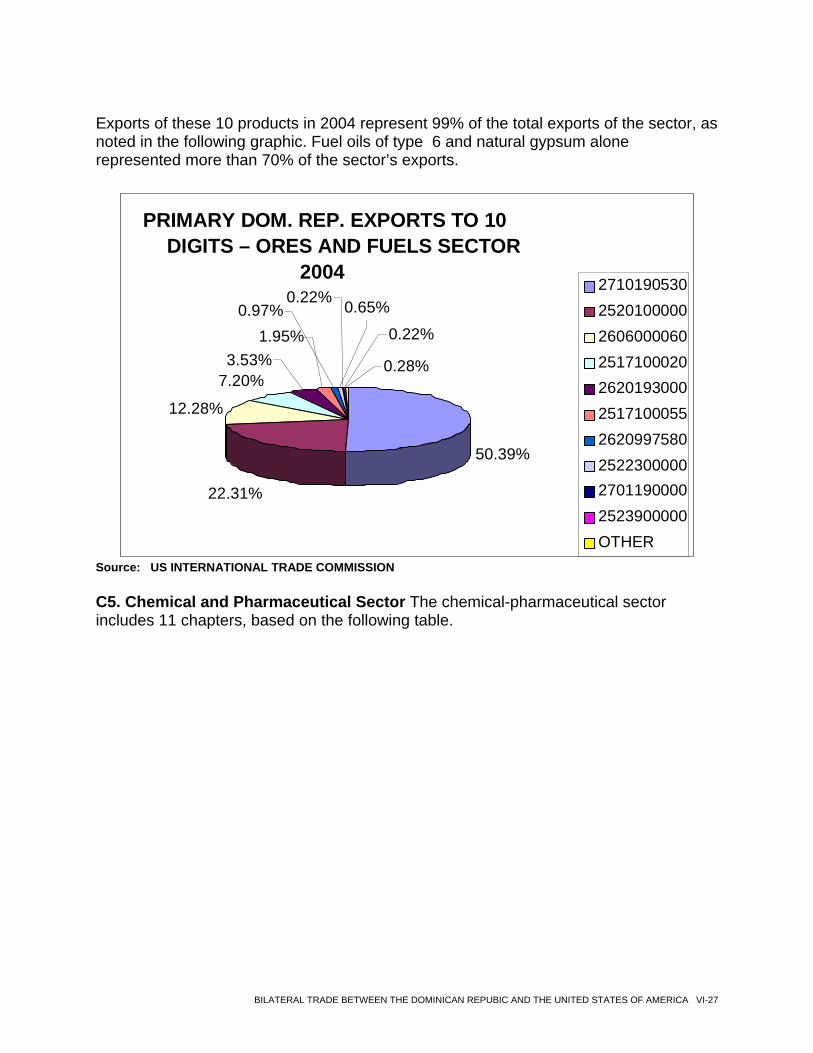
Exports of these 10 products in 2004 represent 99% of the total exports of the sector, as noted in the following graphic. Fuel oils of type 6 and natural gypsum alone represented more than 70% of the sector’s exports.
PRIMARY DOM. REP. EXPORTS TO 10
DIGITS – ORES AND FUELS SECTOR 2004
50.39%
22.31%
12.28%
7.20%
1.95%
0.22% 0.65%0.97%
3.53%
0.22%
0.28%
2710190530252010000026060000602517100020262019300025171000552620997580252230000027011900002523900000OTHER
Source: US INTERNATIONAL TRADE COMMISSION C5. Chemical and Pharmaceutical Sector The chemical-pharmaceutical sector includes 11 chapters, based on the following table.
BILATERAL TRADE BETWEEN THE DOMINICAN REPUBIC AND THE UNITED STATES OF AMERICA VI-27
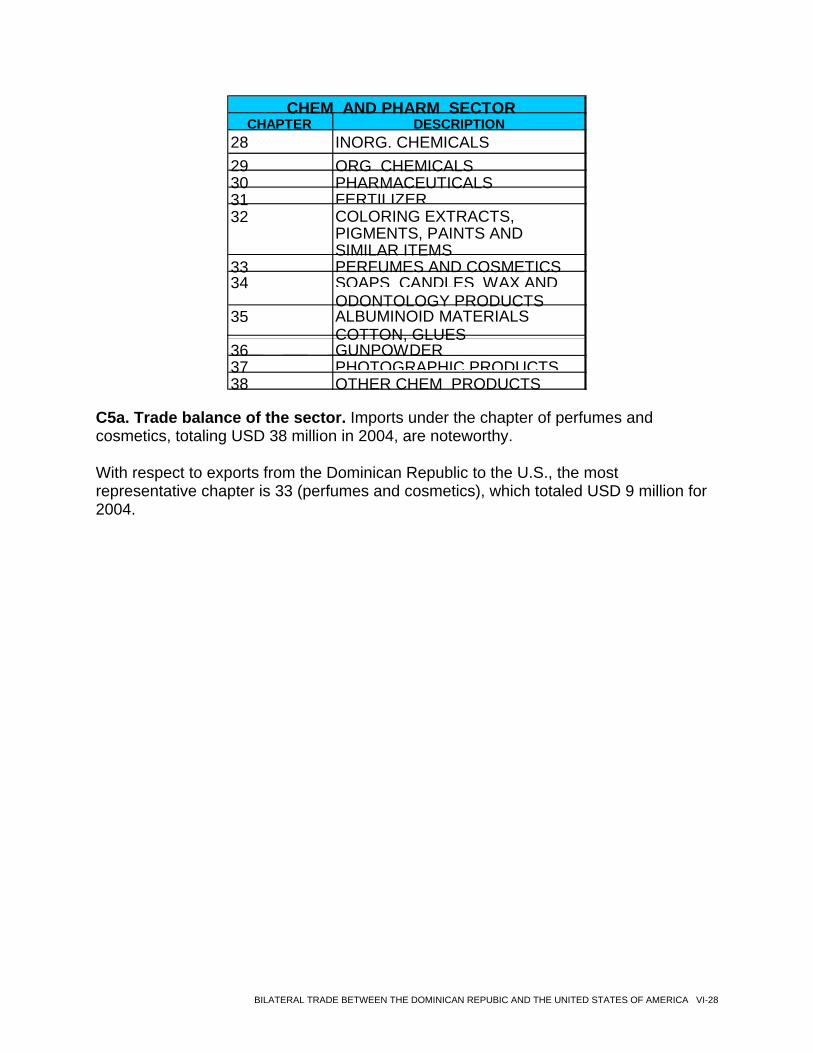
CHAPTER DESCRIPTION
28 INORG. CHEMICALS 29 ORG CHEMICALS 30 PHARMACEUTICALS 31 FERTILIZER32 COLORING EXTRACTS,
PIGMENTS, PAINTS AND SIMILAR ITEMS
33 PERFUMES AND COSMETICS34 SOAPS CANDLES WAX AND
ODONTOLOGY PRODUCTS 35 ALBUMINOID MATERIALS
COTTON, GLUES 36 GUNPOWDER37 PHOTOGRAPHIC PRODUCTS38 OTHER CHEM PRODUCTS
CHEM AND PHARM SECTOR
C5a. Trade balance of the sector. Imports under the chapter of perfumes and cosmetics, totaling USD 38 million in 2004, are noteworthy. With respect to exports from the Dominican Republic to the U.S., the most representative chapter is 33 (perfumes and cosmetics), which totaled USD 9 million for 2004.
BILATERAL TRADE BETWEEN THE DOMINICAN REPUBIC AND THE UNITED STATES OF AMERICA VI-28
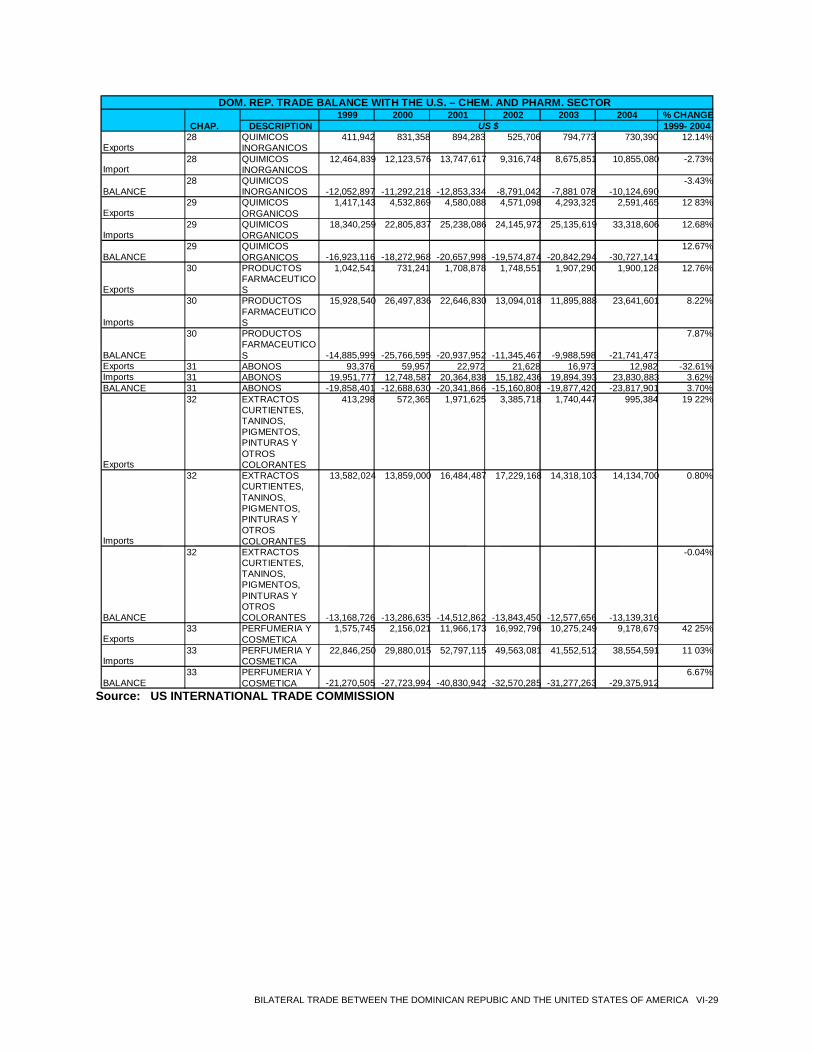
1999 2000 2001 2002 2003 2004 % CHANGE
DESCRIPTION 1999- 2004
Exports 28 QUIMICOS
INORGANICOS 411,942 831,358 894,283 525,706 794,773 730,390 12.14%
Import 28 QUIMICOS
INORGANICOS 12,464,839 12,123,576 13,747,617 9,316,748 8,675,851 10,855,080 -2.73%
BALANCE 28 QUIMICOS
INORGANICOS -12,052,897 -11,292,218 -12,853,334 -8,791,042 -7,881 078 -10,124,690-3.43%
Exports 29 QUIMICOS
ORGANICOS 1,417,143 4,532,869 4,580,088 4,571,098 4,293,325 2,591,465 12 83%
Imports 29 QUIMICOS
ORGANICOS 18,340,259 22,805,837 25,238,086 24,145,972 25,135,619 33,318,606 12.68%
BALANCE 29 QUIMICOS
ORGANICOS -16,923,116 -18,272,968 -20,657,998 -19,574,874 -20,842,294 -30,727,14112.67%
Exports 30 PRODUCTOS
FARMACEUTICO S
1,042,541 731,241 1,708,878 1,748,551 1,907,290 1,900,128 12.76%
Imports 30 PRODUCTOS
FARMACEUTICO S
15,928,540 26,497,836 22,646,830 13,094,018 11,895,888 23,641,601 8.22%
BALANCE 30 PRODUCTOS
FARMACEUTICO S -14,885,999 -25,766,595 -20,937,952 -11,345,467 -9,988,598 -21,741,473
7.87%
Exports 31 ABONOS 93,376 59,957 22,972 21,628 16,973 12,982 -32.61%Imports 31 ABONOS 19,951,777 12,748,587 20,364,838 15,182,436 19,894,393 23,830,883 3.62%BALANCE 31 ABONOS -19,858,401 -12,688,630 -20,341,866 -15,160,808 -19,877,420 -23,817,901 3.70%
Exports
32 EXTRACTOS CURTIENTES, TANINOS, PIGMENTOS, PINTURAS Y OTROS COLORANTES
413,298 572,365 1,971,625 3,385,718 1,740,447 995,384 19 22%
Imports
32 EXTRACTOS CURTIENTES, TANINOS, PIGMENTOS, PINTURAS Y OTROS COLORANTES
13,582,024 13,859,000 16,484,487 17,229,168 14,318,103 14,134,700 0.80%
BALANCE
32 EXTRACTOS CURTIENTES, TANINOS, PIGMENTOS, PINTURAS Y OTROS COLORANTES -13,168,726 -13,286,635 -14,512,862 -13,843,450 -12,577,656 -13,139,316
-0.04%
Exports 33 PERFUMERIA Y
COSMETICA 1,575,745 2,156,021 11,966,173 16,992,796 10,275,249 9,178,679 42 25%
Imports 33 PERFUMERIA Y
COSMETICA 22,846,250 29,880,015 52,797,115 49,563,081 41,552,512 38,554,591 11 03%
BALANCE 33 PERFUMERIA Y
COSMETICA -21,270,505 -27,723,994 -40,830,942 -32,570,285 -31,277,263 -29,375,9126.67%
DOM. REP. TRADE BALANCE WITH THE U.S. – CHEM. AND PHARM. SECTOR
CHAP. US $
Source: US INTERNATIONAL TRADE COMMISSION
BILATERAL TRADE BETWEEN THE DOMINICAN REPUBIC AND THE UNITED STATES OF AMERICA VI-29
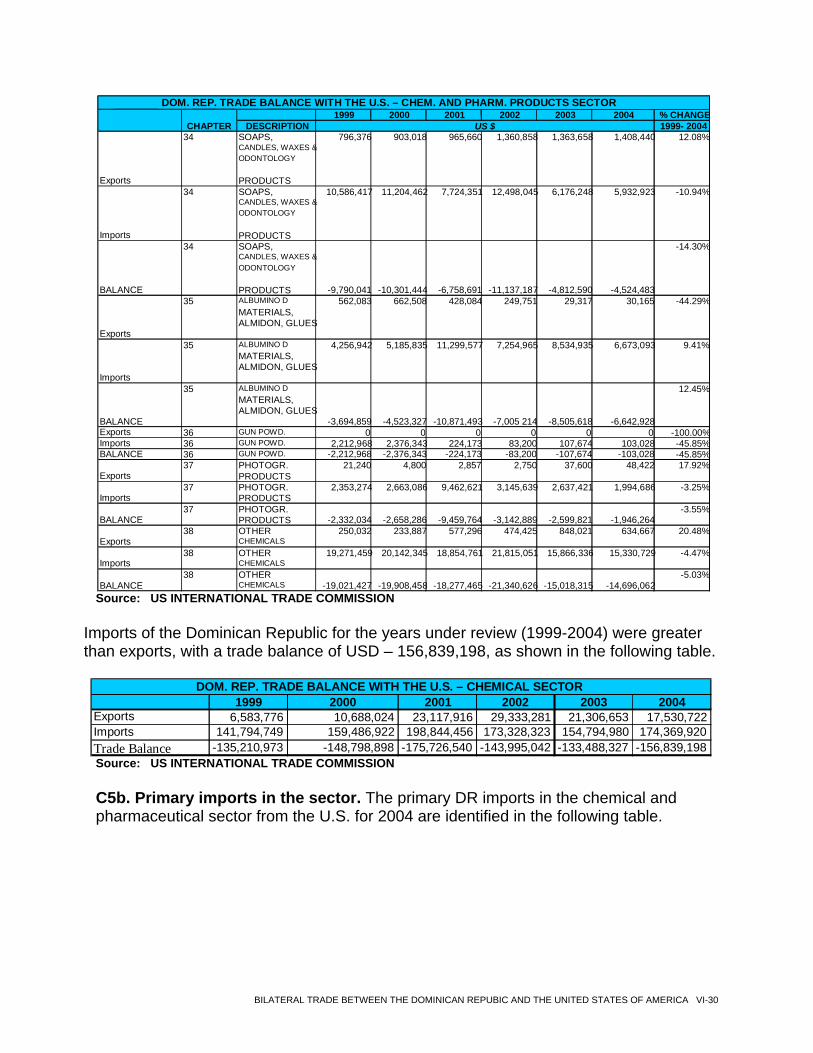
1999 2000 2001 2002 2003 2004 % CHANGE
DESCRIPTION 1999- 2004
Exports
34 SOAPS, CANDLES, WAXES & ODONTOLOGY PRODUCTS
796,376 903,018 965,660 1,360,858 1,363,658 1,408,440 12.08%
Imports
34 SOAPS, CANDLES, WAXES & ODONTOLOGY PRODUCTS
10,586,417 11,204,462 7,724,351 12,498,045 6,176,248 5,932,923 -10.94%
BALANCE
34 SOAPS, CANDLES, WAXES & ODONTOLOGY PRODUCTS -9,790,041 -10,301,444 -6,758,691 -11,137,187 -4,812,590 -4,524,483
-14.30%
Exports
35 ALBUMINO D MATERIALS, ALMIDON, GLUES
562,083 662,508 428,084 249,751 29,317 30,165 -44.29%
Imports
35 ALBUMINO D MATERIALS, ALMIDON, GLUES
4,256,942 5,185,835 11,299,577 7,254,965 8,534,935 6,673,093 9.41%
BALANCE
35 ALBUMINO D MATERIALS, ALMIDON, GLUES
-3,694,859 -4,523,327 -10,871,493 -7,005 214 -8,505,618 -6,642,928
12.45%
Exports 36 GUN POWD. 0 0 0 0 0 0 -100.00%Imports 36 GUN POWD. 2,212,968 2,376,343 224,173 83,200 107,674 103,028 -45.85%BALANCE 36 GUN POWD. -2,212,968 -2,376,343 -224,173 -83,200 -107,674 -103,028 -45.85%
Exports 37 PHOTOGR.
PRODUCTS 21,240 4,800 2,857 2,750 37,600 48,422 17.92%
Imports 37 PHOTOGR.
PRODUCTS 2,353,274 2,663,086 9,462,621 3,145,639 2,637,421 1,994,686 -3.25%
BALANCE 37 PHOTOGR.
PRODUCTS -2,332,034 -2,658,286 -9,459,764 -3,142,889 -2,599,821 -1,946,264-3.55%
Exports 38 OTHER
CHEMICALS 250,032 233,887 577,296 474,425 848,021 634,667 20.48%
Imports 38 OTHER
CHEMICALS 19,271,459 20,142,345 18,854,761 21,815,051 15,866,336 15,330,729 -4.47%
BALANCE 38 OTHER
CHEMICALS -19,021,427 -19,908,458 -18,277,465 -21,340,626 -15,018,315 -14,696,062-5.03%
DOM. REP. TRADE BALANCE WITH THE U.S. – CHEM. AND PHARM. PRODUCTS SECTOR CHAPTER US $
Source: US INTERNATIONAL TRADE COMMISSION
Imports of the Dominican Republic for the years under review (1999-2004) were greater than exports, with a trade balance of USD – 156,839,198, as shown in the following table.
1999 2000 2001 2002 2003 2004Exports 6,583,776 10,688,024 23,117,916 29,333,281 21,306,653 17,530,722Imports 141,794,749 159,486,922 198,844,456 173,328,323 154,794,980 174,369,920Trade Balance -135,210,973 -148,798,898 -175,726,540 -143,995,042 -133,488,327 -156,839,198
DOM. REP. TRADE BALANCE WITH THE U.S. – CHEMICAL SECTOR
Source: US INTERNATIONAL TRADE COMMISSION
C5b. Primary imports in the sector. The primary DR imports in the chemical and pharmaceutical sector from the U.S. for 2004 are identified in the following table.
BILATERAL TRADE BETWEEN THE DOMINICAN REPUBIC AND THE UNITED STATES OF AMERICA VI-30
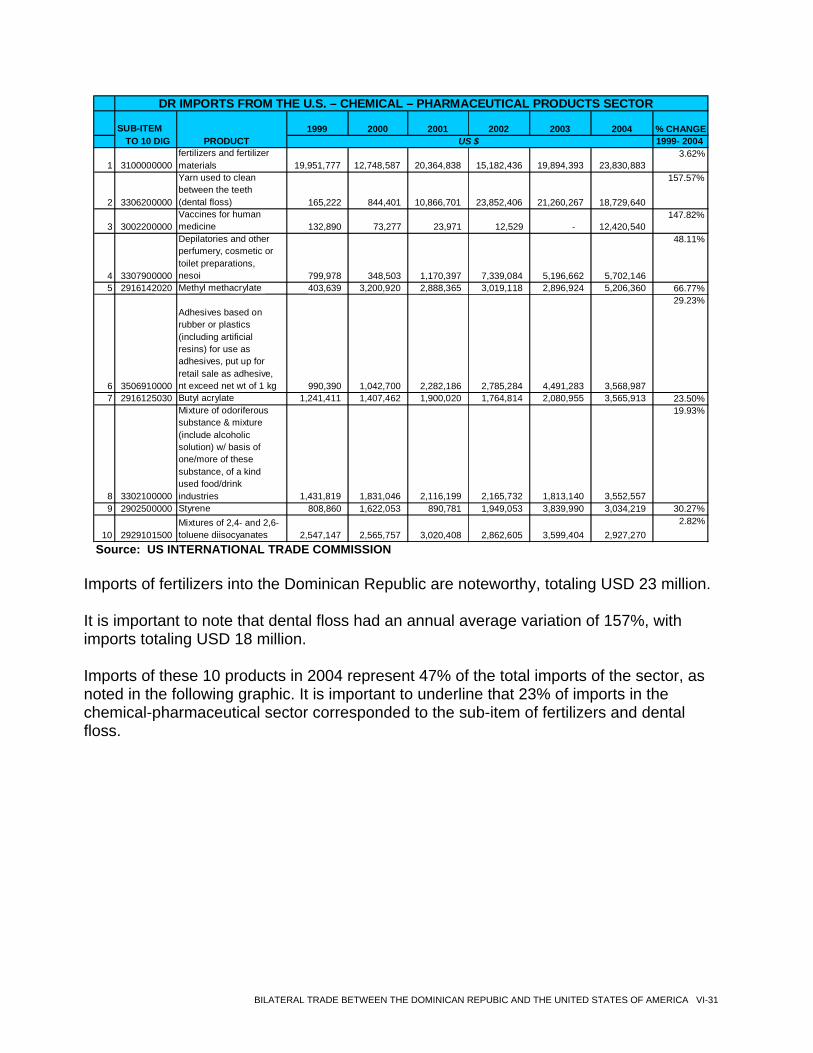
1999 2000 2001 2002 2003 2004 % CHANGE
1999- 2004
1 3100000000 fertilizers and fertilizer materials 19,951,777 12,748,587 20,364,838 15,182,436 19,894,393 23,830,883
3.62%
2 3306200000 Yarn used to clean between the teeth (dental floss) 165,222 844,401 10,866,701 23,852,406 21,260,267 18,729,640
157.57%
3 3002200000 Vaccines for human medicine 132,890 73,277 23,971 12,529 - 12,420,540
147.82%
4 3307900000
Depilatories and other perfumery, cosmetic or toilet preparations, nesoi 799,978 348,503 1,170,397 7,339,084 5,196,662 5,702,146
48.11%
5 2916142020 Methyl methacrylate 403,639 3,200,920 2,888,365 3,019,118 2,896,924 5,206,360 66.77%
6 3506910000
Adhesives based on rubber or plastics (including artificial resins) for use as adhesives, put up for retail sale as adhesive, nt exceed net wt of 1 kg 990,390 1,042,700 2,282,186 2,785,284 4,491,283 3,568,987
29.23%
7 2916125030 Butyl acrylate 1,241,411 1,407,462 1,900,020 1,764,814 2,080,955 3,565,913 23.50%
8 3302100000
Mixture of odoriferous substance & mixture (include alcoholic solution) w/ basis of one/more of these substance, of a kind used food/drink industries 1,431,819 1,831,046 2,116,199 2,165,732 1,813,140 3,552,557
19.93%
9 2902500000 Styrene 808,860 1,622,053 890,781 1,949,053 3,839,990 3,034,219 30.27%
10 2929101500 Mixtures of 2,4- and 2,6- toluene diisocyanates 2,547,147 2,565,757 3,020,408 2,862,605 3,599,404 2,927,270
2.82%
DR IMPORTS FROM THE U.S. – CHEMICAL – PHARMACEUTICAL PRODUCTS SECTOR SUB-ITEM
TO 10 DIG PRODUCT US $
Source: US INTERNATIONAL TRADE COMMISSION
Imports of fertilizers into the Dominican Republic are noteworthy, totaling USD 23 million. It is important to note that dental floss had an annual average variation of 157%, with imports totaling USD 18 million. Imports of these 10 products in 2004 represent 47% of the total imports of the sector, as noted in the following graphic. It is important to underline that 23% of imports in the chemical-pharmaceutical sector corresponded to the sub-item of fertilizers and dental floss.
BILATERAL TRADE BETWEEN THE DOMINICAN REPUBIC AND THE UNITED STATES OF AMERICA VI-31

[TITLE: PRIMARY DOM. REP. IMPORTS TO 10 DIGITS, CHEMICAL AND PHARMACEUTICAL SECTOR – 2004]
P R I N C I P A L E S I M P O R T AC I O N E S D E R E P D O M A 1 0
D I G I T O S S E C T O R Q U I M I C O Y F AR M AC E U T I C O AÑ O 20 0 4
13.67%10.74%
5 2 . 6 6 %
2.05%
3.27%2.99%
7.12%
2.05%2.04%1.74%1.68%
310 0 0 0 0 0 0 0 330 6 2 0 0 0 0 0 300 2 2 0 0 0 0 0 330 7 9 0 0 0 0 0 291 6 1 4 2 0 2 0 350 6 9 1 0 0 0 0 291 6 1 2 5 0 3 0 330 2 1 0 0 0 0 0 290 2 5 0 0 0 0 0 292 9 1 0 1 5 0 0 OTHER
Source: US INTERNATIONAL TRADE COMMISSION
C5c. Primary exports in the sector. The primary DR exports to the U.S. in the chemical-pharmaceutical sector for 2004 are shown in the following table.
BILATERAL TRADE BETWEEN THE DOMINICAN REPUBIC AND THE UNITED STATES OF AMERICA VI-32
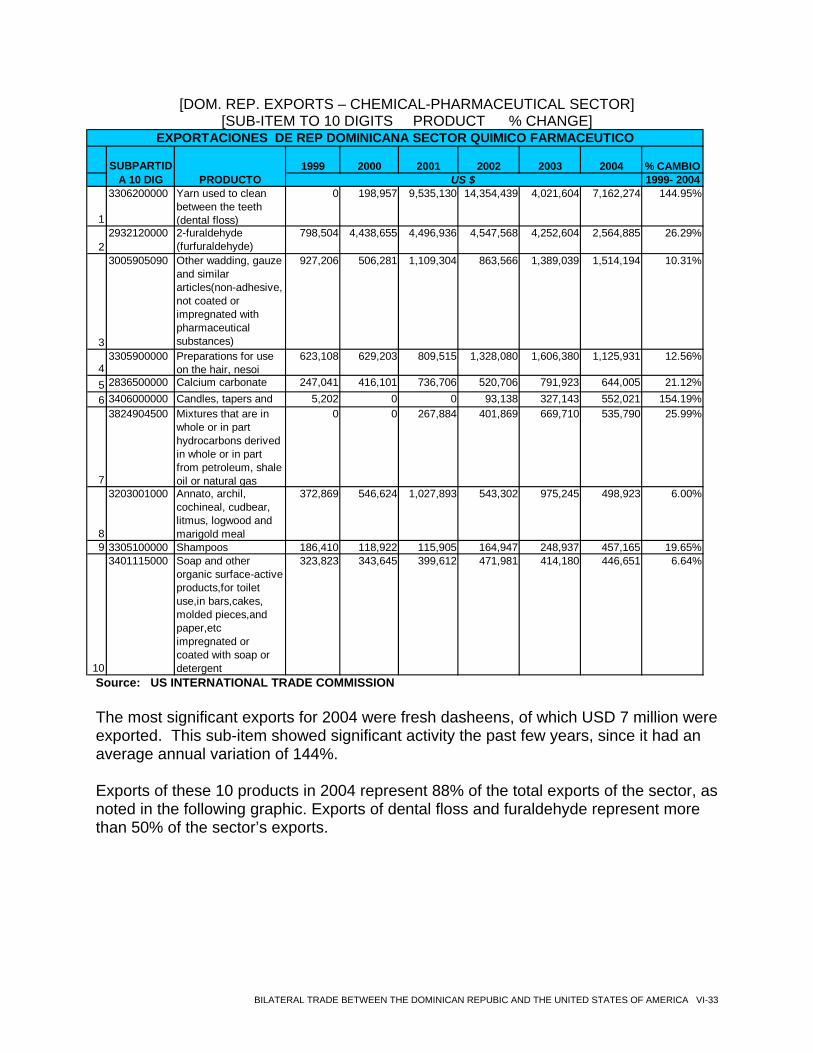
[DOM. REP. EXPORTS – CHEMICAL-PHARMACEUTICAL SECTOR] [SUB-ITEM TO 10 DIGITS PRODUCT % CHANGE]
1999 2000 2001 2002 2003 2004 % CAMBIO1999- 2004
1
3306200000 Yarn used to clean between the teeth (dental floss)
0 198,957 9,535,130 14,354,439 4,021,604 7,162,274 144.95%
22932120000 2-furaldehyde
(furfuraldehyde)798,504 4,438,655 4,496,936 4,547,568 4,252,604 2,564,885 26.29%
3
3005905090 Other wadding, gauze and similar articles(non-adhesive, not coated or impregnated with pharmaceutical substances)
927,206 506,281 1,109,304 863,566 1,389,039 1,514,194 10.31%
43305900000 Preparations for use
on the hair, nesoi623,108 629,203 809,515 1,328,080 1,606,380 1,125,931 12.56%
5 2836500000 Calcium carbonate 247,041 416,101 736,706 520,706 791,923 644,005 21.12%6 3406000000 Candles, tapers and 5,202 0 0 93,138 327,143 552,021 154.19%
7
3824904500 Mixtures that are in whole or in part hydrocarbons derived in whole or in part from petroleum, shale oil or natural gas
0 0 267,884 401,869 669,710 535,790 25.99%
8
3203001000 Annato, archil, cochineal, cudbear, litmus, logwood and marigold meal
372,869 546,624 1,027,893 543,302 975,245 498,923 6.00%
9 3305100000 Shampoos 186,410 118,922 115,905 164,947 248,937 457,165 19.65%
10
3401115000 Soap and other organic surface-active products,for toilet use,in bars,cakes, molded pieces,and paper,etc impregnated or coated with soap or detergent
323,823 343,645 399,612 471,981 414,180 446,651 6.64%
SUBPARTIDA 10 DIG PRODUCTO US $
EXPORTACIONES DE REP DOMINICANA SECTOR QUIMICO FARMACEUTICO
Source: US INTERNATIONAL TRADE COMMISSION The most significant exports for 2004 were fresh dasheens, of which USD 7 million were exported. This sub-item showed significant activity the past few years, since it had an average annual variation of 144%. Exports of these 10 products in 2004 represent 88% of the total exports of the sector, as noted in the following graphic. Exports of dental floss and furaldehyde represent more than 50% of the sector’s exports.
BILATERAL TRADE BETWEEN THE DOMINICAN REPUBIC AND THE UNITED STATES OF AMERICA VI-33
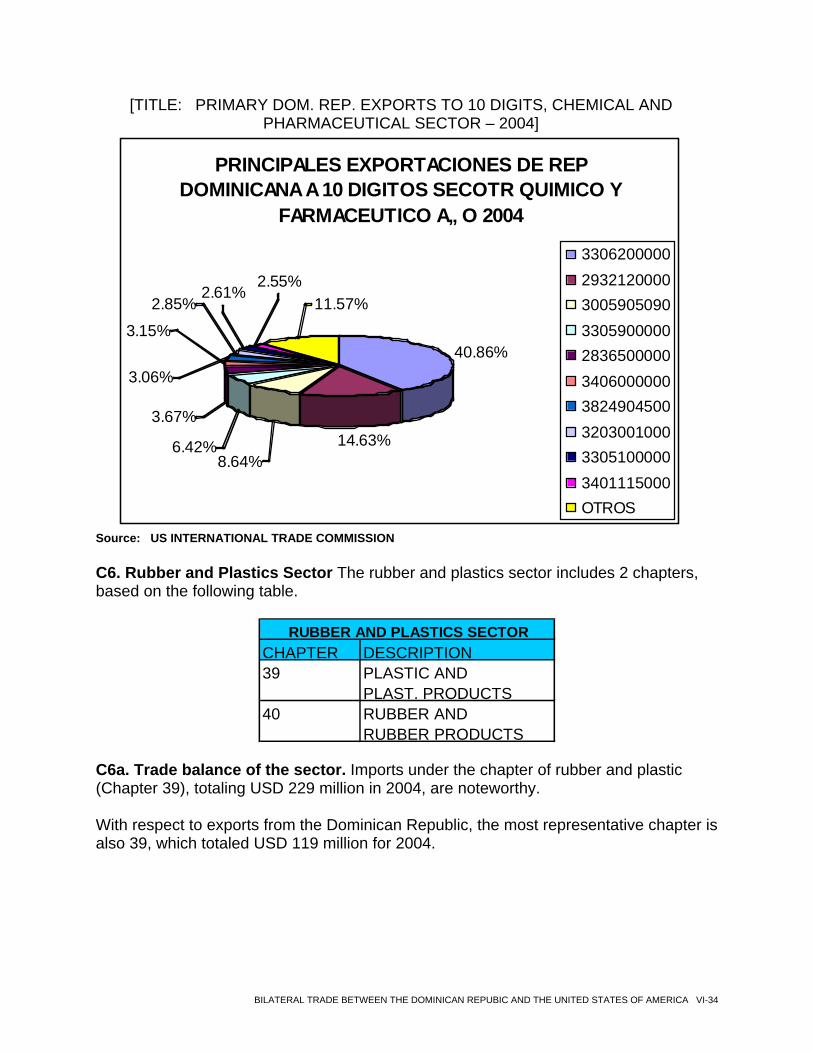
[TITLE: PRIMARY DOM. REP. EXPORTS TO 10 DIGITS, CHEMICAL AND PHARMACEUTICAL SECTOR – 2004]
P R I N C I P A L E S E X P O R T A C I O N E S D E R E P
D O M I N I C A N A A 1 0 D I G I T O S S E C O T R Q U I M I C O Y F A R M A C E U T I C O A „ O 2 0 0 4
4 0 . 8 6 %
1 4 . 6 3 %
1 1 . 5 7 % 2 . 5 5 %
2 . 6 1 % 2 . 8 5 %
3 . 0 6 %
8 . 6 4 %
3 . 6 7 %
6 . 4 2 %
3 . 1 5 %
3 3 0 6 2 0 0 0 0 0 2 9 3 2 1 2 0 0 0 0 3 0 0 5 9 0 5 0 9 0 3 3 0 5 9 0 0 0 0 0 2 8 3 6 5 0 0 0 0 0 3 4 0 6 0 0 0 0 0 0 3 8 2 4 9 0 4 5 0 0 3 2 0 3 0 0 1 0 0 0 3 3 0 5 1 0 0 0 0 0 3 4 0 1 1 1 5 0 0 0 O T R O S
Source: US INTERNATIONAL TRADE COMMISSION C6. Rubber and Plastics Sector The rubber and plastics sector includes 2 chapters, based on the following table.
CHAPTER DESCRIPTION39 PLASTIC AND
PLAST. PRODUCTS 40 RUBBER AND
RUBBER PRODUCTS
RUBBER AND PLASTICS SECTOR
C6a. Trade balance of the sector. Imports under the chapter of rubber and plastic (Chapter 39), totaling USD 229 million in 2004, are noteworthy. With respect to exports from the Dominican Republic, the most representative chapter is also 39, which totaled USD 119 million for 2004.
BILATERAL TRADE BETWEEN THE DOMINICAN REPUBIC AND THE UNITED STATES OF AMERICA VI-34
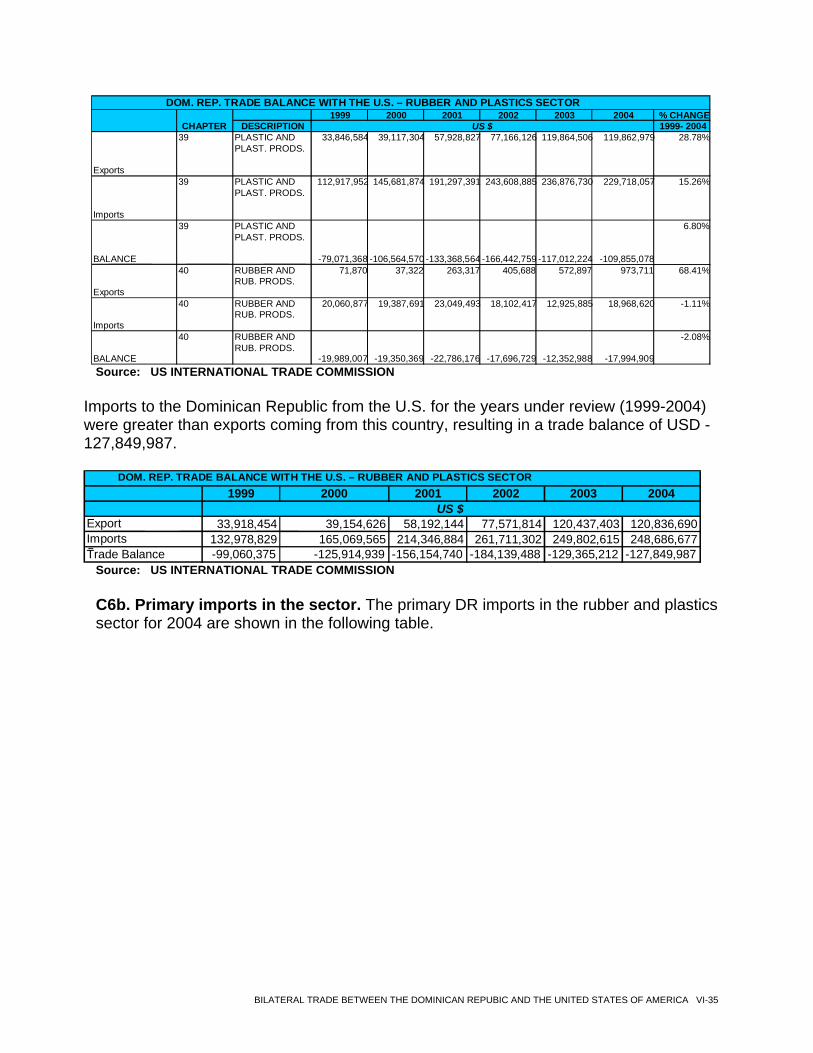
1999 2000 2001 2002 2003 2004 % CHANGE
DESCRIPTION 1999- 2004
Exports
39 PLASTIC AND PLAST. PRODS.
33,846,584 39,117,304 57,928,827 77,166,126 119,864,506 119,862,979 28.78%
Imports
39 PLASTIC AND PLAST. PRODS.
112,917,952 145,681,874 191,297,391 243,608,885 236,876,730 229,718,057 15.26%
BALANCE
39 PLASTIC AND PLAST. PRODS.
-79,071,368 -106,564,570 -133,368,564 -166,442,759 -117,012,224 -109,855,078
6.80%
Exports 40 RUBBER AND
RUB. PRODS. 71,870 37,322 263,317 405,688 572,897 973,711 68.41%
Imports 40 RUBBER AND
RUB. PRODS. 20,060,877 19,387,691 23,049,493 18,102,417 12,925,885 18,968,620 -1.11%
BALANCE 40 RUBBER AND
RUB. PRODS. -19,989,007 -19,350,369 -22,786,176 -17,696,729 -12,352,988 -17,994,909
-2.08%
DOM. REP. TRADE BALANCE WITH THE U.S. – RUBBER AND PLASTICS SECTOR CHAPTER US $
Source: US INTERNATIONAL TRADE COMMISSION
Imports to the Dominican Republic from the U.S. for the years under review (1999-2004) were greater than exports coming from this country, resulting in a trade balance of USD -127,849,987.
1999 2000 2001 2002 2003 2004
Export 33,918,454 39,154,626 58,192,144 77,571,814 120,437,403 120,836,690Imports S
132,978,829 165,069,565 214,346,884 261,711,302 249,802,615 248,686,677Trade Balance -99,060,375 -125,914,939 -156,154,740 -184,139,488 -129,365,212 -127,849,987
DOM. REP. TRADE BALANCE WITH THE U.S. – RUBBER AND PLASTICS SECTOR
US $
Source: US INTERNATIONAL TRADE COMMISSION
C6b. Primary imports in the sector. The primary DR imports in the rubber and plastics sector for 2004 are shown in the following table.
BILATERAL TRADE BETWEEN THE DOMINICAN REPUBIC AND THE UNITED STATES OF AMERICA VI-35
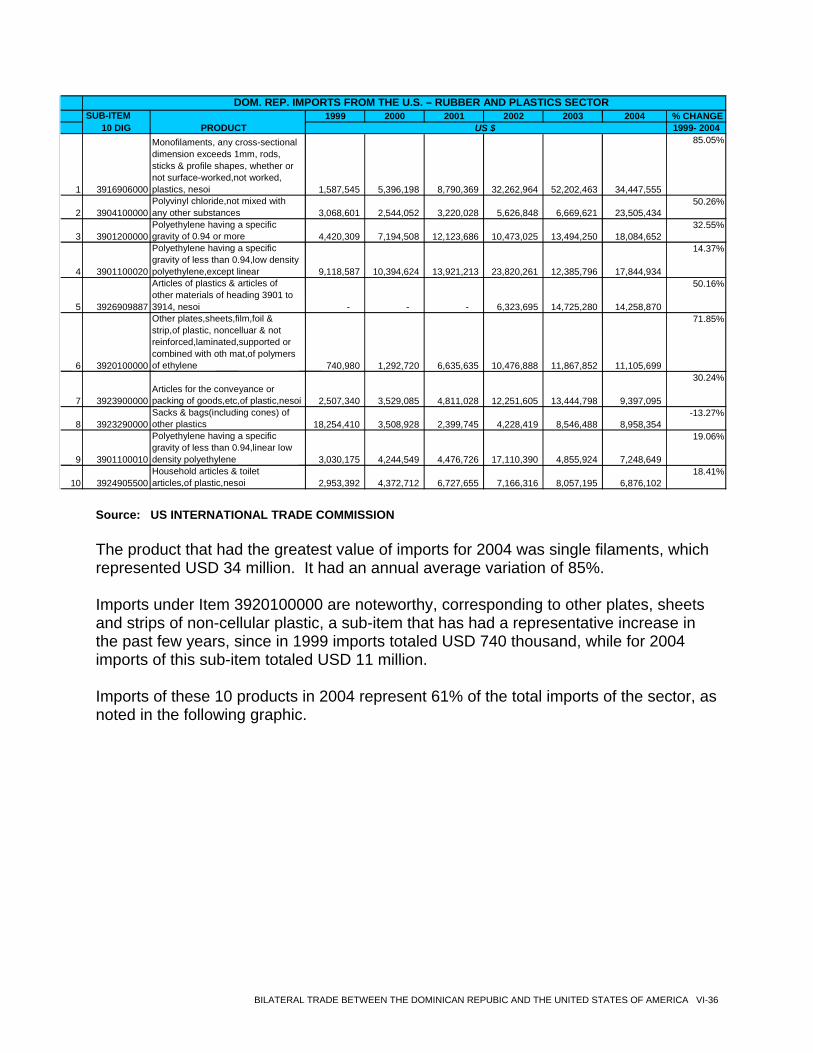
1999 2000 2001 2002 2003 2004 % CHANGE
1999- 2004
1 3916906000
Monofilaments, any cross-sectional dimension exceeds 1mm, rods, sticks & profile shapes, whether or not surface-worked,not worked, plastics, nesoi 1,587,545 5,396,198 8,790,369 32,262,964 52,202,463 34,447,555
85.05%
2 3904100000 Polyvinyl chloride,not mixed with any other substances 3,068,601 2,544,052 3,220,028 5,626,848 6,669,621 23,505,434
50.26%
3 3901200000 Polyethylene having a specific gravity of 0.94 or more 4,420,309 7,194,508 12,123,686 10,473,025 13,494,250 18,084,652
32.55%
4 3901100020 Polyethylene having a specific gravity of less than 0.94,low density polyethylene,except linear 9,118,587 10,394,624 13,921,213 23,820,261 12,385,796 17,844,934
14.37%
5 3926909887 Articles of plastics & articles of other materials of heading 3901 to 3914, nesoi - - - 6,323,695 14,725,280 14,258,870
50.16%
6 3920100000
Other plates,sheets,film,foil & strip,of plastic, noncelluar & not reinforced,laminated,supported or combined with oth mat,of polymers of ethylene 740,980 1,292,720 6,635,635 10,476,888 11,867,852 11,105,699
71.85%
7 3923900000 Articles for the conveyance or packing of goods,etc,of plastic,nesoi 2,507,340 3,529,085 4,811,028 12,251,605 13,444,798 9,397,095
30.24%
8 3923290000 Sacks & bags(including cones) of other plastics 18,254,410 3,508,928 2,399,745 4,228,419 8,546,488 8,958,354
-13.27%
9 3901100010 Polyethylene having a specific gravity of less than 0.94,linear low density polyethylene 3,030,175 4,244,549 4,476,726 17,110,390 4,855,924 7,248,649
19.06%
10 3924905500 Household articles & toilet articles,of plastic,nesoi 2,953,392 4,372,712 6,727,655 7,166,316 8,057,195 6,876,102
18.41%
DOM. REP. IMPORTS FROM THE U.S. – RUBBER AND PLASTICS SECTOR SUB-ITEM
10 DIG PRODUCT US $
Source: US INTERNATIONAL TRADE COMMISSION The product that had the greatest value of imports for 2004 was single filaments, which represented USD 34 million. It had an annual average variation of 85%. Imports under Item 3920100000 are noteworthy, corresponding to other plates, sheets and strips of non-cellular plastic, a sub-item that has had a representative increase in the past few years, since in 1999 imports totaled USD 740 thousand, while for 2004 imports of this sub-item totaled USD 11 million. Imports of these 10 products in 2004 represent 61% of the total imports of the sector, as noted in the following graphic.
BILATERAL TRADE BETWEEN THE DOMINICAN REPUBIC AND THE UNITED STATES OF AMERICA VI-36
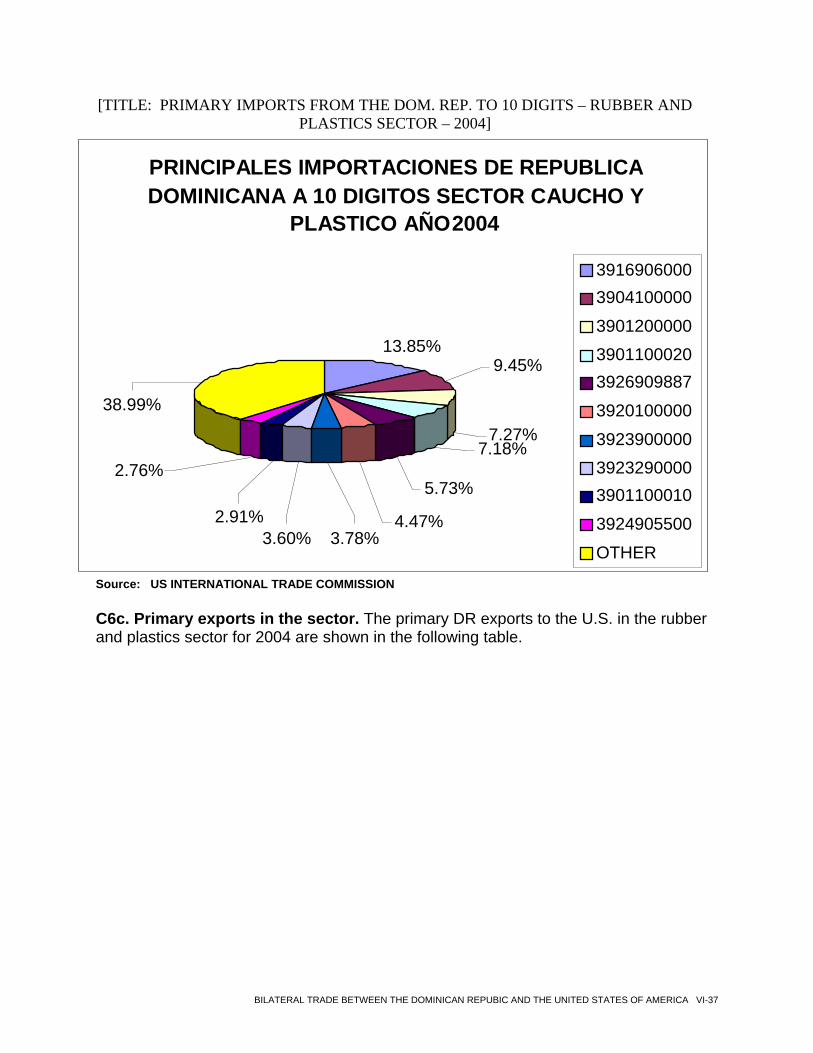
[TITLE: PRIMARY IMPORTS FROM THE DOM. REP. TO 10 DIGITS – RUBBER AND PLASTICS SECTOR – 2004]
PRINCIPALES IMPORTACIONES DE REPUBLICA DOMINICANA A 10 DIGITOS SECTOR CAUCHO Y
PLASTICO AÑO 2004
13.85%
4.47%
7.18%
5.73%
7.27%
3.78%3.60% 2.91%
2.76%
38.99%
9.45%
39169060003904100000
390120000039011000203926909887
3920100000
392390000039232900003901100010
3924905500
OTHER
Source: US INTERNATIONAL TRADE COMMISSION
C6c. Primary exports in the sector. The primary DR exports to the U.S. in the rubber and plastics sector for 2004 are shown in the following table.
BILATERAL TRADE BETWEEN THE DOMINICAN REPUBIC AND THE UNITED STATES OF AMERICA VI-37
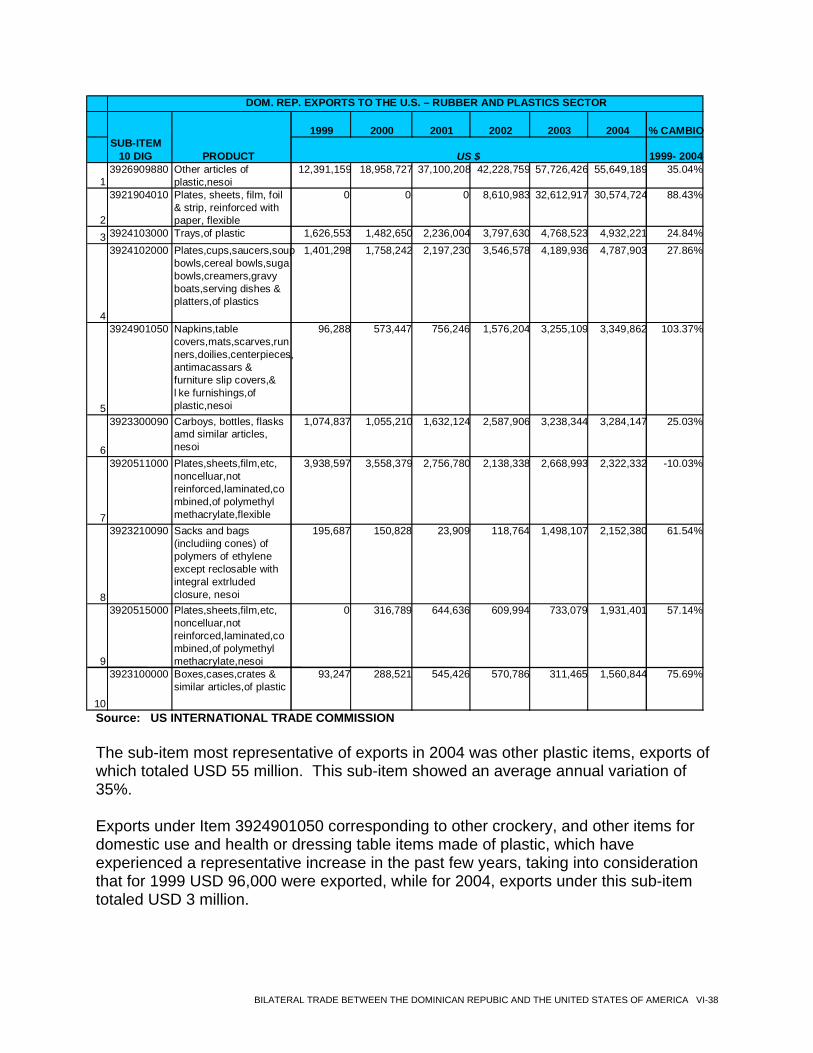
1999 2000 2001 2002 2003 2004 % CAMBIO
1999- 2004
1 3926909880 Other articles of
plastic,nesoi 12,391,159 18,958,727 37,100,208 42,228,759 57,726,426 55,649,189 35.04%
2 3921904010 Plates, sheets, film, foil
& strip, reinforced with paper, flexible
0 0 0 8,610,983 32,612,917 30,574,724 88.43%
3 3924103000 Trays,of plastic 1,626,553 1,482,650 2,236,004 3,797,630 4,768,523 4,932,221 24.84%
4
3924102000 Plates,cups,saucers,soup bowls,cereal bowls,suga bowls,creamers,gravy boats,serving dishes & platters,of plastics
1,401,298 1,758,242 2,197,230 3,546,578 4,189,936 4,787,903 27.86%
5
3924901050 Napkins,table covers,mats,scarves,run ners,doilies,centerpieces, antimacassars & furniture slip covers,& l ke furnishings,of plastic,nesoi
96,288 573,447 756,246 1,576,204 3,255,109 3,349,862 103.37%
6
3923300090 Carboys, bottles, flasks amd similar articles, nesoi
1,074,837 1,055,210 1,632,124 2,587,906 3,238,344 3,284,147 25.03%
7
3920511000 Plates,sheets,film,etc, noncelluar,not reinforced,laminated,co mbined,of polymethyl methacrylate,flexible
3,938,597 3,558,379 2,756,780 2,138,338 2,668,993 2,322,332 -10.03%
8
3923210090 Sacks and bags (includiing cones) of polymers of ethylene except reclosable with integral extrluded closure, nesoi
195,687 150,828 23,909 118,764 1,498,107 2,152,380 61.54%
9
3920515000 Plates,sheets,film,etc, noncelluar,not reinforced,laminated,co mbined,of polymethyl methacrylate,nesoi
0 316,789 644,636 609,994 733,079 1,931,401 57.14%
10
3923100000 Boxes,cases,crates & similar articles,of plastic
93,247 288,521 545,426 570,786 311,465 1,560,844 75.69%
DOM. REP. EXPORTS TO THE U.S. – RUBBER AND PLASTICS SECTOR
SUB-ITEM 10 DIG PRODUCT US $
Source: US INTERNATIONAL TRADE COMMISSION
The sub-item most representative of exports in 2004 was other plastic items, exports of which totaled USD 55 million. This sub-item showed an average annual variation of 35%. Exports under Item 3924901050 corresponding to other crockery, and other items for domestic use and health or dressing table items made of plastic, which have experienced a representative increase in the past few years, taking into consideration that for 1999 USD 96,000 were exported, while for 2004, exports under this sub-item totaled USD 3 million.
BILATERAL TRADE BETWEEN THE DOMINICAN REPUBIC AND THE UNITED STATES OF AMERICA VI-38
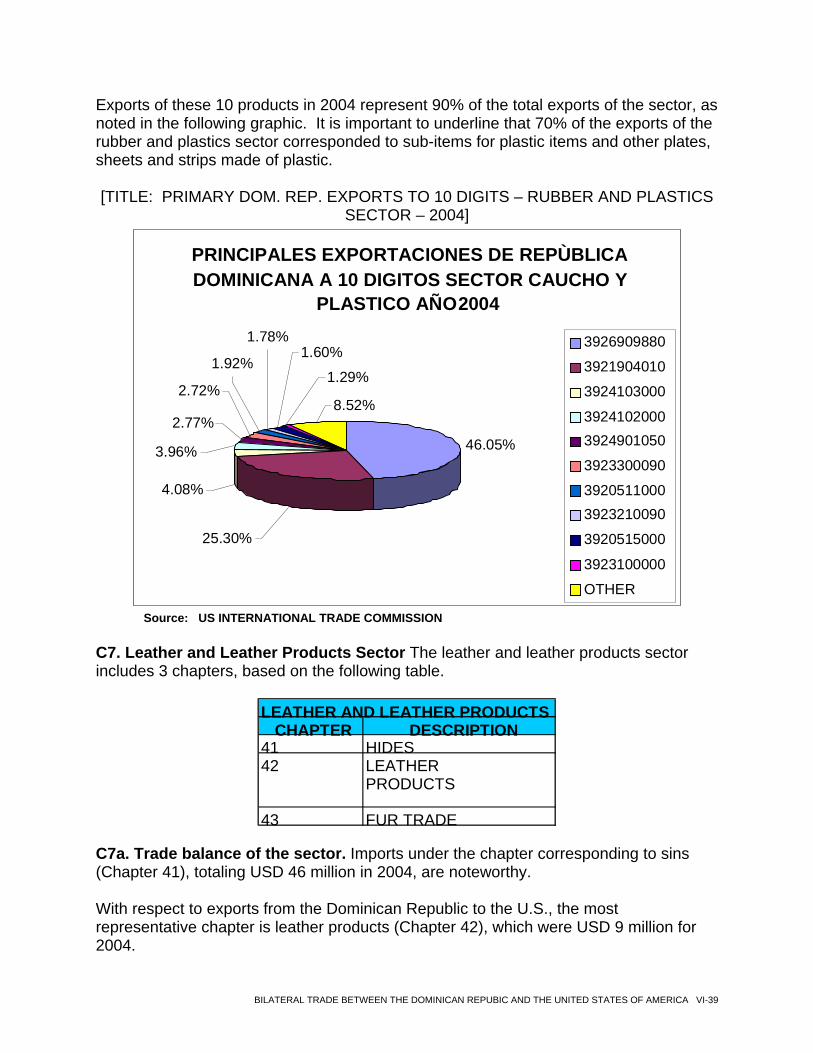
Exports of these 10 products in 2004 represent 90% of the total exports of the sector, as noted in the following graphic. It is important to underline that 70% of the exports of the rubber and plastics sector corresponded to sub-items for plastic items and other plates, sheets and strips made of plastic. [TITLE: PRIMARY DOM. REP. EXPORTS TO 10 DIGITS – RUBBER AND PLASTICS
SECTOR – 2004]
PRINCIPALES EXPORTACIONES DE REPÙBLICA DOMINICANA A 10 DIGITOS SECTOR CAUCHO Y
PLASTICO AÑO 2004
46.05%
25.30%
8.52%
1.29%
1.60%1.78%
1.92%
4.08%
2.77%
3.96%
2.72%
3926909880
3921904010
3924103000
39241020003924901050
3923300090
39205110003923210090
3920515000
3923100000
OTHER
Source: US INTERNATIONAL TRADE COMMISSION
C7. Leather and Leather Products Sector The leather and leather products sector includes 3 chapters, based on the following table.
LEATHER AND LEATHER PRODUCTS CHAPTER DESCRIPTION
41 HIDES 42 LEATHER
PRODUCTS
43 FUR TRADE C7a. Trade balance of the sector. Imports under the chapter corresponding to sins (Chapter 41), totaling USD 46 million in 2004, are noteworthy. With respect to exports from the Dominican Republic to the U.S., the most representative chapter is leather products (Chapter 42), which were USD 9 million for 2004.
BILATERAL TRADE BETWEEN THE DOMINICAN REPUBIC AND THE UNITED STATES OF AMERICA VI-39
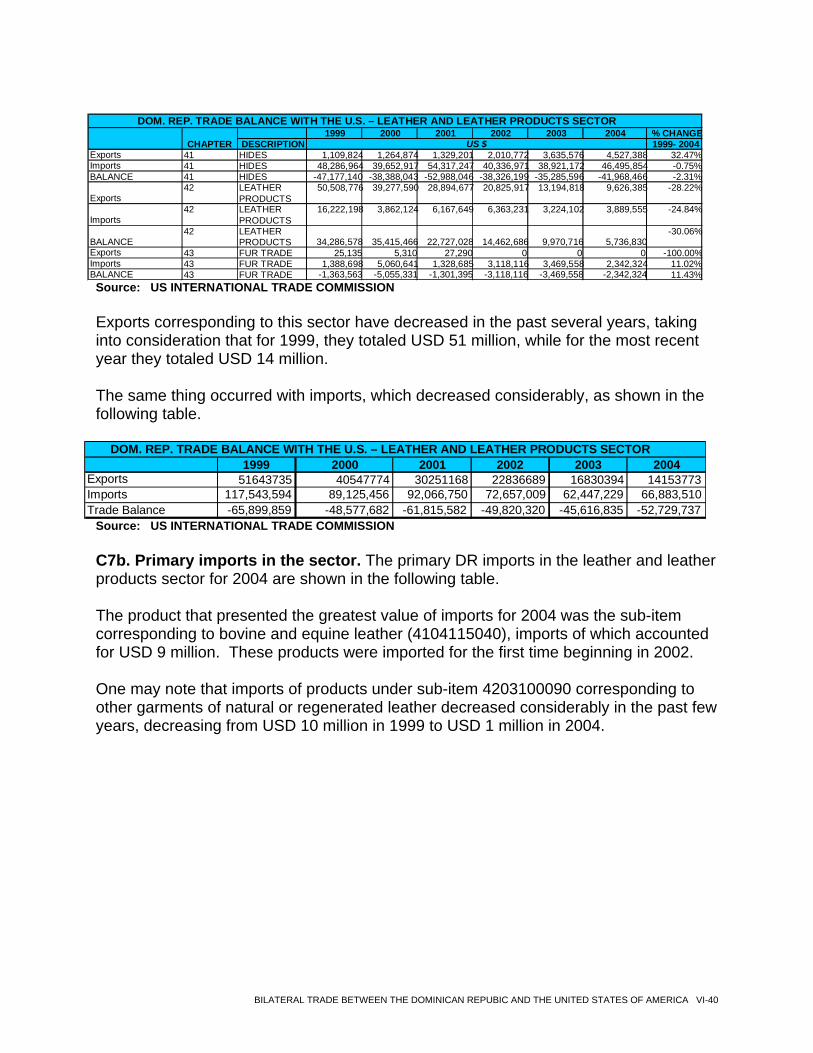
1999 2000 2001 2002 2003 2004 % CHANGEDESCRIPTION 1999- 2004
Exports 41 HIDES 1,109,824 1,264,874 1,329,201 2,010,772 3,635,576 4,527,388 32.47%Imports 41 HIDES 48,286,964 39,652,917 54,317,247 40,336,971 38,921,172 46,495,854 -0.75%BALANCE 41 HIDES -47,177,140 -38,388,043 -52,988,046 -38,326,199 -35,285,596 -41,968,466 -2.31%
Exports 42 LEATHER
PRODUCTS 50,508,776 39,277,590 28,894,677 20,825,917 13,194,818 9,626,385 -28.22%
Imports 42 LEATHER
PRODUCTS 16,222,198 3,862,124 6,167,649 6,363,231 3,224,102 3,889,555 -24.84%
BALANCE 42 LEATHER
PRODUCTS 34,286,578 35,415,466 22,727,028 14,462,686 9,970,716 5,736,830 -30.06%
Exports 43 FUR TRADE 25,135 5,310 27,290 0 0 0 -100.00%Imports 43 FUR TRADE 1,388,698 5,060,641 1,328,685 3,118,116 3,469,558 2,342,324 11.02%BALANCE 43 FUR TRADE -1,363,563 -5,055,331 -1,301,395 -3,118,116 -3,469,558 -2,342,324 11.43%
DOM. REP. TRADE BALANCE WITH THE U.S. – LEATHER AND LEATHER PRODUCTS SECTOR CHAPTER US $
Source: US INTERNATIONAL TRADE COMMISSION Exports corresponding to this sector have decreased in the past several years, taking into consideration that for 1999, they totaled USD 51 million, while for the most recent year they totaled USD 14 million. The same thing occurred with imports, which decreased considerably, as shown in the following table.
DOM. REP. TRADE BALANCE WITH THE U.S. – LEATHER AND LEATHER PRODUCTS SECTOR
1999 2000 2001 2002 2003 2004Exports 51643735 40547774 30251168 22836689 16830394 14153773Imports 117,543,594 89,125,456 92,066,750 72,657,009 62,447,229 66,883,510Trade Balance -65,899,859 -48,577,682 -61,815,582 -49,820,320 -45,616,835 -52,729,737
Source: US INTERNATIONAL TRADE COMMISSION
C7b. Primary imports in the sector. The primary DR imports in the leather and leather products sector for 2004 are shown in the following table. The product that presented the greatest value of imports for 2004 was the sub-item corresponding to bovine and equine leather (4104115040), imports of which accounted for USD 9 million. These products were imported for the first time beginning in 2002. One may note that imports of products under sub-item 4203100090 corresponding to other garments of natural or regenerated leather decreased considerably in the past few years, decreasing from USD 10 million in 1999 to USD 1 million in 2004.
BILATERAL TRADE BETWEEN THE DOMINICAN REPUBIC AND THE UNITED STATES OF AMERICA VI-40
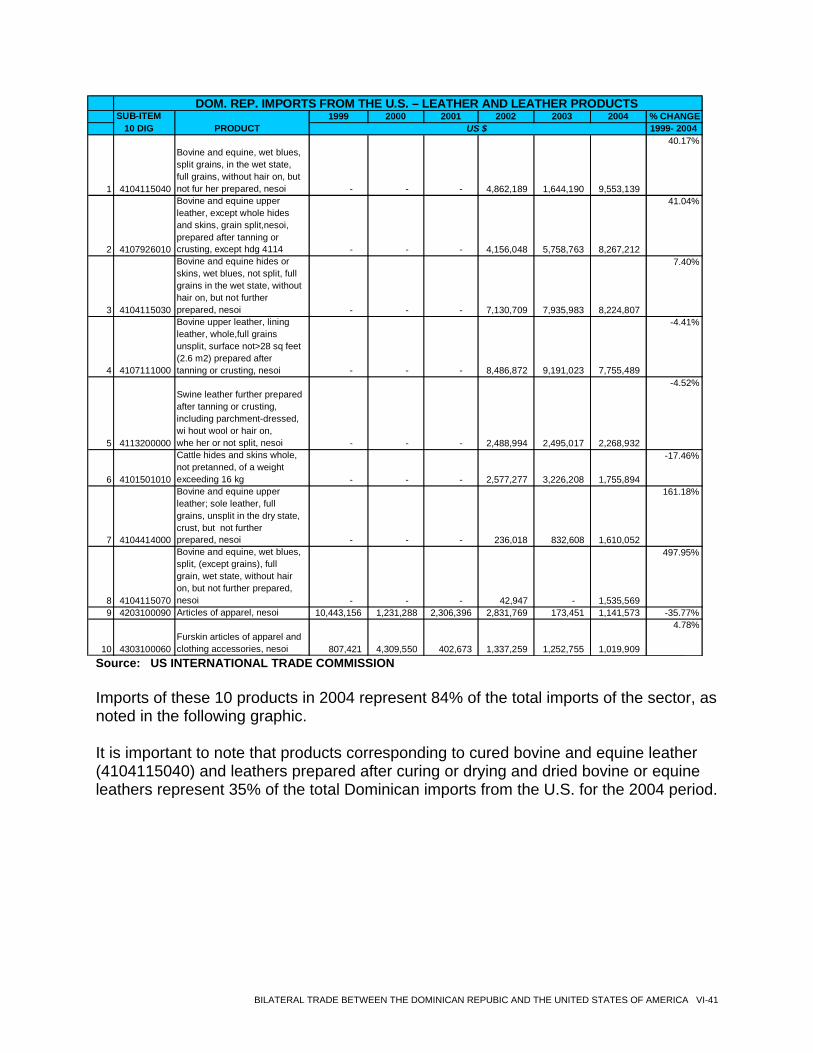
1999 2000 2001 2002 2003 2004 % CHANGE
1999- 2004
1 4104115040
Bovine and equine, wet blues, split grains, in the wet state, full grains, without hair on, but not fur her prepared, nesoi - - - 4,862,189 1,644,190 9,553,139
40.17%
2 4107926010
Bovine and equine upper leather, except whole hides and skins, grain split,nesoi, prepared after tanning or crusting, except hdg 4114 - - - 4,156,048 5,758,763 8,267,212
41.04%
3 4104115030
Bovine and equine hides or skins, wet blues, not split, full grains in the wet state, without hair on, but not further prepared, nesoi - - - 7,130,709 7,935,983 8,224,807
7.40%
4 4107111000
Bovine upper leather, lining leather, whole,full grains unsplit, surface not>28 sq feet (2.6 m2) prepared after tanning or crusting, nesoi - - - 8,486,872 9,191,023 7,755,489
-4.41%
5 4113200000
Swine leather further prepared after tanning or crusting, including parchment-dressed, wi hout wool or hair on, whe her or not split, nesoi - - - 2,488,994 2,495,017 2,268,932
-4.52%
6 4101501010 Cattle hides and skins whole, not pretanned, of a weight exceeding 16 kg - - - 2,577,277 3,226,208 1,755,894
-17.46%
7 4104414000
Bovine and equine upper leather; sole leather, full grains, unsplit in the dry state, crust, but not further prepared, nesoi - - - 236,018 832,608 1,610,052
161.18%
8 4104115070
Bovine and equine, wet blues, split, (except grains), full grain, wet state, without hair on, but not further prepared, nesoi - - - 42,947 - 1,535,569
497.95%
9 4203100090 Articles of apparel, nesoi 10,443,156 1,231,288 2,306,396 2,831,769 173,451 1,141,573 -35.77%
10 4303100060 Furskin articles of apparel and clothing accessories, nesoi 807,421 4,309,550 402,673 1,337,259 1,252,755 1,019,909
4.78%
DOM. REP. IMPORTS FROM THE U.S. – LEATHER AND LEATHER PRODUCTS SUB-ITEM
10 DIG PRODUCT US $
Source: US INTERNATIONAL TRADE COMMISSION
Imports of these 10 products in 2004 represent 84% of the total imports of the sector, as noted in the following graphic. It is important to note that products corresponding to cured bovine and equine leather (4104115040) and leathers prepared after curing or drying and dried bovine or equine leathers represent 35% of the total Dominican imports from the U.S. for the 2004 period.
BILATERAL TRADE BETWEEN THE DOMINICAN REPUBIC AND THE UNITED STATES OF AMERICA VI-41
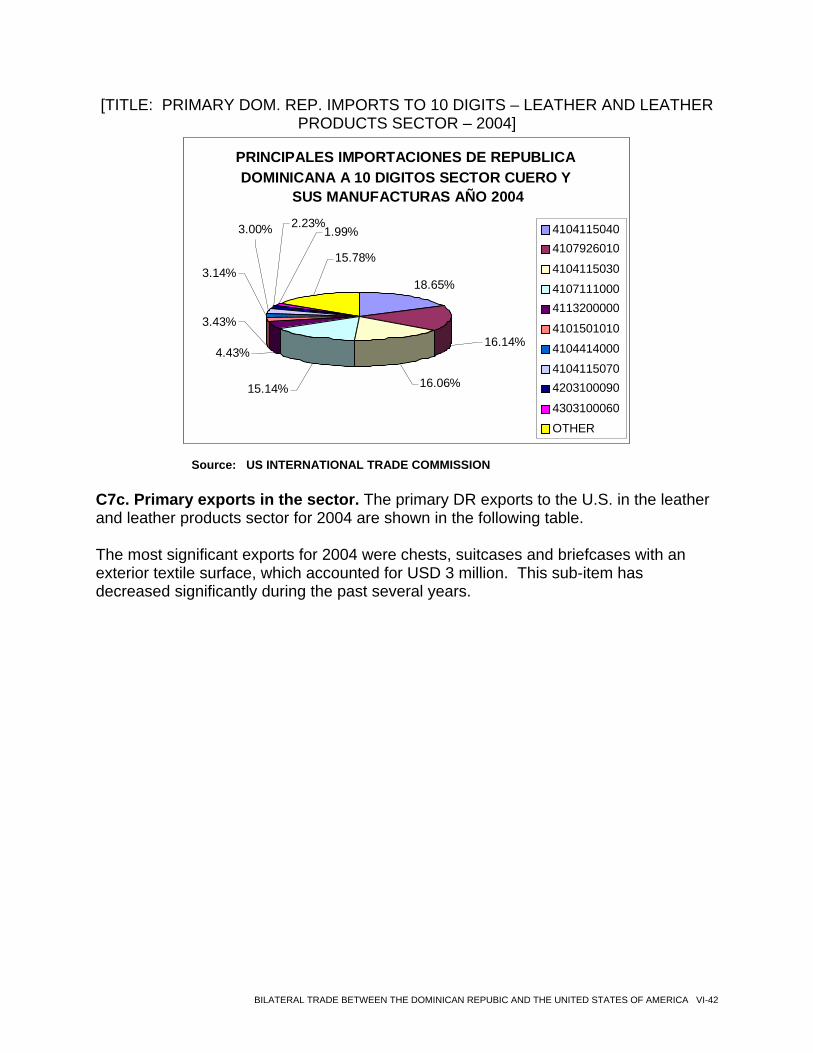
[TITLE: PRIMARY DOM. REP. IMPORTS TO 10 DIGITS – LEATHER AND LEATHER PRODUCTS SECTOR – 2004]
PRINCIPALES IMPORTACIONES DE REPUBLICA DOMINICANA A 10 DIGITOS SECTOR CUERO Y
SUS MANUFACTURAS AÑO 2004
18.65%
16.14%
15.78%
1.99%2.23% 3.00%
3.14%
16.06%
4.43%
15.14%
3.43%
4104115040 4107926010 4104115030 4107111000 4113200000 4101501010 4104414000 4104115070 4203100090 4303100060 OTHER
Source: US INTERNATIONAL TRADE COMMISSION C7c. Primary exports in the sector. The primary DR exports to the U.S. in the leather and leather products sector for 2004 are shown in the following table. The most significant exports for 2004 were chests, suitcases and briefcases with an exterior textile surface, which accounted for USD 3 million. This sub-item has decreased significantly during the past several years.
BILATERAL TRADE BETWEEN THE DOMINICAN REPUBIC AND THE UNITED STATES OF AMERICA VI-42
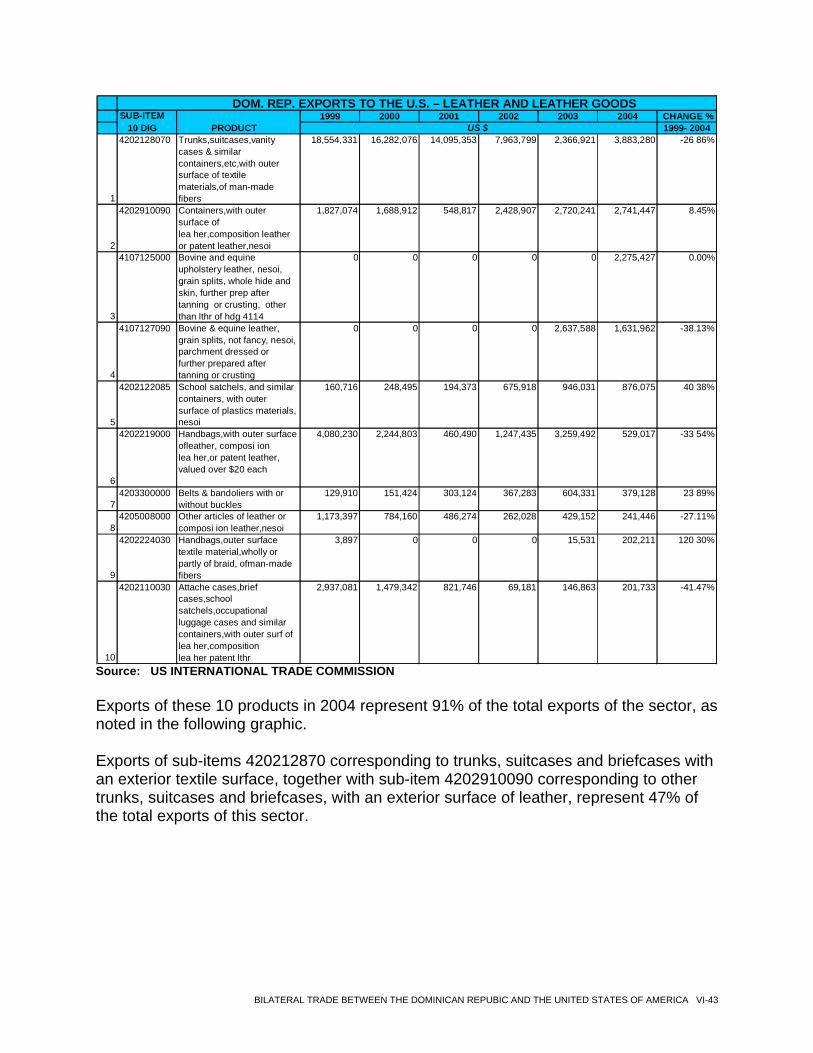
1999 2000 2001 2002 2003 2004 CHANGE %
1999- 2004
1
4202128070 Trunks,suitcases,vanity cases & similar containers,etc,with outer surface of textile materials,of man-made fibers
18,554,331 16,282,076 14,095,353 7,963,799 2,366,921 3,883,280 -26 86%
2
4202910090 Containers,with outer surface of lea her,composition leather or patent leather,nesoi
1,827,074 1,688,912 548,817 2,428,907 2,720,241 2,741,447 8.45%
3
4107125000 Bovine and equine upholstery leather, nesoi, grain splits, whole hide and skin, further prep after tanning or crusting, other than lthr of hdg 4114
0 0 0 0 0 2,275,427 0.00%
4
4107127090 Bovine & equine leather, grain splits, not fancy, nesoi, parchment dressed or further prepared after tanning or crusting
0 0 0 0 2,637,588 1,631,962 -38.13%
5
4202122085 School satchels, and similar containers, with outer surface of plastics materials, nesoi
160,716 248,495 194,373 675,918 946,031 876,075 40 38%
6
4202219000 Handbags,with outer surface ofleather, composi ion lea her,or patent leather, valued over $20 each
4,080,230 2,244,803 460,490 1,247,435 3,259,492 529,017 -33 54%
7 4203300000 Belts & bandoliers with or
without buckles 129,910 151,424 303,124 367,283 604,331 379,128 23 89%
8 4205008000 Other articles of leather or
composi ion leather,nesoi 1,173,397 784,160 486,274 262,028 429,152 241,446 -27.11%
9
4202224030 Handbags,outer surface textile material,wholly or partly of braid, ofman-made fibers
3,897 0 0 0 15,531 202,211 120 30%
10
4202110030 Attache cases,brief cases,school satchels,occupational luggage cases and similar containers,with outer surf of lea her,composition lea her patent lthr
2,937,081 1,479,342 821,746 69,181 146,863 201,733 -41.47%
DOM. REP. EXPORTS TO THE U.S. – LEATHER AND LEATHER GOODS SUB-ITEM
10 DIG PRODUCT US $
Source: US INTERNATIONAL TRADE COMMISSION Exports of these 10 products in 2004 represent 91% of the total exports of the sector, as noted in the following graphic. Exports of sub-items 420212870 corresponding to trunks, suitcases and briefcases with an exterior textile surface, together with sub-item 4202910090 corresponding to other trunks, suitcases and briefcases, with an exterior surface of leather, represent 47% of the total exports of this sector.
BILATERAL TRADE BETWEEN THE DOMINICAN REPUBIC AND THE UNITED STATES OF AMERICA VI-43
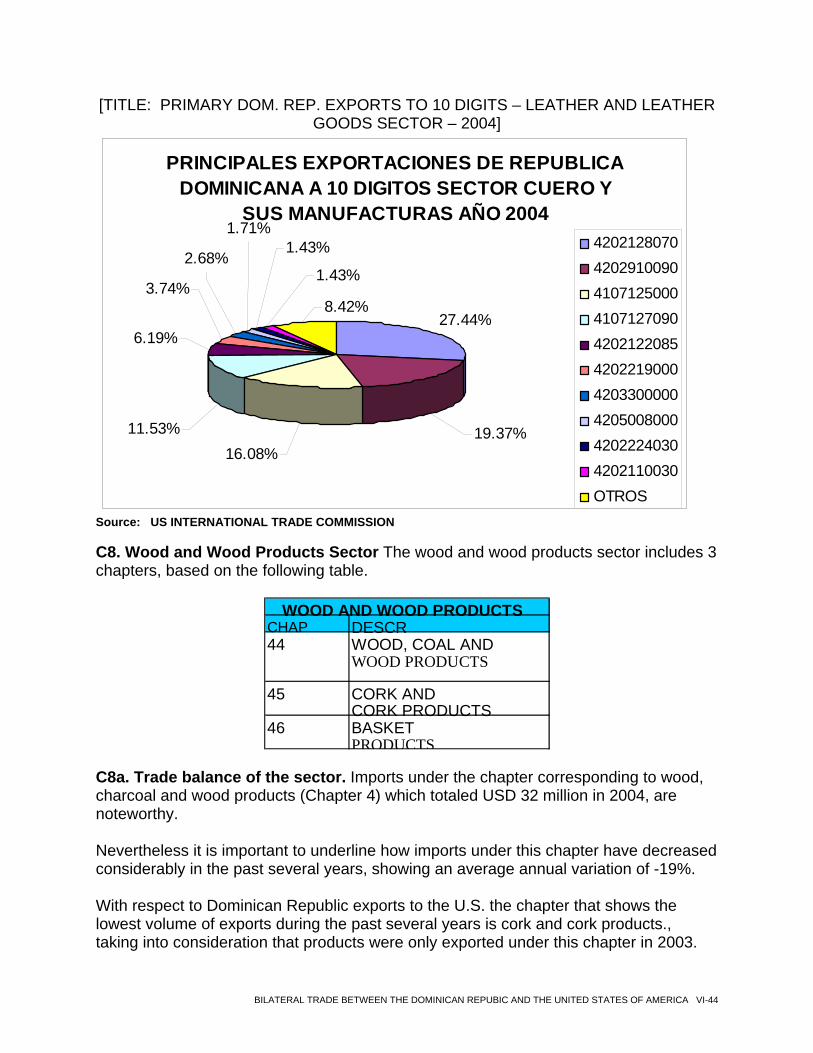
[TITLE: PRIMARY DOM. REP. EXPORTS TO 10 DIGITS – LEATHER AND LEATHER GOODS SECTOR – 2004]
PRINCIPALES EXPORTACIONES DE REPUBLICA DOMINICANA A 10 DIGITOS SECTOR CUERO Y
SUS MANUFACTURAS AÑO 2004
27.44%
3.74%
11.53%
6.19%
16.08%
2.68%
1.71%1.43%
1.43%
8.42%
19.37%
4202128070420291009041071250004107127090420212208542022190004203300000420500800042022240304202110030OTROS
Source: US INTERNATIONAL TRADE COMMISSION C8. Wood and Wood Products Sector The wood and wood products sector includes 3 chapters, based on the following table.
WOOD AND WOOD PRODUCTSCHAP DESCR44 WOOD, COAL AND
WOOD PRODUCTS
45 CORK AND CORK PRODUCTS
46 BASKET PRODUCTS
C8a. Trade balance of the sector. Imports under the chapter corresponding to wood, charcoal and wood products (Chapter 4) which totaled USD 32 million in 2004, are noteworthy. Nevertheless it is important to underline how imports under this chapter have decreased considerably in the past several years, showing an average annual variation of -19%. With respect to Dominican Republic exports to the U.S. the chapter that shows the lowest volume of exports during the past several years is cork and cork products., taking into consideration that products were only exported under this chapter in 2003.
BILATERAL TRADE BETWEEN THE DOMINICAN REPUBIC AND THE UNITED STATES OF AMERICA VI-44
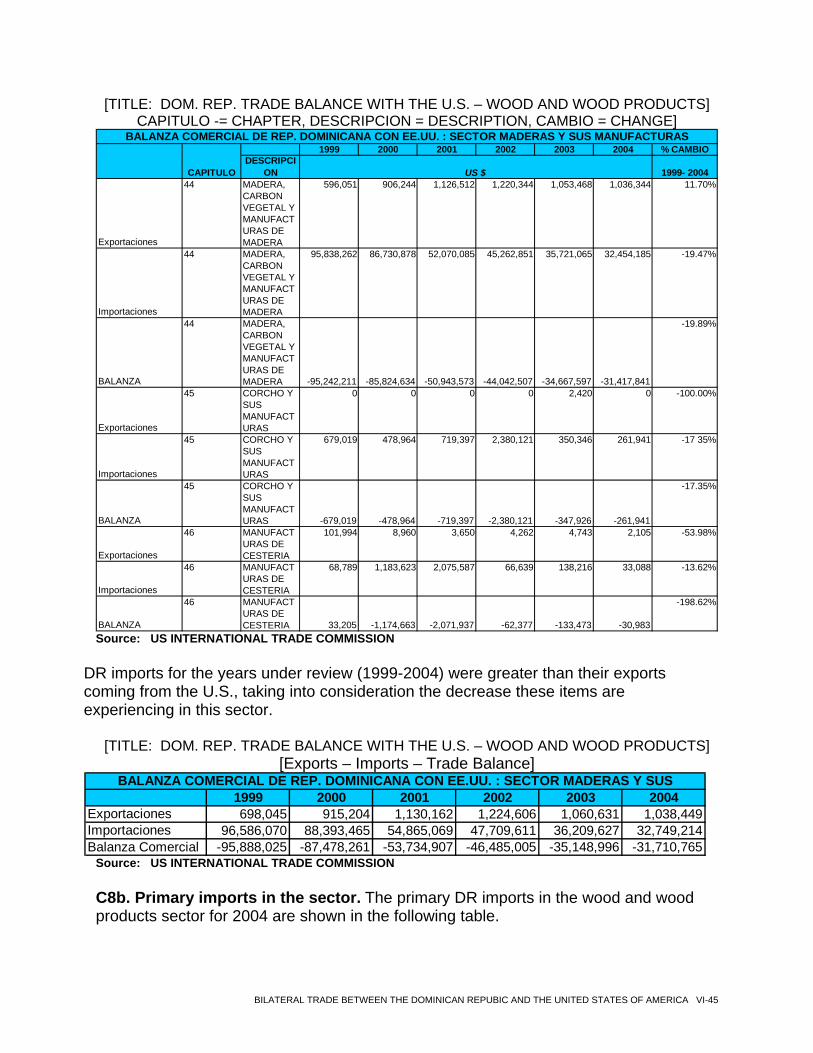
[TITLE: DOM. REP. TRADE BALANCE WITH THE U.S. – WOOD AND WOOD PRODUCTS] CAPITULO -= CHAPTER, DESCRIPCION = DESCRIPTION, CAMBIO = CHANGE]
1999 2000 2001 2002 2003 2004 % CAMBIODESCRIPCI
ON 1999- 2004
Exportaciones
44 MADERA, CARBON VEGETAL Y MANUFACTURAS DE MADERA
596,051 906,244 1,126,512 1,220,344 1,053,468 1,036,344 11.70%
Importaciones
44 MADERA, CARBON VEGETAL Y MANUFACTURAS DE MADERA
95,838,262 86,730,878 52,070,085 45,262,851 35,721,065 32,454,185 -19.47%
BALANZA
44 MADERA, CARBON VEGETAL Y MANUFACTURAS DE MADERA -95,242,211 -85,824,634 -50,943,573 -44,042,507 -34,667,597 -31,417,841
-19.89%
Exportaciones
45 CORCHO Y SUS MANUFACTURAS
0 0 0 0 2,420 0 -100.00%
Importaciones
45 CORCHO Y SUS MANUFACTURAS
679,019 478,964 719,397 2,380,121 350,346 261,941 -17 35%
BALANZA
45 CORCHO Y SUS MANUFACTURAS -679,019 -478,964 -719,397 -2,380,121 -347,926 -261,941
-17.35%
Exportaciones
46 MANUFACTURAS DE CESTERIA
101,994 8,960 3,650 4,262 4,743 2,105 -53.98%
Importaciones
46 MANUFACTURAS DE CESTERIA
68,789 1,183,623 2,075,587 66,639 138,216 33,088 -13.62%
BALANZA
46 MANUFACTURAS DE CESTERIA 33,205 -1,174,663 -2,071,937 -62,377 -133,473 -30,983
-198.62%
BALANZA COMERCIAL DE REP. DOMINICANA CON EE.UU. : SECTOR MADERAS Y SUS MANUFACTURAS
CAPITULO US $
Source: US INTERNATIONAL TRADE COMMISSION
DR imports for the years under review (1999-2004) were greater than their exports coming from the U.S., taking into consideration the decrease these items are experiencing in this sector.
[TITLE: DOM. REP. TRADE BALANCE WITH THE U.S. – WOOD AND WOOD PRODUCTS] [Exports – Imports – Trade Balance]
1999 2000 2001 2002 2003 2004Exportaciones 698,045 915,204 1,130,162 1,224,606 1,060,631 1,038,449Importaciones 96,586,070 88,393,465 54,865,069 47,709,611 36,209,627 32,749,214Balanza Comercial -95,888,025 -87,478,261 -53,734,907 -46,485,005 -35,148,996 -31,710,765
BALANZA COMERCIAL DE REP. DOMINICANA CON EE.UU. : SECTOR MADERAS Y SUS
Source: US INTERNATIONAL TRADE COMMISSION
C8b. Primary imports in the sector. The primary DR imports in the wood and wood products sector for 2004 are shown in the following table.
BILATERAL TRADE BETWEEN THE DOMINICAN REPUBIC AND THE UNITED STATES OF AMERICA VI-45
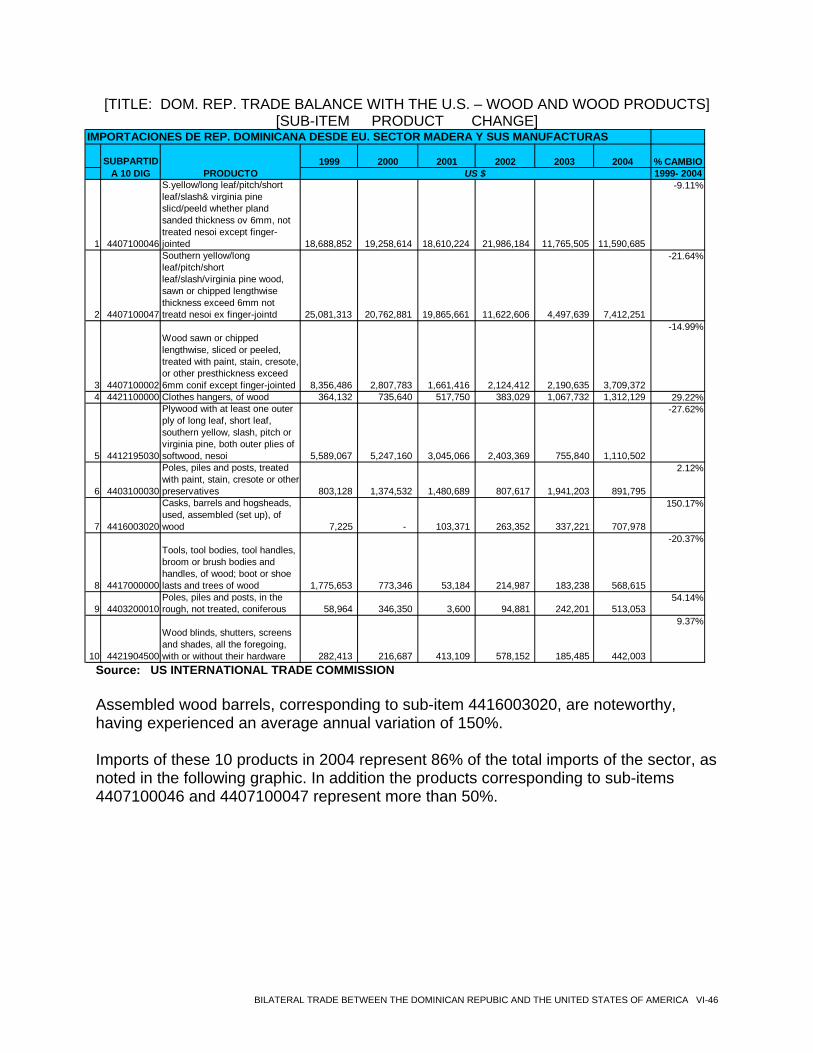
[TITLE: DOM. REP. TRADE BALANCE WITH THE U.S. – WOOD AND WOOD PRODUCTS] [SUB-ITEM PRODUCT CHANGE]
IMPORTACIONES DE REP. DOMINICANA DESDE EU. SECTOR MADERA Y SUS MANUFACTURAS
1999 2000 2001 2002 2003 2004 % CAMBIO1999- 2004
1 4407100046
S.yellow/long leaf/pitch/short leaf/slash& virginia pine slicd/peeld whether pland sanded thickness ov 6mm, not treated nesoi except finger-jointed 18,688,852 19,258,614 18,610,224 21,986,184 11,765,505 11,590,685
-9.11%
2 4407100047
Southern yellow/long leaf/pitch/short leaf/slash/virginia pine wood, sawn or chipped lengthwise thickness exceed 6mm not treatd nesoi ex finger-jointd 25,081,313 20,762,881 19,865,661 11,622,606 4,497,639 7,412,251
-21.64%
3 4407100002
Wood sawn or chipped lengthwise, sliced or peeled, treated with paint, stain, cresote, or other presthickness exceed 6mm conif except finger-jointed 8,356,486 2,807,783 1,661,416 2,124,412 2,190,635 3,709,372
-14.99%
4 4421100000 Clothes hangers, of wood 364,132 735,640 517,750 383,029 1,067,732 1,312,129 29.22%
5 4412195030
Plywood with at least one outer ply of long leaf, short leaf, southern yellow, slash, pitch or virginia pine, both outer plies of softwood, nesoi 5,589,067 5,247,160 3,045,066 2,403,369 755,840 1,110,502
-27.62%
6 4403100030
Poles, piles and posts, treated with paint, stain, cresote or other preservatives 803,128 1,374,532 1,480,689 807,617 1,941,203 891,795
2.12%
7 4416003020
Casks, barrels and hogsheads, used, assembled (set up), of wood 7,225 - 103,371 263,352 337,221 707,978
150.17%
8 4417000000
Tools, tool bodies, tool handles, broom or brush bodies and handles, of wood; boot or shoe lasts and trees of wood 1,775,653 773,346 53,184 214,987 183,238 568,615
-20.37%
9 4403200010Poles, piles and posts, in the rough, not treated, coniferous 58,964 346,350 3,600 94,881 242,201 513,053
54.14%
10 4421904500
Wood blinds, shutters, screens and shades, all the foregoing, with or without their hardware 282,413 216,687 413,109 578,152 185,485 442,003
9.37%
SUBPARTIDA 10 DIG PRODUCTO US $
Source: US INTERNATIONAL TRADE COMMISSION Assembled wood barrels, corresponding to sub-item 4416003020, are noteworthy, having experienced an average annual variation of 150%. Imports of these 10 products in 2004 represent 86% of the total imports of the sector, as noted in the following graphic. In addition the products corresponding to sub-items 4407100046 and 4407100047 represent more than 50%.
BILATERAL TRADE BETWEEN THE DOMINICAN REPUBIC AND THE UNITED STATES OF AMERICA VI-46
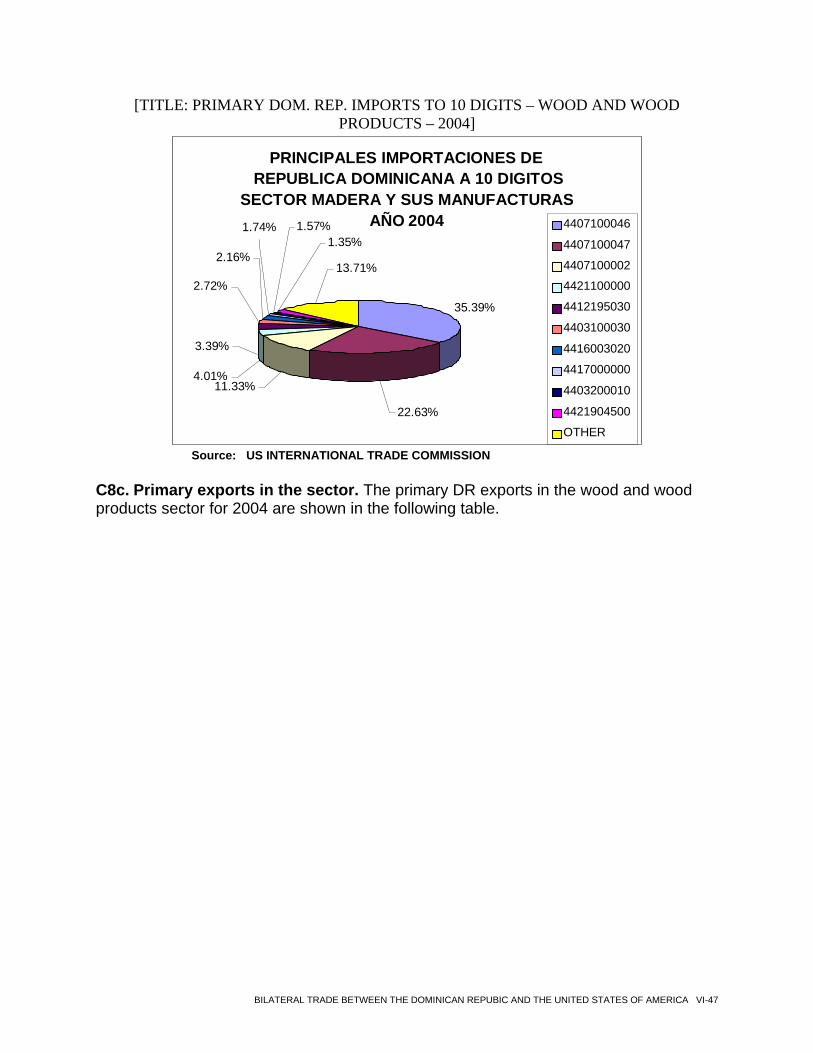
[TITLE: PRIMARY DOM. REP. IMPORTS TO 10 DIGITS – WOOD AND WOOD PRODUCTS – 2004]
PRINCIPALES IMPORTACIONES DE
REPUBLICA DOMINICANA A 10 DIGITOS SECTOR MADERA Y SUS MANUFACTURAS
AÑO 2004
35.39%
22.63%
13.71%
1.35%1.57%1.74%
2.16%
11.33%
3.39%
4.01%
2.72%
4407100046 4407100047 4407100002 4421100000 4412195030 4403100030 4416003020 4417000000 4403200010 4421904500 OTHER
Source: US INTERNATIONAL TRADE COMMISSION
C8c. Primary exports in the sector. The primary DR exports in the wood and wood products sector for 2004 are shown in the following table.
BILATERAL TRADE BETWEEN THE DOMINICAN REPUBIC AND THE UNITED STATES OF AMERICA VI-47
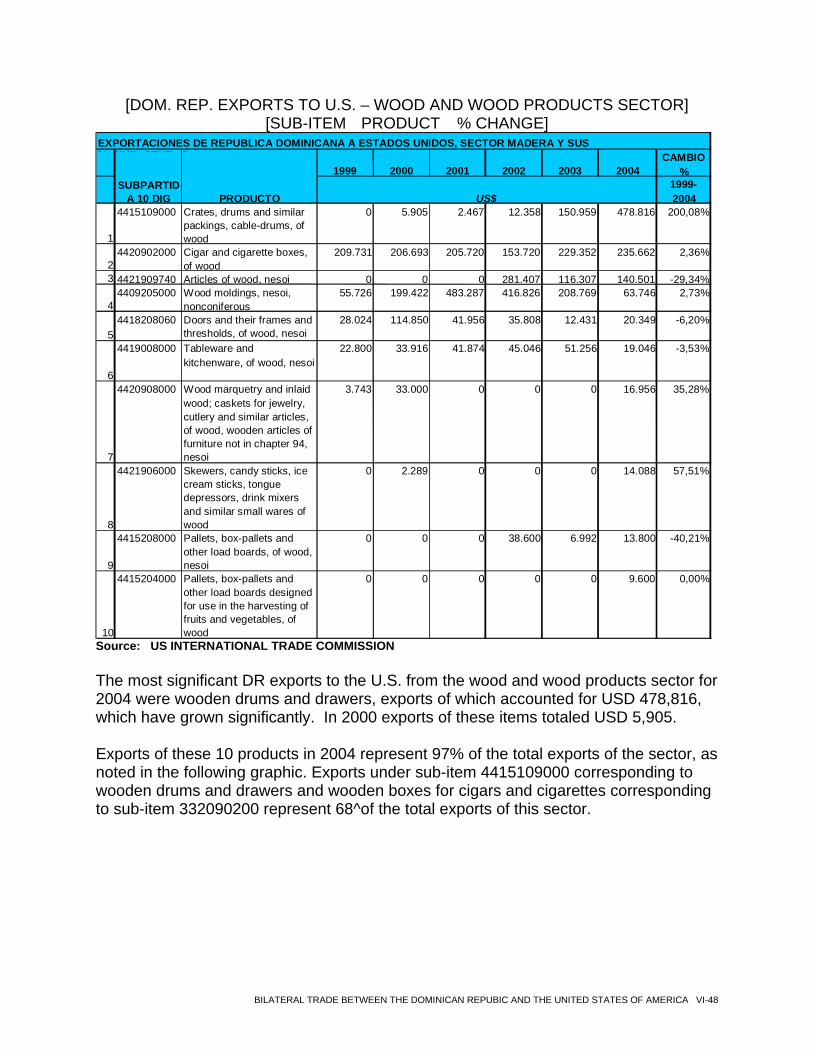
[DOM. REP. EXPORTS TO U.S. – WOOD AND WOOD PRODUCTS SECTOR] [SUB-ITEM PRODUCT % CHANGE]
EXPORTACIONES DE REPUBLICA DOMINICANA A ESTADOS UNIDOS, SECTOR MADERA Y SUS M NUF CTUR S
1999 2000 2001 2002 2003 2004 CAMBIO
%1999- 2004
1
4415109000 Crates, drums and similar packings, cable-drums, of wood
0 5.905 2.467 12.358 150.959 478.816 200,08%
2 4420902000 Cigar and cigarette boxes,
of wood 209.731 206.693 205.720 153.720 229.352 235.662 2,36%
3 4421909740 Articles of wood, nesoi 0 0 0 281.407 116.307 140.501 -29,34%
4 4409205000 Wood moldings, nesoi,
nonconiferous 55.726 199.422 483.287 416.826 208.769 63.746 2,73%
5 4418208060 Doors and their frames and
thresholds, of wood, nesoi 28.024 114.850 41.956 35.808 12.431 20.349 -6,20%
6
4419008000 Tableware and kitchenware, of wood, nesoi
22.800 33.916 41.874 45.046 51.256 19.046 -3,53%
7
4420908000 Wood marquetry and inlaid wood; caskets for jewelry, cutlery and similar articles, of wood, wooden articles of furniture not in chapter 94, nesoi
3.743 33.000 0 0 0 16.956 35,28%
8
4421906000 Skewers, candy sticks, ice cream sticks, tongue depressors, drink mixers and similar small wares of wood
0 2.289 0 0 0 14.088 57,51%
9
4415208000 Pallets, box-pallets and other load boards, of wood, nesoi
0 0 0 38.600 6.992 13.800 -40,21%
10
4415204000 Pallets, box-pallets and other load boards designed for use in the harvesting of fruits and vegetables, of wood
0 0 0 0 0 9.600 0,00%
SUBPARTID A 10 DIG PRODUCTO US$
Source: US INTERNATIONAL TRADE COMMISSION The most significant DR exports to the U.S. from the wood and wood products sector for 2004 were wooden drums and drawers, exports of which accounted for USD 478,816, which have grown significantly. In 2000 exports of these items totaled USD 5,905. Exports of these 10 products in 2004 represent 97% of the total exports of the sector, as noted in the following graphic. Exports under sub-item 4415109000 corresponding to wooden drums and drawers and wooden boxes for cigars and cigarettes corresponding to sub-item 332090200 represent 68^of the total exports of this sector.
BILATERAL TRADE BETWEEN THE DOMINICAN REPUBIC AND THE UNITED STATES OF AMERICA VI-48
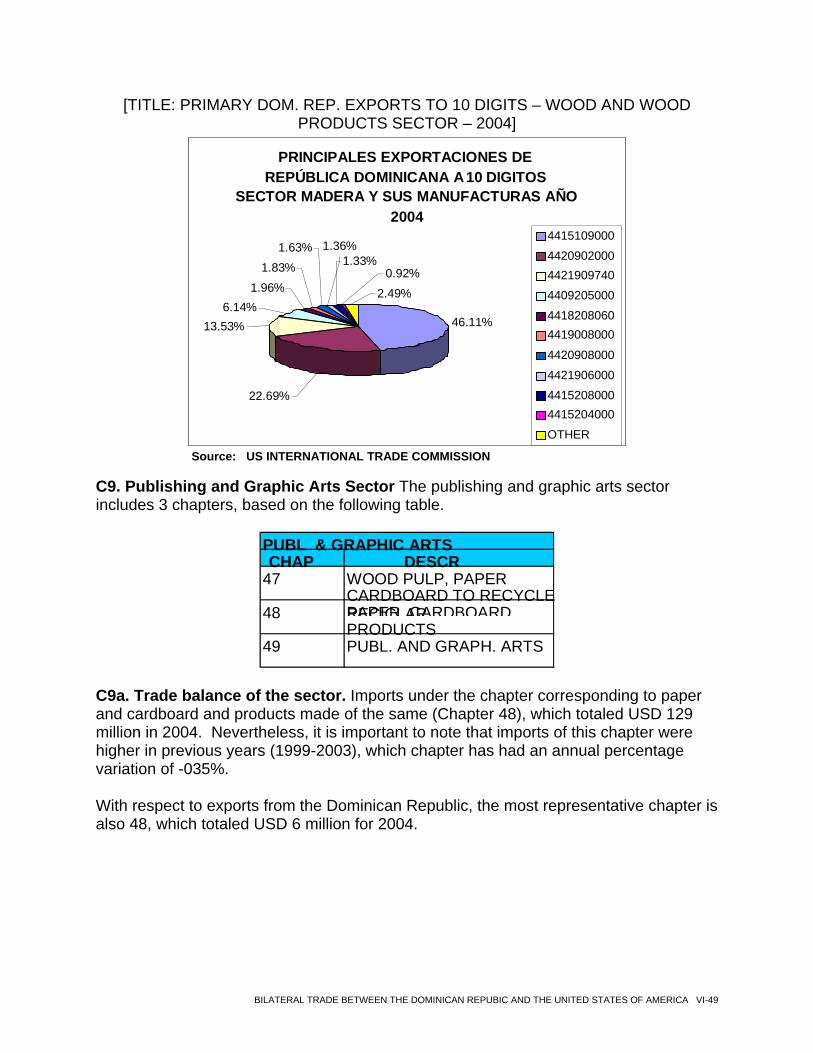
[TITLE: PRIMARY DOM. REP. EXPORTS TO 10 DIGITS – WOOD AND WOOD PRODUCTS SECTOR – 2004]
PRINCIPALES EXPORTACIONES DE
REPÚBLICA DOMINICANA A 10 DIGITOS SECTOR MADERA Y SUS MANUFACTURAS AÑO
2004
46.11%
1.83%
6.14% 1.96%
13.53%
1.63% 1.36%1.33%
0.92%2.49%
22.69%
4415109000 4420902000 4421909740 4409205000 4418208060 4419008000 4420908000 4421906000 4415208000 4415204000 OTHER
Source: US INTERNATIONAL TRADE COMMISSION
C9. Publishing and Graphic Arts Sector The publishing and graphic arts sector includes 3 chapters, based on the following table.
PUBL & GRAPHIC ARTS CHAP DESCR
47 WOOD PULP, PAPER CARDBOARD TO RECYCLERECICLAR48 PAPER CARDBOARDPRODUCTS
49 PUBL. AND GRAPH. ARTS
C9a. Trade balance of the sector. Imports under the chapter corresponding to paper and cardboard and products made of the same (Chapter 48), which totaled USD 129 million in 2004. Nevertheless, it is important to note that imports of this chapter were higher in previous years (1999-2003), which chapter has had an annual percentage variation of -035%. With respect to exports from the Dominican Republic, the most representative chapter is also 48, which totaled USD 6 million for 2004.
BILATERAL TRADE BETWEEN THE DOMINICAN REPUBIC AND THE UNITED STATES OF AMERICA VI-49
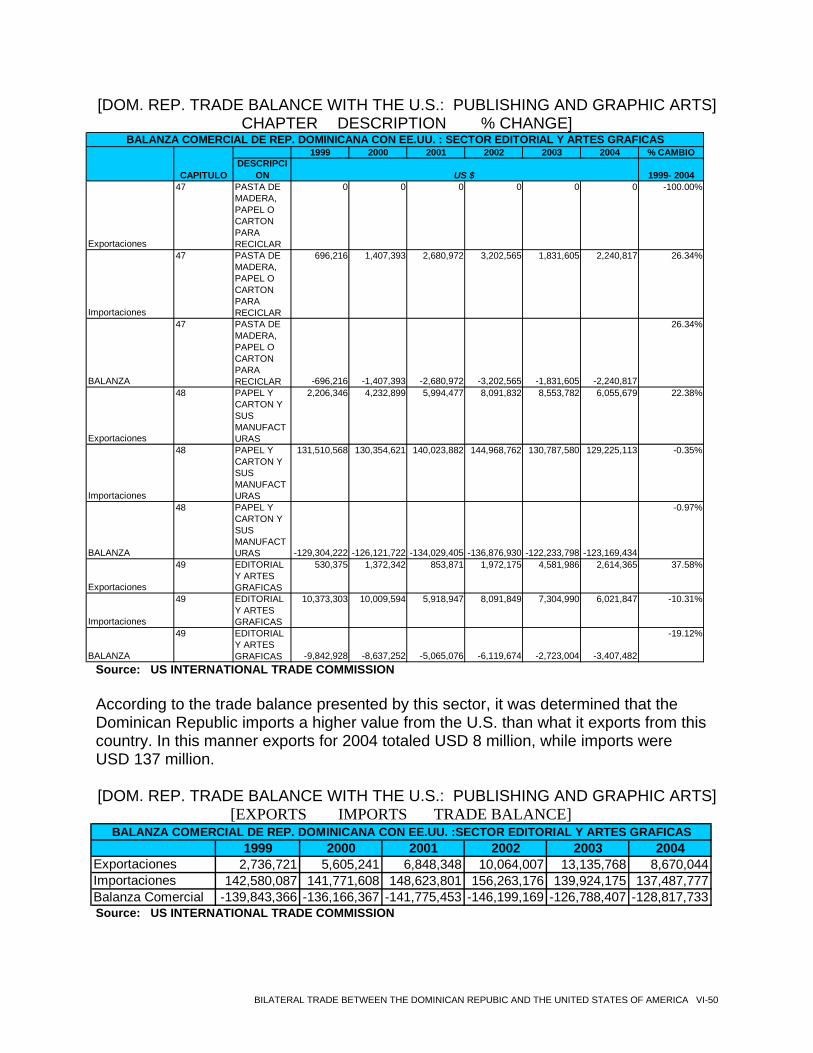
[DOM. REP. TRADE BALANCE WITH THE U.S.: PUBLISHING AND GRAPHIC ARTS] CHAPTER DESCRIPTION % CHANGE]
1999 2000 2001 2002 2003 2004 % CAMBIODESCRIPCI
ON 1999- 2004
Exportaciones
47 PASTA DE MADERA, PAPEL O CARTON PARA RECICLAR
0 0 0 0 0 0 -100
Importaciones
47 PASTA DE MADERA, PAPEL O CARTON PARA RECICLAR
696,216 1,407,393 2,680,972 3,202,565 1,831,605 2,240,817 26.34%
BALANZA
47 PASTA DE MADERA, PAPEL O CARTON PARA RECICLAR -696,216 -1,407,393 -2,680,972 -3,202,565 -1,831,605 -2,240,817
26.34%
Exportaciones
48 PAPEL Y CARTON Y SUS MANUFACTURAS
2,206,346 4,232,899 5,994,477 8,091,832 8,553,782 6,055,679 22.38%
Importaciones
48 PAPEL Y CARTON Y SUS MANUFACTURAS
131,510,568 130,354,621 140,023,882 144,968,762 130,787,580 129,225,113 -0.35%
BALANZA
48 PAPEL Y CARTON Y SUS MANUFACTURAS -129,304,222 -126,121,722 -134,029,405 -136,876,930 -122,233,798 -123,169,434
-0.97%
Exportaciones
49 EDITORIAL Y ARTES GRAFICAS
530,375 1,372,342 853,871 1,972,175 4,581,986 2,614,365 37.58%
Importaciones
49 EDITORIAL Y ARTES GRAFICAS
10,373,303 10,009,594 5,918,947 8,091,849 7,304,990 6,021,847 -10.31%
BALANZA
49 EDITORIAL Y ARTES GRAFICAS -9,842,928 -8,637,252 -5,065,076 -6,119,674 -2,723,004 -3,407,482
-19.12%
BALANZA COMERCIAL DE REP. DOMINICANA CON EE.UU. : SECTOR EDITORIAL Y ARTES GRAFICAS
CAPITULO US $.00%
Source: US INTERNATIONAL TRADE COMMISSION
According to the trade balance presented by this sector, it was determined that the Dominican Republic imports a higher value from the U.S. than what it exports from this country. In this manner exports for 2004 totaled USD 8 million, while imports were USD 137 million. [DOM. REP. TRADE BALANCE WITH THE U.S.: PUBLISHING AND GRAPHIC ARTS]
[EXPORTS IMPORTS TRADE BALANCE]
1999 2000 2001 2002 2003 2004Exportaciones 2,736,721 5,605,241 6,848,348 10,064,007 13,135,768 8,670,044Importaciones 142,580,087 141,771,608 148,623,801 156,263,176 139,924,175 137,487,777Balanza Comercial -139,843,366 -136,166,367 -141,775,453 -146,199,169 -126,788,407 -128,817,733
BALANZA COMERCIAL DE REP. DOMINICANA CON EE.UU. :SECTOR EDITORIAL Y ARTES GRAFICAS
Source: US INTERNATIONAL TRADE COMMISSION
BILATERAL TRADE BETWEEN THE DOMINICAN REPUBIC AND THE UNITED STATES OF AMERICA VI-50
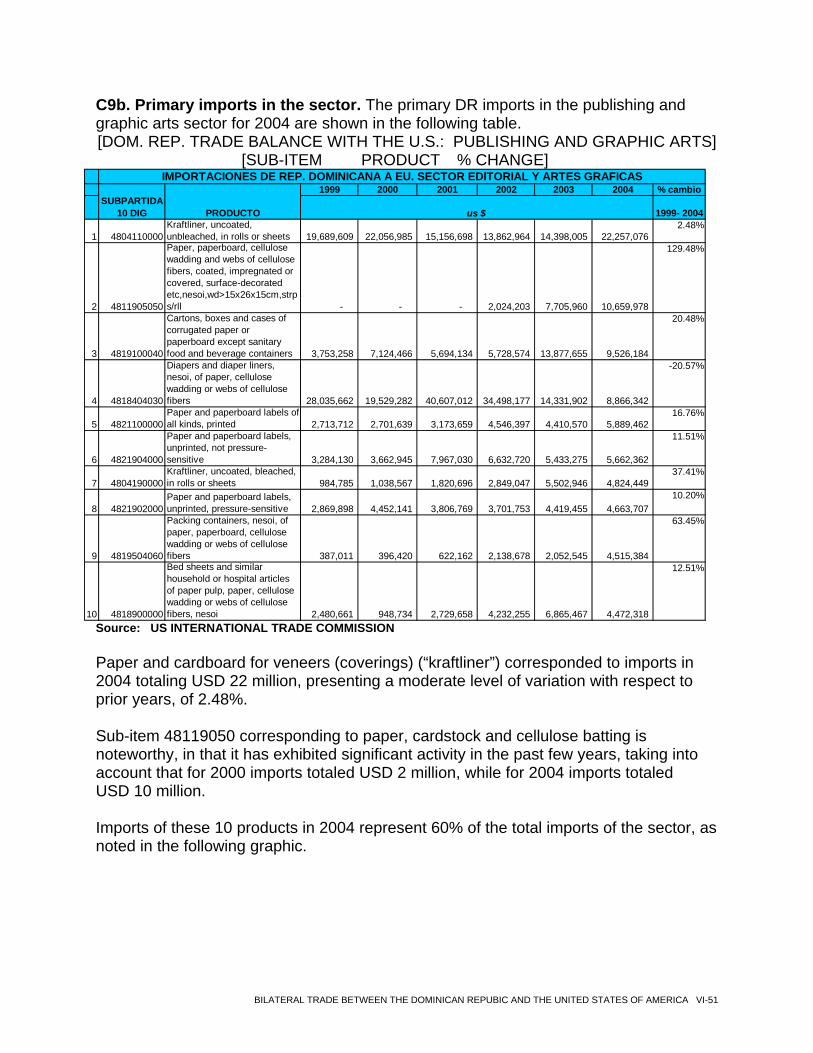
C9b. Primary imports in the sector. The primary DR imports in the publishing and graphic arts sector for 2004 are shown in the following table. [DOM. REP. TRADE BALANCE WITH THE U.S.: PUBLISHING AND GRAPHIC ARTS]
[SUB-ITEM PRODUCT % CHANGE]
1999 2000 2001 2002 2003 2004 % cambio
1999- 2004
1 4804110000Kraftliner, uncoated, unbleached, in rolls or sheets 19,689,609 22,056,985 15,156,698 13,862,964 14,398,005 22,257,076
2.48%
2 4811905050
Paper, paperboard, cellulose wadding and webs of cellulose fibers, coated, impregnated or covered, surface-decorated etc,nesoi,wd>15x26x15cm,strps/rll - - - 2,024,203 7,705,960 10,659,978
129.48%
3 4819100040
Cartons, boxes and cases of corrugated paper or paperboard except sanitary food and beverage containers 3,753,258 7,124,466 5,694,134 5,728,574 13,877,655 9,526,184
20.48%
4 4818404030
Diapers and diaper liners, nesoi, of paper, cellulose wadding or webs of cellulose fibers 28,035,662 19,529,282 40,607,012 34,498,177 14,331,902 8,866,342
-20.57%
5 4821100000Paper and paperboard labels of all kinds, printed 2,713,712 2,701,639 3,173,659 4,546,397 4,410,570 5,889,462
16.76%
6 4821904000
Paper and paperboard labels, unprinted, not pressure-sensitive 3,284,130 3,662,945 7,967,030 6,632,720 5,433,275 5,662,362
11.51%
7 4804190000Kraftliner, uncoated, bleached, in rolls or sheets 984,785 1,038,567 1,820,696 2,849,047 5,502,946 4,824,449
37.41%
8 4821902000Paper and paperboard labels, unprinted, pressure-sensitive 2,869,898 4,452,141 3,806,769 3,701,753 4,419,455 4,663,707
10.20%
9 4819504060
Packing containers, nesoi, of paper, paperboard, cellulose wadding or webs of cellulose fibers 387,011 396,420 622,162 2,138,678 2,052,545 4,515,384
63.45%
10 4818900000
Bed sheets and similar household or hospital articles of paper pulp, paper, cellulose wadding or webs of cellulose fibers, nesoi 2,480,661 948,734 2,729,658 4,232,255 6,865,467 4,472,318
12.51%
IMPORTACIONES DE REP. DOMINICANA A EU. SECTOR EDITORIAL Y ARTES GRAFICAS
SUBPARTIDA 10 DIG PRODUCTO us $
Source: US INTERNATIONAL TRADE COMMISSION
Paper and cardboard for veneers (coverings) (“kraftliner”) corresponded to imports in 2004 totaling USD 22 million, presenting a moderate level of variation with respect to prior years, of 2.48%.
Sub-item 48119050 corresponding to paper, cardstock and cellulose batting is noteworthy, in that it has exhibited significant activity in the past few years, taking into account that for 2000 imports totaled USD 2 million, while for 2004 imports totaled USD 10 million.
Imports of these 10 products in 2004 represent 60% of the total imports of the sector, as noted in the following graphic.
BILATERAL TRADE BETWEEN THE DOMINICAN REPUBIC AND THE UNITED STATES OF AMERICA VI-51
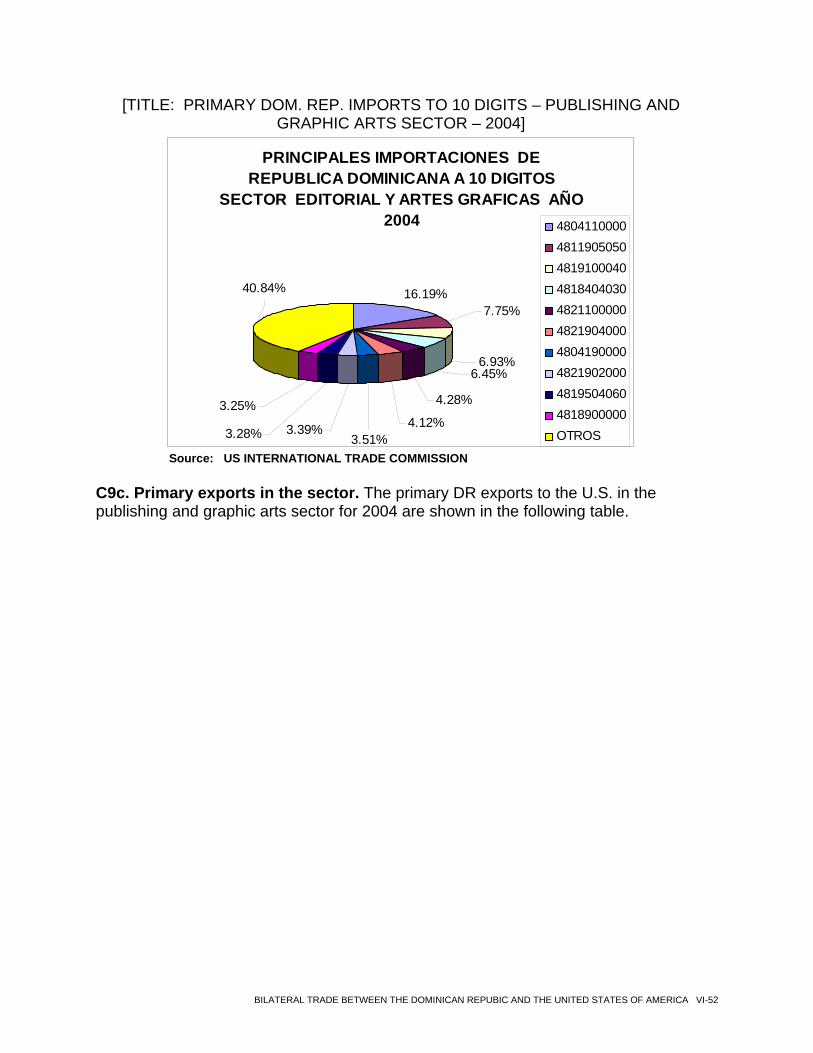
[TITLE: PRIMARY DOM. REP. IMPORTS TO 10 DIGITS – PUBLISHING AND GRAPHIC ARTS SECTOR – 2004]
PRINCIPALES IMPORTACIONES DE REPUBLICA DOMINICANA A 10 DIGITOS
SECTOR EDITORIAL Y ARTES GRAFICAS AÑO 2004
16.19%7.75%
40.84%
3.25%
3.28% 3.39%3.51%
6.93%
4.28%
6.45%
4.12%
4804110000481190505048191000404818404030482110000048219040004804190000482190200048195040604818900000OTROS
Source: US INTERNATIONAL TRADE COMMISSION
C9c. Primary exports in the sector. The primary DR exports to the U.S. in the publishing and graphic arts sector for 2004 are shown in the following table.
BILATERAL TRADE BETWEEN THE DOMINICAN REPUBIC AND THE UNITED STATES OF AMERICA VI-52
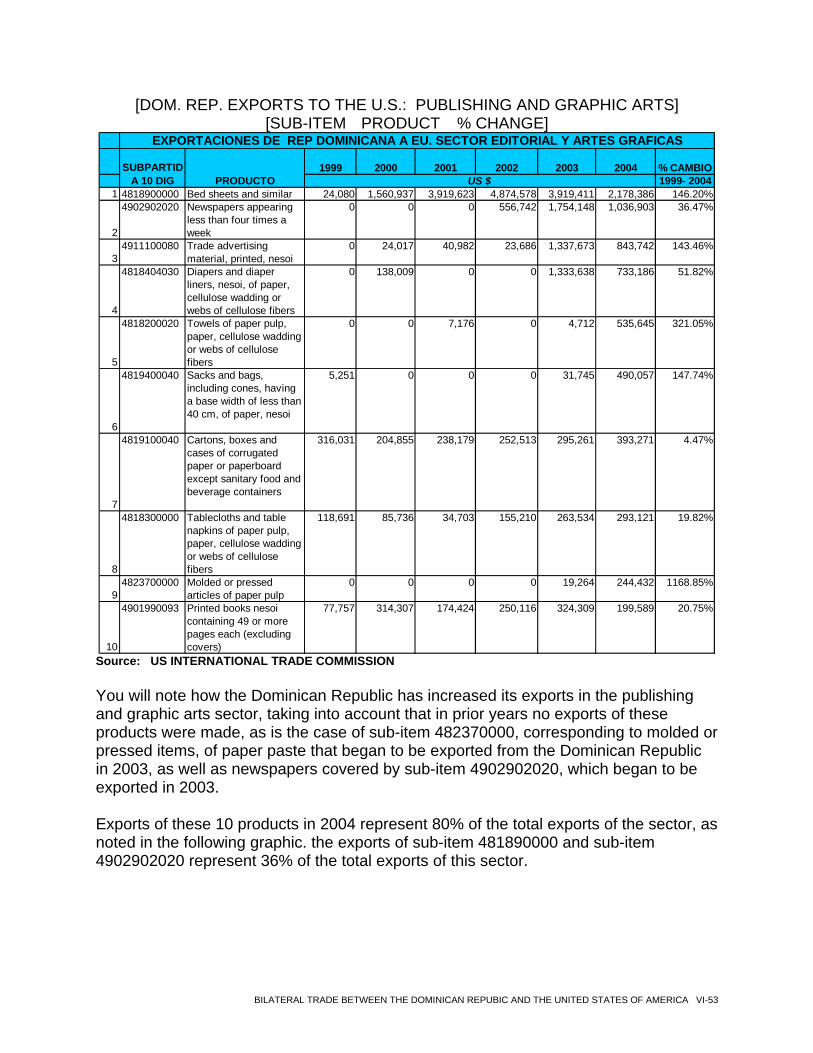
[DOM. REP. EXPORTS TO THE U.S.: PUBLISHING AND GRAPHIC ARTS] [SUB-ITEM PRODUCT % CHANGE]
1999 2000 2001 2002 2003 2004 % CAMBIO1999- 2004
1 4818900000 Bed sheets and similar 24,080 1,560,937 3,919,623 4,874,578 3,919,411 2,178,386 146.20%
2
4902902020 Newspapers appearing less than four times a week
0 0 0 556,742 1,754,148 1,036,903 36.47%
34911100080 Trade advertising
material, printed, nesoi0 24,017 40,982 23,686 1,337,673 843,742 143.46%
4
4818404030 Diapers and diaper liners, nesoi, of paper, cellulose wadding or webs of cellulose fibers
0 138,009 0 0 1,333,638 733,186 51.82%
5
4818200020 Towels of paper pulp, paper, cellulose wadding or webs of cellulose fibers
0 0 7,176 0 4,712 535,645 321.05%
6
4819400040 Sacks and bags, including cones, having a base width of less than 40 cm, of paper, nesoi
5,251 0 0 0 31,745 490,057 147.74%
7
4819100040 Cartons, boxes and cases of corrugated paper or paperboard except sanitary food and beverage containers
316,031 204,855 238,179 252,513 295,261 393,271 4.47%
8
4818300000 Tablecloths and table napkins of paper pulp, paper, cellulose wadding or webs of cellulose fibers
118,691 85,736 34,703 155,210 263,534 293,121 19.82%
94823700000 Molded or pressed
articles of paper pulp0 0 0 0 19,264 244,432 1168.85%
10
4901990093 Printed books nesoi containing 49 or more pages each (excluding covers)
77,757 314,307 174,424 250,116 324,309 199,589 20.75%
EXPORTACIONES DE REP DOMINICANA A EU. SECTOR EDITORIAL Y ARTES GRAFICAS
SUBPARTIDA 10 DIG PRODUCTO US $
Source: US INTERNATIONAL TRADE COMMISSION
You will note how the Dominican Republic has increased its exports in the publishing and graphic arts sector, taking into account that in prior years no exports of these products were made, as is the case of sub-item 482370000, corresponding to molded or pressed items, of paper paste that began to be exported from the Dominican Republic in 2003, as well as newspapers covered by sub-item 4902902020, which began to be exported in 2003.
Exports of these 10 products in 2004 represent 80% of the total exports of the sector, as noted in the following graphic. the exports of sub-item 481890000 and sub-item 4902902020 represent 36% of the total exports of this sector.
BILATERAL TRADE BETWEEN THE DOMINICAN REPUBIC AND THE UNITED STATES OF AMERICA VI-53
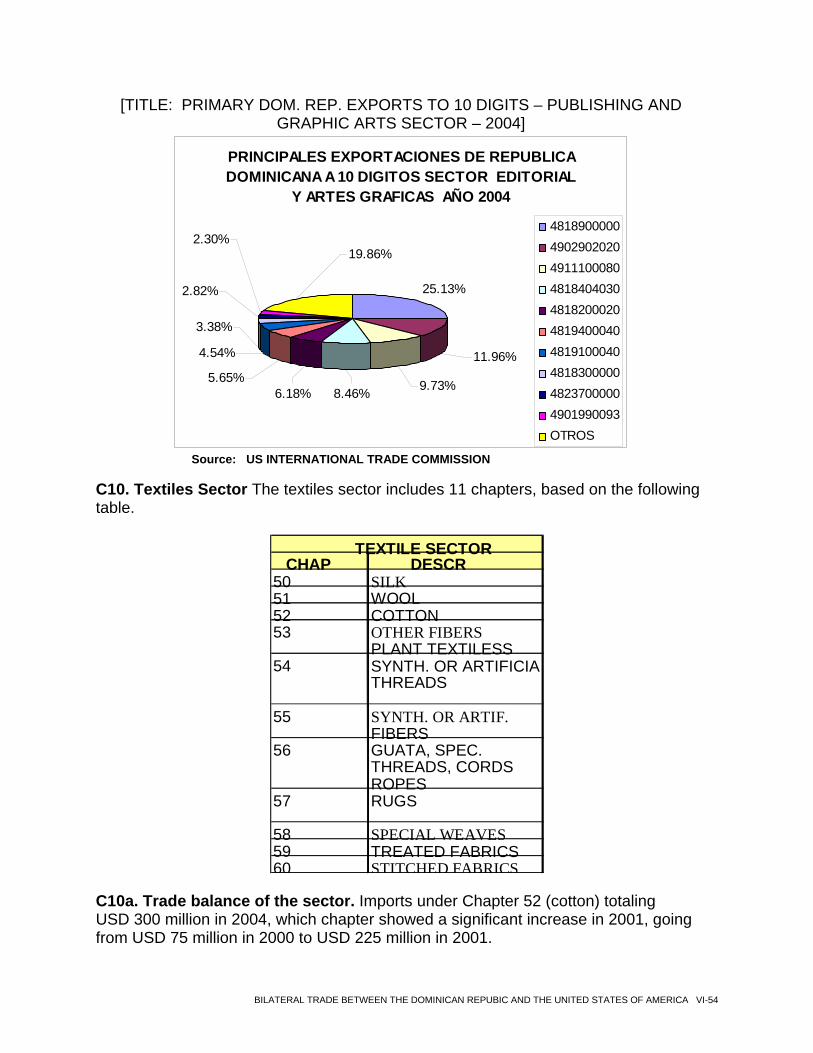
[TITLE: PRIMARY DOM. REP. EXPORTS TO 10 DIGITS – PUBLISHING AND GRAPHIC ARTS SECTOR – 2004]
PRINCIPALES EXPORTACIONES DE REPUBLICA DOMINICANA A 10 DIGITOS SECTOR EDITORIAL
Y ARTES GRAFICAS AÑO 2004
25.13%
5.65%8.46%6.18% 9.73%
4.54%
3.38%
2.82%
2.30%19.86%
11.96%
4818900000490290202049111000804818404030481820002048194000404819100040481830000048237000004901990093OTROS
Source: US INTERNATIONAL TRADE COMMISSION
C10. Textiles Sector The textiles sector includes 11 chapters, based on the following table.
CHAP DESCR
50 SILK51 WOOL52 COTTON53 OTHER FIBERS
PLANT TEXTILESS54 SYNTH. OR ARTIFICIA
THREADS
55 SYNTH. OR ARTIF. FIBERS
56 GUATA, SPEC. THREADS, CORDS ROPES
57 RUGS
58 SPECIAL WEAVES 59 TREATED FABRICS 60 STITCHED FABRICS
TEXTILE SECTOR
C10a. Trade balance of the sector. Imports under Chapter 52 (cotton) totaling USD 300 million in 2004, which chapter showed a significant increase in 2001, going from USD 75 million in 2000 to USD 225 million in 2001.
BILATERAL TRADE BETWEEN THE DOMINICAN REPUBIC AND THE UNITED STATES OF AMERICA VI-54
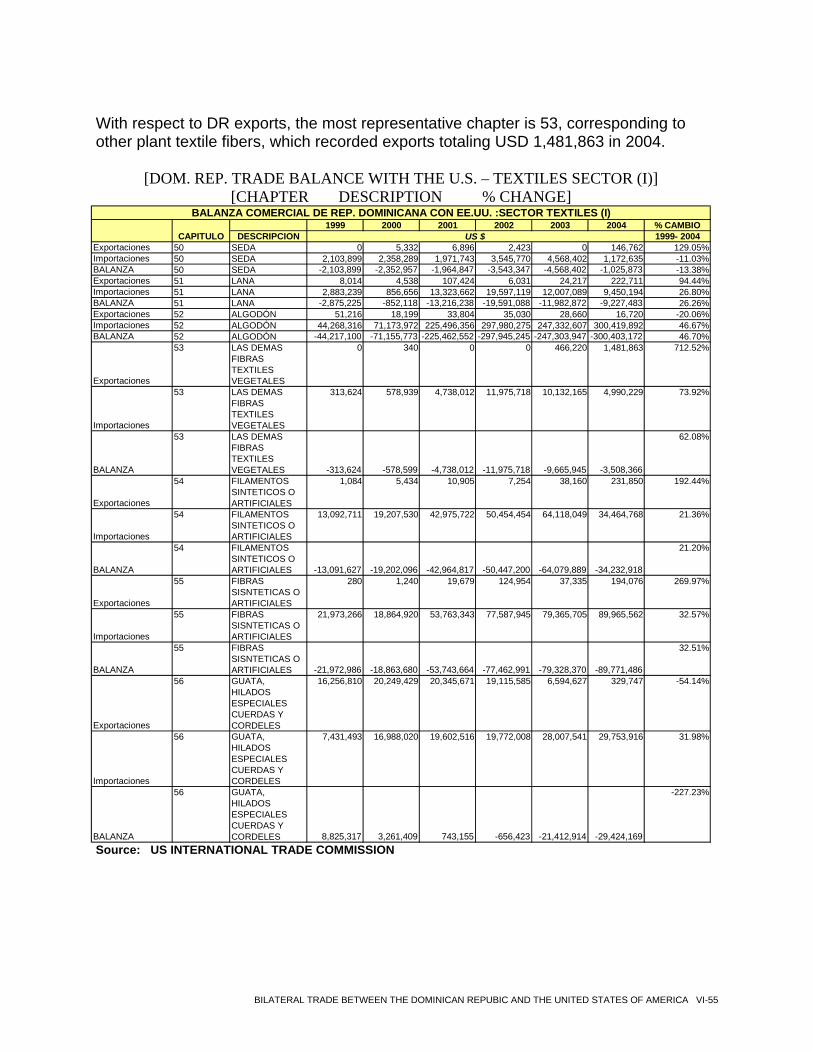
With respect to DR exports, the most representative chapter is 53, corresponding to other plant textile fibers, which recorded exports totaling USD 1,481,863 in 2004.
[DOM. REP. TRADE BALANCE WITH THE U.S. – TEXTILES SECTOR (I)]
[CHAPTER DESCRIPTION % CHANGE]
1999 2000 2001 2002 2003 2004 % CAMBIODESCRIPCION 1999- 2004
Exportaciones 50 SEDA 0 5,332 6,896 2,423 0 146,762 129.05%Importaciones 50 SEDA 2,103,899 2,358,289 1,971,743 3,545,770 4,568,402 1,172,635 -11.03%BALANZA 50 SEDA -2,103,899 -2,352,957 -1,964,847 -3,543,347 -4,568,402 -1,025,873 -13.38%Exportaciones 51 LANA 8,014 4,538 107,424 6,031 24,217 222,711 94.44%Importaciones 51 LANA 2,883,239 856,656 13,323,662 19,597,119 12,007,089 9,450,194 26.80%BALANZA 51 LANA -2,875,225 -852,118 -13,216,238 -19,591,088 -11,982,872 -9,227,483 26.26%Exportaciones 52 ALGODÓN 51,216 18,199 33,804 35,030 28,660 16,720 -20.06%Importaciones 52 ALGODÓN 44,268,316 71,173,972 225,496,356 297,980,275 247,332,607 300,419,892 46.67%BALANZA 52 ALGODÓN -44,217,100 -71,155,773 -225,462,552 -297,945,245 -247,303,947 -300,403,172 46.70%
Exportaciones
53 LAS DEMAS FIBRAS TEXTILES VEGETALES
0 340 0 0 466,220 1,481,863 712.52%
Importaciones
53 LAS DEMAS FIBRAS TEXTILES VEGETALES
313,624 578,939 4,738,012 11,975,718 10,132,165 4,990,229 73.92%
BALANZA
53 LAS DEMAS FIBRAS TEXTILES VEGETALES -313,624 -578,599 -4,738,012 -11,975,718 -9,665,945 -3,508,366
62.08%
Exportaciones
54 FILAMENTOS SINTETICOS O ARTIFICIALES
1,084 5,434 10,905 7,254 38,160 231,850 192.44%
Importaciones
54 FILAMENTOS SINTETICOS O ARTIFICIALES
13,092,711 19,207,530 42,975,722 50,454,454 64,118,049 34,464,768 21.36%
BALANZA
54 FILAMENTOS SINTETICOS O ARTIFICIALES -13,091,627 -19,202,096 -42,964,817 -50,447,200 -64,079,889 -34,232,918
21.20%
Exportaciones
55 FIBRAS SISNTETICAS O ARTIFICIALES
280 1,240 19,679 124,954 37,335 194,076 269.97%
Importaciones
55 FIBRAS SISNTETICAS O ARTIFICIALES
21,973,266 18,864,920 53,763,343 77,587,945 79,365,705 89,965,562 32.57%
BALANZA
55 FIBRAS SISNTETICAS O ARTIFICIALES -21,972,986 -18,863,680 -53,743,664 -77,462,991 -79,328,370 -89,771,486
32.51%
Exportaciones
56 GUATA, HILADOS ESPECIALES CUERDAS Y CORDELES
16,256,810 20,249,429 20,345,671 19,115,585 6,594,627 329,747 -54.14%
Importaciones
56 GUATA, HILADOS ESPECIALES CUERDAS Y CORDELES
7,431,493 16,988,020 19,602,516 19,772,008 28,007,541 29,753,916 31.98%
BALANZA
56 GUATA, HILADOS ESPECIALES CUERDAS Y CORDELES 8,825,317 3,261,409 743,155 -656,423 -21,412,914 -29,424,169
-227.23%
BALANZA COMERCIAL DE REP. DOMINICANA CON EE.UU. :SECTOR TEXTILES (I)
CAPITULO US $
Source: US INTERNATIONAL TRADE COMMISSION
BILATERAL TRADE BETWEEN THE DOMINICAN REPUBIC AND THE UNITED STATES OF AMERICA VI-55
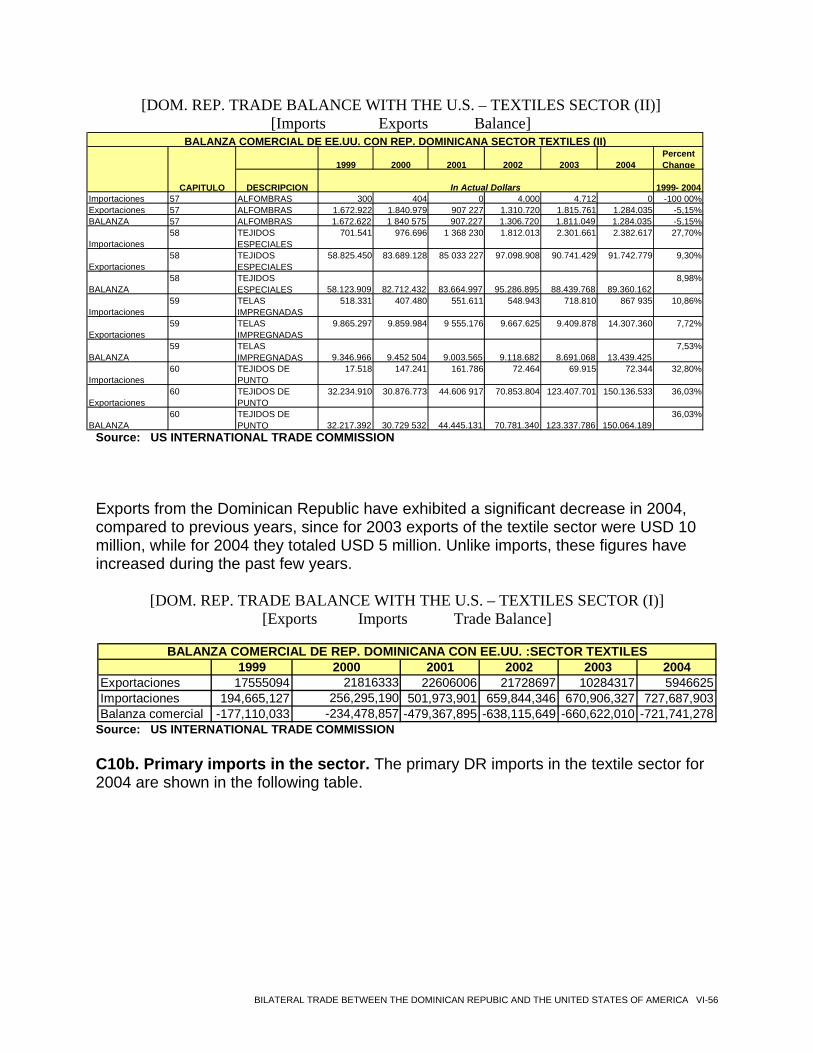
[DOM. REP. TRADE BALANCE WITH THE U.S. – TEXTILES SECTOR (II)] [Imports Exports Balance]
1999 2000 2001 2002 2003 2004Percent Change
DESCRIPCION 1999- 2004Importaciones 57 ALFOMBRAS 300 404 0 4.000 4.712 0 -100 00%Exportaciones 57 ALFOMBRAS 1.672.922 1.840.979 907 227 1.310.720 1.815.761 1.284.035 -5,15%BALANZA 57 ALFOMBRAS 1.672.622 1 840 575 907.227 1.306.720 1.811.049 1.284.035 -5,15%
Importaciones58 TEJIDOS
ESPECIALES701.541 976.696 1 368 230 1.812.013 2.301.661 2.382.617 27,70%
Exportaciones58 TEJIDOS
ESPECIALES58.825.450 83.689.128 85 033 227 97.098.908 90.741.429 91.742.779 9,30%
BALANZA 58 TEJIDOS
ESPECIALES 58.123.909 82.712.432 83.664.997 95.286.895 88.439.768 89.360.1628,98%
Importaciones59 TELAS
IMPREGNADAS518.331 407.480 551.611 548.943 718.810 867 935 10,86%
Exportaciones59 TELAS
IMPREGNADAS9.865.297 9.859.984 9 555.176 9.667.625 9.409.878 14.307.360 7,72%
BALANZA 59 TELAS
IMPREGNADAS 9.346.966 9.452 504 9.003.565 9.118.682 8.691.068 13.439.4257,53%
Importaciones60 TEJIDOS DE
PUNTO17.518 147.241 161.786 72.464 69.915 72.344 32,80%
Exportaciones60 TEJIDOS DE
PUNTO32.234.910 30.876.773 44.606 917 70.853.804 123.407.701 150.136.533 36,03%
BALANZA 60 TEJIDOS DE
PUNTO 32.217.392 30.729 532 44.445.131 70.781.340 123.337.786 150.064.18936,03%
BALANZA COMERCIAL DE EE.UU. CON REP. DOMINICANA SECTOR TEXTILES (II)
CAPITULO In Actual Dollars
Source: US INTERNATIONAL TRADE COMMISSION Exports from the Dominican Republic have exhibited a significant decrease in 2004, compared to previous years, since for 2003 exports of the textile sector were USD 10 million, while for 2004 they totaled USD 5 million. Unlike imports, these figures have increased during the past few years.
[DOM. REP. TRADE BALANCE WITH THE U.S. – TEXTILES SECTOR (I)] [Exports Imports Trade Balance]
1999 2000 2001 2002 2003 2004Exportaciones 17555094 21816333 22606006 21728697 10284317 5946625Importaciones 194,665,127 256,295,190 501,973,901 659,844,346 670,906,327 727,687,903Balanza comercial -177,110,033 -234,478,857 -479,367,895 -638,115,649 -660,622,010 -721,741,278
BALANZA COMERCIAL DE REP. DOMINICANA CON EE.UU. :SECTOR TEXTILES
Source: US INTERNATIONAL TRADE COMMISSION
C10b. Primary imports in the sector. The primary DR imports in the textile sector for 2004 are shown in the following table.
BILATERAL TRADE BETWEEN THE DOMINICAN REPUBIC AND THE UNITED STATES OF AMERICA VI-56
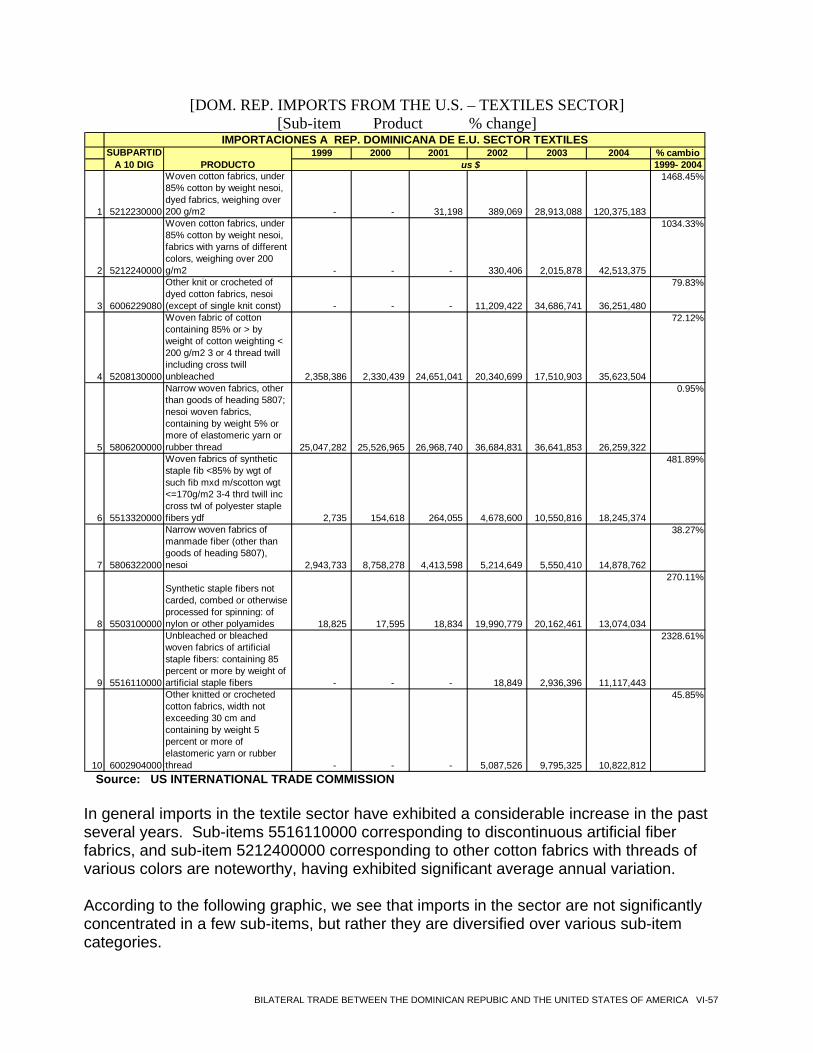
[DOM. REP. IMPORTS FROM THE U.S. – TEXTILES SECTOR] [Sub-item Product % change]
1999 2000 2001 2002 2003 2004 % cambio1999- 2004
1 5212230000
Woven cotton fabrics, under 85% cotton by weight nesoi, dyed fabrics, weighing over 200 g/m2 - - 31,198 389,069 28,913,088 120,375,183
1468.45%
2 5212240000
Woven cotton fabrics, under 85% cotton by weight nesoi, fabrics with yarns of different colors, weighing over 200 g/m2 - - - 330,406 2,015,878 42,513,375
1034.33%
3 6006229080
Other knit or crocheted of dyed cotton fabrics, nesoi (except of single knit const) - - - 11,209,422 34,686,741 36,251,480
79.83%
4 5208130000
Woven fabric of cotton containing 85% or > by weight of cotton weighting < 200 g/m2 3 or 4 thread twill including cross twill unbleached 2,358,386 2,330,439 24,651,041 20,340,699 17,510,903 35,623,504
72.12%
5 5806200000
Narrow woven fabrics, other than goods of heading 5807; nesoi woven fabrics, containing by weight 5% or more of elastomeric yarn or rubber thread 25,047,282 25,526,965 26,968,740 36,684,831 36,641,853 26,259,322
0.95%
6 5513320000
Woven fabrics of synthetic staple fib <85% by wgt of such fib mxd m/scotton wgt <=170g/m2 3-4 thrd twill inc cross twl of polyester staple fibers ydf 2,735 154,618 264,055 4,678,600 10,550,816 18,245,374
481.89%
7 5806322000
Narrow woven fabrics of manmade fiber (other than goods of heading 5807), nesoi 2,943,733 8,758,278 4,413,598 5,214,649 5,550,410 14,878,762
38.27%
8 5503100000
Synthetic staple fibers not carded, combed or otherwise processed for spinning: of nylon or other polyamides 18,825 17,595 18,834 19,990,779 20,162,461 13,074,034
270.11%
9 5516110000
Unbleached or bleached woven fabrics of artificial staple fibers: containing 85 percent or more by weight of artificial staple fibers - - - 18,849 2,936,396 11,117,443
2328.61%
10 6002904000
Other knitted or crocheted cotton fabrics, width not exceeding 30 cm and containing by weight 5 percent or more of elastomeric yarn or rubber thread - - - 5,087,526 9,795,325 10,822,812
45.85%
IMPORTACIONES A REP. DOMINICANA DE E.U. SECTOR TEXTILESSUBPARTID
A 10 DIG PRODUCTO us $
Source: US INTERNATIONAL TRADE COMMISSION
In general imports in the textile sector have exhibited a considerable increase in the past several years. Sub-items 5516110000 corresponding to discontinuous artificial fiber fabrics, and sub-item 5212400000 corresponding to other cotton fabrics with threads of various colors are noteworthy, having exhibited significant average annual variation. According to the following graphic, we see that imports in the sector are not significantly concentrated in a few sub-items, but rather they are diversified over various sub-item categories.
BILATERAL TRADE BETWEEN THE DOMINICAN REPUBIC AND THE UNITED STATES OF AMERICA VI-57
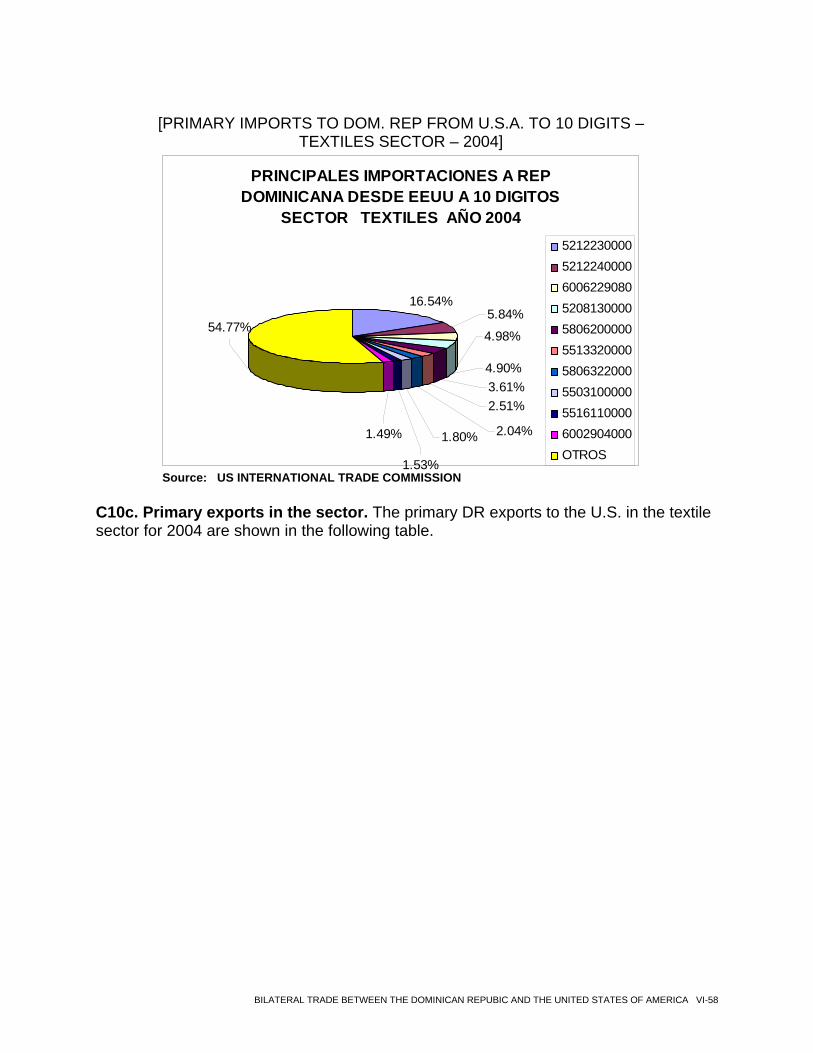
[PRIMARY IMPORTS TO DOM. REP FROM U.S.A. TO 10 DIGITS –
TEXTILES SECTOR – 2004]
PRINCIPALES IMPORTACIONES A REP DOMINICANA DESDE EEUU A 10 DIGITOS
SECTOR TEXTILES AÑO 2004
16.54%
2.51%
4.90%3.61%
4.98%
2.04%1.80%
1.53%
1.49%
54.77%5.84%
5212230000521224000060062290805208130000580620000055133200005806322000550310000055161100006002904000OTROS
Source: US INTERNATIONAL TRADE COMMISSION
C10c. Primary exports in the sector. The primary DR exports to the U.S. in the textile sector for 2004 are shown in the following table.
BILATERAL TRADE BETWEEN THE DOMINICAN REPUBIC AND THE UNITED STATES OF AMERICA VI-58
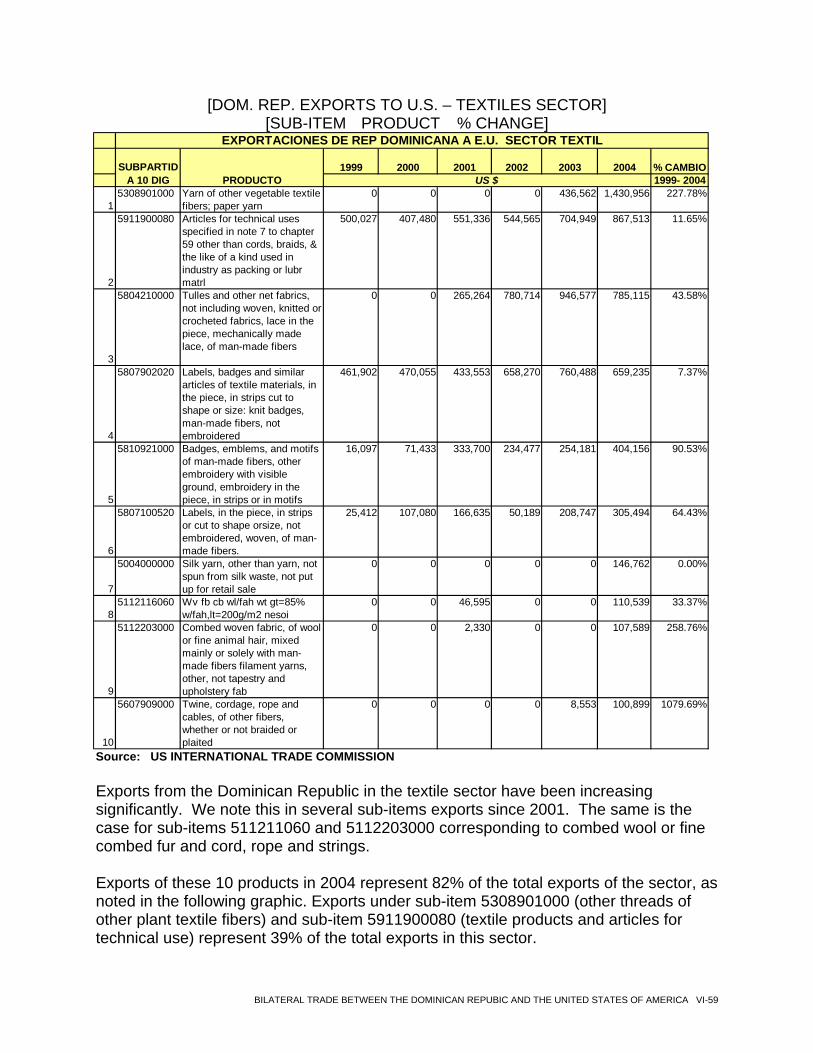
[DOM. REP. EXPORTS TO U.S. – TEXTILES SECTOR] [SUB-ITEM PRODUCT % CHANGE]
1999 2000 2001 2002 2003 2004 % CAMBIO1999- 2004
15308901000 Yarn of other vegetable textile
fibers; paper yarn0 0 0 0 436,562 1,430,956 227.78%
2
5911900080 Articles for technical uses specified in note 7 to chapter 59 other than cords, braids, & the like of a kind used in industry as packing or lubr matrl
500,027 407,480 551,336 544,565 704,949 867,513 11.65%
3
5804210000 Tulles and other net fabrics, not including woven, knitted or crocheted fabrics, lace in the piece, mechanically made lace, of man-made fibers
0 0 265,264 780,714 946,577 785,115 43.58%
4
5807902020 Labels, badges and similar articles of textile materials, in the piece, in strips cut to shape or size: knit badges, man-made fibers, not embroidered
461,902 470,055 433,553 658,270 760,488 659,235 7.37%
5
5810921000 Badges, emblems, and motifs of man-made fibers, other embroidery with visible ground, embroidery in the piece, in strips or in motifs
16,097 71,433 333,700 234,477 254,181 404,156 90.53%
6
5807100520 Labels, in the piece, in strips or cut to shape orsize, not embroidered, woven, of man-made fibers.
25,412 107,080 166,635 50,189 208,747 305,494 64.43%
7
5004000000 Silk yarn, other than yarn, not spun from silk waste, not put up for retail sale
0 0 0 0 0 146,762 0.00%
85112116060 Wv fb cb wl/fah wt gt=85%
w/fah,lt=200g/m2 nesoi0 0 46,595 0 0 110,539 33.37%
9
5112203000 Combed woven fabric, of wool or fine animal hair, mixed mainly or solely with man-made fibers filament yarns, other, not tapestry and upholstery fab
0 0 2,330 0 0 107,589 258.76%
10
5607909000 Twine, cordage, rope and cables, of other fibers, whether or not braided or plaited
0 0 0 0 8,553 100,899 1079.69%
EXPORTACIONES DE REP DOMINICANA A E.U. SECTOR TEXTIL
SUBPARTIDA 10 DIG PRODUCTO US $
Source: US INTERNATIONAL TRADE COMMISSION
Exports from the Dominican Republic in the textile sector have been increasing significantly. We note this in several sub-items exports since 2001. The same is the case for sub-items 511211060 and 5112203000 corresponding to combed wool or fine combed fur and cord, rope and strings.
Exports of these 10 products in 2004 represent 82% of the total exports of the sector, as noted in the following graphic. Exports under sub-item 5308901000 (other threads of other plant textile fibers) and sub-item 5911900080 (textile products and articles for technical use) represent 39% of the total exports in this sector.
BILATERAL TRADE BETWEEN THE DOMINICAN REPUBIC AND THE UNITED STATES OF AMERICA VI-59
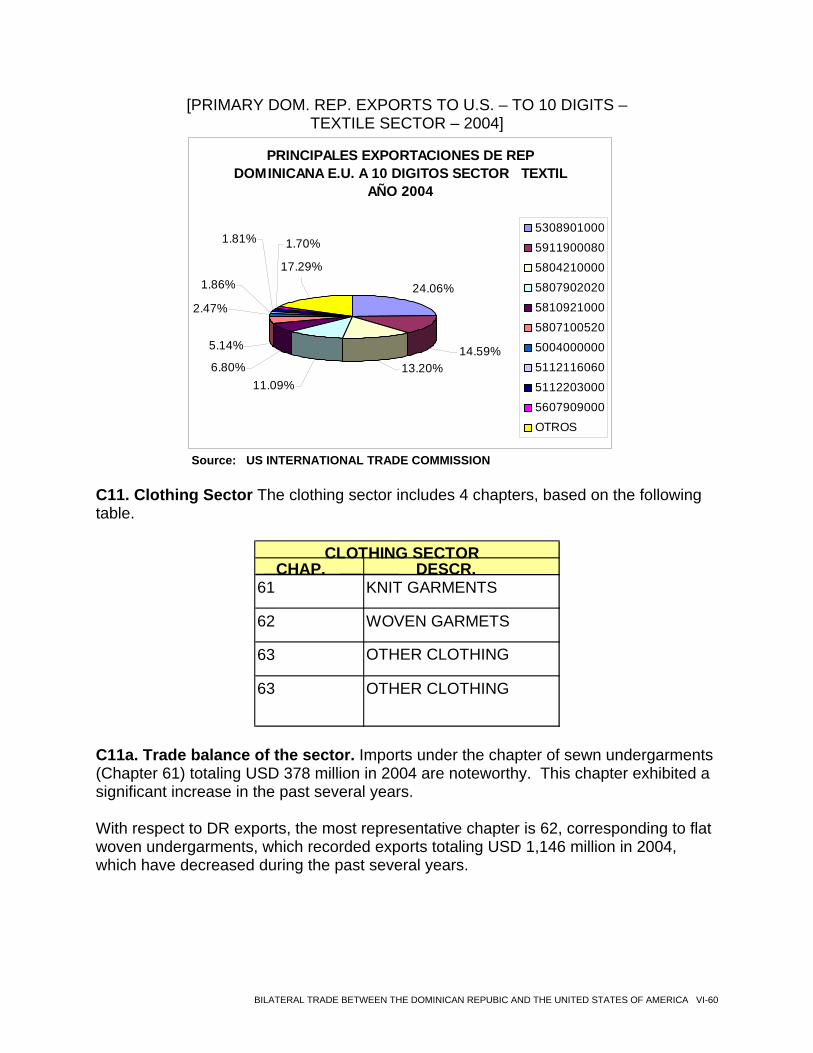
[PRIMARY DOM. REP. EXPORTS TO U.S. – TO 10 DIGITS – TEXTILE SECTOR – 2004]
PRINCIPALES EXPORTACIONES DE REP DOMINICANA E.U. A 10 DIGITOS SECTOR TEXTIL
AÑO 2004
24.06%
14.59%
17.29%
1.70%1.81%
1.86%
2.47%
13.20%6.80%11.09%
5.14%
5308901000
5911900080
5804210000
5807902020
5810921000
5807100520
5004000000
5112116060
5112203000
5607909000OTROS
Source: US INTERNATIONAL TRADE COMMISSION
C11. Clothing Sector The clothing sector includes 4 chapters, based on the following table.
CHAP. DESCR.
61 KNIT GARMENTS
62 WOVEN GARMETS
63 OTHER CLOTHING
63 OTHER CLOTHING
CLOTHING SECTOR
C11a. Trade balance of the sector. Imports under the chapter of sewn undergarments (Chapter 61) totaling USD 378 million in 2004 are noteworthy. This chapter exhibited a significant increase in the past several years. With respect to DR exports, the most representative chapter is 62, corresponding to flat woven undergarments, which recorded exports totaling USD 1,146 million in 2004, which have decreased during the past several years.
BILATERAL TRADE BETWEEN THE DOMINICAN REPUBIC AND THE UNITED STATES OF AMERICA VI-60
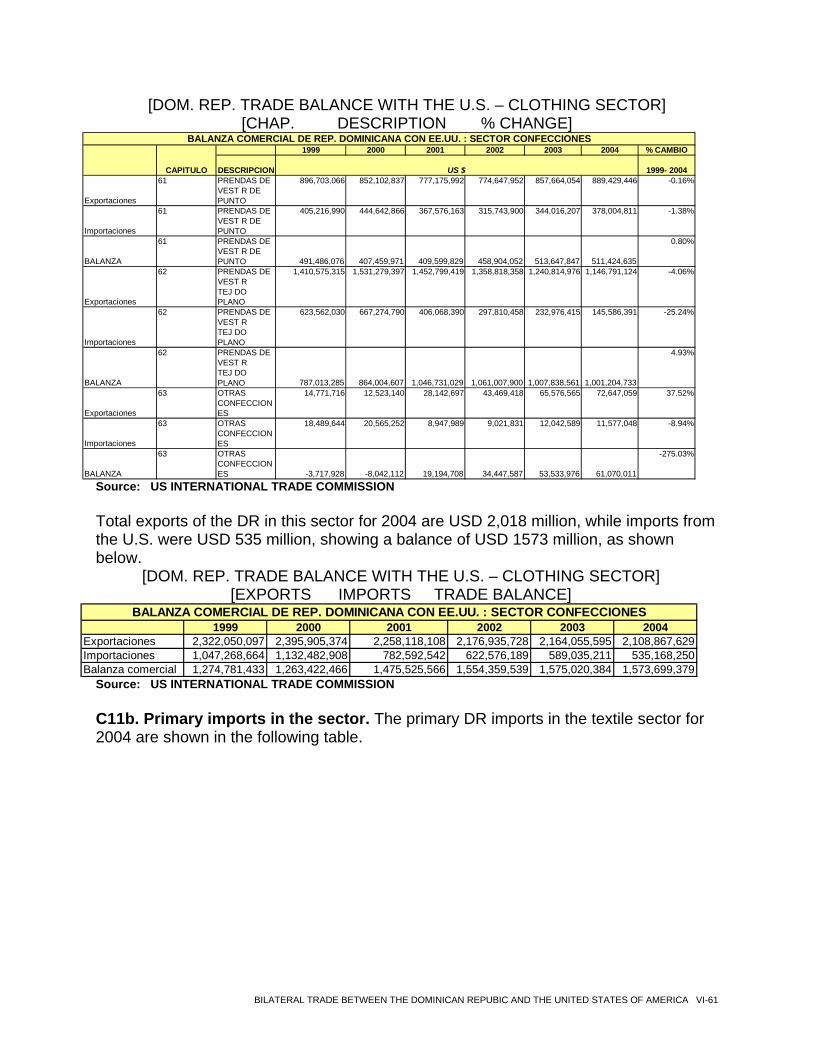
[DOM. REP. TRADE BALANCE WITH THE U.S. – CLOTHING SECTOR] [CHAP. DESCRIPTION % CHANGE]
1999 2000 2001 2002 2003 2004 % CAMBIO
DESCRIPCION 1999- 2004
Exportaciones
61 PRENDAS DE VEST R DE PUNTO
896,703,066 852,102,837 777,175,992 774,647,952 857,664,054 889,429,446 -0.16%
Importaciones
61 PRENDAS DE VEST R DE PUNTO
405,216,990 444,642,866 367,576,163 315,743,900 344,016,207 378,004,811 -1.38%
BALANZA
61 PRENDAS DE VEST R DE PUNTO 491,486,076 407,459,971 409,599,829 458,904,052 513,647,847 511,424,635
0.80%
Exportaciones
62 PRENDAS DE VEST R TEJ DO PLANO
1,410,575,315 1,531,279,397 1,452,799,419 1,358,818,358 1,240,814,976 1,146,791,124 -4.06%
Importaciones
62 PRENDAS DE VEST R TEJ DO PLANO
623,562,030 667,274,790 406,068,390 297,810,458 232,976,415 145,586,391 -25.24%
BALANZA
62 PRENDAS DE VEST R TEJ DO PLANO 787,013,285 864,004,607 1,046,731,029 1,061,007,900 1,007,838,561 1,001,204,733
4.93%
Exportaciones
63 OTRAS CONFECCIONES
14,771,716 12,523,140 28,142,697 43,469,418 65,576,565 72,647,059 37.52%
Importaciones
63 OTRAS CONFECCIONES
18,489,644 20,565,252 8,947,989 9,021,831 12,042,589 11,577,048 -8.94%
BALANZA
63 OTRAS CONFECCIONES -3,717,928 -8,042,112 19,194,708 34,447,587 53,533,976 61,070,011
-275.03%
BALANZA COMERCIAL DE REP. DOMINICANA CON EE.UU. : SECTOR CONFECCIONES
CAPITULO US $
Source: US INTERNATIONAL TRADE COMMISSION
Total exports of the DR in this sector for 2004 are USD 2,018 million, while imports from the U.S. were USD 535 million, showing a balance of USD 1573 million, as shown below.
[DOM. REP. TRADE BALANCE WITH THE U.S. – CLOTHING SECTOR] [EXPORTS IMPORTS TRADE BALANCE]
1999 2000 2001 2002 2003 2004Exportaciones 2,322,050,097 2,395,905,374 2,258,118,108 2,176,935,728 2,164,055,595 2,108,867,629Importaciones 1,047,268,664 1,132,482,908 782,592,542 622,576,189 589,035,211 535,168,250Balanza comercial 1,274,781,433 1,263,422,466 1,475,525,566 1,554,359,539 1,575,020,384 1,573,699,379
BALANZA COMERCIAL DE REP. DOMINICANA CON EE.UU. : SECTOR CONFECCIONES
Source: US INTERNATIONAL TRADE COMMISSION
C11b. Primary imports in the sector. The primary DR imports in the textile sector for 2004 are shown in the following table.
BILATERAL TRADE BETWEEN THE DOMINICAN REPUBIC AND THE UNITED STATES OF AMERICA VI-61
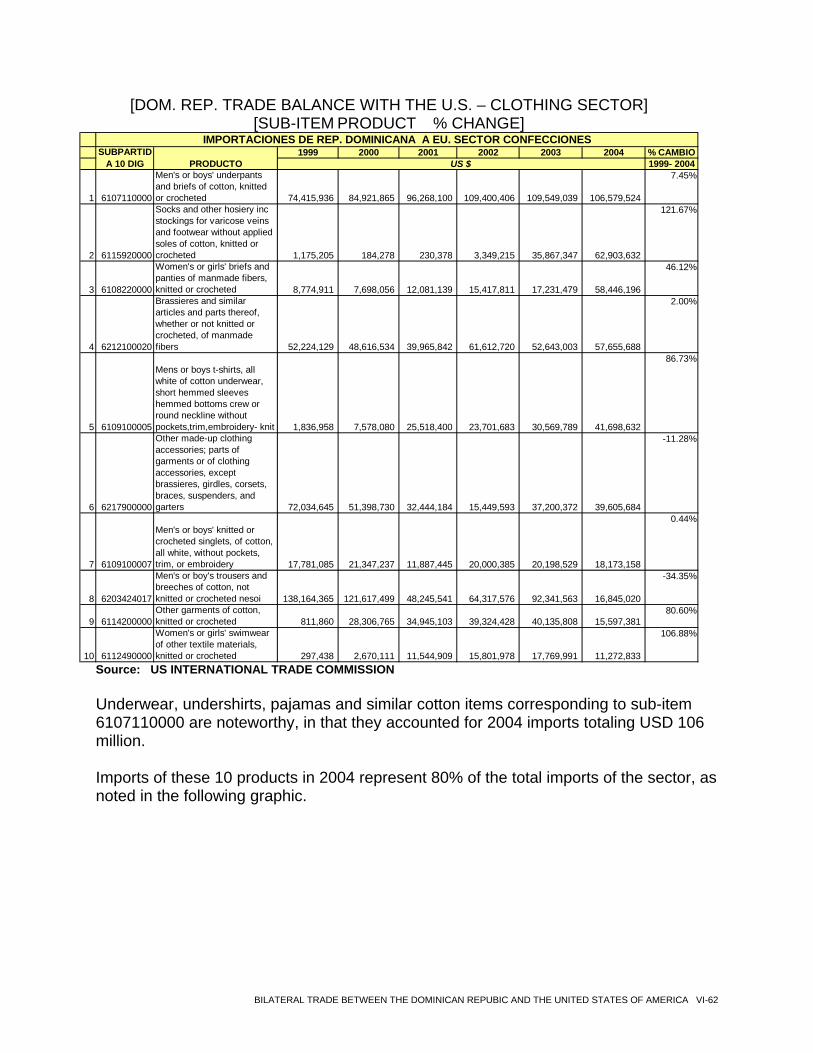
[DOM. REP. TRADE BALANCE WITH THE U.S. – CLOTHING SECTOR] [SUB-ITEM PRODUCT % CHANGE]
1999 2000 2001 2002 2003 2004 % CAMBIO1999- 2004
1 6107110000
Men's or boys' underpants and briefs of cotton, knitted or crocheted 74,415,936 84,921,865 96,268,100 109,400,406 109,549,039 106,579,524
7.45%
2 6115920000
Socks and other hosiery inc stockings for varicose veins and footwear without applied soles of cotton, knitted or crocheted 1,175,205 184,278 230,378 3,349,215 35,867,347 62,903,632
121.67%
3 6108220000
Women's or girls' briefs and panties of manmade fibers, knitted or crocheted 8,774,911 7,698,056 12,081,139 15,417,811 17,231,479 58,446,196
46.12%
4 6212100020
Brassieres and similar articles and parts thereof, whether or not knitted or crocheted, of manmade fibers 52,224,129 48,616,534 39,965,842 61,612,720 52,643,003 57,655,688
2.00%
5 6109100005
Mens or boys t-shirts, all white of cotton underwear, short hemmed sleeves hemmed bottoms crew or round neckline without pockets,trim,embroidery- knit 1,836,958 7,578,080 25,518,400 23,701,683 30,569,789 41,698,632
86.73%
6 6217900000
Other made-up clothing accessories; parts of garments or of clothing accessories, except brassieres, girdles, corsets, braces, suspenders, and garters 72,034,645 51,398,730 32,444,184 15,449,593 37,200,372 39,605,684
-11.28%
7 6109100007
Men's or boys' knitted or crocheted singlets, of cotton, all white, without pockets, trim, or embroidery 17,781,085 21,347,237 11,887,445 20,000,385 20,198,529 18,173,158
0.44%
8 6203424017
Men's or boy's trousers and breeches of cotton, not knitted or crocheted nesoi 138,164,365 121,617,499 48,245,541 64,317,576 92,341,563 16,845,020
-34.35%
9 6114200000Other garments of cotton, knitted or crocheted 811,860 28,306,765 34,945,103 39,324,428 40,135,808 15,597,381
80.60%
10 6112490000
Women's or girls' swimwear of other textile materials, knitted or crocheted 297,438 2,670,111 11,544,909 15,801,978 17,769,991 11,272,833
106.88%
IMPORTACIONES DE REP. DOMINICANA A EU. SECTOR CONFECCIONESSUBPARTID
A 10 DIG PRODUCTO US $
Source: US INTERNATIONAL TRADE COMMISSION
Underwear, undershirts, pajamas and similar cotton items corresponding to sub-item 6107110000 are noteworthy, in that they accounted for 2004 imports totaling USD 106 million. Imports of these 10 products in 2004 represent 80% of the total imports of the sector, as noted in the following graphic.
BILATERAL TRADE BETWEEN THE DOMINICAN REPUBIC AND THE UNITED STATES OF AMERICA VI-62
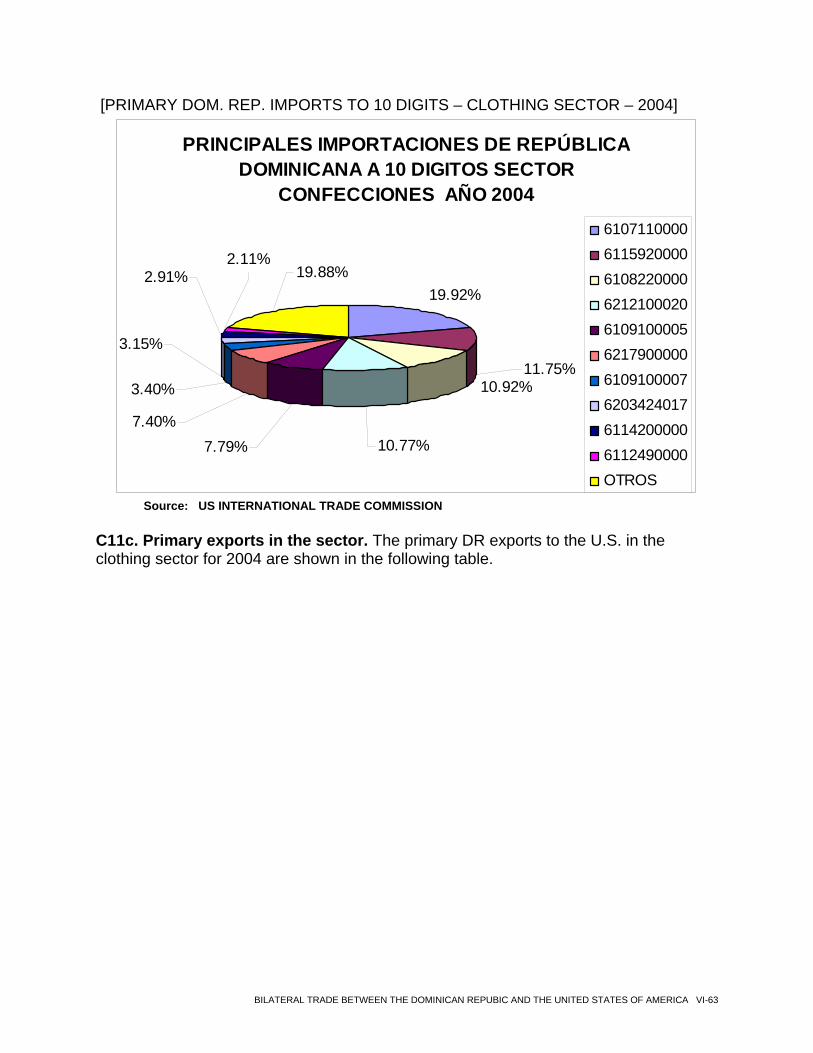
[PRIMARY DOM. REP. IMPORTS TO 10 DIGITS – CLOTHING SECTOR – 2004]
PRINCIPALES IMPORTACIONES DE REPÚBLICA DOMINICANA A 10 DIGITOS SECTOR
CONFECCIONES AÑO 2004
19.92%
11.75%
19.88%2.11%
2.91%
3.15%
3.40% 10.92%
7.79% 10.77%7.40%
6107110000611592000061082200006212100020610910000562179000006109100007620342401761142000006112490000OTROS
Source: US INTERNATIONAL TRADE COMMISSION
C11c. Primary exports in the sector. The primary DR exports to the U.S. in the clothing sector for 2004 are shown in the following table.
BILATERAL TRADE BETWEEN THE DOMINICAN REPUBIC AND THE UNITED STATES OF AMERICA VI-63
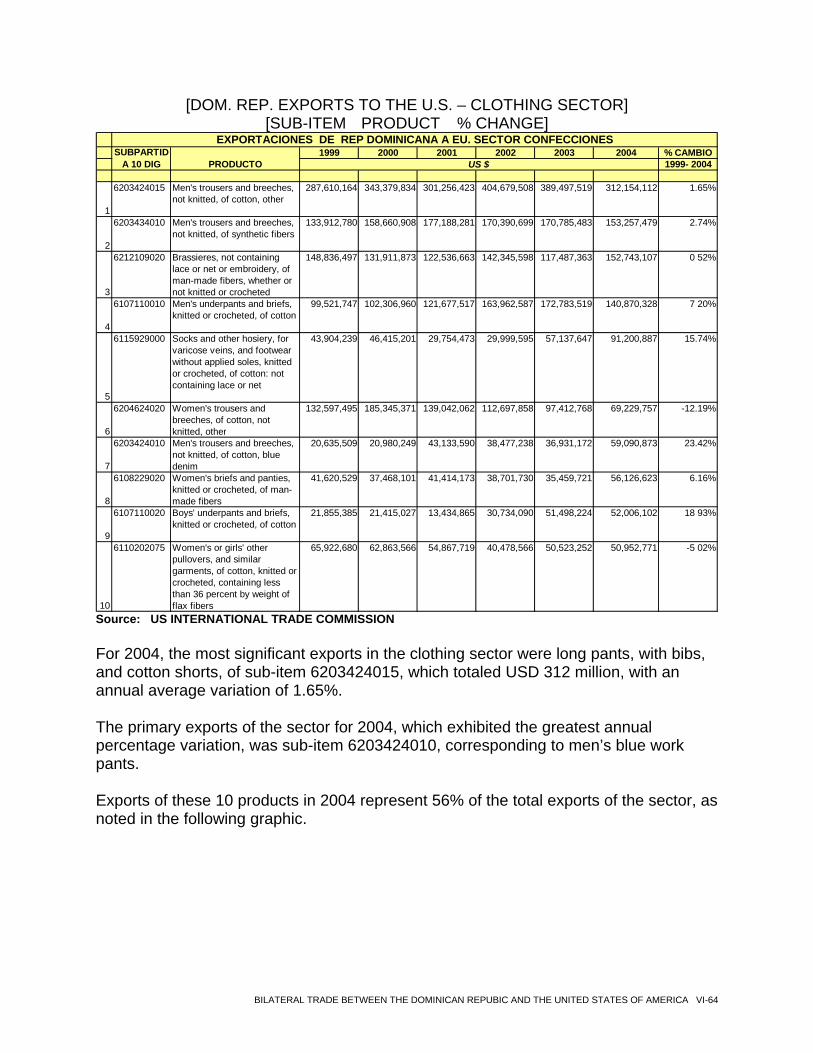
[DOM. REP. EXPORTS TO THE U.S. – CLOTHING SECTOR] [SUB-ITEM PRODUCT % CHANGE]
1999 2000 2001 2002 2003 2004 % CAMBIO1999- 2004
1
6203424015 Men's trousers and breeches, not knitted, of cotton, other
287,610,164 343,379,834 301,256,423 404,679,508 389,497,519 312,154,112 1.65%
2
6203434010 Men's trousers and breeches, not knitted, of synthetic fibers
133,912,780 158,660,908 177,188,281 170,390,699 170,785,483 153,257,479 2.74%
3
6212109020 Brassieres, not containing lace or net or embroidery, of man-made fibers, whether or not knitted or crocheted
148,836,497 131,911,873 122,536,663 142,345,598 117,487,363 152,743,107 0 52%
4
6107110010 Men's underpants and briefs, knitted or crocheted, of cotton
99,521,747 102,306,960 121,677,517 163,962,587 172,783,519 140,870,328 7 20%
5
6115929000 Socks and other hosiery, for varicose veins, and footwear without applied soles, knitted or crocheted, of cotton: not containing lace or net
43,904,239 46,415,201 29,754,473 29,999,595 57,137,647 91,200,887 15.74%
6
6204624020 Women's trousers and breeches, of cotton, not knitted, other
132,597,495 185,345,371 139,042,062 112,697,858 97,412,768 69,229,757 -12.19%
7
6203424010 Men's trousers and breeches, not knitted, of cotton, blue denim
20,635,509 20,980,249 43,133,590 38,477,238 36,931,172 59,090,873 23.42%
8
6108229020 Women's briefs and panties, knitted or crocheted, of man-made fibers
41,620,529 37,468,101 41,414,173 38,701,730 35,459,721 56,126,623 6.16%
9
6107110020 Boys' underpants and briefs, knitted or crocheted, of cotton
21,855,385 21,415,027 13,434,865 30,734,090 51,498,224 52,006,102 18 93%
10
6110202075 Women's or girls' other pullovers, and similar garments, of cotton, knitted or crocheted, containing less than 36 percent by weight of flax fibers
65,922,680 62,863,566 54,867,719 40,478,566 50,523,252 50,952,771 -5 02%
EXPORTACIONES DE REP DOMINICANA A EU. SECTOR CONFECCIONESSUBPARTID
A 10 DIG PRODUCTO US $
Source: US INTERNATIONAL TRADE COMMISSION
For 2004, the most significant exports in the clothing sector were long pants, with bibs, and cotton shorts, of sub-item 6203424015, which totaled USD 312 million, with an annual average variation of 1.65%.
The primary exports of the sector for 2004, which exhibited the greatest annual percentage variation, was sub-item 6203424010, corresponding to men’s blue work pants.
Exports of these 10 products in 2004 represent 56% of the total exports of the sector, as noted in the following graphic.
BILATERAL TRADE BETWEEN THE DOMINICAN REPUBIC AND THE UNITED STATES OF AMERICA VI-64
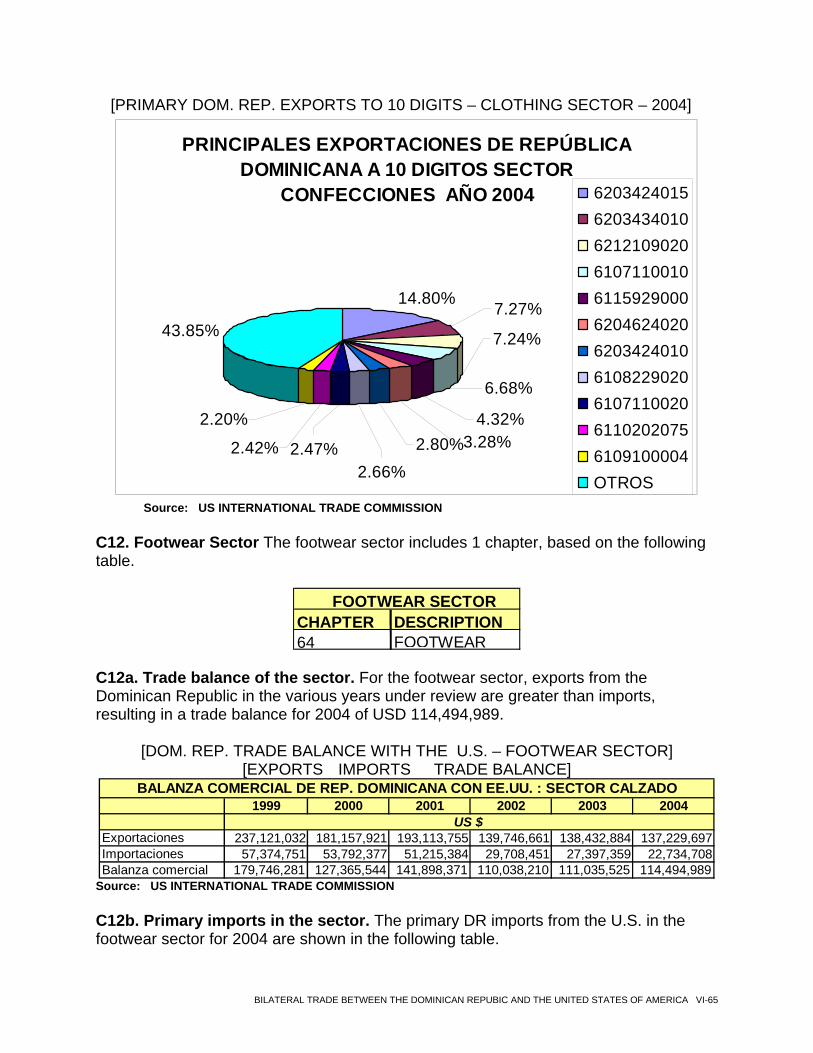
[PRIMARY DOM. REP. EXPORTS TO 10 DIGITS – CLOTHING SECTOR – 2004]
PRINCIPALES EXPORTACIONES DE REPÚBLICA DOMINICANA A 10 DIGITOS SECTOR
CONFECCIONES AÑO 2004
14.80%
43.85%
3.28%
6.68%
4.32%
7.24%
2.80%2.66%
2.47%2.42%
2.20%
7.27%
62034240156203434010621210902061071100106115929000620462402062034240106108229020610711002061102020756109100004OTROS
Source: US INTERNATIONAL TRADE COMMISSION
C12. Footwear Sector The footwear sector includes 1 chapter, based on the following table.
CHAPTER DESCRIPTION 64 FOOTWEAR
FOOTWEAR SECTOR
C12a. Trade balance of the sector. For the footwear sector, exports from the Dominican Republic in the various years under review are greater than imports, resulting in a trade balance for 2004 of USD 114,494,989.
[DOM. REP. TRADE BALANCE WITH THE U.S. – FOOTWEAR SECTOR] [EXPORTS IMPORTS TRADE BALANCE]
1999 2000 2001 2002 2003 2004
Exportaciones 237,121,032 181,157,921 193,113,755 139,746,661 138,432,884 137,229,697Importaciones 57,374,751 53,792,377 51,215,384 29,708,451 27,397,359 22,734,708Balanza comercial 179,746,281 127,365,544 141,898,371 110,038,210 111,035,525 114,494,989
US $
BALANZA COMERCIAL DE REP. DOMINICANA CON EE.UU. : SECTOR CALZADO
Source: US INTERNATIONAL TRADE COMMISSION C12b. Primary imports in the sector. The primary DR imports from the U.S. in the footwear sector for 2004 are shown in the following table.
BILATERAL TRADE BETWEEN THE DOMINICAN REPUBIC AND THE UNITED STATES OF AMERICA VI-65
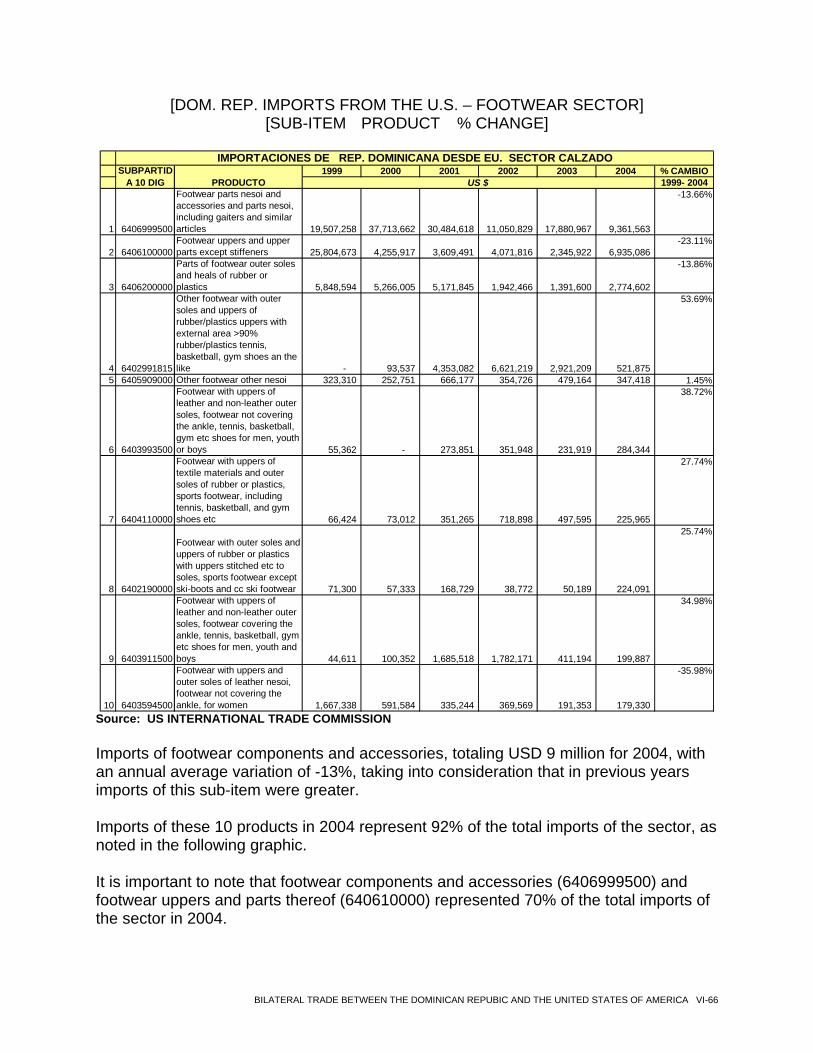
[DOM. REP. IMPORTS FROM THE U.S. – FOOTWEAR SECTOR] [SUB-ITEM PRODUCT % CHANGE]
1999 2000 2001 2002 2003 2004 % CAMBIO1999- 2004
1 6406999500
Footwear parts nesoi and accessories and parts nesoi, including gaiters and similar articles 19,507,258 37,713,662 30,484,618 11,050,829 17,880,967 9,361,563
-13.66%
2 6406100000Footwear uppers and upper parts except stiffeners 25,804,673 4,255,917 3,609,491 4,071,816 2,345,922 6,935,086
-23.11%
3 6406200000
Parts of footwear outer soles and heals of rubber or plastics 5,848,594 5,266,005 5,171,845 1,942,466 1,391,600 2,774,602
-13.86%
4 6402991815
Other footwear with outer soles and uppers of rubber/plastics uppers with external area >90% rubber/plastics tennis, basketball, gym shoes an the like - 93,537 4,353,082 6,621,219 2,921,209 521,875
53.69%
5 6405909000 Other footwear other nesoi 323,310 252,751 666,177 354,726 479,164 347,418 1.45%
6 6403993500
Footwear with uppers of leather and non-leather outer soles, footwear not covering the ankle, tennis, basketball, gym etc shoes for men, youth or boys 55,362 - 273,851 351,948 231,919 284,344
38.72%
7 6404110000
Footwear with uppers of textile materials and outer soles of rubber or plastics, sports footwear, including tennis, basketball, and gym shoes etc 66,424 73,012 351,265 718,898 497,595 225,965
27.74%
8 6402190000
Footwear with outer soles and uppers of rubber or plastics with uppers stitched etc to soles, sports footwear except ski-boots and cc ski footwear 71,300 57,333 168,729 38,772 50,189 224,091
25.74%
9 6403911500
Footwear with uppers of leather and non-leather outer soles, footwear covering the ankle, tennis, basketball, gym etc shoes for men, youth and boys 44,611 100,352 1,685,518 1,782,171 411,194 199,887
34.98%
10 6403594500
Footwear with uppers and outer soles of leather nesoi, footwear not covering the ankle, for women 1,667,338 591,584 335,244 369,569 191,353 179,330
-35.98%
IMPORTACIONES DE REP. DOMINICANA DESDE EU. SECTOR CALZADOSUBPARTID
A 10 DIG PRODUCTO US $
Source: US INTERNATIONAL TRADE COMMISSION Imports of footwear components and accessories, totaling USD 9 million for 2004, with an annual average variation of -13%, taking into consideration that in previous years imports of this sub-item were greater. Imports of these 10 products in 2004 represent 92% of the total imports of the sector, as noted in the following graphic. It is important to note that footwear components and accessories (6406999500) and footwear uppers and parts thereof (640610000) represented 70% of the total imports of the sector in 2004.
BILATERAL TRADE BETWEEN THE DOMINICAN REPUBIC AND THE UNITED STATES OF AMERICA VI-66
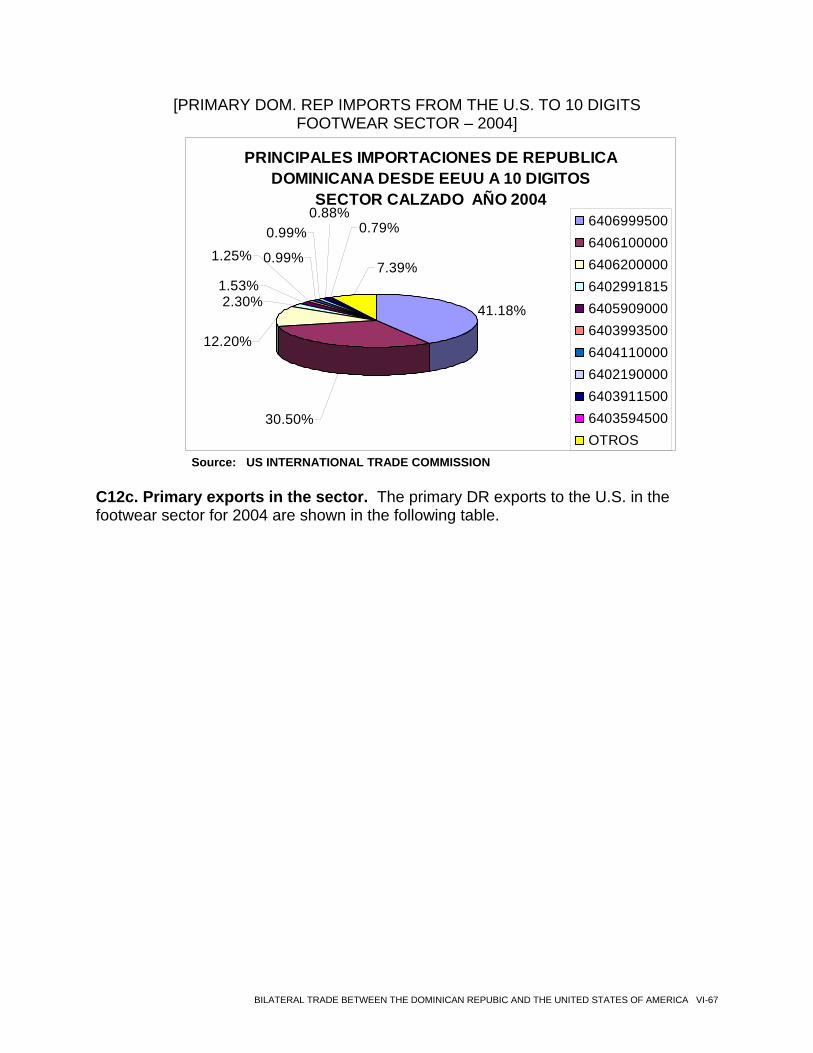
[PRIMARY DOM. REP IMPORTS FROM THE U.S. TO 10 DIGITS FOOTWEAR SECTOR – 2004]
PRINCIPALES IMPORTACIONES DE REPUBLICA DOMINICANA DESDE EEUU A 10 DIGITOS
SECTOR CALZADO AÑO 2004
41.18%
30.50%
7.39%
0.79%0.88%
0.99%
0.99%
12.20%
1.53%2.30%
1.25%
6406999500640610000064062000006402991815640590900064039935006404110000640219000064039115006403594500OTROS
Source: US INTERNATIONAL TRADE COMMISSION
C12c. Primary exports in the sector. The primary DR exports to the U.S. in the footwear sector for 2004 are shown in the following table.
BILATERAL TRADE BETWEEN THE DOMINICAN REPUBIC AND THE UNITED STATES OF AMERICA VI-67
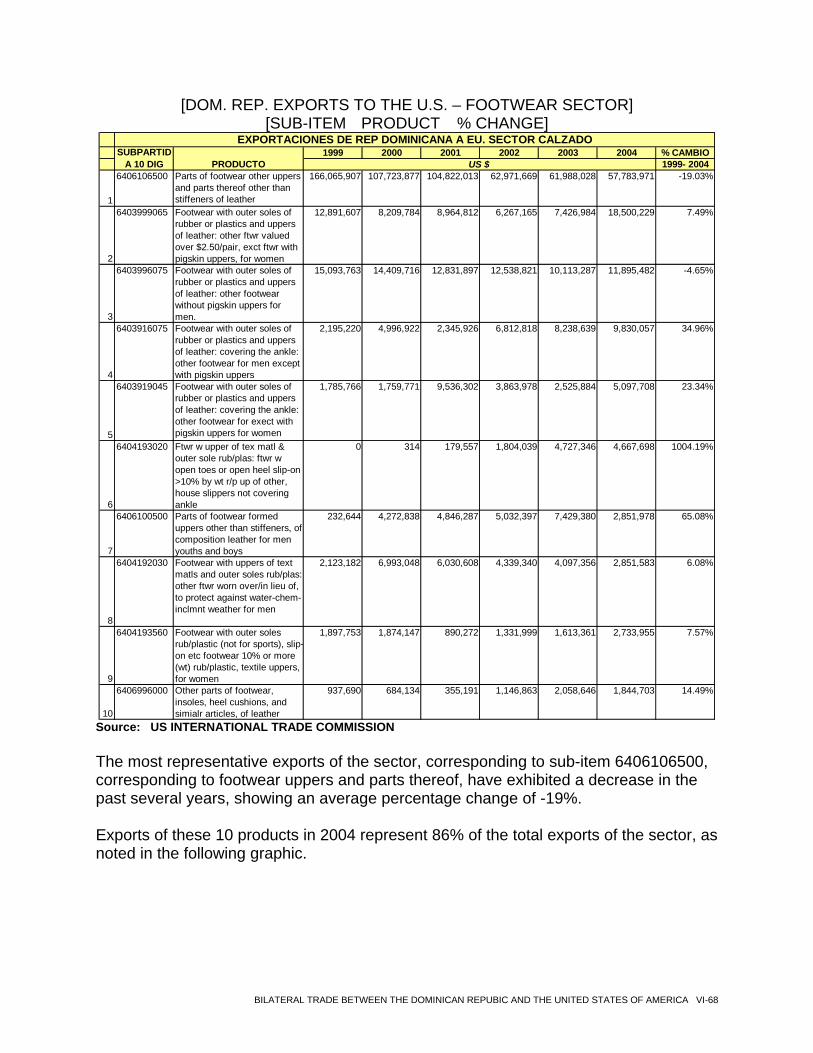
[DOM. REP. EXPORTS TO THE U.S. – FOOTWEAR SECTOR] [SUB-ITEM PRODUCT % CHANGE]
1999 2000 2001 2002 2003 2004 % CAMBIO1999- 2004
1
6406106500 Parts of footwear other uppers and parts thereof other than stiffeners of leather
166,065,907 107,723,877 104,822,013 62,971,669 61,988,028 57,783,971 -19.03%
2
6403999065 Footwear with outer soles of rubber or plastics and uppers of leather: other ftwr valued over $2.50/pair, exct ftwr with pigskin uppers, for women
12,891,607 8,209,784 8,964,812 6,267,165 7,426,984 18,500,229 7.49%
3
6403996075 Footwear with outer soles of rubber or plastics and uppers of leather: other footwear without pigskin uppers for men.
15,093,763 14,409,716 12,831,897 12,538,821 10,113,287 11,895,482 -4.65%
4
6403916075 Footwear with outer soles of rubber or plastics and uppers of leather: covering the ankle: other footwear for men except with pigskin uppers
2,195,220 4,996,922 2,345,926 6,812,818 8,238,639 9,830,057 34.96%
5
6403919045 Footwear with outer soles of rubber or plastics and uppers of leather: covering the ankle: other footwear for exect with pigskin uppers for women
1,785,766 1,759,771 9,536,302 3,863,978 2,525,884 5,097,708 23.34%
6
6404193020 Ftwr w upper of tex matl & outer sole rub/plas: ftwr w open toes or open heel slip-on >10% by wt r/p up of other, house slippers not covering ankle
0 314 179,557 1,804,039 4,727,346 4,667,698 1004.19%
7
6406100500 Parts of footwear formed uppers other than stiffeners, of composition leather for men youths and boys
232,644 4,272,838 4,846,287 5,032,397 7,429,380 2,851,978 65.08%
8
6404192030 Footwear with uppers of text matls and outer soles rub/plas: other ftwr worn over/in lieu of, to protect against water-chem-inclmnt weather for men
2,123,182 6,993,048 6,030,608 4,339,340 4,097,356 2,851,583 6.08%
9
6404193560 Footwear with outer soles rub/plastic (not for sports), slip-on etc footwear 10% or more (wt) rub/plastic, textile uppers, for women
1,897,753 1,874,147 890,272 1,331,999 1,613,361 2,733,955 7.57%
10
6406996000 Other parts of footwear, insoles, heel cushions, and simialr articles, of leather
937,690 684,134 355,191 1,146,863 2,058,646 1,844,703 14.49%
EXPORTACIONES DE REP DOMINICANA A EU. SECTOR CALZADOSUBPARTID
A 10 DIG PRODUCTO US $
Source: US INTERNATIONAL TRADE COMMISSION The most representative exports of the sector, corresponding to sub-item 6406106500, corresponding to footwear uppers and parts thereof, have exhibited a decrease in the past several years, showing an average percentage change of -19%. Exports of these 10 products in 2004 represent 86% of the total exports of the sector, as noted in the following graphic.
BILATERAL TRADE BETWEEN THE DOMINICAN REPUBIC AND THE UNITED STATES OF AMERICA VI-68
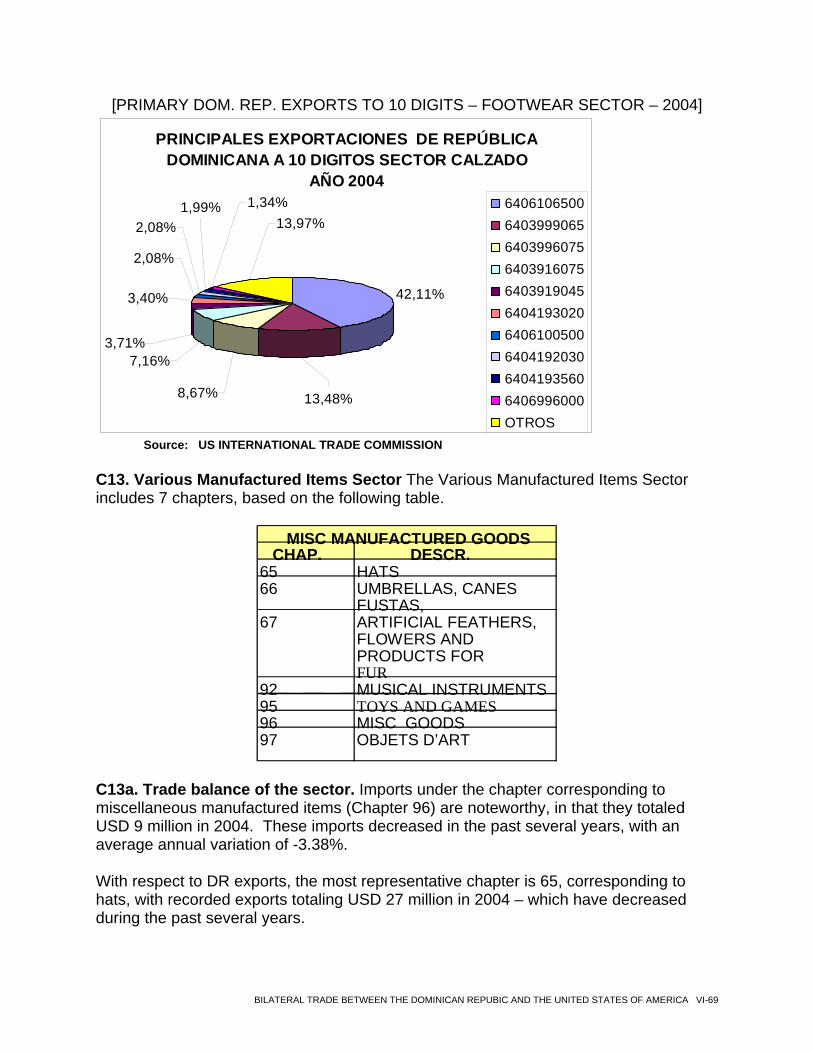
[PRIMARY DOM. REP. EXPORTS TO 10 DIGITS – FOOTWEAR SECTOR – 2004]
PRINCIPALES EXPORTACIONES DE REPÚBLICA DOMINICANA A 10 DIGITOS SECTOR CALZADO
AÑO 2004
42,11%3,40%
7,16%3,71%
8,67%
2,08%
2,08%1,99% 1,34%
13,97%
13,48%
6406106500640399906564039960756403916075640391904564041930206406100500640419203064041935606406996000OTROS
Source: US INTERNATIONAL TRADE COMMISSION
C13. Various Manufactured Items Sector The Various Manufactured Items Sector includes 7 chapters, based on the following table.
CHAP. DESCR.
65 HATS 66 UMBRELLAS, CANES
FUSTAS, 67 ARTIFICIAL FEATHERS,
FLOWERS AND PRODUCTS FOR FUR
92 MUSICAL INSTRUMENTS 95 TOYS AND GAMES96 MISC GOODS 97 OBJETS D’ART
MISC MANUFACTURED GOODS
C13a. Trade balance of the sector. Imports under the chapter corresponding to miscellaneous manufactured items (Chapter 96) are noteworthy, in that they totaled USD 9 million in 2004. These imports decreased in the past several years, with an average annual variation of -3.38%. With respect to DR exports, the most representative chapter is 65, corresponding to hats, with recorded exports totaling USD 27 million in 2004 – which have decreased during the past several years.
BILATERAL TRADE BETWEEN THE DOMINICAN REPUBIC AND THE UNITED STATES OF AMERICA VI-69
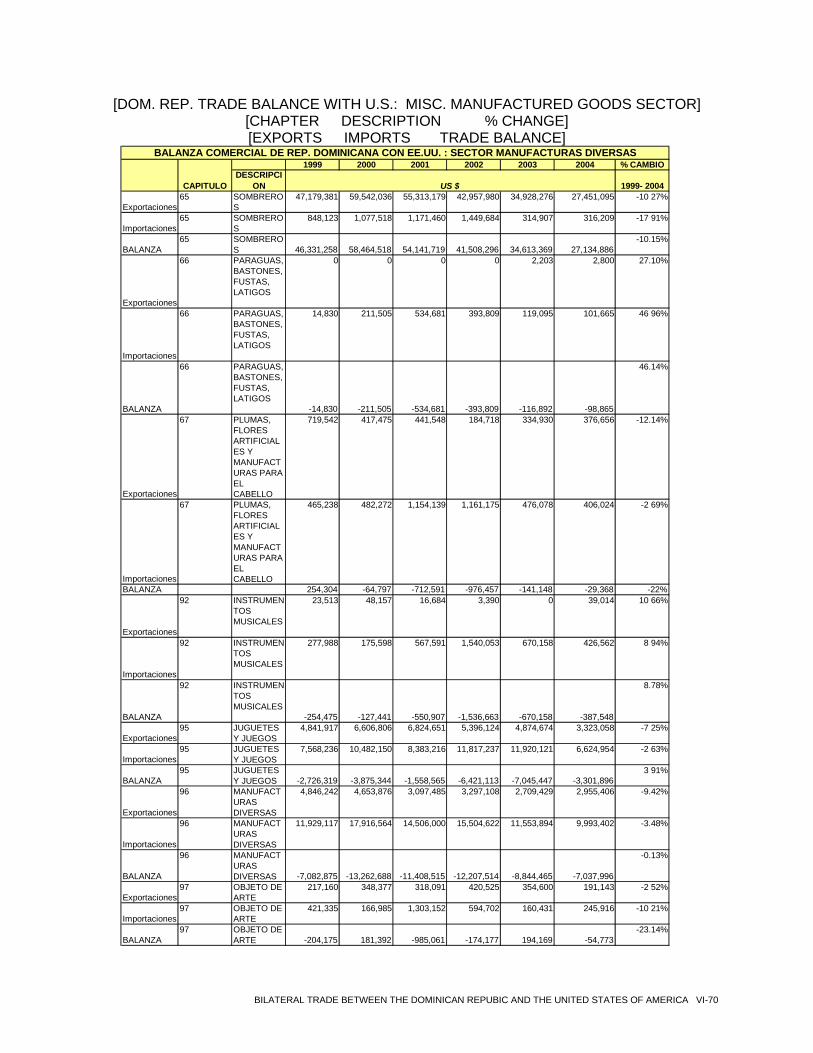
[DOM. REP. TRADE BALANCE WITH U.S.: MISC. MANUFACTURED GOODS SECTOR] [CHAPTER DESCRIPTION % CHANGE] [EXPORTS IMPORTS TRADE BALANCE]
1999 2000 2001 2002 2003 2004 % CAMBIODESCRIPCI
ON 1999- 2004
Exportaciones65 SOMBRERO
S47,179,381 59,542,036 55,313,179 42,957,980 34,928,276 27,451,095 -10 27%
Importaciones65 SOMBRERO
S848,123 1,077,518 1,171,460 1,449,684 314,907 316,209 -17 91%
BALANZA 65 SOMBRERO
S 46,331,258 58,464,518 54,141,719 41,508,296 34,613,369 27,134,886-10.15%
Exportaciones
66 PARAGUAS, BASTONES, FUSTAS, LATIGOS
0 0 0 0 2,203 2,800 27.10%
Importaciones
66 PARAGUAS, BASTONES, FUSTAS, LATIGOS
14,830 211,505 534,681 393,809 119,095 101,665 46 96%
BALANZA
66 PARAGUAS, BASTONES, FUSTAS, LATIGOS
-14,830 -211,505 -534,681 -393,809 -116,892 -98,865
46.14%
Exportaciones
67 PLUMAS, FLORES ARTIFICIALES Y MANUFACTURAS PARA EL CABELLO
719,542 417,475 441,548 184,718 334,930 376,656 -12.14%
Importaciones
67 PLUMAS, FLORES ARTIFICIALES Y MANUFACTURAS PARA EL CABELLO
465,238 482,272 1,154,139 1,161,175 476,078 406,024 -2 69%
BALANZA 254,304 -64,797 -712,591 -976,457 -141,148 -29,368 -22%
Exportaciones
92 INSTRUMENTOS MUSICALES
23,513 48,157 16,684 3,390 0 39,014 10 66%
Importaciones
92 INSTRUMENTOS MUSICALES
277,988 175,598 567,591 1,540,053 670,158 426,562 8 94%
BALANZA
92 INSTRUMENTOS MUSICALES
-254,475 -127,441 -550,907 -1,536,663 -670,158 -387,548
8.78%
Exportaciones95 JUGUETES
Y JUEGOS4,841,917 6,606,806 6,824,651 5,396,124 4,874,674 3,323,058 -7 25%
Importaciones95 JUGUETES
Y JUEGOS7,568,236 10,482,150 8,383,216 11,817,237 11,920,121 6,624,954 -2 63%
BALANZA 95 JUGUETES
Y JUEGOS -2,726,319 -3,875,344 -1,558,565 -6,421,113 -7,045,447 -3,301,8963 91%
Exportaciones
96 MANUFACTURAS DIVERSAS
4,846,242 4,653,876 3,097,485 3,297,108 2,709,429 2,955,406 -9.42%
Importaciones
96 MANUFACTURAS DIVERSAS
11,929,117 17,916,564 14,506,000 15,504,622 11,553,894 9,993,402 -3.48%
BALANZA
96 MANUFACTURAS DIVERSAS -7,082,875 -13,262,688 -11,408,515 -12,207,514 -8,844,465 -7,037,996
-0.13%
Exportaciones97 OBJETO DE
ARTE217,160 348,377 318,091 420,525 354,600 191,143 -2 52%
Importaciones97 OBJETO DE
ARTE421,335 166,985 1,303,152 594,702 160,431 245,916 -10 21%
BALANZA 97 OBJETO DE
ARTE -204,175 181,392 -985,061 -174,177 194,169 -54,773-23.14%
BALANZA COMERCIAL DE REP. DOMINICANA CON EE.UU. : SECTOR MANUFACTURAS DIVERSAS
CAPITULO US $
BILATERAL TRADE BETWEEN THE DOMINICAN REPUBIC AND THE UNITED STATES OF AMERICA VI-70
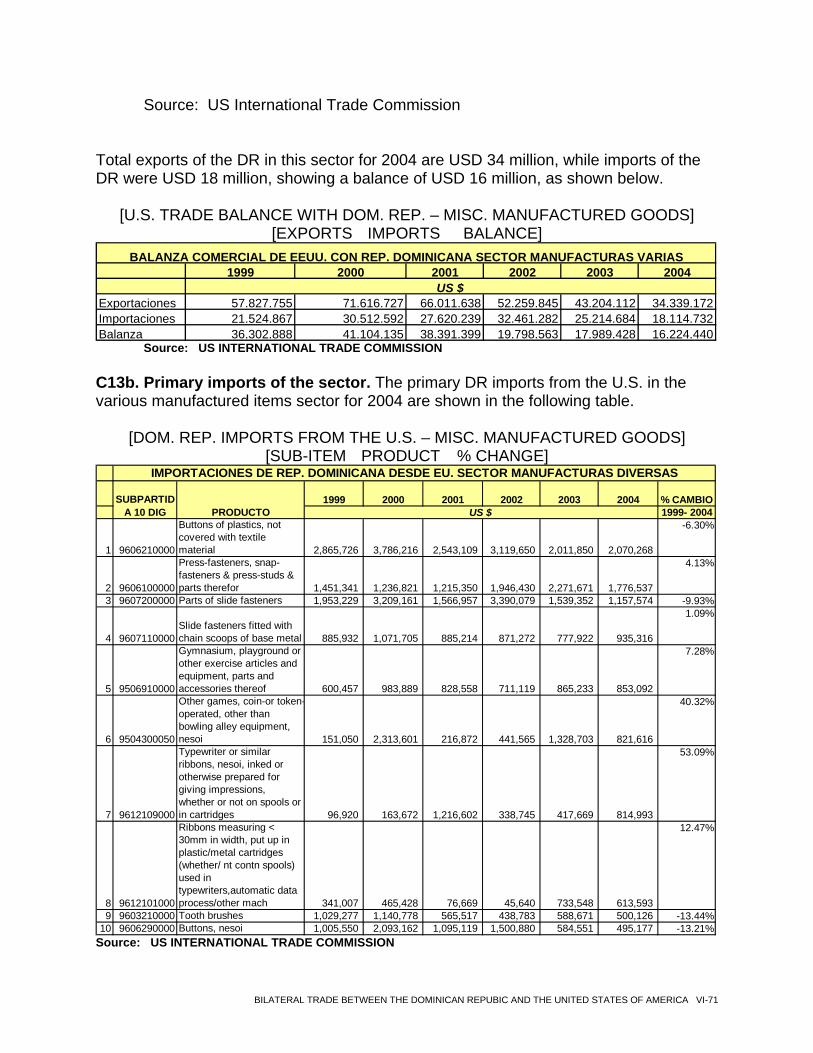
Source: US International Trade Commission
Total exports of the DR in this sector for 2004 are USD 34 million, while imports of the DR were USD 18 million, showing a balance of USD 16 million, as shown below.
[U.S. TRADE BALANCE WITH DOM. REP. – MISC. MANUFACTURED GOODS] [EXPORTS IMPORTS BALANCE]
1999 2000 2001 2002 2003 2004
Exportaciones 57.827.755 71.616.727 66.011.638 52.259.845 43.204.112 34.339.172Importaciones 21.524.867 30.512.592 27.620.239 32.461.282 25.214.684 18.114.732Balanza 36.302.888 41.104.135 38.391.399 19.798.563 17.989.428 16.224.440
US $
BALANZA COMERCIAL DE EEUU. CON REP. DOMINICANA SECTOR MANUFACTURAS VARIAS
Source: US INTERNATIONAL TRADE COMMISSION
C13b. Primary imports of the sector. The primary DR imports from the U.S. in the various manufactured items sector for 2004 are shown in the following table.
[DOM. REP. IMPORTS FROM THE U.S. – MISC. MANUFACTURED GOODS] [SUB-ITEM PRODUCT % CHANGE]
1999 2000 2001 2002 2003 2004 % CAMBIO1999- 2004
1 9606210000
Buttons of plastics, not covered with textile material 2,865,726 3,786,216 2,543,109 3,119,650 2,011,850 2,070,268
-6.30%
2 9606100000
Press-fasteners, snap-fasteners & press-studs & parts therefor 1,451,341 1,236,821 1,215,350 1,946,430 2,271,671 1,776,537
4.13%
3 9607200000 Parts of slide fasteners 1,953,229 3,209,161 1,566,957 3,390,079 1,539,352 1,157,574 -9.93%
4 9607110000Slide fasteners fitted with chain scoops of base metal 885,932 1,071,705 885,214 871,272 777,922 935,316
1.09%
5 9506910000
Gymnasium, playground or other exercise articles and equipment, parts and accessories thereof 600,457 983,889 828,558 711,119 865,233 853,092
7.28%
6 9504300050
Other games, coin-or token-operated, other than bowling alley equipment, nesoi 151,050 2,313,601 216,872 441,565 1,328,703 821,616
40.32%
7 9612109000
Typewriter or similar ribbons, nesoi, inked or otherwise prepared for giving impressions, whether or not on spools or in cartridges 96,920 163,672 1,216,602 338,745 417,669 814,993
53.09%
8 9612101000
Ribbons measuring < 30mm in width, put up in plastic/metal cartridges (whether/ nt contn spools) used in typewriters,automatic data process/other mach 341,007 465,428 76,669 45,640 733,548 613,593
12.47%
9 9603210000 Tooth brushes 1,029,277 1,140,778 565,517 438,783 588,671 500,126 -13.44%10 9606290000 Buttons, nesoi 1,005,550 2,093,162 1,095,119 1,500,880 584,551 495,177 -13.21%
IMPORTACIONES DE REP. DOMINICANA DESDE EU. SECTOR MANUFACTURAS DIVERSAS
SUBPARTIDA 10 DIG PRODUCTO US $
Source: US INTERNATIONAL TRADE COMMISSION
BILATERAL TRADE BETWEEN THE DOMINICAN REPUBIC AND THE UNITED STATES OF AMERICA VI-71
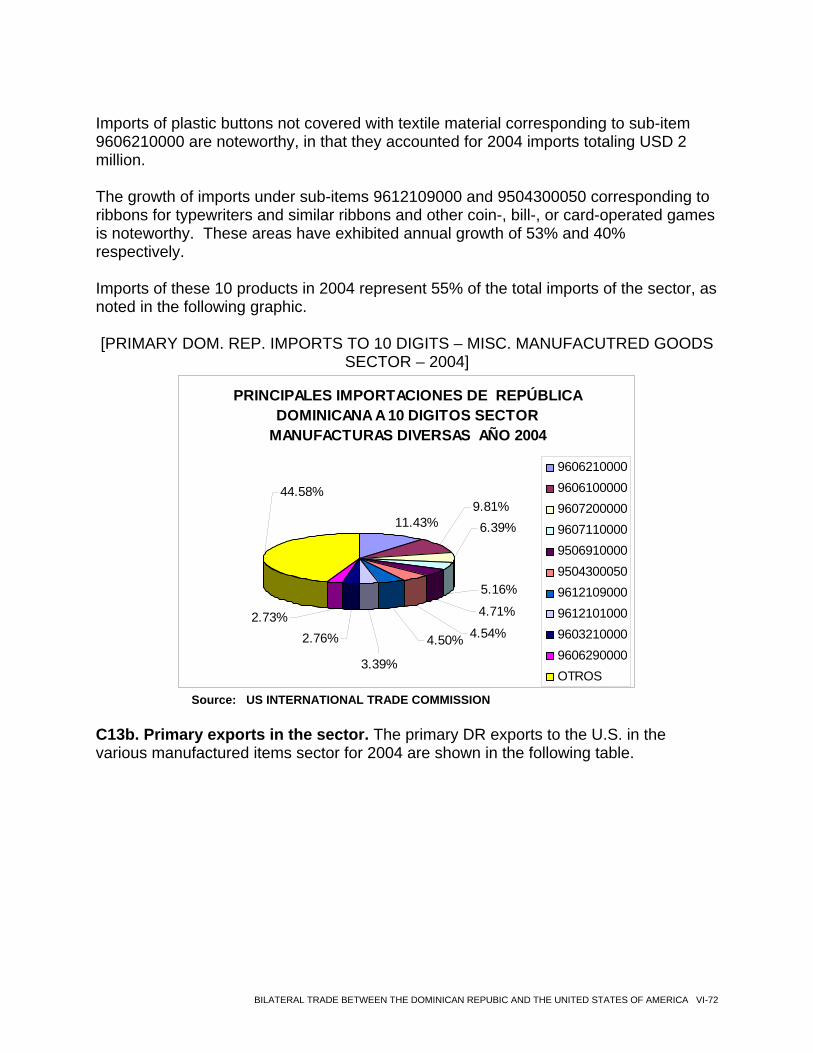
Imports of plastic buttons not covered with textile material corresponding to sub-item 9606210000 are noteworthy, in that they accounted for 2004 imports totaling USD 2 million. The growth of imports under sub-items 9612109000 and 9504300050 corresponding to ribbons for typewriters and similar ribbons and other coin-, bill-, or card-operated games is noteworthy. These areas have exhibited annual growth of 53% and 40% respectively. Imports of these 10 products in 2004 represent 55% of the total imports of the sector, as noted in the following graphic. [PRIMARY DOM. REP. IMPORTS TO 10 DIGITS – MISC. MANUFACUTRED GOODS
SECTOR – 2004]
PRINCIPALES IMPORTACIONES DE REPÚBLICA DOMINICANA A 10 DIGITOS SECTOR
MANUFACTURAS DIVERSAS AÑO 2004
11.43%
4.54%
5.16%
4.71%
6.39%
4.50%
3.39%
2.76%2.73%
44.58%9.81%
9606210000960610000096072000009607110000950691000095043000509612109000961210100096032100009606290000OTROS
Source: US INTERNATIONAL TRADE COMMISSION
C13b. Primary exports in the sector. The primary DR exports to the U.S. in the various manufactured items sector for 2004 are shown in the following table.
BILATERAL TRADE BETWEEN THE DOMINICAN REPUBIC AND THE UNITED STATES OF AMERICA VI-72
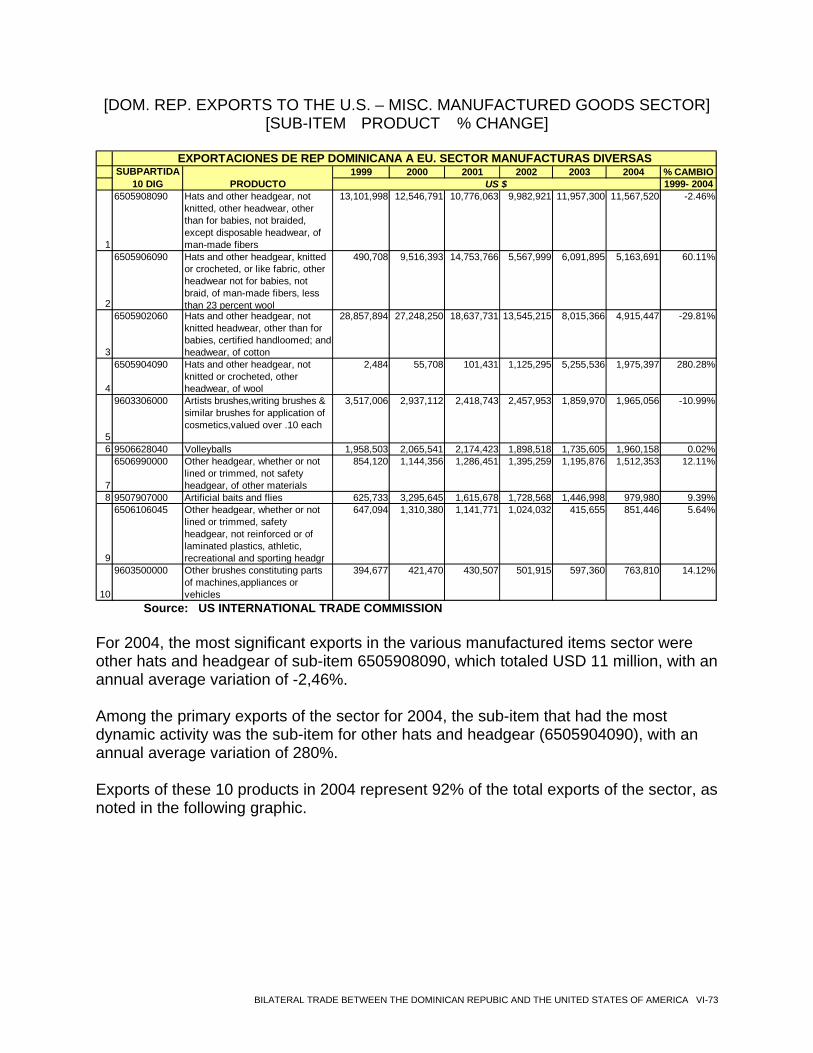
[DOM. REP. EXPORTS TO THE U.S. – MISC. MANUFACTURED GOODS SECTOR] [SUB-ITEM PRODUCT % CHANGE]
1999 2000 2001 2002 2003 2004 % CAMBIO1999- 2004
1
6505908090 Hats and other headgear, not knitted, other headwear, other than for babies, not braided, except disposable headwear, of man-made fibers
13,101,998 12,546,791 10,776,063 9,982,921 11,957,300 11,567,520 -2.46%
2
6505906090 Hats and other headgear, knitted or crocheted, or like fabric, other headwear not for babies, not braid, of man-made fibers, less than 23 percent wool
490,708 9,516,393 14,753,766 5,567,999 6,091,895 5,163,691 60.11%
3
6505902060 Hats and other headgear, not knitted headwear, other than for babies, certified handloomed; and headwear, of cotton
28,857,894 27,248,250 18,637,731 13,545,215 8,015,366 4,915,447 -29.81%
4
6505904090 Hats and other headgear, not knitted or crocheted, other headwear, of wool
2,484 55,708 101,431 1,125,295 5,255,536 1,975,397 280.28%
5
9603306000 Artists brushes,writing brushes & similar brushes for application of cosmetics,valued over .10 each
3,517,006 2,937,112 2,418,743 2,457,953 1,859,970 1,965,056 -10.99%
6 9506628040 Volleyballs 1,958,503 2,065,541 2,174,423 1,898,518 1,735,605 1,960,158 0.02%
7
6506990000 Other headgear, whether or not lined or trimmed, not safety headgear, of other materials
854,120 1,144,356 1,286,451 1,395,259 1,195,876 1,512,353 12.11%
8 9507907000 Artificial baits and flies 625,733 3,295,645 1,615,678 1,728,568 1,446,998 979,980 9.39%
9
6506106045 Other headgear, whether or not lined or trimmed, safety headgear, not reinforced or of laminated plastics, athletic, recreational and sporting headgr
647,094 1,310,380 1,141,771 1,024,032 415,655 851,446 5.64%
10
9603500000 Other brushes constituting parts of machines,appliances or vehicles
394,677 421,470 430,507 501,915 597,360 763,810 14.12%
EXPORTACIONES DE REP DOMINICANA A EU. SECTOR MANUFACTURAS DIVERSASSUBPARTIDA
10 DIG PRODUCTO US $
Source: US INTERNATIONAL TRADE COMMISSION
For 2004, the most significant exports in the various manufactured items sector were other hats and headgear of sub-item 6505908090, which totaled USD 11 million, with an annual average variation of -2,46%.
Among the primary exports of the sector for 2004, the sub-item that had the most dynamic activity was the sub-item for other hats and headgear (6505904090), with an annual average variation of 280%.
Exports of these 10 products in 2004 represent 92% of the total exports of the sector, as noted in the following graphic.
BILATERAL TRADE BETWEEN THE DOMINICAN REPUBIC AND THE UNITED STATES OF AMERICA VI-73
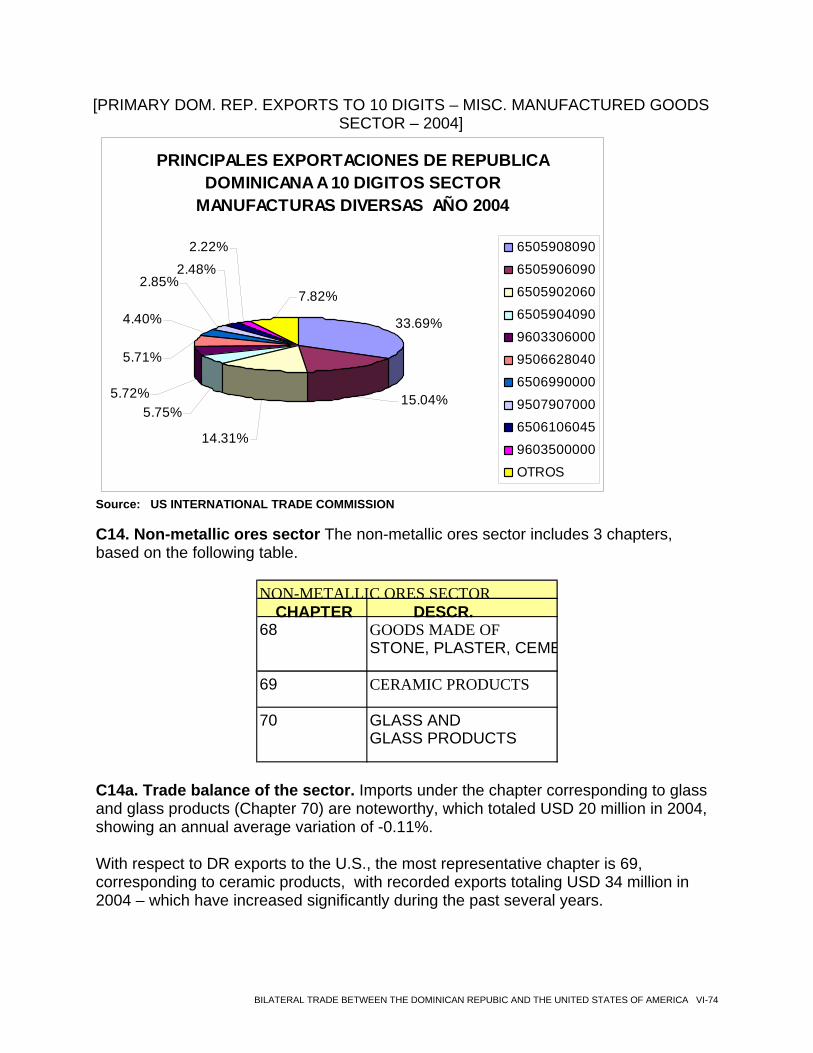
[PRIMARY DOM. REP. EXPORTS TO 10 DIGITS – MISC. MANUFACTURED GOODS
MMISSION
SECTOR – 2004]
Source: US INTERNATIONAL TRADE CO
PRINCIPALES EXPORTACIONES DE REPUBLICA DOMINICANA A 10 DIGITOS SECTOR
MANUFACTURAS DIVERSAS AÑO 2004
33.69%
15.04%
7.82%
2.22%
2.48%2.85%
4.40%
14.31%
5.72%5.75%
5.71%
6505908090
6505906090
6505902060
6505904090
9603306000
9506628040
6506990000
9507907000
6506106045
9603500000
OTROS
14. Non-metallic ores sector The non-metallic ores sector includes 3 chapters, C
based on the following table.
NON-METALLIC ORES SECTOR CHAPTER DESCR.
68 GOODS MADE OF STONE, PLASTER, CEME
69 CERAMIC PRODUCTS
70 GLASS AND GLASS PRODUCTS
14a. Trade balance of the sector. Imports under the chapter corresponding to glass
ith respect to DR exports to the U.S., the most representative chapter is 69, ion in
Cand glass products (Chapter 70) are noteworthy, which totaled USD 20 million in 2004, showing an annual average variation of -0.11%. Wcorresponding to ceramic products, with recorded exports totaling USD 34 mill2004 – which have increased significantly during the past several years.
BILATERAL TRADE BETWEEN THE DOMINICAN REPUBIC AND THE UNITED STATES OF AMERICA VI-74
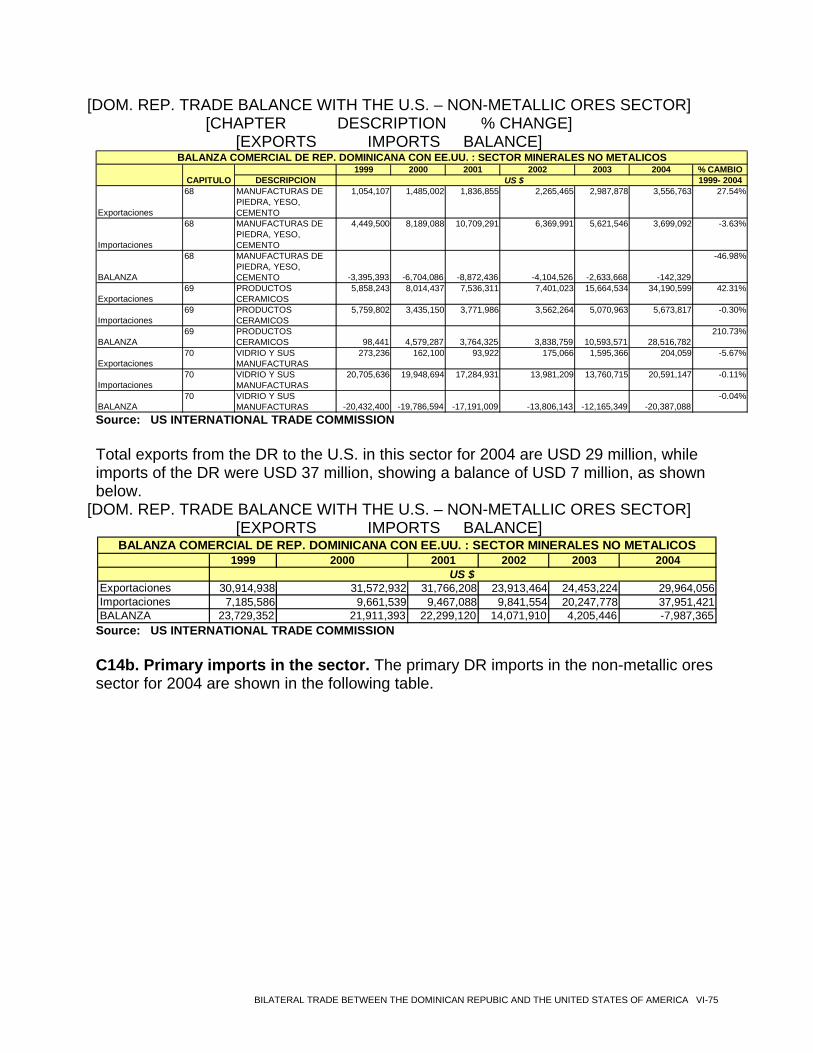
[DOM. REP. TRADE BALANCE WITH THE U.S. – NON-METALLIC ORES SECTOR] [CHAPTER DESCRIPTION % CHANGE]
[EXPORTS IMPORTS BALANCE] 1999 2000 2001 2002 2003 2004 % CAMBIO
DESCRIPCION 1999- 2004
Exportaciones
68 MANUFACTURAS DE PIEDRA, YESO, CEMENTO
1,054,107 1,485,002 1,836,855 2,265,465 2,987,878 3,556,763 27.54%
Importaciones
68 MANUFACTURAS DE PIEDRA, YESO, CEMENTO
4,449,500 8,189,088 10,709,291 6,369,991 5,621,546 3,699,092 -3.63%
BALANZA
68 MANUFACTURAS DE PIEDRA, YESO, CEMENTO -3,395,393 -6,704,086 -8,872,436 -4,104,526 -2,633,668 -142,329
-46.98%
Exportaciones69 PRODUCTOS
CERAMICOS5,858,243 8,014,437 7,536,311 7,401,023 15,664,534 34,190,599 42.31%
Importaciones69 PRODUCTOS
CERAMICOS5,759,802 3,435,150 3,771,986 3,562,264 5,070,963 5,673,817 -0.30%
BALANZA 69 PRODUCTOS
CERAMICOS 98,441 4,579,287 3,764,325 3,838,759 10,593,571 28,516,782210.73%
Exportaciones70 VIDRIO Y SUS
MANUFACTURAS273,236 162,100 93,922 175,066 1,595,366 204,059 -5.67%
Importaciones70 VIDRIO Y SUS
MANUFACTURAS20,705,636 19,948,694 17,284,931 13,981,209 13,760,715 20,591,147 -0.11%
BALANZA 70 VIDRIO Y SUS
MANUFACTURAS -20,432,400 -19,786,594 -17,191,009 -13,806,143 -12,165,349 -20,387,088-0.04%
CAPITULO US $
BALANZA COMERCIAL DE REP. DOMINICANA CON EE.UU. : SECTOR MINERALES NO METALICOS
Source: US INTERNATIONAL TRADE COMMISSION Total exports from the DR to the U.S. in this sector for 2004 are USD 29 million, while imports of the DR were USD 37 million, showing a balance of USD 7 million, as shown below.
[DOM. REP. TRADE BALANCE WITH THE U.S. – NON-METALLIC ORES SECTOR] [EXPORTS IMPORTS BALANCE]
1999 2000 2001 2002 2003 2004
Exportaciones 30,914,938 31,572,932 31,766,208 23,913,464 24,453,224 29,964,056Importaciones 7,185,586 9,661,539 9,467,088 9,841,554 20,247,778 37,951,421BALANZA 23,729,352 21,911,393 22,299,120 14,071,910 4,205,446 -7,987,365
US $
BALANZA COMERCIAL DE REP. DOMINICANA CON EE.UU. : SECTOR MINERALES NO METALICOS
Source: US INTERNATIONAL TRADE COMMISSION
C14b. Primary imports in the sector. The primary DR imports in the non-metallic ores sector for 2004 are shown in the following table.
BILATERAL TRADE BETWEEN THE DOMINICAN REPUBIC AND THE UNITED STATES OF AMERICA VI-75
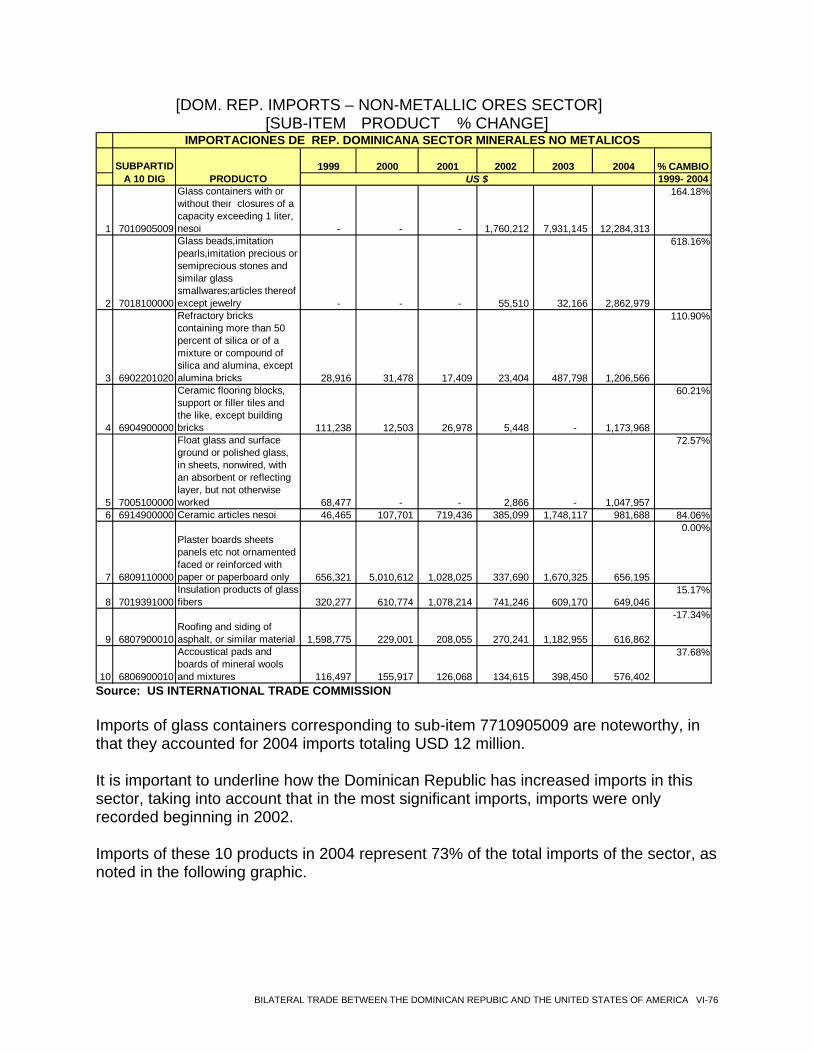
[DOM. REP. IMPORTS – NON-METALLIC ORES SECTOR] [SUB-ITEM PRODUCT % CHANGE]
1999 2000 2001 2002 2003 2004 % CAMBIO1999- 2004
1 7010905009
Glass containers with or without their closures of a capacity exceeding 1 liter, nesoi - - - 1,760,212 7,931,145 12,284,313
164.18%
2 7018100000
Glass beads,imitation pearls,imitation precious or semiprecious stones and similar glass smallwares;articles thereof except jewelry - - - 55,510 32,166 2,862,979
618.16%
3 6902201020
Refractory bricks containing more than 50 percent of silica or of a mixture or compound of silica and alumina, except alumina bricks 28,916 31,478 17,409 23,404 487,798 1,206,566
110.90%
4 6904900000
Ceramic flooring blocks, support or filler tiles and the like, except building bricks 111,238 12,503 26,978 5,448 - 1,173,968
60.21%
5 7005100000
Float glass and surface ground or polished glass, in sheets, nonwired, with an absorbent or reflecting layer, but not otherwise worked 68,477 - - 2,866 - 1,047,957
72.57%
6 6914900000 Ceramic articles nesoi 46,465 107,701 719,436 385,099 1,748,117 981,688 84.06%
7 6809110000
Plaster boards sheets panels etc not ornamented faced or reinforced with paper or paperboard only 656,321 5,010,612 1,028,025 337,690 1,670,325 656,195
0.00%
8 7019391000Insulation products of glass fibers 320,277 610,774 1,078,214 741,246 609,170 649,046
15.17%
9 6807900010Roofing and siding of asphalt, or similar material 1,598,775 229,001 208,055 270,241 1,182,955 616,862
-17.34%
10 6806900010
Accoustical pads and boards of mineral wools and mixtures 116,497 155,917 126,068 134,615 398,450 576,402
37.68%
IMPORTACIONES DE REP. DOMINICANA SECTOR MINERALES NO METALICOS
SUBPARTIDA 10 DIG PRODUCTO US $
Source: US INTERNATIONAL TRADE COMMISSION Imports of glass containers corresponding to sub-item 7710905009 are noteworthy, in that they accounted for 2004 imports totaling USD 12 million. It is important to underline how the Dominican Republic has increased imports in this sector, taking into account that in the most significant imports, imports were only recorded beginning in 2002. Imports of these 10 products in 2004 represent 73% of the total imports of the sector, as noted in the following graphic.
BILATERAL TRADE BETWEEN THE DOMINICAN REPUBIC AND THE UNITED STATES OF AMERICA VI-76
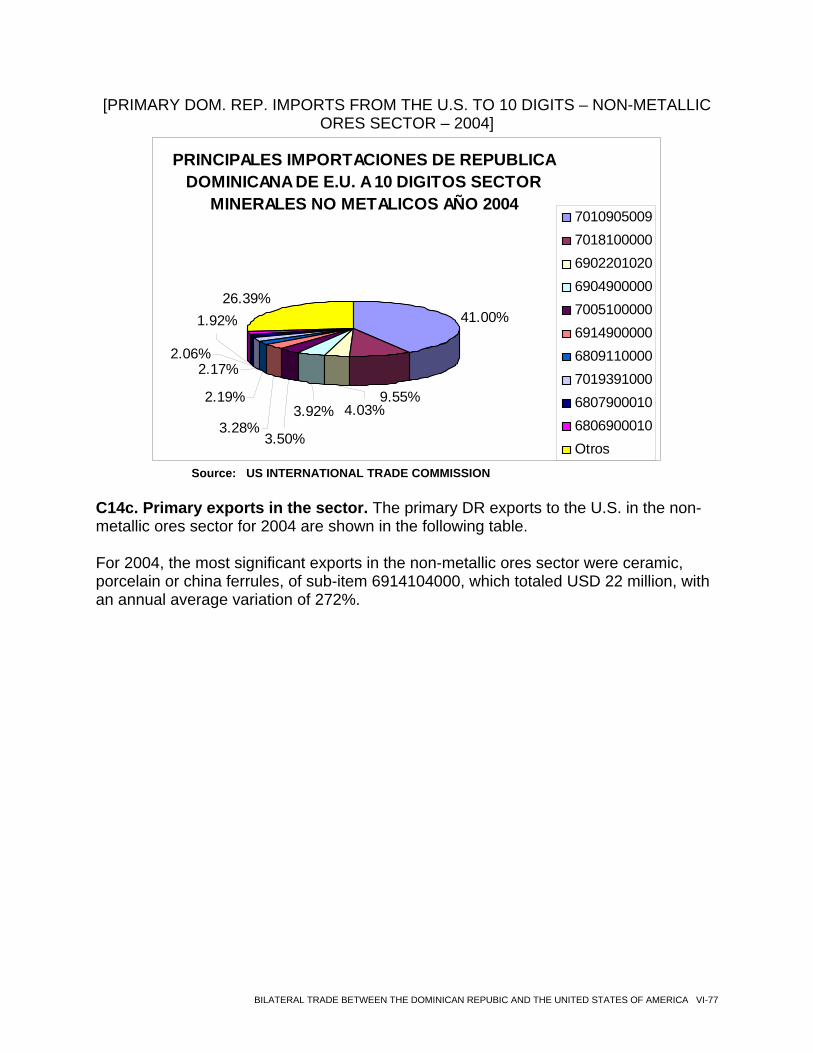
[PRIMARY DOM. REP. IMPORTS FROM THE U.S. TO 10 DIGITS – NON-METALLIC ORES SECTOR – 2004]
PRINCIPALES IMPORTACIONES DE REPUBLICA DOMINICANA DE E.U. A 10 DIGITOS SECTOR
MINERALES NO METALICOS AÑO 2004
41.00%
9.55%2.19%
2.17%
26.39%
3.50%3.28%
3.92% 4.03%
2.06%
1.92%
7010905009701810000069022010206904900000700510000069149000006809110000701939100068079000106806900010Otros
Source: US INTERNATIONAL TRADE COMMISSION
C14c. Primary exports in the sector. The primary DR exports to the U.S. in the non-metallic ores sector for 2004 are shown in the following table.
For 2004, the most significant exports in the non-metallic ores sector were ceramic, porcelain or china ferrules, of sub-item 6914104000, which totaled USD 22 million, with an annual average variation of 272%.
BILATERAL TRADE BETWEEN THE DOMINICAN REPUBIC AND THE UNITED STATES OF AMERICA VI-77
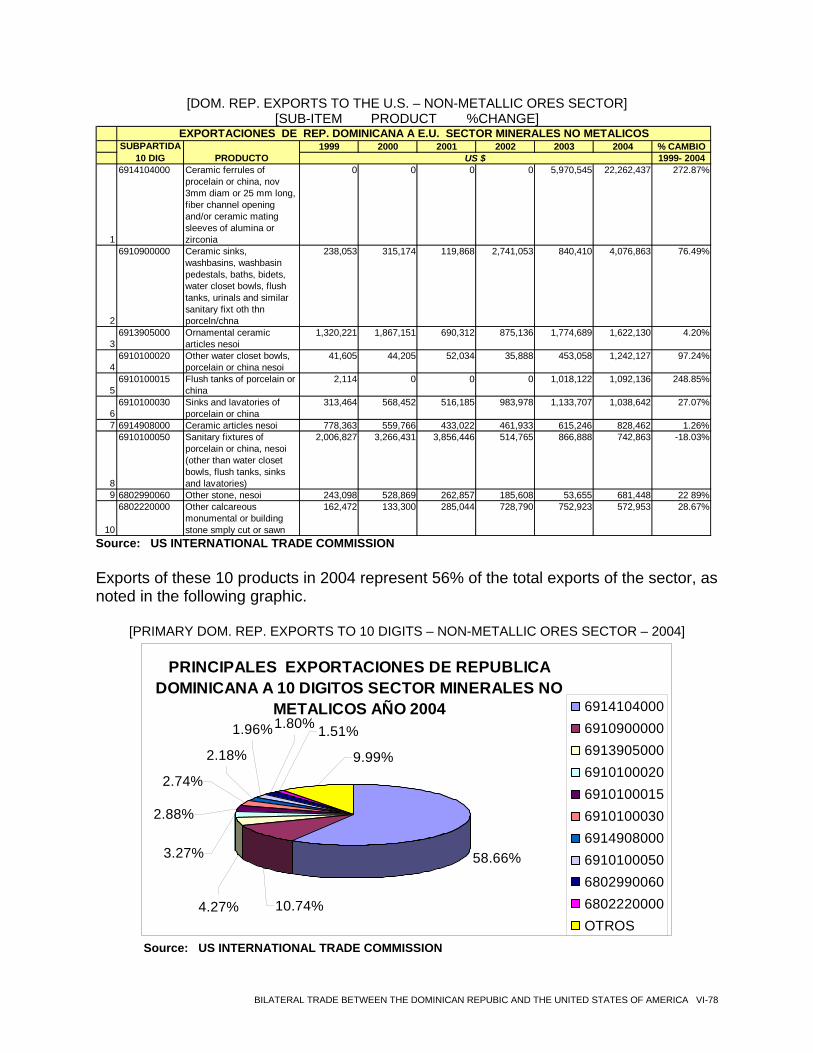
[DOM. REP. EXPORTS TO THE U.S. – NON-METALLIC ORES SECTOR] [SUB-ITEM PRODUCT %CHANGE]
1999 2000 2001 2002 2003 2004 % CAMBIO1999- 2004
1
6914104000 Ceramic ferrules of procelain or china, nov 3mm diam or 25 mm long, fiber channel opening and/or ceramic mating sleeves of alumina or zirconia
0 0 0 0 5,970,545 22,262,437 272.87%
2
6910900000 Ceramic sinks, washbasins, washbasin pedestals, baths, bidets, water closet bowls, flush tanks, urinals and similar sanitary fixt oth thn porceln/chna
238,053 315,174 119,868 2,741,053 840,410 4,076,863 76.49%
36913905000 Ornamental ceramic
articles nesoi1,320,221 1,867,151 690,312 875,136 1,774,689 1,622,130 4.20%
46910100020 Other water closet bowls,
porcelain or china nesoi41,605 44,205 52,034 35,888 453,058 1,242,127 97.24%
56910100015 Flush tanks of porcelain or
china2,114 0 0 0 1,018,122 1,092,136 248.85%
66910100030 Sinks and lavatories of
porcelain or china313,464 568,452 516,185 983,978 1,133,707 1,038,642 27.07%
7 6914908000 Ceramic articles nesoi 778,363 559,766 433,022 461,933 615,246 828,462 1.26%
8
6910100050 Sanitary fixtures of porcelain or china, nesoi (other than water closet bowls, flush tanks, sinks and lavatories)
2,006,827 3,266,431 3,856,446 514,765 866,888 742,863 -18.03%
9 6802990060 Other stone, nesoi 243,098 528,869 262,857 185,608 53,655 681,448 22 89%
10
6802220000 Other calcareous monumental or building stone smply cut or sawn
162,472 133,300 285,044 728,790 752,923 572,953 28.67%
EXPORTACIONES DE REP. DOMINICANA A E.U. SECTOR MINERALES NO METALICOSSUBPARTIDA
10 DIG PRODUCTO US $
Source: US INTERNATIONAL TRADE COMMISSION Exports of these 10 products in 2004 represent 56% of the total exports of the sector, as noted in the following graphic.
[PRIMARY DOM. REP. EXPORTS TO 10 DIGITS – NON-METALLIC ORES SECTOR – 2004]
PRINCIPALES EXPORTACIONES DE REPUBLICA DOMINICANA A 10 DIGITOS SECTOR MINERALES NO
METALICOS AÑO 2004
58.66%
2.74%
3.27%
4.27%
1.80% 1.51%
9.99%
1.96%
2.88%
10.74%
2.18%
6914104000691090000069139050006910100020691010001569101000306914908000691010005068029900606802220000OTROS
Source: US INTERNATIONAL TRADE COMMISSION
BILATERAL TRADE BETWEEN THE DOMINICAN REPUBIC AND THE UNITED STATES OF AMERICA VI-78
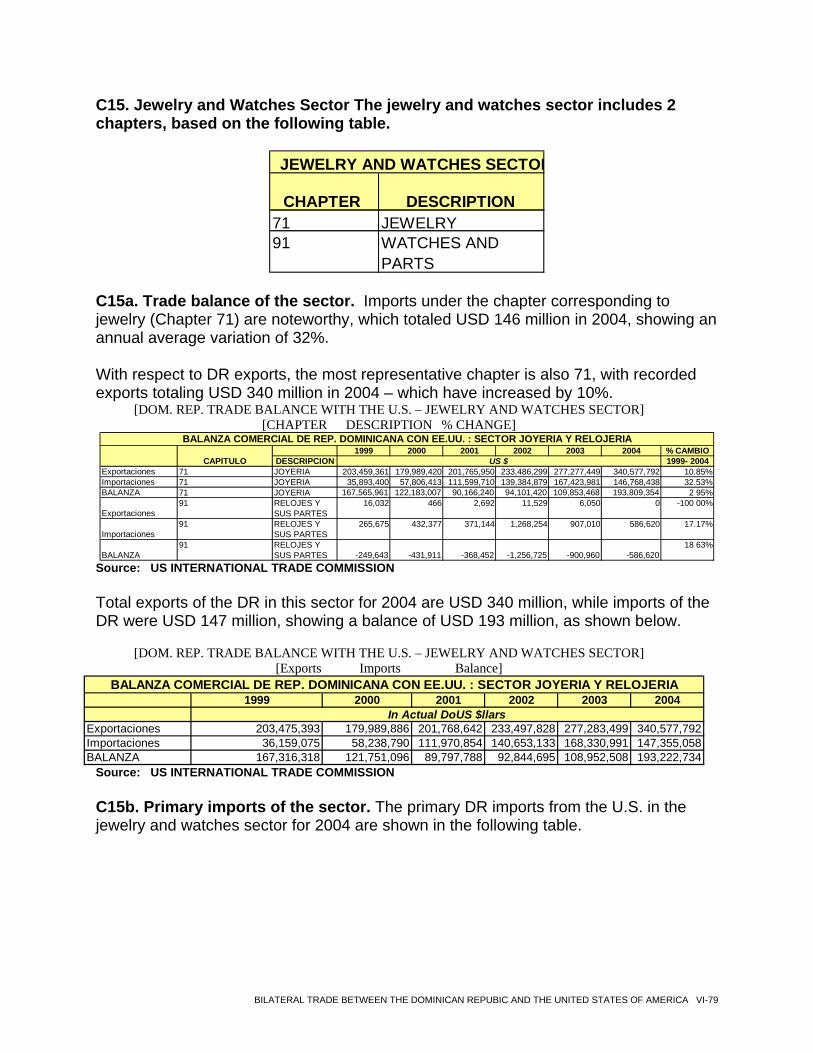
C15. Jewelry and Watches Sector The jewelry and watches sector includes 2 chapters, based on the following table.
CHAPTER DESCRIPTION 71 JEWELRY91 WATCHES AND
PARTS
JEWELRY AND WATCHES SECTOR
C15a. Trade balance of the sector. Imports under the chapter corresponding to jewelry (Chapter 71) are noteworthy, which totaled USD 146 million in 2004, showing an annual average variation of 32%. With respect to DR exports, the most representative chapter is also 71, with recorded exports totaling USD 340 million in 2004 – which have increased by 10%.
[DOM. REP. TRADE BALANCE WITH THE U.S. – JEWELRY AND WATCHES SECTOR] [CHAPTER DESCRIPTION % CHANGE]
1999 2000 2001 2002 2003 2004 % CAMBIODESCRIPCION 1999- 2004
Exportaciones 71 JOYERIA 203,459,361 179,989,420 201,765,950 233,486,299 277,277,449 340,577,792 10.85%Importaciones 71 JOYERIA 35,893,400 57,806,413 111,599,710 139,384,879 167,423,981 146,768,438 32.53%BALANZA 71 JOYERIA 167,565,961 122,183,007 90,166,240 94,101,420 109,853,468 193,809,354 2 95%
Exportaciones91 RELOJES Y
SUS PARTES16,032 466 2,692 11,529 6,050 0 -100 00%
Importaciones91 RELOJES Y
SUS PARTES265,675 432,377 371,144 1,268,254 907,010 586,620 17.17%
BALANZA 91 RELOJES Y
SUS PARTES -249,643 -431,911 -368,452 -1,256,725 -900,960 -586,62018 63%
BALANZA COMERCIAL DE REP. DOMINICANA CON EE.UU. : SECTOR JOYERIA Y RELOJERIA
CAPITULO US $
Source: US INTERNATIONAL TRADE COMMISSION Total exports of the DR in this sector for 2004 are USD 340 million, while imports of the DR were USD 147 million, showing a balance of USD 193 million, as shown below.
[DOM. REP. TRADE BALANCE WITH THE U.S. – JEWELRY AND WATCHES SECTOR]
[Exports Imports Balance]
1999 2000 2001 2002 2003 2004
Exportaciones 203,475,393 179,989,886 201,768,642 233,497,828 277,283,499 340,577,792Importaciones 36,159,075 58,238,790 111,970,854 140,653,133 168,330,991 147,355,058BALANZA 167,316,318 121,751,096 89,797,788 92,844,695 108,952,508 193,222,734
In Actual DoUS $llars
BALANZA COMERCIAL DE REP. DOMINICANA CON EE.UU. : SECTOR JOYERIA Y RELOJERIA
Source: US INTERNATIONAL TRADE COMMISSION
C15b. Primary imports of the sector. The primary DR imports from the U.S. in the jewelry and watches sector for 2004 are shown in the following table.
BILATERAL TRADE BETWEEN THE DOMINICAN REPUBIC AND THE UNITED STATES OF AMERICA VI-79
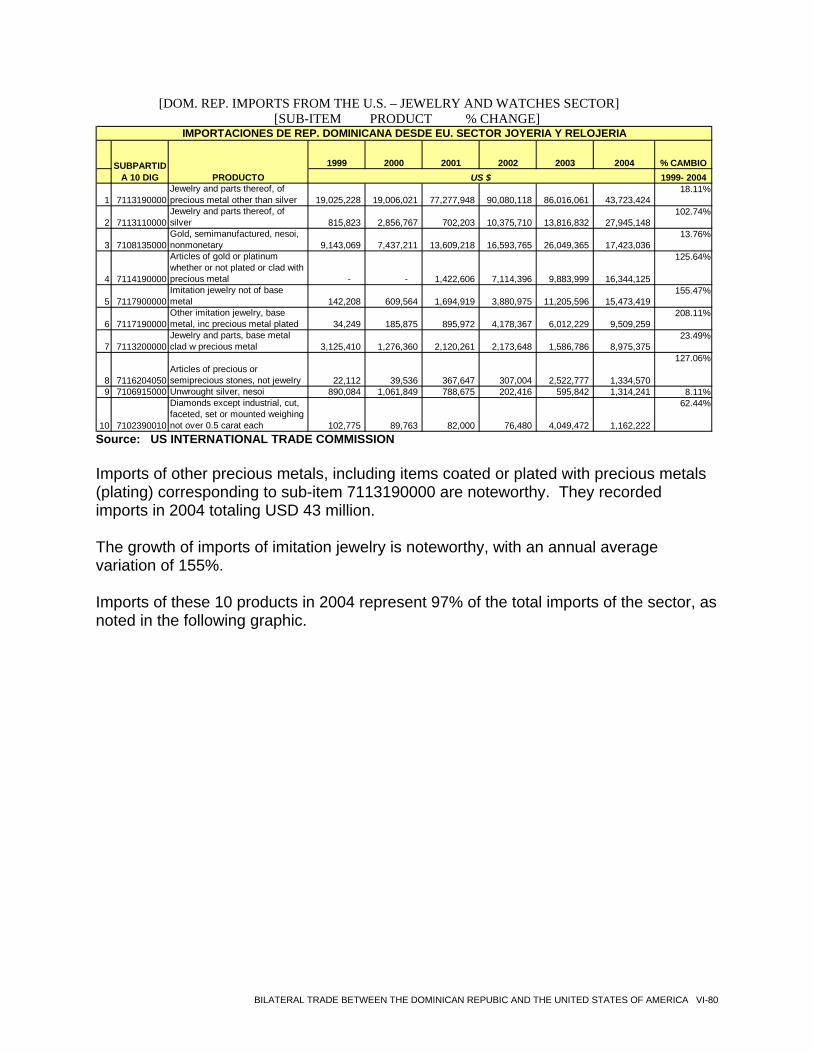
[DOM. REP. IMPORTS FROM THE U.S. – JEWELRY AND WATCHES SECTOR] [SUB-ITEM PRODUCT % CHANGE]
1999 2000 2001 2002 2003 2004 % CAMBIO1999- 2004
1 7113190000Jewelry and parts thereof, of precious metal other than silver 19,025,228 19,006,021 77,277,948 90,080,118 86,016,061 43,723,424
18.11%
2 7113110000Jewelry and parts thereof, of silver 815,823 2,856,767 702,203 10,375,710 13,816,832 27,945,148
102.74%
3 7108135000Gold, semimanufactured, nesoi, nonmonetary 9,143,069 7,437,211 13,609,218 16,593,765 26,049,365 17,423,036
13.76%
4 7114190000
Articles of gold or platinum whether or not plated or clad with precious metal - - 1,422,606 7,114,396 9,883,999 16,344,125
125.64%
5 7117900000Imitation jewelry not of base metal 142,208 609,564 1,694,919 3,880,975 11,205,596 15,473,419
155.47%
6 7117190000Other imitation jewelry, base metal, inc precious metal plated 34,249 185,875 895,972 4,178,367 6,012,229 9,509,259
208.11%
7 7113200000Jewelry and parts, base metal clad w precious metal 3,125,410 1,276,360 2,120,261 2,173,648 1,586,786 8,975,375
23.49%
8 7116204050Articles of precious or semiprecious stones, not jewelry 22,112 39,536 367,647 307,004 2,522,777 1,334,570
127.06%
9 7106915000 Unwrought silver, nesoi 890,084 1,061,849 788,675 202,416 595,842 1,314,241 8.11%
10 7102390010
Diamonds except industrial, cut, faceted, set or mounted weighing not over 0.5 carat each 102,775 89,763 82,000 76,480 4,049,472 1,162,222
62.44%
SUBPARTIDA 10 DIG PRODUCTO US $
IMPORTACIONES DE REP. DOMINICANA DESDE EU. SECTOR JOYERIA Y RELOJERIA
Source: US INTERNATIONAL TRADE COMMISSION Imports of other precious metals, including items coated or plated with precious metals (plating) corresponding to sub-item 7113190000 are noteworthy. They recorded imports in 2004 totaling USD 43 million. The growth of imports of imitation jewelry is noteworthy, with an annual average variation of 155%. Imports of these 10 products in 2004 represent 97% of the total imports of the sector, as noted in the following graphic.
BILATERAL TRADE BETWEEN THE DOMINICAN REPUBIC AND THE UNITED STATES OF AMERICA VI-80
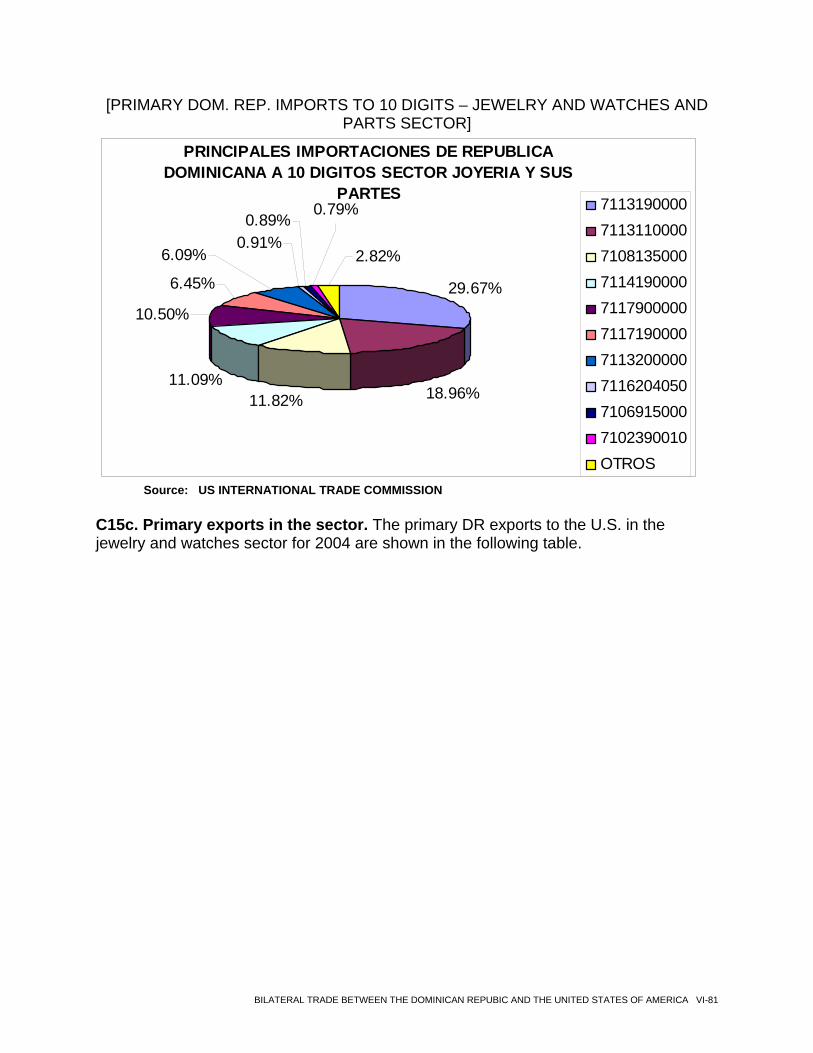
[PRIMARY DOM. REP. IMPORTS TO 10 DIGITS – JEWELRY AND WATCHES AND PARTS SECTOR]
PRINCIPALES IMPORTACIONES DE REPUBLICA DOMINICANA A 10 DIGITOS SECTOR JOYERIA Y SUS
PARTES
29.67%
18.96%11.82%11.09%
10.50%
6.45%
0.91%6.09%
0.89%0.79%
2.82%
7113190000711311000071081350007114190000711790000071171900007113200000711620405071069150007102390010OTROS
Source: US INTERNATIONAL TRADE COMMISSION
C15c. Primary exports in the sector. The primary DR exports to the U.S. in the jewelry and watches sector for 2004 are shown in the following table.
BILATERAL TRADE BETWEEN THE DOMINICAN REPUBIC AND THE UNITED STATES OF AMERICA VI-81
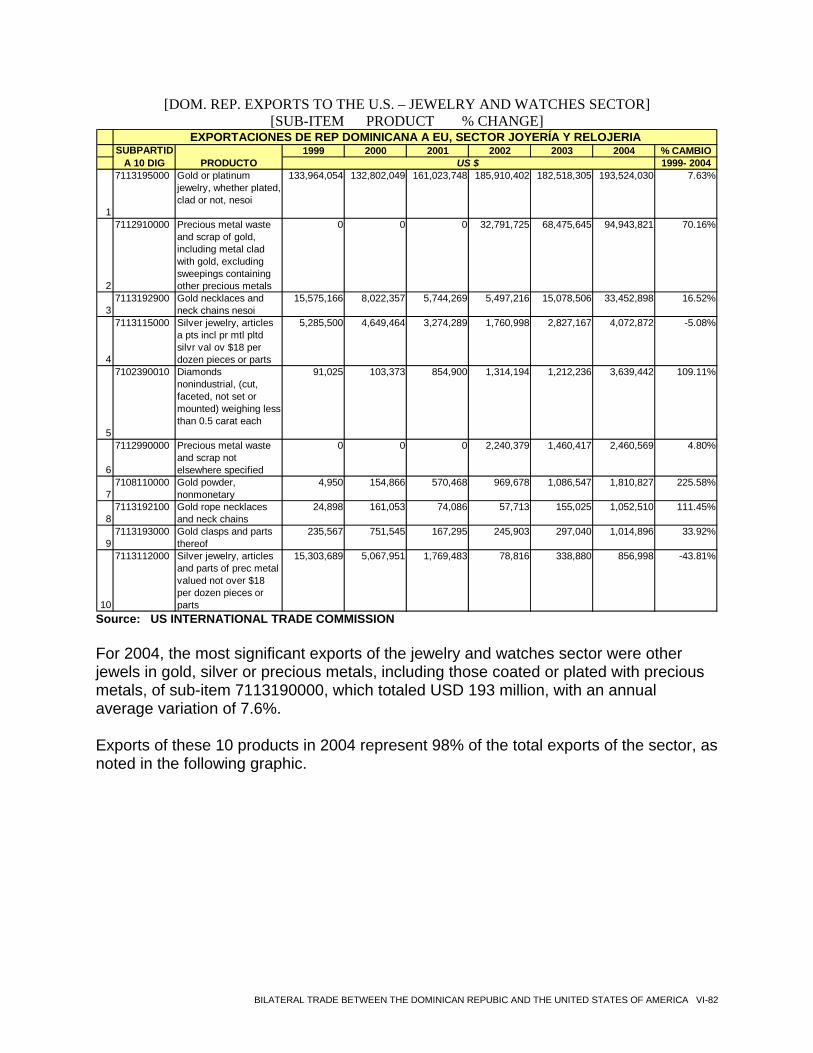
[DOM. REP. EXPORTS TO THE U.S. – JEWELRY AND WATCHES SECTOR] [SUB-ITEM PRODUCT % CHANGE]
1999 2000 2001 2002 2003 2004 % CAMBIO1999- 2004
1
7113195000 Gold or platinum jewelry, whether plated, clad or not, nesoi
133,964,054 132,802,049 161,023,748 185,910,402 182,518,305 193,524,030 7.63%
2
7112910000 Precious metal waste and scrap of gold, including metal clad with gold, excluding sweepings containing other precious metals
0 0 0 32,791,725 68,475,645 94,943,821 70.16%
37113192900 Gold necklaces and
neck chains nesoi15,575,166 8,022,357 5,744,269 5,497,216 15,078,506 33,452,898 16.52%
4
7113115000 Silver jewelry, articles a pts incl pr mtl pltd silvr val ov $18 per dozen pieces or parts
5,285,500 4,649,464 3,274,289 1,760,998 2,827,167 4,072,872 -5.08%
5
7102390010 Diamonds nonindustrial, (cut, faceted, not set or mounted) weighing less than 0.5 carat each
91,025 103,373 854,900 1,314,194 1,212,236 3,639,442 109.11%
6
7112990000 Precious metal waste and scrap not elsewhere specified
0 0 0 2,240,379 1,460,417 2,460,569 4.80%
77108110000 Gold powder,
nonmonetary4,950 154,866 570,468 969,678 1,086,547 1,810,827 225.58%
87113192100 Gold rope necklaces
and neck chains24,898 161,053 74,086 57,713 155,025 1,052,510 111.45%
97113193000 Gold clasps and parts
thereof235,567 751,545 167,295 245,903 297,040 1,014,896 33.92%
10
7113112000 Silver jewelry, articles and parts of prec metal valued not over $18 per dozen pieces or parts
15,303,689 5,067,951 1,769,483 78,816 338,880 856,998 -43.81%
EXPORTACIONES DE REP DOMINICANA A EU, SECTOR JOYERÍA Y RELOJERIASUBPARTID
A 10 DIG PRODUCTO US $
Source: US INTERNATIONAL TRADE COMMISSION
For 2004, the most significant exports of the jewelry and watches sector were other jewels in gold, silver or precious metals, including those coated or plated with precious metals, of sub-item 7113190000, which totaled USD 193 million, with an annual average variation of 7.6%.
Exports of these 10 products in 2004 represent 98% of the total exports of the sector, as noted in the following graphic.
BILATERAL TRADE BETWEEN THE DOMINICAN REPUBIC AND THE UNITED STATES OF AMERICA VI-82
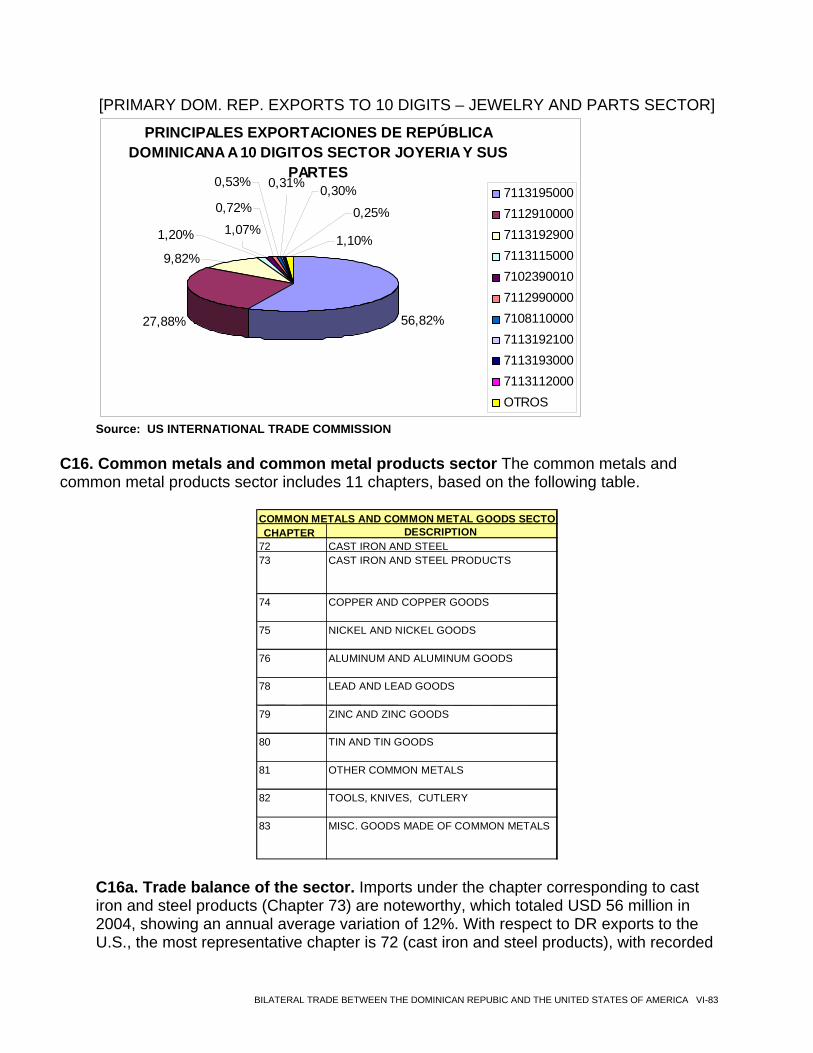
[PRIMARY DOM. REP. EXPORTS TO 10 DIGITS – JEWELRY AND PARTS SECTOR]
PRINCIPALES EXPORTACIONES DE REPÚBLICA DOMINICANA A 10 DIGITOS SECTOR JOYERIA Y SUS
PARTES
56,82%27,88%
1,07%
0,72%
9,82%
1,20% 1,10%
0,25%
0,30%0,53% 0,31%
7113195000711291000071131929007113115000710239001071129900007108110000711319210071131930007113112000OTROS
Source: US INTERNATIONAL TRADE COMMISSION
C16. Common metals and common metal products sector The common metals and common metal products sector includes 11 chapters, based on the following table.
COMMON METALS AND COMMON METAL GOODS SECTO
CHAPTER DESCRIPTION72 CAST IRON AND STEEL73 CAST IRON AND STEEL PRODUCTS
74 COPPER AND COPPER GOODS
75 NICKEL AND NICKEL GOODS
76 ALUMINUM AND ALUMINUM GOODS
78 LEAD AND LEAD GOODS
79 ZINC AND ZINC GOODS
80 TIN AND TIN GOODS
81 OTHER COMMON METALS
82 TOOLS, KNIVES, CUTLERY
83 MISC. GOODS MADE OF COMMON METALS
C16a. Trade balance of the sector. Imports under the chapter corresponding to cast iron and steel products (Chapter 73) are noteworthy, which totaled USD 56 million in 2004, showing an annual average variation of 12%. With respect to DR exports to the U.S., the most representative chapter is 72 (cast iron and steel products), with recorded
BILATERAL TRADE BETWEEN THE DOMINICAN REPUBIC AND THE UNITED STATES OF AMERICA VI-83
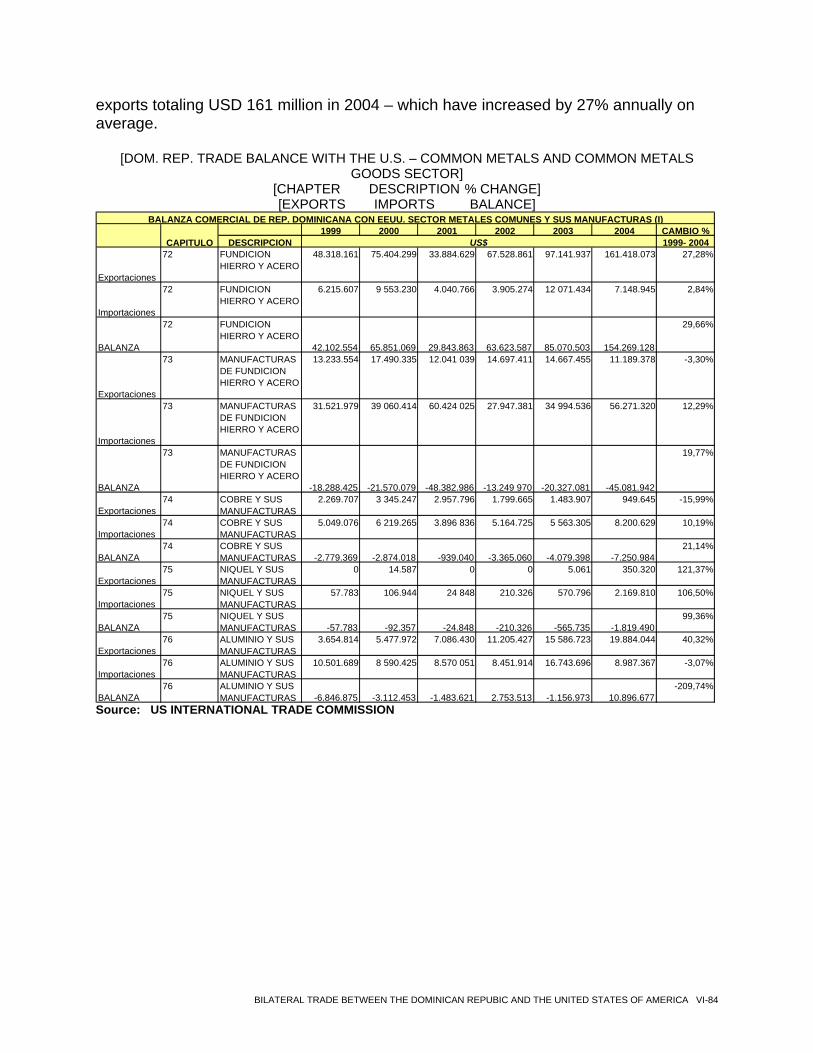
exports totaling USD 161 million in 2004 – which have increased by 27% annually on average.
[DOM. REP. TRADE BALANCE WITH THE U.S. – COMMON METALS AND COMMON METALS GOODS SECTOR]
[CHAPTER DESCRIPTION % CHANGE] [EXPORTS IMPORTS BALANCE]
1999 2000 2001 2002 2003 2004 CAMBIO %DESCRIPCION 1999- 2004
Exportaciones
72 FUNDICION HIERRO Y ACERO
48.318.161 75.404.299 33.884.629 67.528.861 97.141.937 161.418.073 27,28%
Importaciones
72 FUNDICION HIERRO Y ACERO
6.215.607 9 553.230 4.040.766 3.905.274 12 071.434 7.148.945 2,84%
BALANZA
72 FUNDICION HIERRO Y ACERO
42.102.554 65.851.069 29.843.863 63.623.587 85.070.503 154.269.128
29,66%
Exportaciones
73 MANUFACTURAS DE FUNDICION HIERRO Y ACERO
13.233.554 17.490.335 12.041 039 14.697.411 14.667.455 11.189.378 -3,30%
Importaciones
73 MANUFACTURAS DE FUNDICION HIERRO Y ACERO
31.521.979 39 060.414 60.424 025 27.947.381 34 994.536 56.271.320 12,29%
BALANZA
73 MANUFACTURAS DE FUNDICION HIERRO Y ACERO
-18.288.425 -21.570.079 -48.382.986 -13.249 970 -20.327.081 -45.081.942
19,77%
Exportaciones74 COBRE Y SUS
MANUFACTURAS2.269.707 3 345.247 2.957.796 1.799.665 1.483.907 949.645 -15,99%
Importaciones74 COBRE Y SUS
MANUFACTURAS5.049.076 6 219.265 3.896 836 5.164.725 5 563.305 8.200.629 10,19%
BALANZA 74 COBRE Y SUS
MANUFACTURAS -2.779.369 -2.874.018 -939.040 -3.365.060 -4.079.398 -7.250.98421,14%
Exportaciones75 NIQUEL Y SUS
MANUFACTURAS0 14.587 0 0 5.061 350.320 121,37%
Importaciones75 NIQUEL Y SUS
MANUFACTURAS57.783 106.944 24 848 210.326 570.796 2.169.810 106,50%
BALANZA 75 NIQUEL Y SUS
MANUFACTURAS -57.783 -92.357 -24.848 -210.326 -565.735 -1.819.49099,36%
Exportaciones76 ALUMINIO Y SUS
MANUFACTURAS3.654.814 5.477.972 7.086.430 11.205.427 15 586.723 19.884.044 40,32%
Importaciones76 ALUMINIO Y SUS
MANUFACTURAS10.501.689 8 590.425 8.570 051 8.451.914 16.743.696 8.987.367 -3,07%
BALANZA 76 ALUMINIO Y SUS
MANUFACTURAS -6.846.875 -3.112.453 -1.483.621 2.753.513 -1.156.973 10.896.677-209,74%
BALANZA COMERCIAL DE REP. DOMINICANA CON EEUU. SECTOR METALES COMUNES Y SUS MANUFACTURAS (I)
CAPITULO US$
Source: US INTERNATIONAL TRADE COMMISSION
BILATERAL TRADE BETWEEN THE DOMINICAN REPUBIC AND THE UNITED STATES OF AMERICA VI-84
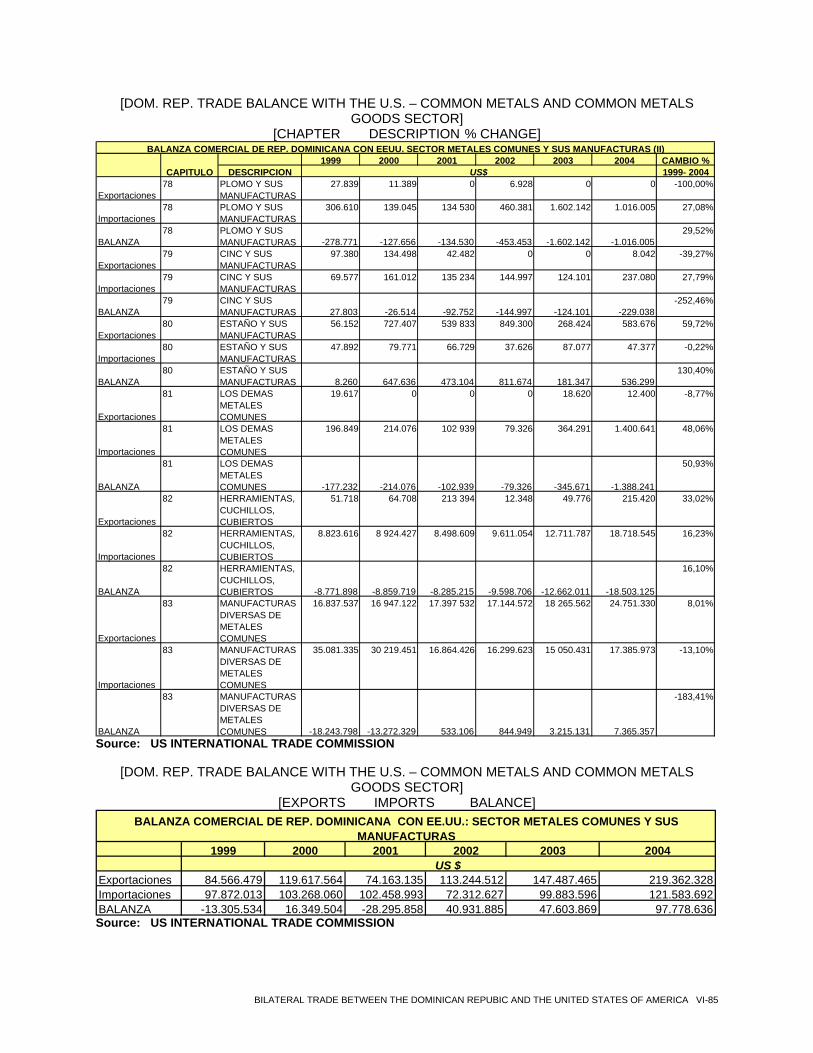
[DOM. REP. TRADE BALANCE WITH THE U.S. – COMMON METALS AND COMMON METALS GOODS SECTOR]
[CHAPTER DESCRIPTION % CHANGE]
1999 2000 2001 2002 2003 2004 CAMBIO %DESCRIPCION 1999- 2004
Exportaciones78 PLOMO Y SUS
MANUFACTURAS27.839 11.389 0 6.928 0 0 -100,00%
Importaciones78 PLOMO Y SUS
MANUFACTURAS306.610 139.045 134 530 460.381 1.602.142 1.016.005 27,08%
BALANZA 78 PLOMO Y SUS
MANUFACTURAS -278.771 -127.656 -134.530 -453.453 -1.602.142 -1.016.00529,52%
Exportaciones79 CINC Y SUS
MANUFACTURAS97.380 134.498 42.482 0 0 8.042 -39,27%
Importaciones79 CINC Y SUS
MANUFACTURAS69.577 161.012 135 234 144.997 124.101 237.080 27,79%
BALANZA 79 CINC Y SUS
MANUFACTURAS 27.803 -26.514 -92.752 -144.997 -124.101 -229.038-252,46%
Exportaciones80 ESTAÑO Y SUS
MANUFACTURAS56.152 727.407 539 833 849.300 268.424 583.676 59,72%
Importaciones80 ESTAÑO Y SUS
MANUFACTURAS47.892 79.771 66.729 37.626 87.077 47.377 -0,22%
BALANZA 80 ESTAÑO Y SUS
MANUFACTURAS 8.260 647.636 473.104 811.674 181.347 536.299130,40%
Exportaciones
81 LOS DEMAS METALES COMUNES
19.617 0 0 0 18.620 12.400 -8,77%
Importaciones
81 LOS DEMAS METALES COMUNES
196.849 214.076 102 939 79.326 364.291 1.400.641 48,06%
BALANZA
81 LOS DEMAS METALES COMUNES -177.232 -214.076 -102.939 -79.326 -345.671 -1.388.241
50,93%
Exportaciones
82 HERRAMIENTAS, CUCHILLOS, CUBIERTOS
51.718 64.708 213 394 12.348 49.776 215.420 33,02%
Importaciones
82 HERRAMIENTAS, CUCHILLOS, CUBIERTOS
8.823.616 8 924.427 8.498.609 9.611.054 12.711.787 18.718.545 16,23%
BALANZA
82 HERRAMIENTAS, CUCHILLOS, CUBIERTOS -8.771.898 -8.859.719 -8.285.215 -9.598.706 -12.662.011 -18.503.125
16,10%
Exportaciones
83 MANUFACTURAS DIVERSAS DE METALES COMUNES
16.837.537 16 947.122 17.397 532 17.144.572 18 265.562 24.751.330 8,01%
Importaciones
83 MANUFACTURAS DIVERSAS DE METALES COMUNES
35.081.335 30 219.451 16.864.426 16.299.623 15 050.431 17.385.973 -13,10%
BALANZA
83 MANUFACTURAS DIVERSAS DE METALES COMUNES -18.243.798 -13.272.329 533.106 844.949 3.215.131 7.365.357
-183,41%
BALANZA COMERCIAL DE REP. DOMINICANA CON EEUU. SECTOR METALES COMUNES Y SUS MANUFACTURAS (II)
CAPITULO US$
Source: US INTERNATIONAL TRADE COMMISSION
[DOM. REP. TRADE BALANCE WITH THE U.S. – COMMON METALS AND COMMON METALS GOODS SECTOR]
[EXPORTS IMPORTS BALANCE]
1999 2000 2001 2002 2003 2004
Exportaciones 84.566.479 119.617.564 74.163.135 113.244.512 147.487.465 219.362.328Importaciones 97.872.013 103.268.060 102.458.993 72.312.627 99.883.596 121.583.692BALANZA -13.305.534 16.349.504 -28.295.858 40.931.885 47.603.869 97.778.636
US $
BALANZA COMERCIAL DE REP. DOMINICANA CON EE.UU.: SECTOR METALES COMUNES Y SUS MANUFACTURAS
Source: US INTERNATIONAL TRADE COMMISSION
BILATERAL TRADE BETWEEN THE DOMINICAN REPUBIC AND THE UNITED STATES OF AMERICA VI-85
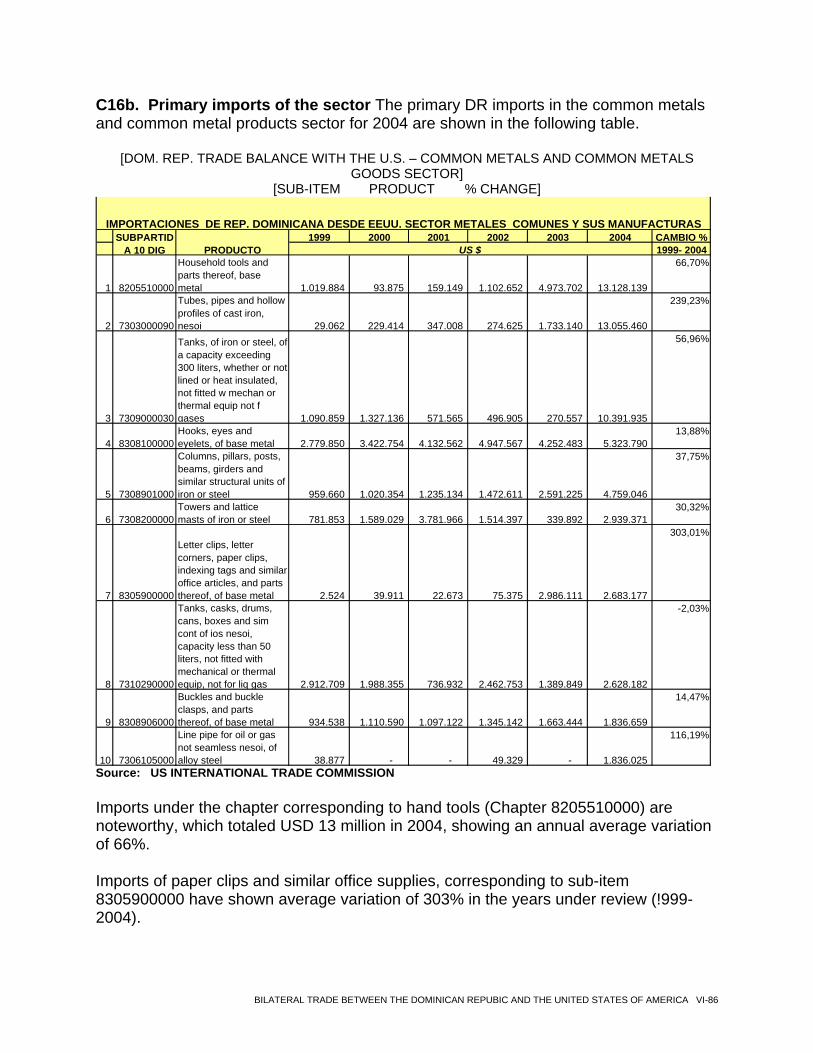
C16b. Primary imports of the sector The primary DR imports in the common metals and common metal products sector for 2004 are shown in the following table.
[DOM. REP. TRADE BALANCE WITH THE U.S. – COMMON METALS AND COMMON METALS GOODS SECTOR]
[SUB-ITEM PRODUCT % CHANGE]
1999 2000 2001 2002 2003 2004 CAMBIO %1999- 2004
1 8205510000
Household tools and parts thereof, base metal 1.019.884 93.875 159.149 1.102.652 4.973.702 13.128.139
66,70%
2 7303000090
Tubes, pipes and hollow profiles of cast iron, nesoi 29.062 229.414 347.008 274.625 1.733.140 13.055.460
239,23%
3 7309000030
Tanks, of iron or steel, of a capacity exceeding 300 liters, whether or not lined or heat insulated, not fitted w mechan or thermal equip not f gases 1.090.859 1.327.136 571.565 496.905 270.557 10.391.935
56,96%
4 8308100000Hooks, eyes and eyelets, of base metal 2.779.850 3.422.754 4.132.562 4.947.567 4.252.483 5.323.790
13,88%
5 7308901000
Columns, pillars, posts, beams, girders and similar structural units of iron or steel 959.660 1.020.354 1.235.134 1.472.611 2.591.225 4.759.046
37,75%
6 7308200000Towers and lattice masts of iron or steel 781.853 1.589.029 3.781.966 1.514.397 339.892 2.939.371
30,32%
7 8305900000
Letter clips, letter corners, paper clips, indexing tags and similar office articles, and parts thereof, of base metal 2.524 39.911 22.673 75.375 2.986.111 2.683.177
303,01%
8 7310290000
Tanks, casks, drums, cans, boxes and sim cont of ios nesoi, capacity less than 50 liters, not fitted with mechanical or thermal equip, not for liq gas 2.912.709 1.988.355 736.932 2.462.753 1.389.849 2.628.182
-2,03%
9 8308906000
Buckles and buckle clasps, and parts thereof, of base metal 934.538 1.110.590 1.097.122 1.345.142 1.663.444 1.836.659
14,47%
10 7306105000
Line pipe for oil or gas not seamless nesoi, of alloy steel 38.877 - - 49.329 - 1.836.025
116,19%
SUBPARTIDA 10 DIG PRODUCTO US $
IMPORTACIONES DE REP. DOMINICANA DESDE EEUU. SECTOR METALES COMUNES Y SUS MANUFACTURAS
Source: US INTERNATIONAL TRADE COMMISSION
Imports under the chapter corresponding to hand tools (Chapter 8205510000) are noteworthy, which totaled USD 13 million in 2004, showing an annual average variation of 66%. Imports of paper clips and similar office supplies, corresponding to sub-item 8305900000 have shown average variation of 303% in the years under review (!999-2004).
BILATERAL TRADE BETWEEN THE DOMINICAN REPUBIC AND THE UNITED STATES OF AMERICA VI-86
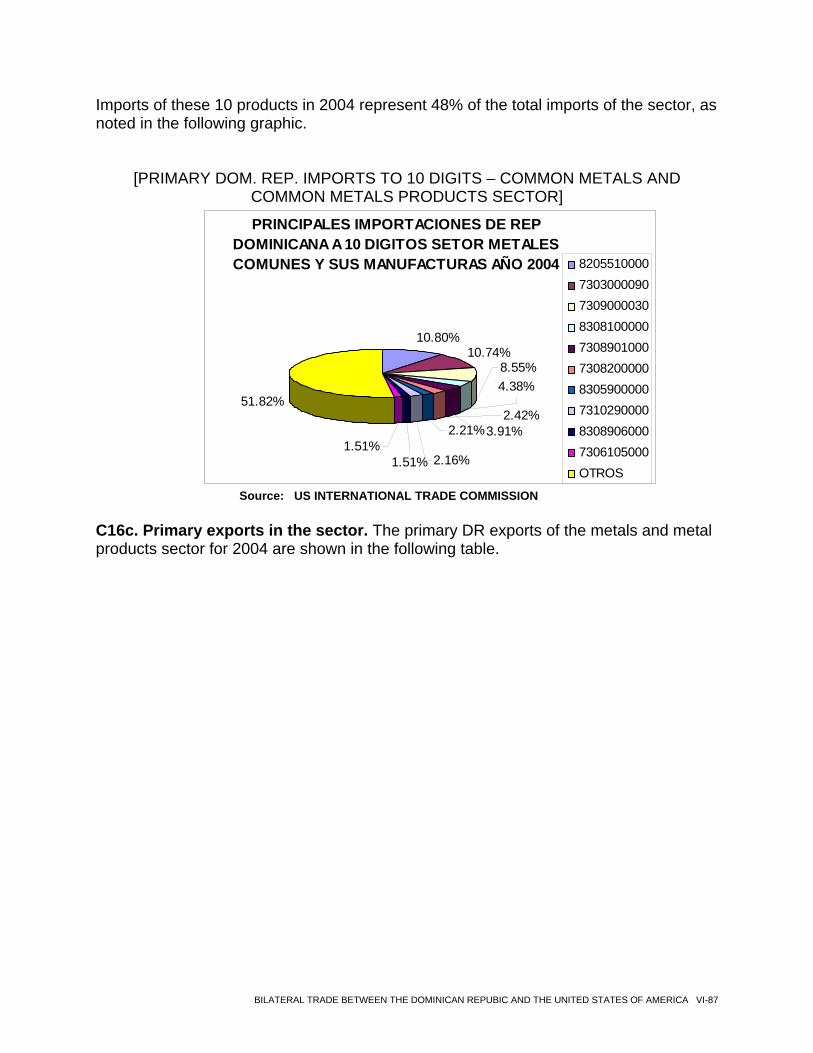
Imports of these 10 products in 2004 represent 48% of the total imports of the sector, as noted in the following graphic.
[PRIMARY DOM. REP. IMPORTS TO 10 DIGITS – COMMON METALS AND COMMON METALS PRODUCTS SECTOR]
PRINCIPALES IMPORTACIONES DE REP DOMINICANA A 10 DIGITOS SETOR METALES COMUNES Y SUS MANUFACTURAS AÑO 2004
10.80%10.74%
51.82%
1.51%1.51%
2.21%
2.16%
3.91%2.42%
4.38%8.55%
8205510000730300009073090000308308100000730890100073082000008305900000731029000083089060007306105000OTROS
Source: US INTERNATIONAL TRADE COMMISSION
C16c. Primary exports in the sector. The primary DR exports of the metals and metal products sector for 2004 are shown in the following table.
BILATERAL TRADE BETWEEN THE DOMINICAN REPUBIC AND THE UNITED STATES OF AMERICA VI-87
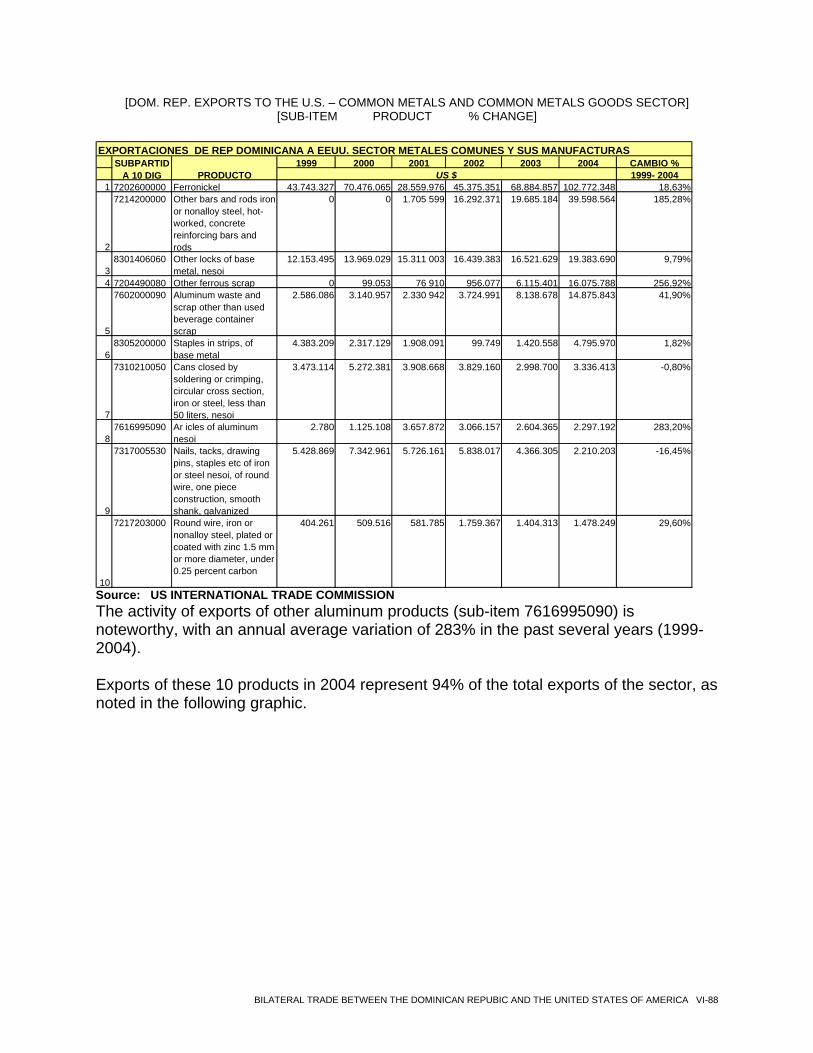
[DOM. REP. EXPORTS TO THE U.S. – COMMON METALS AND COMMON METALS GOODS SECTOR] [SUB-ITEM PRODUCT % CHANGE]
EXPORTACIONES DE REP DOMINICANA A EEUU. SECTOR METALES COMUNES Y SUS MANUFACTURAS
1999 2000 2001 2002 2003 2004 CAMBIO %1999- 2004
1 7202600000 Ferronickel 43.743.327 70.476.065 28.559.976 45.375.351 68.884.857 102.772.348 18,63%
2
7214200000 Other bars and rods iron or nonalloy steel, hot-worked, concrete reinforcing bars and rods
0 0 1.705 599 16.292.371 19.685.184 39.598.564 185,28%
38301406060 Other locks of base
metal, nesoi12.153.495 13.969.029 15.311 003 16.439.383 16.521.629 19.383.690 9,79%
4 7204490080 Other ferrous scrap 0 99.053 76 910 956.077 6.115.401 16.075.788 256,92%
5
7602000090 Aluminum waste and scrap other than used beverage container scrap
2.586.086 3.140.957 2.330 942 3.724.991 8.138.678 14.875.843 41,90%
68305200000 Staples in strips, of
base metal4.383.209 2.317.129 1.908.091 99.749 1.420.558 4.795.970 1,82%
7
7310210050 Cans closed by soldering or crimping, circular cross section, iron or steel, less than 50 liters, nesoi
3.473.114 5.272.381 3.908.668 3.829.160 2.998.700 3.336.413 -0,80%
87616995090 Ar icles of aluminum
nesoi2.780 1.125.108 3.657.872 3.066.157 2.604.365 2.297.192 283,20%
9
7317005530 Nails, tacks, drawing pins, staples etc of iron or steel nesoi, of round wire, one piece construction, smooth shank, galvanized
5.428.869 7.342.961 5.726.161 5.838.017 4.366.305 2.210.203 -16,45%
10
7217203000 Round wire, iron or nonalloy steel, plated or coated with zinc 1.5 mm or more diameter, under 0.25 percent carbon
404.261 509.516 581.785 1.759.367 1.404.313 1.478.249 29,60%
SUBPARTIDA 10 DIG PRODUCTO US $
Source: US INTERNATIONAL TRADE COMMISSION The activity of exports of other aluminum products (sub-item 7616995090) is noteworthy, with an annual average variation of 283% in the past several years (1999-2004).
Exports of these 10 products in 2004 represent 94% of the total exports of the sector, as noted in the following graphic.
BILATERAL TRADE BETWEEN THE DOMINICAN REPUBIC AND THE UNITED STATES OF AMERICA VI-88
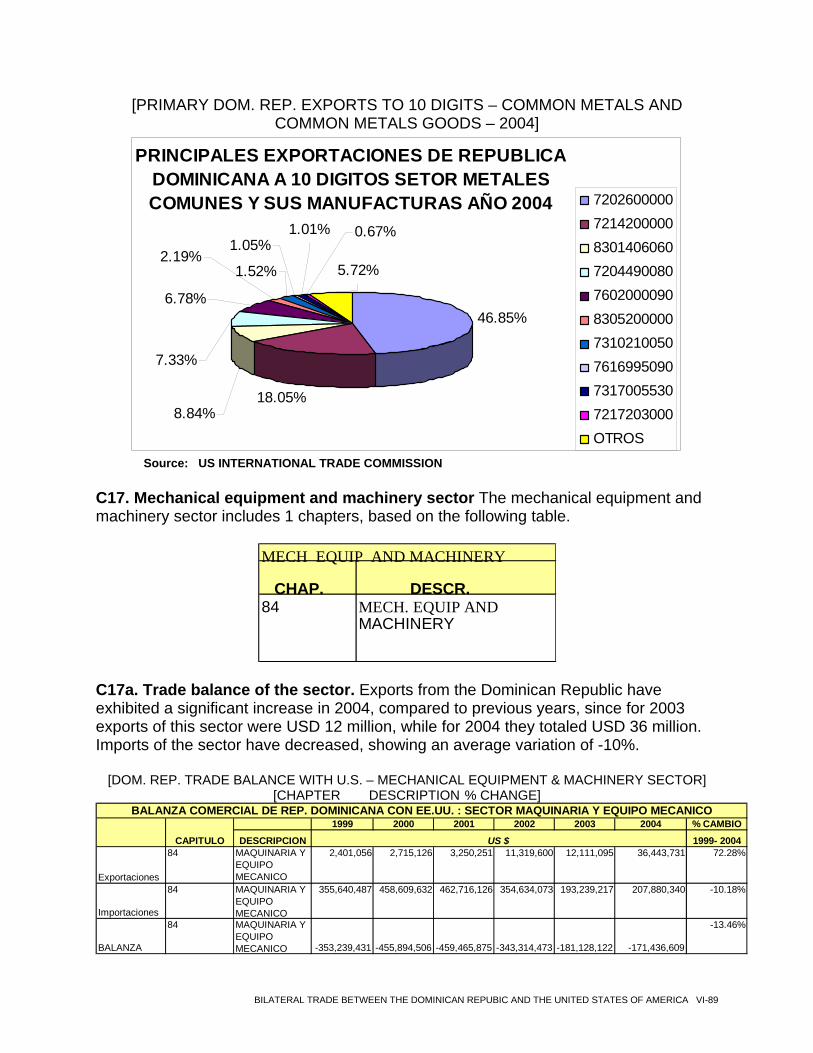
[PRIMARY DOM. REP. EXPORTS TO 10 DIGITS – COMMON METALS AND COMMON METALS GOODS – 2004]
PRINCIPALES EXPORTACIONES DE REPUBLICA DOMINICANA A 10 DIGITOS SETOR METALES COMUNES Y SUS MANUFACTURAS AÑO 2004
46.85%
18.05%
5.72%
8.84%
7.33%
2.19%
6.78%
1.05%
1.52%
1.01% 0.67%
7202600000721420000083014060607204490080760200009083052000007310210050761699509073170055307217203000OTROS
Source: US INTERNATIONAL TRADE COMMISSION
C17. Mechanical equipment and machinery sector The mechanical equipment and machinery sector includes 1 chapters, based on the following table.
MECH EQUIP AND MACHINERY
CHAP. DESCR. 84 MECH. EQUIP AND
MACHINERY
C17a. Trade balance of the sector. Exports from the Dominican Republic have exhibited a significant increase in 2004, compared to previous years, since for 2003 exports of this sector were USD 12 million, while for 2004 they totaled USD 36 million. Imports of the sector have decreased, showing an average variation of -10%.
[DOM. REP. TRADE BALANCE WITH U.S. – MECHANICAL EQUIPMENT & MACHINERY SECTOR]
[CHAPTER DESCRIPTION % CHANGE]
1999 2000 2001 2002 2003 2004 % CAMBIO
DESCRIPCION 1999- 2004
Exportaciones
84 MAQUINARIA Y EQUIPO MECANICO
2,401,056 2,715,126 3,250,251 11,319,600 12,111,095 36,443,731 72.28%
Importaciones
84 MAQUINARIA Y EQUIPO MECANICO
355,640,487 458,609,632 462,716,126 354,634,073 193,239,217 207,880,340 -10.18%
BALANZA
84 MAQUINARIA Y EQUIPO MECANICO -353,239,431 -455,894,506 -459,465,875 -343,314,473 -181,128,122 -171,436,609
-13.46%
BALANZA COMERCIAL DE REP. DOMINICANA CON EE.UU. : SECTOR MAQUINARIA Y EQUIPO MECANICO
CAPITULO US $
BILATERAL TRADE BETWEEN THE DOMINICAN REPUBIC AND THE UNITED STATES OF AMERICA VI-89
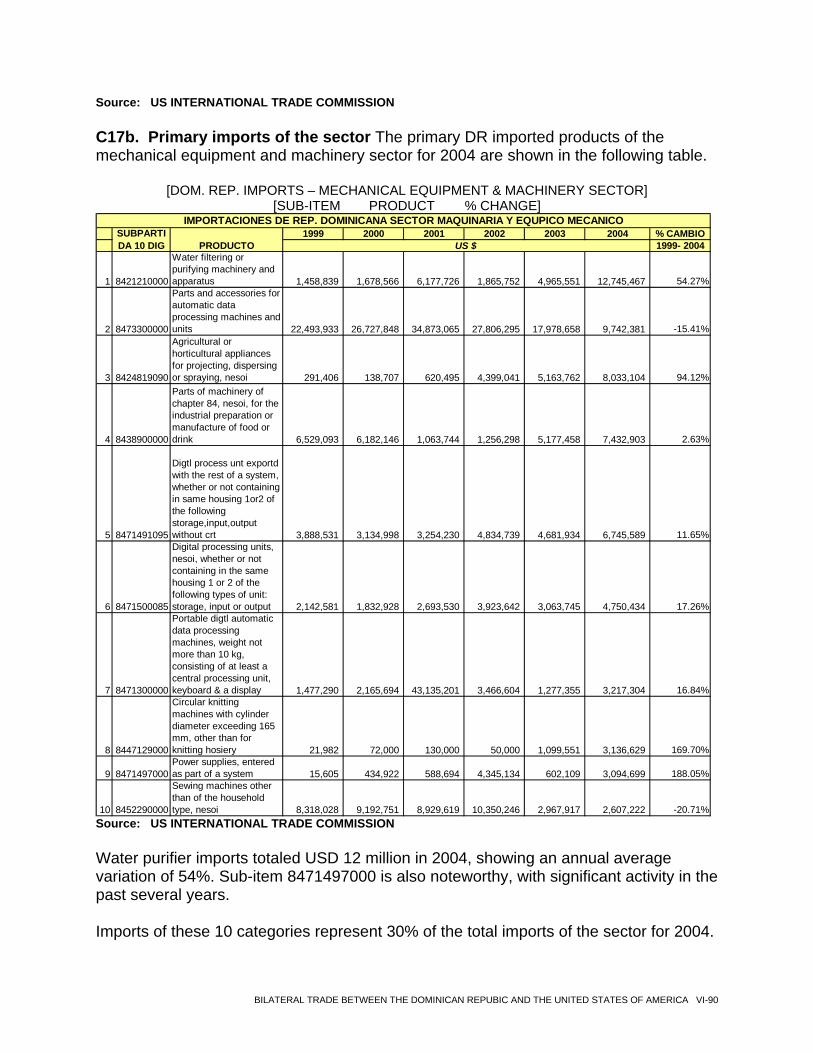
Source: US INTERNATIONAL TRADE COMMISSION
C17b. Primary imports of the sector The primary DR imported products of the mechanical equipment and machinery sector for 2004 are shown in the following table.
[DOM. REP. IMPORTS – MECHANICAL EQUIPMENT & MACHINERY SECTOR] [SUB-ITEM PRODUCT % CHANGE]
1999 2000 2001 2002 2003 2004 % CAMBIO1999- 2004
1 8421210000
Water filtering or purifying machinery and apparatus 1,458,839 1,678,566 6,177,726 1,865,752 4,965,551 12,745,467 54.27%
2 8473300000
Parts and accessories for automatic data processing machines and units 22,493,933 26,727,848 34,873,065 27,806,295 17,978,658 9,742,381 -15.41%
3 8424819090
Agricultural or horticultural appliances for projecting, dispersing or spraying, nesoi 291,406 138,707 620,495 4,399,041 5,163,762 8,033,104 94.12%
4 8438900000
Parts of machinery of chapter 84, nesoi, for the industrial preparation or manufacture of food or drink 6,529,093 6,182,146 1,063,744 1,256,298 5,177,458 7,432,903 2.63%
5 8471491095
Digtl process unt exportd with the rest of a system, whether or not containing in same housing 1or2 of the following storage,input,output without crt 3,888,531 3,134,998 3,254,230 4,834,739 4,681,934 6,745,589 11.65%
6 8471500085
Digital processing units, nesoi, whether or not containing in the same housing 1 or 2 of the following types of unit: storage, input or output 2,142,581 1,832,928 2,693,530 3,923,642 3,063,745 4,750,434 17.26%
7 8471300000
Portable digtl automatic data processing machines, weight not more than 10 kg, consisting of at least a central processing unit, keyboard & a display 1,477,290 2,165,694 43,135,201 3,466,604 1,277,355 3,217,304 16.84%
8 8447129000
Circular knitting machines with cylinder diameter exceeding 165 mm, other than for knitting hosiery 21,982 72,000 130,000 50,000 1,099,551 3,136,629 169.70%
9 8471497000Power supplies, entered as part of a system 15,605 434,922 588,694 4,345,134 602,109 3,094,699 188.05%
10 8452290000
Sewing machines other than of the household type, nesoi 8,318,028 9,192,751 8,929,619 10,350,246 2,967,917 2,607,222 -20.71%
SUBPARTIDA 10 DIG PRODUCTO US $
IMPORTACIONES DE REP. DOMINICANA SECTOR MAQUINARIA Y EQUPICO MECANICO
Source: US INTERNATIONAL TRADE COMMISSION Water purifier imports totaled USD 12 million in 2004, showing an annual average variation of 54%. Sub-item 8471497000 is also noteworthy, with significant activity in the past several years.
Imports of these 10 categories represent 30% of the total imports of the sector for 2004.
BILATERAL TRADE BETWEEN THE DOMINICAN REPUBIC AND THE UNITED STATES OF AMERICA VI-90
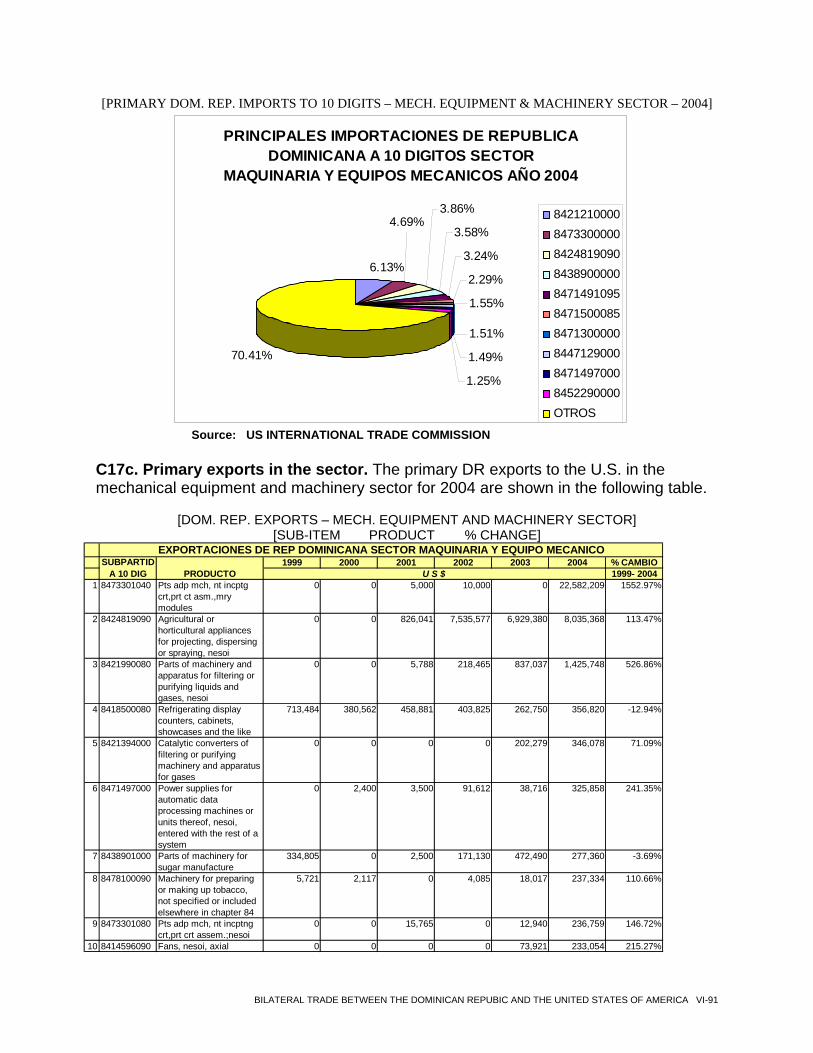
[PRIMARY DOM. REP. IMPORTS TO 10 DIGITS – MECH. EQUIPMENT & MACHINERY SECTOR – 2004]
PRINCIPALES IMPORTACIONES DE REPUBLICA DOMINICANA A 10 DIGITOS SECTOR
MAQUINARIA Y EQUIPOS MECANICOS AÑO 2004
6.13%
3.86%
3.58%
3.24%
2.29%
1.55%
1.51%
1.49%
1.25%
70.41%
4.69% 8421210000847330000084248190908438900000847149109584715000858471300000844712900084714970008452290000OTROS
Source: US INTERNATIONAL TRADE COMMISSION
C17c. Primary exports in the sector. The primary DR exports to the U.S. in the mechanical equipment and machinery sector for 2004 are shown in the following table.
[DOM. REP. EXPORTS – MECH. EQUIPMENT AND MACHINERY SECTOR]
[SUB-ITEM PRODUCT % CHANGE]
1999 2000 2001 2002 2003 2004 % CAMBIO1999- 2004
1 8473301040 Pts adp mch, nt incptg crt,prt ct asm.,mry modules
0 0 5,000 10,000 0 22,582,209 1552.97%
2 8424819090 Agricultural or horticultural appliances for projecting, dispersing or spraying, nesoi
0 0 826,041 7,535,577 6,929,380 8,035,368 113.47%
3 8421990080 Parts of machinery and apparatus for filtering or purifying liquids and gases, nesoi
0 0 5,788 218,465 837,037 1,425,748 526.86%
4 8418500080 Refrigerating display counters, cabinets, showcases and the like
713,484 380,562 458,881 403,825 262,750 356,820 -12.94%
5 8421394000 Catalytic converters of filtering or purifying machinery and apparatus for gases
0 0 0 0 202,279 346,078 71.09%
6 8471497000 Power supplies for automatic data processing machines or units thereof, nesoi, entered with the rest of a system
0 2,400 3,500 91,612 38,716 325,858 241.35%
7 8438901000 Parts of machinery for sugar manufacture
334,805 0 2,500 171,130 472,490 277,360 -3.69%
8 8478100090 Machinery for preparing or making up tobacco, not specified or included elsewhere in chapter 84
5,721 2,117 0 4,085 18,017 237,334 110.66%
9 8473301080 Pts adp mch, nt incptng crt,prt crt assem.;nesoi
0 0 15,765 0 12,940 236,759 146.72%
10 8414596090 Fans, nesoi, axial 0 0 0 0 73,921 233,054 215.27%
EXPORTACIONES DE REP DOMINICANA SECTOR MAQUINARIA Y EQUIPO MECANICOSUBPARTID
A 10 DIG PRODUCTO U S $
BILATERAL TRADE BETWEEN THE DOMINICAN REPUBIC AND THE UNITED STATES OF AMERICA VI-91
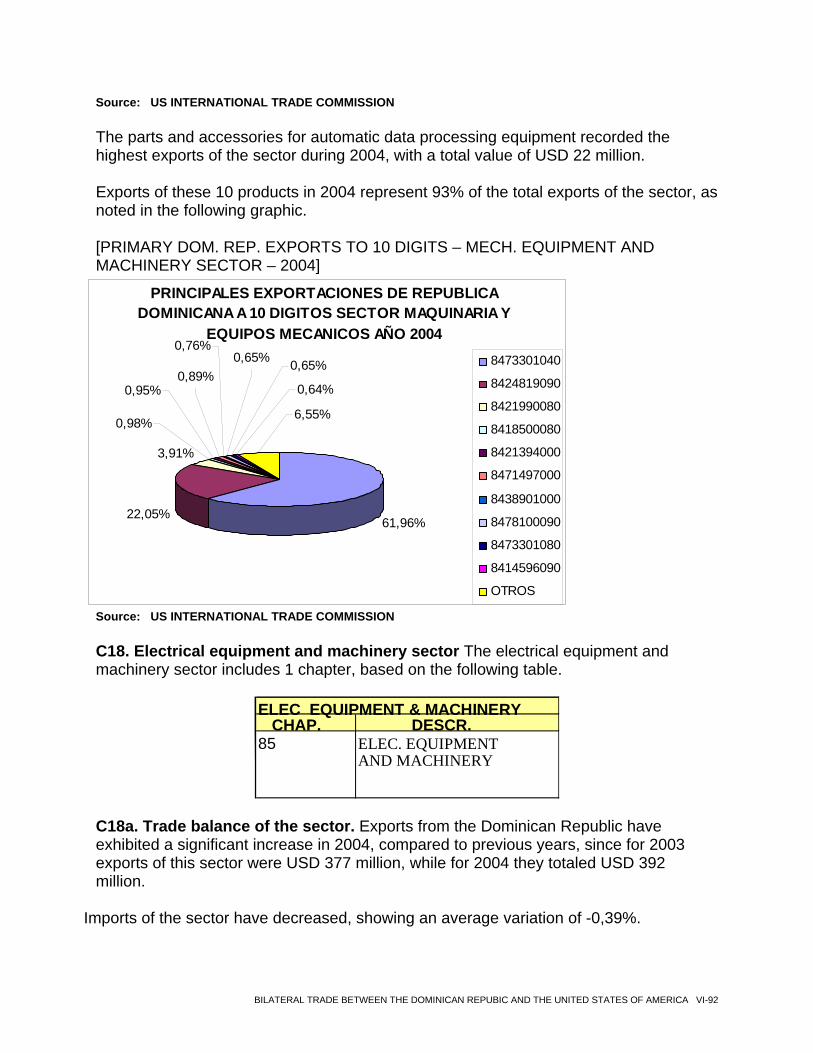
Source: US INTERNATIONAL TRADE COMMISSION The parts and accessories for automatic data processing equipment recorded the highest exports of the sector during 2004, with a total value of USD 22 million. Exports of these 10 products in 2004 represent 93% of the total exports of the sector, as noted in the following graphic. [PRIMARY DOM. REP. EXPORTS TO 10 DIGITS – MECH. EQUIPMENT AND MACHINERY SECTOR – 2004]
PRINCIPALES EXPORTACIONES DE REPUBLICA DOMINICANA A 10 DIGITOS SECTOR MAQUINARIA Y
EQUIPOS MECANICOS AÑO 2004
61,96%22,05%
3,91%
0,98%
0,95%0,89%
0,65%0,76%
0,65%
0,64%
6,55%
8473301040
8424819090
8421990080
8418500080
8421394000
8471497000
8438901000
8478100090
8473301080
8414596090
OTROS
Source: US INTERNATIONAL TRADE COMMISSION C18. Electrical equipment and machinery sector The electrical equipment and machinery sector includes 1 chapter, based on the following table.
ELEC EQUIPMENT & MACHINERY CHAP. DESCR.
85 ELEC. EQUIPMENT AND MACHINERY
C18a. Trade balance of the sector. Exports from the Dominican Republic have exhibited a significant increase in 2004, compared to previous years, since for 2003 exports of this sector were USD 377 million, while for 2004 they totaled USD 392 million.
Imports of the sector have decreased, showing an average variation of -0,39%.
BILATERAL TRADE BETWEEN THE DOMINICAN REPUBIC AND THE UNITED STATES OF AMERICA VI-92
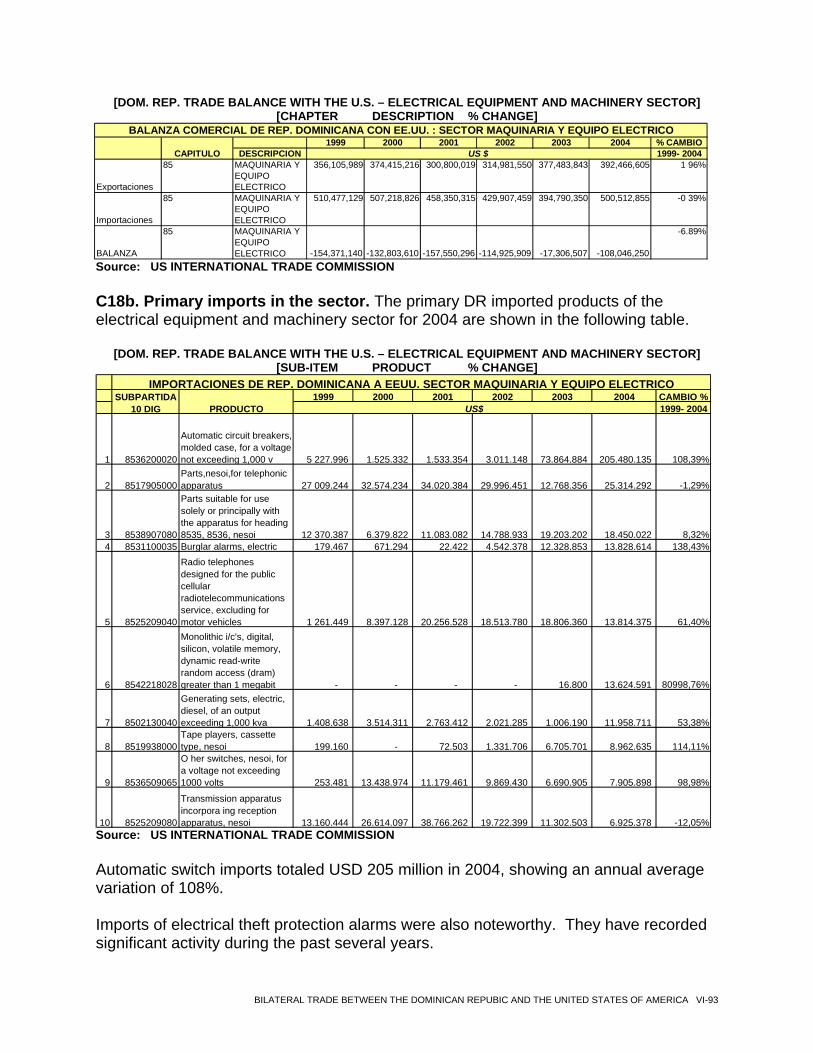
[DOM. REP. TRADE BALANCE WITH THE U.S. – ELECTRICAL EQUIPMENT AND MACHINERY SECTOR] [CHAPTER DESCRIPTION % CHANGE]
1999 2000 2001 2002 2003 2004 % CAMBIODESCRIPCION 1999- 2004
Exportaciones
85 MAQUINARIA Y EQUIPO ELECTRICO
356,105,989 374,415,216 300,800,019 314,981,550 377,483,843 392,466,605 1 96%
Importaciones
85 MAQUINARIA Y EQUIPO ELECTRICO
510,477,129 507,218,826 458,350,315 429,907,459 394,790,350 500,512,855 -0 39%
BALANZA
85 MAQUINARIA Y EQUIPO ELECTRICO -154,371,140 -132,803,610 -157,550,296 -114,925,909 -17,306,507 -108,046,250
-6.89%
BALANZA COMERCIAL DE REP. DOMINICANA CON EE.UU. : SECTOR MAQUINARIA Y EQUIPO ELECTRICO
CAPITULO US $
Source: US INTERNATIONAL TRADE COMMISSION
C18b. Primary imports in the sector. The primary DR imported products of the electrical equipment and machinery sector for 2004 are shown in the following table.
[DOM. REP. TRADE BALANCE WITH THE U.S. – ELECTRICAL EQUIPMENT AND MACHINERY SECTOR] [SUB-ITEM PRODUCT % CHANGE]
1999 2000 2001 2002 2003 2004 CAMBIO %1999- 2004
1 8536200020
Automatic circuit breakers, molded case, for a voltage not exceeding 1,000 v 5 227.996 1.525.332 1.533.354 3.011.148 73.864.884 205.480.135 108,39%
2 8517905000Parts,nesoi,for telephonic apparatus 27 009.244 32.574.234 34.020.384 29.996.451 12.768.356 25.314.292 -1,29%
3 8538907080
Parts suitable for use solely or principally with the apparatus for heading 8535, 8536, nesoi 12 370.387 6.379.822 11.083.082 14.788.933 19.203.202 18.450.022 8,32%
4 8531100035 Burglar alarms, electric 179.467 671.294 22.422 4.542.378 12.328.853 13.828.614 138,43%
5 8525209040
Radio telephones designed for the public cellular radiotelecommunications service, excluding for motor vehicles 1 261.449 8.397.128 20.256.528 18.513.780 18.806.360 13.814.375 61,40%
6 8542218028
Monolithic i/c's, digital, silicon, volatile memory, dynamic read-write random access (dram) greater than 1 megabit - - - - 16.800 13.624.591 80998,76%
7 8502130040
Generating sets, electric, diesel, of an output exceeding 1,000 kva 1.408.638 3.514.311 2.763.412 2.021.285 1.006.190 11.958.711 53,38%
8 8519938000Tape players, cassette type, nesoi 199.160 - 72.503 1.331.706 6.705.701 8.962.635 114,11%
9 8536509065
O her switches, nesoi, for a voltage not exceeding 1000 volts 253.481 13.438.974 11.179.461 9.869.430 6.690.905 7.905.898 98,98%
10 8525209080
Transmission apparatus incorpora ing reception apparatus, nesoi 13.160.444 26.614.097 38.766.262 19.722.399 11.302.503 6.925.378 -12,05%
IMPORTACIONES DE REP. DOMINICANA A EEUU. SECTOR MAQUINARIA Y EQUIPO ELECTRICOSUBPARTIDA
10 DIG PRODUCTO US$
Source: US INTERNATIONAL TRADE COMMISSION
Automatic switch imports totaled USD 205 million in 2004, showing an annual average variation of 108%. Imports of electrical theft protection alarms were also noteworthy. They have recorded significant activity during the past several years.
BILATERAL TRADE BETWEEN THE DOMINICAN REPUBIC AND THE UNITED STATES OF AMERICA VI-93
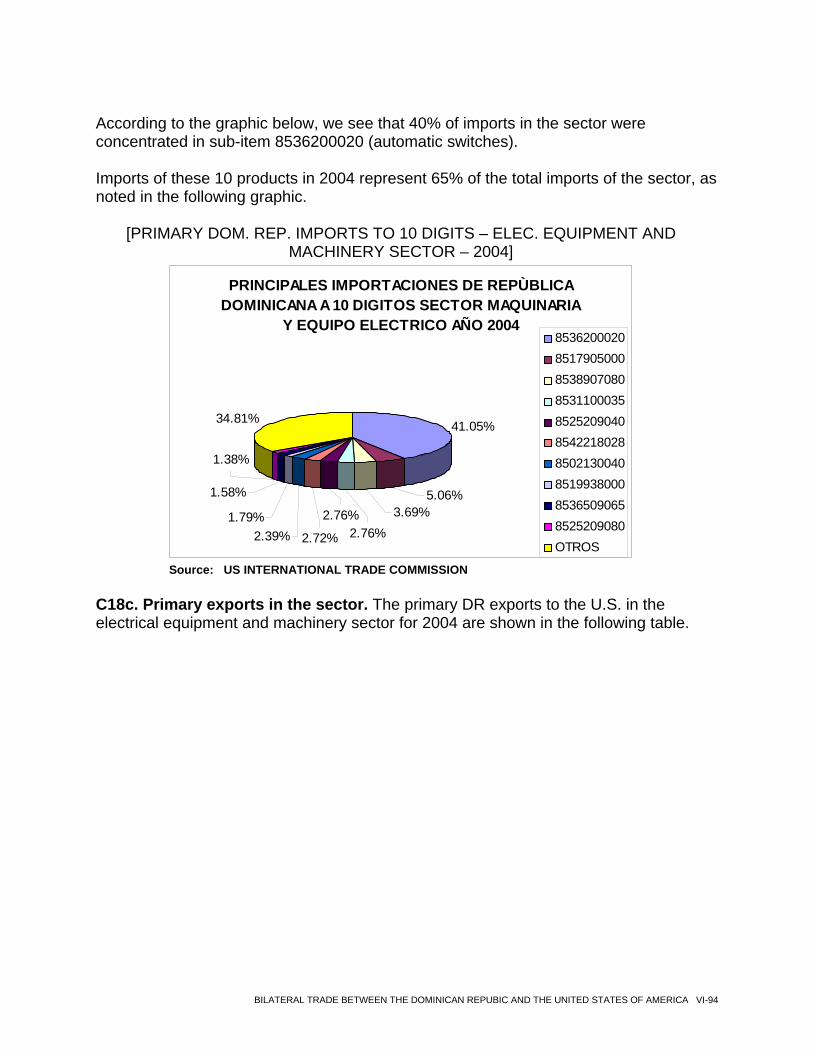
According to the graphic below, we see that 40% of imports in the sector were concentrated in sub-item 8536200020 (automatic switches). Imports of these 10 products in 2004 represent 65% of the total imports of the sector, as noted in the following graphic.
[PRIMARY DOM. REP. IMPORTS TO 10 DIGITS – ELEC. EQUIPMENT AND
MACHINERY SECTOR – 2004]
PRINCIPALES IMPORTACIONES DE REPÙBLICA DOMINICANA A 10 DIGITOS SECTOR MAQUINARIA
Y EQUIPO ELECTRICO AÑO 2004
41.05%34.81%
5.06%3.69%
2.72%
2.76%2.76%2.39%
1.79%
1.58%
1.38%
8536200020851790500085389070808531100035852520904085422180288502130040851993800085365090658525209080OTROS
Source: US INTERNATIONAL TRADE COMMISSION
C18c. Primary exports in the sector. The primary DR exports to the U.S. in the electrical equipment and machinery sector for 2004 are shown in the following table.
BILATERAL TRADE BETWEEN THE DOMINICAN REPUBIC AND THE UNITED STATES OF AMERICA VI-94
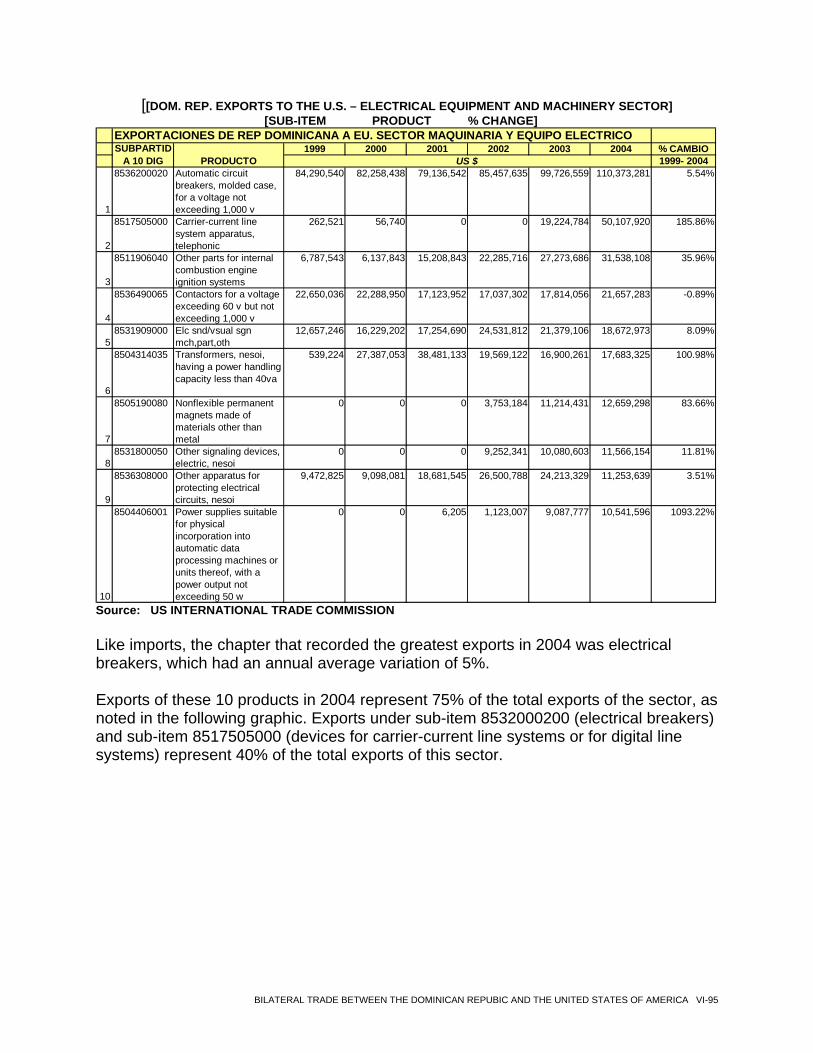
[[DOM. REP. EXPORTS TO THE U.S. – ELECTRICAL EQUIPMENT AND MACHINERY SECTOR] [SUB-ITEM PRODUCT % CHANGE]
EXPORTACIONES DE REP DOMINICANA A EU. SECTOR MAQUINARIA Y EQUIPO ELECTRICO1999 2000 2001 2002 2003 2004 % CAMBIO
1999- 2004
1
8536200020 Automatic circuit breakers, molded case, for a voltage not exceeding 1,000 v
84,290,540 82,258,438 79,136,542 85,457,635 99,726,559 110,373,281 5.54%
2
8517505000 Carrier-current line system apparatus, telephonic
262,521 56,740 0 0 19,224,784 50,107,920 185.86%
3
8511906040 Other parts for internal combustion engine ignition systems
6,787,543 6,137,843 15,208,843 22,285,716 27,273,686 31,538,108 35.96%
4
8536490065 Contactors for a voltage exceeding 60 v but not exceeding 1,000 v
22,650,036 22,288,950 17,123,952 17,037,302 17,814,056 21,657,283 -0.89%
58531909000 Elc snd/vsual sgn
mch,part,oth12,657,246 16,229,202 17,254,690 24,531,812 21,379,106 18,672,973 8.09%
6
8504314035 Transformers, nesoi, having a power handling capacity less than 40va
539,224 27,387,053 38,481,133 19,569,122 16,900,261 17,683,325 100.98%
7
8505190080 Nonflexible permanent magnets made of materials other than metal
0 0 0 3,753,184 11,214,431 12,659,298 83.66%
88531800050 Other signaling devices,
electric, nesoi0 0 0 9,252,341 10,080,603 11,566,154 11.81%
9
8536308000 Other apparatus for protecting electrical circuits, nesoi
9,472,825 9,098,081 18,681,545 26,500,788 24,213,329 11,253,639 3.51%
10
8504406001 Power supplies suitable for physical incorporation into automatic data processing machines or units thereof, with a power output not exceeding 50 w
0 0 6,205 1,123,007 9,087,777 10,541,596 1093.22%
SUBPARTIDA 10 DIG PRODUCTO US $
Source: US INTERNATIONAL TRADE COMMISSION
Like imports, the chapter that recorded the greatest exports in 2004 was electrical breakers, which had an annual average variation of 5%. Exports of these 10 products in 2004 represent 75% of the total exports of the sector, as noted in the following graphic. Exports under sub-item 8532000200 (electrical breakers) and sub-item 8517505000 (devices for carrier-current line systems or for digital line systems) represent 40% of the total exports of this sector.
BILATERAL TRADE BETWEEN THE DOMINICAN REPUBIC AND THE UNITED STATES OF AMERICA VI-95
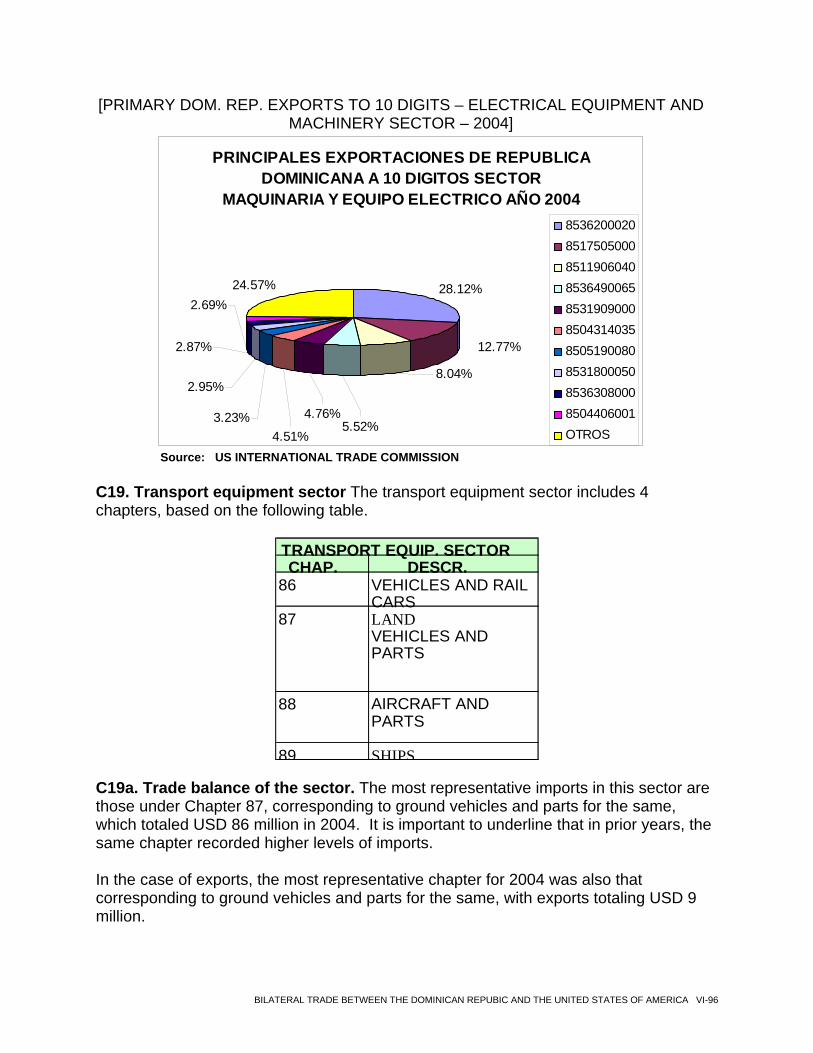
[PRIMARY DOM. REP. EXPORTS TO 10 DIGITS – ELECTRICAL EQUIPMENT AND MACHINERY SECTOR – 2004]
PRINCIPALES EXPORTACIONES DE REPUBLICA DOMINICANA A 10 DIGITOS SECTOR
MAQUINARIA Y EQUIPO ELECTRICO AÑO 2004
28.12%24.57%2.69%
2.87%
2.95%
3.23%5.52%
4.76%
4.51%
8.04%
12.77%
8536200020851750500085119060408536490065853190900085043140358505190080853180005085363080008504406001OTROS
Source: US INTERNATIONAL TRADE COMMISSION
C19. Transport equipment sector The transport equipment sector includes 4 chapters, based on the following table.
CHAP. DESCR.
86 VEHICLES AND RAIL CARS
87 LAND VEHICLES AND PARTS
88 AIRCRAFT AND PARTS
89 SHIPS
TRANSPORT EQUIP. SECTOR
C19a. Trade balance of the sector. The most representative imports in this sector are those under Chapter 87, corresponding to ground vehicles and parts for the same, which totaled USD 86 million in 2004. It is important to underline that in prior years, the same chapter recorded higher levels of imports. In the case of exports, the most representative chapter for 2004 was also that corresponding to ground vehicles and parts for the same, with exports totaling USD 9 million.
BILATERAL TRADE BETWEEN THE DOMINICAN REPUBIC AND THE UNITED STATES OF AMERICA VI-96
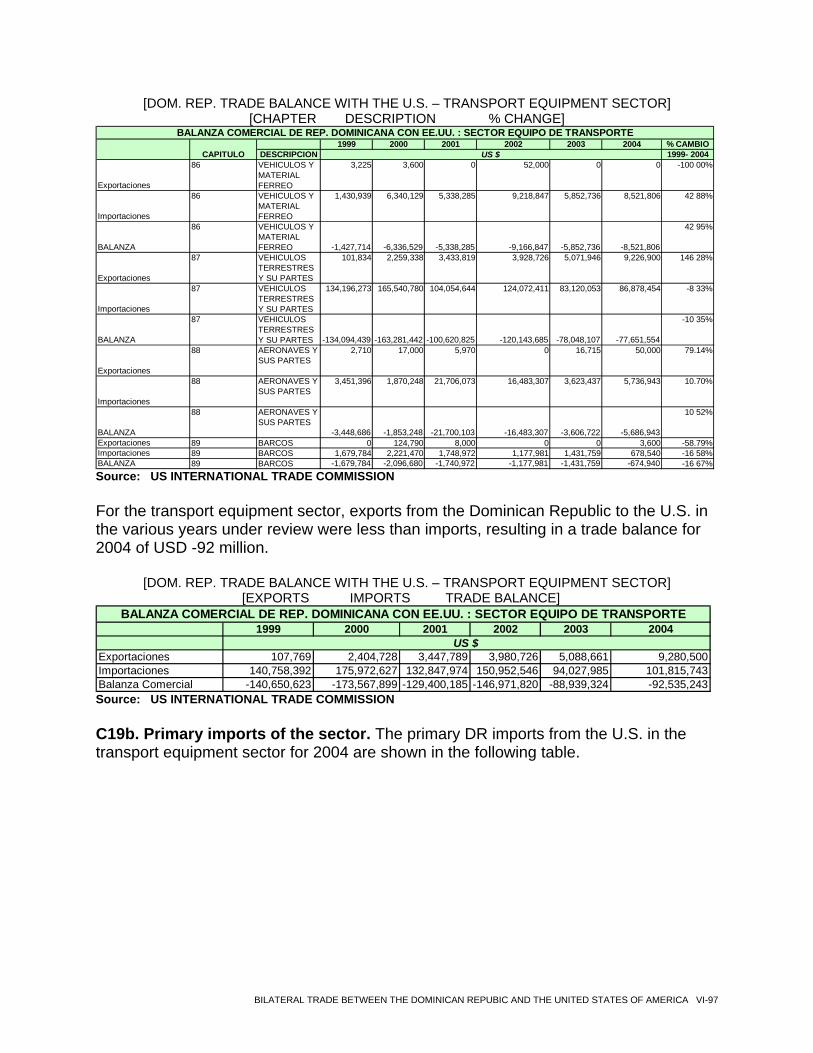
[DOM. REP. TRADE BALANCE WITH THE U.S. – TRANSPORT EQUIPMENT SECTOR] [CHAPTER DESCRIPTION % CHANGE]
1999 2000 2001 2002 2003 2004 % CAMBIODESCRIPCION 1999- 2004
Exportaciones
86 VEHICULOS Y MATERIAL FERREO
3,225 3,600 0 52,000 0 0 -100 00%
Importaciones
86 VEHICULOS Y MATERIAL FERREO
1,430,939 6,340,129 5,338,285 9,218,847 5,852,736 8,521,806 42 88%
BALANZA
86 VEHICULOS Y MATERIAL FERREO -1,427,714 -6,336,529 -5,338,285 -9,166,847 -5,852,736 -8,521,806
42 95%
Exportaciones
87 VEHICULOS TERRESTRES Y SU PARTES
101,834 2,259,338 3,433,819 3,928,726 5,071,946 9,226,900 146 28%
Importaciones
87 VEHICULOS TERRESTRES Y SU PARTES
134,196,273 165,540,780 104,054,644 124,072,411 83,120,053 86,878,454 -8 33%
BALANZA
87 VEHICULOS TERRESTRES Y SU PARTES -134,094,439 -163,281,442 -100,620,825 -120,143,685 -78,048,107 -77,651,554
-10 35%
Exportaciones
88 AERONAVES Y SUS PARTES
2,710 17,000 5,970 0 16,715 50,000 79.14%
Importaciones
88 AERONAVES Y SUS PARTES
3,451,396 1,870,248 21,706,073 16,483,307 3,623,437 5,736,943 10.70%
BALANZA
88 AERONAVES Y SUS PARTES
-3,448,686 -1,853,248 -21,700,103 -16,483,307 -3,606,722 -5,686,943
10 52%
Exportaciones 89 BARCOS 0 124,790 8,000 0 0 3,600 -58.79%Importaciones 89 BARCOS 1,679,784 2,221,470 1,748,972 1,177,981 1,431,759 678,540 -16 58%BALANZA 89 BARCOS -1,679,784 -2,096,680 -1,740,972 -1,177,981 -1,431,759 -674,940 -16 67%
BALANZA COMERCIAL DE REP. DOMINICANA CON EE.UU. : SECTOR EQUIPO DE TRANSPORTE
CAPITULO US $
Source: US INTERNATIONAL TRADE COMMISSION For the transport equipment sector, exports from the Dominican Republic to the U.S. in the various years under review were less than imports, resulting in a trade balance for 2004 of USD -92 million.
[DOM. REP. TRADE BALANCE WITH THE U.S. – TRANSPORT EQUIPMENT SECTOR]
[EXPORTS IMPORTS TRADE BALANCE]
1999 2000 2001 2002 2003 2004
Exportaciones 107,769 2,404,728 3,447,789 3,980,726 5,088,661 9,280,500Importaciones 140,758,392 175,972,627 132,847,974 150,952,546 94,027,985 101,815,743Balanza Comercial -140,650,623 -173,567,899 -129,400,185 -146,971,820 -88,939,324 -92,535,243
US $
BALANZA COMERCIAL DE REP. DOMINICANA CON EE.UU. : SECTOR EQUIPO DE TRANSPORTE
Source: US INTERNATIONAL TRADE COMMISSION
C19b. Primary imports of the sector. The primary DR imports from the U.S. in the transport equipment sector for 2004 are shown in the following table.
BILATERAL TRADE BETWEEN THE DOMINICAN REPUBIC AND THE UNITED STATES OF AMERICA VI-97
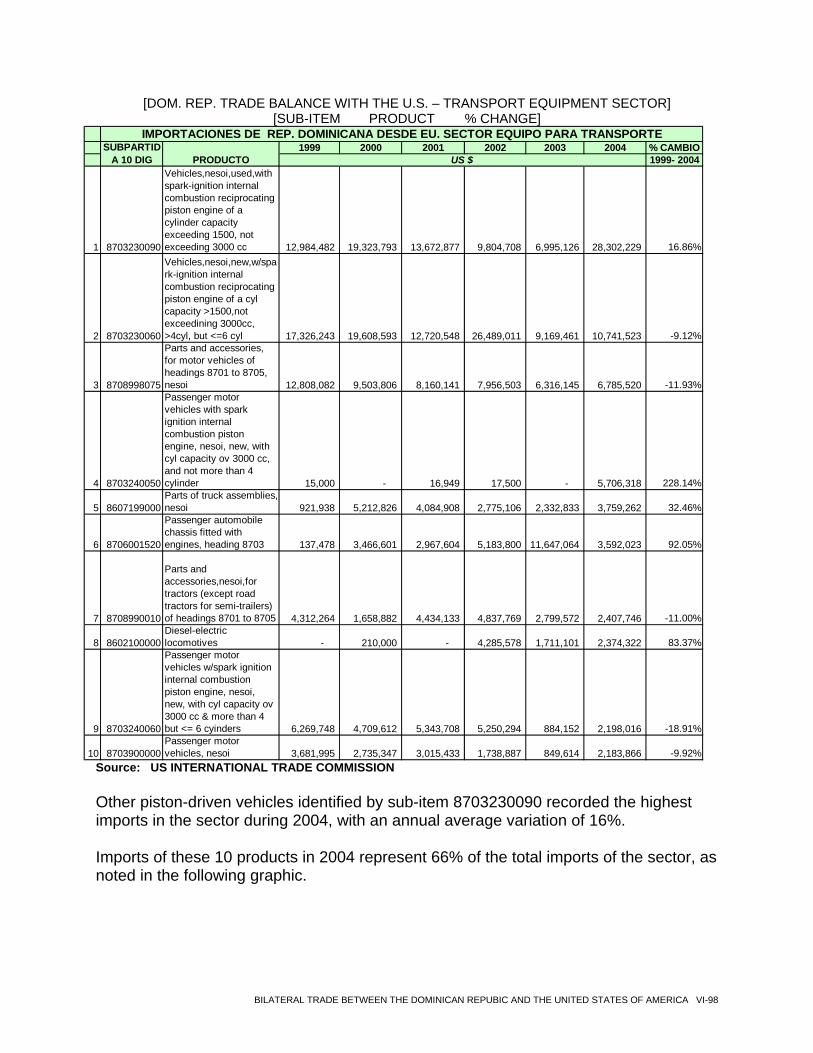
[DOM. REP. TRADE BALANCE WITH THE U.S. – TRANSPORT EQUIPMENT SECTOR] [SUB-ITEM PRODUCT % CHANGE]
1999 2000 2001 2002 2003 2004 % CAMBIO1999- 2004
1 8703230090
Vehicles,nesoi,used,with spark-ignition internal combustion reciprocating piston engine of a cylinder capacity exceeding 1500, not exceeding 3000 cc 12,984,482 19,323,793 13,672,877 9,804,708 6,995,126 28,302,229 16.86%
2 8703230060
Vehicles,nesoi,new,w/spark-ignition internal combustion reciprocating piston engine of a cyl capacity >1500,not exceedining 3000cc, >4cyl, but <=6 cyl 17,326,243 19,608,593 12,720,548 26,489,011 9,169,461 10,741,523 -9.12%
3 8708998075
Parts and accessories, for motor vehicles of headings 8701 to 8705, nesoi 12,808,082 9,503,806 8,160,141 7,956,503 6,316,145 6,785,520 -11.93%
4 8703240050
Passenger motor vehicles with spark ignition internal combustion piston engine, nesoi, new, with cyl capacity ov 3000 cc, and not more than 4 cylinder 15,000 - 16,949 17,500 - 5,706,318 228.14%
5 8607199000Parts of truck assemblies, nesoi 921,938 5,212,826 4,084,908 2,775,106 2,332,833 3,759,262 32.46%
6 8706001520
Passenger automobile chassis fitted with engines, heading 8703 137,478 3,466,601 2,967,604 5,183,800 11,647,064 3,592,023 92.05%
7 8708990010
Parts and accessories,nesoi,for tractors (except road tractors for semi-trailers) of headings 8701 to 8705 4,312,264 1,658,882 4,434,133 4,837,769 2,799,572 2,407,746 -11.00%
8 8602100000Diesel-electric locomotives - 210,000 - 4,285,578 1,711,101 2,374,322 83.37%
9 8703240060
Passenger motor vehicles w/spark ignition internal combustion piston engine, nesoi, new, with cyl capacity ov 3000 cc & more than 4 but <= 6 cyinders 6,269,748 4,709,612 5,343,708 5,250,294 884,152 2,198,016 -18.91%
10 8703900000Passenger motor vehicles, nesoi 3,681,995 2,735,347 3,015,433 1,738,887 849,614 2,183,866 -9.92%
IMPORTACIONES DE REP. DOMINICANA DESDE EU. SECTOR EQUIPO PARA TRANSPORTESUBPARTID
A 10 DIG PRODUCTO US $
Source: US INTERNATIONAL TRADE COMMISSION
Other piston-driven vehicles identified by sub-item 8703230090 recorded the highest imports in the sector during 2004, with an annual average variation of 16%. Imports of these 10 products in 2004 represent 66% of the total imports of the sector, as noted in the following graphic.
BILATERAL TRADE BETWEEN THE DOMINICAN REPUBIC AND THE UNITED STATES OF AMERICA VI-98
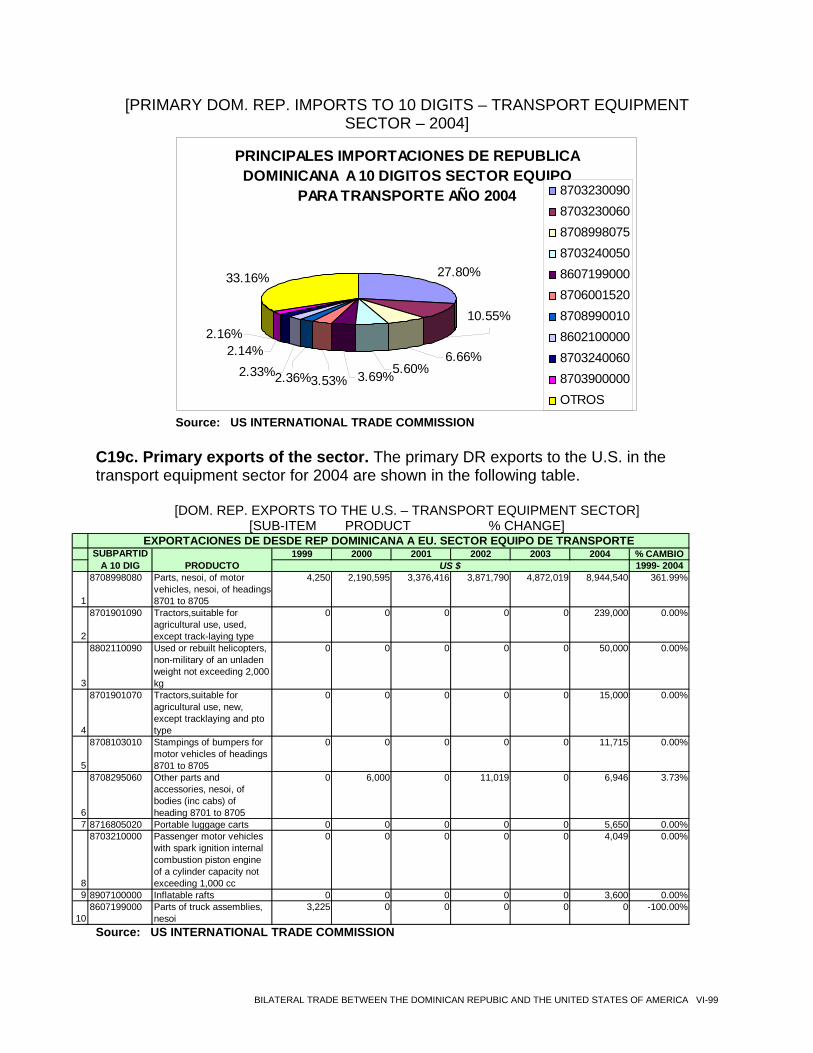
[PRIMARY DOM. REP. IMPORTS TO 10 DIGITS – TRANSPORT EQUIPMENT SECTOR – 2004]
PRINCIPALES IMPORTACIONES DE REPUBLICA DOMINICANA A 10 DIGITOS SECTOR EQUIPO
PARA TRANSPORTE AÑO 2004
33.16%
2.36%
2.16%2.14%
2.33%3.53% 3.69%5.60%
6.66%
10.55%
27.80%
8703230090870323006087089980758703240050860719900087060015208708990010860210000087032400608703900000OTROS
Source: US INTERNATIONAL TRADE COMMISSION C19c. Primary exports of the sector. The primary DR exports to the U.S. in the transport equipment sector for 2004 are shown in the following table.
[DOM. REP. EXPORTS TO THE U.S. – TRANSPORT EQUIPMENT SECTOR] [SUB-ITEM PRODUCT % CHANGE]
1999 2000 2001 2002 2003 2004 % CAMBIO1999- 2004
1
8708998080 Parts, nesoi, of motor vehicles, nesoi, of headings 8701 to 8705
4,250 2,190,595 3,376,416 3,871,790 4,872,019 8,944,540 361.99%
2
8701901090 Tractors,suitable for agricultural use, used, except track-laying type
0 0 0 0 0 239,000 0.00%
3
8802110090 Used or rebuilt helicopters, non-military of an unladen weight not exceeding 2,000 kg
0 0 0 0 0 50,000 0.00%
4
8701901070 Tractors,suitable for agricultural use, new, except tracklaying and pto type
0 0 0 0 0 15,000 0.00%
5
8708103010 Stampings of bumpers for motor vehicles of headings 8701 to 8705
0 0 0 0 0 11,715 0.00%
6
8708295060 Other parts and accessories, nesoi, of bodies (inc cabs) of heading 8701 to 8705
0 6,000 0 11,019 0 6,946 3.73%
7 8716805020 Portable luggage carts 0 0 0 0 0 5,650 0.00%
8
8703210000 Passenger motor vehicles with spark ignition internal combustion piston engine of a cylinder capacity not exceeding 1,000 cc
0 0 0 0 0 4,049 0.00%
9 8907100000 Inflatable rafts 0 0 0 0 0 3,600 0.00%
108607199000 Parts of truck assemblies,
nesoi3,225 0 0 0 0 0 -100.00%
EXPORTACIONES DE DESDE REP DOMINICANA A EU. SECTOR EQUIPO DE TRANSPORTESUBPARTID
A 10 DIG PRODUCTO US $
Source: US INTERNATIONAL TRADE COMMISSION
BILATERAL TRADE BETWEEN THE DOMINICAN REPUBIC AND THE UNITED STATES OF AMERICA VI-99
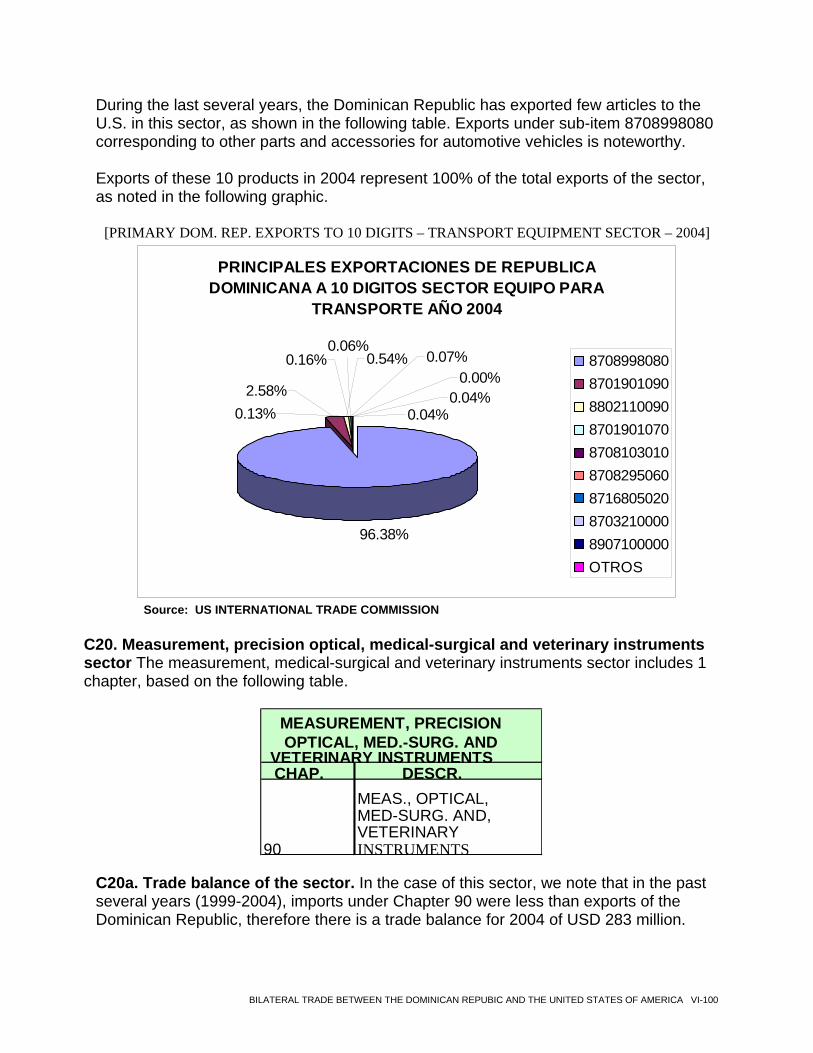
During the last several years, the Dominican Republic has exported few articles to the U.S. in this sector, as shown in the following table. Exports under sub-item 8708998080 corresponding to other parts and accessories for automotive vehicles is noteworthy. Exports of these 10 products in 2004 represent 100% of the total exports of the sector, as noted in the following graphic.
[PRIMARY DOM. REP. EXPORTS TO 10 DIGITS – TRANSPORT EQUIPMENT SECTOR – 2004]
PRINCIPALES EXPORTACIONES DE REPUBLICA DOMINICANA A 10 DIGITOS SECTOR EQUIPO PARA
TRANSPORTE AÑO 2004
0.06%
0.04%
0.00%0.04%
0.07%
0.13%
0.16% 0.54%
2.58%
96.38%
870899808087019010908802110090870190107087081030108708295060871680502087032100008907100000OTROS
Source: US INTERNATIONAL TRADE COMMISSION
C20. Measurement, precision optical, medical-surgical and veterinary instruments sector The measurement, medical-surgical and veterinary instruments sector includes 1 chapter, based on the following table.
CHAP. DESCR.
90
MEAS., OPTICAL, MED-SURG. AND, VETERINARY INSTRUMENTS
MEASUREMENT, PRECISION OPTICAL, MED.-SURG. AND
VETERINARY INSTRUMENTS
C20a. Trade balance of the sector. In the case of this sector, we note that in the past several years (1999-2004), imports under Chapter 90 were less than exports of the Dominican Republic, therefore there is a trade balance for 2004 of USD 283 million.
BILATERAL TRADE BETWEEN THE DOMINICAN REPUBIC AND THE UNITED STATES OF AMERICA VI-100
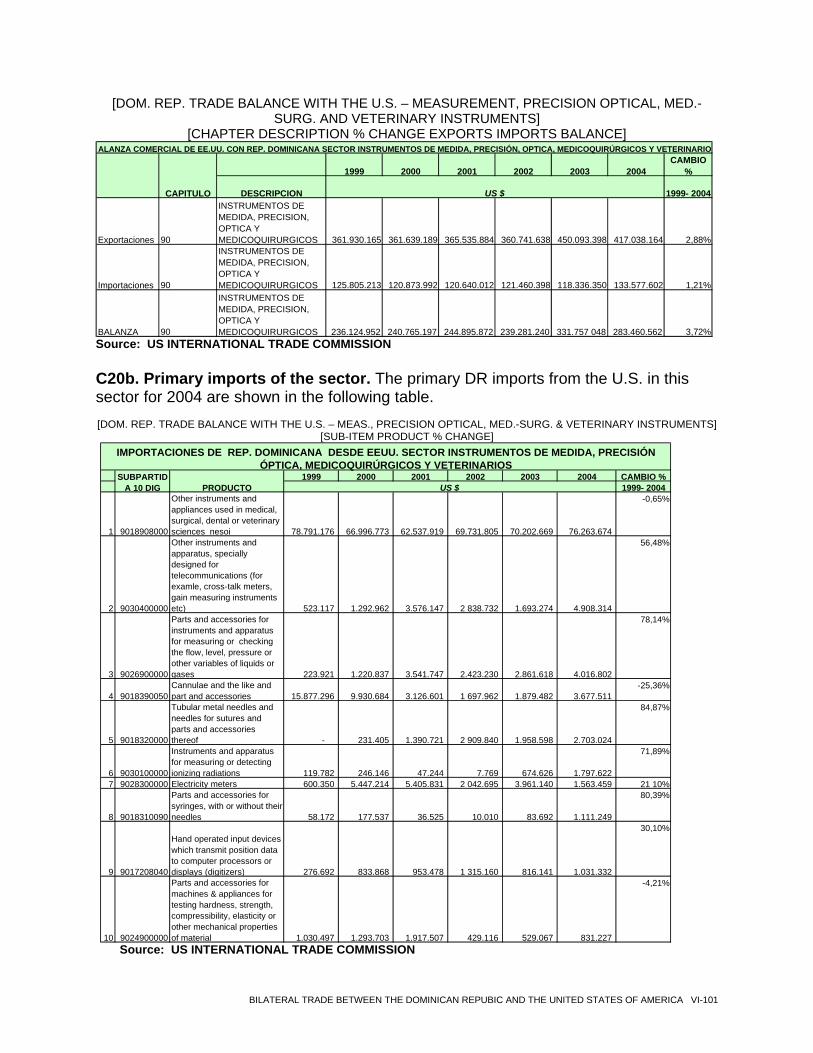
[DOM. REP. TRADE BALANCE WITH THE U.S. – MEASUREMENT, PRECISION OPTICAL, MED.-SURG. AND VETERINARY INSTRUMENTS]
[CHAPTER DESCRIPTION % CHANGE EXPORTS IMPORTS BALANCE]
1999 2000 2001 2002 2003 2004CAMBIO
%
DESCRIPCION 1999- 2004
Exportaciones 90
INSTRUMENTOS DE MEDIDA, PRECISION, OPTICA Y MEDICOQUIRURGICOS 361.930.165 361.639.189 365.535.884 360.741.638 450.093.398 417.038.164 2,88%
Importaciones 90
INSTRUMENTOS DE MEDIDA, PRECISION, OPTICA Y MEDICOQUIRURGICOS 125.805.213 120.873.992 120.640.012 121.460.398 118.336.350 133.577.602 1,21%
BALANZA 90
INSTRUMENTOS DE MEDIDA, PRECISION, OPTICA Y MEDICOQUIRURGICOS 236.124.952 240.765.197 244.895.872 239.281.240 331.757 048 283.460.562 3,72%
ALANZA COMERCIAL DE EE.UU. CON REP. DOMINICANA SECTOR INSTRUMENTOS DE MEDIDA, PRECISIÓN, OPTICA, MEDICOQUIRÚRGICOS Y VETERINARIO
CAPITULO US $
Source: US INTERNATIONAL TRADE COMMISSION
C20b. Primary imports of the sector. The primary DR imports from the U.S. in this sector for 2004 are shown in the following table. [DOM. REP. TRADE BALANCE WITH THE U.S. – MEAS., PRECISION OPTICAL, MED.-SURG. & VETERINARY INSTRUMENTS]
[SUB-ITEM PRODUCT % CHANGE]
1999 2000 2001 2002 2003 2004 CAMBIO %1999- 2004
1 9018908000
Other instruments and appliances used in medical, surgical, dental or veterinary sciences nesoi 78.791.176 66.996.773 62.537.919 69.731.805 70.202.669 76.263.674
-0,65%
2 9030400000
Other instruments and apparatus, specially designed for telecommunications (for examle, cross-talk meters, gain measuring instruments etc) 523.117 1.292.962 3.576.147 2 838.732 1.693.274 4.908.314
56,48%
3 9026900000
Parts and accessories for instruments and apparatus for measuring or checking the flow, level, pressure or other variables of liquids or gases 223.921 1.220.837 3.541.747 2.423.230 2.861.618 4.016.802
78,14%
4 9018390050Cannulae and the like and part and accessories 15.877.296 9.930.684 3.126.601 1 697.962 1.879.482 3.677.511
-25,36%
5 9018320000
Tubular metal needles and needles for sutures and parts and accessories thereof - 231.405 1.390.721 2 909.840 1.958.598 2.703.024
84,87%
6 9030100000
Instruments and apparatus for measuring or detecting ionizing radiations 119.782 246.146 47.244 7.769 674.626 1.797.622
71,89%
7 9028300000 Electricity meters 600.350 5.447.214 5.405.831 2 042.695 3.961.140 1.563.459 21 10%
8 9018310090
Parts and accessories for syringes, with or without their needles 58.172 177.537 36.525 10.010 83.692 1.111.249
80,39%
9 9017208040
Hand operated input devices which transmit position data to computer processors or displays (digitizers) 276.692 833.868 953.478 1 315.160 816.141 1.031.332
30,10%
10 9024900000
Parts and accessories for machines & appliances for testing hardness, strength, compressibility, elasticity or other mechanical properties of material 1.030.497 1.293.703 1.917.507 429.116 529.067 831.227
-4,21%
SUBPARTIDA 10 DIG PRODUCTO US $
IMPORTACIONES DE REP. DOMINICANA DESDE EEUU. SECTOR INSTRUMENTOS DE MEDIDA, PRECISIÓN ÓPTICA, MEDICOQUIRÚRGICOS Y VETERINARIOS
Source: US INTERNATIONAL TRADE COMMISSION
BILATERAL TRADE BETWEEN THE DOMINICAN REPUBIC AND THE UNITED STATES OF AMERICA VI-101
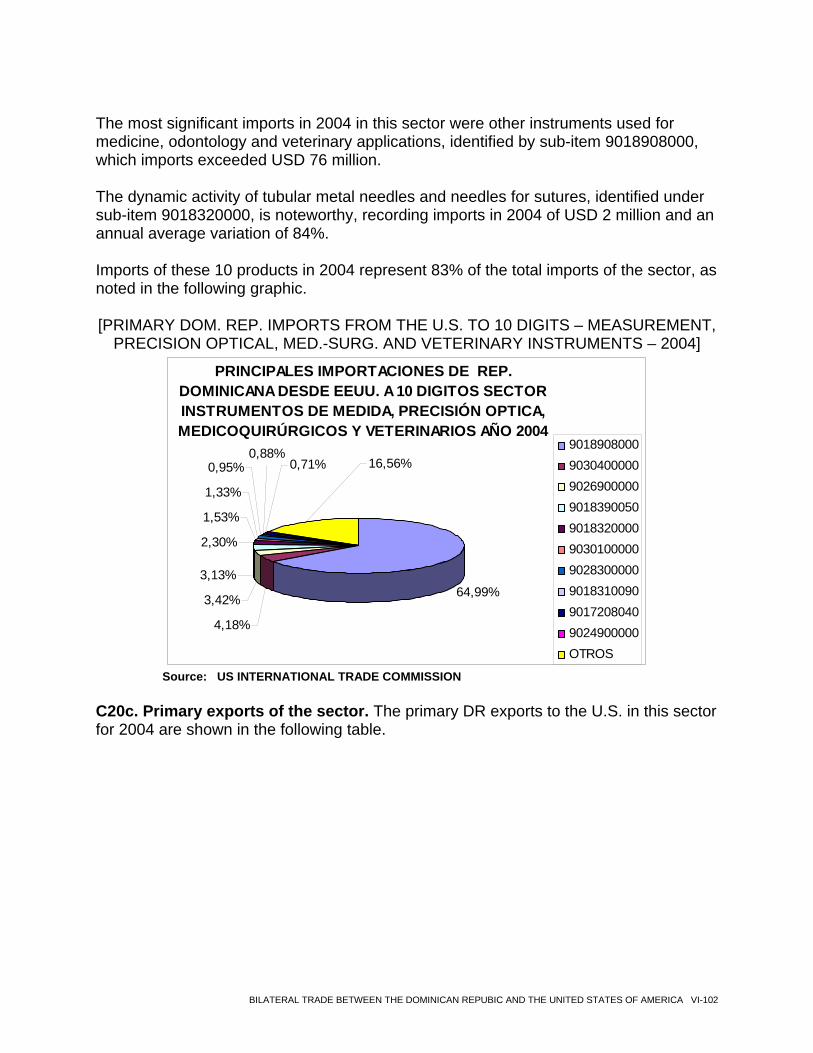
The most significant imports in 2004 in this sector were other instruments used for medicine, odontology and veterinary applications, identified by sub-item 9018908000, which imports exceeded USD 76 million.
The dynamic activity of tubular metal needles and needles for sutures, identified under sub-item 9018320000, is noteworthy, recording imports in 2004 of USD 2 million and an annual average variation of 84%. Imports of these 10 products in 2004 represent 83% of the total imports of the sector, as noted in the following graphic. [PRIMARY DOM. REP. IMPORTS FROM THE U.S. TO 10 DIGITS – MEASUREMENT,
PRECISION OPTICAL, MED.-SURG. AND VETERINARY INSTRUMENTS – 2004]
PRINCIPALES IMPORTACIONES DE REP. DOMINICANA DESDE EEUU. A 10 DIGITOS SECTOR INSTRUMENTOS DE MEDIDA, PRECISIÓN OPTICA, MEDICOQUIRÚRGICOS Y VETERINARIOS AÑO 2004
64,99%
4,18%
3,42%
3,13%
2,30%
1,53%
1,33%
0,95%0,88%
0,71% 16,56%9018908000903040000090269000009018390050901832000090301000009028300000901831009090172080409024900000OTROS
Source: US INTERNATIONAL TRADE COMMISSION
C20c. Primary exports of the sector. The primary DR exports to the U.S. in this sector for 2004 are shown in the following table.
BILATERAL TRADE BETWEEN THE DOMINICAN REPUBIC AND THE UNITED STATES OF AMERICA VI-102
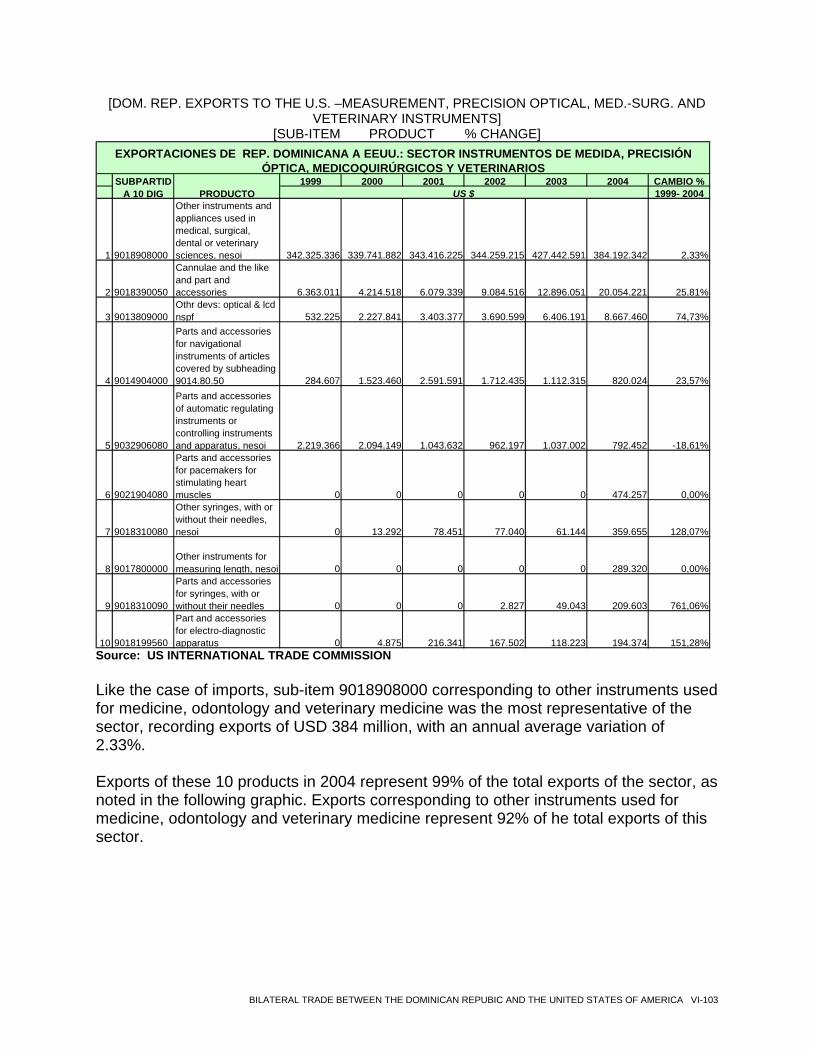
[DOM. REP. EXPORTS TO THE U.S. –MEASUREMENT, PRECISION OPTICAL, MED.-SURG. AND VETERINARY INSTRUMENTS]
[SUB-ITEM PRODUCT % CHANGE]
1999 2000 2001 2002 2003 2004 CAMBIO %1999- 2004
1 9018908000
Other instruments and appliances used in medical, surgical, dental or veterinary sciences, nesoi 342.325.336 339.741.882 343.416.225 344.259.215 427.442.591 384.192.342 2,33%
2 9018390050
Cannulae and the like and part and accessories 6.363.011 4.214.518 6.079.339 9.084.516 12.896.051 20.054.221 25,81%
3 9013809000Othr devs: optical & lcd nspf 532.225 2.227.841 3.403.377 3.690.599 6.406.191 8.667.460 74,73%
4 9014904000
Parts and accessories for navigational instruments of articles covered by subheading 9014.80.50 284.607 1.523.460 2.591.591 1.712.435 1.112.315 820.024 23,57%
5 9032906080
Parts and accessories of automatic regulating instruments or controlling instruments and apparatus, nesoi 2.219.366 2.094.149 1.043.632 962.197 1.037.002 792.452 -18,61%
6 9021904080
Parts and accessories for pacemakers for stimulating heart muscles 0 0 0 0 0 474.257 0,00%
7 9018310080
Other syringes, with or without their needles, nesoi 0 13.292 78.451 77.040 61.144 359.655 128,07%
8 9017800000Other instruments for measuring length, nesoi 0 0 0 0 0 289.320 0,00%
9 9018310090
Parts and accessories for syringes, with or without their needles 0 0 0 2.827 49.043 209.603 761,06%
10 9018199560
Part and accessories for electro-diagnostic apparatus 0 4.875 216.341 167.502 118.223 194.374 151,28%
SUBPARTIDA 10 DIG PRODUCTO US $
EXPORTACIONES DE REP. DOMINICANA A EEUU.: SECTOR INSTRUMENTOS DE MEDIDA, PRECISIÓN ÓPTICA, MEDICOQUIRÚRGICOS Y VETERINARIOS
Source: US INTERNATIONAL TRADE COMMISSION
Like the case of imports, sub-item 9018908000 corresponding to other instruments used for medicine, odontology and veterinary medicine was the most representative of the sector, recording exports of USD 384 million, with an annual average variation of 2.33%.
Exports of these 10 products in 2004 represent 99% of the total exports of the sector, as noted in the following graphic. Exports corresponding to other instruments used for medicine, odontology and veterinary medicine represent 92% of he total exports of this sector.
BILATERAL TRADE BETWEEN THE DOMINICAN REPUBIC AND THE UNITED STATES OF AMERICA VI-103
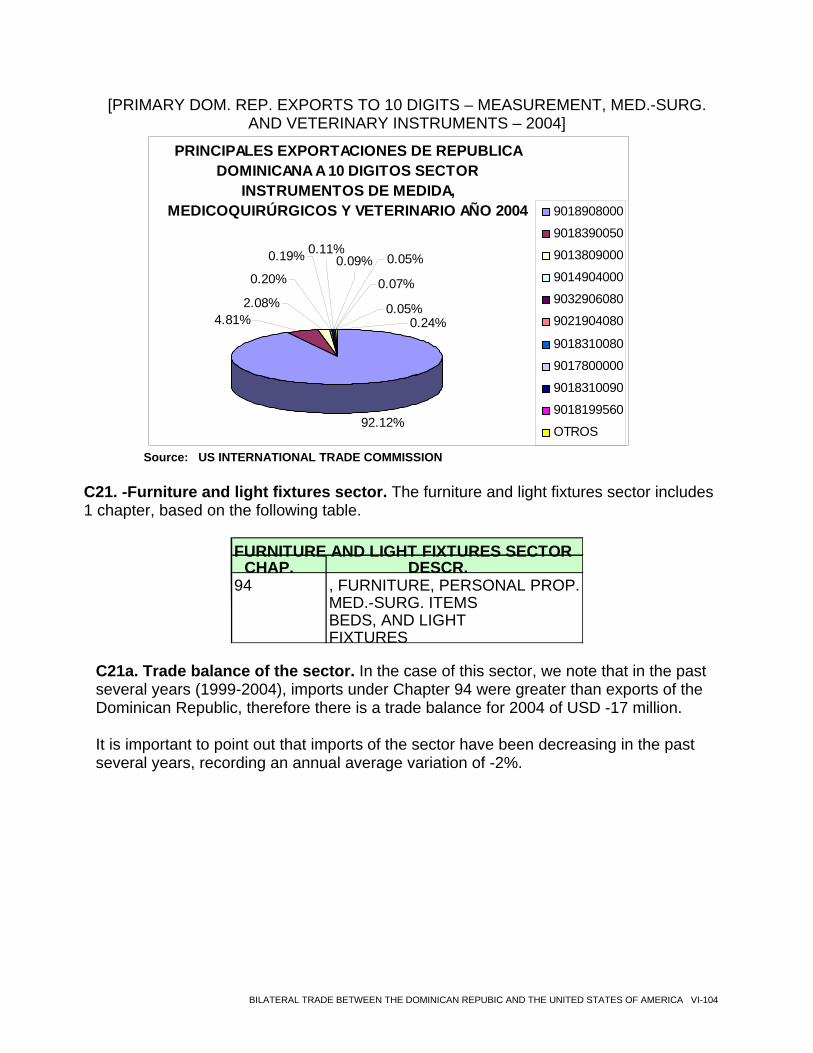
[PRIMARY DOM. REP. EXPORTS TO 10 DIGITS – MEASUREMENT, MED.-SURG. AND VETERINARY INSTRUMENTS – 2004]
PRINCIPALES EXPORTACIONES DE REPUBLICA DOMINICANA A 10 DIGITOS SECTOR
INSTRUMENTOS DE MEDIDA, MEDICOQUIRÚRGICOS Y VETERINARIO AÑO 2004
92.12%
0.20%
0.19% 0.11%
2.08%
0.09%
0.07%
4.81% 0.24%0.05%
0.05%
9018908000
9018390050
9013809000
9014904000
9032906080
9021904080
9018310080
9017800000
9018310090
9018199560
OTROS
Source: US INTERNATIONAL TRADE COMMISSION
C21. -Furniture and light fixtures sector. The furniture and light fixtures sector includes 1 chapter, based on the following table.
FURNITURE AND LIGHT FIXTURES SECTOR
CHAP. DESCR. 94 , FURNITURE, PERSONAL PROP.
MED.-SURG. ITEMS BEDS, AND LIGHT FIXTURES
C21a. Trade balance of the sector. In the case of this sector, we note that in the past several years (1999-2004), imports under Chapter 94 were greater than exports of the Dominican Republic, therefore there is a trade balance for 2004 of USD -17 million. It is important to point out that imports of the sector have been decreasing in the past several years, recording an annual average variation of -2%.
BILATERAL TRADE BETWEEN THE DOMINICAN REPUBIC AND THE UNITED STATES OF AMERICA VI-104
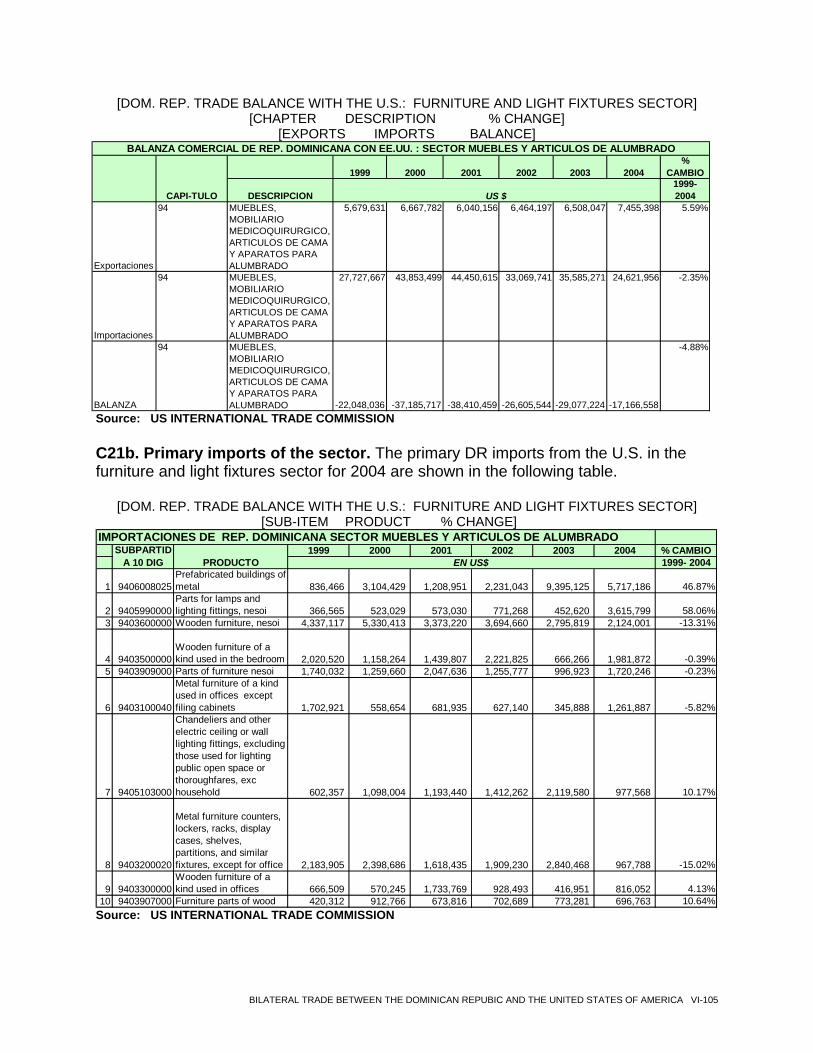
[DOM. REP. TRADE BALANCE WITH THE U.S.: FURNITURE AND LIGHT FIXTURES SECTOR] [CHAPTER DESCRIPTION % CHANGE]
[EXPORTS IMPORTS BALANCE]
1999 2000 2001 2002 2003 2004%
CAMBIO
DESCRIPCION1999- 2004
Exportaciones
94 MUEBLES, MOBILIARIO MEDICOQUIRURGICO, ARTICULOS DE CAMA Y APARATOS PARA ALUMBRADO
5,679,631 6,667,782 6,040,156 6,464,197 6,508,047 7,455,398 5.59%
Importaciones
94 MUEBLES, MOBILIARIO MEDICOQUIRURGICO, ARTICULOS DE CAMA Y APARATOS PARA ALUMBRADO
27,727,667 43,853,499 44,450,615 33,069,741 35,585,271 24,621,956 -2.35%
BALANZA
94 MUEBLES, MOBILIARIO MEDICOQUIRURGICO, ARTICULOS DE CAMA Y APARATOS PARA ALUMBRADO -22,048,036 -37,185,717 -38,410,459 -26,605,544 -29,077,224 -17,166,558
-4.88%
BALANZA COMERCIAL DE REP. DOMINICANA CON EE.UU. : SECTOR MUEBLES Y ARTICULOS DE ALUMBRADO
CAPI-TULO US $
Source: US INTERNATIONAL TRADE COMMISSION
C21b. Primary imports of the sector. The primary DR imports from the U.S. in the furniture and light fixtures sector for 2004 are shown in the following table.
[DOM. REP. TRADE BALANCE WITH THE U.S.: FURNITURE AND LIGHT FIXTURES SECTOR]
[SUB-ITEM PRODUCT % CHANGE] IMPORTACIONES DE REP. DOMINICANA SECTOR MUEBLES Y ARTICULOS DE ALUMBRADO
1999 2000 2001 2002 2003 2004 % CAMBIO1999- 2004
1 9406008025Prefabricated buildings of metal 836,466 3,104,429 1,208,951 2,231,043 9,395,125 5,717,186 46.87%
2 9405990000Parts for lamps and lighting fittings, nesoi 366,565 523,029 573,030 771,268 452,620 3,615,799 58.06%
3 9403600000 Wooden furniture, nesoi 4,337,117 5,330,413 3,373,220 3,694,660 2,795,819 2,124,001 -13.31%
4 9403500000Wooden furniture of a kind used in the bedroom 2,020,520 1,158,264 1,439,807 2,221,825 666,266 1,981,872 -0.39%
5 9403909000 Parts of furniture nesoi 1,740,032 1,259,660 2,047,636 1,255,777 996,923 1,720,246 -0.23%
6 9403100040
Metal furniture of a kind used in offices except filing cabinets 1,702,921 558,654 681,935 627,140 345,888 1,261,887 -5.82%
7 9405103000
Chandeliers and other electric ceiling or wall lighting fittings, excluding those used for lighting public open space or thoroughfares, exc household 602,357 1,098,004 1,193,440 1,412,262 2,119,580 977,568 10.17%
8 9403200020
Metal furniture counters, lockers, racks, display cases, shelves, partitions, and similar fixtures, except for office 2,183,905 2,398,686 1,618,435 1,909,230 2,840,468 967,788 -15.02%
9 9403300000Wooden furniture of a kind used in offices 666,509 570,245 1,733,769 928,493 416,951 816,052 4.13%
10 9403907000 Furniture parts of wood 420,312 912,766 673,816 702,689 773,281 696,763 10.64%
SUBPARTIDA 10 DIG PRODUCTO EN US$
Source: US INTERNATIONAL TRADE COMMISSION
BILATERAL TRADE BETWEEN THE DOMINICAN REPUBIC AND THE UNITED STATES OF AMERICA VI-105
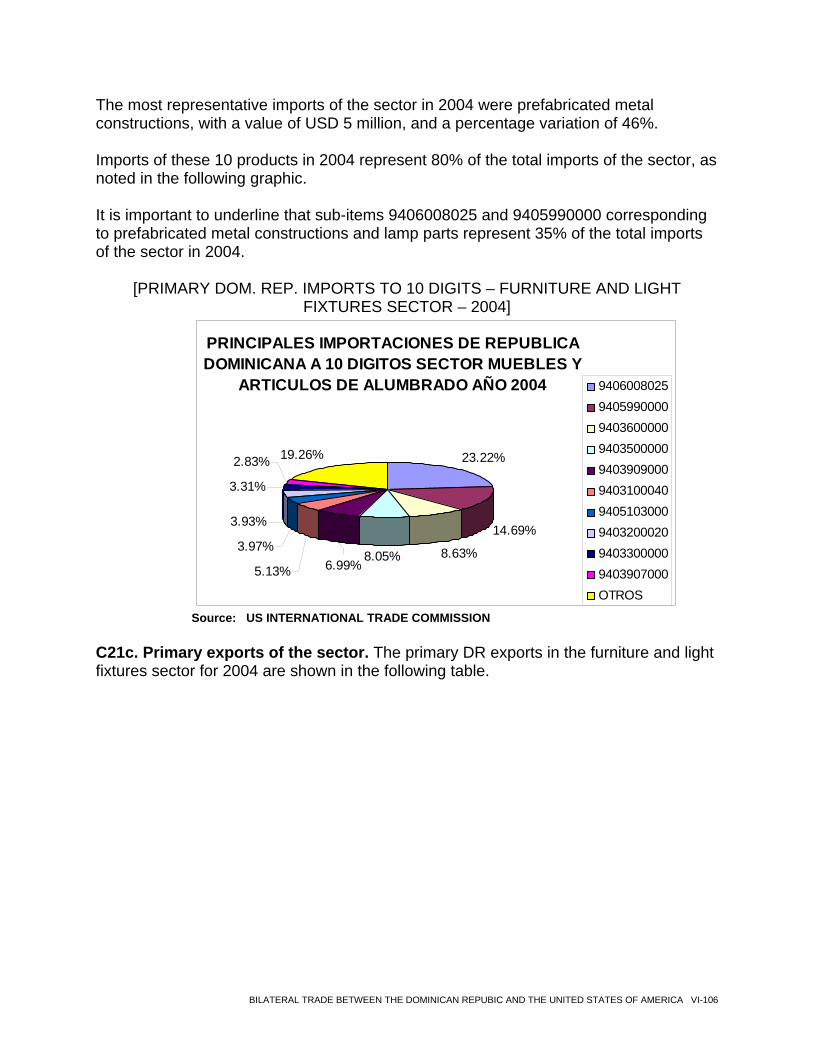
The most representative imports of the sector in 2004 were prefabricated metal constructions, with a value of USD 5 million, and a percentage variation of 46%.
Imports of these 10 products in 2004 represent 80% of the total imports of the sector, as noted in the following graphic. It is important to underline that sub-items 9406008025 and 9405990000 corresponding to prefabricated metal constructions and lamp parts represent 35% of the total imports of the sector in 2004.
[PRIMARY DOM. REP. IMPORTS TO 10 DIGITS – FURNITURE AND LIGHT FIXTURES SECTOR – 2004]
PRINCIPALES IMPORTACIONES DE REPUBLICA DOMINICANA A 10 DIGITOS SECTOR MUEBLES Y
ARTICULOS DE ALUMBRADO AÑO 2004
23.22%
14.69%
8.63%8.05%5.13%
3.97%
3.93%
3.31%
2.83% 19.26%
6.99%
9406008025940599000094036000009403500000940390900094031000409405103000940320002094033000009403907000OTROS
Source: US INTERNATIONAL TRADE COMMISSION
C21c. Primary exports of the sector. The primary DR exports in the furniture and light fixtures sector for 2004 are shown in the following table.
BILATERAL TRADE BETWEEN THE DOMINICAN REPUBIC AND THE UNITED STATES OF AMERICA VI-106
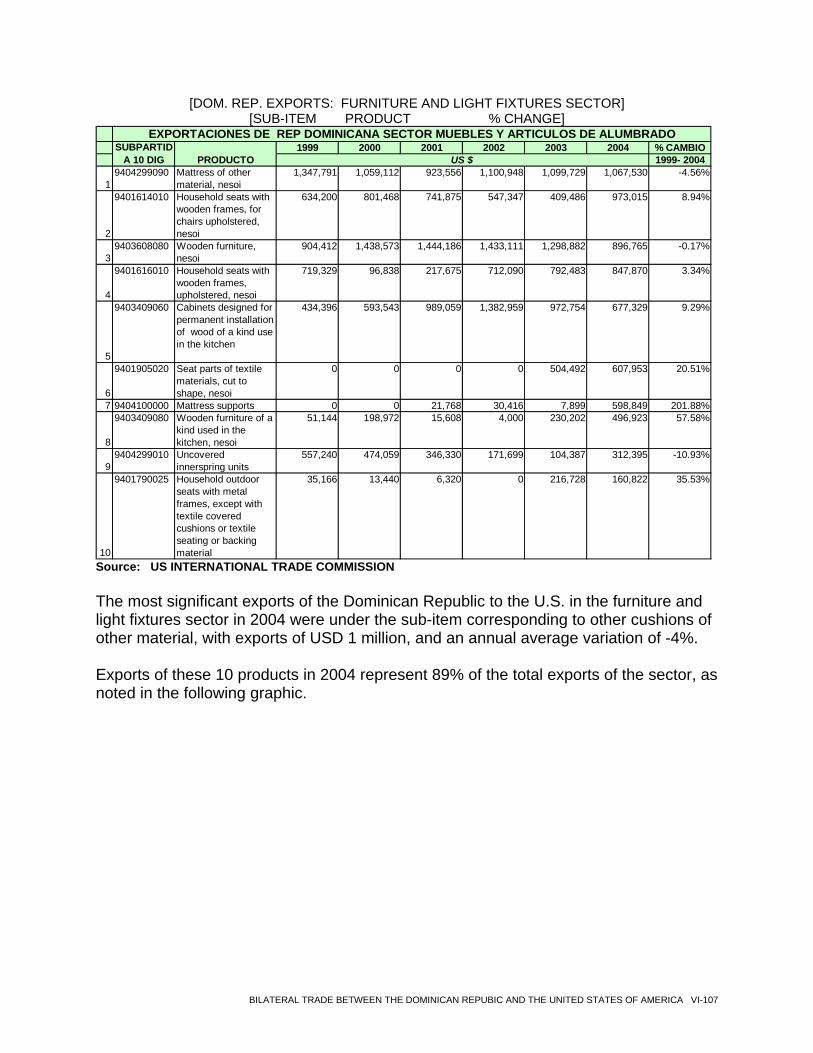
[DOM. REP. EXPORTS: FURNITURE AND LIGHT FIXTURES SECTOR] [SUB-ITEM PRODUCT % CHANGE]
1999 2000 2001 2002 2003 2004 % CAMBIO1999- 2004
19404299090 Mattress of other
material, nesoi1,347,791 1,059,112 923,556 1,100,948 1,099,729 1,067,530 -4.56%
2
9401614010 Household seats with wooden frames, for chairs upholstered, nesoi
634,200 801,468 741,875 547,347 409,486 973,015 8.94%
39403608080 Wooden furniture,
nesoi904,412 1,438,573 1,444,186 1,433,111 1,298,882 896,765 -0.17%
4
9401616010 Household seats with wooden frames, upholstered, nesoi
719,329 96,838 217,675 712,090 792,483 847,870 3.34%
5
9403409060 Cabinets designed for permanent installation of wood of a kind use in the kitchen
434,396 593,543 989,059 1,382,959 972,754 677,329 9.29%
6
9401905020 Seat parts of textile materials, cut to shape, nesoi
0 0 0 0 504,492 607,953 20.51%
7 9404100000 Mattress supports 0 0 21,768 30,416 7,899 598,849 201.88%
8
9403409080 Wooden furniture of a kind used in the kitchen, nesoi
51,144 198,972 15,608 4,000 230,202 496,923 57.58%
99404299010 Uncovered
innerspring units557,240 474,059 346,330 171,699 104,387 312,395 -10.93%
10
9401790025 Household outdoor seats with metal frames, except with textile covered cushions or textile seating or backing material
35,166 13,440 6,320 0 216,728 160,822 35.53%
EXPORTACIONES DE REP DOMINICANA SECTOR MUEBLES Y ARTICULOS DE ALUMBRADOSUBPARTID
A 10 DIG PRODUCTO US $
Source: US INTERNATIONAL TRADE COMMISSION
The most significant exports of the Dominican Republic to the U.S. in the furniture and light fixtures sector in 2004 were under the sub-item corresponding to other cushions of other material, with exports of USD 1 million, and an annual average variation of -4%.
Exports of these 10 products in 2004 represent 89% of the total exports of the sector, as noted in the following graphic.
BILATERAL TRADE BETWEEN THE DOMINICAN REPUBIC AND THE UNITED STATES OF AMERICA VI-107
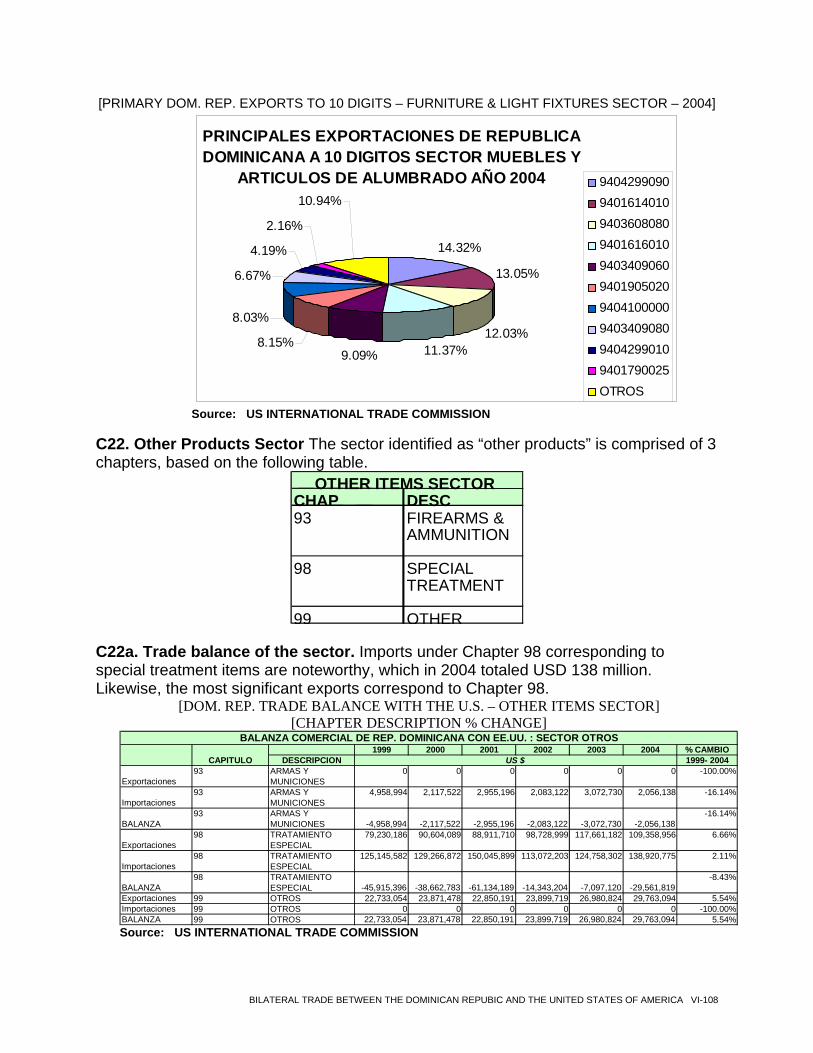
[PRIMARY DOM. REP. EXPORTS TO 10 DIGITS – FURNITURE & LIGHT FIXTURES SECTOR – 2004]
PRINCIPALES EXPORTACIONES DE REPUBLICA DOMINICANA A 10 DIGITOS SECTOR MUEBLES Y
ARTICULOS DE ALUMBRADO AÑO 2004
14.32%
13.05%
12.03%11.37%8.15%
8.03%
6.67%
4.19%
2.16%
10.94%
9.09%
9404299090940161401094036080809401616010940340906094019050209404100000940340908094042990109401790025OTROS
Source: US INTERNATIONAL TRADE COMMISSION
C22. Other Products Sector The sector identified as “other products” is comprised of 3 chapters, based on the following table.
CHAP DESC 93 FIREARMS &
AMMUNITION
98 SPECIAL TREATMENT
99 OTHER
OTHER ITEMS SECTOR
C22a. Trade balance of the sector. Imports under Chapter 98 corresponding to special treatment items are noteworthy, which in 2004 totaled USD 138 million. Likewise, the most significant exports correspond to Chapter 98.
[DOM. REP. TRADE BALANCE WITH THE U.S. – OTHER ITEMS SECTOR] [CHAPTER DESCRIPTION % CHANGE]
1999 2000 2001 2002 2003 2004 % CAMBIODESCRIPCION 1999- 2004
Exportaciones93 ARMAS Y
MUNICIONES0 0 0 0 0 0 -100
Importaciones93 ARMAS Y
MUNICIONES4,958,994 2,117,522 2,955,196 2,083,122 3,072,730 2,056,138 -16.14%
BALANZA 93 ARMAS Y
MUNICIONES -4,958,994 -2,117,522 -2,955,196 -2,083,122 -3,072,730 -2,056,138-16.14%
Exportaciones98 TRATAMIENTO
ESPECIAL79,230,186 90,604,089 88,911,710 98,728,999 117,661,182 109,358,956 6.66%
Importaciones98 TRATAMIENTO
ESPECIAL125,145,582 129,266,872 150,045,899 113,072,203 124,758,302 138,920,775 2.11%
BALANZA 98 TRATAMIENTO
ESPECIAL -45,915,396 -38,662,783 -61,134,189 -14,343,204 -7,097,120 -29,561,819-8.43%
Exportaciones 99 OTROS 22,733,054 23,871,478 22,850,191 23,899,719 26,980,824 29,763,094 5.54%Importaciones 99 OTROS 0 0 0 0 0 0 -100BALANZA 99 OTROS 22,733,054 23,871,478 22,850,191 23,899,719 26,980,824 29,763,094 5.54%
BALANZA COMERCIAL DE REP. DOMINICANA CON EE.UU. : SECTOR OTROS
CAPITULO US $.00%
.00%
Source: US INTERNATIONAL TRADE COMMISSION
BILATERAL TRADE BETWEEN THE DOMINICAN REPUBIC AND THE UNITED STATES OF AMERICA VI-108
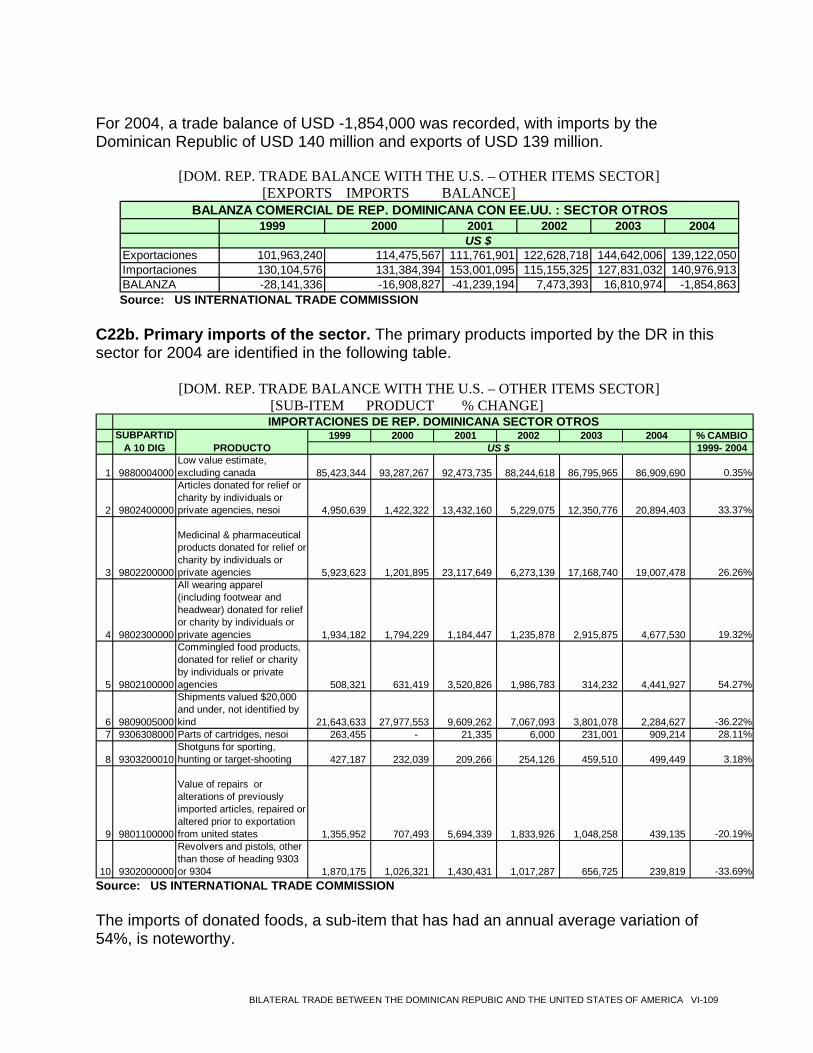
For 2004, a trade balance of USD -1,854,000 was recorded, with imports by the Dominican Republic of USD 140 million and exports of USD 139 million.
[DOM. REP. TRADE BALANCE WITH THE U.S. – OTHER ITEMS SECTOR]
[EXPORTS IMPORTS BALANCE]
1999 2000 2001 2002 2003 2004
Exportaciones 101,963,240 114,475,567 111,761,901 122,628,718 144,642,006 139,122,050Importaciones 130,104,576 131,384,394 153,001,095 115,155,325 127,831,032 140,976,913BALANZA -28,141,336 -16,908,827 -41,239,194 7,473,393 16,810,974 -1,854,863
US $
BALANZA COMERCIAL DE REP. DOMINICANA CON EE.UU. : SECTOR OTROS
Source: US INTERNATIONAL TRADE COMMISSION
C22b. Primary imports of the sector. The primary products imported by the DR in this sector for 2004 are identified in the following table.
[DOM. REP. TRADE BALANCE WITH THE U.S. – OTHER ITEMS SECTOR] [SUB-ITEM PRODUCT % CHANGE]
1999 2000 2001 2002 2003 2004 % CAMBIO1999- 2004
1 9880004000Low value estimate, excluding canada 85,423,344 93,287,267 92,473,735 88,244,618 86,795,965 86,909,690 0.35%
2 9802400000
Articles donated for relief or charity by individuals or private agencies, nesoi 4,950,639 1,422,322 13,432,160 5,229,075 12,350,776 20,894,403 33.37%
3 9802200000
Medicinal & pharmaceutical products donated for relief or charity by individuals or private agencies 5,923,623 1,201,895 23,117,649 6,273,139 17,168,740 19,007,478 26.26%
4 9802300000
All wearing apparel (including footwear and headwear) donated for relief or charity by individuals or private agencies 1,934,182 1,794,229 1,184,447 1,235,878 2,915,875 4,677,530 19.32%
5 9802100000
Commingled food products, donated for relief or charity by individuals or private agencies 508,321 631,419 3,520,826 1,986,783 314,232 4,441,927 54.27%
6 9809005000
Shipments valued $20,000 and under, not identified by kind 21,643,633 27,977,553 9,609,262 7,067,093 3,801,078 2,284,627 -36.22%
7 9306308000 Parts of cartridges, nesoi 263,455 - 21,335 6,000 231,001 909,214 28.11%
8 9303200010Shotguns for sporting, hunting or target-shooting 427,187 232,039 209,266 254,126 459,510 499,449 3.18%
9 9801100000
Value of repairs or alterations of previously imported articles, repaired or altered prior to exportation from united states 1,355,952 707,493 5,694,339 1,833,926 1,048,258 439,135 -20.19%
10 9302000000
Revolvers and pistols, other than those of heading 9303 or 9304 1,870,175 1,026,321 1,430,431 1,017,287 656,725 239,819 -33.69%
IMPORTACIONES DE REP. DOMINICANA SECTOR OTROSSUBPARTID
A 10 DIG PRODUCTO US $
Source: US INTERNATIONAL TRADE COMMISSION
The imports of donated foods, a sub-item that has had an annual average variation of 54%, is noteworthy.
BILATERAL TRADE BETWEEN THE DOMINICAN REPUBIC AND THE UNITED STATES OF AMERICA VI-109
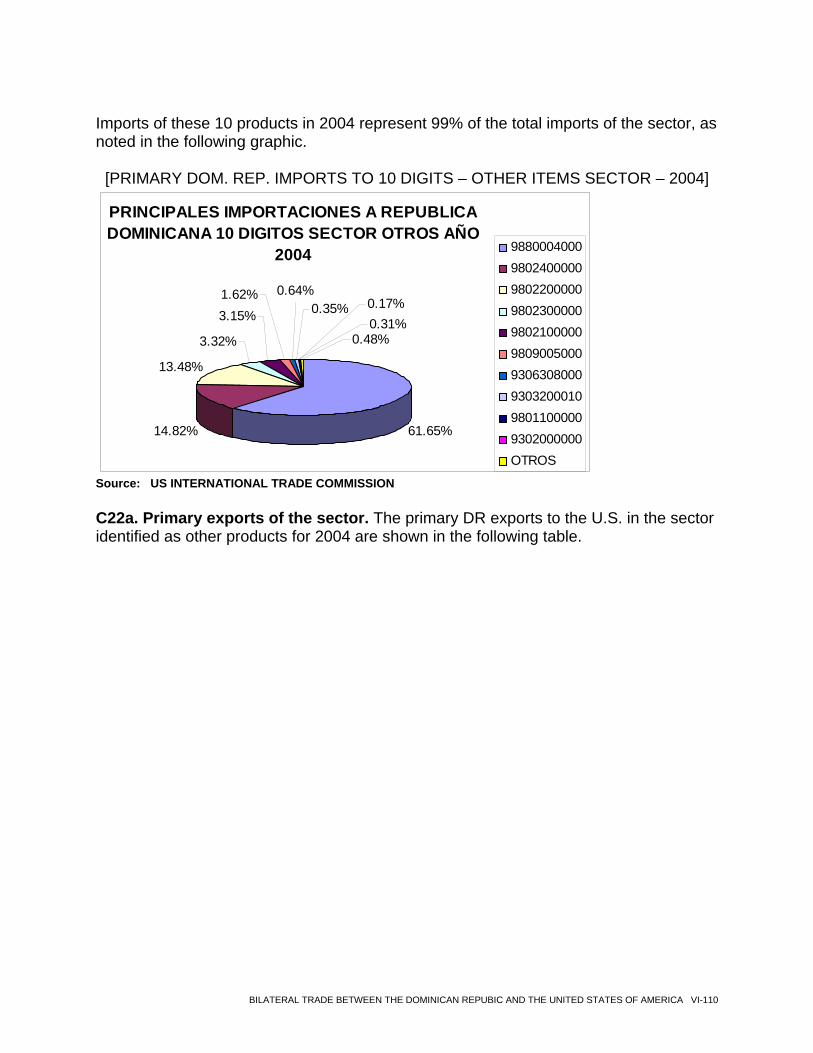
Imports of these 10 products in 2004 represent 99% of the total imports of the sector, as noted in the following graphic.
[PRIMARY DOM. REP. IMPORTS TO 10 DIGITS – OTHER ITEMS SECTOR – 2004]
PRINCIPALES IMPORTACIONES A REPUBLICA DOMINICANA 10 DIGITOS SECTOR OTROS AÑO
2004
61.65%14.82%
13.48%
3.32%
3.15%1.62% 0.64%
0.35%0.31%0.17%
0.48%
9880004000980240000098022000009802300000980210000098090050009306308000930320001098011000009302000000OTROS
Source: US INTERNATIONAL TRADE COMMISSION C22a. Primary exports of the sector. The primary DR exports to the U.S. in the sector identified as other products for 2004 are shown in the following table.
BILATERAL TRADE BETWEEN THE DOMINICAN REPUBIC AND THE UNITED STATES OF AMERICA VI-110
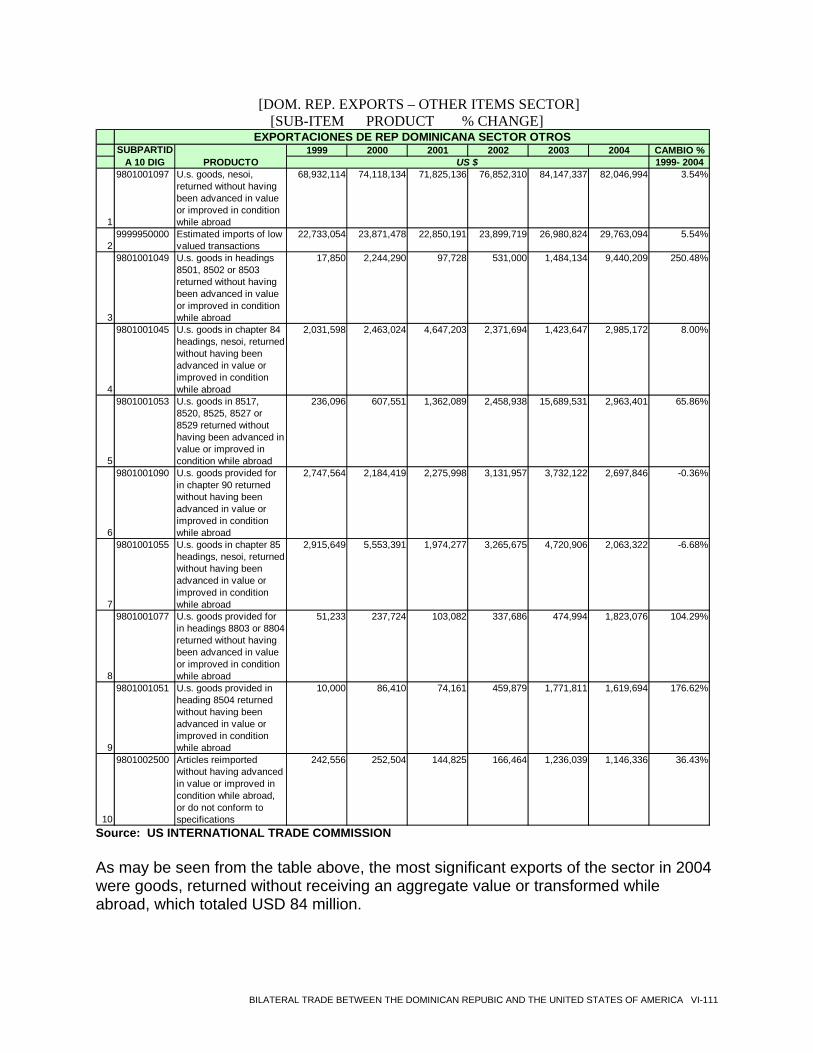
[DOM. REP. EXPORTS – OTHER ITEMS SECTOR] [SUB-ITEM PRODUCT % CHANGE]
1999 2000 2001 2002 2003 2004 CAMBIO %1999- 2004
1
9801001097 U.s. goods, nesoi, returned without having been advanced in value or improved in condition while abroad
68,932,114 74,118,134 71,825,136 76,852,310 84,147,337 82,046,994 3.54%
29999950000 Estimated imports of low
valued transactions22,733,054 23,871,478 22,850,191 23,899,719 26,980,824 29,763,094 5.54%
3
9801001049 U.s. goods in headings 8501, 8502 or 8503 returned without having been advanced in value or improved in condition while abroad
17,850 2,244,290 97,728 531,000 1,484,134 9,440,209 250.48%
4
9801001045 U.s. goods in chapter 84 headings, nesoi, returned without having been advanced in value or improved in condition while abroad
2,031,598 2,463,024 4,647,203 2,371,694 1,423,647 2,985,172 8.00%
5
9801001053 U.s. goods in 8517, 8520, 8525, 8527 or 8529 returned without having been advanced in value or improved in condition while abroad
236,096 607,551 1,362,089 2,458,938 15,689,531 2,963,401 65.86%
6
9801001090 U.s. goods provided for in chapter 90 returned without having been advanced in value or improved in condition while abroad
2,747,564 2,184,419 2,275,998 3,131,957 3,732,122 2,697,846 -0.36%
7
9801001055 U.s. goods in chapter 85 headings, nesoi, returned without having been advanced in value or improved in condition while abroad
2,915,649 5,553,391 1,974,277 3,265,675 4,720,906 2,063,322 -6.68%
8
9801001077 U.s. goods provided for in headings 8803 or 8804 returned without having been advanced in value or improved in condition while abroad
51,233 237,724 103,082 337,686 474,994 1,823,076 104.29%
9
9801001051 U.s. goods provided in heading 8504 returned without having been advanced in value or improved in condition while abroad
10,000 86,410 74,161 459,879 1,771,811 1,619,694 176.62%
10
9801002500 Articles reimported without having advanced in value or improved in condition while abroad, or do not conform to specifications
242,556 252,504 144,825 166,464 1,236,039 1,146,336 36.43%
EXPORTACIONES DE REP DOMINICANA SECTOR OTROSSUBPARTID
A 10 DIG PRODUCTO US $
Source: US INTERNATIONAL TRADE COMMISSION
As may be seen from the table above, the most significant exports of the sector in 2004 were goods, returned without receiving an aggregate value or transformed while abroad, which totaled USD 84 million.
BILATERAL TRADE BETWEEN THE DOMINICAN REPUBIC AND THE UNITED STATES OF AMERICA VI-111
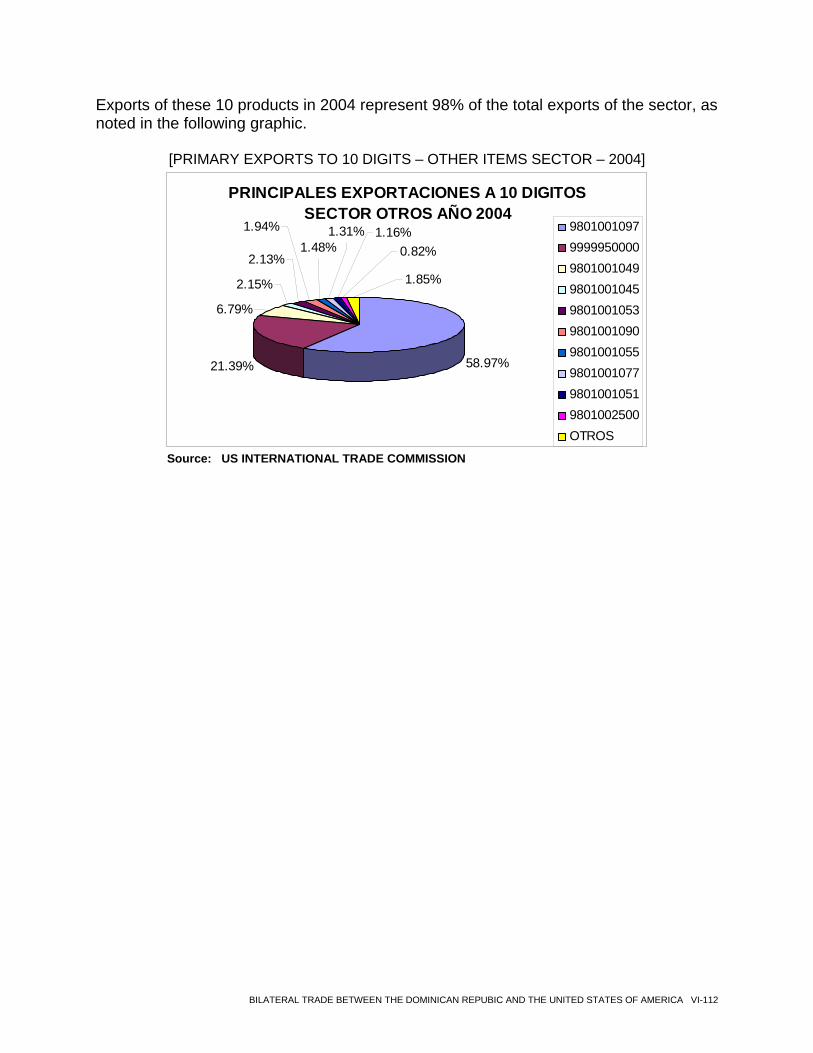
Exports of these 10 products in 2004 represent 98% of the total exports of the sector, as noted in the following graphic.
[PRIMARY EXPORTS TO 10 DIGITS – OTHER ITEMS SECTOR – 2004]
PRINCIPALES EXPORTACIONES A 10 DIGITOS SECTOR OTROS AÑO 2004
58.97%21.39%
6.79%
2.15%
2.13%1.85%
0.82%1.16%1.31%
1.48%1.94% 9801001097
999995000098010010499801001045980100105398010010909801001055980100107798010010519801002500OTROS
Source: US INTERNATIONAL TRADE COMMISSION
BILATERAL TRADE BETWEEN THE DOMINICAN REPUBIC AND THE UNITED STATES OF AMERICA VI-112
SECTION VII BILATERAL TRADE – 10 DIGITS OF THE CUSTOMS TARIFF CODE
SECTION VII BILATERAL TRADE – 10 DIGITS OF THE CUSTOMS TARIFF CODE A. Primary Imports of the DR from the U.S. to 10 Digits Total imports of the Dominican Republic from the U.S. in 2004 were USD 4,116,101,623. The 74 sub-items that represented the greatest value in 2004, and which represented 55% of the total value of the same, are shown below. The sub-item that generated the greatest imports for this year was automatic switches, with a value of USD 205 million, representing 5% of the total imports recorded in the past year. This sub-item had an average annual variation of 108% during the past several years (1999 - 204), taking into consideration that for 2003, imports totaled USD 73 million. The second sub-item in order of size is 5212230000, corresponding to dyed cotton fabric, with imports totaling USD 120 million in 2004. It is important to underline that this sub-item had no imports in 1999 and 2000, while in 2001 imports in the amount of USD 31,000 were recorded, with a notable increase for 2003 to USD 28 million. Imports of underwear, undershirts and pajamas made of cotton for men or children corresponding to sub-item 6107110000 are noteworthy. They totaled USD 106 million in 2004. This sub-item had an annual average variation which was moderate in comparison with the two sub-items analyzed above, of 7.45%. A table appears below identifying the 74 sub-items that recorded the highest level of imports in 2004, their position, description and the value of imports, within a range of from USD 205 million to USD 10 million.
BILATERAL TRADE BETWEEN THE DOMINICAN REPUBIC AND THE UNITED STATES OF AMERICA VII-2
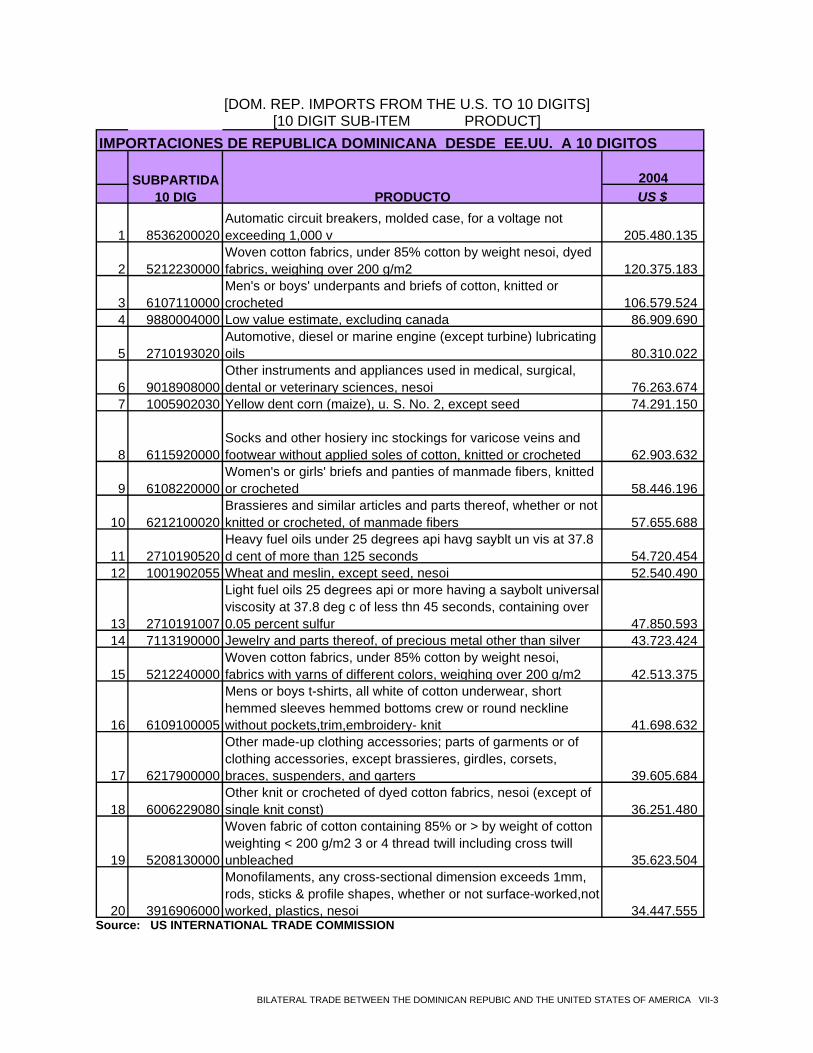
[DOM. REP. IMPORTS FROM THE U.S. TO 10 DIGITS] [10 DIGIT SUB-ITEM PRODUCT]
IMPORTACIONES DE REPUBLICA DOMINICANA DESDE EE.UU. A 10 DIGITOS
2004
1 8536200020Automatic circuit breakers, molded case, for a voltage not exceeding 1,000 v 205.480.135
2 5212230000Woven cotton fabrics, under 85% cotton by weight nesoi, dyed fabrics, weighing over 200 g/m2 120.375.183
3 6107110000Men's or boys' underpants and briefs of cotton, knitted or crocheted 106.579.524
4 9880004000 Low value estimate, excluding canada 86.909.690
5 2710193020Automotive, diesel or marine engine (except turbine) lubricating oils 80.310.022
6 9018908000Other instruments and appliances used in medical, surgical, dental or veterinary sciences, nesoi 76.263.674
7 1005902030 Yellow dent corn (maize), u. S. No. 2, except seed 74.291.150
8 6115920000Socks and other hosiery inc stockings for varicose veins and footwear without applied soles of cotton, knitted or crocheted 62.903.632
9 6108220000Women's or girls' briefs and panties of manmade fibers, knitted or crocheted 58.446.196
10 6212100020Brassieres and similar articles and parts thereof, whether or not knitted or crocheted, of manmade fibers 57.655.688
11 2710190520Heavy fuel oils under 25 degrees api havg sayblt un vis at 37.8 d cent of more than 125 seconds 54.720.454
12 1001902055 Wheat and meslin, except seed, nesoi 52.540.490
13 2710191007
Light fuel oils 25 degrees api or more having a saybolt universal viscosity at 37.8 deg c of less thn 45 seconds, containing over 0.05 percent sulfur 47.850.593
14 7113190000 Jewelry and parts thereof, of precious metal other than silver 43.723.424
15 5212240000Woven cotton fabrics, under 85% cotton by weight nesoi, fabrics with yarns of different colors, weighing over 200 g/m2 42.513.375
16 6109100005
Mens or boys t-shirts, all white of cotton underwear, short hemmed sleeves hemmed bottoms crew or round neckline without pockets,trim,embroidery- knit 41.698.632
17 6217900000
Other made-up clothing accessories; parts of garments or of clothing accessories, except brassieres, girdles, corsets, braces, suspenders, and garters 39.605.684
18 6006229080Other knit or crocheted of dyed cotton fabrics, nesoi (except of single knit const) 36.251.480
19 5208130000
Woven fabric of cotton containing 85% or > by weight of cotton weighting < 200 g/m2 3 or 4 thread twill including cross twill unbleached 35.623.504
20 3916906000
Monofilaments, any cross-sectional dimension exceeds 1mm, rods, sticks & profile shapes, whether or not surface-worked,not worked, plastics, nesoi 34.447.555
SUBPARTIDA 10 DIG PRODUCTO US $
Source: US INTERNATIONAL TRADE COMMISSION
BILATERAL TRADE BETWEEN THE DOMINICAN REPUBIC AND THE UNITED STATES OF AMERICA VII-3
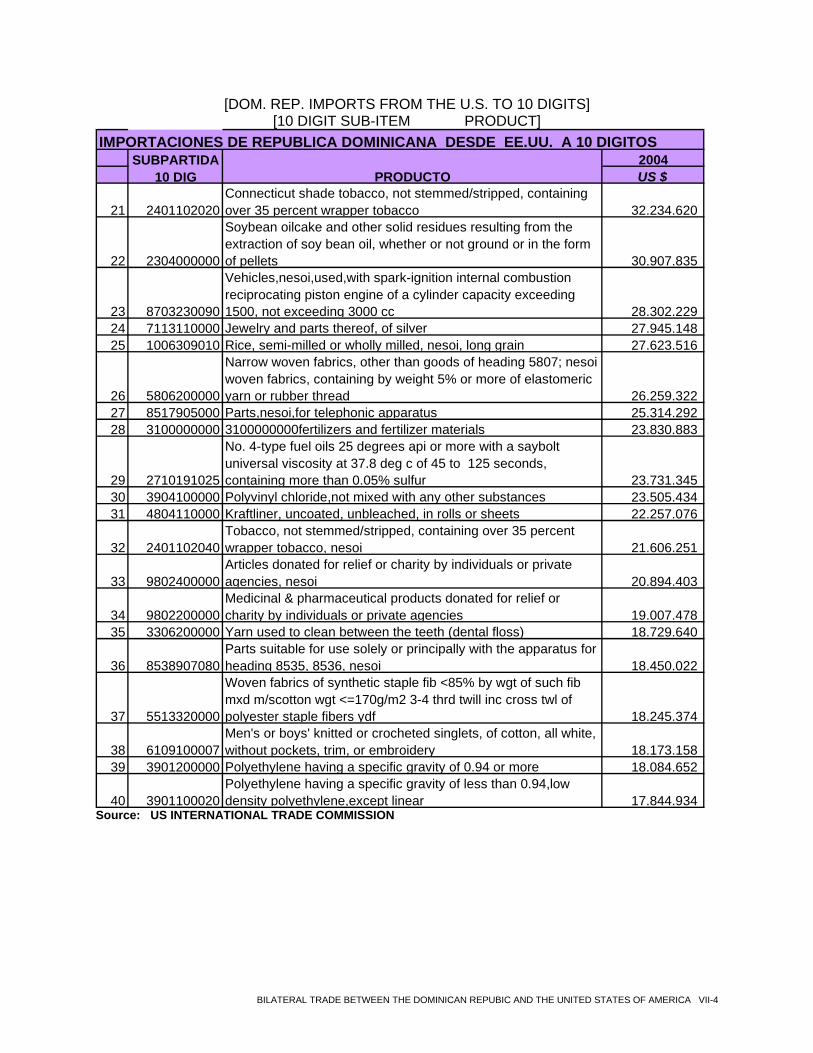
[DOM. REP. IMPORTS FROM THE U.S. TO 10 DIGITS] [10 DIGIT SUB-ITEM PRODUCT]
IMPORTACIONES DE REPUBLICA DOMINICANA DESDE EE.UU. A 10 DIGITOS2004
21 2401102020Connecticut shade tobacco, not stemmed/stripped, containing over 35 percent wrapper tobacco 32.234.620
22 2304000000
Soybean oilcake and other solid residues resulting from the extraction of soy bean oil, whether or not ground or in the form of pellets 30.907.835
23 8703230090
Vehicles,nesoi,used,with spark-ignition internal combustion reciprocating piston engine of a cylinder capacity exceeding 1500, not exceeding 3000 cc 28.302.229
24 7113110000 Jewelry and parts thereof, of silver 27.945.148 25 1006309010 Rice, semi-milled or wholly milled, nesoi, long grain 27.623.516
26 5806200000
Narrow woven fabrics, other than goods of heading 5807; nesoi woven fabrics, containing by weight 5% or more of elastomeric yarn or rubber thread 26.259.322
27 8517905000 Parts,nesoi,for telephonic apparatus 25.314.292 28 3100000000 3100000000fertilizers and fertilizer materials 23.830.883
29 2710191025
No. 4-type fuel oils 25 degrees api or more with a saybolt universal viscosity at 37.8 deg c of 45 to 125 seconds, containing more than 0.05% sulfur 23.731.345
30 3904100000 Polyvinyl chloride,not mixed with any other substances 23.505.434 31 4804110000 Kraftliner, uncoated, unbleached, in rolls or sheets 22.257.076
32 2401102040Tobacco, not stemmed/stripped, containing over 35 percent wrapper tobacco, nesoi 21.606.251
33 9802400000Articles donated for relief or charity by individuals or private agencies, nesoi 20.894.403
34 9802200000Medicinal & pharmaceutical products donated for relief or charity by individuals or private agencies 19.007.478
35 3306200000 Yarn used to clean between the teeth (dental floss) 18.729.640
36 8538907080Parts suitable for use solely or principally with the apparatus for heading 8535, 8536, nesoi 18.450.022
37 5513320000
Woven fabrics of synthetic staple fib <85% by wgt of such fib mxd m/scotton wgt <=170g/m2 3-4 thrd twill inc cross twl of polyester staple fibers ydf 18.245.374
38 6109100007Men's or boys' knitted or crocheted singlets, of cotton, all white, without pockets, trim, or embroidery 18.173.158
39 3901200000 Polyethylene having a specific gravity of 0.94 or more 18.084.652
40 3901100020Polyethylene having a specific gravity of less than 0.94,low density polyethylene,except linear 17.844.934
SUBPARTIDA 10 DIG PRODUCTO US $
Source: US INTERNATIONAL TRADE COMMISSION
BILATERAL TRADE BETWEEN THE DOMINICAN REPUBIC AND THE UNITED STATES OF AMERICA VII-4
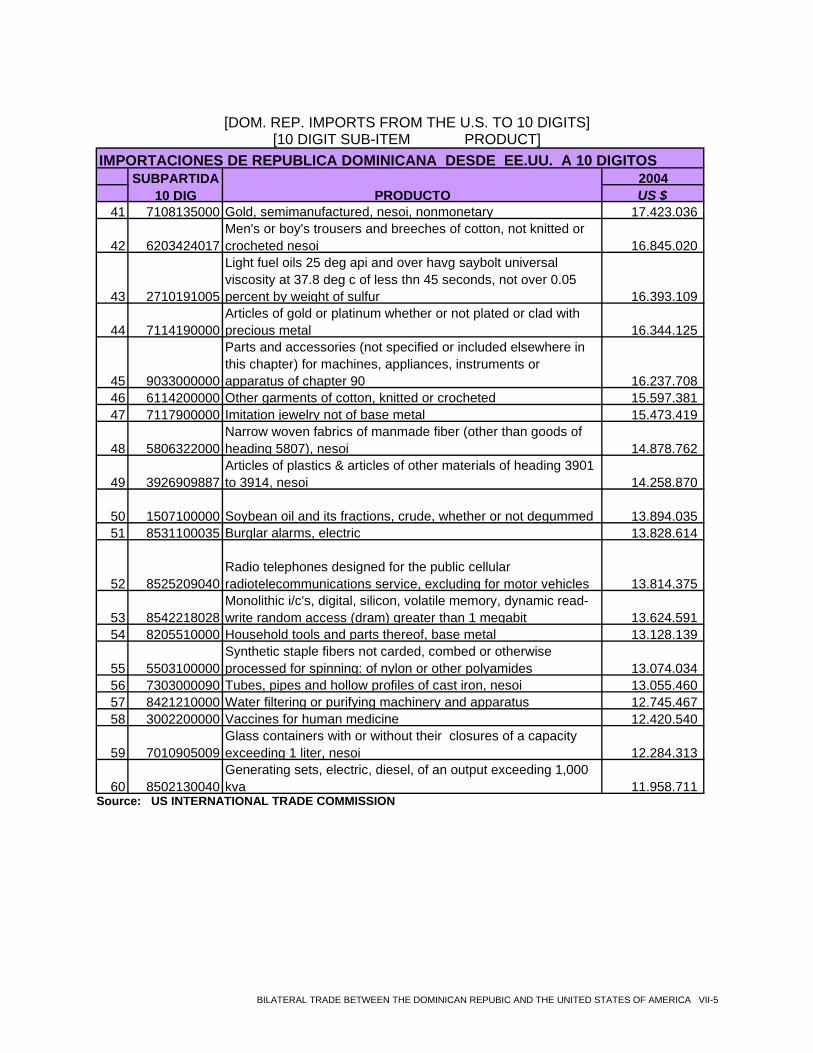
[DOM. REP. IMPORTS FROM THE U.S. TO 10 DIGITS]
[10 DIGIT SUB-ITEM PRODUCT] IMPORTACIONES DE REPUBLICA DOMINICANA DESDE EE.UU. A 10 DIGITOS
2004
41 7108135000 Gold, semimanufactured, nesoi, nonmonetary 17.423.036
42 6203424017Men's or boy's trousers and breeches of cotton, not knitted or crocheted nesoi 16.845.020
43 2710191005
Light fuel oils 25 deg api and over havg saybolt universal viscosity at 37.8 deg c of less thn 45 seconds, not over 0.05 percent by weight of sulfur 16.393.109
44 7114190000Articles of gold or platinum whether or not plated or clad with precious metal 16.344.125
45 9033000000
Parts and accessories (not specified or included elsewhere in this chapter) for machines, appliances, instruments or apparatus of chapter 90 16.237.708
46 6114200000 Other garments of cotton, knitted or crocheted 15.597.381 47 7117900000 Imitation jewelry not of base metal 15.473.419
48 5806322000Narrow woven fabrics of manmade fiber (other than goods of heading 5807), nesoi 14.878.762
49 3926909887Articles of plastics & articles of other materials of heading 3901 to 3914, nesoi 14.258.870
50 1507100000 Soybean oil and its fractions, crude, whether or not degummed 13.894.035 51 8531100035 Burglar alarms, electric 13.828.614
52 8525209040Radio telephones designed for the public cellular radiotelecommunications service, excluding for motor vehicles 13.814.375
53 8542218028Monolithic i/c's, digital, silicon, volatile memory, dynamic read-write random access (dram) greater than 1 megabit 13.624.591
54 8205510000 Household tools and parts thereof, base metal 13.128.139
55 5503100000Synthetic staple fibers not carded, combed or otherwise processed for spinning: of nylon or other polyamides 13.074.034
56 7303000090 Tubes, pipes and hollow profiles of cast iron, nesoi 13.055.460 57 8421210000 Water filtering or purifying machinery and apparatus 12.745.467 58 3002200000 Vaccines for human medicine 12.420.540
59 7010905009Glass containers with or without their closures of a capacity exceeding 1 liter, nesoi 12.284.313
60 8502130040Generating sets, electric, diesel, of an output exceeding 1,000 kva 11.958.711
SUBPARTIDA 10 DIG PRODUCTO US $
Source: US INTERNATIONAL TRADE COMMISSION
BILATERAL TRADE BETWEEN THE DOMINICAN REPUBIC AND THE UNITED STATES OF AMERICA VII-5
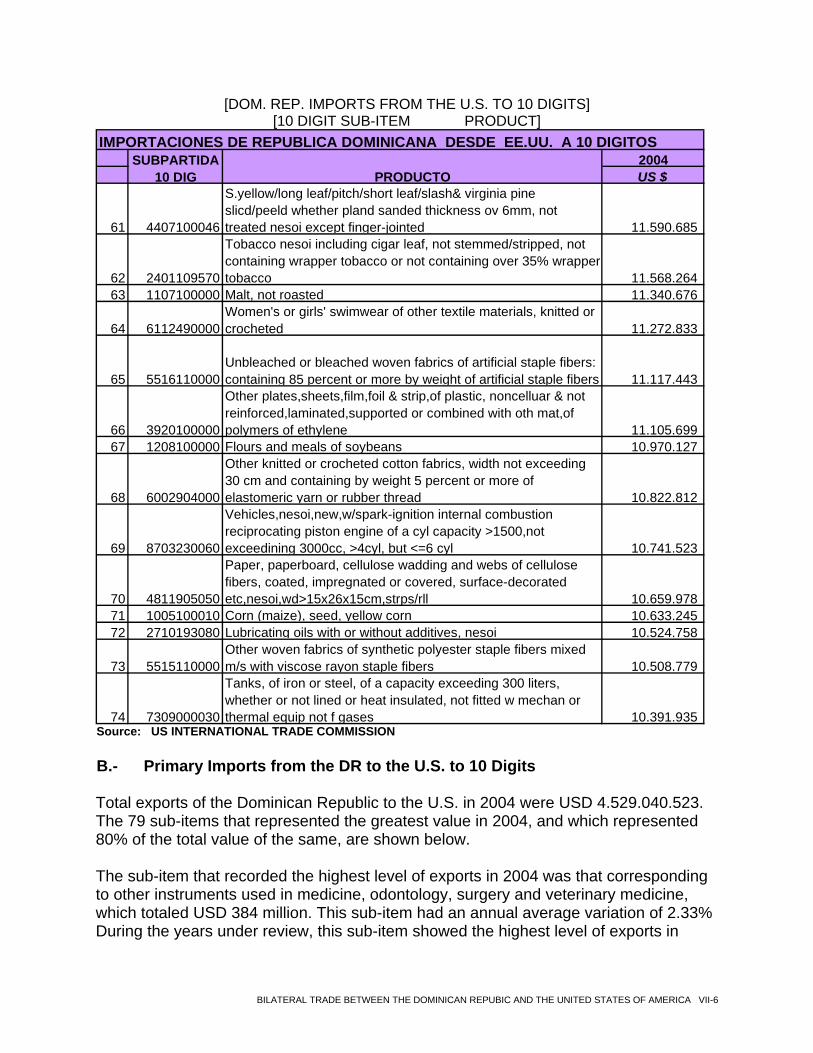
[DOM. REP. IMPORTS FROM THE U.S. TO 10 DIGITS] [10 DIGIT SUB-ITEM PRODUCT]
IMPORTACIONES DE REPUBLICA DOMINICANA DESDE EE.UU. A 10 DIGITOS2004
61 4407100046
S.yellow/long leaf/pitch/short leaf/slash& virginia pine slicd/peeld whether pland sanded thickness ov 6mm, not treated nesoi except finger-jointed 11.590.685
62 2401109570
Tobacco nesoi including cigar leaf, not stemmed/stripped, not containing wrapper tobacco or not containing over 35% wrapper tobacco 11.568.264
63 1107100000 Malt, not roasted 11.340.676
64 6112490000Women's or girls' swimwear of other textile materials, knitted or crocheted 11.272.833
65 5516110000Unbleached or bleached woven fabrics of artificial staple fibers: containing 85 percent or more by weight of artificial staple fibers 11.117.443
66 3920100000
Other plates,sheets,film,foil & strip,of plastic, noncelluar & not reinforced,laminated,supported or combined with oth mat,of polymers of ethylene 11.105.699
67 1208100000 Flours and meals of soybeans 10.970.127
68 6002904000
Other knitted or crocheted cotton fabrics, width not exceeding 30 cm and containing by weight 5 percent or more of elastomeric yarn or rubber thread 10.822.812
69 8703230060
Vehicles,nesoi,new,w/spark-ignition internal combustion reciprocating piston engine of a cyl capacity >1500,not exceedining 3000cc, >4cyl, but <=6 cyl 10.741.523
70 4811905050
Paper, paperboard, cellulose wadding and webs of cellulose fibers, coated, impregnated or covered, surface-decorated etc,nesoi,wd>15x26x15cm,strps/rll 10.659.978
71 1005100010 Corn (maize), seed, yellow corn 10.633.245 72 2710193080 Lubricating oils with or without additives, nesoi 10.524.758
73 5515110000Other woven fabrics of synthetic polyester staple fibers mixed m/s with viscose rayon staple fibers 10.508.779
74 7309000030
Tanks, of iron or steel, of a capacity exceeding 300 liters, whether or not lined or heat insulated, not fitted w mechan or thermal equip not f gases 10.391.935
SUBPARTIDA 10 DIG PRODUCTO US $
Source: US INTERNATIONAL TRADE COMMISSION
B.- Primary Imports from the DR to the U.S. to 10 Digits Total exports of the Dominican Republic to the U.S. in 2004 were USD 4.529.040.523. The 79 sub-items that represented the greatest value in 2004, and which represented 80% of the total value of the same, are shown below. The sub-item that recorded the highest level of exports in 2004 was that corresponding to other instruments used in medicine, odontology, surgery and veterinary medicine, which totaled USD 384 million. This sub-item had an annual average variation of 2.33% During the years under review, this sub-item showed the highest level of exports in
BILATERAL TRADE BETWEEN THE DOMINICAN REPUBIC AND THE UNITED STATES OF AMERICA VII-6
2004. It is important to underline that exports under this sub-item correspond to 8.48% of the total DR exports to the U.S. in 2004. Long pants, pants with a bib, short pants and shorts represented 6.89% of the total exports for 2004. Of this sub-item (6203424015), USD 312 million were exported, which had an average annual variation of 1.65%. In order of importance, exports of other gold or platinum jewelry, coated or non-coated, corresponding to sub-item 7113195000 comes next, which represented exports of USD 193 million in 2004, with an average annual variation of 7.63%. Exports of this sub-item represent 4.27% of the total exports of the Dominican Republic for 2004. A table appears below showing the 79 sub-items that accounted for the highest levels of exports in 2004, as well as their position, description and the value of exports, within a range of from USD 384 million to USD 10 million
BILATERAL TRADE BETWEEN THE DOMINICAN REPUBIC AND THE UNITED STATES OF AMERICA VII-7
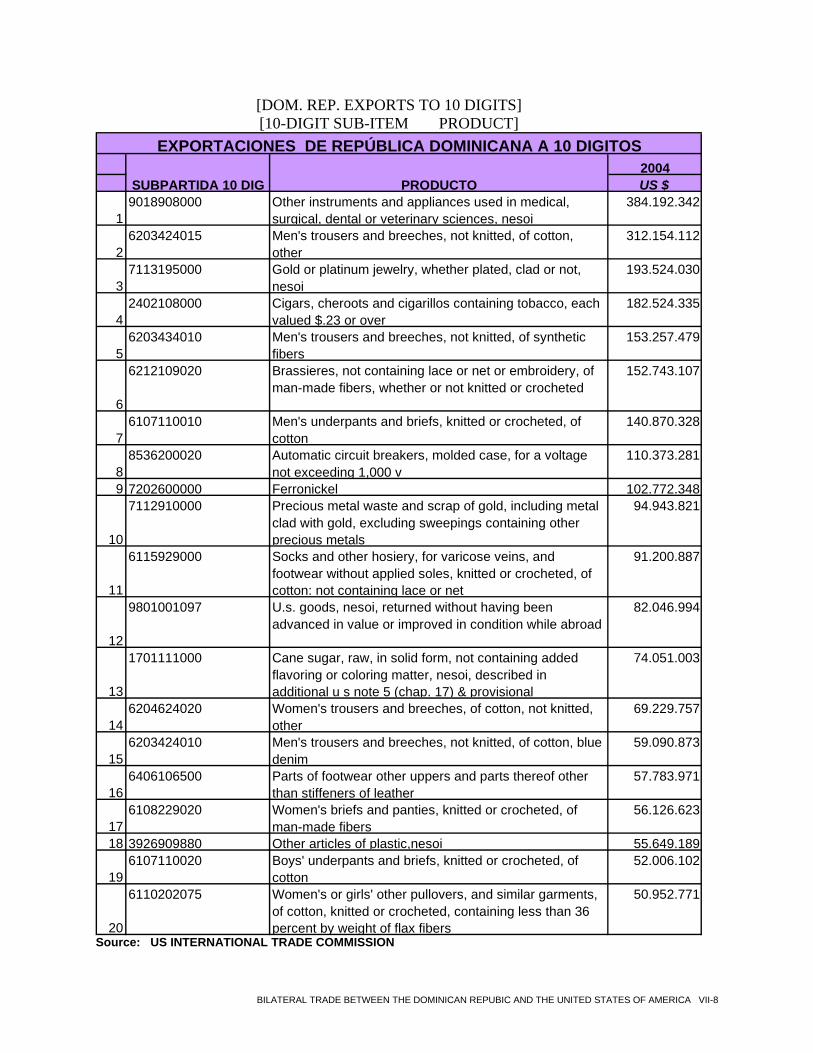
[DOM. REP. EXPORTS TO 10 DIGITS] [10-DIGIT SUB-ITEM PRODUCT]
2004
19018908000 Other instruments and appliances used in medical,
surgical, dental or veterinary sciences, nesoi384.192.342
26203424015 Men's trousers and breeches, not knitted, of cotton,
other312.154.112
37113195000 Gold or platinum jewelry, whether plated, clad or not,
nesoi193.524.030
42402108000 Cigars, cheroots and cigarillos containing tobacco, each
valued $.23 or over182.524.335
56203434010 Men's trousers and breeches, not knitted, of synthetic
fibers153.257.479
6
6212109020 Brassieres, not containing lace or net or embroidery, of man-made fibers, whether or not knitted or crocheted
152.743.107
76107110010 Men's underpants and briefs, knitted or crocheted, of
cotton140.870.328
88536200020 Automatic circuit breakers, molded case, for a voltage
not exceeding 1,000 v110.373.281
9 7202600000 Ferronickel 102.772.348
10
7112910000 Precious metal waste and scrap of gold, including metal clad with gold, excluding sweepings containing other precious metals
94.943.821
11
6115929000 Socks and other hosiery, for varicose veins, and footwear without applied soles, knitted or crocheted, of cotton: not containing lace or net
91.200.887
12
9801001097 U.s. goods, nesoi, returned without having been advanced in value or improved in condition while abroad
82.046.994
13
1701111000 Cane sugar, raw, in solid form, not containing added flavoring or coloring matter, nesoi, described in additional u s note 5 (chap. 17) & provisional
74.051.003
146204624020 Women's trousers and breeches, of cotton, not knitted,
other69.229.757
156203424010 Men's trousers and breeches, not knitted, of cotton, blue
denim59.090.873
166406106500 Parts of footwear other uppers and parts thereof other
than stiffeners of leather57.783.971
176108229020 Women's briefs and panties, knitted or crocheted, of
man-made fibers56.126.623
18 3926909880 Other articles of plastic,nesoi 55.649.189
196107110020 Boys' underpants and briefs, knitted or crocheted, of
cotton52.006.102
20
6110202075 Women's or girls' other pullovers, and similar garments, of cotton, knitted or crocheted, containing less than 36 percent by weight of flax fibers
50.952.771
SUBPARTIDA 10 DIG PRODUCTO US $
EXPORTACIONES DE REPÚBLICA DOMINICANA A 10 DIGITOS
Source: US INTERNATIONAL TRADE COMMISSION
BILATERAL TRADE BETWEEN THE DOMINICAN REPUBIC AND THE UNITED STATES OF AMERICA VII-8
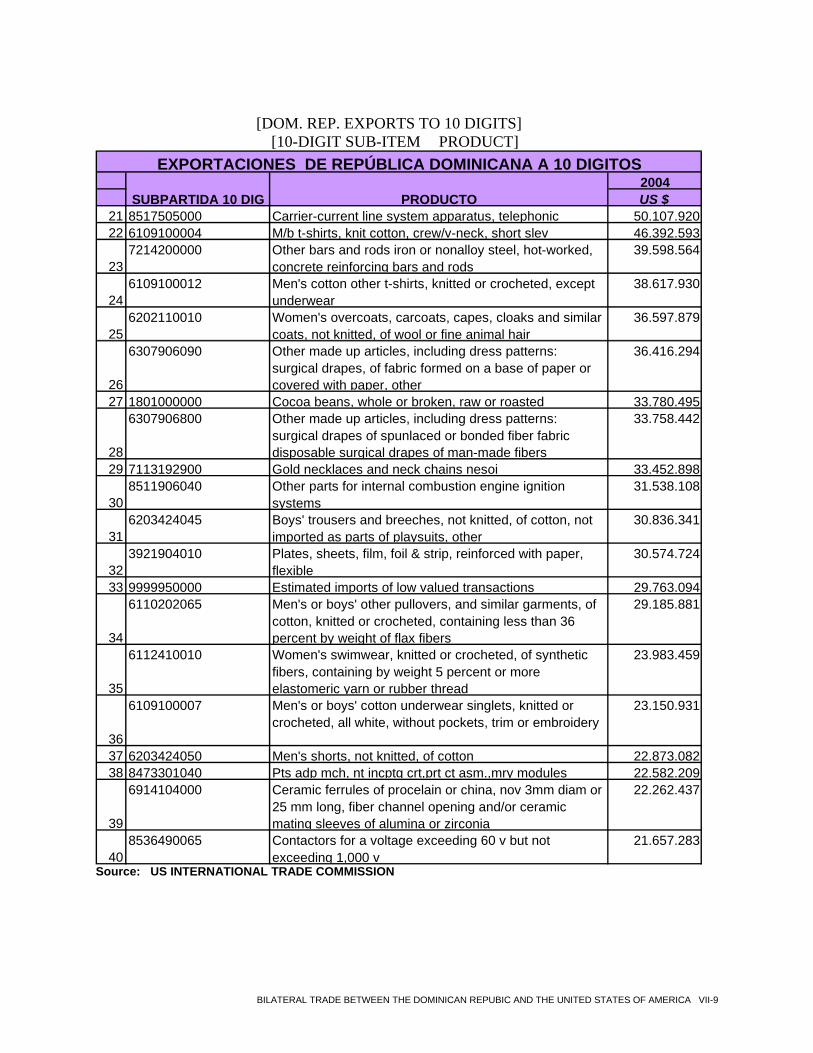
[DOM. REP. EXPORTS TO 10 DIGITS]
[10-DIGIT SUB-ITEM PRODUCT]
2004
21 8517505000 Carrier-current line system apparatus, telephonic 50.107.92022 6109100004 M/b t-shirts, knit cotton, crew/v-neck, short slev 46.392.593
237214200000 Other bars and rods iron or nonalloy steel, hot-worked,
concrete reinforcing bars and rods39.598.564
246109100012 Men's cotton other t-shirts, knitted or crocheted, except
underwear38.617.930
256202110010 Women's overcoats, carcoats, capes, cloaks and similar
coats, not knitted, of wool or fine animal hair36.597.879
26
6307906090 Other made up articles, including dress patterns: surgical drapes, of fabric formed on a base of paper or covered with paper, other
36.416.294
27 1801000000 Cocoa beans, whole or broken, raw or roasted 33.780.495
28
6307906800 Other made up articles, including dress patterns: surgical drapes of spunlaced or bonded fiber fabric disposable surgical drapes of man-made fibers
33.758.442
29 7113192900 Gold necklaces and neck chains nesoi 33.452.898
308511906040 Other parts for internal combustion engine ignition
systems31.538.108
316203424045 Boys' trousers and breeches, not knitted, of cotton, not
imported as parts of playsuits, other30.836.341
323921904010 Plates, sheets, film, foil & strip, reinforced with paper,
flexible30.574.724
33 9999950000 Estimated imports of low valued transactions 29.763.094
34
6110202065 Men's or boys' other pullovers, and similar garments, of cotton, knitted or crocheted, containing less than 36 percent by weight of flax fibers
29.185.881
35
6112410010 Women's swimwear, knitted or crocheted, of synthetic fibers, containing by weight 5 percent or more elastomeric yarn or rubber thread
23.983.459
36
6109100007 Men's or boys' cotton underwear singlets, knitted or crocheted, all white, without pockets, trim or embroidery
23.150.931
37 6203424050 Men's shorts, not knitted, of cotton 22.873.08238 8473301040 Pts adp mch, nt incptg crt,prt ct asm.,mry modules 22.582.209
39
6914104000 Ceramic ferrules of procelain or china, nov 3mm diam or 25 mm long, fiber channel opening and/or ceramic mating sleeves of alumina or zirconia
22.262.437
408536490065 Contactors for a voltage exceeding 60 v but not
exceeding 1,000 v21.657.283
EXPORTACIONES DE REPÚBLICA DOMINICANA A 10 DIGITOS
SUBPARTIDA 10 DIG PRODUCTO US $
Source: US INTERNATIONAL TRADE COMMISSION
BILATERAL TRADE BETWEEN THE DOMINICAN REPUBIC AND THE UNITED STATES OF AMERICA VII-9
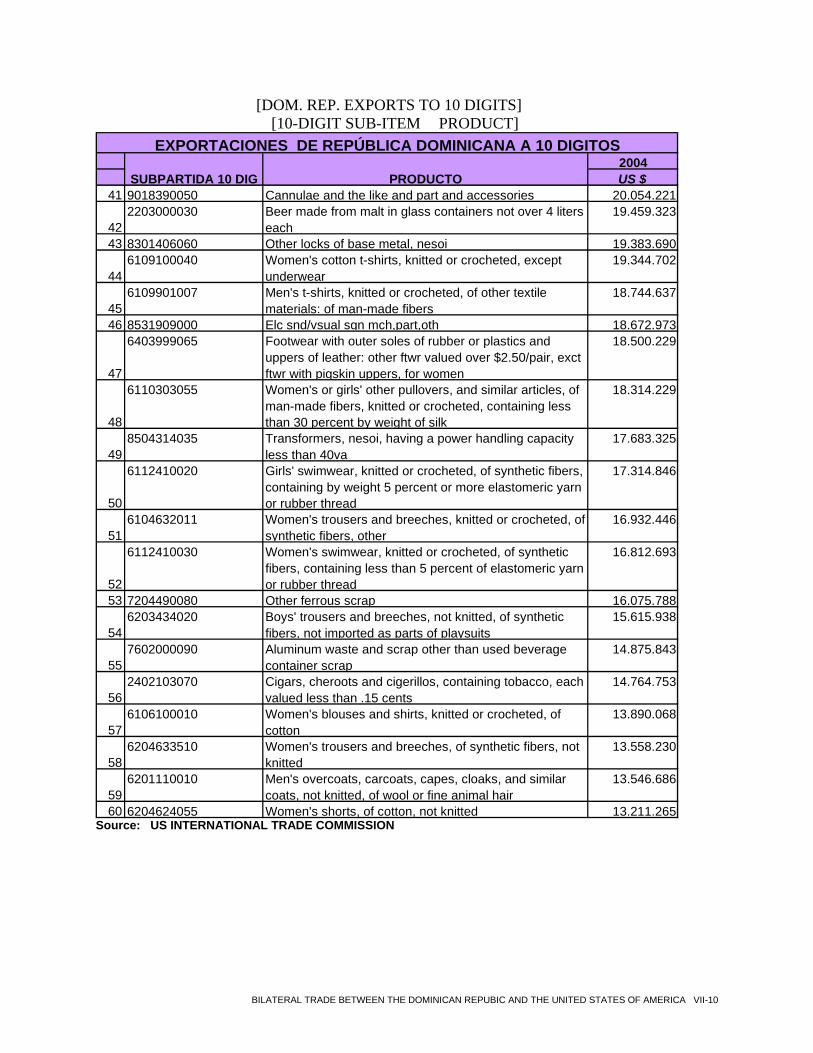
[DOM. REP. EXPORTS TO 10 DIGITS] [10-DIGIT SUB-ITEM PRODUCT]
2004
41 9018390050 Cannulae and the like and part and accessories 20.054.221
422203000030 Beer made from malt in glass containers not over 4 liters
each19.459.323
43 8301406060 Other locks of base metal, nesoi 19.383.690
446109100040 Women's cotton t-shirts, knitted or crocheted, except
underwear19.344.702
456109901007 Men's t-shirts, knitted or crocheted, of other textile
materials: of man-made fibers18.744.637
46 8531909000 Elc snd/vsual sgn mch,part,oth 18.672.973
47
6403999065 Footwear with outer soles of rubber or plastics and uppers of leather: other ftwr valued over $2.50/pair, exct ftwr with pigskin uppers, for women
18.500.229
48
6110303055 Women's or girls' other pullovers, and similar articles, of man-made fibers, knitted or crocheted, containing less than 30 percent by weight of silk
18.314.229
498504314035 Transformers, nesoi, having a power handling capacity
less than 40va17.683.325
50
6112410020 Girls' swimwear, knitted or crocheted, of synthetic fibers, containing by weight 5 percent or more elastomeric yarn or rubber thread
17.314.846
516104632011 Women's trousers and breeches, knitted or crocheted, of
synthetic fibers, other16.932.446
52
6112410030 Women's swimwear, knitted or crocheted, of synthetic fibers, containing less than 5 percent of elastomeric yarn or rubber thread
16.812.693
53 7204490080 Other ferrous scrap 16.075.788
546203434020 Boys' trousers and breeches, not knitted, of synthetic
fibers, not imported as parts of playsuits15.615.938
557602000090 Aluminum waste and scrap other than used beverage
container scrap14.875.843
562402103070 Cigars, cheroots and cigerillos, containing tobacco, each
valued less than .15 cents14.764.753
576106100010 Women's blouses and shirts, knitted or crocheted, of
cotton13.890.068
586204633510 Women's trousers and breeches, of synthetic fibers, not
knitted13.558.230
596201110010 Men's overcoats, carcoats, capes, cloaks, and similar
coats, not knitted, of wool or fine animal hair13.546.686
60 6204624055 Women's shorts, of cotton, not knitted 13.211.265
EXPORTACIONES DE REPÚBLICA DOMINICANA A 10 DIGITOS
SUBPARTIDA 10 DIG PRODUCTO US $
Source: US INTERNATIONAL TRADE COMMISSION
BILATERAL TRADE BETWEEN THE DOMINICAN REPUBIC AND THE UNITED STATES OF AMERICA VII-10
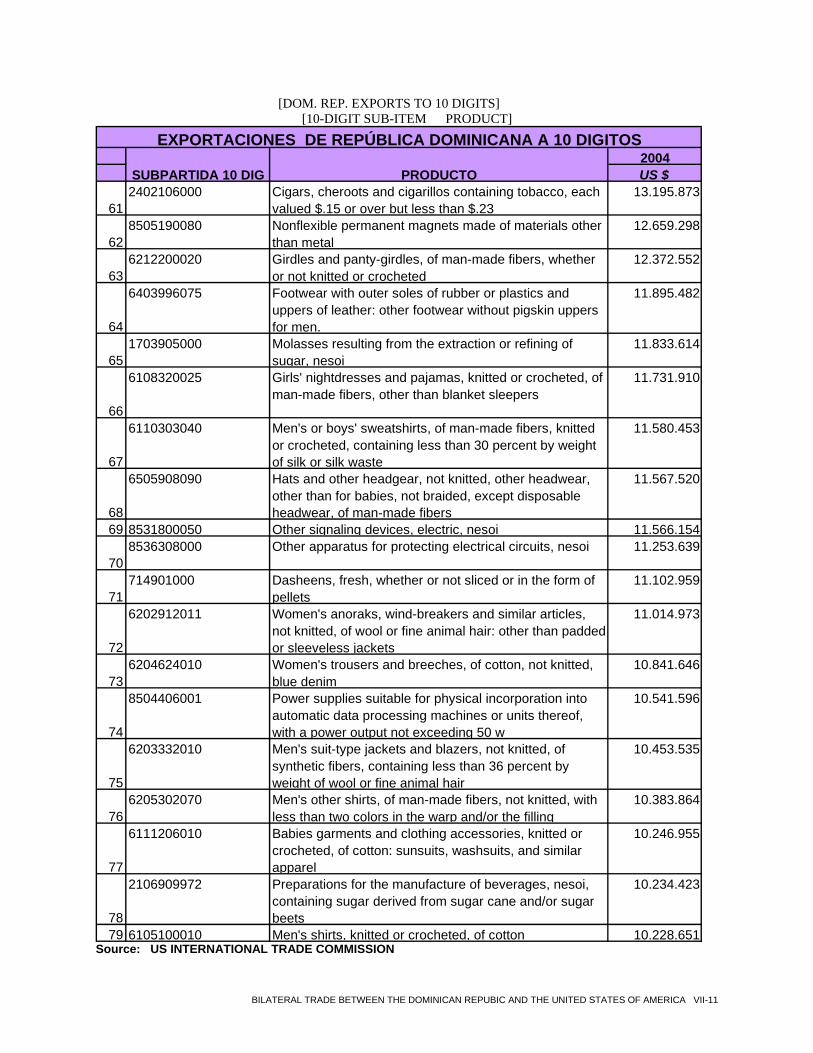
[DOM. REP. EXPORTS TO 10 DIGITS] [10-DIGIT SUB-ITEM PRODUCT]
2004
612402106000 Cigars, cheroots and cigarillos containing tobacco, each
valued $.15 or over but less than $.2313.195.873
628505190080 Nonflexible permanent magnets made of materials other
than metal12.659.298
636212200020 Girdles and panty-girdles, of man-made fibers, whether
or not knitted or crocheted12.372.552
64
6403996075 Footwear with outer soles of rubber or plastics and uppers of leather: other footwear without pigskin uppers for men.
11.895.482
651703905000 Molasses resulting from the extraction or refining of
sugar, nesoi11.833.614
66
6108320025 Girls' nightdresses and pajamas, knitted or crocheted, of man-made fibers, other than blanket sleepers
11.731.910
67
6110303040 Men's or boys' sweatshirts, of man-made fibers, knitted or crocheted, containing less than 30 percent by weight of silk or silk waste
11.580.453
68
6505908090 Hats and other headgear, not knitted, other headwear, other than for babies, not braided, except disposable headwear, of man-made fibers
11.567.520
69 8531800050 Other signaling devices, electric, nesoi 11.566.154
708536308000 Other apparatus for protecting electrical circuits, nesoi 11.253.639
71714901000 Dasheens, fresh, whether or not sliced or in the form of
pellets11.102.959
72
6202912011 Women's anoraks, wind-breakers and similar articles, not knitted, of wool or fine animal hair: other than padded or sleeveless jackets
11.014.973
736204624010 Women's trousers and breeches, of cotton, not knitted,
blue denim10.841.646
74
8504406001 Power supplies suitable for physical incorporation into automatic data processing machines or units thereof, with a power output not exceeding 50 w
10.541.596
75
6203332010 Men's suit-type jackets and blazers, not knitted, of synthetic fibers, containing less than 36 percent by weight of wool or fine animal hair
10.453.535
766205302070 Men's other shirts, of man-made fibers, not knitted, with
less than two colors in the warp and/or the filling10.383.864
77
6111206010 Babies garments and clothing accessories, knitted or crocheted, of cotton: sunsuits, washsuits, and similar apparel
10.246.955
78
2106909972 Preparations for the manufacture of beverages, nesoi, containing sugar derived from sugar cane and/or sugar beets
10.234.423
79 6105100010 Men's shirts, knitted or crocheted, of cotton 10.228.651
EXPORTACIONES DE REPÚBLICA DOMINICANA A 10 DIGITOS
SUBPARTIDA 10 DIG PRODUCTO US $
Source: US INTERNATIONAL TRADE COMMISSION
BILATERAL TRADE BETWEEN THE DOMINICAN REPUBIC AND THE UNITED STATES OF AMERICA VII-11
SECTION VIII
BIBLIOGRAPHY
SECTION VIII
BIBLIOGRAPHY CEPAL, “DOMINICAN REPUBLIC: ECONOMIC PROGRESS DURING 2004 AND PROSPECTS FOR 2005.” LC/MEX/L.670 – July 21, 2005 U.S. DEPARTMENT OF COMMERCE, STATISTICAL INFORMATION, EXPORTS OF THE UNITED STATES, EXPORT STATISTICS TO THE WORLD AND THE DOMINICAN REPUBLIC 1999, 2000, 2001, 2002, 2003 AND 2004 BY PRODUCTS, BY SECTORS AND BY CUSTOMS TARIFF CHAPTER. U.S. DEPARTMENT OF COMMERCE, STATISTICAL INFORMATION, EXPORTS OF THE UNITED STATES, EXPORT STATISTICS TO THE WORLD AND THE DOMINICAN REPUBLIC 1999, 2000, 2001, 2002, 2003 AND 2004 BY PRODUCTS, BY SECTORS AND BY CUSTOMS TARIFF CHAPTER. SEGOVIA ALEXANDER, “THE IMPACT OF CAFTA ON THE CENTRAL AMERICAN DEVELOPMENT MODEL” (On-going Research) August 2004
BILATERAL TRADE BETWEEN THE DOMINICAN REPUBIC AND THE UNITED STATES OF AMERICA VIII-2
APPENDIX A DESCRIPTION OF CUSTOMS TARIFF CHAPTERS
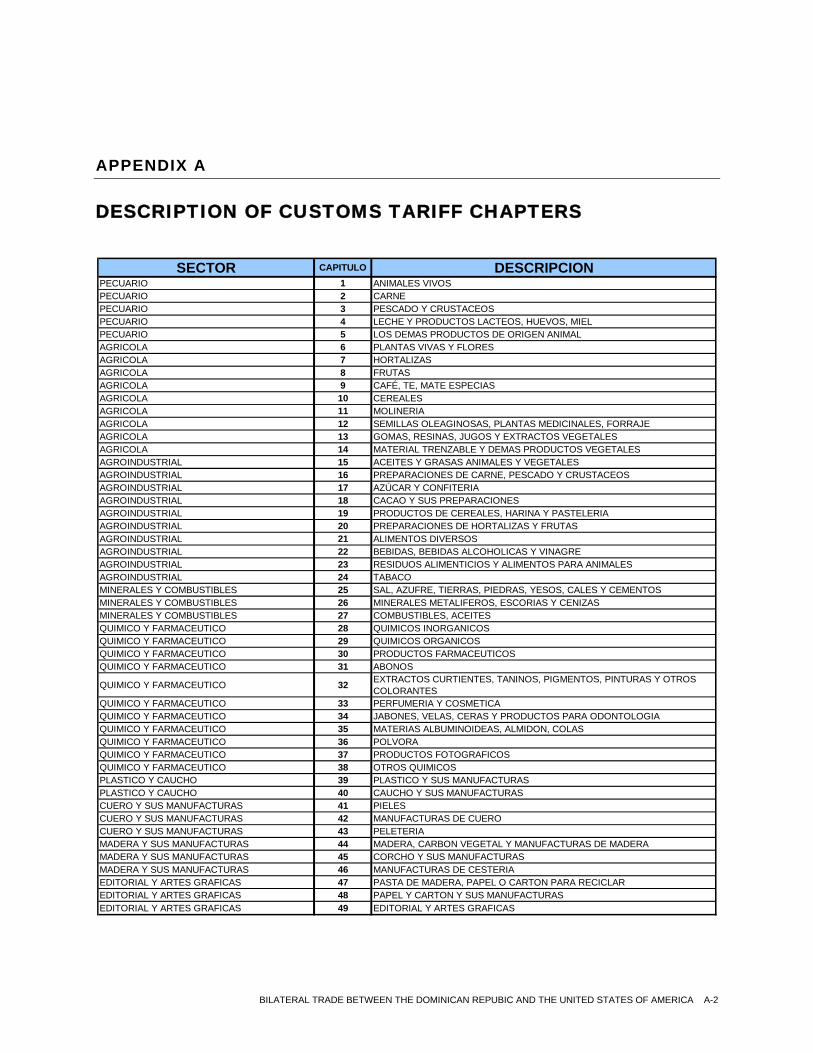
APPENDIX A DESCRIPTION OF CUSTOMS TARIFF CHAPTERS
SECTOR CAPITULO DESCRIPCIONPECUARIO 1 ANIMALES VIVOSPECUARIO 2 CARNE PECUARIO 3 PESCADO Y CRUSTACEOSPECUARIO 4 LECHE Y PRODUCTOS LACTEOS, HUEVOS, MIELPECUARIO 5 LOS DEMAS PRODUCTOS DE ORIGEN ANIMALAGRICOLA 6 PLANTAS VIVAS Y FLORESAGRICOLA 7 HORTALIZASAGRICOLA 8 FRUTASAGRICOLA 9 CAFÉ, TE, MATE ESPECIASAGRICOLA 10 CEREALESAGRICOLA 11 MOLINERIAAGRICOLA 12 SEMILLAS OLEAGINOSAS, PLANTAS MEDICINALES, FORRAJEAGRICOLA 13 GOMAS, RESINAS, JUGOS Y EXTRACTOS VEGETALESAGRICOLA 14 MATERIAL TRENZABLE Y DEMAS PRODUCTOS VEGETALESAGROINDUSTRIAL 15 ACEITES Y GRASAS ANIMALES Y VEGETALESAGROINDUSTRIAL 16 PREPARACIONES DE CARNE, PESCADO Y CRUSTACEOSAGROINDUSTRIAL 17 AZÚCAR Y CONFITERIAAGROINDUSTRIAL 18 CACAO Y SUS PREPARACIONESAGROINDUSTRIAL 19 PRODUCTOS DE CEREALES, HARINA Y PASTELERIAAGROINDUSTRIAL 20 PREPARACIONES DE HORTALIZAS Y FRUTASAGROINDUSTRIAL 21 ALIMENTOS DIVERSOSAGROINDUSTRIAL 22 BEBIDAS, BEBIDAS ALCOHOLICAS Y VINAGREAGROINDUSTRIAL 23 RESIDUOS ALIMENTICIOS Y ALIMENTOS PARA ANIMALESAGROINDUSTRIAL 24 TABACOMINERALES Y COMBUSTIBLES 25 SAL, AZUFRE, TIERRAS, PIEDRAS, YESOS, CALES Y CEMENTOSMINERALES Y COMBUSTIBLES 26 MINERALES METALIFEROS, ESCORIAS Y CENIZASMINERALES Y COMBUSTIBLES 27 COMBUSTIBLES, ACEITESQUIMICO Y FARMACEUTICO 28 QUIMICOS INORGANICOSQUIMICO Y FARMACEUTICO 29 QUIMICOS ORGANICOSQUIMICO Y FARMACEUTICO 30 PRODUCTOS FARMACEUTICOSQUIMICO Y FARMACEUTICO 31 ABONOS
QUIMICO Y FARMACEUTICO 32 EXTRACTOS CURTIENTES, TANINOS, PIGMENTOS, PINTURAS Y OTROS COLORANTES
QUIMICO Y FARMACEUTICO 33 PERFUMERIA Y COSMETICAQUIMICO Y FARMACEUTICO 34 JABONES, VELAS, CERAS Y PRODUCTOS PARA ODONTOLOGIAQUIMICO Y FARMACEUTICO 35 MATERIAS ALBUMINOIDEAS, ALMIDON, COLASQUIMICO Y FARMACEUTICO 36 POLVORAQUIMICO Y FARMACEUTICO 37 PRODUCTOS FOTOGRAFICOSQUIMICO Y FARMACEUTICO 38 OTROS QUIMICOSPLASTICO Y CAUCHO 39 PLASTICO Y SUS MANUFACTURASPLASTICO Y CAUCHO 40 CAUCHO Y SUS MANUFACTURASCUERO Y SUS MANUFACTURAS 41 PIELESCUERO Y SUS MANUFACTURAS 42 MANUFACTURAS DE CUEROCUERO Y SUS MANUFACTURAS 43 PELETERIAMADERA Y SUS MANUFACTURAS 44 MADERA, CARBON VEGETAL Y MANUFACTURAS DE MADERAMADERA Y SUS MANUFACTURAS 45 CORCHO Y SUS MANUFACTURASMADERA Y SUS MANUFACTURAS 46 MANUFACTURAS DE CESTERIAEDITORIAL Y ARTES GRAFICAS 47 PASTA DE MADERA, PAPEL O CARTON PARA RECICLAREDITORIAL Y ARTES GRAFICAS 48 PAPEL Y CARTON Y SUS MANUFACTURASEDITORIAL Y ARTES GRAFICAS 49 EDITORIAL Y ARTES GRAFICAS
BILATERAL TRADE BETWEEN THE DOMINICAN REPUBIC AND THE UNITED STATES OF AMERICA A-2
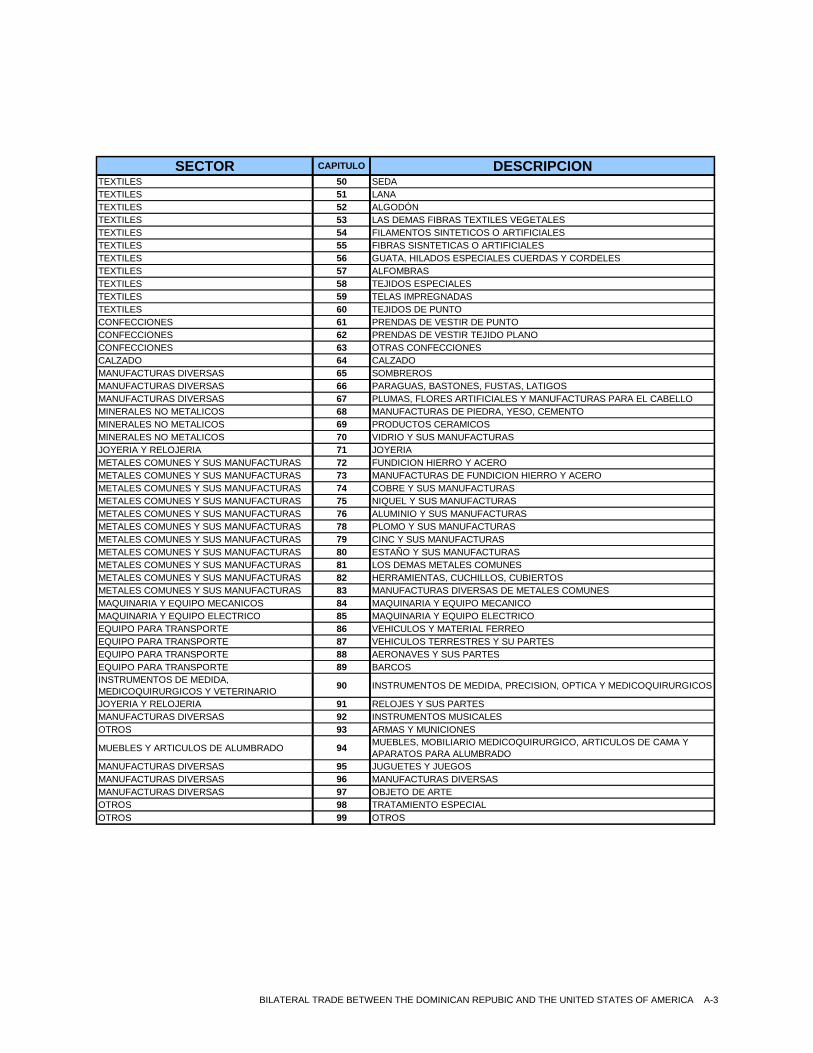
SECTOR CAPITULO DESCRIPCIONTEXTILES 50 SEDATEXTILES 51 LANATEXTILES 52 ALGODÓNTEXTILES 53 LAS DEMAS FIBRAS TEXTILES VEGETALESTEXTILES 54 FILAMENTOS SINTETICOS O ARTIFICIALESTEXTILES 55 FIBRAS SISNTETICAS O ARTIFICIALESTEXTILES 56 GUATA, HILADOS ESPECIALES CUERDAS Y CORDELESTEXTILES 57 ALFOMBRASTEXTILES 58 TEJIDOS ESPECIALESTEXTILES 59 TELAS IMPREGNADASTEXTILES 60 TEJIDOS DE PUNTOCONFECCIONES 61 PRENDAS DE VESTIR DE PUNTOCONFECCIONES 62 PRENDAS DE VESTIR TEJIDO PLANOCONFECCIONES 63 OTRAS CONFECCIONESCALZADO 64 CALZADOMANUFACTURAS DIVERSAS 65 SOMBREROSMANUFACTURAS DIVERSAS 66 PARAGUAS, BASTONES, FUSTAS, LATIGOSMANUFACTURAS DIVERSAS 67 PLUMAS, FLORES ARTIFICIALES Y MANUFACTURAS PARA EL CABELLOMINERALES NO METALICOS 68 MANUFACTURAS DE PIEDRA, YESO, CEMENTOMINERALES NO METALICOS 69 PRODUCTOS CERAMICOSMINERALES NO METALICOS 70 VIDRIO Y SUS MANUFACTURASJOYERIA Y RELOJERIA 71 JOYERIAMETALES COMUNES Y SUS MANUFACTURAS 72 FUNDICION HIERRO Y ACEROMETALES COMUNES Y SUS MANUFACTURAS 73 MANUFACTURAS DE FUNDICION HIERRO Y ACEROMETALES COMUNES Y SUS MANUFACTURAS 74 COBRE Y SUS MANUFACTURASMETALES COMUNES Y SUS MANUFACTURAS 75 NIQUEL Y SUS MANUFACTURASMETALES COMUNES Y SUS MANUFACTURAS 76 ALUMINIO Y SUS MANUFACTURASMETALES COMUNES Y SUS MANUFACTURAS 78 PLOMO Y SUS MANUFACTURASMETALES COMUNES Y SUS MANUFACTURAS 79 CINC Y SUS MANUFACTURASMETALES COMUNES Y SUS MANUFACTURAS 80 ESTAÑO Y SUS MANUFACTURASMETALES COMUNES Y SUS MANUFACTURAS 81 LOS DEMAS METALES COMUNESMETALES COMUNES Y SUS MANUFACTURAS 82 HERRAMIENTAS, CUCHILLOS, CUBIERTOS METALES COMUNES Y SUS MANUFACTURAS 83 MANUFACTURAS DIVERSAS DE METALES COMUNESMAQUINARIA Y EQUIPO MECANICOS 84 MAQUINARIA Y EQUIPO MECANICOMAQUINARIA Y EQUIPO ELECTRICO 85 MAQUINARIA Y EQUIPO ELECTRICOEQUIPO PARA TRANSPORTE 86 VEHICULOS Y MATERIAL FERREOEQUIPO PARA TRANSPORTE 87 VEHICULOS TERRESTRES Y SU PARTESEQUIPO PARA TRANSPORTE 88 AERONAVES Y SUS PARTESEQUIPO PARA TRANSPORTE 89 BARCOSINSTRUMENTOS DE MEDIDA, MEDICOQUIRURGICOS Y VETERINARIO 90 INSTRUMENTOS DE MEDIDA, PRECISION, OPTICA Y MEDICOQUIRURGICOS
JOYERIA Y RELOJERIA 91 RELOJES Y SUS PARTESMANUFACTURAS DIVERSAS 92 INSTRUMENTOS MUSICALESOTROS 93 ARMAS Y MUNICIONES
MUEBLES Y ARTICULOS DE ALUMBRADO 94 MUEBLES, MOBILIARIO MEDICOQUIRURGICO, ARTICULOS DE CAMA Y APARATOS PARA ALUMBRADO
MANUFACTURAS DIVERSAS 95 JUGUETES Y JUEGOSMANUFACTURAS DIVERSAS 96 MANUFACTURAS DIVERSASMANUFACTURAS DIVERSAS 97 OBJETO DE ARTEOTROS 98 TRATAMIENTO ESPECIALOTROS 99 OTROS
BILATERAL TRADE BETWEEN THE DOMINICAN REPUBIC AND THE UNITED STATES OF AMERICA A-3