biochemical evaluation of selected strains of...
TRANSCRIPT

CHAPTER 6
Biochemical evaluation of selected strains of
cyanobacteria

Ecological and biochemical studies on cyanobacteria of Cochin estuary and their application as source of antioxidants
6.1 Introduction
Cyanobacteria are distributed in the whole aquatic ecosystem serving
as the primary food source for all growth stages of bivalves, and for the larvae
of some crustaceans and fishes (Brown and Farmer, 1994). The biochemical
composition of the algae plays an important role in their nutritional value and
is crucial to the growth and development of these animals. Besides,
cyanobacteria have the potential to produce a wide range of fine chemicals
including polyunsaturated fatty acids, carotenoids, biloproteins, antibiotics,
vitamins, polysaccharides, bioflocculants, biosurfactants, growth promoters
etc. and thus can be utilised on a commercial scale.
The cyanobacterium Spirulina has been commercially exploited in
several countries (Benemann, 1988; Venkataraman and Becker, 1985). It has
been used as food for many centuries in Central America. For the past two
decades S.platensis has been a focus of interest among researchers in
various fields because of its commercial importance as a source of proteins,
vitamins, essential aminoacids and fatty acids. (Ciferri and Tiboni, 1985;
Vonshak and Richmond, 1988; Vonshak, 1990; Tanticharoen et al., 1994) and
more recently, for its potential in therapeutic effects (Amha Belay et al., 1993).
Basic studies on this species include studies on the growth kinetics by Ogawa
et al. (1971) and lehana (1983); growth and growth yield by Aiba and Ogawa
(1977) and Ogawa and Aiba (1978).
Although work on the screening and selection of efficient Spirulina
strains for their nutritive value as well as production of particular end products
has been done, much attention has not been paid to screening and selection
of other cyanobacteria. Cyanobacteria such as Phormidium, Chroococcus and
Nostoc have regularly been used as food in Mexico, Mongolia, China, Fiji and
Thailand (Cannell, 1989). However, the commercial significance of
cyanobacteria was realized only very recently and so it is in its infancy. Now
a-days, scientists are motivated to search for more potential species available
Chapter.6· Biochemical evaluation of selected strains of cyanobacteria
71

Ecological and biochemical studies on cyanobacteria of Cochln estuary and their application as source of antioxidants
in nature for exploiting them in a variety of ways to meet our needs. It needs
an extensive screening, which is expected to result in the discovery of better
cyanobacterial strains of industrial interest.
The merits of an organism for commercial exploitation are maximum
yield and utility of cellular constituents (Borowitzka and Borowitzka, 1988).
Higher growth rate and nutrient profile of cyanobacteria make them a
potentially valuable source of nutrients (Cannell, 1989). Growth of a living
organism is defined as an increase in mass or size accompanied by synthesis
of macromolecules, leading to the production of a newly organized structure.
In unicellular cyanobacteria, the increase in number of cells is a measure of
growth. In filamentous species, growth may include differentiation to produce
cells for particular function. Any cell of such a filament is potentially capable of
binary fission, and hence, growth in length of the chain is mainly the sum of
growth of the individual cells. Therefore, it is very complicated to measure the
growth of cyanobacteria in terms of increase in cell numbers by microscopic
observation.
Microbiologists use a variety of techniques to quantify microbial growth
other than determining direct cell count. These include the measurement of
macromolecules in the cells (Healy and Henzde/, 1976), the cell quota of
specific elements (Rhee and Gotham, 1980), or the kinetic parameters for
nutrient uptake (Zevenboom e.t al. 1982). Photosynthetic rate was higher in
cultures grown at faster rates. Although relative incorporation into protein was
constant, the absolute rate of protein incorporation increased at higher growth
rates because the photosynthetic rate had increased. Chlorophyll-a is another
component of biomass, which can be estimated as a measure of growth
(Kobayasi, 1961).
The various phases of growth in a microbial culture constitute a typical
growth curve. The growth cycle in the system passes through four phases
such as lag, log, stationary and death phase. Lag phase is the initial period in
Chapter.6- Biochemical evaluation of selected strains of cyanobacteria
72

Ecological and biochemical studies on cyanobacteria of Cochln estuary and their application as source of antioxidants
which there appears to be no growth. Although cells are not dividing during
the lag phase they are metabolically active, repairing cellular damage and
synthesizing enzymes. The lag phase is followed by a period of rapid
balanced growth, the logarithmic or the exponential growth phase commonly
called the log phase. Next is stationary phase, during which no new growth is
apparent and finally there is decline in the viable population until all microbial
cells die, i.e. the decline or death phase. Very often, one or more of these
phases may not be recognizable. The presence and duration of various
phases of growth are indicative of the eco-physiological response of the
organism to the physicochemical parameters to which the culture is exposed.
Venkataraman and Mahadevaswamy (1992) pointed out that good
culture management with suitable strain is one of the basic needs to get
promising yields with quality material on commercial scale. Therefore,
cultivation techniques are to be improved with the main objective of obtaining
higher algal biomass that exhibits specific qualities (Lobban and Harrison,
1994). Mass cultivation of cyanobacteria is essentially a complex process
involving a large number of variables and for the successful growth of
cyanobacteria, the environment must be conditioned to meet as many of the
essential requirements of that organism as possible. The limitations imposed
in the cultivation process can be due to the physical (photon, nutrients,
temperature and pH), physiological (organism-environmental-interrelationship)
and economic constraints (Rad.ha Prasanna et al., 1998). The environmental
factors may be either physiological such as salinity and pH or chemical which
provide all the raw materials used for structural and protoplasmic synthesis of
cyanobacterial cells (Secker, 1994). Physical and chemical factors such as
temperature, salinity and light (Lobban and Harrison, 1994), aeration (Chen
and Johns, 1991) or nutrient concentration (Sjornsater and Wheeler, 1990)
influence the biochemical composition, physiological status and ultrastructure
of the cyanobacteria. Culture medium has been found to play a significant role
in the growth kinetics of algae, since it has to stimulate the natural conditions
as closely as possible. Cyanobacteria are known to exhibit a wide adaptability
Chapter.6- Biochemical evaluation of selected strains of cyanobacteria
73

Ecological and biochemical studies on cyanobactcria of Cochin estuary and their application as source of antioxidants
to pH and salinity, but for mass cultivation of cyanobacteria, it is essential to
determine their optimal conditions.
The measurement of photosynthetic pigments and other products can
be used to monitor their physiological state (Li et al., 1980; Smith and Morris,
1980; Morris et al., 1981; Konopka, 1982), but by itself, it will not provide
conclusive information on the nutritional status of the population (Konopka,
1983). Evaluation of their physiological as well as biochemical characteristics
lead to the selection of more prospective strains.
The aim of the present investigation was to screen and select the most
promising cyanobacteria. They were investigated both physiologically and
biochemically. Determination of the most favourable pH, salinity and
nutritional requirements for low cost production of selected cyanobacterial
strains has been done. Preliminary screening was done based on their
biochemical components such as total sugars, proteins and lipids, maintaining
optimal growth conditions. Further characterisation of the selected species
was carried out by studying the growth kinetics, pigment composition and
productivity.
6.2 Materials and Methods
6.2.1 Optimisation of Cultur~ conditions
6.2.1.1 Salinity and pH
The effect of salinity and pH on growth of cyanobacteria was studied to
find out the optimum salinity and pH for maximum growth. Three filamentous
species identified as Phormidium tenue, Phormidium angustissimum,
Oscillatoria salina and one unicellular species, G/oeocapsa livida, were
chosen for the study. Experiments were carried out in Alien and Nelson
medium. Effect of salinity was examined at 0,10, 20, 30 and 40 ppt. and that
of pH was done at pH 6,7,8 and 9.
Olapter.6- Biochemical evaluation of selected strains of cyanobacterla
74

Ecological and biochemical studies on cyanobacterla of Codlin estuary and their application as source of antioxidants
6.2.1.2 Medium
The influence of various culture media such as Alien and Nelson
medium, BG11 medium, Sea Water Enrichment medium and Nitrogen free
medium on gto'H\'t\ ta\e 0' \'t\e a't}o\Je 'OUt ~~ec\e~ (}' C'fo.\\(}'t}o.c\~~\o. ~o.~
studied.
The compositions of these media are given below: -
6.2.1.2a Alien and Nelson
Composition of Alien and Nelson medium is given in section 2.2.2
6.2.1.2b BG11 (Stanier et al., 1971)
Table 6.1 Composition of BG 11 medium
Ingredients Quantity IL
Solution - A NaN03 1.5 9
Na2C03 20 mg
K2HP04 . 3H2O 40 mg
MgS04.7H2O 95 mg
CaCI2.2H2O 36 mg
Citric acid 6mg
Ferric ammonium citrate 6mg
EDTA 1 mg
Solution - B Boric.acid 2.86 9
MnC12.4 H2O 1.81 9
ZnS04. 7H20 222 mg
Sodium molybdate 390 mg
Copper sulphate 79 mg
Calcium nitrate 49.4 mg
Solution A and B were prepared separately and autoclaved. 1 ml of solution B
was added to 1000 ml of solution 'A' prepared in seawater.
Olapter.6- Biochemical evaluation of selected strains of cyanobacteria 75

Ecological and biochemical studies on cyanobacterla of Cochin estuary and their application as source of antioxidants
6.2.1.2c Sea Water Enrichment Medium (SWEM) (Subramanian et al., 1999)
Table 6.2 Composition of Seawater enrichment medium
Ingredients Quantity
Solution -A NaN03 0.5 9
Na2HP04. 2H2O 100mg
Sea Water 100ml
Solution - B KN03 2.02g
K2HP04 0.35g
FeCI3 9.7mg
MnCI2 0.75mg
EDTA 100mg
Thiamine HCI 0.1mg
Sea water 75ml
Distilled water 25ml
Solution A and solution B were prepared separately and autoclaved. 2 ml
solution A and 1 ml solution B were added to 1000ml sterilised seawater.
6.2.1.2d Nitrogen free medium
The source of combined nitrogen (KN03) in the Alien and Nelson
medium was omitted and replaced by corresponding chlorides to prepare the
nitrogen free medium.
The observation on growth using chlorophyll-a as the biomass
component was made upto 30 days at time intervals of 3 days as per the
method of Strickland and Parsons (1972). Experiments were carried out in
triplicate.
10ml of the culture filtrate was filtered through GF/C filter paper under
moderate vacuum, the filter paper was then transferred into a clean stoppered
test tube and 10ml of 90% acetone was added. The test tube was refrigerated
Chapter.6- Biochemical evaluation of selected strains of cyanobacteria
76

Ecological and biochemical studies on cyanobacteria of eochin estuary and their application as source of antioxidants
for about 24 hrs, in order to facilitate the complete extraction of chlorophyll.
The chlorophyll-acetone solution was centrifuged for about 10 minutes at
5000 rpm and the absorbance of the clear solution was measured at 665, 645
and 630 nm wavelengths using U - 2001 spectrophotometer taking 90%
acetone solution as the blank. The absorbance of the sample was also
obtained at 750nm, which was substracted from the values at 665, 645 and
630 nm, thus minimizing the error in chlorophyll measure. Chlorophyll-a was
estimated in J.l.g/ml using the equation given below.
Ca = 11.85 E665 - 1.54 E645 - 0.08 E630 ----------------- Eqn -1
where Eis the absorbance of chlorophyll samples at the respective wavelength.
Chlorophyll -a (J.l.g/ml) = (Ca x v) I (V x 1)
where:
v = volume of acetone (ml)
V = volume of water sample filtered (L)
1 = path length of the cuvette (cm)
6.2.2 Biochemical composition, Growth kinetics, Pigment
composition and productivity
6iochemical characterization of various cyanobacteria species were
done under optimal conditions.
6.2.2.1 Biochemical composition
The biochemical composition (total sugars, proteins and lipids) of forty
pure cultures of cyanobacteria were determined. Out of these, 12 were
Oscil/atoria sp., 10 Phormidium sp., 5 Lyngbya sp., 4 G/oeocapsa sp., 2
Synechococcus sp., and one species each from the genera of Synechocystis,
G/oeothece, Chroococcus, Microcystis, Ch/orog/oea, To/ypothrix, and
Pseudanabaena.
Chapter.6- Biochemical evaluation of selected strains of cyanobacteria
77

Ecological and biochemical studies on cyanobacteria of Cochir. estuary and their application as source of antioxidants
Total sugar content was determined by Anthrone method (Roe, 1955)
after hydrolysing dried samples in 2.5 N HCI.
Protein was analysed by Lowry's method (Lowry et al., 1951).
Extraction was done using 1 N NaOH.
Lipid content was extracted in chloroform methanol mixture and assay
was done using sulphophosphovanillin method (Frings and Dunn, 1970).
6.2.2.2 Growth kinetics
In order to study growth characteristics, twenty strains of cyanobacteria
were selected based on their biochemical composition and yield, of which ten
were Oscillatoria sp., five Phormidium sp., three Lyngbya sp. and two
G/oeocapsa sp. Growth as chlorophyll content was measured as per the
methodology given in the section 6.2.1 and was expressed in terms of Ilg
chlorophyll/ml.
6.2.2.3 Pigment composition
The composition of pigments such as chlorophyll-a, carotenoids, and
phycobiliproteins of 20 strains of cyanobacteria were analysed. Concentration
of phycobiliproteins such as C-phycocyanin, allophycocyanin and C
phycoerythrin were determined separately. Cells were harvested in the
exponential and early stationary growth phases and these parameters were
analysed.
6.2.2.3a Chlorophyll-a
Chlorophyll-a was measured as per the methodology given in the
section 6.2.1 and was expressed as mg chlorophyll/100mg wet weight of the
sample.
6.2.2.3b Carotenoids
Carotenoids present in the samples were extracted using 90%
acetone. After complete extraction, samples were centrifuged for about 10
minutes at 5000 rpm, and the absorbance of the clear solution was measured
Cilapter.6- Biochemical evaluation of selected strains of cyanobacteria
78

Ecological and biochemical studies on cyanobacteria of eochin estuary and their application as source of antioxidants
at 480 and 510 nm wavelengths using U - 2001 spectrophotometer, taking
90% acetone solution as the blank (Strickland and Parsons, 1972). The
absorbance of the sample was also obtained at 750nm, which was
substracted from the values at 480 and 510 nm nm, thus minimizing the error.
The amount of carotenoids was determined using the equation:
Total carotenoids (Ilg/ml) = 7.6 x (E480 - 1.49 E510)
6.2.2.3c Phycobiliproteins
Known volumes of cyanobacterial suspensions were centrifuged and
the pellets were suspended in 3 ml of phosphate buffer. The contents were
repeatedly frozen and thawed and centrifuged in order to facilitate complete
extraction. The supernatants were pooled and the absorbance was measured
at 565, 620 and 650 nm against phosphate buffer blank (Seigelman and
Kycia, 1978). Calculations were done using the following equations,
C-Phycocyanin (PC) mglml = A620 - (0.7 x A 650) 17.38
Allophycocyanon (APC) = A650 - (0.208 x A 620) 15.09
C-Phycoerythrin (PE) = A562 - 2.41 (PC) - 0.849 (A PC) 19.62
6.2.2.4 Productivity
Productivity of cyanobacterial cultures was estimated by light and dark
bottle oxygen technique (Gaarder and Gran, 1927). The difference in oxygen
concentration between the light (LB) and dark bottles (DB) was converted into
its carbon equivalents using a PO (photosynthetic quotient) of 1.25 for
obtaining gross production values.
Calculation
Gross production (mg C/l/hr) = Oxygen content of LB - DB I PO x T
where 'T' is the time of incubation
Chapter.6- Biochemical evaluation of selected strains of cyanobacterla
79

Ecological and biochemical studies on cyanobacteria of Cochin estuary and their application as source of antioxidants
6.2.3 Data analysis
One-way ANOVA was done by Duncan's multiple comparison of the
means using SPSS 10.0 for window in order to analyze significant difference,
if any, between the various culture conditions chosen.
6.3 Results
6.3.1 Optimisation of Culture conditions
6.3.1.1 Salinity tolerance
Salinity tolerance of different species of cyanobacteria viz. Phormidium
fenue, P. angustissimum, Oscillatoria salina, Gloeocapsa livida was studied
by growing the cultures in Alien and Nelson medium having different salinity
levels (0-40ppt) and measuring growth as chlorophyll-a content upto 30 days
at three day time interval.
Phormidium tenue
Chlorophyll content of P.tenue grown at zero, 20 and 30 ppt salinity
began to decline markedly after 24th day of the experiment [Fig. 6.1 and Table
6.3 (Appendix 3)]. At 10 ppt, decline of growth was observed beyond 2ih
day. However, at 40 ppt, cells kept growing until the end of the experiment.
When the species was grown at salinity 0 ppt the lag phase was very short or
absent whereas, at 10, 30 and 40 ppt lag phase extended for 12 days and for
20 ppt it was upto 6 days. The specific growth rate or 'k' value obtained at
various time intervals obviously showed the same trend. Negative values for
'k' indicated that final values were less than the initial values and therefore, a
clear decline in cell biomass. The highest specific growth rate was obtained at
o ppt, on the 18th day of the experiment. The maximum chlorophyll content
obtained was 2.66 J.lg/ml at 0 ppt. However, growth was found to occur at all
levels of salinity indicating that the species can tolerate wide fluctuations in
salinity. ANOVA result substantiated the same finding that there was no
significant difference (p< 0.05) between growth at various salinities.
Chapter.6- Biochemical evaluation of selected strains of cyanobacteria
80

-3.0
2.5
~ 2.0
~ 1.5 cp :c 1.0 o
0.5
Fig. 6.1. Salinity tolerance of Phormidium tenue
0.0 +------r---,----,-----.--------,.----,--,-------r---,----,------,
o 3 6 9 12 15 18 21 24 27 30 Age in days
-+- 0 ppt -10 ppt ---.- 20 ppt -+-30 ppt -:e:-40 ppt
Phormidium angustissimum
Phorrnidium angusfissimum exhibited growth at all salinities initially
[Fig. 6.2 and Table 6.4 (Appendix 3»). The onset of death phase was on 21 st
day at zero ppt ,24th day for both 20 and 30ppt . At salinity 10 and 40ppt, cells
kept growing until the end of the experiment.
Fig. 6.2. Salinity tolerance of Phormidium angustissimum
2.5
i 2.0
~ 1.5
.! 1.0
ts 0.5
0.0 +------r----,----,-----,----,--,----,.----,--,--.--------.
o 3 6 9 12 15 18 21 24 27 30
Age In days
-+-0 ppt - 10 ppt ---.- 20 ppt -+-30 ppt _ 40 ppt
Log phase started from 3,12,0, 9 and 9th day at 0,10, 20, 30, 40 ppt
salinity respectively. Very short lag phase upto 3 days could be observed at
zero ppt and it was absent at 20ppt. The highest growth rate was obtained at
0Iapter.6- BIOchemical evaluation cA selected strains of cyanobacteria
81

Ecological and biochemical studies on cyanobacteria cl Cochin estuary and their appllcatkln as source of antioxidants
20ppt (0.066 day-1). The maximum chlorophyll content obtained was 2.25
~g/ml at 20 ppt. It was found that at 20 ppt, yield as well as growth rate
increased to double fold when compared to other salinities. One-way AN OVA
showed that 20ppt gave significantly higher (psO.05) growth than all other
salinities except zero ppt. Very low growth was observed in 30 and 40ppt.
Oscil/ataria salina
From Fig. 6.3 and Table 6.5 (Appendix 3) it is clear that for O.salina at
zero ppt, the lag phase was upto 3 days followed by log phase upto 24th day
and proceeded to death phase. The maximum chlorophyll concentration
obtained at the end of the log phase was 1.84Jig/ml. At 10 and 20 ppt lag
phase was upto 6th day whereas, at 30 and 40 ppt there was no growth. At
10ppt, the species exhibited a log phase from 6th day to 24th day and reached
the maximum chlorophyll concentration of 2.41 Jig/ml whereas, the log phase
was upto 27th day at 20ppt.
3.0 __ 2.5
12.0 ~ 1.5
Fig. 6.3. Salinity tolerance of Oscil/atoria sa/ina
~1.0t~g:;~ o 0.5 -
0.0 o 3 6 9 12 15 18 21 24 27 30
Age In days
~ 0 ppt --'-10 ppt ~ 20 ppt -+-30 ppt __ 40 ppt
The maximum specific growth rates obtained at 0, 10 and 20 ppt were
0.052, 0.061 and 0.038day-1 respectively. The species could not survive at 30
and 40ppt. Maximum yield was obtained at 10 ppt. Duncan analysis revealed
that the species could show significant (p< 0.05) growth at the salinities 0 to
20 ppt.
Olapter.6- Biochemical evaluation of selected strains of cyanobacteria
82
Ecological and biochemical studies on o/anobacteria r:J Cochin estuary and their aPfl!ication as source r:J antioxidants
Gloeocapsa livida
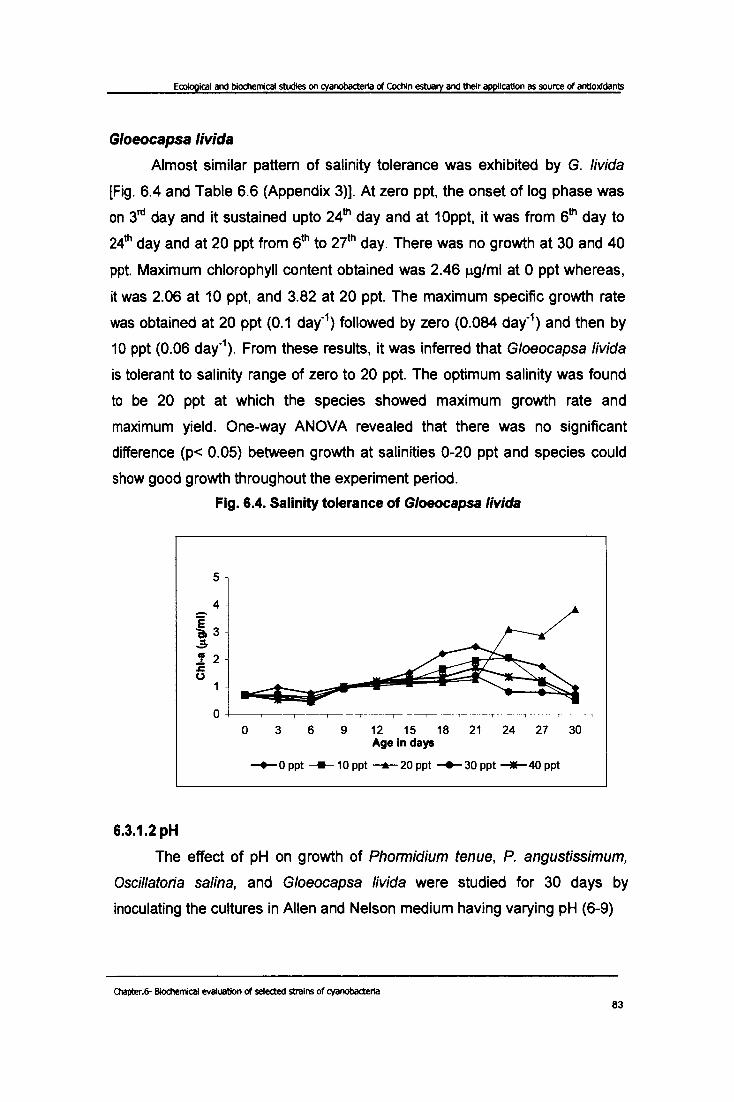
Almost similar pattern of salinity tolerance was exhibited by G. livida
[Fig. 6.4 and Table 6.6 (Appendix 3)]. At zero ppt, the onset of log phase was
on 3rd day and it sustained upto 24th day and at 10ppt, it was from 6th day to
24th day and at 20 ppt from 6th to 27th day. There was no growth at 30 and 40
ppt. Maximum chlorophyll content obtained was 2.46 J.1g/ml at 0 ppt whereas,
it was 2.06 at 10 ppt, and 3.82 at 20 ppt. The maximum specific growth rate
was obtained at 20 ppt (0.1 day-1) followed by zero (0.084 day-1) and then by
10 ppt (0.06 day-\ From these results, it was inferred that G/oeocapsa livida
is tolerant to salinity range of zero to 20 ppt. The optimum salinity was found
to be 20 ppt at which the species showed maximum growth rate and
maximum yield. One-way ANOVA revealed that there was no significant
difference (p< 0.05) between growth at salinities 0-20 ppt and species could
show good growth throughout the experiment period.
6.3.1.2 pH
Fig. 6.4. Salinity tolerance of Gloeocapsa livid a
o 3 6 9 12 15 18 21 24 27 30 Age in days
-+-0 ppt ___ 10 ppt ---....- 20 ppt -+-30 ppt __ 40 ppt
The effect of pH on growth of Phormidium fenue, P. angusfissimum,
Oscillatoria salina, and G/oeocapsa livida were studied for 30 days by
inoculating the cultures in Alien and Nelson medium having varying pH (6-9)
OIapter.6- BIochemical evaluation r:J selected strains of cyanobacteria
83

Ecological and biochemical studies on tyanobacteria d Cochin estuary and their application as source of antioxidants
Phormidium tenue
Fig. 6.5 and Table 6.7 (Appendix 3) explain pH tolerance of
Phormidium tenue. It was clear that at pH 6 the lag phase was upto 6 days
followed by log phase upto 24th day and then proceeded to death phase. The
maximum chlorophyll concentration obtained was 3.25J.1g/ml on 24th day. Lag
phase at pH 7, 8 and 9 were also upto 6 days but log phase extended till the
end of the experiment. The highest concentration of chlorophyll at these pH
were almost same, i.e., 4.88, 4.86 and 5.01 J.1g/ml respectively. Maximum
specific growth rate obtained at pH 6 and 7 was 0.081 day-1 while at pH 8 and
9, it was 0.119 and 0.124 day-1 respectively. ANOVA result showed that the
growth at various pH did not show any significant difference (p< 0.05).
o
Fig 6.5 pH tolerance of Phormidium tenue
3 6
-+-pH6
9 12 15 18 21 24 27 30
Age in days
---pH7 ~pH8 -+-pH9
Phormidium angustissimum
Phormidium angustissimum exhibited growth at all pH [Fig. 6.6 and
Table 6.8 (Appendix 3)]. At pH 6, the onset of death phase was on 24th day
whereas, at pH 7, 8 and 9, cells kept growing until the end of the experiment.
There was no lag phase observed at pH 6 whereas, at all other pH lag phase
extended upto 6th day. The maximum chlorophyll content obtained was 2.46,
1.61, 2.46 and 1.76 J.1g/ml at pH 6,7, 8 and 9 respectively. The maximum
Chapter.6- Biochemical evaluation d selected strains of cyanobacteria
84

Ecological and biochemical studies on cyanobacteria rI Cochin estuary and their apPIitaUon as source of antioxidants
specific growth rate at pH 6,7,8, and 9 were 0.072, 0.032, 0.058 and
O.035day-1 respectively. Highest growth rate was obtained at pH 6. From this
experiment it was inferred that eventhough the species showed broad pH
tolerance, pH 6 was the optimum one. pH 8 was also giving the same growth,
but slower. No significant difference (p< 0.05) could be observed between the
growth at various pH conditions when Duncan analysis was done.
--E -1:1) :::I. ..
..J.
..c 0
Fig 6.6 pH tolerance of Phormidium angustissimum
3.0
2.5
2.0
1.5
1.0
0.5
0.0 o 3 6 9 12 15 18 21 24 27 30
Age In days
--+-pH6 ___ pH7 ---..-pH8 ""'-pH9
Oscil/atoria sa/ina
From Fig. 6.7 and Table 6.9 (Appendix 3)], it is clear that chlorophyll
content of Oscil/atoria salina grown at pH 6 began to decline markedly after
2ih day and that at pH 7, it declined after 24th day of the experiment. At pH 8
and 9, cells kept growing until the end of the experiment. The onset of log
phase was on the 6th day at pH 6 and 8 and for cultures grown at pH 7 and 9,
it was on the 3rd day. The maximum specific growth rate of the species at pH
6 was 0.051 per day, at pH 7, it was 0.079, at pH 8, 0.03, and at pH 9, the
value was 0.044 per day. Therefore, the highest specific growth rate was
obtained at pH 7. The maximum chlorophyll contents obtained were 2.25,
2.75, 1.77 and 2.2 J.lg/ml at pH 6, 7, 8 and 9 respectively. From these results,
it was concluded that the optimum pH for O.salina was pH 7. However, the
Chapter.6- Biochemical evaluation of selected strains of cyanobacteria
85

Emlogical and biochemical studies on cyanobacteria of Cochin estuary and their apPlication as source of antioxidants
species showed broad pH tolerance. ANOVA revealed the same fact that no
significant difference (p< 0.05) in growth could be seen at various pH levels.
3.0
2.5
-- 2.0 E Q 1.5 ~ la
1.0 • :c 0 0.5
0.0
Gloeocapsa livida
0
Fig 6.7 pH tolerance of Oscillatoria salina
3 6
-+-pH6
9 12 15 18 21 24 27 30 Age In days
---- pH7 -.- pH8 -+-pH9
Fig. 6.8 and Table 6.10 (Appendix 3)] reveal that at pH 6, 7 and 8
G/oeocapsa livida cells were growing constantly until the end of the
experiment. At pH 9, a slight decline in growth was observed on the last day.
Lag phase was absent at pH 6, whereas, it was upto 3 days at pH 7 as well as
pH 8 and upto 6 days at pH 9. The maximum chlorophyll content obtained
was 2.61 j.Lg/ml at pH 6, whereas, it was 1.8, 1.22 and 1.15 at pH 7, 8 and 9
respectively. Maximum specific growth rate was 0.071 day·1 at pH 6, 0.044
day·1 at pH 7, 0.025 day·1 at pH 8 and 0.026 day·1 at pH 9.Therefore, for
G/oeocapsa livida, the optimum pH was found to be 6 at which the species
showed maximum growth rate. Maximum yield was also obtained at the same
pH. However, single factor ANOVA revealed that there was no Significant
difference (psO.05) in growth between various pH levels.
Olapter.6- Biochemical evaluation of selected strains of cyanobacteria
86

3.0
2.5
i 2.0 c;, ..=. 1.5 ca :E 1.0
Fig 6.8 pH tolerance of Gloeocapsa livida
u 0.51~:Si;3E~::!:::~_--r_-'---_"---------._---' 0.0
6.3.1.3 Medium
o 3 6 9 12 15 18 21 24 27 30 Age in days
-+- pH6 --- pH7 -.-pH8 - pH9
The ability of cyanobacteria to grow in different media, Alien' and
Nelson medium, BG11 medium, Sea Water Enrichment Medium (SWEM) and
Nitrogen-free medium were tested.
Phormidium tenue
Fig. 6.9 and Table 6.11 (Appendix 3) reveal that in Alien and Nelson
(AN) medium, Phonnidium tenue showed a log phase between 6th to 24th days
and in BG11, it was between 6 -27 days. The log phase extended upto the
end of the experiment from 9th day in SWEM whereas, in Nitrogen-free
medium, the species showed no growth. In Alien and Nelson medium,
maximum specific growth rate (0.074 day-1) and highest chlorophyll content
(2.96 J.1g/ml) were obtained on 24th day. In BG11, these factors were 0.018
day-1 and 1.548 J.1g/ml and in SWEM 0.015 day-1 and 1.418 J.1g/ml respectively.
But in NF medium, k value was negative indicating that the species could not
grow in nitrogen free medium, as it was unable to fix nitrogen. F,rom these
results, it was found that AN medium was the best medium for the growth of
this species. One-way ANOVA also revealed the same.
Olapter.6- Biochemical evaluation of selected strains of cvanobacteria
87

Ecological and biochemical studies on cyanobacteria cl Cochin estuary and their application as source cl antiOxidants
Fig 6.9 Growth characteristics of Phormidium tenue in different media
4
- 3 E Q ~ 2 .. .J. s: 0
0
0 3 6
~AN
Phonnidium angustissimum
9 12 15 18 21 24 27 30 Age in days
----BG11 -+-SWEM -+-NF
Growth characteristics of Phormidium angusfissimum in various media
are shown in Fig. 6.10 and Table 6.12 (Appendix 3). In AN medium, growth
curve was in such a way that lag phase was completely absent and log phase
started directly from zero day and extended upto 24th day which was followed
by a death phase. Kmax was 0.049day-1 and chlorophyll content reached the
peak value of 1.656 J.lg/ml. In BG11 medium, lag phase was found upto 6th
day followed by log phase upto the end of the experiment. Maximum specific
growth rate of 0.014 day-1 and chlorophyll content of 0.909 J.lg/ml were
obtained on the 30th day of the experiment. In SWEM, lag phase was upto the
3rl1 day followed by log phase upto 2ih day followed by the death phase. Kmax of 0.024 day-1 and chlorophyll content of 1.117 J.lg/ml were obtained in this
medium. In nitrogen-free medium, no growth was obtained. From these
results, it was inferred that AN medium was the optimum one for the growth of
P. angusfissimum and it was also found that the species was unable to fix
nitrogen as it could not grow in NF medium. Duncan analysis demonstrated
that AN medium showed significantly higher (pS 0.05) growth than BG 11. The
species could give comparatively good growth in SWEM also.
Chapter.&- Biochemical evaluation of selected strains of cyanobacter1a
88

Ecological and biochemical studies on cyanobacteria cl Cochin estuary and their appllcatlon as source of antioxidants
Fig 6.10 Growth characteristics of Phormidium angustissimum in different
media
2.5
2.0 -E 1.5
~~ a. ..:!r 1.0 1
I I ~~ J: 0.5 • • 0
0.0 0 3 6 9 12 15 18 21 24 27 30
Age in days
~AN __ BG11
Oscillatoria sa/ina
Fig. 6.11 and Table 6.13 (Appendix 3) reveal that in AN medium,
Oscillatoria salina showed exponential phase from 6th day to 2ih day and
then an immediate death phase whereas in BG 11 medium, cells were
growing constantly until the end of the experiment and in SWEM the species
attained maximum growth without much delay and the stationary phase was
prolonged afterwards. In this case also, in NF medium, no growth was
observed. The maximum chlorophyll content obtained was 1.473 Jlg/ml in AN
medium, whereas, it was 2.327 and 1.48 in BG11 and SWEM respectively.
Maximum specific growth rate obtained in these media were 0.028,0.054 and
0.035 day-1 respectively. Therefore, for Oscillatoria salina the best medium for
growth was found to be BG11 at which the species showed maximum growth
rate and yield. However, the species could show considerable growth in both
AN medium and SWEM and it was also found that the species did not have
the capacity to fix nitrogen as it could not grow in NF medium. One-way
ANOVA revealed that the organism showed significantly good (pS 0.05)
growth in SWEM and least growth in NF medium.
Olapter.6- Biochemical evaluation of selected strains of cyanobacteria
89

Ecological and biochemical studies on cyanobacteria of Cochln estuary and their apPlication as source of anttoxidants
Fig 6.11 Growth characteristics of Oscil/atoria sa/ina in different media
2.5
i 2.0
Q 1.5 ..=. i 1.0
0 0.5
0.0 o 3 6 9 12 15 18 21 24 27 30
Age In days
-+-AN ...-.e-BG11 ---'-SWEM ~NF
Gloeocapsa livid a Gloeocapsa livida also exhibited significant growth in AN medium [Fig.
6.12 and Table 6.14 (Appendix 3)]. The onset of log phase was on 6th day
and was extended upto the end of the experiment. Kmax was O.121day-1 and
chlorophyll content reached the peak value of 4.438 J-lg/ml. In BG11 medium,
SWEM, and NF medium k value was found always negative indicating that
there was no growth in these media. From this, it was concluded that AN
medium was the only suitable medium for the favourable growth of this
unicellular species. Single-factor ANOVA substantiated the same finding.
Fig 6.12 Growth characteristics of G/oeocapsa Iivida in different media
5
4
3
2
1
o~~~~~~~~~~~~L o 3 6 9 12 15 18 21 24 27 30
Age in days
-+-AN ...-.e-BG11 ---'-SWEM ~NF
Olapter.6- BIochemical evaluation of selected strail'5 of cyanobacteria
90

Ecological and biochemical studies on cyanobacteria of Cochin estuary and their application as source of antioxidants
6.3.2 Biochemical composition, Growth kinetics, Pigment composition and Productivity
In order to select the most promising strains, biochemical studies of the
isolated cyanobacterial species were carried out in the laboratory keeping
them in Alien and Nelson medium at the optimum salinity (20 ppt) and pH (7).
Cultures were grown at 28°C with an illumination of 2000 lux for 12 hours
duration and were harvested in the exponential learly stationary growth phase
(24th day of incubation).
6.3.2.1 Biochemical composition
The biochemical composition of forty strains of cyanobacteria has been
determined. The results are expressed as percentage of dry weight and are
given in Figs 6.13 to 6.15 and Table 6.15 .
6.3.2.1a Total sugars
Sugar content of various species was found to be in the range of 1.1 -
13% (Fig 6.13) and Oscillatoria pseudogeminata (C81) yielded the highest
amount of sugars (13.02%). O.accuta (C49), 0. jasorvensis (C23), O. willei
(C30), O. fremyi (C32), O.foreauii (C72), O.limnetica (C77), Phormidium
dimorphum (C9), P. corium (C13), Lyngbya semiplena (C34), Gloeocapsa
gelatinosa (C28), G. compacta (C52), G. quaternata (C94) , and Tolypothrix
tenuis (C113) were also composed of comparatively higher amount of sugars
(more than 8%).
6.3.2.1 b Proteins
Protein content was found to be in the range of 1.84 - 39% (Fig 6.14);
maximum was encountered in Phormidium dimorphum (C9 - 38.88%). Other
species with high protein content (more than 20%) were Oscillatoria salina
(C21), O.foreauii (C72), O. pseudogeminata (C81), O.laete-virens minimum
(Ca5), O.accuminata (C112), Phormidium abronema (C11), P. corium (C13),
Lyngbya martensiana (C1), L. semiplena (C34) and Gloeothece rupestris
(C19).
Olapter.6- Biochemical evaluation of selected strains of cyanobacteria
91

% Lipid % protein % Total sugar ~ ..... N N
oo~~~g ..... ..... o (J1 0 (J1 0 (J1 0 (J1 0 (J1
C7 C7 C7
C21 C21 C21
C23 C23 C23
C30 C30 C30
C32 C32 C32
C49 C49 C49
C55 C55 C55
C72 C72 C72
cn . :.;,-,:,,'!'-" cn cn C81 C81 C81
C85 C85 C85 '11 C
C112 C112 C112 G)
:... CB :!! C8 ." C8 w
ca C ... C9 G) C9 G)
C9 ! C11
:... :... ,C11 Cl! C11 ... 11
C13 r- "U C13 c
-S" C13 ca
i en 11 C29 a: C29 5' C29 iiJ
n S" a C61 0 C61 3" C61
i n .. 11 C73
0 C73 ID
a C73 :=I f en en If 5' C84 0 i C84 a C84 I -• 2-S" C108 .. S" C108 C108 n • iD • 11 '<
C110 n C110 C110 11
If I :=I
C1 C1 0 Go C1 er • 11
CM "0 CM Go CM n .. • i C15
n C15 i C15 :::I. i" 11 n -
C107 C107 iD C107 11
• 1: C109 C109 C109 n
C28 iD C2B C28 11
C35 C35 C35
C52 C52 C52
C94 C94 C94
C62 C62 C62
C67 C87 C87
C93 C93 C93
C19 C19 C19
et7 et7 C47
C99 C99 C99
C108 C108 C108
C113 C113 C113
C111 C111 C111

Table 6.15 - Biochemical composition of forty different species of cyanoabcteria
E d 01< f d . ht f xpresse as 00 Iry welQI o sample Strain
S.No No. Name of the species Total sugars Proteins Lipids 1 C 7 Oscillatoria cortiana 7.51 ± 0.22 10.26 ± 0.22 12.90 ± 0.79 2 C 21 Oscillatoria salina 9.50 ± 1.07 10.53 ± 0.89 19.25 ± 0.42 3 C 23 Oscillatoria jasorvensis 6.58 ± 0.31 30.02 ± 0.15 12.62 ± 0.67 4 C 30 Oscillatoria willei 8.04 ± 0.22 5.61 ± 0.05 15.51 ± 0.69 5 C 32 Oscillatoria fremyi 8.45 ± 0.37 9.58 ± 0.21 16.95 ± 2.07 6 C49 Oscillatoria ac uta 9.24 ± 0.80 6.82 ± 0.42 17.66 ± 2.07 7 C 55 Osci/latoria minnesotensis 2.90 ± 0.98 13.41 ± 0.23 8.16 ± 1.02 8 C72 Oscillatoria foreauii 12.58 ± 0.73 21.17 ± 0.34 4.25 ± 0.40 9 C77 Oscillatoria limnetica 8.52 ± 0.41 6.42 ±0.11 13.95 ±4.15 10 C 81 Oscillatoria pseudogeminata 13.02 ± 0.92 23.31 ± 0.38 11.10±1.17 11 C 85 Oscillatoria laete-virens minimus 6.02 ± 0.49 31.93 ± 0.45 15.69 ± 2.64 12 C112 Osci/latoria ac uminata 7.41 ± 0.30 21.82 ± 2.32 17.07 ± 0.14 13 C 8 Phormidium tenue 6.65 ± 0.31 6.92 ± 0.14 13.59 ± 3.93 14 C 9 Phormidium dimorphum 9.80 ± 0.68 38.88 ± 1.30 12.50 ± 1.19 15 C 11 Phormidium abronema 7.22 ± 0.34 23.51 ± 0.85 10.34 ± 2.76 16 C 13 Phormidium corium 10.01 ± 0.30 21.07±1.10 12.74 ±4.10 17 C 29 Phormidium mucicola 2.68 ± 0.03 5.82 ± 0.69 2.90 ± 0.21 18 C 61 Phormidium purpurescens 4.85 ± 0.12 13.60 ± 0.14 5.64 ± 1.21 19 C 73 Phormidium foveola rum 3.05 ± 0.10 6.47 ± 0.12 7.82 ± 1.19 20 C84 Phormidium angustissima 5.15 ± 0.15 5.36 ± 0.75 8.35 ± 0.86 21 C106 Phormidium molle 1.36±0.19 4.39 ± 0.76 2.25±0.13 22 C110 Phormidium bohneri 1.99 ± 0.06 8.71 ± 0.77 4.26 ± 0.16 23 C 1 Lyngbya martensiana 6.83 ± 0.30 29.68 ± 0.70 4.67 ± 1.39 24 C 34 Lyngbya semiplena 9.45 ± 0.80 30.71 ± 0.70 13.45 ± 1.34 25 C 15 Lyngbya aerugineo 4.32 ± 0.49 6.64 ± 1.05 13.71 ± 0.61 26 C107 Lyngbya cryptovaginata 3.06 ± 0.35 6.82 ± 1.02 6.49 ± 0.29 27 C109 Lyngbya putealis 2.96 ± 0.42 6.21 ± 0.90 3.85 ± 0.08 28 C 28 Gloeocapsa ge/atinosa 10.26 ± 0.32 8.89 ± 0.70 13.17±2.86 29 C 35 Gloeocapsa livida 7.08 ± 0.57 4.40 ± 0.85 12.90 ± 0.63 30 C 52 Gloeocapsa compacta 9.11 ± 0.98 18.65 ± 0.83 1.60 ± 1.40 31 C94 Gloeocapsa quaternata 8.40 ± 0.04 16.74 ± 0.93 4.37 ± 0.37 32 C62 Synechocystis aquatilis 5.36 ± 0.29 15.90 ± 0.74 0.59 ± 0.10 33 C67 Synechococcus cedrorum 3.61 ± 0.00 8.13±0.71 1.56 ± 0.52 34 C 93 Synechococcus elongatu,s 5.77 ± 1.10 11.86 ± 0.70 8.15±0.12 35 C 19 Gloeothece rupestris 4.82 ± 0.25 21.16 ± 1.32 3.10±0.94 36 C47 Chroococus tenax 4.76 ± 0.87 9.12 ±0.75 2.14 ± 0.17 37 C99 Microcystis orissica 4.55 ± 0.02 6.47 ± 3.50 9.68 ± 0.34 38 C108 Chlorogloea fritschii 3.05 ± 0.08 15.14 ± 0.80 6.54 ± 0.34 39 C113 Tolypothrix tenuis 8.90 ± 1.35 18.09 ± 0.95 3.84 ± 0.78 40 C111 Pseudanabaena schmidlei. Robusta 1.08 ± 0.09 1.84 ± 0.76 1.90 ± 0.50
Species selected for further study are given in bold letters

Ecological and biochemical studies on cyanobacteria of eochin estuary and their application as source of antioxidants
6.3.2.1 c Lipids
Lipid content varied between 0.6-19.25% (Fig 6.15) and the maximum
being in Oscillatoria accuta (C49), for which 19.25% of the total biomass was
lipid. Oscillatoria cortiana (C7), Oscillatoria salina (C21), Oscillatoria
jasorvensis (C23), Oscillatoria willei (C30), Oscillatoria fremyi (C32),
Oscillatoria Iimnetica (C77), Oscillatoria pseudogeminata (C81), Oscillatoria
laete-virens minimum (C85), Oscillatoria accuminata (C112), Phormidium
tenue (C8), Phormidium dimorphum (C9), Phormidium abronema (C 11),
Phormidium corium (C13), Lyngbya semiplena (C34), Lyngbya aerugineo
(C15), G/oeocapsa gelatinosa (C28), and Gloeocapsa livida (C35) were also
composed of comparatively higher amount (more than 11 %) of lipid.
Species with high composition of all the three components viz. total
sugars, proteins and lipids were Oscillatoria pseudogeminata (C81),
Phormidium dimorphum (C9), Phormidium corium (C13) and Lyngbya
semiplena (C34).
6.3.2.2 Growth profile
Twenty
carbohydrates,
species of cyanobacteria with high
proteins and lipids were selected
composition of
for the growth
characterization. The cultures were kept under optimum conditions. Growth
was measured in terms of chlorophyll-a content. Figs 6.16 (1-20) and Tables
6.16 (1-20) (Appendix 3) depict growth characteristics of various species of
cyanobacteria. From these results, the following inferences were made'
Out of ten Oscillatoria sp. studied, O. laete-virens minimum (C85),
O.jasorvensis (C23) and O. foreaui (C72) showed maximum specific growth
rate and the values were 0.301, 0.244 and 0.235day-1 respectively. The
cultures were continuously growing upto 24th day and reached their zenith and
then a diminution was observed.
Chapter.6· Biochemical evaluation of selected strains of cyanobactcria
92

Fig 6.16 Growth characteris!ics of selected cyanobacterial strains
2.0
E 1.5 -Cl :1.0 :c 0 0.5
I I
0.0 ~
- : I -§,3 ::I.
'l' 2 ::E 0
I 0:
E - 6 C) ::I.
'l' 4 ::E 0 2
0
8
.E 6 c:n :::1. 4 1 .c 2 o
o
0 3
0 3
0 3
o 3
(1) Oscillatoria cortiana
6 9 12 15 18 21 24 27 30
Days
(2) Oscillatoria salina
6 9 12 15 18 21 24 27 30
Days
(3) Oscillatoria jasorvensis
6 9 12 15 18 21 24 27 30
Days
(4) Oscillatoria fremyii
6 9 12 15 18 21 24 27 30
Days

6
:§ 4 01 :1. rp :E 2 0
0
4
E 3 -01 :1. 2 rp
:E 1 ,0
0
8
E 6 -01 :1. 4 rp
:E 2 0
o '
3.0) E 2.5 I C, 2.0 i ::1. 5' cp 1. 1
:c 1.0 ~
(5) Oscillatoria accuta
0 3 6 9 12 15 18 21 24 27 30
Days
(6) Oscillatoria willei
0 3 6 9 12 15 18 21 24 27 30
Days
(7) Oscillatoria foreauii
o 3 6 9 12 15 18 21 24 27 30
Days
(8) Oscillatoria limnetica
o 0.5 l 0.0 j- - I
o 3 6 9 12 15 18 21 24 27 30
Days

6
I :€ 4 .1:1) ! ::l
~2 o
o
4
-3
~2 cp
61
6
-§, 4 ::l cp :E 2 o
o
(9) Oscillatoria pseudogeminata
- I
o 3 6 9 12 15 18 21 24 27 30
Days
(10) Oscillatoria leaetevirens minimum
6 9 12 15 18 21 Days
(11) Phormidium tenue
·I-----~T -------1 ~-!
24 27 30
o 3 6 9 12 15 18 21 24 27 30 Days
(12) Phormidium dimorphum
o 3 6 9 12 15 18 21 24 27 30 Days

4 , i
~ 3 Cl :::1.2 cp
~ 1
o
10
El 8 -Cl 6 E cp 4 :E 2 0
0
2.0
El 1.5 C, ; 1.0
~ 0.5
(13) Phormidium abronema
,-o 3 6 9 12 15 18 21 24 27 30
Days
----T
0 3
(14) Phormidium corium
6 9 12 15 18 21 24 27 30 Days
(15) Phormidium angustissimum
0.0 - - T-
El 6 ,
-Cl 4 :::1.
cp :E 0 2
o ' 0
o 3 6 9 12 15 18 21 24 27 30 Days
(16) Lyngbya martensiana
3 6 9 12 15 18 21 24 27 30
Days

10
:§ 8 ~ 6
" 4 :c o 2
o
4 ,
~3 :12
" :c 1 o o
12
~ 9 :1 6
" :c 3 o o
6 I
~4 :1 .! 2 .c o
o
(17) Lyngbya aerugineo
o 3 6 9 12 15 18 21 24 27 30
Days
(18) Lyngbya semi plena
- -r ---,- -~T- -- -1
o 3 6 9 12 15 18 21 24 27 30 Days
(19) Gloeocapsa gelatinosa
o 3 6 9 12 15 18 21 24 27 30 Days
(20) Gloeocapsa livida
o 3 6 9 12 15 18 21 24 27 30 Days

Ecological and biochemical studies on cyanobacteria of Cochin estuary and their application as source of antioxidants
Phormidium corium (C13) was the outstanding species in the genus
Phormidium as it showed high specific growth rate, 0.213day-1. P. corium
showed continuous growth from the 6th day to the end of the experiment. Of
the species selected from Lyngbya, L. martensiana (C1) showed excellent
growth with a Kmax of 0.186 day-1. But the species reached the log phase
very late, i.e., beyond 9th day. In case of Gloeocapsa, G. gelatinosa (C28) was
grown with the maximum specific growth rate of 0.345 day-1. Gloeocapsa
gelatinosa and Oscillatoria laete-virens minimum (C85) showed maximum
growth rate among the tested cyanobacteria.
6.3.2.3 Pigment composition
Percentage composition of pigments such as chlorophyll-a, carotenoids
and phycobiliproteins of 20 species of selected cyanobacteria were analyzed.
Figs 6.17 to 6.21 and Table 6.18 (Appendix 3) show the pigment composition
in various species.
Chlorophyll. a
Out of 20 species studied, Oscillatoria jasorvensis (C23), O. laetevirens
minimum (C85), Phormidium corium (C13) and Gloeocapsa gelatinosa (C28)
were composed of more than 3% chlorophyll (Fig 6.17).
Carotenoids
Carotenoids were more in 0. fremyii (C32), Phormidium corium (C13),
Phormidium angustissima (C84), Lyngbya aerugineo (C15) and Gloeocapsa
gelatinosa (C28) in which more than 0.6% could be obtained (Fig 6.18).
Phycobiliproteins
Phycocyanin was maximum in Lyngbya semiplena (C34) and in
Phormidium corium (C13), it was 10 % of the weight, whereas, Gloeocapsa
gelatinosa (C28), 7 % and Oscillatoria foreaui (C72), 5.5% and others were
with less than 2.5% phycocyanin (Fig 6.19). Lyngbya semiplena (C34),
Phormidium corium (C13), Gloeocapsa gelatinosa (C28) Oscillatoria willei
Chapter.6- Biochemical evaluation of selected strains of cyanobacteria
93

Composition of pigments: chlorophyll-a, carotenoids and phycobiliproteins
Fig 6.17 Chlorophyll- a content of selected cyanobacterial specielS
5
4
3
2
10 CD Cl ~ CJ CJ
Strains
Fig 6.18 Carotenoid content of selected cyanobacterial species
1.2
0.8
"I. 0.6
0.4
11 I i 0.2
o ~ ~ ~ ~ ~ ~ ~ ~ ~ 0 CJ~ ~ ~ ~ CJ CJ CJ CJ CJ CJ CJ CJ CJ CJ
Strains

2
0,
O,g
0.8
0.7
0.6
~0,5 o 0,4
0.3
0.2
0.1
.... 0
Fig 6.19 C- Phycocyanin content of selected strains
.... C'l 0 ~ 0) N .... Q; ~ CD 0) C'l ~ 0 10 ~ CD 10
N N C'l tS .... .... 0 0 0 0 0 N C'l 0 0 0 0 0 0 0 0 0 0 0 0
Strains
Fig 6.20 Allophycocyanin content of selected strains
O+-~~~~~~.-~~r-~~~.-~~r-~-.~~~~'-~~~ 10 CD 0)
~ 0 0
strains
Fig 6.21 C- Phycoerythrin content of selected strains
0.5
0 .... N C'l 0 N 0) N .... Q; 10 CD 0) C'l ~ [) 10 ~ CD 10 0 N C'l C'l tS .... .... CD 0 0 [) [) 0 N C'l
0 0 0 0 0 0 0 0 0 0 0 0
strains

Ecological and biochemical studies on cyanobacteria of Cochin estuary and their application as source of antioxidants
(C30) and Oscillatoria foreaui (C72) were composed of more than 0.5%
allophycocyanin (Fig 6.20). Phycoerythrin was also present in high level in
these strains where more than 2% of the weight was phycoerythrin (Fig 6.21)
From the analysis, it was found that the prominent pigments present in
cyanobacteria are chlorophyll and phycobiliproteins whereas, carotenoids
were comparatively less. The proportion of phycobiliproteins to chlorophyll
was more than one in case of species like O.cortiana (C7), 0. willei (C30),
O.accuta (C49), o.foreaui (C72), P.tenue (C8), P.corium (C13),
P.angustissima (C84), L. semiplena (C34) and G. gelatinosa (C28) as
phycobiliproteins were more in these species.
6.3.2.4 Productivity
Production of organic substances by 20 different species of
cyanobacteria grown in Alien and Nelson medium with salinity 20 ppt and
temperature 28°C were studied. The cells were harvested on 24th day. Known
weight of the samples were taken for the analysis and productivity was
estimated in terms of J..lg C ! U hr! gram wet weight of sample. The results are
presented in Fig 6.22 and Table 6.19 (Appendix 3). Gross production was
high in Lyngbya aerugineo (C 15) and Oscillatoria jasorvensis (C23).
Fig 6.22 Productivity of selected species of cyanobacteria
CD is. E la III CD ~ s:. :J o CD ::I.
2 -
1.5
T"" It) GO CD 13 13 0 0
Strains
Chapter.6- Biochemical evaluation of selected strains of cyanobacteria
94

Ecological and biochemical studies on cyanobacteria of eochin estuary and their application as source of antioxidants
6. 4 Discussion
6.4.1 Optimisation of culture conditions
All the four species of cyanobacteria studied in the present
investigation showed almost identical requirements of salinity and pH. Salinity
upto 20 ppt was found to be optimum for all species. Growth was found to
occur at all levels of salinity indicating that the species can tolerate wide
fluctuations of salinity. This is in agreement with earlier studies reported on
cyanobacteria (Kaushik and Sharma, 1997, Subramanian and Thajuddin,
1995 and Newby, 2002). However, higher salinity was found to be unsuitable
for survival as it affects the protein content. Kaushik and Sharma (1997)
studied the effect of salinity stress on the halotolerant forms such as Nostoc
Iinckia, Westiellopsis proJifica and Tolypothrix ceylonica and found that there
was a 3-5% reduction in total protein content when these forms were grown in
100mM NaCI. It was found that the growth of cyanobacteria in the presence of
NaCI depends on the availability of nutrients and the rate and mode of carbon
fixation (Atre, 1998).
Cyanobacteria showed a wide range of adaptability and flexibility in
their response to pH. The pH of the medium plays an important role in
culturing as it determines the solubility of CO2 and minerals in the medium,
which in turn, directly or indirectly influence the metabolism of the algae
(Markl, 1977). Cyanobacteria v.ary, not only in their preference for different pH
but also in their qualitative response which is dependent upon the composition
and buffering capacity of the medium, amount of C02 dissolved, temperature
and metabolic activity of the cell. Venkataraman (1972), Subramanian and
Shanmugasundaram (1987) and Radha Prasanna et al. (1998) studied the pH
tolerance of cyanobacteria. The organisms have been reported to grow well in
a range of pH 7.5 - 10 (Gerolff et al., 1950; Kratz and Myers, 1955; Okuda
and Yamaguchi, 1956; Prasad et al., 1978; Roger and Reynaud, 1979).
However, there are reports of cyanobacteria growing at pH as low as 3.5
Chapter.5- Biochemical evaluation of selected strains of cyanobacteria
95

Ecological and biochemical studies on cyanobacteria of Cochln estuary and their application as source of antioxidants
(Aiyer, 1965). In the present study, the strains exhibited broad tolerance to
pH.
Growth kinetics of four cyanobacterial strains in various media proved
that Alien and Nelson medium was significantly superior to other media in
terms of both chlorophyll and growth and was very simple to prepare. All the
media showed good growth except nitrogen-free medium in which no growth
was observed. Unicellular species Gloeocapsa livida could grow well only in
Alien and Nelson medium.
6.4.2 Biochemical composition, Growth kinetics, Pigment composition and Productivity
Cyanobacteria constitute a large proportion of the world's organic
matter. They offer the most efficient means of fixing solar energy in the form
of biomass. The cyanobacterium Spirulina has already been commercially
exploited because of its merits viz. maximum yield and utility of cellular
constituents (Borowitzka and Borowitzka, 1988). Therefore, it would be
appropriate if the growth characteristics and biochemical composition of the
presently investigated species could be compared with those of Spirulina.
Spirulina strains from CFTRI, India were found to have protein content within
the range of 40 - 55 % and total lipid content between 2 - 7 % (Tasneem
Fatma et al., 1999). Phycocyanin was reported in them between 10 and 19 %
of the weight. In the present study, out of forty strains, Phormidium
dimorphum (C9) contained total proteins of 39% of the dry weight, which was
comparable to Spirulina, the reference species. Eighteen species were
reported with more than 11 % lipid content, which was very much greater than
that of Spirulina. In the present study, phycocyanin was estimated as 10% of
the weight in Lyngbya semiplena and P. corium (C13). Highest amount of
carbohydrate (13.02%) was present in Oscil/atoria pseudogeminata (C81)
whereas, carbohydrate content of dried Spirulina (CFTRI) could be improved
only upto 10% as per Venkataraman, 1989. Vaidya and Mehta, 1989 reported
that the dried matter of blue green algae like Anabaena and Nostoc contained
Chapter.6- Biochemical evaluation of selected strains of cyanobacteria
96

Ecological and biochemical studies on cyanobacteria of Cochin estuary and their application as source of antioxidants
total carbohydrates varying from 14.6% to 20.2%. When nitrogen fixing
Cyanobacteria were grown under diazotrophic conditions, protein,
carbohydrate, and lipid comprised 37-52%, 16-38% and 8-13% of the dry
weight respectively (Vargas et al., 1998). Kebede and Ahlgren (1996) found
maximum chlorophyll content of 2.4% of dry weight in S.platensis and also
reported that the ratio of carotenoids to chlorophyll-a was within the range of
0.27 to 0.64 in them. In the present investigation, of the twenty strains studied,
four strains contained more than 3% of chlorophyll. Seven species were
reported having the ratio of phycobiliprotein to chlorophyll greater than one. In
Phormidium tenue, the ratio of carotenoids to chlorophyll was greater than
one.
Since the culture conditions are known to change the biochemical
composition of the algae (Ciferri, 1983), the constituents can be improved
upon further by manipulating culture conditions. The overall results showed
that, of the strains undertaken for the detailed biochemical evaluation,
Oscillatoria pseudogeminata (C81), Phormidium dimorphum (C9),
Phormidium corium (C13), G/oeocapsa gelatinosa (C28) Oscillatoria foreauii
(C72) and Lyngbya semiplena (C34) are suitable for mass cultivation as a
source of foodl feed as they showed not only good growth and productivity but
also high levels of valuable biochemical constituents and pigments, very much
similar to that of Spirulina.
The techniques of genetic manipulation are likely to be applied to
cyanobacterial biotechnology in the near future. Genetic manipulation may
lead to increased production of valuable primary and secondary metabolites,
faster growth rates, tolerance of extreme growth conditions and so on (Lewin,
1983). Considerable variation in growth and cellular constituents justify the
importance of.strain selection over the complex and time-consuming genetic
engineering process involved in strain improvement. Cyanobacteria represent
an ecologically sen~ible form of technology, and it is hoped that, with enduring
research and development, their enormous potential would be realized by all.
Chapter.6- Biochemical evaluation of selected strains of cyanobacteria
97