bkd seattle final
DESCRIPTION
BKD Seattle FinalTRANSCRIPT
1
Behind the Kitchen Door: The Highs and Lows of Seattle’s Booming
Restaurant Economy
EXECUTIVE SUMMARY #
I. INTRODUCTION AND METHODOLOGY # II. OVERVIEW OF THE SEATTLE RESTAURANT INDUSTRY #
III. WORKERS’ PERSPECTIVES a. EARNINGS AND BENEFITS #
i. EARNINGS ii. TIPPED WORKERS #
iii. HOUSING # iv. BENEFITS # v. SICK LEAVE #
b. WORKING CONDITIONS i. SCHEDULING
ii. WAGE THEFT iii. HEALTH AND SAFETY # iv. UNFAIR APPLICATION OF DISCIPLINE
c. MOBILITY AND DISCRIMINATION WITHIN THE INDUSTRY i. OPPORTUNITIES FOR ADVANCEMENT #
ii. OCCUPATIONAL SEGREGATION # iii. DISCRIMINATION IN HIRING, PROMOTION, AND TRAINING
IV. CONCLUSION AND POLICY RECOMMENDATIONS # APPENDIX # ACKNOWLEDGMENTS # NOTES #
2
EXECUTIVE SUMMARY
Behind the Kitchen Door: The Highs and Lows of Seattle’s Booming Restaurant Economy is one of the
most comprehensive research analyses of the restaurant industry in the Seattle area. The report draws on
524 worker surveys and 15 structured interviews with restaurant workers in King County, along with
other industry and government data. Our study was inspired by the need for an analysis of the impact of
trail-blazing policies enacted by the City of Seattle to improve earnings and working conditions for low-
wage workers, as well as the need to survey the range of other workplace issues critical to the lives of
thousands of restaurant workers.
Through examining industry and government data alongside worker surveys and interviews our study
demonstrates that while the industry holds great prospects as a result of positive steps taken by legislators
and high-road employers, many restaurant jobs in the Seattle area remain low-road jobs characterized by
few benefits, low wages, and poor workplace conditions. Our survey instrument captured a range of
problems with restaurant working conditions related to the availability of benefits, hiring and promotion
practices, workplace discrimination, and job-specific training opportunities.
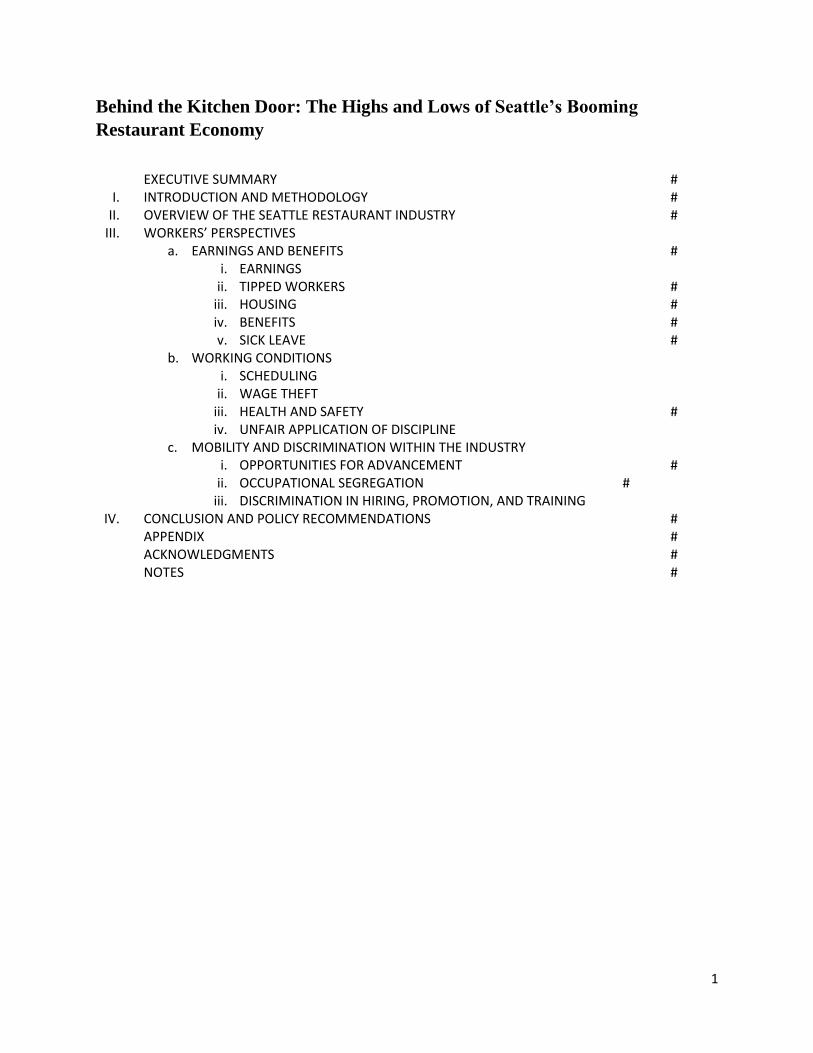
A VIBRANT AND GROWING INDUSTRY
Figure 1. In the last decade, restaurants have grown in importance as a percentage of the Seattle
region’s economy. Source: Bureau of Labor Statistics, Quarterly Census of Employment and
Wages, 2004-2014.
Seattle is home to a resilient and growing restaurant industry. The industry includes more than 86,000
workers in over 5,400 establishments.i Over the last decade, the industry has grown to over 8% of the
local economy (see Figure 1),ii contributing to the region’s reputation as a tourism, hospitality, and
entertainment destination, and generating over $4.7 billion in revenue and $443 million in sales tax for the
state and local economy.iii However, the benefits of this growth have not been equally shared.
A GROWING PROMISE
Seattle has received much attention for being among the first cities to adopt a $15 minimum wage, a paid
sick leave benefit, and ban the box legislation, and has recently adopted wage theft legislation. These
steps have made Seattle one of the more attractive cities for workers, including restaurant workers, with
7.20%
7.30%
7.40%
7.50%
7.60%
7.70%
7.80%
7.90%
8.00%
8.10%
2005 2006 2007 2008 2009 2010 2011 2012 2013 2014
Food Services and Drinking Places Jobs in Seattle as a Percent of Total Private Sector
Jobs
3
some of the highest base wages and basic benefits of any city in the country. However, some of these
increases have come with carve-outs for tipped workers, such as the minimum wage increase, or, as we
have found, enforcement has been largely lacking, effectively diminishing the reach of these gains.
Seattle holds much promise for restaurant workers, but in many instances that promise has been denied.
Our key findings include:
HIGH ROAD
In the wake of Seattle’s historic $15 minimum wage victory, full-service restaurant counts in the
city are skyrocketing – up 23% since March 2014.iv We interviewed several high road employers
who model successful examples of growth in the new higher-wage market.
LOW WAGES AND MEAGER BENEFITS
A significant majority of restaurant workers do not receive workplace benefits such as employer-
provided health coverage (87.7%). 28.4% report not having any form of health insurance
coverage. 11.4% report having gone to the emergency room without being able to pay in the past
year.
Workers paid lower wages are less likely to have health insurance than higher paid workers.
Despite promising steps to raise wages for low-wage restaurant workers 42.7% reported earning
poverty wages (below the wage required for a full-time, full-year worker to support a family of
three as defined by the Department of Labor’s Lower Living Standard Income Level. (See Table
1).
WAGE LAW VIOLATIONS
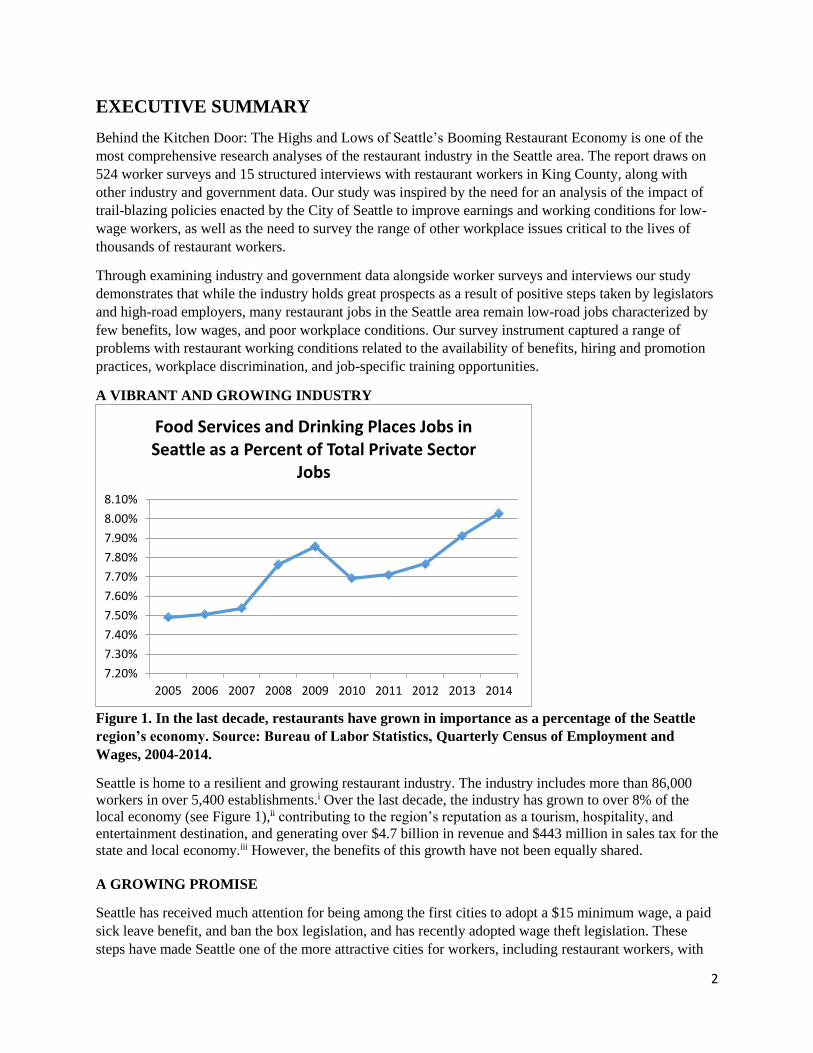
Despite laws that require paid sick leave, only 37.4% of restaurant workers in Seattle are aware of
the law and 73.5% report that they don’t have access to paid sick leave (see Figure 2).
20.5% of restaurant workers in the Seattle area report having worked off the clock without pay in
the past 12 months.
38.8% report that they are not paid 1.5 times the normal wage when they work over 40 hours in
violation of federal laws.
6% of tipped restaurant workers report that management takes a share of their tips.
SCHEDULING
52.5% of tipped restaurant workers experience daily changes in their schedule, and an additional
23.6% of tipped workers experience changes in their schedule every other week. Tipped workers
are effectively expected to be on-call by their employers.
PROMOTIONS AND TRAINING
38.4% of restaurant workers reported that they do not receive regular raises, 43.3% did not move
up in position from their last restaurant job to their current one, and 62.8% do not receive ongoing
job training.
HEALTH AND SAFETY HAZARDS
88.25% of workers we spoke with have worked when their restaurant was understaffed.
20.3% reported have done something that put their own safety at risk.
4
24.1% have done something due to time pressure that might have harmed the health and safety of
customers.
13.5% of restaurant workers report that their workplace has fire hazards. 40% of Back-of-the-
House workers surveyed have been burned while on the job, and 45.4% have been cut on the job.
OCCUPATIONAL SEGREGATION
56.7% of Asian workers, 59.8% of Black workers, and 77.4% of Latino workers worked in the
Back of the House, compared to 47.8% of white workers.
38% of Front-of-the-House positions are occupied by workers of color, compared to 57.3% of
Back-of-the-House positions.
60.7% of Black workers, 54.3% of Latino workers, and 52.5% of Asian workers are found in
Quick Serve establishments, compared to 40.6% of white workers.
Women make up 22.6% of fine dining positions, compared to 57.2% of casual full-service
restaurant occupations.
Figure 2. Access to Paid Sick Days and the Cycle of Contagion. Seattle is one of the few cities in the
country where all workers are ensured a paid sick leave benefit by law, meaning that if they or a close
family member falls ill they can take the day off without fear of retribution or losing a day’s wages. In
reality the majority of workers are unaware of this benefit, and even fewer are allowed to access it.
Table 1. Wages in Seattle’s Restaurants: Restaurant worker wages are above the industry average in part
due to the progressive wage legislation in the region and the city. However, great wage disparities still
exist for workers based on race and gender. In addition, recent wage increases have not been fully

5
implemented for certain categories of tipped workers, in effect reinstituting a tipped credit in the Seattle
restaurant economy, and workers of color, in general, appear to be left behind.
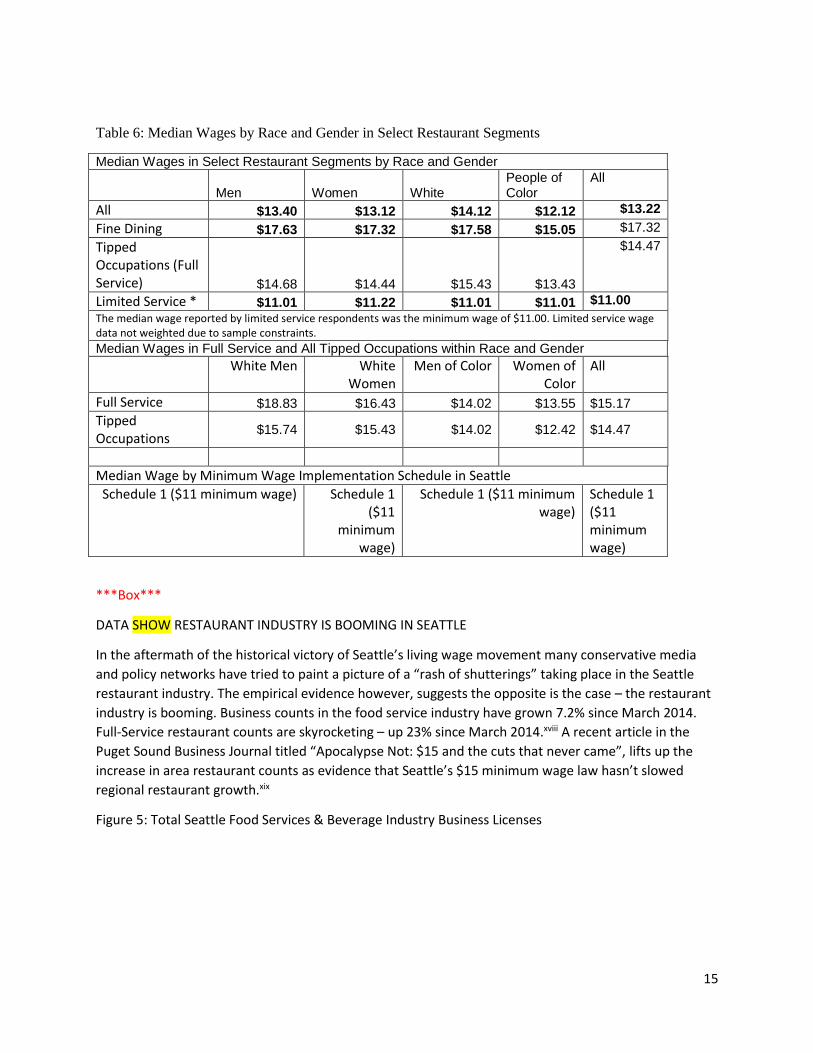
Table 1: Median Wages in Select Restaurant Segments by Race and Gender
Men Women White
People of Color
All
All $13.40 $13.12 $14.12 $12.12 $13.22
Fine Dining $17.63 $17.32 $17.58 $15.05 $17.32
Tipped Occupations (Full Service) $14.68 $14.44 $15.43 $13.43
$14.47
Limited Service* $11.01 $11.22 $11.01 $11.01 $11.00 The median wage reported by limited service respondents was the minimum wage of $11.00. Limited service wage data not weighted due to sample constraints.
Median Wage by Minimum Wage Implementation Schedule in Seattle
Schedule 1 ($11 minimum wage) $15.33
Schedule 2 ($10 subminimum wage)
$14.02
CHAPTER 1: INTRODUCTION AND METHODOLOGY
INTRODUCTION
Seattle has a well-earned reputation as a national leader in implementing progressive policies that
improve working conditions for low-wage workers. Through enacting laws that require employers to offer
paid leave, setting limits on the way employers can utilize conviction and arrest records in hiring, and
raising the minimum wage towards a living wage, Seattle has made tremendous steps towards being a
model of high-road employment. With a package of labor standards far in advance of many other cities,
the Seattle restaurant industry continues to grow rapidly. However, while some Seattle restaurant workers
have access to benefits and livable wages, many continue to earn poverty-level wages that don’t keep up
with costs for rent in the area. An even greater number of workers have jobs that offer no health
insurance, no sick or vacation days, few advancement opportunities, and expose them to unhealthy,
unsafe, and at times illegal workplace conditions.
Through integrating 524 in-person worker surveys with interviews and analysis of government data, we
have assembled the most comprehensive picture of the state of Seattle’s restaurant industry to date. Our
research suggests that there are two roads to profitability in the Seattle restaurant industry: the ‘high road’
and the ‘low road’. Restaurant employers who take the high road are the source of the best jobs in the
industry: jobs that offer career advancement, wages that support a family, and a healthy workplace.
Taking the low road to profitability, on the other hand, creates low-wage jobs with few benefits, long
hours, and little opportunity for advancement. This not only harms workers, but also high-road restaurant
employers, consumers, and taxpayers. Low road practices also create negative public health implications
such as customers being served food by sick restaurant workers.
Our research reveals that while there have been important steps made towards improving working
conditions in the Seattle restaurant industry, major gaps and areas for advancement remain. Many
employers continue to take the low road to profitability. Our worker surveys and interviews illustrate the
impact this approach has had on people’s lives. Our primary research – interviews and surveys with
6
restaurant workers coupled with government and industry statistics, provide the first comprehensive look
at working conditions in Seattle’s restaurant industry. The result is a unique overview of the
characteristics of workers in the industry, their wages, benefits, and working environment.
METHODOLOGY
INTERVIEW METHODOLOGY
In order to obtain a holistic picture of the daily lives of restaurant workers and to gain detailed
information about the nature of working conditions, in-depth, open-ended, one-on-one interviews were
conducted with 15 workers. An interview guide was used to structure interviews and ensure that all
interviews covered the same general topics, but workers were also given the space to discuss issues and
lead the conversation in directions that they considered relevant or important. Interviewers were trained in
how to use the guide to conduct structured, open-ended interviews. The interviews were recorded and
analyzed using Dedoose software.
SURVEY METHODLOGY
The survey was administered from October 2013 to August 2015 by staff, members, and volunteers from
the Restaurant Opportunities Center of Seattle (ROC – Seattle), a community-based organization with
significant contacts among restaurant workers and access to workplaces in the industry. A total of 524
surveys were conducted face-to-face with workers in the city of Seattle and in King County. Unless
otherwise specified, Seattle and Seattle area refers to the city and surrounding areas within King County.
Seattle Metropolitan region refers to the Seattle-Tacoma-Bellevue Metropolitan Statistical Area. Our
sample consisted entirely of workers currently employed in the restaurant industry, with 56% of
respondents with four years of experience or more at their current employer, within the Seattle area. We
sought to capture a wide range of experiences in each of the three main segments of the industry – fine
dining, casual dining, and quick serve. The sample was stratified to ensure that the workers interviewed
were as representative as possible by gender, race, age, and segment, with an oversample in fine dining.
To add to the rigor of the survey administration, we weighted the data according to proportions of Front
and Back-of-the-House workers within full-service and limited-service restaurants to appropriately reflect
the actual distribution of positions in the industry. Resulting statistics were analyzed using Stata SE12
statistical data analysis software. Results from this survey refer to the weighted figures unless otherwise
stated.
WAGE METHODOLOGY
Due to annual increases in wages in Washington State, and steeper increases to the minimum wage in the
city of Seattle, we normalized wage data across the survey population to 2015 based on year to year
percentage increases to base wages according to the increase in the Washington State minimum wage in
2014 and 2015, and an additional increase to the Seattle minimum wage for the survey respondents
working in Seattle and surveyed prior to April 1, 2015 with a subminimum wage discount for respondents
in tipped occupations, with health insurance, or working in a business with 500 or more employees. Due
to the average tenure, fine dining oversample, and wage increases within Seattle, the median wage is
higher for our sample than the overall wages recorded by employers in the Seattle-Tacoma-Bellevue
Metropolitan Region, yet provides a vivid view of the changes taking place in the Seattle restaurant
industry.
**BOX**
7
TERMS USED IN THIS REPORT
Front-of-the-House and Back-of-the House are restaurant industry terms for the placement and function of
workers in a restaurant setting. Front-of-the-House generally refers to those interacting with customers in
the front of the restaurant including wait staff, bussers, and runners. Back-of-the-House workers generally
refers to kitchen staff including chefs, cooks, food preparation staff, dishwashers, and cleaners.
High road and low road are industry terms referring to opposing business strategies for achieving
productivity and profitability. In this report, the former is used to denote employer practices that involve
investing in workers by paying livable wages, providing comprehensive benefits, opportunities for career
advancement, and safe workplace conditions as a means to maximize productivity. This often results in
reduced turnover as well as better quality food and service. The latter refers to strategies that involve
chronic understaffing, failing to provide benefits, pushing workers to cut corners, and violating labor,
employment and health and safety standards. Low-road practices are not just illegal practices – they also
include employment practices such as providing low wages and little or no access to benefits. These
practices are not sustainable for workers and their families, and they have a long-term negative impact on
both consumers and employers.
**END BOX**
CHAPTER 2: OVERVIEW OF THE SEATTLE RESTAURANT INDUSTRY
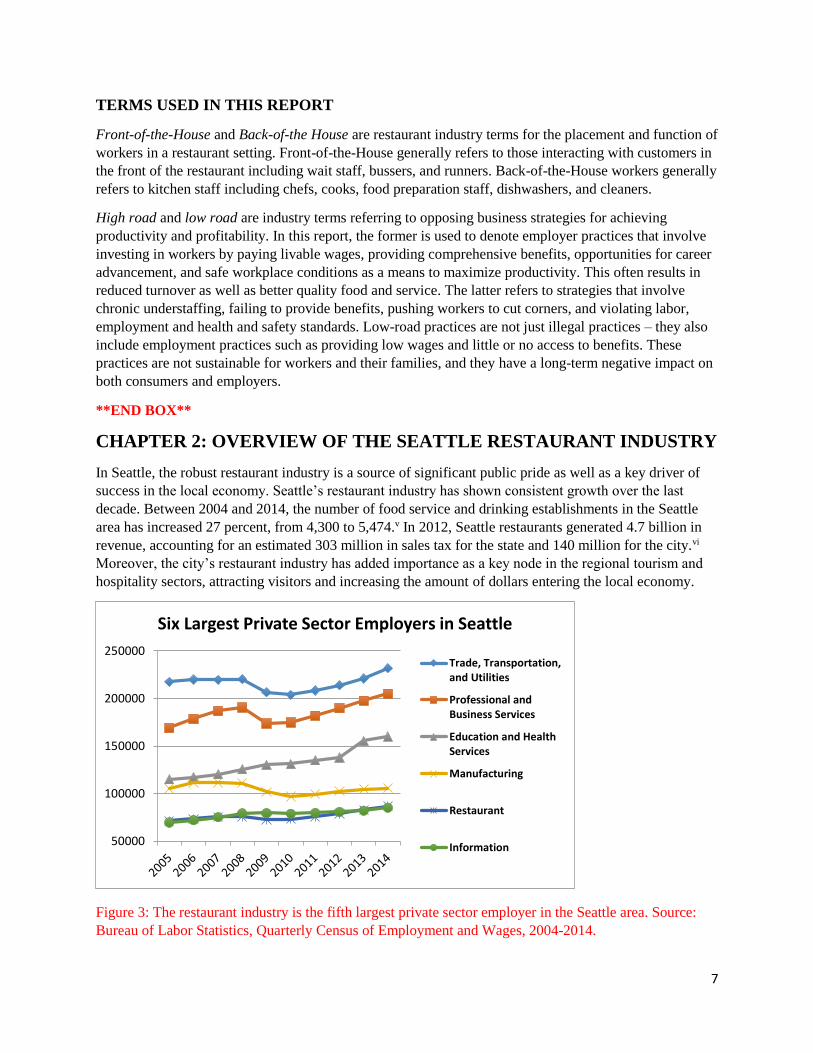
In Seattle, the robust restaurant industry is a source of significant public pride as well as a key driver of
success in the local economy. Seattle’s restaurant industry has shown consistent growth over the last
decade. Between 2004 and 2014, the number of food service and drinking establishments in the Seattle
area has increased 27 percent, from 4,300 to 5,474.v In 2012, Seattle restaurants generated 4.7 billion in
revenue, accounting for an estimated 303 million in sales tax for the state and 140 million for the city.vi
Moreover, the city’s restaurant industry has added importance as a key node in the regional tourism and
hospitality sectors, attracting visitors and increasing the amount of dollars entering the local economy.
Figure 3: The restaurant industry is the fifth largest private sector employer in the Seattle area. Source:
Bureau of Labor Statistics, Quarterly Census of Employment and Wages, 2004-2014.
50000
100000
150000
200000
250000
Six Largest Private Sector Employers in Seattle
Trade, Transportation,and Utilities
Professional andBusiness Services
Education and HealthServices
Manufacturing
Restaurant
Information

8
In order to assemble a comprehensive analysis of the issues restaurant workers in the Seattle-area face, we
collected 524 worker surveys and conducted 15 in-depth interviews with workers over a 22-month period.
This primary research is supplemented with analyses of industry and government data and reviews of
existing academic literature. Seattle’s growing restaurant industry includes more than 86,000 workers in
5,474 establishments, which contribute to the region’s tourism, hospitality, and entertainment sectors.
Seattle restaurant workers comprise 8% of the total local private sector employment. Our survey research
found that nearly 46% of Seattle restaurant workers are paid an hourly wage that would not support a
family of three above the poverty level in Seattle.
**Box**
RESTAURANT TERMINOLOGY
As shown throughout the report, wages and working conditions vary markedly between position and
industry segment.
SEGMENT
The North American Industry Classification System (NAICS) categorizes the restaurant industry (“Food
Services and Drinking Places”) into four segments: full-service restaurants, which have table service
where the consumer orders from a menu at a table; limited-service restaurants, which have no table
service; special food services, which provide services such as catering; and drinking places, which serve
drinks but not food.vii The restaurant categories used in this report align with the NAICS categories, with
the addition of a distinction within full-service between ‘fine dining’ and ‘casual restaurants.’
Distinguishing between these two categories is critical to our analysis because job quality, employer
practices, and patterns for ethnic and racial employment and occupational segregation differ across the
two segments. The categories used in this report are as follows:
1. Fine dining includes full-service restaurants commonly referred to as “upscale” restaurants. The
typical dining tab per person is above $40.
2. Casual restaurants, also described as ‘casual dining’ or ‘family style’ restaurants, are
moderately priced full-service restaurants. They include franchise or chain restaurants, such as
Olive Garden or Applebee’s, as well as independently owned establishments.
3. Quick Serve, limited service restaurants, serve food without table service. Examples include ‘fast
food’ restaurants like McDonald’s, or ‘fast casual’ restaurants, like Chipotle, that may have
higher prices and cater to different clientele.
4. Bars and other includes catering, and bars that do not serve food.
Position
Jobs in the restaurant industry generally fall into one of three basic categories, each corresponding to
different levels of compensation, potential for mobility, access to training, workplace conditions, and
other indicators of job quality:
1. Managers and supervisors, including chefs.
2. Front-of-the-House positions, including all staff that has direct contact with customers, such as
servers, bartenders, hosts, and bussers.
3. Back-of-the-House positions, or those that do not involve direct contact with customers, but are
essential to a restaurant’s functions, such as dishwashers and cooks. Many quick service
employees work a combined back of the house and front of the house position. Quick serve jobs
9
are categorized as Back-of-the-House in this study because wages and working conditions in
them are similar to those in Back-of-the-House jobs.
**END OF BOX**
HOW MANY JOBS?
The restaurant industry is the fifth largest private sector employer in Seattle. In 2014, according to the
Bureau of Labor Statistics, the Seattle restaurant industry employed 86,757 workers, 8% of all private
sector employees.viii
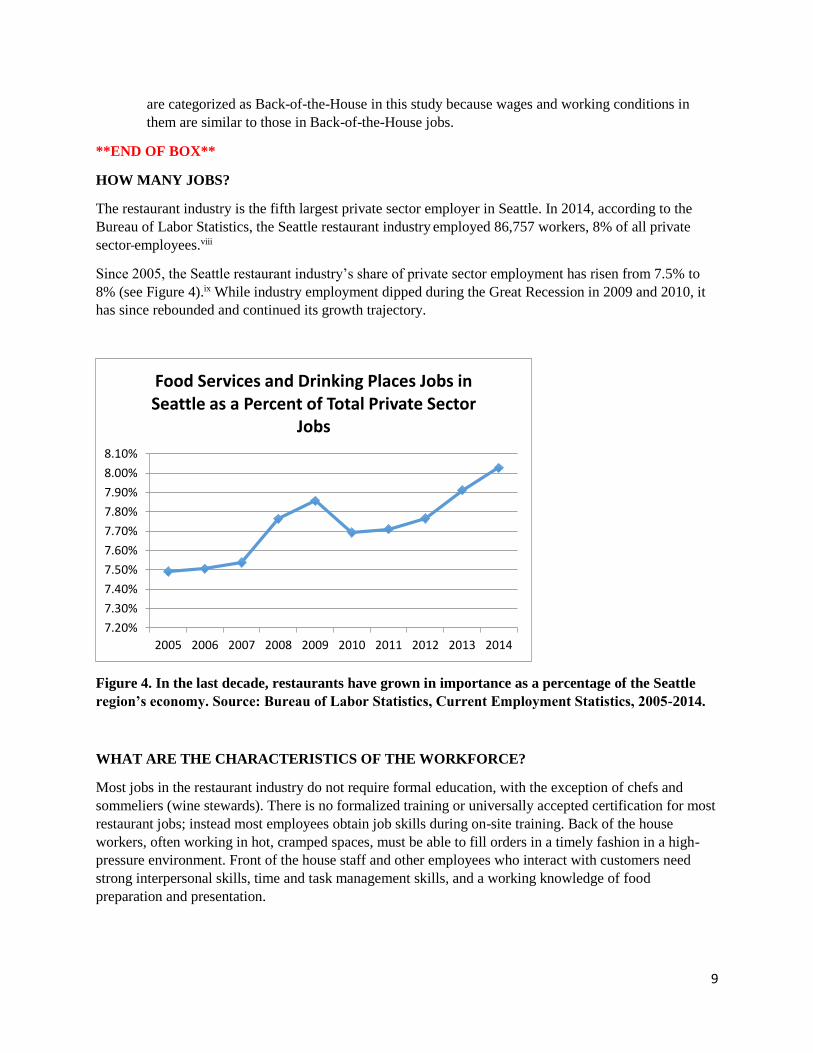
Since 2005, the Seattle restaurant industry’s share of private sector employment has risen from 7.5% to
8% (see Figure 4).ix While industry employment dipped during the Great Recession in 2009 and 2010, it
has since rebounded and continued its growth trajectory.
Figure 4. In the last decade, restaurants have grown in importance as a percentage of the Seattle
region’s economy. Source: Bureau of Labor Statistics, Current Employment Statistics, 2005-2014.
WHAT ARE THE CHARACTERISTICS OF THE WORKFORCE?
Most jobs in the restaurant industry do not require formal education, with the exception of chefs and
sommeliers (wine stewards). There is no formalized training or universally accepted certification for most
restaurant jobs; instead most employees obtain job skills during on-site training. Back of the house
workers, often working in hot, cramped spaces, must be able to fill orders in a timely fashion in a high-
pressure environment. Front of the house staff and other employees who interact with customers need
strong interpersonal skills, time and task management skills, and a working knowledge of food
preparation and presentation.
7.20%
7.30%
7.40%
7.50%
7.60%
7.70%
7.80%
7.90%
8.00%
8.10%
2005 2006 2007 2008 2009 2010 2011 2012 2013 2014
Food Services and Drinking Places Jobs in Seattle as a Percent of Total Private Sector
Jobs
10
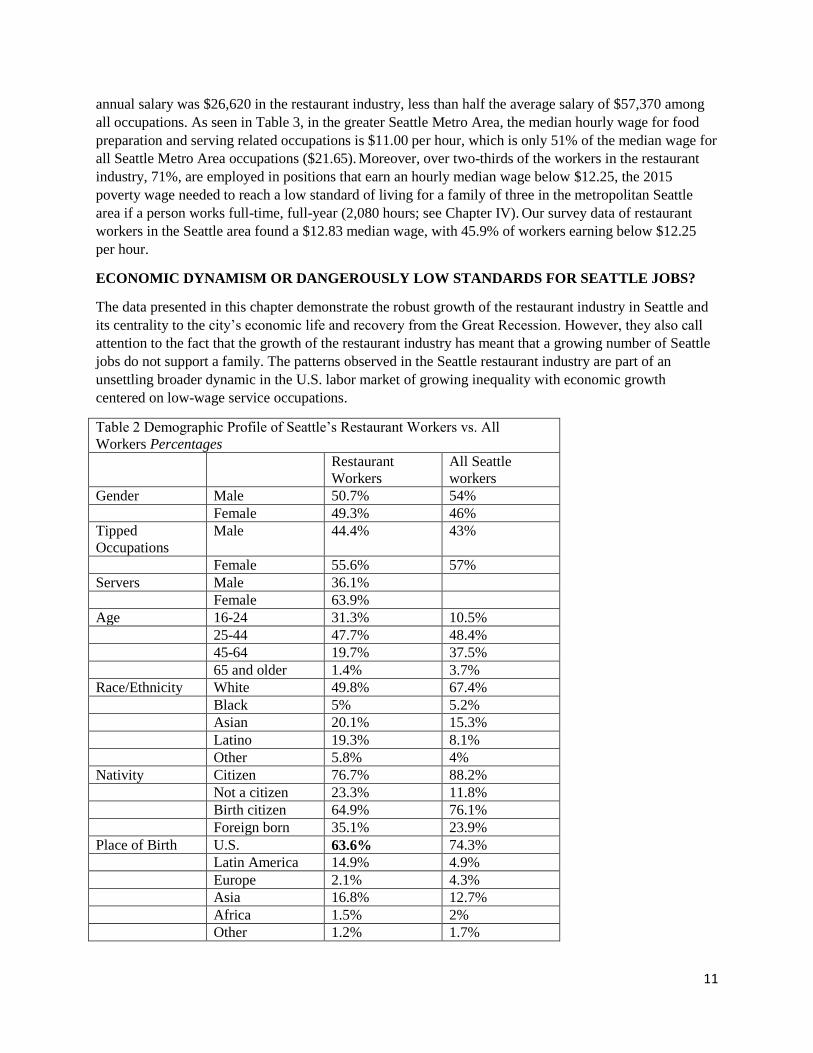
Census data shows that the Seattle restaurant industry is generally younger, has greater representation of
women and people of color, with a higher proportion of foreign-born workers and workers without a
college degree than the overall workforce (see Table 2). Some key statistics include:
GENDER
Women make up half the industry’s overall workforce, and make up 56% of the industry’s tipped
restaurant occupations, and 64% of servers, compared to 46% of the overall economy.x
AGE
Seattle restaurant workers are younger on average than the overall labor force of the city, but the industry
is an important source of jobs for workers in all age brackets. The median age of restaurant employees is
30 compared to 41 in the overall work force. Nearly 31% of restaurant industry workers are between the
ages of 16 and 24, three times the rate of all Seattle workers in the same age category, and the share of
workers between the ages of 45 and 64 is 20%, or nearly half of the 38% among all workers. However, in
both the restaurant industry and the broader economy nearly half of all workers, 48%, are between the
ages of 25 to 44 in both the restaurant industry and the overall economy.xi
RACE
Approximately 50% of the restaurant labor force in 2010 was comprised of Blacks, Asians, Latinos, and
other workers of color, compared to only 33% among all Seattle workers. Asian workers comprise the
largest single group after whites, at 20%, compared to 15% among the total workforce. Latinos represent
19% of the industry, but that is more than twice their participation in the total economy at 8%. Black
workers are represented at the same rate as in the rest of the local economy, but are overrepresented in
fast food occupations and earn the absolute lowest wages.xii In total, the restaurant industry provides
greater opportunities for workers of color than the rest of the economy, but as shown in chapter XI, tends
to segregate them in the lower earning segments of the industry.
FOREIGN BORN
In Seattle there are 35% foreign born workers employed in the restaurant industry, compared to 24% in all
industries.xiii
EDUCATION
The restaurant industry provides greater opportunities for workers without extensive education, 53% have
a high school degree or less compared to 27% among all Seattle workers. Similarly, the restaurant
industry provides greater opportunities for workers without a Bachelor’s degree, 84% do not have a B.A.,
compared to only 51% among all workers. However, 47% of all restaurant workers still have at least
some amount of college education.xiv
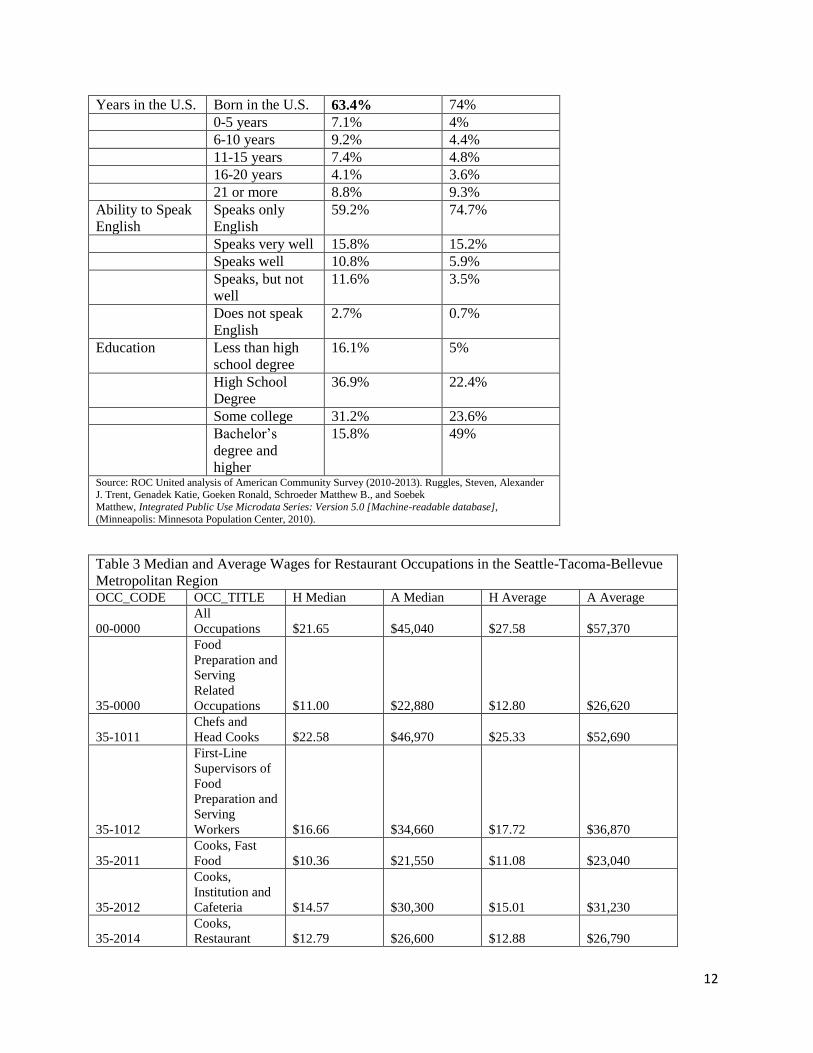
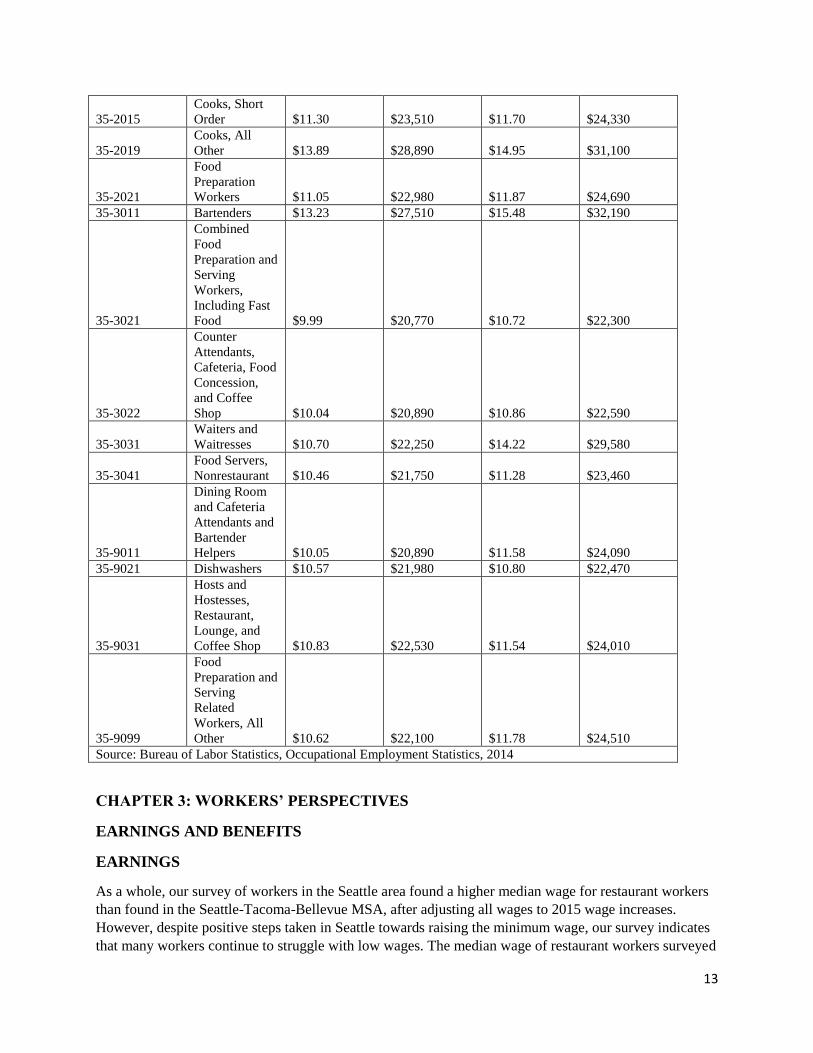
WHAT DO THE JOBS PAY?
While Seattle restaurant industry employment has grown in the past decade, wages in the region have not
kept pace. According to the Bureau of Labor Statistics’ Occupational Employment Statistics survey of
employers, in 2014, the median hourly wage for a worker in the Seattle-Tacoma-Bellevue restaurant
industry was $11 per hour, compared to a $21.65 median wage per hour for all occupations.xv The average
11
annual salary was $26,620 in the restaurant industry, less than half the average salary of $57,370 among
all occupations. As seen in Table 3, in the greater Seattle Metro Area, the median hourly wage for food
preparation and serving related occupations is $11.00 per hour, which is only 51% of the median wage for
all Seattle Metro Area occupations ($21.65). Moreover, over two-thirds of the workers in the restaurant
industry, 71%, are employed in positions that earn an hourly median wage below $12.25, the 2015
poverty wage needed to reach a low standard of living for a family of three in the metropolitan Seattle
area if a person works full-time, full-year (2,080 hours; see Chapter IV). Our survey data of restaurant
workers in the Seattle area found a $12.83 median wage, with 45.9% of workers earning below $12.25
per hour.
ECONOMIC DYNAMISM OR DANGEROUSLY LOW STANDARDS FOR SEATTLE JOBS?
The data presented in this chapter demonstrate the robust growth of the restaurant industry in Seattle and
its centrality to the city’s economic life and recovery from the Great Recession. However, they also call
attention to the fact that the growth of the restaurant industry has meant that a growing number of Seattle
jobs do not support a family. The patterns observed in the Seattle restaurant industry are part of an
unsettling broader dynamic in the U.S. labor market of growing inequality with economic growth
centered on low-wage service occupations.
Table 2 Demographic Profile of Seattle’s Restaurant Workers vs. All
Workers Percentages
Restaurant
Workers
All Seattle
workers
Gender Male 50.7% 54%
Female 49.3% 46%
Tipped
Occupations
Male 44.4% 43%
Female 55.6% 57%
Servers Male 36.1%
Female 63.9%
Age 16-24 31.3% 10.5%
25-44 47.7% 48.4%
45-64 19.7% 37.5%
65 and older 1.4% 3.7%
Race/Ethnicity White 49.8% 67.4%
Black 5% 5.2%
Asian 20.1% 15.3%
Latino 19.3% 8.1%
Other 5.8% 4%
Nativity Citizen 76.7% 88.2%
Not a citizen 23.3% 11.8%
Birth citizen 64.9% 76.1%
Foreign born 35.1% 23.9%
Place of Birth U.S. 63.6% 74.3%
Latin America 14.9% 4.9%
Europe 2.1% 4.3%
Asia 16.8% 12.7%
Africa 1.5% 2%
Other 1.2% 1.7%
12
Years in the U.S. Born in the U.S. 63.4% 74%
0-5 years 7.1% 4%
6-10 years 9.2% 4.4%
11-15 years 7.4% 4.8%
16-20 years 4.1% 3.6%
21 or more 8.8% 9.3%
Ability to Speak
English
Speaks only
English
59.2% 74.7%
Speaks very well 15.8% 15.2%
Speaks well 10.8% 5.9%
Speaks, but not
well
11.6% 3.5%
Does not speak
English
2.7% 0.7%
Education Less than high
school degree
16.1% 5%
High School
Degree
36.9% 22.4%
Some college 31.2% 23.6%
Bachelor’s
degree and
higher
15.8% 49%
Source: ROC United analysis of American Community Survey (2010-2013). Ruggles, Steven, Alexander J. Trent, Genadek Katie, Goeken Ronald, Schroeder Matthew B., and Soebek
Matthew, Integrated Public Use Microdata Series: Version 5.0 [Machine-readable database],
(Minneapolis: Minnesota Population Center, 2010).
Table 3 Median and Average Wages for Restaurant Occupations in the Seattle-Tacoma-Bellevue
Metropolitan Region OCC_CODE OCC_TITLE H Median A Median H Average A Average
00-0000
All
Occupations $21.65 $45,040 $27.58 $57,370
35-0000
Food
Preparation and
Serving
Related
Occupations $11.00 $22,880 $12.80 $26,620
35-1011
Chefs and
Head Cooks $22.58 $46,970 $25.33 $52,690
35-1012
First-Line
Supervisors of
Food
Preparation and
Serving
Workers $16.66 $34,660 $17.72 $36,870
35-2011
Cooks, Fast
Food $10.36 $21,550 $11.08 $23,040
35-2012
Cooks,
Institution and
Cafeteria $14.57 $30,300 $15.01 $31,230
35-2014
Cooks,
Restaurant $12.79 $26,600 $12.88 $26,790
13
35-2015
Cooks, Short
Order $11.30 $23,510 $11.70 $24,330
35-2019
Cooks, All
Other $13.89 $28,890 $14.95 $31,100
35-2021
Food
Preparation
Workers $11.05 $22,980 $11.87 $24,690
35-3011 Bartenders $13.23 $27,510 $15.48 $32,190
35-3021
Combined
Food
Preparation and
Serving
Workers,
Including Fast
Food $9.99 $20,770 $10.72 $22,300
35-3022
Counter
Attendants,
Cafeteria, Food
Concession,
and Coffee
Shop $10.04 $20,890 $10.86 $22,590
35-3031
Waiters and
Waitresses $10.70 $22,250 $14.22 $29,580
35-3041
Food Servers,
Nonrestaurant $10.46 $21,750 $11.28 $23,460
35-9011
Dining Room
and Cafeteria
Attendants and
Bartender
Helpers $10.05 $20,890 $11.58 $24,090
35-9021 Dishwashers $10.57 $21,980 $10.80 $22,470
35-9031
Hosts and
Hostesses,
Restaurant,
Lounge, and
Coffee Shop $10.83 $22,530 $11.54 $24,010
35-9099
Food
Preparation and
Serving
Related
Workers, All
Other $10.62 $22,100 $11.78 $24,510
Source: Bureau of Labor Statistics, Occupational Employment Statistics, 2014
CHAPTER 3: WORKERS’ PERSPECTIVES
EARNINGS AND BENEFITS
EARNINGS
As a whole, our survey of workers in the Seattle area found a higher median wage for restaurant workers
than found in the Seattle-Tacoma-Bellevue MSA, after adjusting all wages to 2015 wage increases.
However, despite positive steps taken in Seattle towards raising the minimum wage, our survey indicates
that many workers continue to struggle with low wages. The median wage of restaurant workers surveyed
14
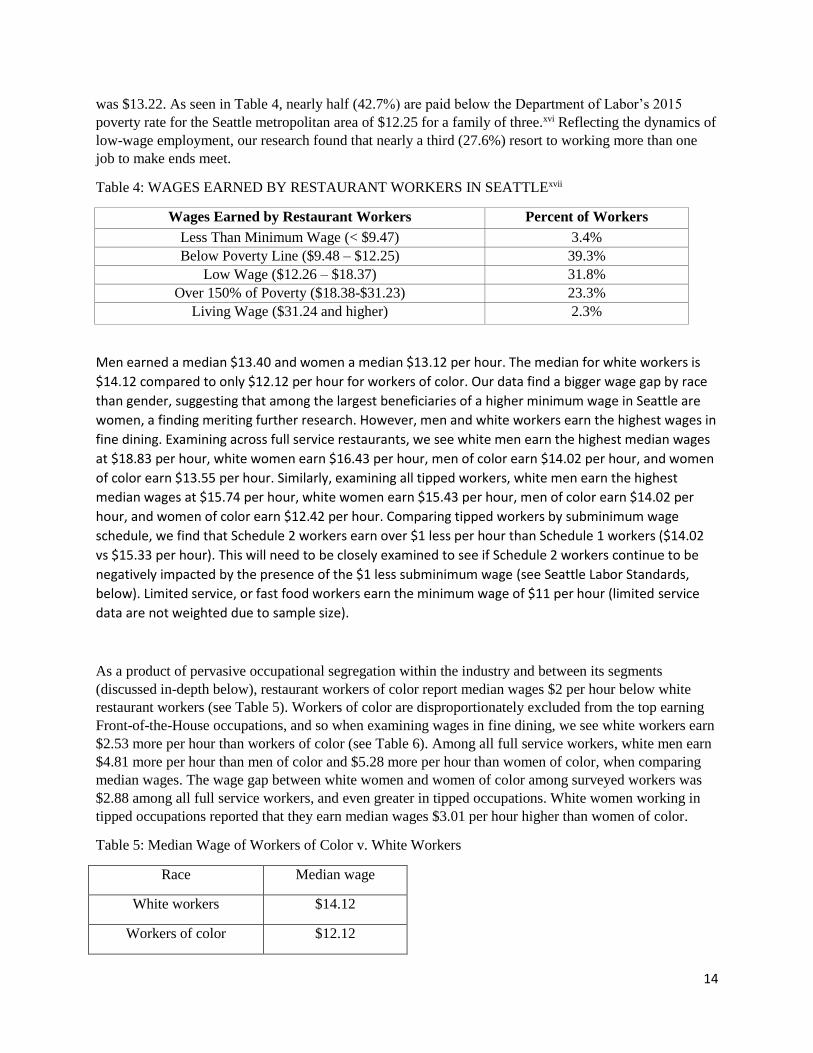
was $13.22. As seen in Table 4, nearly half (42.7%) are paid below the Department of Labor’s 2015
poverty rate for the Seattle metropolitan area of $12.25 for a family of three.xvi Reflecting the dynamics of
low-wage employment, our research found that nearly a third (27.6%) resort to working more than one
job to make ends meet.
Table 4: WAGES EARNED BY RESTAURANT WORKERS IN SEATTLExvii
Wages Earned by Restaurant Workers Percent of Workers
Less Than Minimum Wage (< $9.47) 3.4%
Below Poverty Line ($9.48 – $12.25) 39.3%
Low Wage ($12.26 – $18.37) 31.8%
Over 150% of Poverty ($18.38-$31.23) 23.3%
Living Wage ($31.24 and higher) 2.3%
Men earned a median $13.40 and women a median $13.12 per hour. The median for white workers is
$14.12 compared to only $12.12 per hour for workers of color. Our data find a bigger wage gap by race
than gender, suggesting that among the largest beneficiaries of a higher minimum wage in Seattle are
women, a finding meriting further research. However, men and white workers earn the highest wages in
fine dining. Examining across full service restaurants, we see white men earn the highest median wages
at $18.83 per hour, white women earn $16.43 per hour, men of color earn $14.02 per hour, and women
of color earn $13.55 per hour. Similarly, examining all tipped workers, white men earn the highest
median wages at $15.74 per hour, white women earn $15.43 per hour, men of color earn $14.02 per
hour, and women of color earn $12.42 per hour. Comparing tipped workers by subminimum wage
schedule, we find that Schedule 2 workers earn over $1 less per hour than Schedule 1 workers ($14.02
vs $15.33 per hour). This will need to be closely examined to see if Schedule 2 workers continue to be
negatively impacted by the presence of the $1 less subminimum wage (see Seattle Labor Standards,
below). Limited service, or fast food workers earn the minimum wage of $11 per hour (limited service
data are not weighted due to sample size).
As a product of pervasive occupational segregation within the industry and between its segments
(discussed in-depth below), restaurant workers of color report median wages $2 per hour below white
restaurant workers (see Table 5). Workers of color are disproportionately excluded from the top earning
Front-of-the-House occupations, and so when examining wages in fine dining, we see white workers earn
$2.53 more per hour than workers of color (see Table 6). Among all full service workers, white men earn
$4.81 more per hour than men of color and $5.28 more per hour than women of color, when comparing
median wages. The wage gap between white women and women of color among surveyed workers was
$2.88 among all full service workers, and even greater in tipped occupations. White women working in
tipped occupations reported that they earn median wages $3.01 per hour higher than women of color.
Table 5: Median Wage of Workers of Color v. White Workers
Race Median wage
White workers $14.12
Workers of color $12.12
15
Table 6: Median Wages by Race and Gender in Select Restaurant Segments
Median Wages in Select Restaurant Segments by Race and Gender
Men Women White
People of Color
All
All $13.40 $13.12 $14.12 $12.12 $13.22
Fine Dining $17.63 $17.32 $17.58 $15.05 $17.32
Tipped Occupations (Full Service) $14.68 $14.44 $15.43 $13.43
$14.47
Limited Service * $11.01 $11.22 $11.01 $11.01 $11.00 The median wage reported by limited service respondents was the minimum wage of $11.00. Limited service wage data not weighted due to sample constraints.
Median Wages in Full Service and All Tipped Occupations within Race and Gender
White Men White Women
Men of Color Women of Color
All
Full Service $18.83 $16.43 $14.02 $13.55 $15.17
Tipped Occupations
$15.74 $15.43 $14.02 $12.42 $14.47
Median Wage by Minimum Wage Implementation Schedule in Seattle
Schedule 1 ($11 minimum wage) Schedule 1 ($11
minimum wage)
Schedule 1 ($11 minimum wage)
Schedule 1 ($11 minimum wage)
***Box***
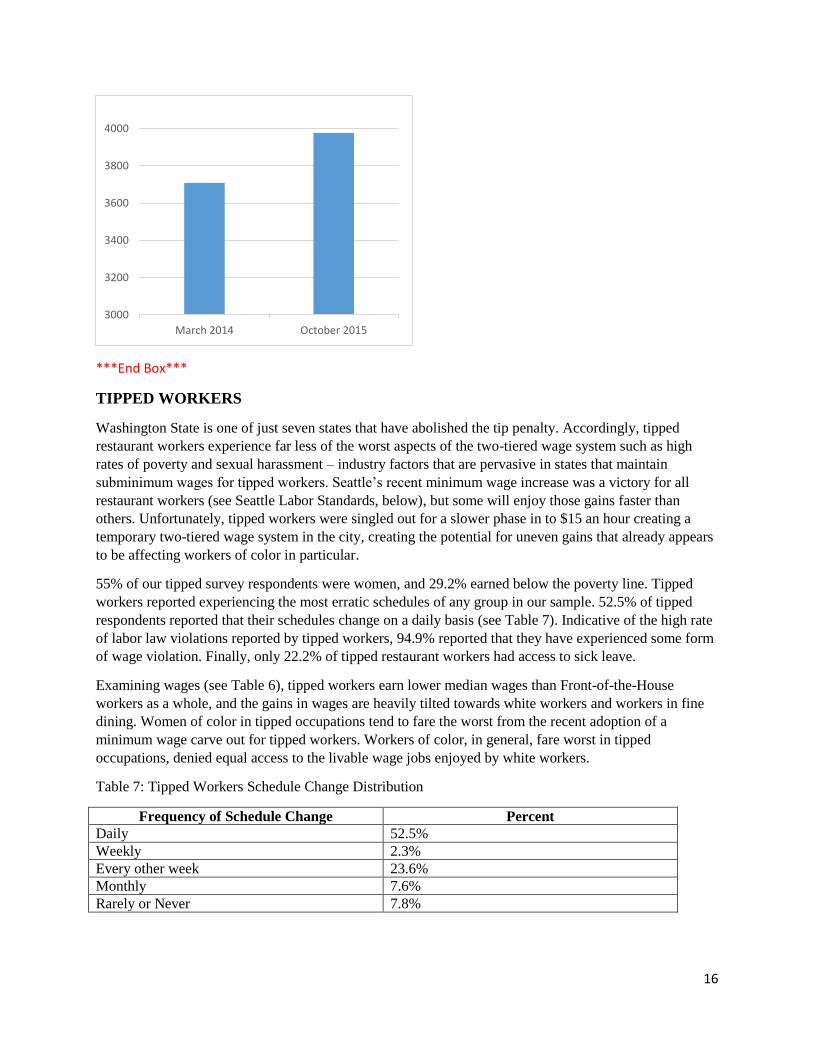
DATA SHOW RESTAURANT INDUSTRY IS BOOMING IN SEATTLE
In the aftermath of the historical victory of Seattle’s living wage movement many conservative media
and policy networks have tried to paint a picture of a “rash of shutterings” taking place in the Seattle
restaurant industry. The empirical evidence however, suggests the opposite is the case – the restaurant
industry is booming. Business counts in the food service industry have grown 7.2% since March 2014.
Full-Service restaurant counts are skyrocketing – up 23% since March 2014.xviii A recent article in the
Puget Sound Business Journal titled “Apocalypse Not: $15 and the cuts that never came”, lifts up the
increase in area restaurant counts as evidence that Seattle’s $15 minimum wage law hasn’t slowed
regional restaurant growth.xix
Figure 5: Total Seattle Food Services & Beverage Industry Business Licenses
16
***End Box***
TIPPED WORKERS
Washington State is one of just seven states that have abolished the tip penalty. Accordingly, tipped
restaurant workers experience far less of the worst aspects of the two-tiered wage system such as high
rates of poverty and sexual harassment – industry factors that are pervasive in states that maintain
subminimum wages for tipped workers. Seattle’s recent minimum wage increase was a victory for all
restaurant workers (see Seattle Labor Standards, below), but some will enjoy those gains faster than
others. Unfortunately, tipped workers were singled out for a slower phase in to $15 an hour creating a
temporary two-tiered wage system in the city, creating the potential for uneven gains that already appears
to be affecting workers of color in particular.
55% of our tipped survey respondents were women, and 29.2% earned below the poverty line. Tipped
workers reported experiencing the most erratic schedules of any group in our sample. 52.5% of tipped
respondents reported that their schedules change on a daily basis (see Table 7). Indicative of the high rate
of labor law violations reported by tipped workers, 94.9% reported that they have experienced some form
of wage violation. Finally, only 22.2% of tipped restaurant workers had access to sick leave.
Examining wages (see Table 6), tipped workers earn lower median wages than Front-of-the-House
workers as a whole, and the gains in wages are heavily tilted towards white workers and workers in fine
dining. Women of color in tipped occupations tend to fare the worst from the recent adoption of a
minimum wage carve out for tipped workers. Workers of color, in general, fare worst in tipped
occupations, denied equal access to the livable wage jobs enjoyed by white workers.
Table 7: Tipped Workers Schedule Change Distribution
Frequency of Schedule Change Percent
Daily 52.5%
Weekly 2.3%
Every other week 23.6%
Monthly 7.6%
Rarely or Never 7.8%
3000
3200
3400
3600
3800
4000
March 2014 October 2015
17
***Box***
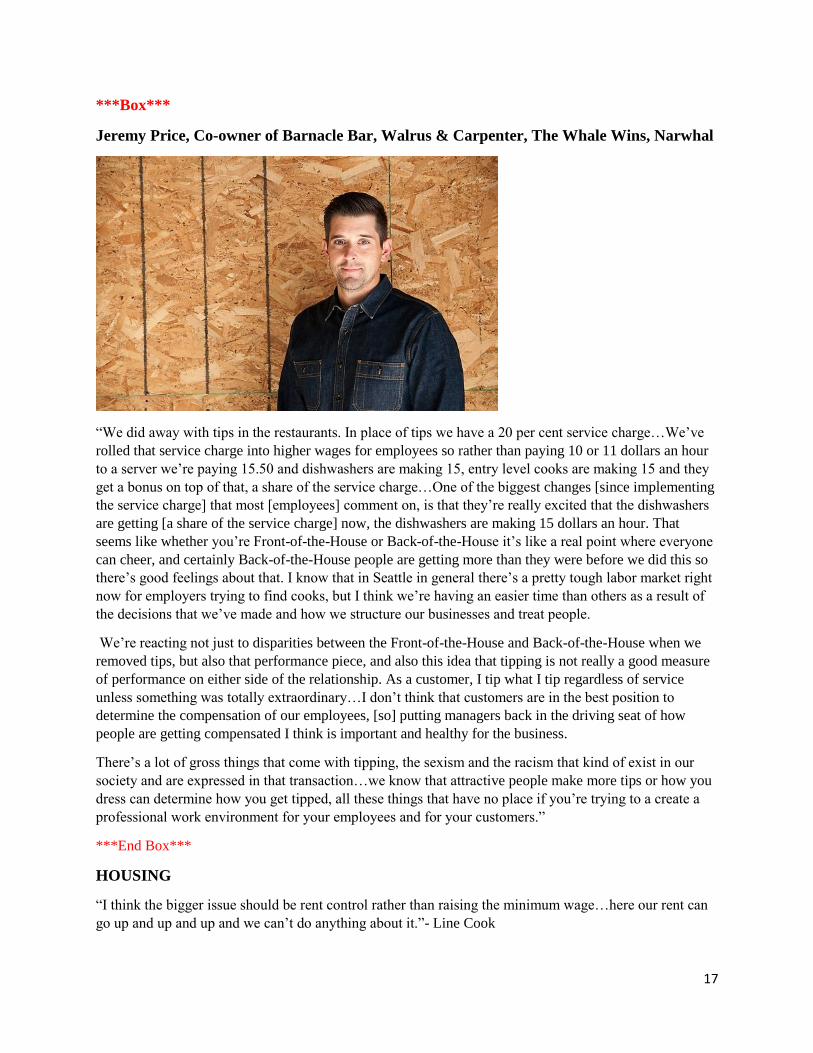
Jeremy Price, Co-owner of Barnacle Bar, Walrus & Carpenter, The Whale Wins, Narwhal
“We did away with tips in the restaurants. In place of tips we have a 20 per cent service charge…We’ve
rolled that service charge into higher wages for employees so rather than paying 10 or 11 dollars an hour
to a server we’re paying 15.50 and dishwashers are making 15, entry level cooks are making 15 and they
get a bonus on top of that, a share of the service charge…One of the biggest changes [since implementing
the service charge] that most [employees] comment on, is that they’re really excited that the dishwashers
are getting [a share of the service charge] now, the dishwashers are making 15 dollars an hour. That
seems like whether you’re Front-of-the-House or Back-of-the-House it’s like a real point where everyone
can cheer, and certainly Back-of-the-House people are getting more than they were before we did this so
there’s good feelings about that. I know that in Seattle in general there’s a pretty tough labor market right
now for employers trying to find cooks, but I think we’re having an easier time than others as a result of
the decisions that we’ve made and how we structure our businesses and treat people.
We’re reacting not just to disparities between the Front-of-the-House and Back-of-the-House when we
removed tips, but also that performance piece, and also this idea that tipping is not really a good measure
of performance on either side of the relationship. As a customer, I tip what I tip regardless of service
unless something was totally extraordinary…I don’t think that customers are in the best position to
determine the compensation of our employees, [so] putting managers back in the driving seat of how
people are getting compensated I think is important and healthy for the business.
There’s a lot of gross things that come with tipping, the sexism and the racism that kind of exist in our
society and are expressed in that transaction…we know that attractive people make more tips or how you
dress can determine how you get tipped, all these things that have no place if you’re trying to a create a
professional work environment for your employees and for your customers.”
***End Box***
HOUSING
“I think the bigger issue should be rent control rather than raising the minimum wage…here our rent can
go up and up and up and we can’t do anything about it.”- Line Cook
18
With Seattle having some of the fastest rising rents in the country, restaurant workers’ lower purchasing
power strongly affects how and where they live. The generally accepted standard on housing affordability
is that rent should be no more than 30% of income. According to the National Low Income Housing
Coalition, the fair market rent for a two-bedroom unit in King County is $1,415.xx In order to afford that
rent, a worker would need an hourly wage of $27.21xxi. More than three-quarters of our survey sample
earned less than that amount. A typical restaurant worker would need to work 83 hours per week to afford
that.
Survey data demonstrated that restaurant workers in the Seattle area are paying on average $700 per
month in rent. In addition to this, many workers reported commuting significant distances from lower-
income areas with more affordable rents and sharing housing costs by living with more people. 46.2% of
restaurant workers living below the poverty wage live in a house with four or more total residents while
only 33.7% of those earning 150% of the poverty wage live in a house with four or more residents. 4.8%
earning a poverty wage live in a house with six or more total residents.
**BOX: DO YOU KNOW THE LAW?**
SEATTLE LABOR STANDARDS
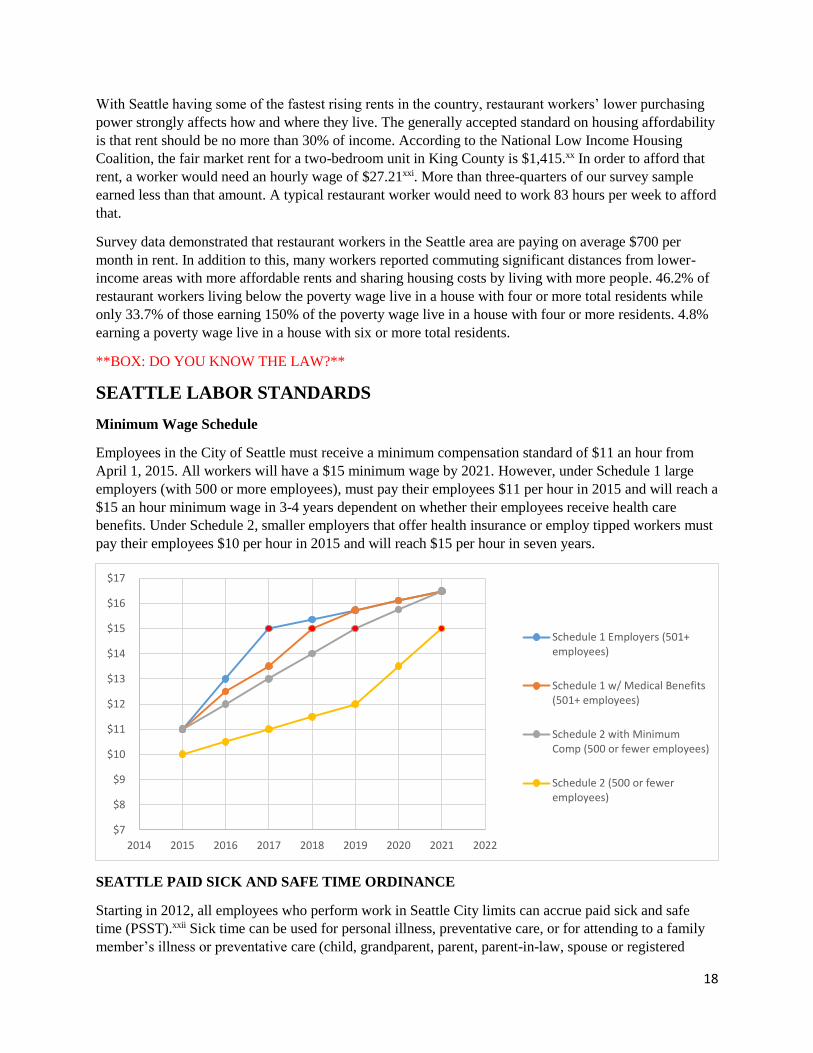
Minimum Wage Schedule
Employees in the City of Seattle must receive a minimum compensation standard of $11 an hour from
April 1, 2015. All workers will have a $15 minimum wage by 2021. However, under Schedule 1 large
employers (with 500 or more employees), must pay their employees $11 per hour in 2015 and will reach a
$15 an hour minimum wage in 3-4 years dependent on whether their employees receive health care
benefits. Under Schedule 2, smaller employers that offer health insurance or employ tipped workers must
pay their employees $10 per hour in 2015 and will reach $15 per hour in seven years.
SEATTLE PAID SICK AND SAFE TIME ORDINANCE
Starting in 2012, all employees who perform work in Seattle City limits can accrue paid sick and safe
time (PSST).xxii Sick time can be used for personal illness, preventative care, or for attending to a family
member’s illness or preventative care (child, grandparent, parent, parent-in-law, spouse or registered
$7
$8
$9
$10
$11
$12
$13
$14
$15
$16
$17
2014 2015 2016 2017 2018 2019 2020 2021 2022
Schedule 1 Employers (501+employees)
Schedule 1 w/ Medical Benefits(501+ employees)
Schedule 2 with MinimumComp (500 or fewer employees)
Schedule 2 (500 or feweremployees)
19
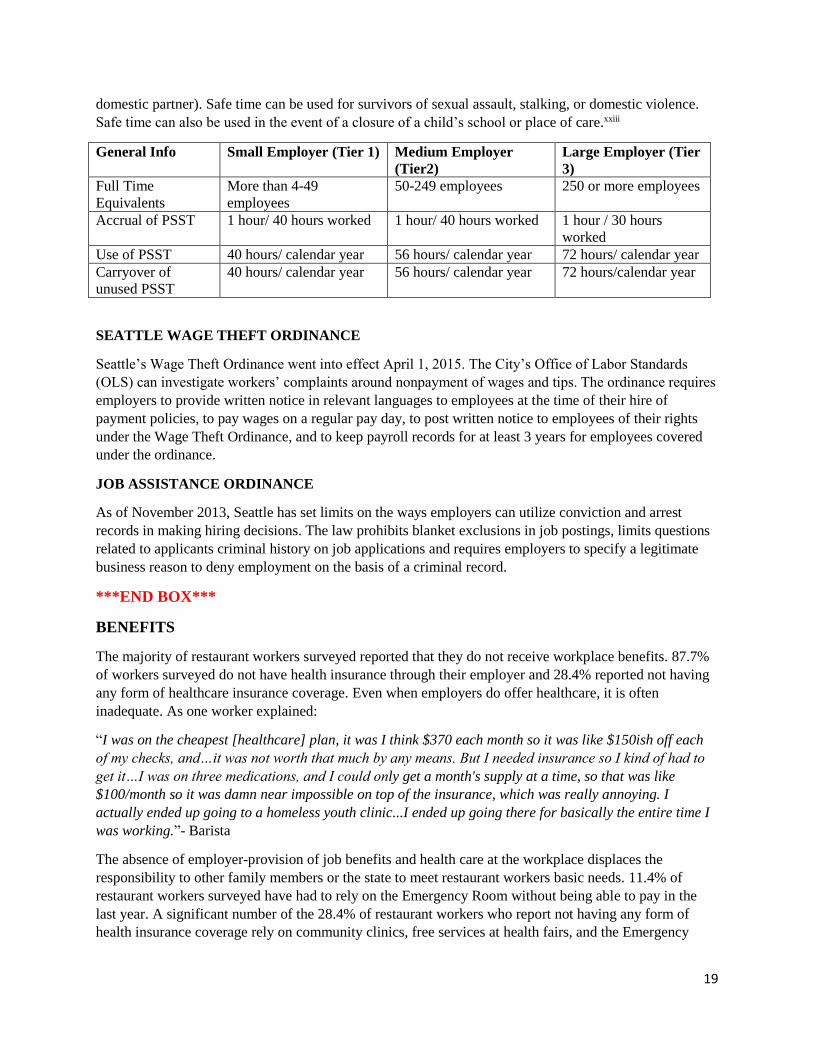
domestic partner). Safe time can be used for survivors of sexual assault, stalking, or domestic violence.
Safe time can also be used in the event of a closure of a child’s school or place of care.xxiii
General Info Small Employer (Tier 1) Medium Employer
(Tier2)
Large Employer (Tier
3)
Full Time
Equivalents
More than 4-49
employees
50-249 employees 250 or more employees
Accrual of PSST 1 hour/ 40 hours worked 1 hour/ 40 hours worked 1 hour / 30 hours
worked
Use of PSST 40 hours/ calendar year 56 hours/ calendar year 72 hours/ calendar year
Carryover of
unused PSST
40 hours/ calendar year 56 hours/ calendar year 72 hours/calendar year
SEATTLE WAGE THEFT ORDINANCE
Seattle’s Wage Theft Ordinance went into effect April 1, 2015. The City’s Office of Labor Standards
(OLS) can investigate workers’ complaints around nonpayment of wages and tips. The ordinance requires
employers to provide written notice in relevant languages to employees at the time of their hire of
payment policies, to pay wages on a regular pay day, to post written notice to employees of their rights
under the Wage Theft Ordinance, and to keep payroll records for at least 3 years for employees covered
under the ordinance.
JOB ASSISTANCE ORDINANCE
As of November 2013, Seattle has set limits on the ways employers can utilize conviction and arrest
records in making hiring decisions. The law prohibits blanket exclusions in job postings, limits questions
related to applicants criminal history on job applications and requires employers to specify a legitimate
business reason to deny employment on the basis of a criminal record.
***END BOX***
BENEFITS
The majority of restaurant workers surveyed reported that they do not receive workplace benefits. 87.7%
of workers surveyed do not have health insurance through their employer and 28.4% reported not having
any form of healthcare insurance coverage. Even when employers do offer healthcare, it is often
inadequate. As one worker explained:
“I was on the cheapest [healthcare] plan, it was I think $370 each month so it was like $150ish off each
of my checks, and…it was not worth that much by any means. But I needed insurance so I kind of had to
get it…I was on three medications, and I could only get a month's supply at a time, so that was like
$100/month so it was damn near impossible on top of the insurance, which was really annoying. I
actually ended up going to a homeless youth clinic...I ended up going there for basically the entire time I
was working.”- Barista
The absence of employer-provision of job benefits and health care at the workplace displaces the
responsibility to other family members or the state to meet restaurant workers basic needs. 11.4% of
restaurant workers surveyed have had to rely on the Emergency Room without being able to pay in the
last year. A significant number of the 28.4% of restaurant workers who report not having any form of
health insurance coverage rely on community clinics, free services at health fairs, and the Emergency
20
Room to receive their healthcare (see Table 8). Most strikingly, 45.7% of restaurant workers without
health insurance report that they only receive healthcare through the emergency room.
Table 8: Job Benefits Reported by Restaurant Workers
Job Benefits and Health Reported by Restaurant Workers Percent of Sample
Does not receive health insurance from employer 87.7%
Do not have any health insurance coverage 28.4%
Gone to the ER without being able to pay in the past year 11.4%
Do not get paid vacation days 77.0%
How workers without insurance receive healthcare:
Community Clinic 14.3%
Free Services at Health Fairs 40.0%
Emergency Room 45.7%
**Box** *******
David Meinert, Owner of The 5 Point Café
“At the 5 Point we offer paid time off, above sick days, and then we offer a 401k retirement plan as both
profit share and matching up to 4%.... [The 410k plan] does [affect our turnover]- I wish I could say it
affected it more! I’ve had employees who definitely stay and appreciate it and see the value of it, I have
others that leave, take another job and cash out…I’ve had other employees leave and not cash out, and
then tell me how much they appreciate it because they’ve watched their retirement increase a little bit and
they still contribute to it. I think long term it will help turnover…I think it helps us hire better staff.
21
We offer health insurance through the exchange, which we’re not required to… no matter how much you
work here you get coverage, its $150 of your coverage and for most of the staff that’s 100 per cent. We
help sign them up on the exchange, and then reimburse them.
The next benefit I’m looking at is longer paid time off. Its five days right now, and you can use it for any
purpose as long as it’s scheduled in advance. The accrual is the same as Seattle sick days. I think that I’d
like to see that get up to two weeks and then I’d like to see family leave, some kind of plan. It’s a little
harder with hourly workers, but I think there should be something.”
*********EndBox*****************
SICK LEAVE IN SEATTLE
“They would get really annoyed if you tried using [sick days]. Like, they would let you use it but you had
to call specifically two hours beforehand and if you called two hours beforehand and you were sick, it
was your responsibility to find someone to cover. Even though I read the book and it said...it's not your
responsibility... if I didn't find someone to cover my shift they forced me to come in anyway" –Barista
Since the Seattle City Council implemented the Paid Sick and Safe Time (PSST) Ordinance in 2012,
employers with more than four full-time employees have been required to provide paid leave for their
employees to attend to their own or their family’s health and critical safety needs. A trail-blazing policy,
Seattle was only the 4th city at that time to create a path to paid sick leave for all workers. Three years
later, many restaurant workers in Seattle report that they are unaware of the law and unable to access its
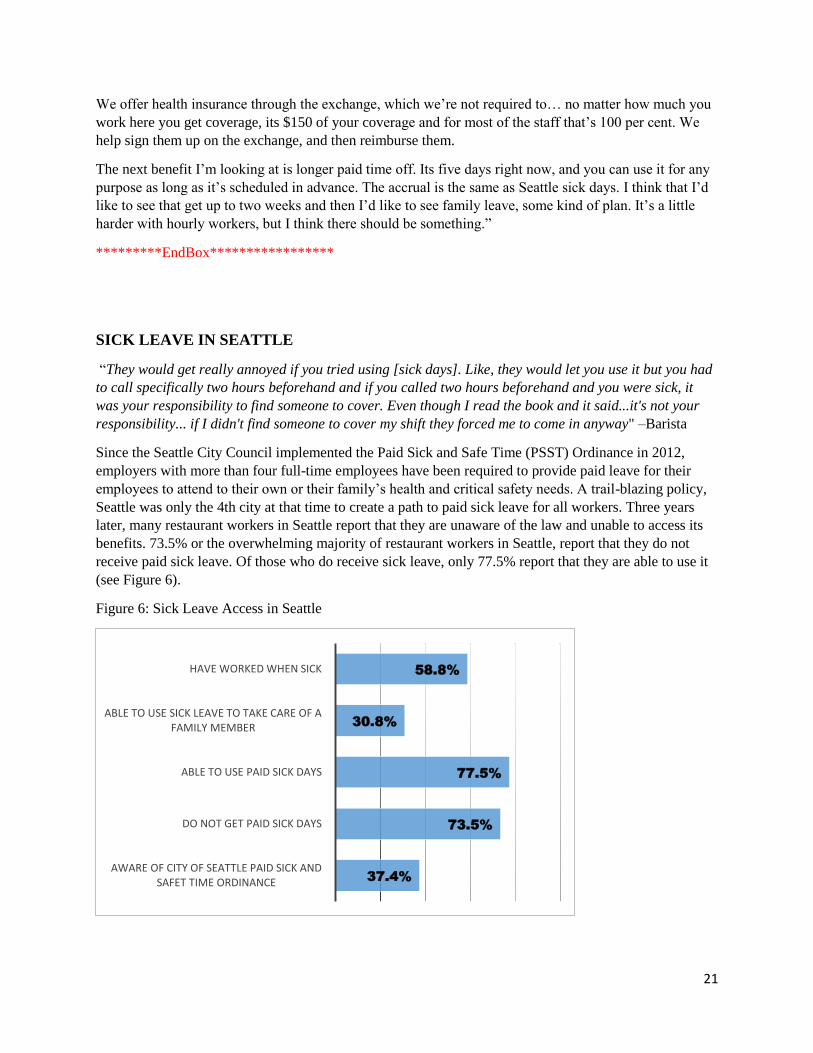
benefits. 73.5% or the overwhelming majority of restaurant workers in Seattle, report that they do not
receive paid sick leave. Of those who do receive sick leave, only 77.5% report that they are able to use it
(see Figure 6).
Figure 6: Sick Leave Access in Seattle
37.4%
73.5%
77.5%
30.8%
58.8%
AWARE OF CITY OF SEATTLE PAID SICK AND SAFET TIME ORDINANCE
DO NOT GET PAID SICK DAYS
ABLE TO USE PAID SICK DAYS
ABLE TO USE SICK LEAVE TO TAKE CARE OF A FAMILY MEMBER
HAVE WORKED WHEN SICK
22
Of those restaurant workers in Seattle who are aware of the law, many don’t recognize key aspects of its
provision such as that it also covers time needed for workers to tend to their families health needs. Only
30.8% of respondents reported that they were able to use sick leave to take care of a family member or
child. With so many restaurant workers showing no awareness of their legal right to paid sick leave, it
follows that many are coming into work sick. 58.8% of restaurant workers in Seattle reported that they’ve
worked while sick. 28.8% of those workers who went into work sick coughed or sneezed while handling
food. Other workers who went into work sick reported that their illness got worse or lasted longer and
they got other workers sick (see Table 9). As one worker recounted:
"The [managers] got really mad because I kept coughing on the line and I was like well I'm sick, I don't
have a choice! And they sent me home a couple of times and they seemed really pissed every time they
sent me home and I was like well, I don't like to call off because they get really mad if you call off….
They were really mad that I called off and the fact that I came in sick, [and] they didn't say anything
about [paid sick time]. - Line Cook
Restaurant workers reported that they prepared and served food while sick for a variety of reasons. 64.1%
reported that they couldn’t afford to take the day off without pay, even though financial support is one of
the key provisions of the Seattle PSST Ordinance. Nearly a third, or 28.6%, were concerned that they
could be fired or penalized. As evidence that many managers continue to require ill workers to find a
replacement for their shifts, 32.4% of restaurant workers who went into work sick reported that they went
in because they couldn’t get their shift covered. Despite PSST having been on the books for three years,
most restaurant workers don’t know about the law and even fewer have access to it.
Table 9: Consequences of going into work sick
Consequences of going to work sick for those who have
gone to work sick (Seattle):
‘Unable to complete the necessary tasks for work’ 15.4% ‘My illness got worse or lasted longer’ 37.5% ‘Coughed or sneezed while handling food’ 28.8% ‘I got other workers sick’ 36.5%
**BOX **
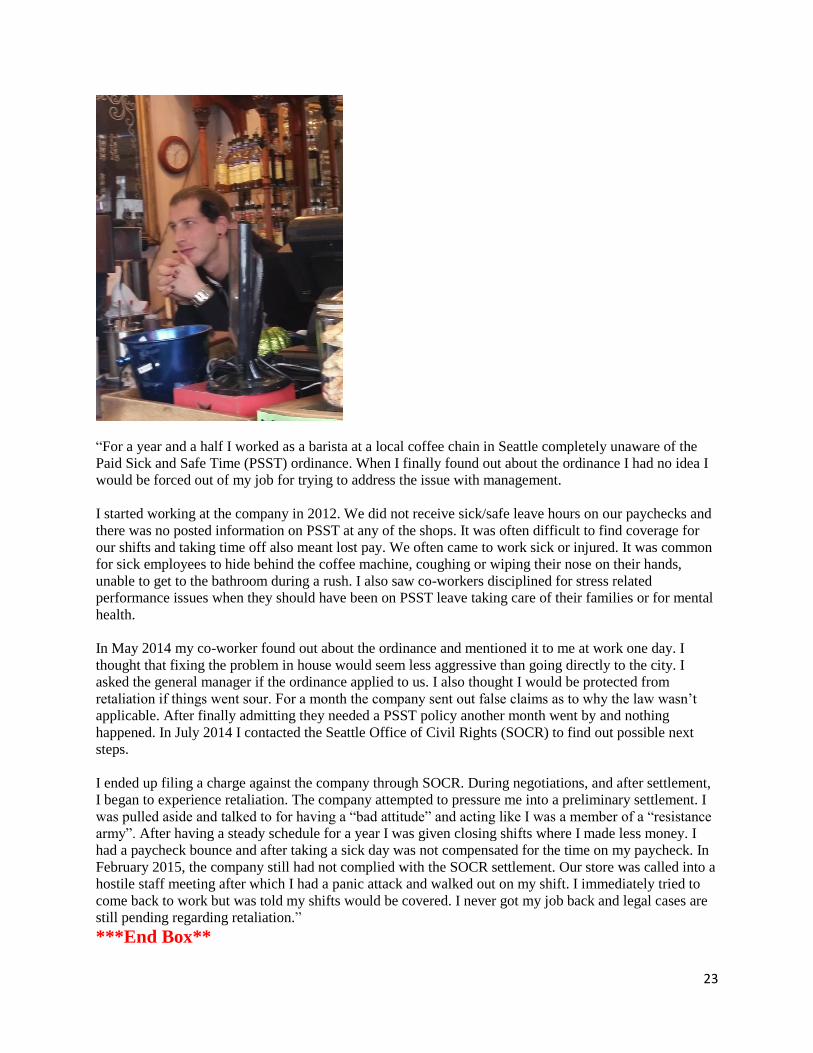
Graham: Barista
23
“For a year and a half I worked as a barista at a local coffee chain in Seattle completely unaware of the
Paid Sick and Safe Time (PSST) ordinance. When I finally found out about the ordinance I had no idea I
would be forced out of my job for trying to address the issue with management.
I started working at the company in 2012. We did not receive sick/safe leave hours on our paychecks and
there was no posted information on PSST at any of the shops. It was often difficult to find coverage for
our shifts and taking time off also meant lost pay. We often came to work sick or injured. It was common
for sick employees to hide behind the coffee machine, coughing or wiping their nose on their hands,
unable to get to the bathroom during a rush. I also saw co-workers disciplined for stress related
performance issues when they should have been on PSST leave taking care of their families or for mental
health.
In May 2014 my co-worker found out about the ordinance and mentioned it to me at work one day. I
thought that fixing the problem in house would seem less aggressive than going directly to the city. I
asked the general manager if the ordinance applied to us. I also thought I would be protected from
retaliation if things went sour. For a month the company sent out false claims as to why the law wasn’t
applicable. After finally admitting they needed a PSST policy another month went by and nothing
happened. In July 2014 I contacted the Seattle Office of Civil Rights (SOCR) to find out possible next
steps.
I ended up filing a charge against the company through SOCR. During negotiations, and after settlement,
I began to experience retaliation. The company attempted to pressure me into a preliminary settlement. I
was pulled aside and talked to for having a “bad attitude” and acting like I was a member of a “resistance
army”. After having a steady schedule for a year I was given closing shifts where I made less money. I
had a paycheck bounce and after taking a sick day was not compensated for the time on my paycheck. In
February 2015, the company still had not complied with the SOCR settlement. Our store was called into a
hostile staff meeting after which I had a panic attack and walked out on my shift. I immediately tried to
come back to work but was told my shifts would be covered. I never got my job back and legal cases are
still pending regarding retaliation.”
***End Box**
24
WORKING CONDITIONS
SCHEDULING
“The schedule is supposed to be done by Wednesday for the next week. Most often it was done by Friday,
so there wasn’t exactly time for you to plan anything. And the schedule could change wildly from one
week to the next, so one week I could be scheduled from 1pm to 8pm or something, and then the next it
could turn into 9am to 4pm. So it’s like you can’t plan because it’s never consistent.” –Barista
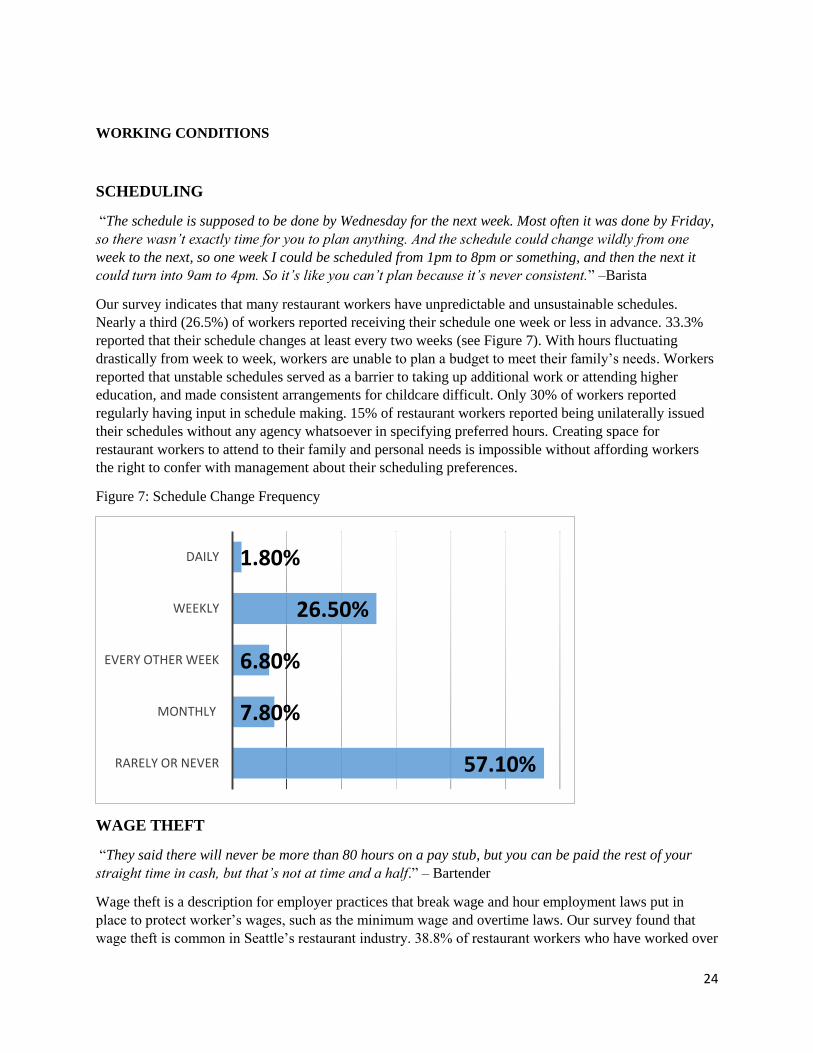
Our survey indicates that many restaurant workers have unpredictable and unsustainable schedules.
Nearly a third (26.5%) of workers reported receiving their schedule one week or less in advance. 33.3%
reported that their schedule changes at least every two weeks (see Figure 7). With hours fluctuating
drastically from week to week, workers are unable to plan a budget to meet their family’s needs. Workers
reported that unstable schedules served as a barrier to taking up additional work or attending higher
education, and made consistent arrangements for childcare difficult. Only 30% of workers reported
regularly having input in schedule making. 15% of restaurant workers reported being unilaterally issued
their schedules without any agency whatsoever in specifying preferred hours. Creating space for
restaurant workers to attend to their family and personal needs is impossible without affording workers
the right to confer with management about their scheduling preferences.
Figure 7: Schedule Change Frequency
WAGE THEFT
“They said there will never be more than 80 hours on a pay stub, but you can be paid the rest of your
straight time in cash, but that’s not at time and a half.” – Bartender
Wage theft is a description for employer practices that break wage and hour employment laws put in
place to protect worker’s wages, such as the minimum wage and overtime laws. Our survey found that
wage theft is common in Seattle’s restaurant industry. 38.8% of restaurant workers who have worked over
57.10%
7.80%
6.80%
26.50%
1.80%
RARELY OR NEVER
MONTHLY
EVERY OTHER WEEK
WEEKLY
DAILY

25
40 hours a week in the past 12 months reported not receiving the legally mandated overtime rate. One
worker that we interviewed suggested that to get overtime “you literally have to fight for it”, and added,
“I think there should be better monitoring on whether or not people are getting paid.” 20.5% of workers
reported working off the clock and 20.9% that they’ve worked more than eight hours without a paid break
(see Figure 8). 6% of tipped workers say management takes a share of their tips. Finally, 15.4% of
restaurant workers reported that they were required to purchase part or whole of their uniform cost.
Figure 8: Overtime & Off-the-Clock Violations
Employment law violations occurred unevenly between industry segments. Restaurant workers in fine
dining restaurants were about three times as likely as fast food workers to experience overtime violations,
work off the clock, or work more than 8 hours straight without a meal break (see Table 10).
Table 10: Employment Law Violations
Employment Law Violations Reported by Restaurant
Workers
Fine
Dining
Family
Style
Quick
Serve
Experienced overtime wage violations 23.20% 7.40% 8.10%
Worked off the clock without pay 43.90% 4.10% 13.50%
Management takes share of tips 14.70% 4.60% 4.70%
Worked more than 8 hours straight without a meal break 41.80% 6.20% 11.80%
HEALTH AND SAFETY VIOLATIONS
Our survey data revealed that restaurant workplaces often do not comply with regulations designed to
ensure the health and safety of workers. 13.5% of restaurant workers reported fire hazards such as
blocked doors or non-functioning fire extinguishers in the restaurant where they worked. 13.9% reported
that the cutting machines in their kitchen lacked guards and 16.3% that there were no mats on the floor to
prevent potential slips. 20.3% of restaurant workers surveyed have carried out assignments at work that
put their safety at risk.
38.80%
20.90%
20.50%
NOT PAID OVERTME IN THE PAST YEAR
WORKED MORE THAN 8 HOURS STRAIGHT WITHOUT A PAID BREAK
WORKED OFF-THE-CLOCK WITHOUT PAY IN THE PAST YEAR

26
The prevalence of health and safety hazards in restaurant workplaces is reflected in the rate of workplace
injuries reported by restaurant workers. On-the-job injuries are pervasive in Seattle area restaurants.
41.8% of the sample reported suffering work-related cuts, 29.6% had been burned on the job, and 30.6%
came into contact with toxic chemicals during the course of their work. 13.9% of restaurant workers
reported that they’ve slipped and injured themselves while at work (see Figure 9). To make matters
worse, 21.2% reported enduring chronic pain as a result of their work, particularly in their back and feet.
Back-of-the-House workers were more likely than Front-of-the-House workers to experience burns and
cuts, and to come into contact with toxic chemicals on the job (see Table 11).
Figure 9: Workplace Injuries
Table 11: Workplace Injuries by Occupation
Understaffing -defined as not having enough personnel to adequately run the restaurant without excessive
strain and stress on workers - existed in strong relation to on-the-job injuries and noncompliance with
health and safety regulations in our survey data. 88.3% of workers reported working when the restaurant
was understaffed in the past 12 months, while 86.3% reported performing several jobs at once. Alongside
this, 36.1% reported performing a job they were not trained for and 24.1% reported doing something due
to time pressure that might have harmed the health and safety of customers. Skeletal staffing pressures
workers in ways that add undue stress while endangering their health and safety as well as the well being
of customers.
UNFAIR APPLICATION OF DISCIPLINE
Many restaurant workers reported being disciplined more severely or often than their co-workers on the
basis of their race, gender, age, immigration status, or sexual orientation. Of those who experienced more
0.0%
10.0%
20.0%
30.0%
40.0%
50.0%
60.0%
70.0%
Slipped and injuredwhilst on the job
Have chronic paincaused or worsened
by the job
Came into contactwith toxic chemicals
while on the job
Repetitive motionfor over an hour a
day
All restaurants Understaffed restaurants
Workplace Injuries Front-of-the-House Back-of-the-House
Have been burned while on the job 15.5% 40.0%
Have been cut while on the job 37.1% 45.4%
Have come into contact with toxic chemicals 24.6% 35.2%
27
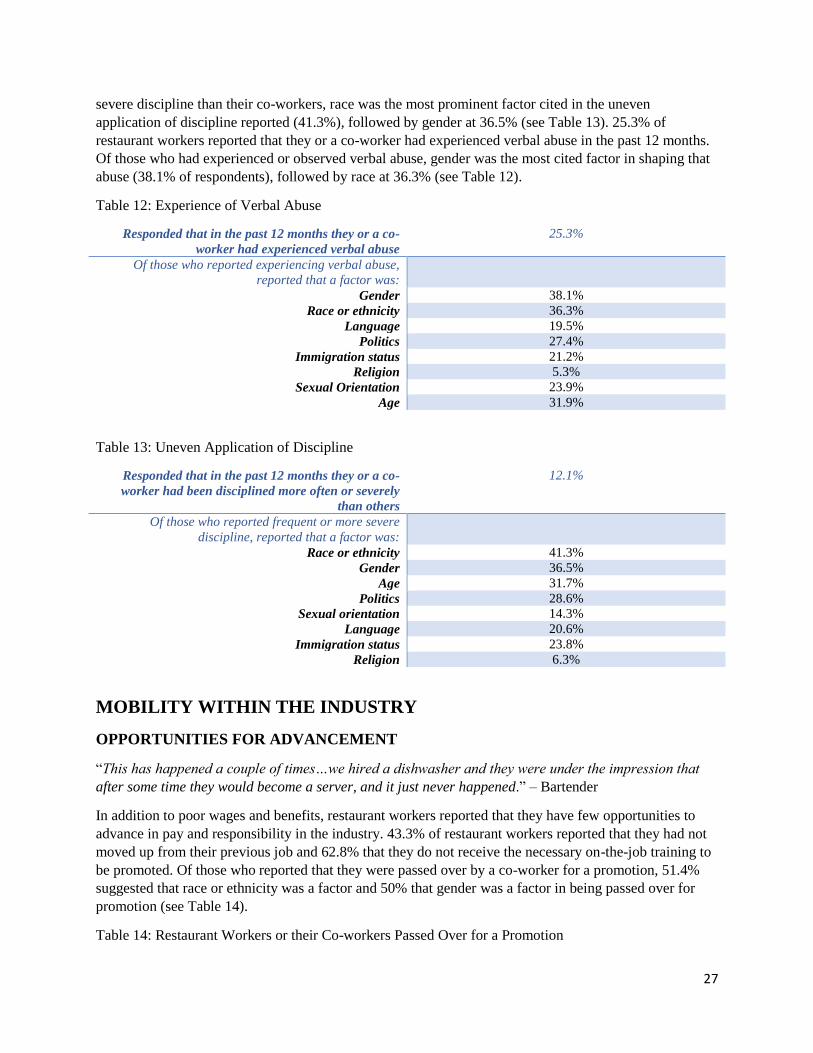
severe discipline than their co-workers, race was the most prominent factor cited in the uneven
application of discipline reported (41.3%), followed by gender at 36.5% (see Table 13). 25.3% of
restaurant workers reported that they or a co-worker had experienced verbal abuse in the past 12 months.
Of those who had experienced or observed verbal abuse, gender was the most cited factor in shaping that
abuse (38.1% of respondents), followed by race at 36.3% (see Table 12).
Table 12: Experience of Verbal Abuse
Responded that in the past 12 months they or a co-
worker had experienced verbal abuse
25.3%
Of those who reported experiencing verbal abuse,
reported that a factor was:
Gender 38.1%
Race or ethnicity 36.3%
Language 19.5%
Politics 27.4%
Immigration status 21.2%
Religion 5.3%
Sexual Orientation 23.9%
Age 31.9%
Table 13: Uneven Application of Discipline
Responded that in the past 12 months they or a co-
worker had been disciplined more often or severely
than others
12.1%
Of those who reported frequent or more severe
discipline, reported that a factor was:
Race or ethnicity 41.3%
Gender 36.5%
Age 31.7%
Politics 28.6%
Sexual orientation 14.3%
Language 20.6%
Immigration status 23.8%
Religion 6.3%
MOBILITY WITHIN THE INDUSTRY
OPPORTUNITIES FOR ADVANCEMENT
“This has happened a couple of times…we hired a dishwasher and they were under the impression that
after some time they would become a server, and it just never happened.” – Bartender
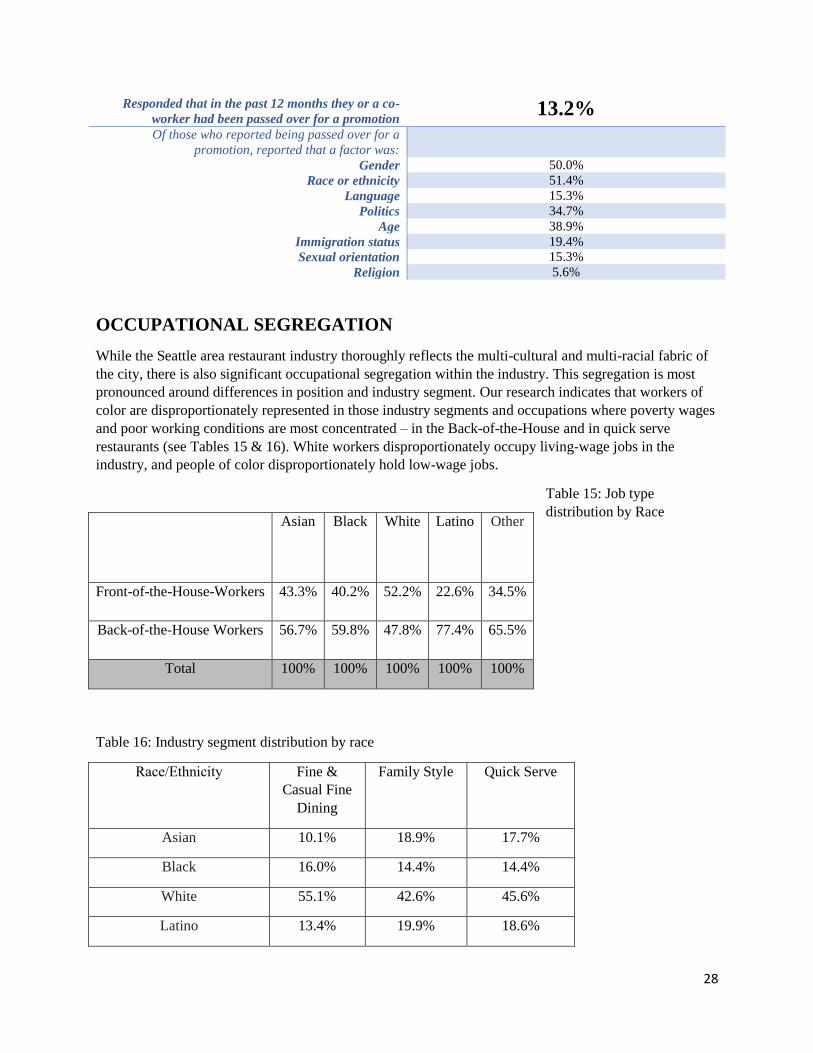
In addition to poor wages and benefits, restaurant workers reported that they have few opportunities to
advance in pay and responsibility in the industry. 43.3% of restaurant workers reported that they had not
moved up from their previous job and 62.8% that they do not receive the necessary on-the-job training to
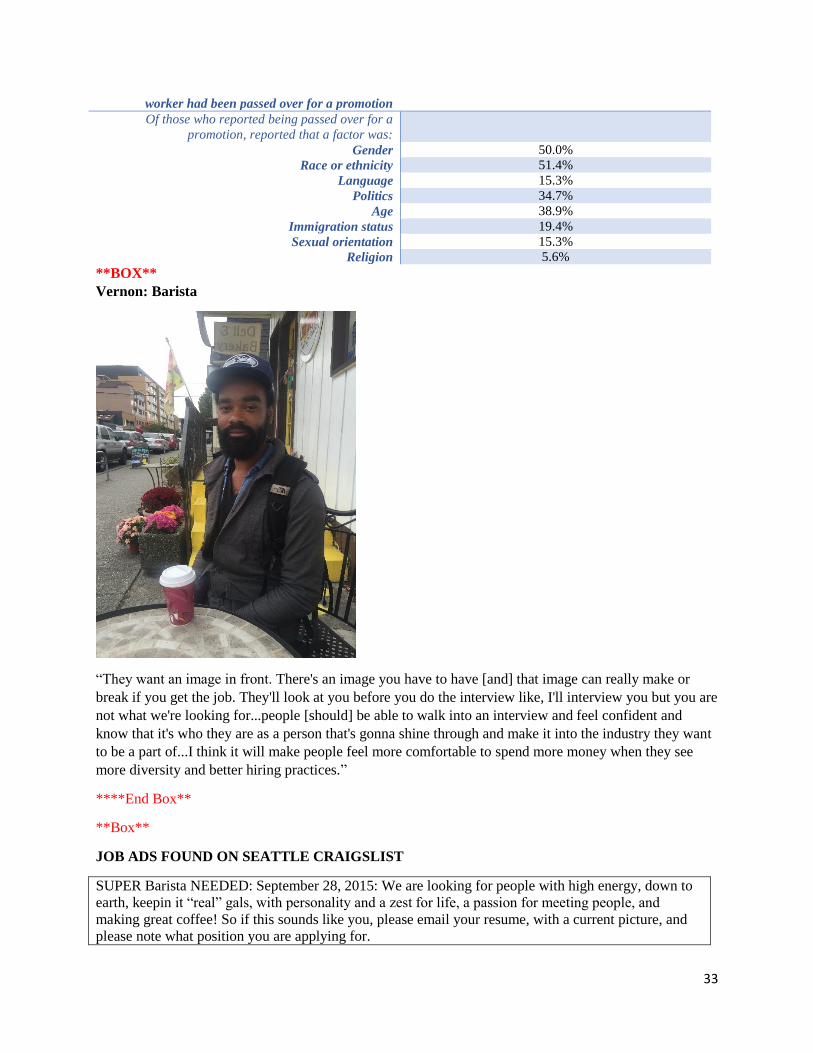
be promoted. Of those who reported that they were passed over by a co-worker for a promotion, 51.4%
suggested that race or ethnicity was a factor and 50% that gender was a factor in being passed over for
promotion (see Table 14).
Table 14: Restaurant Workers or their Co-workers Passed Over for a Promotion
28
Responded that in the past 12 months they or a co-
worker had been passed over for a promotion 13.2%
Of those who reported being passed over for a
promotion, reported that a factor was:
Gender 50.0%
Race or ethnicity 51.4%
Language 15.3%
Politics 34.7%
Age 38.9%
Immigration status 19.4%
Sexual orientation 15.3%
Religion 5.6%
OCCUPATIONAL SEGREGATION
While the Seattle area restaurant industry thoroughly reflects the multi-cultural and multi-racial fabric of
the city, there is also significant occupational segregation within the industry. This segregation is most
pronounced around differences in position and industry segment. Our research indicates that workers of
color are disproportionately represented in those industry segments and occupations where poverty wages
and poor working conditions are most concentrated – in the Back-of-the-House and in quick serve
restaurants (see Tables 15 & 16). White workers disproportionately occupy living-wage jobs in the
industry, and people of color disproportionately hold low-wage jobs.
Table 15: Job type
distribution by Race
Table 16: Industry segment distribution by race
Race/Ethnicity Fine &
Casual Fine
Dining
Family Style Quick Serve
Asian 10.1% 18.9% 17.7%
Black 16.0% 14.4% 14.4%
White 55.1% 42.6% 45.6%
Latino 13.4% 19.9% 18.6%
Asian
Black
White
Latino
Other
Front-of-the-House-Workers 43.3% 40.2% 52.2% 22.6% 34.5%
Back-of-the-House Workers 56.7% 59.8% 47.8% 77.4% 65.5%
Total 100% 100% 100% 100% 100%
29
Other 5.4% 4.2% 3.8%
Total 100% 100% 100%
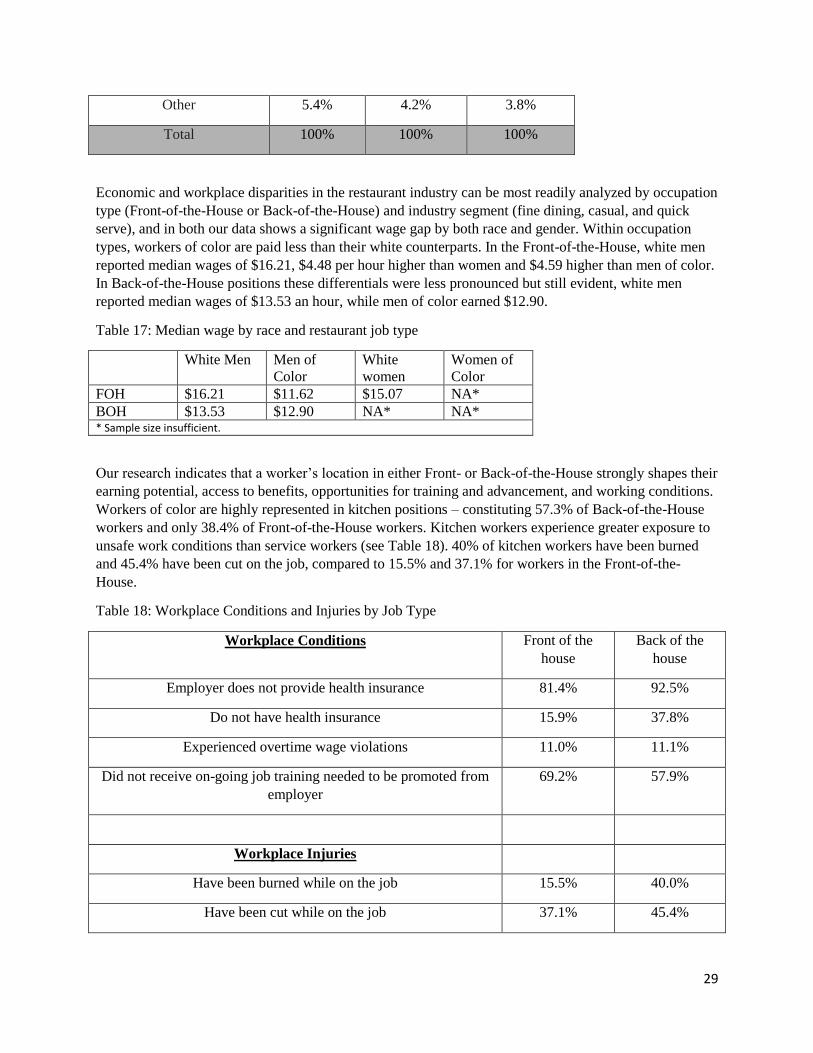
Economic and workplace disparities in the restaurant industry can be most readily analyzed by occupation
type (Front-of-the-House or Back-of-the-House) and industry segment (fine dining, casual, and quick
serve), and in both our data shows a significant wage gap by both race and gender. Within occupation
types, workers of color are paid less than their white counterparts. In the Front-of-the-House, white men
reported median wages of $16.21, $4.48 per hour higher than women and $4.59 higher than men of color.
In Back-of-the-House positions these differentials were less pronounced but still evident, white men
reported median wages of $13.53 an hour, while men of color earned $12.90.
Table 17: Median wage by race and restaurant job type
White Men Men of
Color
White
women
Women of
Color
FOH $16.21 $11.62 $15.07 NA*
BOH $13.53 $12.90 NA* NA* * Sample size insufficient.
Our research indicates that a worker’s location in either Front- or Back-of-the-House strongly shapes their
earning potential, access to benefits, opportunities for training and advancement, and working conditions.
Workers of color are highly represented in kitchen positions – constituting 57.3% of Back-of-the-House
workers and only 38.4% of Front-of-the-House workers. Kitchen workers experience greater exposure to
unsafe work conditions than service workers (see Table 18). 40% of kitchen workers have been burned
and 45.4% have been cut on the job, compared to 15.5% and 37.1% for workers in the Front-of-the-
House.
Table 18: Workplace Conditions and Injuries by Job Type
Workplace Conditions Front of the
house
Back of the
house
Employer does not provide health insurance 81.4% 92.5%
Do not have health insurance 15.9% 37.8%
Experienced overtime wage violations 11.0% 11.1%
Did not receive on-going job training needed to be promoted from
employer
69.2% 57.9%
Workplace Injuries
Have been burned while on the job 15.5% 40.0%
Have been cut while on the job 37.1% 45.4%
30
Have come into contact with toxic chemicals 24.6% 35.2%
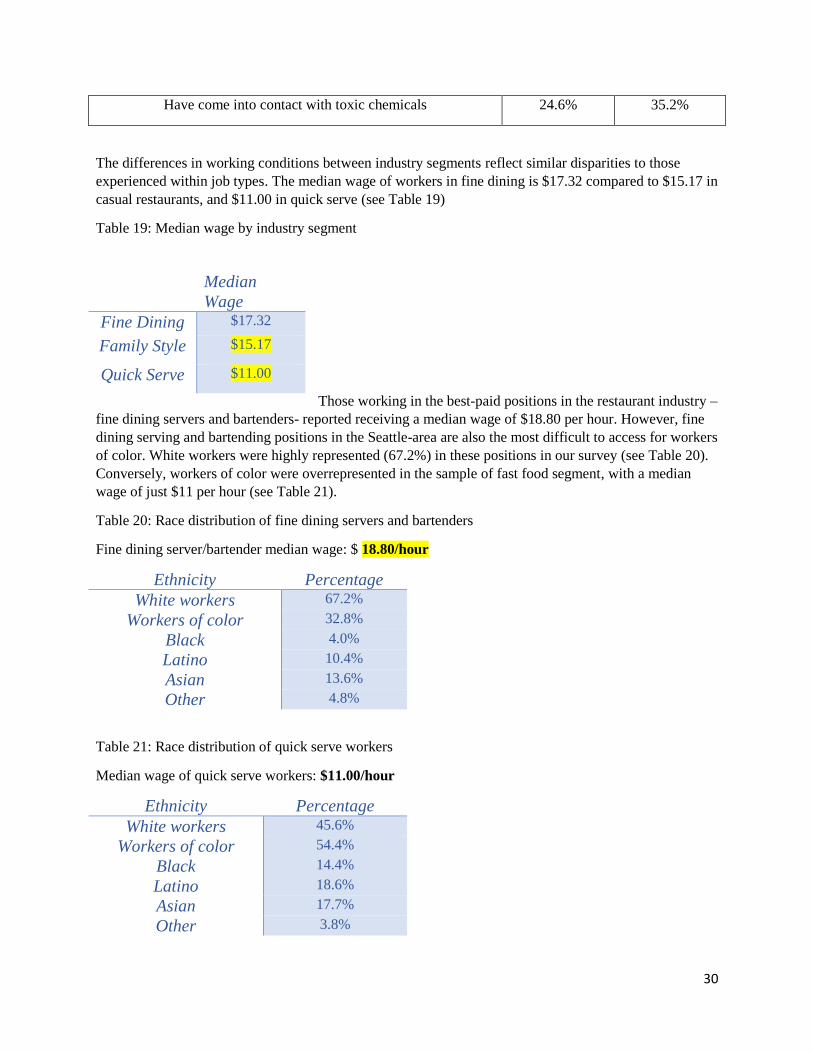
The differences in working conditions between industry segments reflect similar disparities to those
experienced within job types. The median wage of workers in fine dining is $17.32 compared to $15.17 in
casual restaurants, and $11.00 in quick serve (see Table 19)
Table 19: Median wage by industry segment
Those working in the best-paid positions in the restaurant industry –
fine dining servers and bartenders- reported receiving a median wage of $18.80 per hour. However, fine
dining serving and bartending positions in the Seattle-area are also the most difficult to access for workers
of color. White workers were highly represented (67.2%) in these positions in our survey (see Table 20).
Conversely, workers of color were overrepresented in the sample of fast food segment, with a median
wage of just $11 per hour (see Table 21).
Table 20: Race distribution of fine dining servers and bartenders
Fine dining server/bartender median wage: $ 18.80/hour
Ethnicity Percentage
White workers 67.2%
Workers of color 32.8%
Black 4.0%
Latino 10.4%
Asian 13.6%
Other 4.8%
Table 21: Race distribution of quick serve workers
Median wage of quick serve workers: $11.00/hour
Ethnicity Percentage
White workers 45.6%
Workers of color 54.4%
Black 14.4%
Latino 18.6%
Asian 17.7%
Other 3.8%
Median
Wage
Fine Dining $17.32
Family Style $15.17
Quick Serve $11.00
31
Disparities in pay and workplace conditions were equally evident when comparing the compensation of
men and women. Men working in the Front-of-the-House reported earning a median wage of $14.37
compared to women earning a median wage of $11.73 in the same positions. Male workers overall
reported earning a median wage of $13.40 per hour compared with female workers reporting earning
$13.12. Women restaurant workers as a whole are heavily represented in Front-of-the-House positions,
but are most concentrated in family-style restaurants as opposed to better-paying fine dining positions
(see Table 23). Only 39.3% of bartenders in the Seattle-area are women. As one bartender we interviewed
observed, “The best position is bartender by far. All the bartenders are white. We have 2 female
bartenders, the rest are male.” Women were the overwhelming majority of lower-paid Front-of-the-House
positions, 81.3% of Hosts were women, and 60.1% of counter attendants (including baristas and cashiers)
were women.
Table 22: Gender Distribution by job type
FOH BOH
Women 65.3% 41.3%
Men 33.1% 55.8%
Transgender 1.6% 2.9%
Table 23: Gender distribution by job type within fine dining and family style
Fine Dining Family Style Quick Serve
Men 77.4% 41.7% 49.2%
Women 22.6% 57.2% 48.4%
Transgender 0.0% 1.2% 2.4%
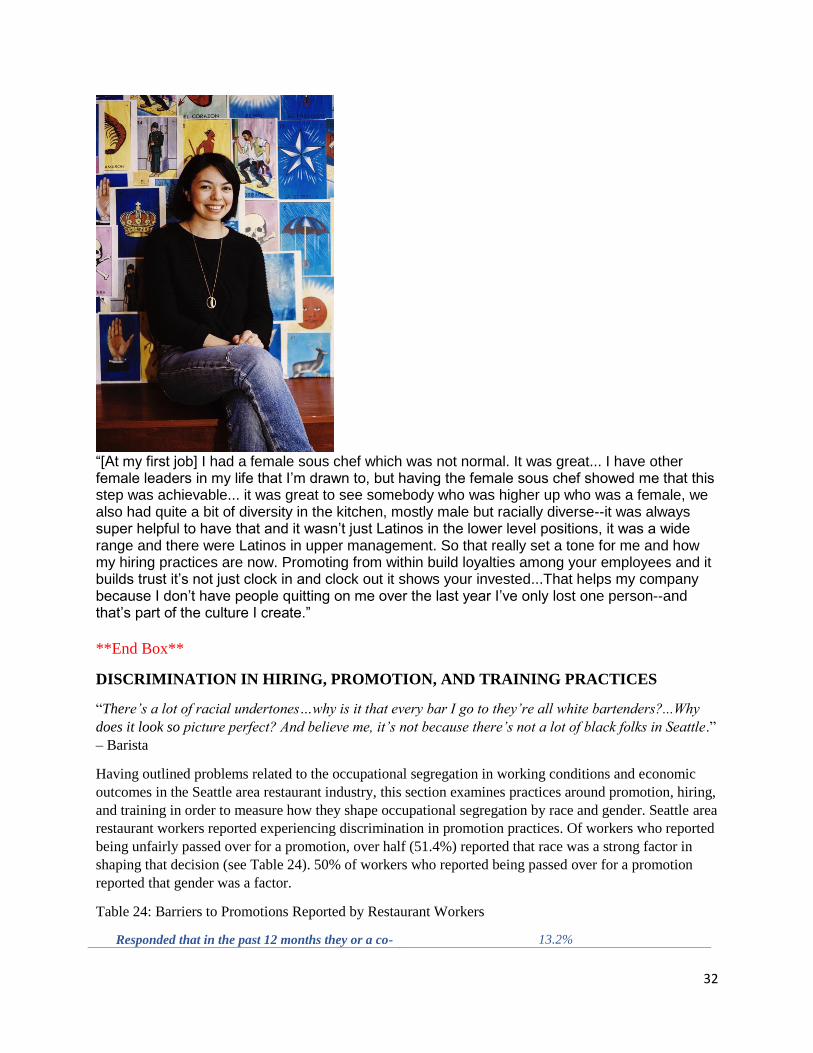
**Box** Monica Dimas, Owner of Tortas Condesa & Neon Taco
32
“[At my first job] I had a female sous chef which was not normal. It was great... I have other female leaders in my life that I’m drawn to, but having the female sous chef showed me that this step was achievable... it was great to see somebody who was higher up who was a female, we also had quite a bit of diversity in the kitchen, mostly male but racially diverse--it was always super helpful to have that and it wasn’t just Latinos in the lower level positions, it was a wide range and there were Latinos in upper management. So that really set a tone for me and how my hiring practices are now. Promoting from within build loyalties among your employees and it builds trust it’s not just clock in and clock out it shows your invested...That helps my company because I don’t have people quitting on me over the last year I’ve only lost one person--and that’s part of the culture I create.”
**End Box**
DISCRIMINATION IN HIRING, PROMOTION, AND TRAINING PRACTICES
“There’s a lot of racial undertones…why is it that every bar I go to they’re all white bartenders?...Why
does it look so picture perfect? And believe me, it’s not because there’s not a lot of black folks in Seattle.”
– Barista
Having outlined problems related to the occupational segregation in working conditions and economic
outcomes in the Seattle area restaurant industry, this section examines practices around promotion, hiring,
and training in order to measure how they shape occupational segregation by race and gender. Seattle area
restaurant workers reported experiencing discrimination in promotion practices. Of workers who reported
being unfairly passed over for a promotion, over half (51.4%) reported that race was a strong factor in
shaping that decision (see Table 24). 50% of workers who reported being passed over for a promotion
reported that gender was a factor.
Table 24: Barriers to Promotions Reported by Restaurant Workers
Responded that in the past 12 months they or a co- 13.2%
33
worker had been passed over for a promotion
Of those who reported being passed over for a
promotion, reported that a factor was:
Gender 50.0%
Race or ethnicity 51.4%
Language 15.3%
Politics 34.7%
Age 38.9%
Immigration status 19.4%
Sexual orientation 15.3%
Religion 5.6%
**BOX**
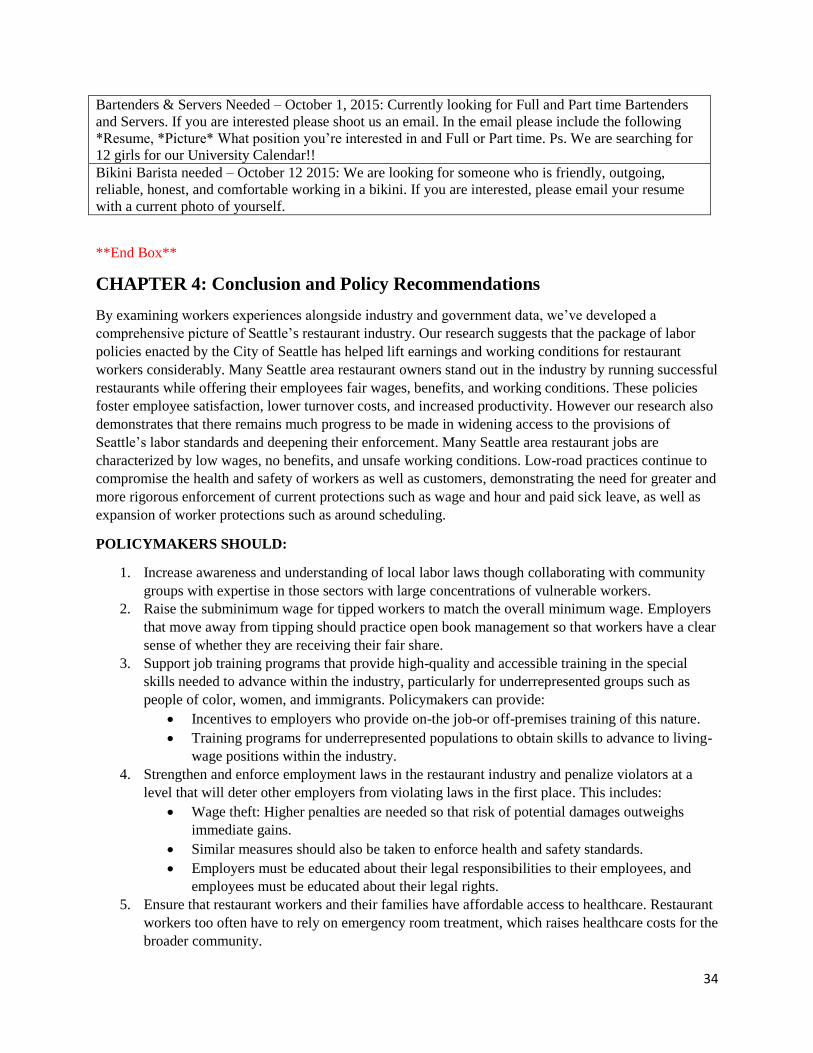
Vernon: Barista
“They want an image in front. There's an image you have to have [and] that image can really make or
break if you get the job. They'll look at you before you do the interview like, I'll interview you but you are
not what we're looking for...people [should] be able to walk into an interview and feel confident and
know that it's who they are as a person that's gonna shine through and make it into the industry they want
to be a part of...I think it will make people feel more comfortable to spend more money when they see
more diversity and better hiring practices.”
****End Box**
**Box**
JOB ADS FOUND ON SEATTLE CRAIGSLIST
SUPER Barista NEEDED: September 28, 2015: We are looking for people with high energy, down to
earth, keepin it “real” gals, with personality and a zest for life, a passion for meeting people, and
making great coffee! So if this sounds like you, please email your resume, with a current picture, and
please note what position you are applying for.
34
Bartenders & Servers Needed – October 1, 2015: Currently looking for Full and Part time Bartenders
and Servers. If you are interested please shoot us an email. In the email please include the following
*Resume, *Picture* What position you’re interested in and Full or Part time. Ps. We are searching for
12 girls for our University Calendar!!
Bikini Barista needed – October 12 2015: We are looking for someone who is friendly, outgoing,
reliable, honest, and comfortable working in a bikini. If you are interested, please email your resume
with a current photo of yourself.
**End Box**
CHAPTER 4: Conclusion and Policy Recommendations
By examining workers experiences alongside industry and government data, we’ve developed a
comprehensive picture of Seattle’s restaurant industry. Our research suggests that the package of labor
policies enacted by the City of Seattle has helped lift earnings and working conditions for restaurant
workers considerably. Many Seattle area restaurant owners stand out in the industry by running successful
restaurants while offering their employees fair wages, benefits, and working conditions. These policies
foster employee satisfaction, lower turnover costs, and increased productivity. However our research also
demonstrates that there remains much progress to be made in widening access to the provisions of
Seattle’s labor standards and deepening their enforcement. Many Seattle area restaurant jobs are
characterized by low wages, no benefits, and unsafe working conditions. Low-road practices continue to
compromise the health and safety of workers as well as customers, demonstrating the need for greater and
more rigorous enforcement of current protections such as wage and hour and paid sick leave, as well as
expansion of worker protections such as around scheduling.
POLICYMAKERS SHOULD:
1. Increase awareness and understanding of local labor laws though collaborating with community
groups with expertise in those sectors with large concentrations of vulnerable workers.
2. Raise the subminimum wage for tipped workers to match the overall minimum wage. Employers
that move away from tipping should practice open book management so that workers have a clear
sense of whether they are receiving their fair share.
3. Support job training programs that provide high-quality and accessible training in the special
skills needed to advance within the industry, particularly for underrepresented groups such as
people of color, women, and immigrants. Policymakers can provide:
Incentives to employers who provide on-the job-or off-premises training of this nature.
Training programs for underrepresented populations to obtain skills to advance to living-
wage positions within the industry.
4. Strengthen and enforce employment laws in the restaurant industry and penalize violators at a
level that will deter other employers from violating laws in the first place. This includes:
Wage theft: Higher penalties are needed so that risk of potential damages outweighs
immediate gains.
Similar measures should also be taken to enforce health and safety standards.
Employers must be educated about their legal responsibilities to their employees, and
employees must be educated about their legal rights.
5. Ensure that restaurant workers and their families have affordable access to healthcare. Restaurant
workers too often have to rely on emergency room treatment, which raises healthcare costs for the
broader community.
35
6. Protect workers from violations of federal, state, and local anti-discrimination and equal
employment opportunity laws.
Assist advocates engaged in anti-discrimination campaigns through intervention aimed at
encouraging employers to change their discriminatory practices. Additionally, by
increasing penalties against employers who violate anti-discrimination laws, legislators
can create a deterrent to such discrimination.
Ensure that employees understand their rights under anti-discrimination laws and make
enforcement of such laws within the restaurant industry a priority.
Adopt legislation that would provide incentives or require employers to provide regular,
ongoing sexual harassment training with all employees, including managers.
7. Enact legislation that would help workers cope with erratic scheduling.
Several states have passed reporting-time pay legislation, which requires employers to
pay workers for a few hours of their time when they report to work and are sent home
immediately.
Other policymakers have enacted protections against erratic and unreliable schedules by
requiring that employees receive their schedules with enough advanced notice to plan
their lives.
8. Publicly support collective organizing among restaurant workers.
9. Initiate and support further study and dialogue on occupational segregation and other areas where
more study is needed.
EMPLOYERS SHOULD:
1. Adopt systematic and fair hiring and promotions practices.
2. Adopt and clearly communicate policies and procedures, including anti-discrimination and
harassment policies, to protect the well being of all workers.
3. Clearly communicate to workers about their benefits, such as earned sick days.
4. Enhance job quality and employee retention by increasing wages and developing scheduling
practices that meet both employer and worker needs.
5. Learn techniques that successful restaurant employers use to implement livable wages, benefits,
scheduling control, and career ladders. ROC-Seattle can act as a resource to provide technical
assistance to employers.
CUSTOMERS SHOULD:
1. Support responsible restaurant owners who provide fair wages, benefits, and opportunities for
workers to advance. Many of these restaurants can be found in the Restaurant Opportunities
Centers’ National Diners’ Guide (www.rocunited.org/dinersguide).
2. Speak to employers every time you eat out and let them know you care about livable wages,
benefits, and opportunities for women and people of color to advance in the restaurant industry.
3. Where workers have filed legal charges against employers who are violating the law, call the
company and let them know that you will not support illegal practices.
WORKERS SHOULD:
1. Become involved in the Seattle restaurant worker movement. There are many opportunities for
involvement in worker-led committees, trainings and more.
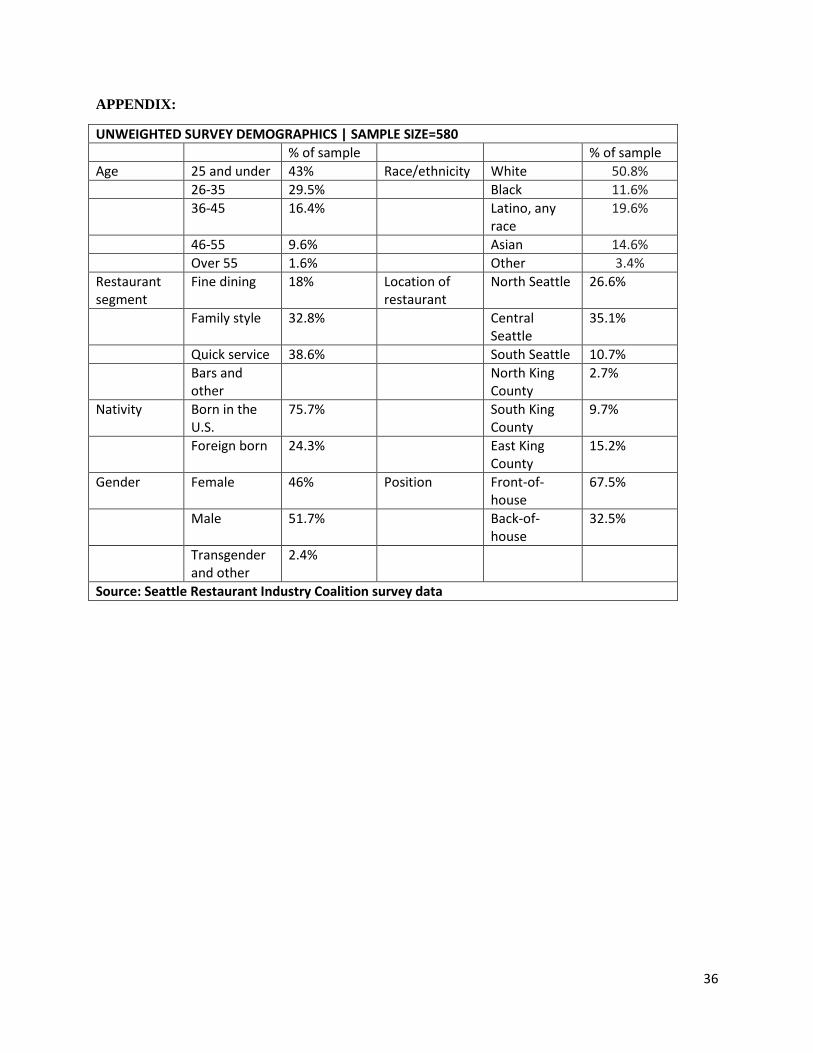
36
APPENDIX:
UNWEIGHTED SURVEY DEMOGRAPHICS | SAMPLE SIZE=580
% of sample % of sample
Age 25 and under 43% Race/ethnicity White 50.8%
26-35 29.5% Black 11.6%
36-45 16.4% Latino, any race
19.6%
46-55 9.6% Asian 14.6%
Over 55 1.6% Other 3.4%
Restaurant segment
Fine dining 18% Location of restaurant
North Seattle 26.6%
Family style 32.8% Central Seattle
35.1%
Quick service 38.6% South Seattle 10.7%
Bars and other
North King County
2.7%
Nativity Born in the U.S.
75.7% South King County
9.7%
Foreign born 24.3% East King County
15.2%
Gender Female 46% Position Front-of-house
67.5%
Male 51.7% Back-of-house
32.5%
Transgender and other
2.4%
Source: Seattle Restaurant Industry Coalition survey data
37
ACKNOWLEDGMENTS
NOTES
iBureau of Labor Statistics, “Quarterly Census of Employment and Wages 2004-2014.” Accessed October
15, 2015. Available at: http://data.bls.gov/oes.
ii Ibid. iii Bureau of Labor Statistics, “2012 Economic Census.”Accessed October 15, 2015. Available at http://www.census.gov/econ/. iv Business license data accessed from the City of Seattle at http://www.seattle.gov/licenses/find-a-business, historical business license data obtained through Webarchive at https://web.archive.org/web/20140321225147/http://www.seattle.gov/licenses/find-a-business. v Bureau of Labor Statistics, Current Employment Statistics, 2005-2014. Available at
http://www.bls.gov/ces. vi Ibid. Estimate uses 6.5% sales tax for the state and 3% for the city. vii US Census, North American Industry Classification System, 2015. viii Bureau of Labor Statistics, “Quarterly Census of Employment and Wages 2004-2014.” Accessed October 15, 2015. Available at: http://data.bls.gov/oes. ix Ibid. x ROC United analysis of American Community Survey (2010-2013)for King County, WA (2010-
2013). Ruggles, Steven, Alexander J. Trent, Genadek Katie, Goeken Ronald, Schroeder Matthew
B., and Soebek Matthew, Integrated Public Use Microdata Series: Version 5.0 [Machine-
readable database], (Minneapolis: Minnesota Population Center, 2010). xi Ibid. xii Ibid. xiii Ibid. xiv Ibid. xv Bureau of Labor Statistics, Occupational Employment Statistics, 2014. Accessed October 15, 2015. Available at http://www.bls.gov/cps. xvi United States Department of Labor Employment & Training Administration, “Lower Living Standard Income Level (LLSIL) Guideline.” Accessed October 2, 2015, http://www.doleta.gov/llsil/2015/LLSIL_2015_FRN.pdf. xvii Livable wage is calculated using the Economic Policy Institute’s (EPI) Basic Family Budget Calculator for a family of three in Seattle, Accessed October 2, 2015, http://www.epi.org/resources/budget/ xviii Business license data accessed from the City of Seattle at http://www.seattle.gov/licenses/find-a-business, historical business license data obtained through Webarchive at https://web.archive.org/web/20140321225147/http://www.seattle.gov/licenses/find-a-business.
38
xix Steward, Jeanine. “Apocalypse Not: $15 and the cuts that never came.” Puget Sound Business Journal (October 2015). Accessed October 23, 2015. http://www.bizjournals.com/seattle/print-edition/2015/10/23/apocolypse-not-15-and-the-cuts-that-never-came.html xx Bolton, Megan, Elina Bravve, Emily Miller, Sheila Crowley, Ellen Errico. “Out of Reach 2015: America’s Forgotten Housing Crisis.” National Low Income Housing Coalition (2012): 1-264. Accessed October 15, 2015. http://nlihc.org/sites/default/files/oor/OOR_2015_FULL.pdf xxi Ibid. xxii Seattle Paid Sick and Safe Time Ordinance Accessed October 15, 2015. Available at: http://www.seattle.gov/civilrights/labor-standards/paid-sick-and-safe-time xxiii Ibid.