block diagram of a mass spectrometer - university of...
TRANSCRIPT

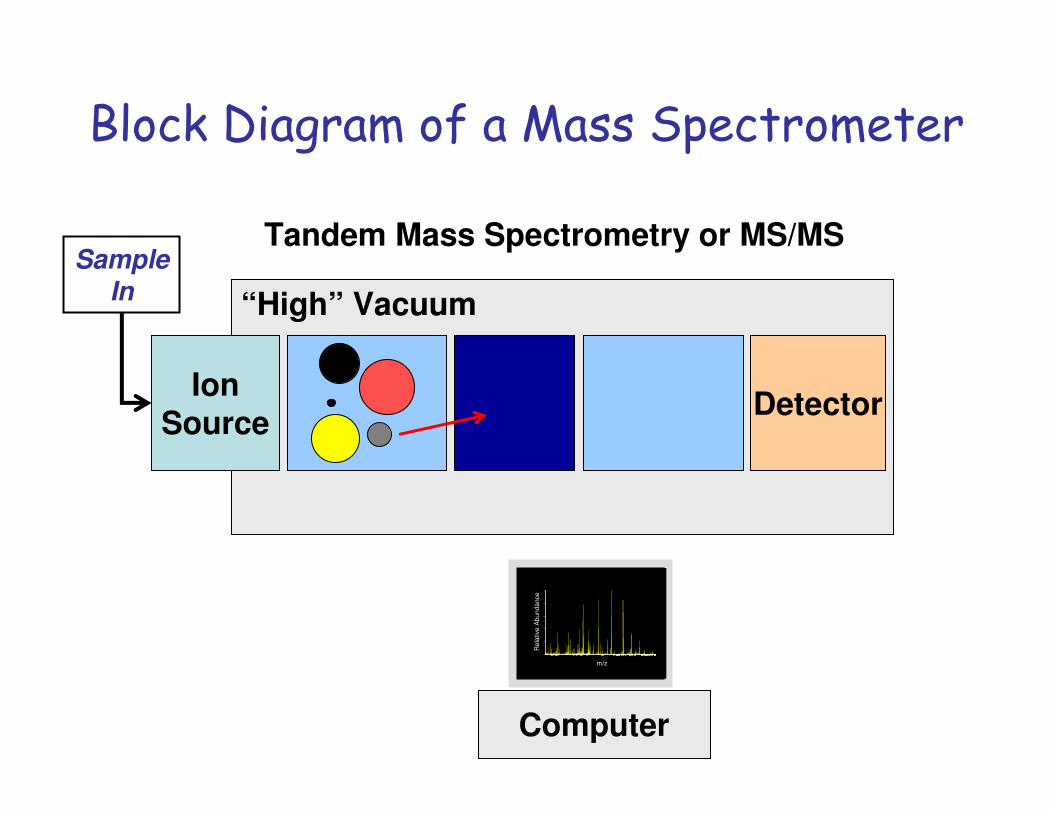
Block Diagram of a Mass Spectrometer
IonSource
Mass Analyzer Detector
“High” Vacuum
SampleIn
Computer
400 600 800 1000 1200 1400 1600 1800m/z
0
20
40
60
80
100
Re
lative
Ab
un
da
nce

Mechanism of Electrospray Ionization (ESI)
+ -++
+
++ +
+
+ +
+-
--
+ +
+ +
-+
+
++ +
+ -+ +
+
-
++
+
+ +
+ ++ -
+ ++
-
++
++ +
++
+
-++
+-
++
+++
+ ++
-
++
+
++ -
++
++
-
+
+
++ +
++ +
++ +
++ ++ + +
Charged
Capillary
Needle
Heated
Capillary
+3-8 kV
Taylor cone Rayleigh
limit hit:
Coulombic
explosion

ESI-MS Spectrum of Horse Apomyoglobin
ApomyoglobinMW=16,951.2
+18
+20
+16 +14
+12
+10+22
m/z

ESI-MS Spectrum of Bovine Serum Albumin
AlbuminMW=66,621
+41
+52
+34
m/z

Block Diagram of a Mass Spectrometer
IonSource
MassAnalyzer
Detector
“High” Vacuum
SampleIn
Computer
400 600 800 1000 1200 1400 1600 1800m/z
0
20
40
60
80
100
Re
lative
Ab
un
da
nce
MassAnalyzer
Activation
orReaction
Tandem Mass Spectrometry or MS/MS
Block Diagram of a Mass Spectrometer
IonSource
Detector
“High” Vacuum
SampleIn
Computer
400 600 800 1000 1200 1400 1600 1800m/z
0
20
40
60
80
100
Re
lative
Ab
un
da
nce
Tandem Mass Spectrometry or MS/MS

Block Diagram of a Mass Spectrometer
IonSource
Detector
“High” Vacuum
SampleIn
Computer
Tandem Mass Spectrometry or MS/MS
m/z

S Q H L F A P I S E K
200 400 600 800 1000 12000
20
40
60
80
100
Re
lative
Abu
dan
ce
m/z

S Q
H L
F A
P I S
E K
147
276
363
477
574
645
792
905
1042
1170 216
353
467
614
685
782
895
982
1111
200
40
06
00
800
100
01
20
00
20
40
60
80
10
0
Relative Abudance
m/z
881111
1042
905
982
792895
685644
M-NH3
574
1042 / 2
467
353
200 400 600 800 1000 1200 14000
10
20
30
40
50
Rela
tive A
bundance
m/z
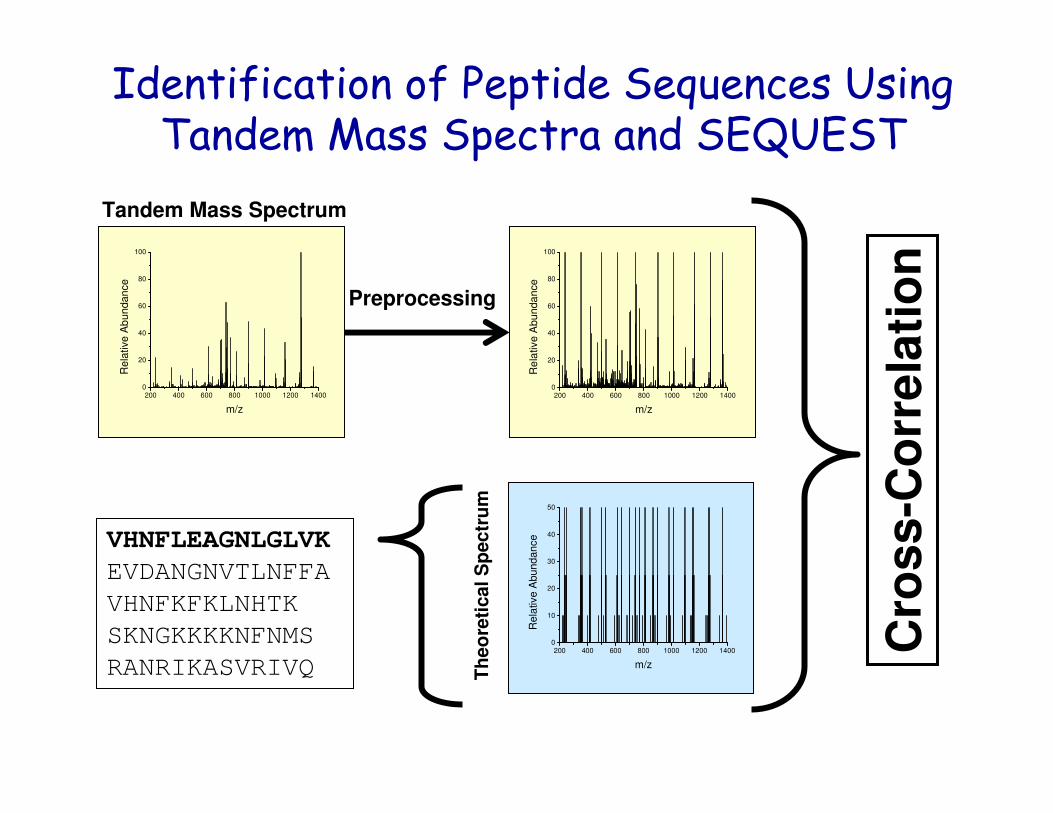
Identification of Peptide Sequences Using Tandem Mass Spectra and SEQUEST
200 400 600 800 1000 1200 14000
20
40
60
80
100
Rela
tive A
bundance
m/z
Tandem Mass Spectrum
Preprocessing
200 400 600 800 1000 1200 14000
20
40
60
80
100
Re
lative A
bunda
nce
m/z
VHNFLEAGNLGLVK
EVDANGNVTLNFFA
VHNFKFKLNHTK
SKNGKKKKNFNMS
RANRIKASVRIVQ Th
eo
reti
cal S
pectr
um
Cro
ss
-Co
rre
lati
on

Data Dependant Acquisition
Is Intensity >
Threshold
Full Scan
380-2000 m/z
Isolate m/z and
Acquire MS/MS
Add Mass to
Mass List
Is Ion
Present In
Mass List
No
No
Yes
Yes
Yates et al. Anal Chem, 67, 1426 (1995)
Stahl et al. JASMS, 7, 532 (1996)

Proteomics: Traditional
Technology
Characterize peptides by mass spectrometry
N
C
CN
2D Gel 1D Gel

µLC
Ab
un
da
nc
e
Time
Ab
un
da
nc
e
Time
Shotgun Proteomics
Protein
Mixture
proteolysis
Peptide
MixtureA
bu
nd
an
ce
m/z
Ab
un
da
nc
e
m/z
MS
MS/MS1
Ab
un
da
nc
e
m/z
Ab
un
da
nc
e
m/z
1
2
Ab
un
da
nc
e
m/z
Ab
un
da
nc
e
m/z
2
3
Ab
un
da
nc
e
m/z
Ab
un
da
nc
e
m/z
3

Shotgun Characterization of Protein Mixtures
C. elegans
Extract Protein Mixture
Denature
Digest into Small Peptides

Measurement of Peptides by Microcapillary Liquid Chromatography Tandem Mass Spectrometry
Traditional Chromatography Column
Microcapillary Chromatography Column

Measurement of Peptides by Microcapillary Liquid Chromatography Tandem Mass Spectrometry
Traditional Chromatography Column
Microcapillary Chromatography Column
Peptide Mixture
Time
Abund
ance
Peptides are loaded onto the column
and separated by liquid chromatography
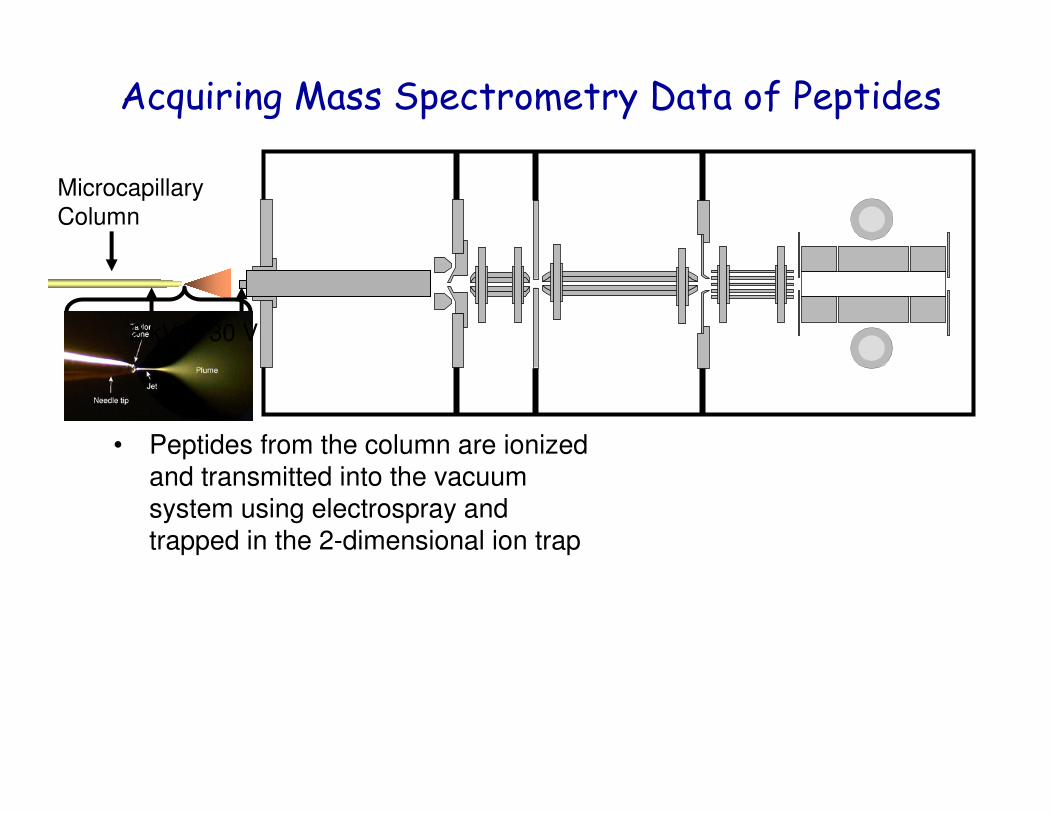
Acquiring Mass Spectrometry Data of Peptides
• Peptides from the column are ionized and transmitted into the vacuum system using electrospray and trapped in the 2-dimensional ion trap
Microcapillary
Column
2 kV 30 V

m/z
Abund
ance
• Peptides from the column are ionized and transmitted into the vacuum system using electrospray and trapped in the 2-dimensional ion trap
• Ions are selectively ejected radially by their m/z to produce a mass spectrum
• The instrument data-system automatically selects a m/z for further analysis
Selected m/z
Acquiring Mass Spectrometry Data of Peptides

Acquiring a Fragmentation Spectrum
• The trap is then refilled

• The trap is then refilled
• All ions are ejected from the trap except the predetermined m/z
• The energy of the isolated ion is increased resulting in collisions with the helium gas in the trap
Acquiring a Fragmentation Spectrum

m/z
Abund
ance
• The collisions with the helium molecules result in structure specific fragment ions
• The fragment ions are then selectively ejected to produce a tandem mass spectrum
Acquiring a Fragmentation Spectrum

Ab
un
da
nc
e
m /z
Ab
un
da
nce
m/z
Ab
un
da
nc
e
m/z
Mass Spectrum
Ab
un
da
nce
m /z
Review
1. Acquire mass spectrum
2. Select precursors for tandem mass spectrometry
3. Selectively isolate and fragment precursor ions.
4. Repeat for 3 different precursor ions
1 2 3 Tandem Mass Spectra of Peptides
1 to 2 Seconds per cycle

Spectrum Identification
Database: fasta file
…Beowulf Computer Cluster
SEQUESTPeptide ID list
Ab
un
da
nc
e
m/z
Ab
un
da
nc
e
m/z
Ab
un
da
nc
e
m/z
Ab
un
da
nc
e
m/z
Ab
un
da
nc
e
m/z
Ab
un
da
nc
e
m/z
>MEKK1 (kinase)MDRILARMKKSTRRGGDKNITPVRRLERR…
>ATMKK5 (kinase kinase)MKPIQSPSGVASPMKNRLRKRPDLSPPLPHRDVALAVLP…
MS/MS spectra
ID proteins
from peptides…
Scan1 0.7 EGSSDEEVP…
Scan1 0.3 TFAEILNPI…
Scan1 0.2 ARFDLNNHD…
-------------------
Scan2 0.5 EDEESIRAV…
Scan2 0.2 WLGDDCFMV…
Scan2 0.1 IDRAAWKAV…
-------------------
Scan3 0.2 EITTRDMGN…
Scan3 0.1 GRNMCTAKL…

>MEKK1 (kinase)MDRILARMKKSTRRGGDKNITPVRRLERR…
>ATMKK5 (kinase kinase)MKPIQTFAEILNPITWRNRLRKRPDLSPPLPHRDVALAVP…
Spectrum Identification
Database: fasta file
SEQUESTPeptide ID list
Ab
un
da
nc
e
m/z
Ab
un
da
nc
e
m/z
Ab
un
da
nc
e
m/z
Ab
un
da
nc
e
m/z
Ab
un
da
nc
e
m/z
Ab
un
da
nc
e
m/z
MS/MS spectra
TFAEILNPITWR
score = 0.3
Scan1 0.7 EGSSDEEVP…
Scan1 0.3 TFAEILNPI…
Scan1 0.2 ARFDLNNHD…
-------------------
Scan2 0.5 EDEESIRAV…
Scan2 0.2 WLGDDCFMV…
Scan2 0.1 IDRAAWKAV…
-------------------
Scan3 0.2 EITTRDMGN…
Scan3 0.1 GRNMCTAKL…
z = 2, m/z = 720.6
mass = 1441.2


MudPIT
• 100 µm i.d. fuse silica
Link et al, Nat Biotech (1999)
Washburn, Wolters, Yates, Nat Biotech (2001)

• 100 µm i.d. fuse silica
• Tip is pulled to ~5 µm I.D.
MudPIT

• 100 µm i.d. fuse silica
• Tip is pulled to ~5 µm I.D.
• Pack with C18 material 1st
MudPIT

• 100 µm i.d. fuse silica
• Tip is pulled to ~5 µm I.D.
• Pack with C18 material 1st
• Pack with SCX material 2nd
MudPIT

• 100 µm i.d. fuse silica
• Tip is pulled to ~5 µm I.D.
• Pack with C18 material 1st
• Pack with SCX material 2nd
• Peptide digest is loaded off-
line
MudPIT

• 100 µm i.d. fuse silica
• Tip is pulled to ~5 µm I.D.
• Pack with C18 material 1st
• Pack with SCX material 2nd
• Peptide digest is loaded off-
line
MudPIT

Multidimensional Protein Identification Technology (MudPIT)
MudPIT Column

2 kV RP-C18SCX
HPLC
H2O MeCN NH4OAc
waste
~200 nl/min
MudPIT

2 kV RP-C18SCX
HPLC
H2O MeCN NH4OAc
waste
• Step 1 – Reverse Phase Gradient
MudPIT

2 kV RP-C18SCX
HPLC
H2O MeCN NH4OAc
waste
• Step 1 – Reverse Phase Gradient
• Step 2 – Salt Pulse
MudPIT

2 kV RP-C18SCX
HPLC
H2O MeCN NH4OAc
waste
• Step 1 – Reverse Phase Gradient
• Step 2 – Salt Pulse
• Step 3 – Reverse Phase Gradient
MudPIT

2 kV RP-C18SCX
HPLC
H2O MeCN NH4OAc
waste
• Step 1 – Reverse Phase Gradient
• Step 2 – Salt Pulse
• Step 3 – Reverse Phase Gradient
• Step 4 – Increase Salt Pulse
• Repeat
MudPIT

µLC/µLC/MS/MS of C. elegans Peptides
1 2 3 4
5 6 7 8
9 10 11 12
MS/MS Spectra: 280290
Peptides Identified: 2753
Proteins IdentifiedWith >95% Confidence: 941
RT: 0.00 - 120.00
0 10 20 30 40 50 60 70 80 90 100 110
Time (min)
0
5
10
15
20
25
30
35
40
45
50
55
60
65
70
75
80
85
90
95
100
Rela
tive
Abu
nda
nce
29.49 34.93
45.53
10.6110.87
11.41
27.34 57.6227.05
35.40
38.8222.90
0.15
40.90
64.17
12.66
48.81 57.088.65
3.65 50.73
114.8864.50
71.3165.67
71.71 114.5877.60 81.56 111.5686.77 100.89
90.15 101.37
NL: 4.86E7
Base Peak F: ITMS + c ESI Full ms [ 400.00-1400.00] MS 061504-worm-trizol-urea-15n-J1-01
RT: 0.00 - 120.03
0 10 20 30 40 50 60 70 80 90 100 110 120
Time (min)
0
5
10
15
20
25
30
35
40
45
50
55
60
65
70
75
80
85
90
95
100
Re
lative
Abu
nd
ance
37.18
37.40
48.33
48.73
21.24
37.8065.92
21.6220.86
66.11
44.58
71.1738.0757.06
75.9263.93
39.8530.48 60.44 80.17
29.14
24.33 52.83 84.50
109.8384.9720.07 111.475.5286.15 108.71
18.715.824.78 88.49 104.8814.237.32
NL: 3.00E7
Base Peak F: ITMS + c ESI Full ms [ 400.00-1400.00] MS 061504-worm-trizol-urea-15n-J1-02
RT: 0.00 - 120.02
0 10 20 30 40 50 60 70 80 90 100 110 120
Time (min)
0
5
10
15
20
25
30
35
40
45
50
55
60
65
70
75
80
85
90
95
100
Re
lative
Abu
nd
ance
42.9723.31
39.00
36.26
61.04
35.84
61.28
27.2560.66
50.54
50.7030.3549.91
20.24
57.01 66.73
56.64 96.28
13.31 76.4167.3177.0677.30
87.4478.7567.65 87.616.45 14.31
97.84102.416.13 109.82
4.32
NL: 3.22E7
Base Peak F: ITMS + c ESI Full ms [ 400.00-1400.00] MS 061704-worm-trizol-urea-15n-H-03
RT: 0.00 - 120.04
0 10 20 30 40 50 60 70 80 90 100 110 120
Time (min)
0
5
10
15
20
25
30
35
40
45
50
55
60
65
70
75
80
85
90
95
100
Re
lative
Abu
nd
ance
30.7933.70
34.49
46.8046.31
37.27
47.31
29.7544.78
44.64 49.4129.29
51.1513.96
71.99
19.61 39.2424.01
72.1656.7697.16
96.6065.30 75.799.7298.028.06 64.83
78.22 98.2061.7983.826.34
93.8385.68
98.7999.263.80
103.52 110.00
NL: 3.90E7
Base Peak F: ITMS + c ESI Full ms [ 400.00-1400.00] MS 061704-worm-trizol-urea-15n-H-04
RT: 0.00 - 120.02
0 10 20 30 40 50 60 70 80 90 100 110 120
Time (min)
0
5
10
15
20
25
30
35
40
45
50
55
60
65
70
75
80
85
90
95
100
Re
lative
Abu
nd
ance
42.83
42.54
43.19
33.70
28.87
37.98
57.48
57.88
61.2944.0519.65 26.08 65.47 73.3725.909.47 56.2445.17 73.88
54.734.06 18.81 23.89 93.3574.1367.81 90.55112.8494.0486.6578.16 100.45
NL: 4.86E7
Base Peak F: ITMS + c ESI Full ms [ 400.00-1400.00] MS 061704-worm-trizol-urea-15n-H-05
RT: 0.00 - 120.04
0 10 20 30 40 50 60 70 80 90 100 110 120
Time (min)
0
5
10
15
20
25
30
35
40
45
50
55
60
65
70
75
80
85
90
95
100
Re
lative
Abu
nd
ance
34.47
34.71
33.94
35.07
40.17
32.53
40.54
30.97 88.67
30.68 88.4911.2461.0741.29 56.73
89.0614.73 88.1746.97
15.03 54.9723.148.13 73.837.92 76.1268.6318.36 89.2448.25 68.27 96.654.08 84.68
62.67 93.26 111.27100.0377.12112.18101.87
113.49
NL: 3.59E7
Base Peak F: ITMS + c ESI Full ms [ 400.00-1400.00] MS 061704-worm-trizol-urea-15n-H-06
RT: 0.00 - 120.02
0 10 20 30 40 50 60 70 80 90 100 110 120
Time (min)
0
5
10
15
20
25
30
35
40
45
50
55
60
65
70
75
80
85
90
95
100
Re
lative
Abu
nd
ance
38.51
41.72
41.99
34.3811.36
86.8650.93 69.6220.35 49.28
52.92
69.9754.4472.76
56.25
56.74
68.9218.23 73.2160.5960.83
73.3932.28 61.38
23.49 24.04 42.89 73.5967.11
79.9231.29
88.1092.9280.25
4.18 81.2693.48
99.03112.53100.76
NL: 1.44E7
Base Peak F: ITMS + c ESI Full ms [ 400.00-1400.00] MS 061704-worm-trizol-urea-15n-H-07
RT: 0.00 - 120.01
0 10 20 30 40 50 60 70 80 90 100 110 120
Time (min)
0
5
10
15
20
25
30
35
40
45
50
55
60
65
70
75
80
85
90
95
100
Re
lative
Abu
nd
ance
89.83
73.2348.03
73.70
89.47
90.2488.22
36.26
74.16
33.3338.43
69.9338.63
40.3432.7711.70
24.1917.71 40.82
19.59
59.25
80.6658.7941.3626.71
58.53 69.3680.99
49.99
50.3159.67
91.174.77 93.13
61.06 84.52 94.729.18 98.66 108.64108.02 108.95
100.80 110.93
NL: 1.39E7
Base Peak F: ITMS + c ESI Full ms [ 400.00-1400.00] MS 061704-worm-trizol-urea-15n-H-08
RT: 0.00 - 120.00
0 10 20 30 40 50 60 70 80 90 100 110 120
Time (min)
0
5
10
15
20
25
30
35
40
45
50
55
60
65
70
75
80
85
90
95
100
Re
lative
Abu
nd
ance
30.16
30.32
90.94
67.78
91.62
33.5567.63
74.33
92.0921.85
20.8740.24
40.6688.63
35.6288.4825.97
48.2911.83 59.53 108.9392.60
108.3411.6548.77 109.6743.6110.38 12.12 78.31 108.11
64.6858.64 109.9378.6912.68 92.9997.1579.20
107.623.6181.48 111.0298.37
4.82 113.79
NL: 1.55E7
Base Peak F: ITMS + c ESI Full ms [ 400.00-1400.00] MS 061704-worm-trizol-urea-15n-H-09
RT: 0.00 - 120.00
0 10 20 30 40 50 60 70 80 90 100 110 120
Time (min)
0
5
10
15
20
25
30
35
40
45
50
55
60
65
70
75
80
85
90
95
100
Re
lative
Abu
nd
ance
21.42
67.19
66.96
67.47
109.24
108.4435.21
26.4267.84
109.6029.97 87.91
89.9068.1276.36
51.2266.0951.0244.85
55.11 110.3240.66 63.75 75.64 76.93
63.3811.31 107.55 110.86
55.5511.80 77.5369.9419.023.70 94.42 103.99 112.57
4.30
NL: 2.25E7
Base Peak F: ITMS + c ESI Full ms [ 400.00-1400.00] MS 061704-worm-trizol-urea-15n-H-10
RT: 0.00 - 120.00
0 10 20 30 40 50 60 70 80 90 100 110
Time (min)
0
5
10
15
20
25
30
35
40
45
50
55
60
65
70
75
80
85
90
95
100
Re
lative
Abu
nd
ance
20.95
27.33
106.92106.57
70.27
106.3770.5231.61 107.70
43.55
43.09108.04
40.5143.86 108.62
44.5085.9837.92 46.26 105.6052.64 108.86
72.4476.3446.4576.64 109.68
57.01 86.9369.60 110.1577.1015.889.36 57.56 64.09 78.54 111.374.07 91.98
92.61112.11
NL: 2.45E7
Base Peak F: ITMS + c ESI Full ms [ 400.00-1400.00] MS 061704-worm-trizol-urea-15n-H-11
RT: 0.00 - 120.01
0 10 20 30 40 50 60 70 80 90 100 110 120
Time (min)
0
5
10
15
20
25
30
35
40
45
50
55
60
65
70
75
80
85
90
95
100
Re
lative
Abu
nd
ance
26.72 28.65
42.56
20.27
42.82
14.938.67
25.21
62.3811.68
65.97 72.52
31.37 39.67111.39
59.61111.0256.2039.09 77.0844.82
77.688.1950.19
112.206.41
87.1492.32
79.56116.2993.36 99.44
5.60
NL: 3.47E7
Base Peak F: ITMS + c ESI Full ms [ 400.00-1400.00] MS 061504-worm-trizol-urea-15n-J1-12

Qualitative Analysis of Tandem Mass SpectraA
bu
nd
an
ce
m/z
Ab
un
da
nc
e
m/z
Ab
un
da
nc
e
m/z
Ab
un
da
nc
e
m/z
Ab
un
da
nc
e
m/z
Ab
un
da
nc
e
m/z
Ab
un
da
nc
e
m/z
Ab
un
da
nc
e
m/z
Ab
un
da
nc
e
m/z
Ab
un
da
nc
e
m/z
100,000’s of
MS/MS Spectra
Peptide IDsSpectrum 1: ERTYILDFGH
Spectrum 2: WEQTMNVCSW
Spectrum 3: ERTYEWIPWQ
Spectrum 4: …
…Beowulf Computer Cluster
Database Search
Using SEQUEST
Output Sorting and
Filtering
Protein
Identifications
Assembly Using
DTASelect


Writing a Manuscript Review
• Overview (~1-2 paragraphs) – summarizing the
general point of the manuscript and your broad
overall enthusiasm
• Major comments – bullet points
– Items that must be fixed before publication
• Minor comments – bullet points
– These should be stylistic recommendations
– Typos
– Etc…


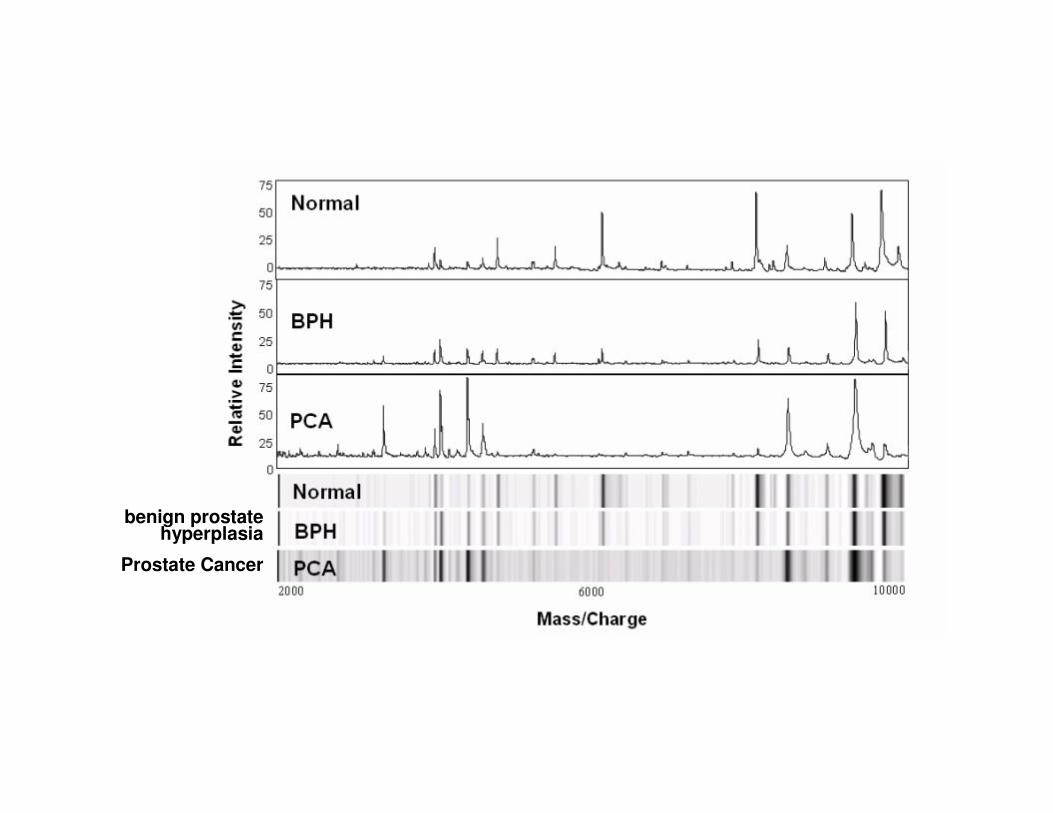
benign prostate hyperplasia
Prostate Cancer