br 3 / bibliometrics on and for the czech republic
TRANSCRIPT
May 2015
R&D Evaluation Methodology and Funding Principles Background report 3: Bibliometrics on and for the Czech Republic
R&D Evaluation Methodology and Funding Principles
Background report 3: Bibliometrics on and for the Czech Republic
May 2015
Gunnar Sivertsen - NIFU
Jan Dvořák, Tomáš Chudlarský - InfoScience Praha
Tomáš Vondrák - Technology Centre AS CR
Bibliometrics on and for the Czech Republic
R&D Evaluation Methodology and Funding Principles i
Table of Contents 1. Introduction 1
2. A bibliometric analysis of the Czech Republic in international comparison 2
2.1 Introduction 2 2.2 Number of publications in the study 3 2.3 Research profiles 4 2.4 International collaboration intensity 5 2.5 Citation impact 5 2.6 Citation impact in the major areas of research 7
3. Bibliometrics in the Evaluation Methodology 10
3.1 Types of data and data sources 10 3.2 Field classification 11 3.3 International citation data 11 3.4 Further development of the RD&I Information System for bibliometric purposes 13 3.5 Experiences with and recommendations from the Small Pilot Evaluation 13 3.6 Special considerations with regard to the social sciences and humanities 14
4. Manual for the bibliometrics report 16
4.1 Introduction 16 4.2 A: Characteristics of the field (CR) 18 4.3 B: Characteristics of the Research Unit (RU) 25 4.4 C: Publishing Profile (RU) 26 4.5 D: Citation Impact (RU) 29 4.6 E: Collaboration (RU) 30 4.7 F: Research outputs and activities – statistical data (RU) 31 4.8 G: IPR-related outputs (RU) 33 4.9 Appendix A: Listing of WoS journals in the fields of the Disciplinary Area 34 4.10 Appendix B: Full list of publications by the RU 34
5. Guidelines for the panels’ use of bibliometric information 35
Bibliometrics on and for the Czech Republic
ii R&D Evaluation Methodology and Funding Principles
Table of Exhibits Exhibit 1 Number of publications in the study per unit and year. Change in percentages indicates the increase between the first and second half of the period 2008-2013. ....................................................................................................................... 4 Exhibit 2 Research profiles of the countries, measured as the number of publications in each major area as a percentage of the total publications. Based on the total publications from 2008-2013. ......................................................................................... 4 Exhibit 3 International collaboration intensity, measured as the percentage of a country’s publications that also have addresses in other countries. ................................ 5 Exhibit 4 Field normalized citation impact relative to the world (=1,0) in all major areas taken together. Publications from 2008-2012 cited in 2008-2013. ..................... 6 Exhibit 5 Percentage publications among the world’s ten per cent most cited publications in all major areas taken together. Publications from 2008-2012 cited in 2008-2013. ........................................................................................................................ 7 Exhibit 6 Field normalized citation impact relative to the world (=1.0) in all major areas taken together, and in each of five major areas (the humanities are not included because of lack of validity of the indicator in this area). Publications from 2008-2012 cited in 2008-2013. .......................................................................................................... 8 Exhibit 7 Percentage publications among the world’s ten per cent most cited publications in all major areas taken together and in each of five major areas (the humanities are not included because of lack of validity of the indicator in this area). Publications from 2008-2012 cited in 2008-2013. ......................................................... 9 Exhibit 8 Coverage in Scopus and Web of Science of 70,500 scholarly publications in journals, series, and books from the higher education sector in Norway since 2005. .. 15
Bibliometrics on and for the Czech Republic
R&D Evaluation Methodology and Funding Principles 1
1. Introduction
This report is a background report to the Final report 1 – The R&D Evaluation Methodology. It holds the final outcomes of the study team activities in the field of bibliometrics.
Chapter 2 presents the results of the bibliometric analysis setting the research profile of the Czech Republic in international comparison.
Chapter 3 describes the design of the bibliometric support for the implementation of the National Evaluation of Research Organisations - NERO. The information resources are appraised with respect of their suitability and coverage of the Czech research outputs, based (also) on the experience in the Small Pilot Evaluation. Some extensions of the RD&I Information System are suggested. Finally, the recommendations based on experiences from the Small Pilot evaluation are presented and the guidelines for panels how to interpret the bibliometric data are given
Chapter 4 contains the template for the bibliometric report in the EM, including a ‘manual’ with technical indications for the implementation of the bibliometric analysis. Chapter 5 gives indications for the interpretation of the bibliometric data to the benefit of the evaluation panel members.
Bibliometrics on and for the Czech Republic
2 R&D Evaluation Methodology and Funding Principles
2. A bibliometric analysis of the Czech Republic in international comparison
2.1 Introduction The aim of the following analysis is to benchmark the research performance of the Czech Republic against an international level represented by five specific important countries as well as the average of the European Union as a whole. The focus will be on the research profile, the growth in output, the degree of international collaboration and the citation impact of research in the Czech Republic as compared to the international level. Rather than giving the status for particular specialties and disciplines, we study the trends in major areas of research in order to provide a clearer picture of potential research policy implications.
The analysis is based on data from the scientific journal indexing service Web of Science (Thomson Reuters) as represented in the standard indicators and classifications in InCites, an online toolkit for bibliometric analysis which is also delivered by Thomson Reuters.
Publications from the latest available years 2008-2013 are analysed. The citation indicators cover the years 2008-2012, leaving at least one year to receive citations for the latest publications.
The publications are classified in six major areas following the OECD classification that is applied on Web of Science journals in InCites:
• NAT: Natural Sciences
• ENG: Engineering and Technology
• MED: Medical and Health Sciences
• AGR: Agricultural Sciences
• SOC: Social Sciences
• HUM: Humanities
It is not possible in InCites to adjust this standard OECD classification as has been done for the Small Pilot Evaluation when using raw Web of Science data limited to the Czech Republic. It is, however, comparable on the large scale that we are using here.
The attribution of publications to countries in InCites is based on the indexed author addresses in Web of Science. Publications are attributed to more than one country if more than one country appear in the addresses.
For the international comparison of the Czech Republic in this study, five other countries have been selected on the basis of an analysis of the collaboration pattern of the Czech Republic in the data. All five countries are among the most frequent collaborating countries from the point of view of the Czech Republic. Three of them are large and important science performing countries in general: USA, United Kingdom, and Germany. The other two are “close” collaborators with more articles in collaboration with the Czech Republic than could be expected from their size: Poland and Slovakia. These countries are also neighbours with similar research conditions and profiles. The Czech Republic will also be compared to baselines representing all

Bibliometrics on and for the Czech Republic
R&D Evaluation Methodology and Funding Principles 3
present 28 member states of the European Union.1 Hence, these are the units for international comparison:
• EU28: The 28 EU member states taken together
• USA: The United States of America
• GBR: United Kingdom
• DEU: Germany
• POL: Poland
• CZE: Czech Republic
• SVK: Slovakia
The comparison is based on four standard bibliometric indicators:
• Research profile: The share of a country’s total publications that can be classified in one of the six major areas. This indicator is presented for the years 2008-2013 taken together.
• International collaboration intensity: Percentage of a country’s publications that also have addresses in other countries. This indicator is presented with trends representing each year 2008-2013 for all major areas taken together.
• Citation Impact: Two supplementing indicators, presented with trends representing each year 2008-2012, both for all major areas taken together and for each major area:
− Average field normalized citation impact. This indicator is an aggregation of a measurement that compares the citation rate of a country’s publications to the average citation rate of the world’s publications in the same field in the same year.
− Percentage publications among the world’s 10 per cent most cited publications in the field. This indicator is also an aggregation from field level and year.
Citation Impact indicators are not presented for the humanities. One reason is that only a small part of the peer-reviewed scholarly publication output from the humanities is published in Web of Science journals (see below). Another reason it is the referencing practices of the humanities do not allow for valid citation indicators based on a limited number of cited and citing publications within a short period of time.
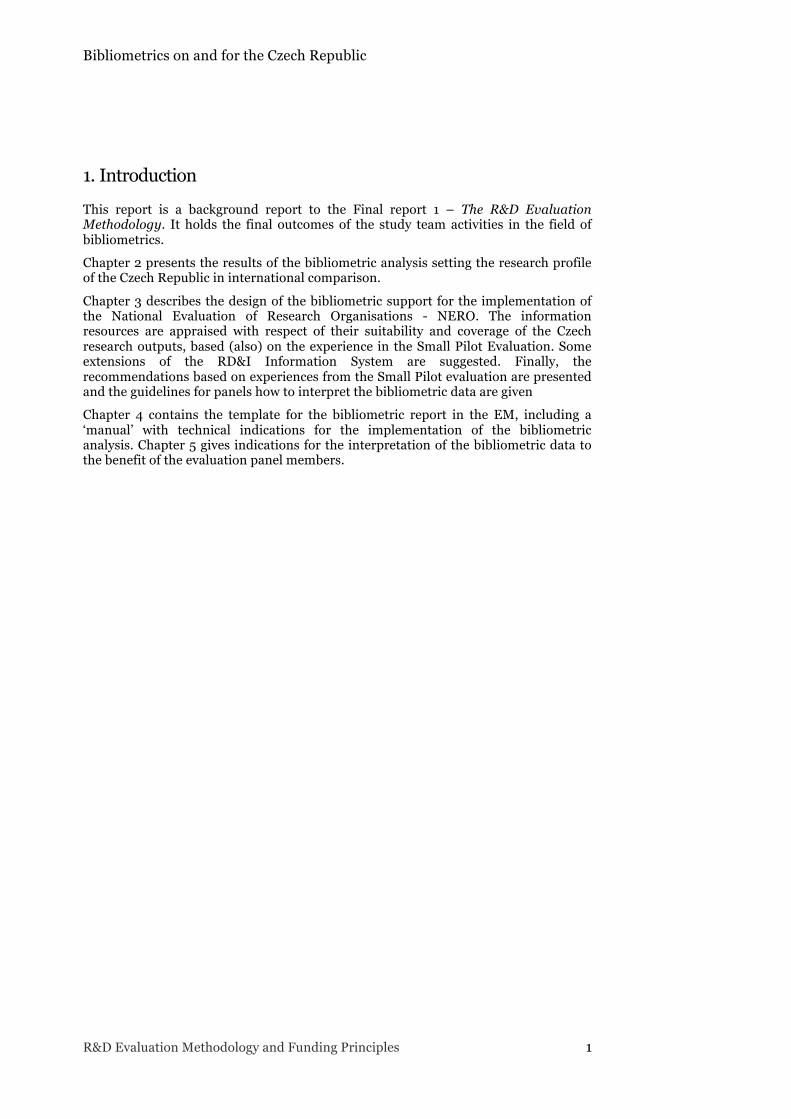
2.2 Number of publications in the study Exhibit 1, below, shows the number of Web of Science publications included in the study from 2008-2013. The Czech Republic has the largest increase of publications in the period. The number of publications from the Czech Republic represent 2.2 per cent of the total from EU28. (Publications from the EU28 are not double counted if they are affiliated with more than one country.)
1 We found it more relevant and up-to-date to specify the UK and Germany in the analysis than to give separate indicators for the old constellation of EU15.
Bibliometrics on and for the Czech Republic
4 R&D Evaluation Methodology and Funding Principles
Exhibit 1 Number of publications in the study per unit and year. Change in percentages indicates the increase between the first and second half of the period 2008-2013. 2008 2009 2010 2011 2012 2013 Change
EU28 611,694 650,461 651,217 665,315 684,561 682,842 6 %
USA 554,345 570,793 575,574 585,101 604,479 593,908 5 %
GBR 147,355 155,743 157,353 164,298 168,739 169,371 9 %
DEU 127,823 134,576 134,776 137,604 140,195 139,220 5 %
POL 25,335 25,898 26,940 27,206 29,547 30,244 11 %
CZE 12,556 13,957 14,915 15,284 15,970 16,060 14 %
SVK 3,981 4,220 4,326 4,278 4,786 4,838 11 %
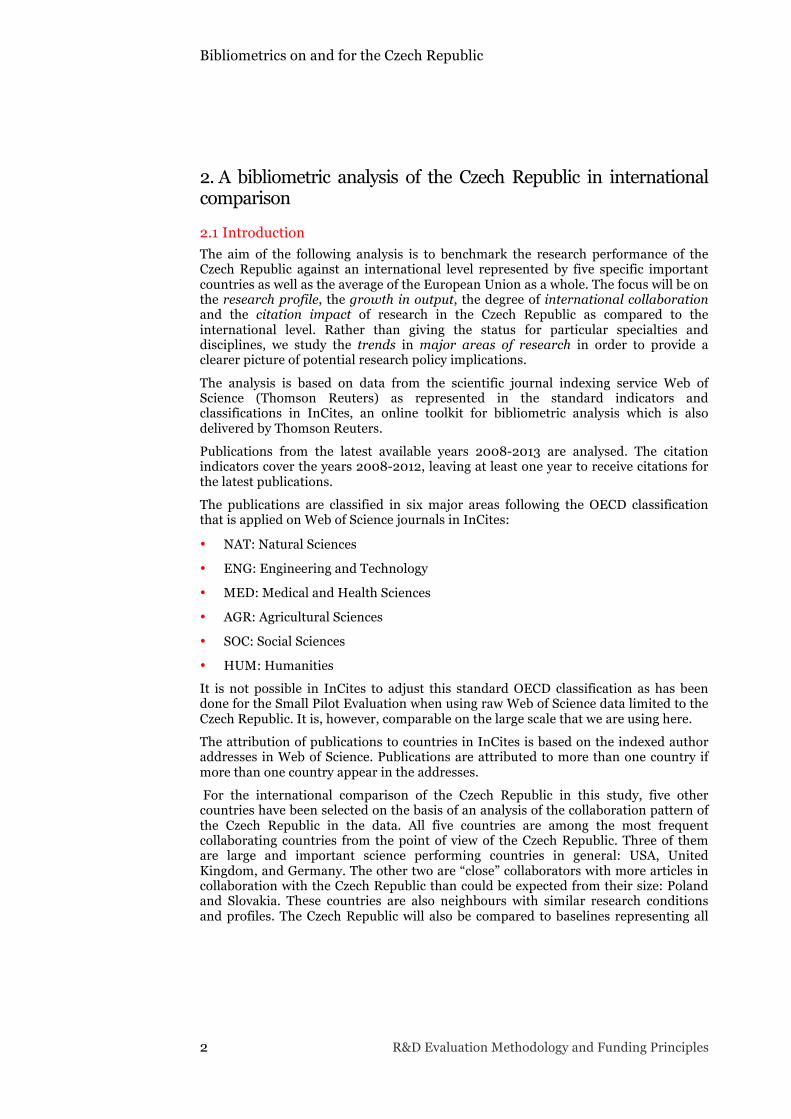
2.3 Research profiles Research profiles are relatively stable over time as a result of long-term scientific traditions and priorities of a country. Exhibit 2, below, shows the research profiles of the countries, measured by the number of publications in each major area as a percentage of the total publications.
We observe that the profile of the Czech Republic is most similar to the profiles of Poland and Slovakia, with relatively more emphasis on the Natural Sciences, Engineering and Technology, and Agricultural Sciences. The emphasis on Natural Sciences and Engineering is also shared with Germany. On the other hand, there is less emphasis on Medical and Health Sciences than can be seen in the EU in general and in the United States.
Exhibit 2 Research profiles of the countries, measured as the number of publications in each major area as a percentage of the total publications. Based on the total publications from 2008-2013.
0% 5% 10% 15% 20% 25% 30% 35% 40% 45% 50%
EU28 USA GBR DEU POL CZE SVK
Research proAiles
NAT ENG MED AGR SOC HUM
Bibliometrics on and for the Czech Republic
R&D Evaluation Methodology and Funding Principles 5
With regard to the Social Sciences and Humanities, it is important to bear in mind that these areas have a more limited coverage in the Web of Science.2 There is also a concentration on Anglo-American journals in these areas. Consequently, these areas are probably more important in the Czech Republic than it may seem from figure 1.
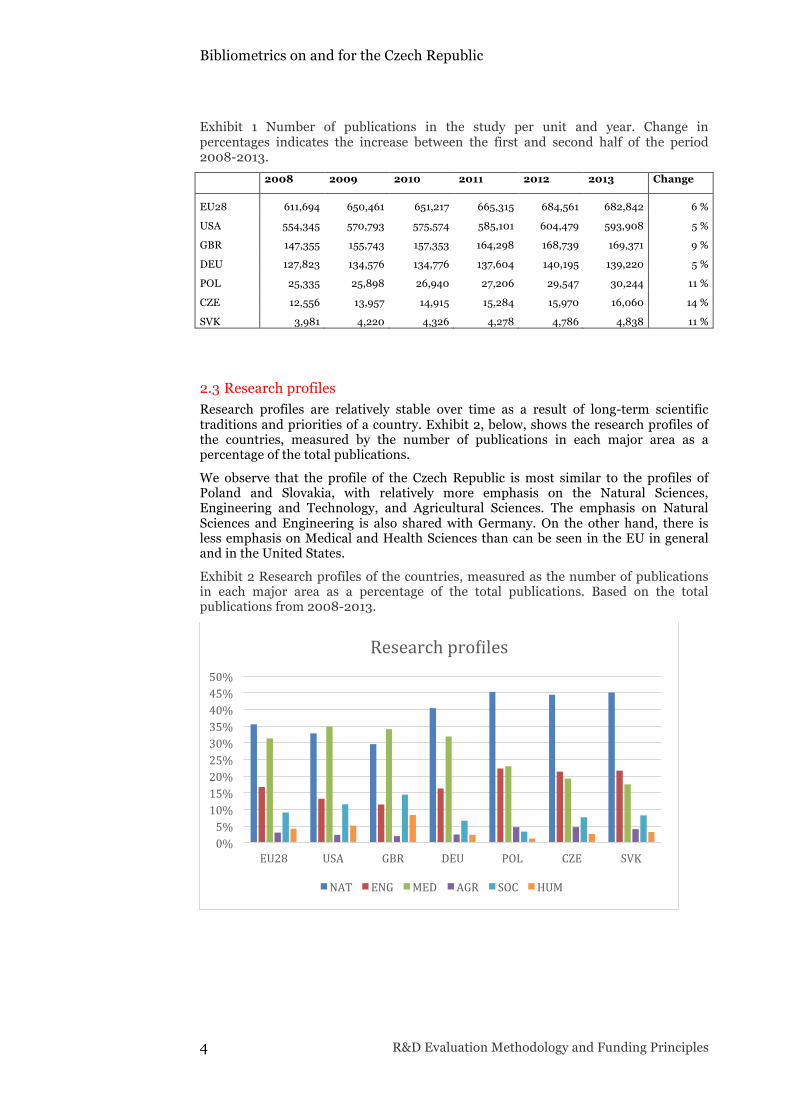
2.4 International collaboration intensity International collaboration is measured as the percentage of a country’s publications that also have addresses in other countries.
As seen in Exhibit 3, below, this percentage is increasing for most of the countries, which is the normal situation also in countries not represented in this study. It is also the rule that this percentage is smaller in large countries and higher in small countries (measured by the total number of publications). Hence, it is not unexpected that the percentage is low for the United States. Consequently, there is a potential for increased international collaboration in the Czech Republic and Poland, since their percentages are presently below those of Germany and the United Kingdom. However, the Czech Republic exhibits a clear increase in international collaboration and is above the EU average.
Exhibit 3 International collaboration intensity, measured as the percentage of a country’s publications that also have addresses in other countries.
2.5 Citation impact Citation impact measures the actual influence of research on further research. Although this influence may be regarded as a sign of research quality, citation indicators cannot be interpreted as directly representing the quality of research.
While a large proportion of scientific publications are seldom or never cited in the subsequent literature, a small proportion receives large numbers of citations. One of the consequences of the skewed distribution of citations over citable publications is that the annual measurement, even on country level, may be visibly influenced by the presence or lack of highly cited publications. Another consequence is that supplementing indicators may be needed to give a clearer picture. Here, we are supplementing the average field normalized citation indicator (which is influenced
2 See figure 6 on page 35 (WoS & Scopus coverage, Journal articles) in the Background Report: The RD&I Information System as an information tool for evaluation
0%
10%
20%
30%
40%
50%
2008 2009 2010 2011 2012 2013
Percentage publications with international collaboration
EU28
USA
GBR
DEU
POL
CZE
Bibliometrics on and for the Czech Republic
6 R&D Evaluation Methodology and Funding Principles
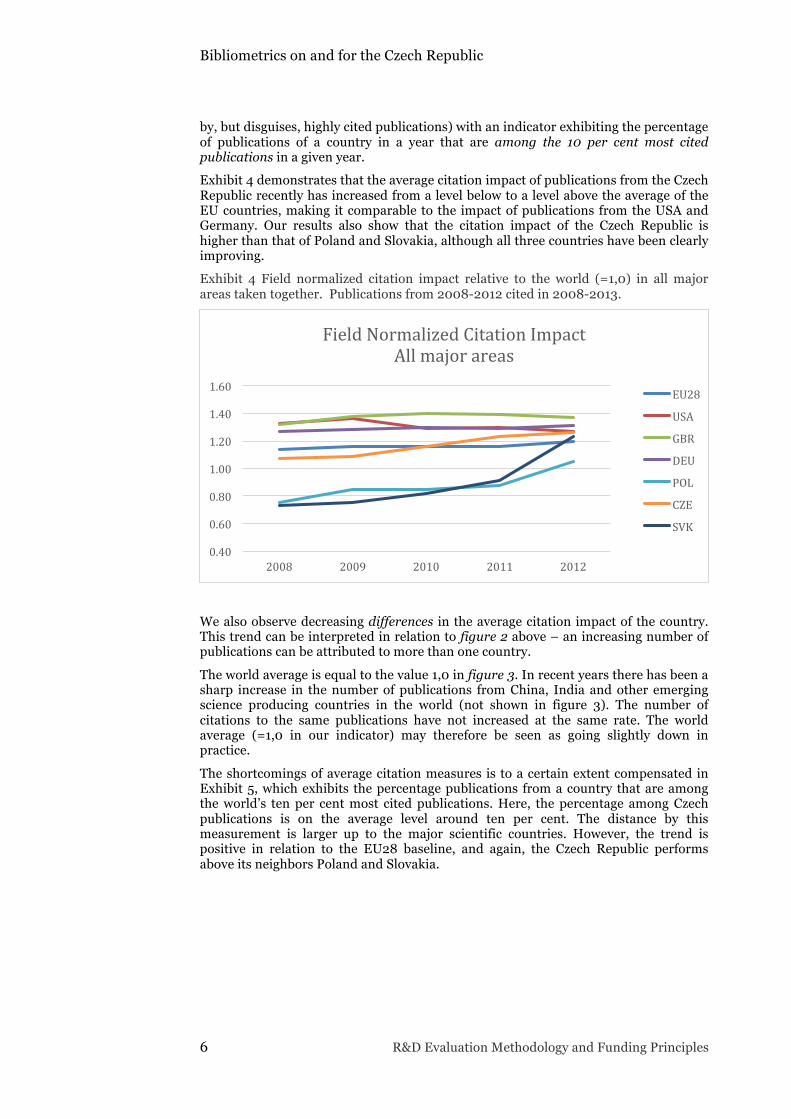
by, but disguises, highly cited publications) with an indicator exhibiting the percentage of publications of a country in a year that are among the 10 per cent most cited publications in a given year.
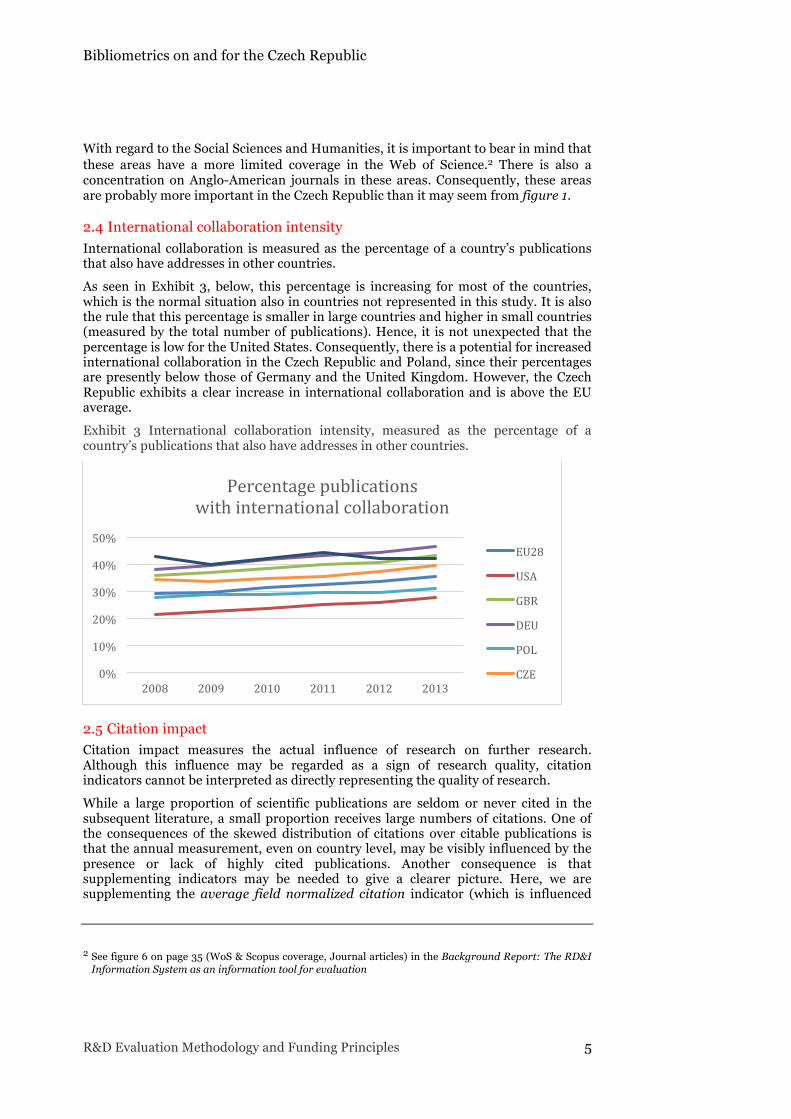
Exhibit 4 demonstrates that the average citation impact of publications from the Czech Republic recently has increased from a level below to a level above the average of the EU countries, making it comparable to the impact of publications from the USA and Germany. Our results also show that the citation impact of the Czech Republic is higher than that of Poland and Slovakia, although all three countries have been clearly improving.
Exhibit 4 Field normalized citation impact relative to the world (=1,0) in all major areas taken together. Publications from 2008-2012 cited in 2008-2013.
We also observe decreasing differences in the average citation impact of the country. This trend can be interpreted in relation to figure 2 above – an increasing number of publications can be attributed to more than one country.
The world average is equal to the value 1,0 in figure 3. In recent years there has been a sharp increase in the number of publications from China, India and other emerging science producing countries in the world (not shown in figure 3). The number of citations to the same publications have not increased at the same rate. The world average (=1,0 in our indicator) may therefore be seen as going slightly down in practice.
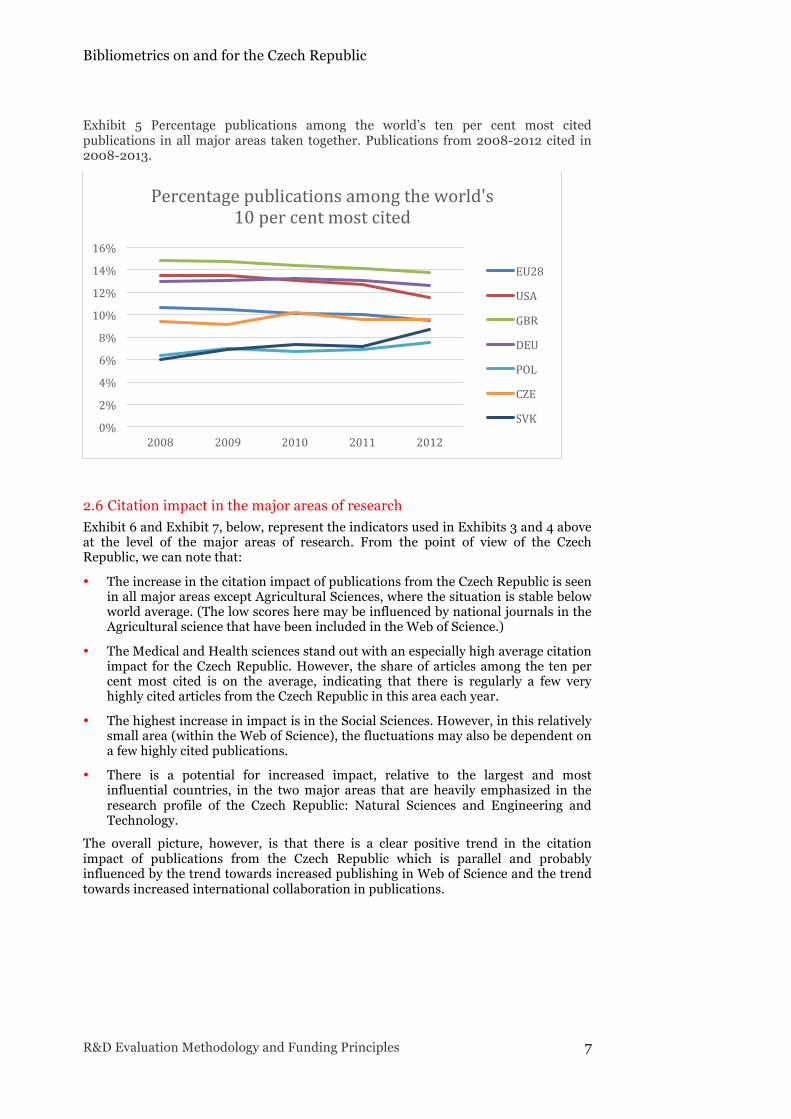
The shortcomings of average citation measures is to a certain extent compensated in Exhibit 5, which exhibits the percentage publications from a country that are among the world’s ten per cent most cited publications. Here, the percentage among Czech publications is on the average level around ten per cent. The distance by this measurement is larger up to the major scientific countries. However, the trend is positive in relation to the EU28 baseline, and again, the Czech Republic performs above its neighbors Poland and Slovakia.
0.40
0.60
0.80
1.00
1.20
1.40
1.60
2008 2009 2010 2011 2012
Field Normalized Citation Impact All major areas
EU28
USA
GBR
DEU
POL
CZE
SVK
Bibliometrics on and for the Czech Republic
R&D Evaluation Methodology and Funding Principles 7
Exhibit 5 Percentage publications among the world’s ten per cent most cited publications in all major areas taken together. Publications from 2008-2012 cited in 2008-2013.
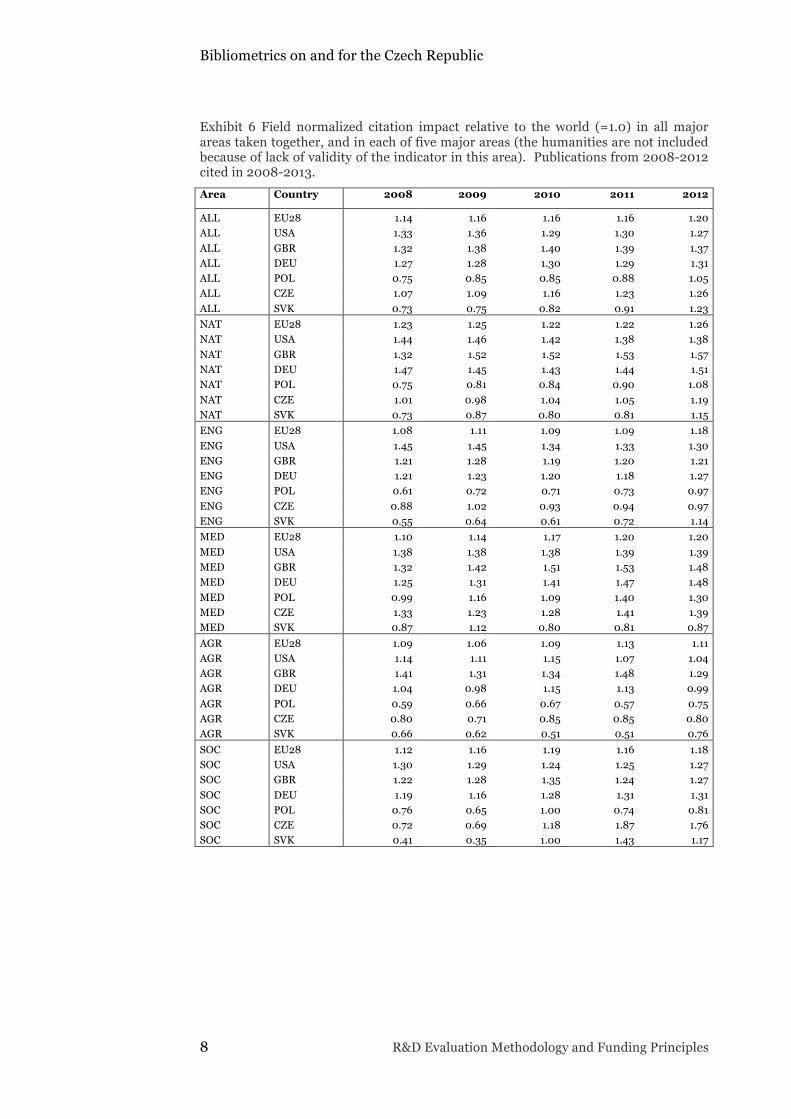
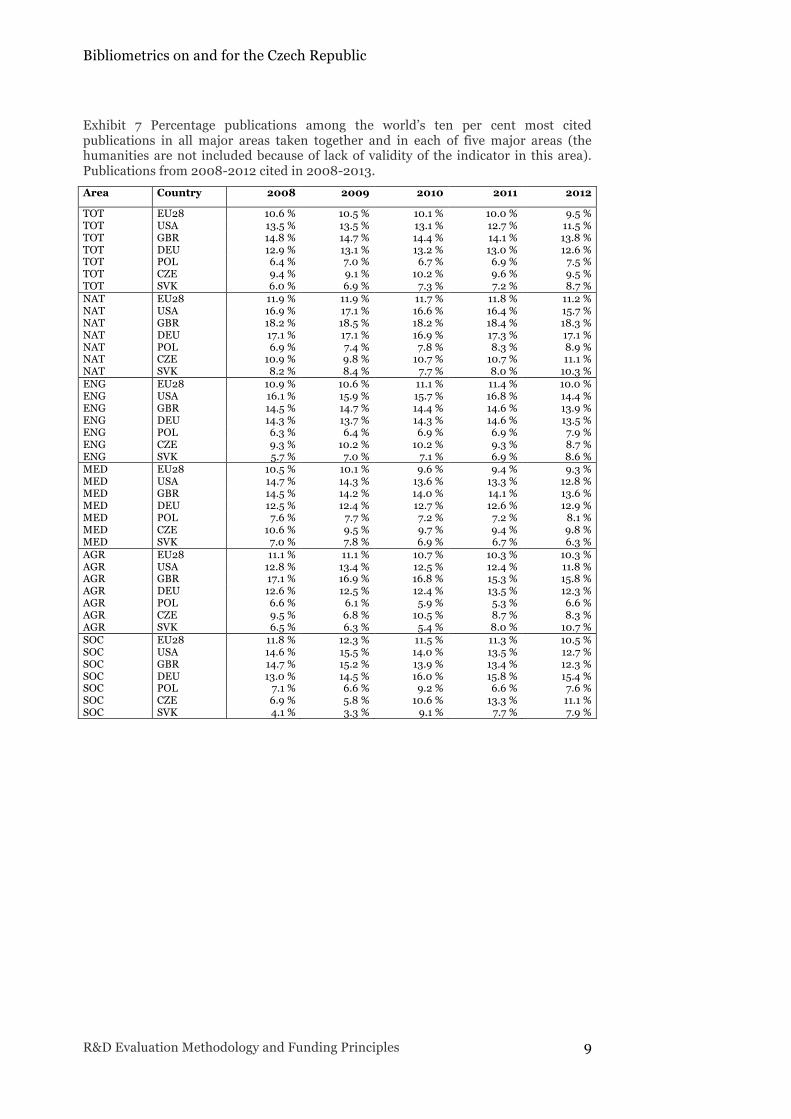
2.6 Citation impact in the major areas of research Exhibit 6 and Exhibit 7, below, represent the indicators used in Exhibits 3 and 4 above at the level of the major areas of research. From the point of view of the Czech Republic, we can note that:
• The increase in the citation impact of publications from the Czech Republic is seen in all major areas except Agricultural Sciences, where the situation is stable below world average. (The low scores here may be influenced by national journals in the Agricultural science that have been included in the Web of Science.)
• The Medical and Health sciences stand out with an especially high average citation impact for the Czech Republic. However, the share of articles among the ten per cent most cited is on the average, indicating that there is regularly a few very highly cited articles from the Czech Republic in this area each year.
• The highest increase in impact is in the Social Sciences. However, in this relatively small area (within the Web of Science), the fluctuations may also be dependent on a few highly cited publications.
• There is a potential for increased impact, relative to the largest and most influential countries, in the two major areas that are heavily emphasized in the research profile of the Czech Republic: Natural Sciences and Engineering and Technology.
The overall picture, however, is that there is a clear positive trend in the citation impact of publications from the Czech Republic which is parallel and probably influenced by the trend towards increased publishing in Web of Science and the trend towards increased international collaboration in publications.
0%
2%
4%
6%
8%
10%
12%
14%
16%
2008 2009 2010 2011 2012
Percentage publications among the world's 10 per cent most cited
EU28
USA
GBR
DEU
POL
CZE
SVK
Bibliometrics on and for the Czech Republic
8 R&D Evaluation Methodology and Funding Principles
Exhibit 6 Field normalized citation impact relative to the world (=1.0) in all major areas taken together, and in each of five major areas (the humanities are not included because of lack of validity of the indicator in this area). Publications from 2008-2012 cited in 2008-2013. Area Country 2008 2009 2010 2011 2012
ALL EU28 1.14 1.16 1.16 1.16 1.20 ALL USA 1.33 1.36 1.29 1.30 1.27 ALL GBR 1.32 1.38 1.40 1.39 1.37 ALL DEU 1.27 1.28 1.30 1.29 1.31 ALL POL 0.75 0.85 0.85 0.88 1.05 ALL CZE 1.07 1.09 1.16 1.23 1.26 ALL SVK 0.73 0.75 0.82 0.91 1.23 NAT EU28 1.23 1.25 1.22 1.22 1.26 NAT USA 1.44 1.46 1.42 1.38 1.38 NAT GBR 1.32 1.52 1.52 1.53 1.57 NAT DEU 1.47 1.45 1.43 1.44 1.51 NAT POL 0.75 0.81 0.84 0.90 1.08 NAT CZE 1.01 0.98 1.04 1.05 1.19 NAT SVK 0.73 0.87 0.80 0.81 1.15 ENG EU28 1.08 1.11 1.09 1.09 1.18 ENG USA 1.45 1.45 1.34 1.33 1.30 ENG GBR 1.21 1.28 1.19 1.20 1.21 ENG DEU 1.21 1.23 1.20 1.18 1.27 ENG POL 0.61 0.72 0.71 0.73 0.97 ENG CZE 0.88 1.02 0.93 0.94 0.97 ENG SVK 0.55 0.64 0.61 0.72 1.14 MED EU28 1.10 1.14 1.17 1.20 1.20 MED USA 1.38 1.38 1.38 1.39 1.39 MED GBR 1.32 1.42 1.51 1.53 1.48 MED DEU 1.25 1.31 1.41 1.47 1.48 MED POL 0.99 1.16 1.09 1.40 1.30 MED CZE 1.33 1.23 1.28 1.41 1.39 MED SVK 0.87 1.12 0.80 0.81 0.87 AGR EU28 1.09 1.06 1.09 1.13 1.11 AGR USA 1.14 1.11 1.15 1.07 1.04 AGR GBR 1.41 1.31 1.34 1.48 1.29 AGR DEU 1.04 0.98 1.15 1.13 0.99 AGR POL 0.59 0.66 0.67 0.57 0.75 AGR CZE 0.80 0.71 0.85 0.85 0.80 AGR SVK 0.66 0.62 0.51 0.51 0.76 SOC EU28 1.12 1.16 1.19 1.16 1.18 SOC USA 1.30 1.29 1.24 1.25 1.27 SOC GBR 1.22 1.28 1.35 1.24 1.27 SOC DEU 1.19 1.16 1.28 1.31 1.31 SOC POL 0.76 0.65 1.00 0.74 0.81 SOC CZE 0.72 0.69 1.18 1.87 1.76 SOC SVK 0.41 0.35 1.00 1.43 1.17
Bibliometrics on and for the Czech Republic
R&D Evaluation Methodology and Funding Principles 9
Exhibit 7 Percentage publications among the world’s ten per cent most cited publications in all major areas taken together and in each of five major areas (the humanities are not included because of lack of validity of the indicator in this area). Publications from 2008-2012 cited in 2008-2013. Area Country 2008 2009 2010 2011 2012
TOT EU28 10.6 % 10.5 % 10.1 % 10.0 % 9.5 % TOT USA 13.5 % 13.5 % 13.1 % 12.7 % 11.5 % TOT GBR 14.8 % 14.7 % 14.4 % 14.1 % 13.8 % TOT DEU 12.9 % 13.1 % 13.2 % 13.0 % 12.6 % TOT POL 6.4 % 7.0 % 6.7 % 6.9 % 7.5 % TOT CZE 9.4 % 9.1 % 10.2 % 9.6 % 9.5 % TOT SVK 6.0 % 6.9 % 7.3 % 7.2 % 8.7 % NAT EU28 11.9 % 11.9 % 11.7 % 11.8 % 11.2 % NAT USA 16.9 % 17.1 % 16.6 % 16.4 % 15.7 % NAT GBR 18.2 % 18.5 % 18.2 % 18.4 % 18.3 % NAT DEU 17.1 % 17.1 % 16.9 % 17.3 % 17.1 % NAT POL 6.9 % 7.4 % 7.8 % 8.3 % 8.9 % NAT CZE 10.9 % 9.8 % 10.7 % 10.7 % 11.1 % NAT SVK 8.2 % 8.4 % 7.7 % 8.0 % 10.3 % ENG EU28 10.9 % 10.6 % 11.1 % 11.4 % 10.0 % ENG USA 16.1 % 15.9 % 15.7 % 16.8 % 14.4 % ENG GBR 14.5 % 14.7 % 14.4 % 14.6 % 13.9 % ENG DEU 14.3 % 13.7 % 14.3 % 14.6 % 13.5 % ENG POL 6.3 % 6.4 % 6.9 % 6.9 % 7.9 % ENG CZE 9.3 % 10.2 % 10.2 % 9.3 % 8.7 % ENG SVK 5.7 % 7.0 % 7.1 % 6.9 % 8.6 % MED EU28 10.5 % 10.1 % 9.6 % 9.4 % 9.3 % MED USA 14.7 % 14.3 % 13.6 % 13.3 % 12.8 % MED GBR 14.5 % 14.2 % 14.0 % 14.1 % 13.6 % MED DEU 12.5 % 12.4 % 12.7 % 12.6 % 12.9 % MED POL 7.6 % 7.7 % 7.2 % 7.2 % 8.1 % MED CZE 10.6 % 9.5 % 9.7 % 9.4 % 9.8 % MED SVK 7.0 % 7.8 % 6.9 % 6.7 % 6.3 % AGR EU28 11.1 % 11.1 % 10.7 % 10.3 % 10.3 % AGR USA 12.8 % 13.4 % 12.5 % 12.4 % 11.8 % AGR GBR 17.1 % 16.9 % 16.8 % 15.3 % 15.8 % AGR DEU 12.6 % 12.5 % 12.4 % 13.5 % 12.3 % AGR POL 6.6 % 6.1 % 5.9 % 5.3 % 6.6 % AGR CZE 9.5 % 6.8 % 10.5 % 8.7 % 8.3 % AGR SVK 6.5 % 6.3 % 5.4 % 8.0 % 10.7 % SOC EU28 11.8 % 12.3 % 11.5 % 11.3 % 10.5 % SOC USA 14.6 % 15.5 % 14.0 % 13.5 % 12.7 % SOC GBR 14.7 % 15.2 % 13.9 % 13.4 % 12.3 % SOC DEU 13.0 % 14.5 % 16.0 % 15.8 % 15.4 % SOC POL 7.1 % 6.6 % 9.2 % 6.6 % 7.6 % SOC CZE 6.9 % 5.8 % 10.6 % 13.3 % 11.1 % SOC SVK 4.1 % 3.3 % 9.1 % 7.7 % 7.9 %
Bibliometrics on and for the Czech Republic
10 R&D Evaluation Methodology and Funding Principles
3. Bibliometrics in the Evaluation Methodology
The bibliometrics for the Evaluation Methodology has mainly been developed and applied by Tomas Vondrak (Technology Centre) as team leader and with Jan Dvorak and Tomas Chudlarsky (InfoScience) and Gunnar Sivertsen (NIFU) as team members. The team has closely collaborated with the IPN KA1 team led by Martin Lhotak (ASCR) on these tasks:
• Choice of the commercial supplier of international citation data
• Design of indicators for the SPE
• Preparation for the 2nd Pilot Evaluation
One result of the collaboration is that the Czech Republic can now be regarded as self-supplied with bibliometric expertise for future research evaluations. There must be collaboration, however, between organizations representing different areas of expertise and applications within bibliometrics.
3.1 Types of data and data sources For the bibliometric indicators covering publication-type research outputs, we have used two complementary data sources in the Small Pilot Evaluation:
• International: InCites by Thomson Reuters, providing data based on publications indexed for Web of Science in these categories: Articles, Reviews, Proceedings Papers, Letters. InCites needed to be supplemented by another product from Thomson Reuters, the National Citation Report (NCR) for the Czech Republic, which gives complete data on the level of articles, but for this country only. The NCR gives the only option for selecting articles on the level of Research Units or Research Organizations within the Czech Republic, while InCites provides benchmarks for international comparison.
• National: the Czech RD&I Information System (IS), providing data for publications in the following categories: Articles in peer-reviewed journals (type J); monographs (type B); book chapters (type C - includes Articles in Books and Chapters in Books); Proceedings papers (type D)
For the full-scale implementation of the National Evaluation of Research Organisations, it can be envisaged that the bibliometric data will be based on both the Thomson Reuters Web of Science and on Elsevier’s Scopus.
The Czech RD&I Information System was an important source for data on other research outputs and activities and IPR-related outputs. It provides data for outputs in the following categories:
• Results used by the funding provider, projected into legislation or norm, projected into non-legislative or strategic documents (type H), Research report containing classified information (type V), Certified methodologies, art conservation methodologies, specialized map works (type N), Pilot plant (Zpilot), Verified technology (Ztech), Software (R), Prototypes, Function examples (G), Audiovisual production, electronic documents(A), Conference organization(M), Workshop organization (W), Exhibition organization (E), Other results (O)
• IPR-related outputs, i.e. Patents (type P), Plant variety (type Zodru), Animal breed (type Zplem), Utility model, Industrial design (F)
Bibliometric data and methods normally only deal with publication-type research outputs. Here, the data can be based on bibliographic data that are derived from or can be verified against independently produced bibliographic data sources. We will concentrate our report on these data and methods in the following. However, we mention the other types of outputs and activities above because the experience from
Bibliometrics on and for the Czech Republic
R&D Evaluation Methodology and Funding Principles 11
the SPE is that they represent valuable additional information in the Czech RD&I Information System that can be used to inform the expert panels.
3.2 Field classification It was decided to follow the OECD field classification for developing an applicable structure for the evaluation panels and units of evaluation that could at the same time be bridged with bibliometric information. The OECD classification was slightly adjusted for a better and more logical representation of the research profile of the Czech Republic.
However, on the background of our experiences with the SPE, we recommend that the OECD classification is not modified, but kept as it is in future adaptations of the methodology. The reason is that international comparisons will be more readily available in international bibliometric data and in R&D statistics.
3.3 International citation data
3.3.1 The choice of the commercial supplier of international data for the Small Pilot Evaluation The idea of indexing metadata representing articles in scientific journals with full lists of author names, affiliations and references was introduced in 1964 by Eugene Garfield as the Science Citation Index. It is now called the Web of Science and published by Thomson Reuters. It was the only product of this kind on the marked until Elsevier launched the competitor Scopus ten years ago. Since then, both suppliers have developed specific additional products (based on the data from the indexing services) for the specific marked of bibliometrics related to research administration and evaluation. These additional products with the names InCites (Thomson Reuters) and SciVal (Elsevier) are online bibliometric toolboxes with standardized indicators.
In a process staring in the Summer of 2014, the two providers were asked to demonstrate their products and services and to offer prices related to the following deliverables that we could see would be needed for the project within the project period and for the purposes of the project only (these restrictions were important when finally negotiating the prices):
• Access to the toolboxes InCites/SciVal
• Delivery of raw data from Web of Science/Scopus limited to articles with affiliations in the Czech Republic
• Specific international baselines and benchmarks that were not readily available in the toolboxes
All meetings and negotiations with the suppliers were held in collaboration with the IPN KA1 team since both teams should be able to use and gain experience from the data in the project period. Together, we chose Thomson Reuters as the supplier for this project. The main reason was that the OECD field classification of journals had already been installed in InCites, but not yet in SciVal. It was noted that Scopus, on the other hand, has a broader coverage, also of Czech journals, but the data quality in Web of Science seemed more reliable. The price differences were marginal.
When taking the decision to choose Web of Science, the two teams agreed that both suppliers should be asked to tender for the Czech Republic in the next round if a continuing evaluation methodology aided by bibliometrics is established. The two teams also agreed that it would be a good idea to prepare for this situation by making a comparison of the representation Czech data in the two data sources. Such a comparison is beyond the tasks of this project. However, the following procedure can be recommended:
Bibliometrics on and for the Czech Republic
12 R&D Evaluation Methodology and Funding Principles
• Apply complete raw data from both data sources using articles, including accumulated citations, from the Czech Republic within a limited period of time (minimum three years) and with approximately the same dates for the start and finish of the indexing p eriod.
• Standardize and match all journal titles; identify those that cannot be matched because of different coverage.
• Use algorithms to match all articles within the matched journals.
• Analyze the metadata for matched articles, including citation rates.
• Identify non-matched articles in the same journals.
• Analyze non-matched journals and how their contents are represented in only one of the data sources. Evaluate non-matched journals.
• Select a few matched journals, study these journals directly in full-text or in independent data sources such as on-line tables of contents, and analyse how they are covered in Scopus and Web of Science.
Data quality can be just as important as wider coverage since the Czech RD&I Information System in all instances is a supplementary data source for non-covered items. If affordable, both criteria might be used with a purchase of data from both suppliers. However, we recommend to perform the study above before any decision is taken.
3.3.2 Experiences with the application and limitations of the commercial products Generally, we found that the raw data of Czech articles are necessary as a supplement to the online availability of Scopus/Web of Science through SciVal/InCites.
We experience the main limitation of SciVal/InCites so far as that the lack of standardization of institution names for most research organizations in a country. As an example, only the major higher education institutions in the Czech Republic are standardized. Most publications from the institutes related to the Academy of Sciences of the Czech Republic are only allocated to their umbrella organizations. This is a serious limitation so far when doing bibliometric analysis and comparison below the national level. To overcome this limitation in our project, we have used the raw data for the Czech Republic to standardize institution names. We recommend this procedure for larger scale bibliometrics on the institutional level in the future. However, we also recommend to decide whether it will be useful to collaborate with the data suppliers by providing the end results of the standardization process as an import to SciVal/InCites. The tool-boxes would then be more useful below the national level. This decision depends, however, on what role the tool-boxes are given in future evaluations and on the conditions given by the data suppliers.
A second limitation of the online tool-boxes is a more principal one: the indicators are pre-constructed and there is no access to the underlying data. This restriction is less important for a mission-oriented evaluation methodology than it is for the basis for advancing biblometric research itself.
The main limitation of the raw data, on the other hand, is evidently that they are limited to the Czech Republic. Although some international benchmarks are provided in the National Citation Report product from Thomson Reuters, we asked for more benchmarks to be delivered alongside in tables. They were provided with no extra cost. Some of them could have been produced ourselves online from InCites, but it was less time-consuming to simply add the tables to the National Citation Report.
A few organizations in the world, such as the Centre for Science and Technology Studies and the Swedish Research Council, purchase raw data from the total database of Web of Science and Scopus and build their own database with standardization of institution names and international benchmarks. This solution is much more costly
Bibliometrics on and for the Czech Republic
R&D Evaluation Methodology and Funding Principles 13
and demands more technical and bibliometric expertise, but it should be mentioned here as a “third” alternative.
We recommend continuing with the combination of SviVal or Incites and raw data from Scopus or Web of Science for the Czech Republic. We also recommend negotiating a new agreement with both Elsevier and Thomson Reuters.
3.4 Further development of the RD&I Information System for bibliometric purposes The further development of the RD&I Information System is covered in separate reports from our project, in particular the report The RD&I Information System and as information tool for evaluation (Background report 10). Here, we highlight two possible improvements that we have discussed on the basis of our experience with bibliometrics for the evaluation methodology.
3.4.1 Matching of international and national data Potentially, but not realized so far, all publications that are registered in Web of Science or Scopus and subsequently or simultaneously in the RD&I Information System can be matched by recording the unique identifier code of the publication (as given in Web of Science or Scopus) in the RD&I Information System. The outcome of the matching will be:
• Verification and quality assurance of data in the RD&I Information System
• Automatic matching of author names and addresses in international data with real persons and institutions as a basis for bibliometric analysis of Czech research in Scopus or Web of Science data
Today, the unique identifies of articles may follow through from the registration in local systems which are then submitted to the national system. A more systematic import on the national level of the international data may be needed for a full matching procedure.
3.4.2 Standardized register of publication channels This option is discussed extensively in the Background report 9 – The RD&I Information System as an information tool for evaluation with a focus on improving the basis for analysing outputs in the social sciences and humanities. We will only shortly note here that the standardized register is necessary for the:
• Verification and quality assurance of scholarly publication data in all fields in the RD&I Information System
• Bibliometric analysis of scholarly publication data in all fields in the RD&I Information System
3.5 Experiences with and recommendations from the Small Pilot Evaluation We refer here to the more extensive information in the report The Small Pilot Evaluation: Feedback and results (Background report 10). We also refer to Chapter 4 in this report presenting the Template for the bibliometrics report, which was used in the Small Pilot Evaluation and then developed further. As mentioned above, the explanations of the data sources and indicators and the reasons for their choice are given in the publications referred to above.
Neither the panels, the IPN KA1 team nor our team have noted that any important indicator is missing in the Template. However, we all agree that full lists of output could be provided in addition. The panels particularly missed such lists in the Social Sciences and Humanities (SSH), but we agree with the IPN KA1 team that full lists of outputs could be useful in all fields. In fields with a more comprehensive coverage in
Bibliometrics on and for the Czech Republic
14 R&D Evaluation Methodology and Funding Principles
Web of Science or Scopus, this information can be supplied citation indicators as well, but care should be taken to follow best practice in bibliometrics:
• Journal Impact Factors (or similar indicators on the level of journals) should only be used in lists of journals, never in lists of publications (journal articles). Impact Factors do not say anything about the actual citation impact of the publications.
• In lists of publications (journal articles), the actual number of accumulated citations to the publication can be given. However, this information should only be given together with information about the average number of citations for publications in the same journal or field in the same year of publications. Citation rates should not be given for very recent publications. The date of the recording of the accumulated citations, as well as the data source, should be specified.
• Lists of publications should preferably be given together with links, full text formats, and/or bibliographic information that makes it easy for the panels to consult the publications themselves.
In general, we agree with the panels that the bibliometric information could be improved with regard to clarity and user-friendliness; the slightly revised version of the bibliometric template in this report is a step in that direction. We have also developed some guidelines for the panel experts, which should facilitate their understanding of the data provided (see Section 5).
Most important, in future runs of the evaluation the registration of bibliometric data in the bibliometric data report should be automated rather than done manually as was the case in the Small Pilot Evaluation. For this purpose, we have delivered to the IPN team an excel version of the data and tables needed for the report.
3.6 Special considerations with regard to the social sciences and humanities The Social Sciences and Humanities need special consideration in bibliometric analysis because the publication patterns of these areas – with relatively more use of publications in books and/or publications in other languages than English – are not as comprehensively and properly covered in the international bibliographic and bibliometric data sources. This can be seen in figure 1, based on data from the Norwegian current research system, CRISTIN. Scopus (of Elsevier) is known to have a wider coverage of journals, however, athe patterns of deficiencies are the same. A similar result, based on data in the Czech RD&I Information System, can be seen in figure 6 on page 35 in the Background Report on the Potential Use of the RD&I Information System as a tool for information.
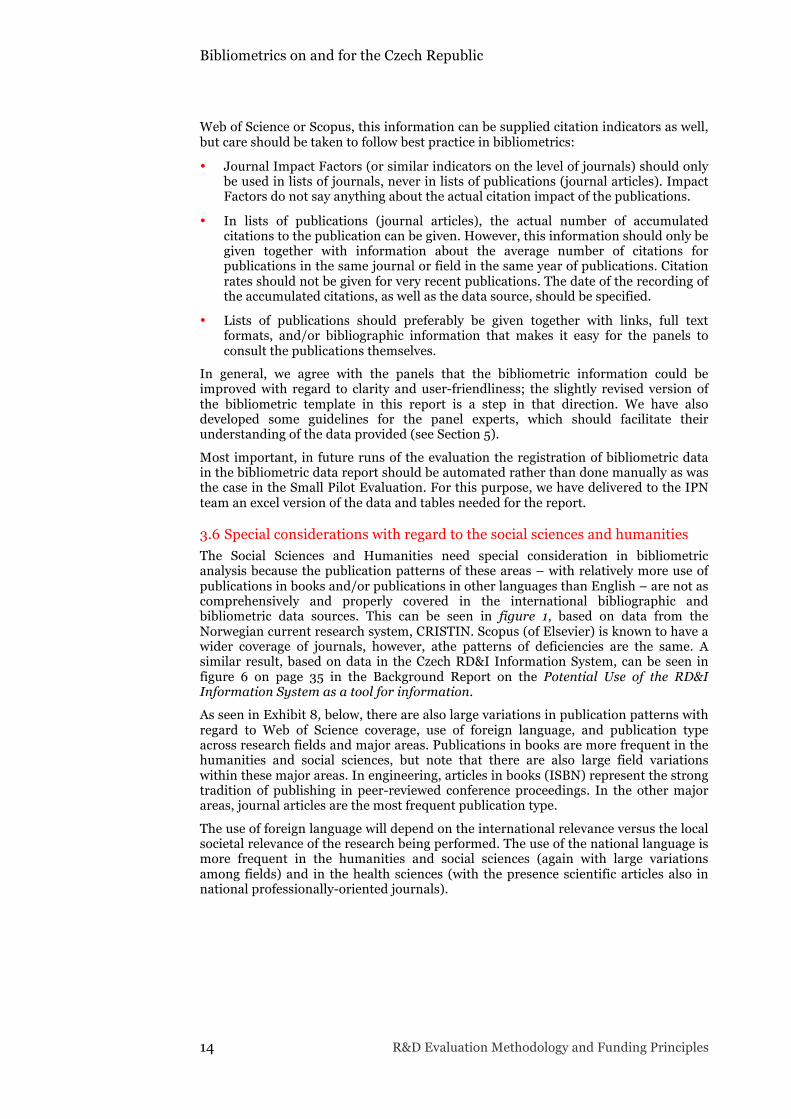
As seen in Exhibit 8, below, there are also large variations in publication patterns with regard to Web of Science coverage, use of foreign language, and publication type across research fields and major areas. Publications in books are more frequent in the humanities and social sciences, but note that there are also large field variations within these major areas. In engineering, articles in books (ISBN) represent the strong tradition of publishing in peer-reviewed conference proceedings. In the other major areas, journal articles are the most frequent publication type.
The use of foreign language will depend on the international relevance versus the local societal relevance of the research being performed. The use of the national language is more frequent in the humanities and social sciences (again with large variations among fields) and in the health sciences (with the presence scientific articles also in national professionally-oriented journals).
Bibliometrics on and for the Czech Republic
R&D Evaluation Methodology and Funding Principles 15
Exhibit 8 Coverage in Scopus and Web of Science of 70,500 scholarly publications in journals, series, and books from the higher education sector in Norway since 2005.
In general, scholars in the Social Sciences and Humanities more often publish directly (as authors of their own publications) for a wider audience in the societies and cultures that they relate to in their research. These publications are both popularizations of research in general (most frequent in the humanities) and professional communication of specific results, e.g. in commissioned reports (most frequent in the social sciences). In addition, nationally adapted textbooks for students are often preferred over international standard editions in the social sciences and humanities. Consequently, their scholars more often appear as authors of textbooks and other educational material. Note that there are also field differences: History usually has a wider national readership than classical studies or general linguistics, and experts in economics or law are more often asked to produce commissioned reports than experts in anthropology or media studies.
With all these considerations, the RD&I Information System stands out as a necessary supplementing data source in the social sciences and humanities, just as other current research information systems do in other countries. Our experience is, however, that the Czech system can be improved to perform this role in a way that would be more adequate for research evaluations. Our ideas with regard to such improvements are presented in section 4.2.1 of the Background Report 10 The RD&I Information System and an information tool for evaluation.
0%
10%
20%
30%
40%
50%
60%
70%
80%
90%
Health Sciences Natural Sciences Engineering Social Sciences Humanities
Scopus Web of Science
Bibliometrics on and for the Czech Republic
16 R&D Evaluation Methodology and Funding Principles
4. Manual for the bibliometrics report
This template (revised version February 2015 gives a view on the information and indicators that will be included in a future implementation of the evaluation methodology that we propose in this study.
MANUAL: The technical explanations of the indicators and how they were constructed will appear in the textboxes in read.
4.1 Introduction
4.1.1 Three groups of research outputs The research outputs are divided in three groups – scholarly outputs, non-traditional scholarly outputs, and IPR-related outputs.
For the scholarly outputs, bibliometric indicators are provided that can be compared within fields across Evaluated Units. The bibliometric indicators are based on bibliographic data that are derived from or can be verified against independently produced bibliographic data sources.
The quantitative information about non-traditional scholarly outputs and IPR-related outputs is based on institutional self-reporting in the national RD&I Information System (IS). In many cases, this information is less easy to verify and to bring into comparable indicators. Nonetheless, this information is important in the evaluation to understand and assess the activities that can be seen as expressed in non-scholarly outputs. These outputs will be listed with numbers in the self-reported categories.
Context information that is needed to understand and assess data on non-traditional scholarly and IPR-related outputs include: a) the self-evaluation report on these outputs and the activities they represent, and b) data to study examples of non-scholarly outputs.
For both the publication-type outputs and other type outputs and activities and IPR-related ones, it is necessary to understand how their types and relative frequencies vary with the field and type of research.
4.1.2 Purpose of the quantitative information The quantitative information about research outputs is only part of the material provided for the evaluation. The quantitative information is designed to support, not to replace, the qualitative judgement of the panel.
The relative importance of the three groups of outputs – as well as the types of outputs within them – can be expected to vary not only by field of research, but also the different purposes and forms of research.
None of the bibliometric indicators or numbers provided should be used alone. Instead, they should be seen in the context of each other and of other information provided for the evaluation. One reason is that peer review – much more than the performance indicators themselves – allows for overview, understanding, discussion and formative judgements. Another reason is that the indicators can enlighten each other, e.g an indicator of the number of authors per article in a field can enlighten the indicator of the presence of international co-authorship in the same field.
4.1.3 Data sources The bibliometric indicators covering publication-type research outputs have two complementary data sources:
Bibliometrics on and for the Czech Republic
R&D Evaluation Methodology and Funding Principles 17
• International: InCites by Thomson Reuters, providing data based on publications indexed for Web of Science in these categories: Articles, Reviews, Proceedings Papers, Letters.
• National: the Czech RD&I Information System (IS), providing data for publications in the following categories: Articles in peer-reviewed journals (type J); monographs (type B); book chapters (type C - includes Articles in Books and Chapters in Books); Proceedings papers (type D)
The data source for information about other research outputs and activities and IPR-related outputs is the Czech RD&I Information System, which can provide data for outputs in the following categories:
• Results used by the funding provider, projected into legislation or norm, projected into non-legislative or strategic documents (type H), Research report containing classified information (type V), Certified methodologies, art conservation methodologies, specialized map works (type N), Pilot plant (Zpilot), Verified technology (Ztech), Software (R), Prototypes, Function examples (G), Audiovisual production, electronic documents(A), Conference organization(M), Workshop organization (W), Exhibition organization (E), Other results (O)
• IPR-related outputs, i.e. Patents (type P), Plant variety (type Zodru), Animal breed (type Zplem), Utility model, Industrial design (F)
MANUAL: DATA SOURCES
In practice, two data sources based on the Web of Science from Thomson Reuters (TR) have to be available: InCites (as mentioned) and the National Citation Report (NCR) for the Czech Republic, which gives complete data on the level of articles, but for this country only. The NCR gives the only option for selecting articles on the level of Research Units, while InCites provides benchmarks for international comparison.
In addition, TR provided a file with specified benchmarks on request.
The data sources from TR have been made available for the IPN team.
4.1.4 The selection of bibliometric indicators The selection of the bibliometric indicators for quantitative information about scholarly publications is based on:
• The purpose of informing field specific panels in the best possible way
• Relevance for the institutional level of evaluation
• Well-established international practice in the field
• Availability, compatibility and transparency in relation to chosen data sources
• Comprehensiveness by also including publications not covered in international data sources, which is important especially in the humanities, the social sciences and the engineering sciences.
4.1.5 Time span of the indicators The time span for bibliometric indicators, also allowing for time series, is (for an evaluation conducted in 2015):
• 2008-2013 for publication-based indicators
• 2008-2012 for citation-based indicators, allowing a minimum of one full year for citing publications to be indexed
Bibliometrics on and for the Czech Republic
18 R&D Evaluation Methodology and Funding Principles
4.1.6 Field categorisation of the research outputs
• In Web of Science/InCites-based indicators, publications are classified by fields according to the journals they were published in. Thomson Reuters predefines both the underlying journal classification in 251 Web of Science fields and the aggregated OECD field classification used here.
• In RD&I IS-based data, the research outputs are classified in fields as they are reported to the RD&I IS by the institution. The RD&I IS classification is mapped over to the OECD classification by InfoScience, who is in charge of the RD&I IS.
For Interdisciplinary Research Units, there will be combined information on the fields they are most active in. This will include also information on the interdisciplinary journals they publish in.
MANUAL: FIELD CLASSIFICATION
A table mapping the WoS-fields into OECD fields has been made available from TR. WoS-journals are thereby classified also in the OECD classification.
4.1.7 Types of information and indicators The bibliometric information and indicators presented below are categorised in five main categories. The first category (A) are indicators on country level (Czech Republic); the other four categories are on the level of Research Units.
• A: Characteristics of the field (CR)
• B: Characteristics of the Research Unit (RU)
• C: Publishing Profile (RU)
• D: Citation Impact (RU)
• E: Collaboration (RU)
Citation indicators and collaboration indicators that demand reasonable coverage of the publications in Web of Science will not be applied in fields with more limited coverage.
The first five sections of this report (A to E) focus on the publication-type outputs as defined in Section 4.1.3, above. For these indicators, the total outputs in the time span 2008-2013 have been taken into account.
The last two sections, instead, provide statistical data on all research outputs of the Research Unit, including the publication trends over the years. These data are based on information registered in the Czech RD&I Information System. The sections are:
• F: All RD&I Information System registered outputs (RU)
• G: IPR-related outputs (RU)
In the chapters below we provide examples of the indicators, using fictitious numbers. We also included some graphs, illustrating how different data sets can be visualised.
4.2 A: Characteristics of the field (CR) This group of indicators are all meant to give the panel an overview of the characteristics of the field at country level, thereby providing a context for interpreting the indicators for a specific Research Unit in a specific field.
This information will be of particular value for the (main) panel members drafting the overview and analytical reports at the national field and/or disciplinary area level.
The same indicators will be used at the level of Research Units in the categories B-F below. More details about the indicators and their interpretation will be given there.
Bibliometrics on and for the Czech Republic
R&D Evaluation Methodology and Funding Principles 19
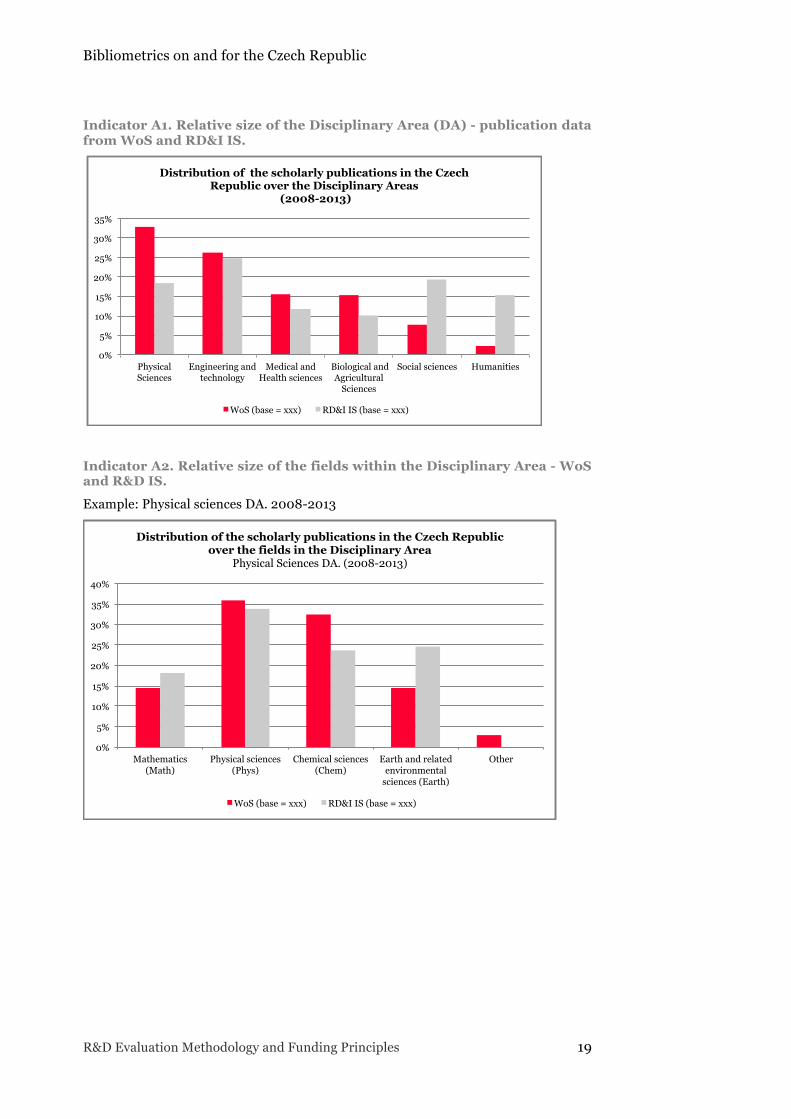
Indicator A1. Relative size of the Disciplinary Area (DA) - publication data from WoS and RD&I IS.
Indicator A2. Relative size of the fields within the Disciplinary Area - WoS and R&D IS.
Example: Physical sciences DA. 2008-2013
0%
5%
10%
15%
20%
25%
30%
35%
Physical Sciences
Engineering and technology
Medical and Health sciences
Biological and Agricultural
Sciences
Social sciences Humanities
Distribution of the scholarly publications in the Czech Republic over the Disciplinary Areas
(2008-2013)
WoS (base = xxx) RD&I IS (base = xxx)
0%
5%
10%
15%
20%
25%
30%
35%
40%
Mathematics (Math)
Physical sciences (Phys)
Chemical sciences (Chem)
Earth and related environmental
sciences (Earth)
Other
Distribution of the scholarly publications in the Czech Republic over the fields in the Disciplinary Area
Physical Sciences DA. (2008-2013)
WoS (base = xxx) RD&I IS (base = xxx)
Bibliometrics on and for the Czech Republic
20 R&D Evaluation Methodology and Funding Principles
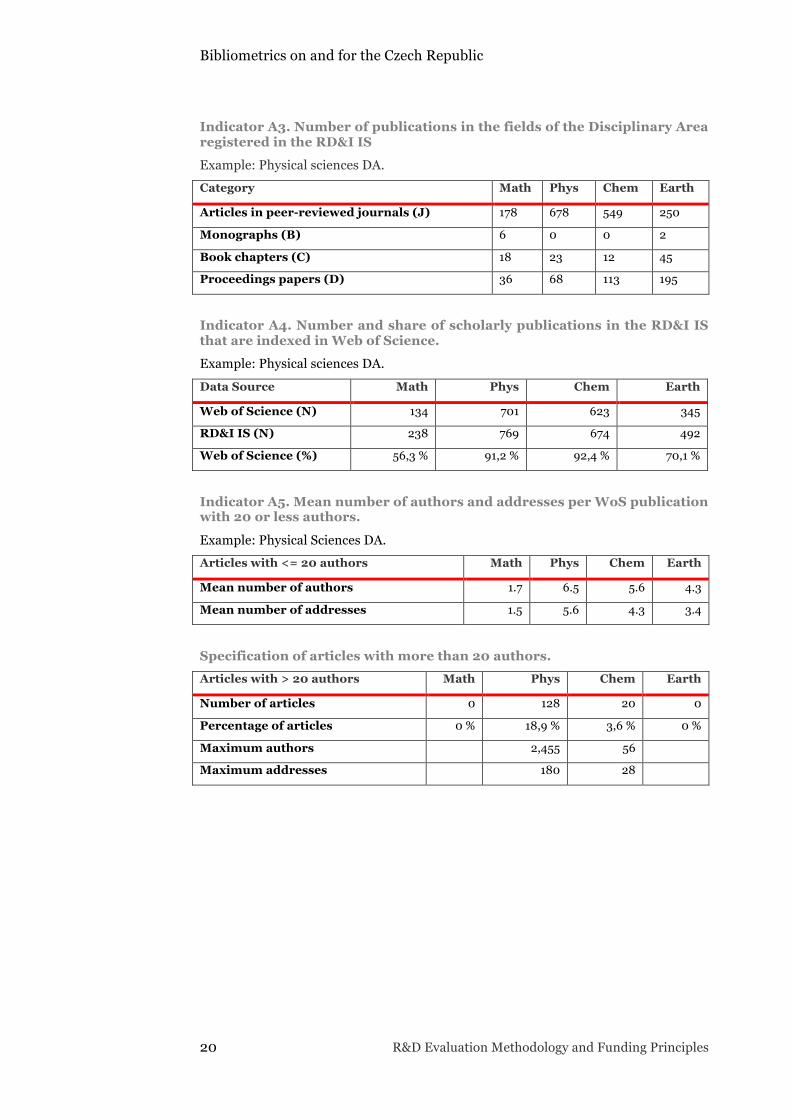
Indicator A3. Number of publications in the fields of the Disciplinary Area registered in the RD&I IS
Example: Physical sciences DA. Category Math Phys Chem Earth
Articles in peer-reviewed journals (J) 178 678 549 250
Monographs (B) 6 0 0 2
Book chapters (C) 18 23 12 45
Proceedings papers (D) 36 68 113 195
Indicator A4. Number and share of scholarly publications in the RD&I IS that are indexed in Web of Science.
Example: Physical sciences DA.
Data Source Math Phys Chem Earth
Web of Science (N) 134 701 623 345
RD&I IS (N) 238 769 674 492
Web of Science (%) 56,3 % 91,2 % 92,4 % 70,1 %
Indicator A5. Mean number of authors and addresses per WoS publication with 20 or less authors.
Example: Physical Sciences DA. Articles with <= 20 authors Math Phys Chem Earth
Mean number of authors 1.7 6.5 5.6 4.3
Mean number of addresses 1.5 5.6 4.3 3.4
Specification of articles with more than 20 authors. Articles with > 20 authors Math Phys Chem Earth
Number of articles 0 128 20 0
Percentage of articles 0 % 18,9 % 3,6 % 0 %
Maximum authors 2,455 56
Maximum addresses 180 28
Bibliometrics on and for the Czech Republic
R&D Evaluation Methodology and Funding Principles 21
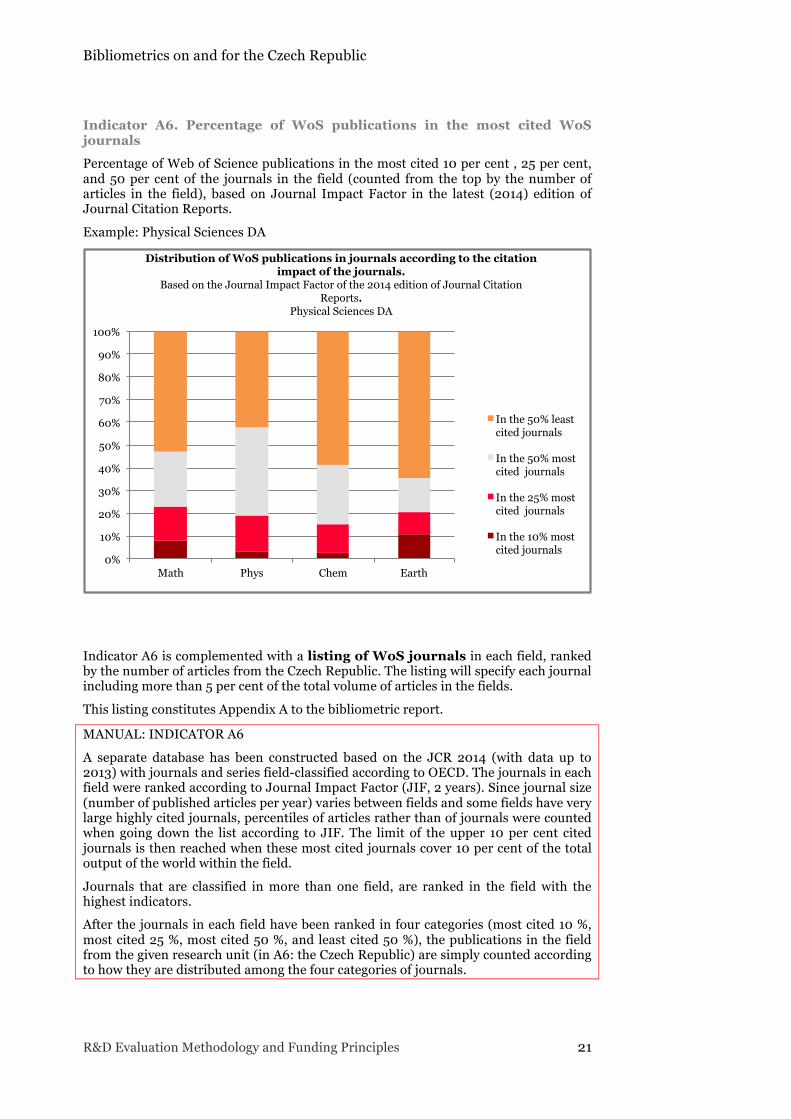
Indicator A6. Percentage of WoS publications in the most cited WoS journals
Percentage of Web of Science publications in the most cited 10 per cent , 25 per cent, and 50 per cent of the journals in the field (counted from the top by the number of articles in the field), based on Journal Impact Factor in the latest (2014) edition of Journal Citation Reports.
Example: Physical Sciences DA
Indicator A6 is complemented with a listing of WoS journals in each field, ranked by the number of articles from the Czech Republic. The listing will specify each journal including more than 5 per cent of the total volume of articles in the fields.
This listing constitutes Appendix A to the bibliometric report.
MANUAL: INDICATOR A6
A separate database has been constructed based on the JCR 2014 (with data up to 2013) with journals and series field-classified according to OECD. The journals in each field were ranked according to Journal Impact Factor (JIF, 2 years). Since journal size (number of published articles per year) varies between fields and some fields have very large highly cited journals, percentiles of articles rather than of journals were counted when going down the list according to JIF. The limit of the upper 10 per cent cited journals is then reached when these most cited journals cover 10 per cent of the total output of the world within the field.
Journals that are classified in more than one field, are ranked in the field with the highest indicators.
After the journals in each field have been ranked in four categories (most cited 10 %, most cited 25 %, most cited 50 %, and least cited 50 %), the publications in the field from the given research unit (in A6: the Czech Republic) are simply counted according to how they are distributed among the four categories of journals.
0%
10%
20%
30%
40%
50%
60%
70%
80%
90%
100%
Math Phys Chem Earth
Distribution of WoS publications in journals according to the citation impact of the journals.
Based on the Journal Impact Factor of the 2014 edition of Journal Citation Reports.
Physical Sciences DA
In the 50% least cited journals
In the 50% most cited journals
In the 25% most cited journals
In the 10% most cited journals

Bibliometrics on and for the Czech Republic
22 R&D Evaluation Methodology and Funding Principles
The extra information with a list of the most used journals in the field is a necessary background for the interpretation of indicator A6. The number and percentage of articles in the most used journal can, as an example, in some instances explain that there is a high number of articles in the least cited journals.
Indicator A7. Mean Field Normalized Citation Impact of Czech WoS publications
Mean Field Normalized Citation Impact, compared to the world average (=1,00) and the EU28 average (=1,00).
Example: Physical sciences, comparison with the world average. 2008 2009 2010 2011 2012
Math 0.91 0.87 0.95 0.99 1.04
Phys 1.05 1.01 0.98 1.10 1.01
Chem 0.78 0.93 0.98 0.83 1.01
Earth 0.76 0.73 0.80 0.83 0.96
MANUAL: INDICATOR A7
Within each field, A7 is the average citation rate of the articles from a given research unit (in this case: the Czech Republic) in a given year divided by the average citation rate of all articles in the same field and year from the world (or the EU28). The average of the RU is counted from the available data while the world and EU28 averages are provided through InCites or as benchmarks from Thomson Reuters.
Indicator A7 should not be calculated for fields with low coverage in the WoS (e.g. humanities).
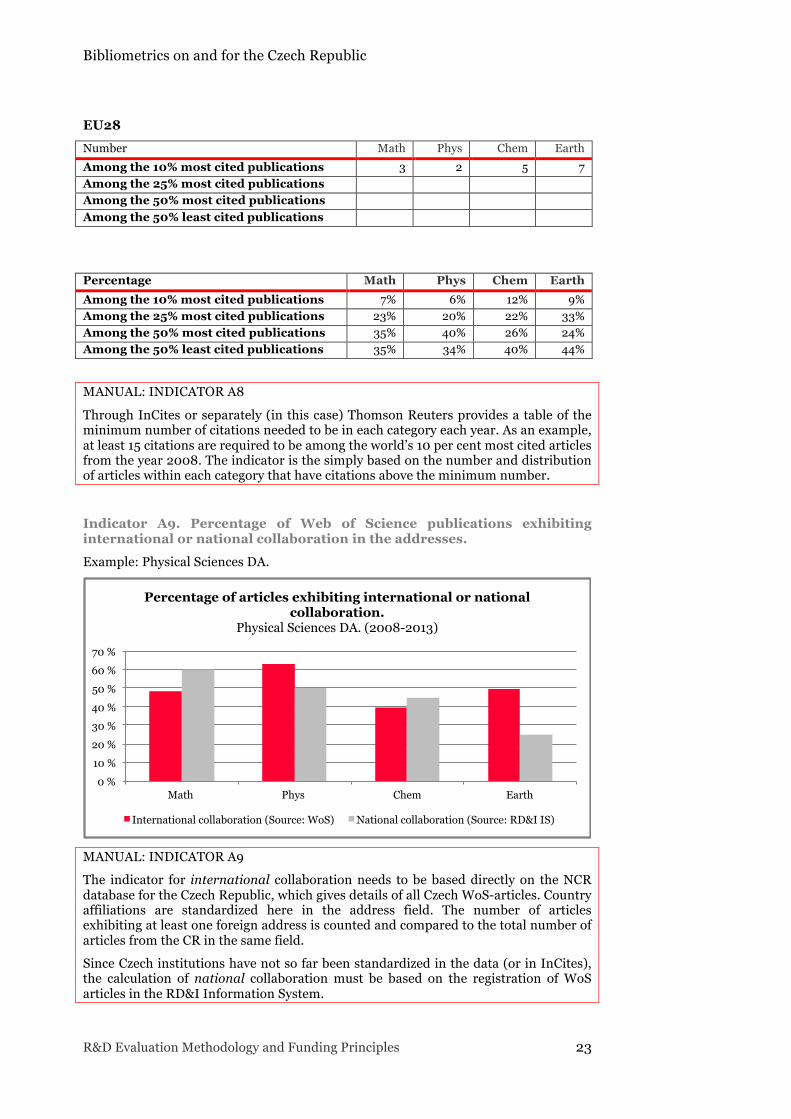
Indicator A8. Number and percentage of Czech publications in WoS among the most cited publications.
Number and percentage of Czech WoS publications among the top 10%, and 25% most cited publications (world, EU28).
World Number Math Phys Chem Earth Among the 10% most cited publications 3 2 5 7 Among the 25% most cited publications Among the 50% most cited publications Among the 50% least cited publications
Percentage Math Phys Chem Earth Among the 10% most cited publications 7% 6% 12% 9% Among the 25% most cited publications 23% 20% 22% 33% Among the 50% most cited publications 35% 40% 26% 24% Among the 50% least cited publications 35% 34% 40% 44%
Bibliometrics on and for the Czech Republic
R&D Evaluation Methodology and Funding Principles 23
EU28 Number Math Phys Chem Earth Among the 10% most cited publications 3 2 5 7 Among the 25% most cited publications Among the 50% most cited publications Among the 50% least cited publications
Percentage Math Phys Chem Earth Among the 10% most cited publications 7% 6% 12% 9% Among the 25% most cited publications 23% 20% 22% 33% Among the 50% most cited publications 35% 40% 26% 24% Among the 50% least cited publications 35% 34% 40% 44%
MANUAL: INDICATOR A8
Through InCites or separately (in this case) Thomson Reuters provides a table of the minimum number of citations needed to be in each category each year. As an example, at least 15 citations are required to be among the world’s 10 per cent most cited articles from the year 2008. The indicator is the simply based on the number and distribution of articles within each category that have citations above the minimum number.
Indicator A9. Percentage of Web of Science publications exhibiting international or national collaboration in the addresses.
Example: Physical Sciences DA.
MANUAL: INDICATOR A9
The indicator for international collaboration needs to be based directly on the NCR database for the Czech Republic, which gives details of all Czech WoS-articles. Country affiliations are standardized here in the address field. The number of articles exhibiting at least one foreign address is counted and compared to the total number of articles from the CR in the same field.
Since Czech institutions have not so far been standardized in the data (or in InCites), the calculation of national collaboration must be based on the registration of WoS articles in the RD&I Information System.
0 % 10 % 20 % 30 % 40 % 50 % 60 % 70 %
Math Phys Chem Earth
Percentage of articles exhibiting international or national collaboration.
Physical Sciences DA. (2008-2013)
International collaboration (Source: WoS) National collaboration (Source: RD&I IS)
Bibliometrics on and for the Czech Republic
24 R&D Evaluation Methodology and Funding Principles
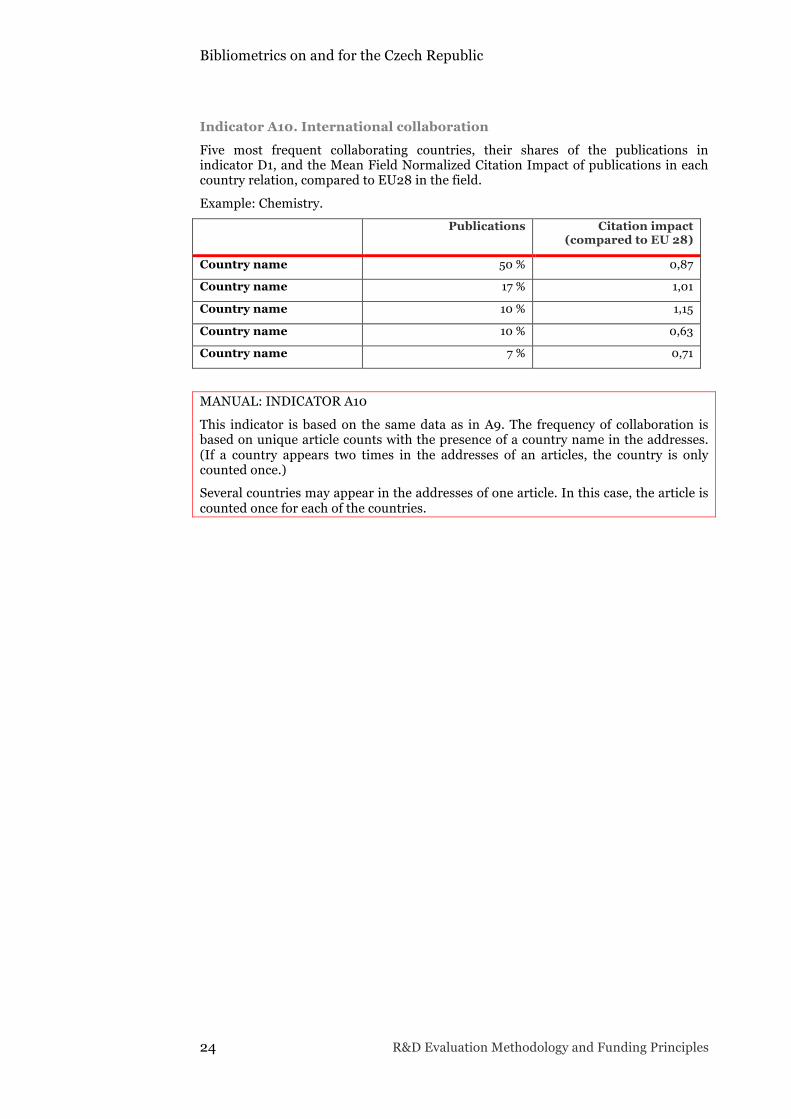
Indicator A10. International collaboration
Five most frequent collaborating countries, their shares of the publications in indicator D1, and the Mean Field Normalized Citation Impact of publications in each country relation, compared to EU28 in the field.
Example: Chemistry. Publications Citation impact
(compared to EU 28)
Country name 50 % 0,87
Country name 17 % 1,01
Country name 10 % 1,15
Country name 10 % 0,63
Country name 7 % 0,71
MANUAL: INDICATOR A10
This indicator is based on the same data as in A9. The frequency of collaboration is based on unique article counts with the presence of a country name in the addresses. (If a country appears two times in the addresses of an articles, the country is only counted once.)
Several countries may appear in the addresses of one article. In this case, the article is counted once for each of the countries.
Bibliometrics on and for the Czech Republic
R&D Evaluation Methodology and Funding Principles 25
4.3 B: Characteristics of the Research Unit (RU) Research Unit: (name in evaluation)
Evaluated Unit: (name)
Field of Research: (OECD field, 2nd level (examples: Mathematics, Chemical Engineering, Basic Medicine, Political Science, History and Archaeology.)
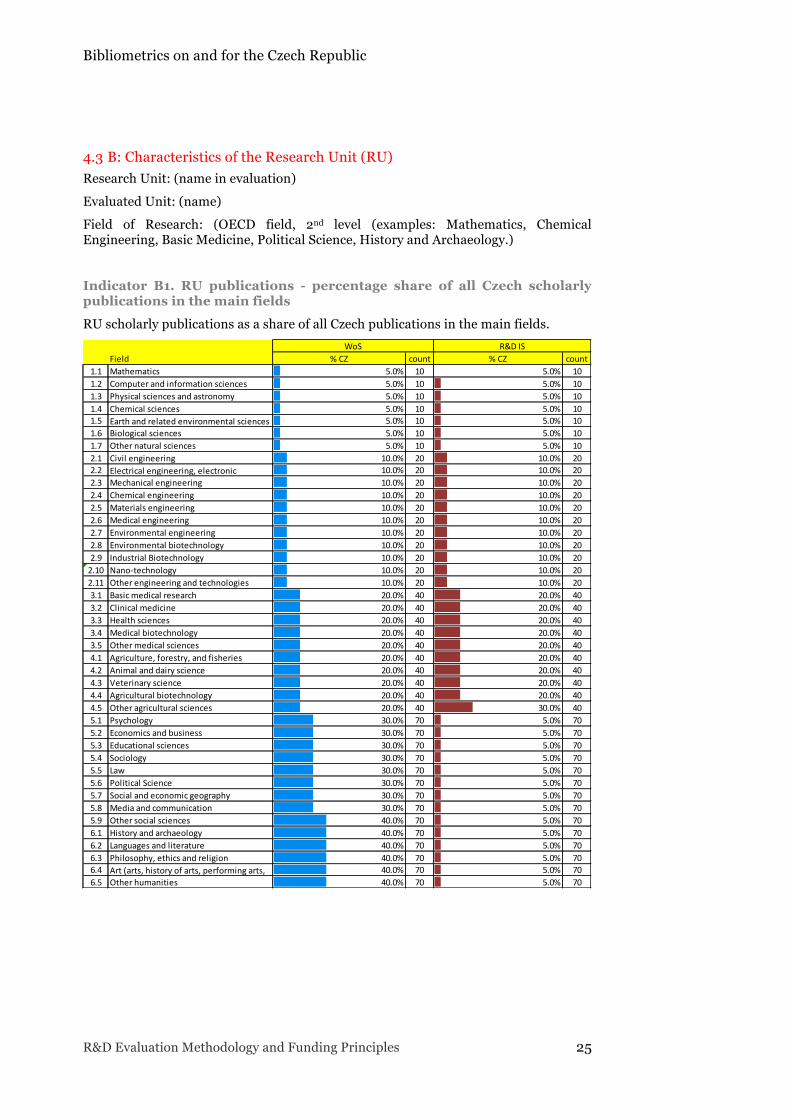
Indicator B1. RU publications - percentage share of all Czech scholarly publications in the main fields
RU scholarly publications as a share of all Czech publications in the main fields.
Field % CZ count % CZ count1.1 Mathematics 5.0% 10 5.0% 101.2 Computer and information sciences 5.0% 10 5.0% 101.3 Physical sciences and astronomy 5.0% 10 5.0% 101.4 Chemical sciences 5.0% 10 5.0% 101.5 Earth and related environmental sciences 5.0% 10 5.0% 101.6 Biological sciences 5.0% 10 5.0% 101.7 Other natural sciences 5.0% 10 5.0% 102.1 Civil engineering 10.0% 20 10.0% 202.2 Electrical engineering, electronic 10.0% 20 10.0% 202.3 Mechanical engineering 10.0% 20 10.0% 202.4 Chemical engineering 10.0% 20 10.0% 202.5 Materials engineering 10.0% 20 10.0% 202.6 Medical engineering 10.0% 20 10.0% 202.7 Environmental engineering 10.0% 20 10.0% 202.8 Environmental biotechnology 10.0% 20 10.0% 202.9 Industrial Biotechnology 10.0% 20 10.0% 202.10 Nano-‐technology 10.0% 20 10.0% 202.11 Other engineering and technologies 10.0% 20 10.0% 203.1 Basic medical research 20.0% 40 20.0% 403.2 Clinical medicine 20.0% 40 20.0% 403.3 Health sciences 20.0% 40 20.0% 403.4 Medical biotechnology 20.0% 40 20.0% 403.5 Other medical sciences 20.0% 40 20.0% 404.1 Agriculture, forestry, and fisheries 20.0% 40 20.0% 404.2 Animal and dairy science 20.0% 40 20.0% 404.3 Veterinary science 20.0% 40 20.0% 404.4 Agricultural biotechnology 20.0% 40 20.0% 404.5 Other agricultural sciences 20.0% 40 30.0% 405.1 Psychology 30.0% 70 5.0% 705.2 Economics and business 30.0% 70 5.0% 705.3 Educational sciences 30.0% 70 5.0% 705.4 Sociology 30.0% 70 5.0% 705.5 Law 30.0% 70 5.0% 705.6 Political Science 30.0% 70 5.0% 705.7 Social and economic geography 30.0% 70 5.0% 705.8 Media and communication 30.0% 70 5.0% 705.9 Other social sciences 40.0% 70 5.0% 706.1 History and archaeology 40.0% 70 5.0% 706.2 Languages and literature 40.0% 70 5.0% 706.3 Philosophy, ethics and religion 40.0% 70 5.0% 706.4 Art (arts, history of arts, performing arts, 40.0% 70 5.0% 706.5 Other humanities 40.0% 70 5.0% 70
WoS R&D IS
Bibliometrics on and for the Czech Republic
26 R&D Evaluation Methodology and Funding Principles
Indicator B2. Percentage share of all scholarly outputs by the Evaluated Unit
Publications by the RU versus all publications by the EvU, all fields taken together
Interpretation: These indicators identify the relative size – measured in publication output (research activity) of the Research Unit within its field in the country and within the Evaluated Unit it belongs to. Coverage in Web of Science is field dependent. The bibliometric report will advise how to use, or not to use, indicators based on Web of Science in each specific field. Nr RU
publications Nr EvU publications
RU % of EvU total
Source: WoS 22 110 20.0%
Source: RD&I IS 36 120 30.0%
Indicator B1 and B2 will be given for all included Research Units in all fields in the evaluation methodology, both within fields and within Evaluated Units. This will give an overview of the relative contributions of each Evaluated Unit to each field in the Czech Republic. In the Pilot Evaluation(s), the two indicators will be given for each selected RU with the field characteristics (Indicator group A above) as context.
4.4 C: Publishing Profile (RU) Interpretation: The indicators in this group give an overview of the publishing profile of the Research Unit. This profile should be contextualized with other material provided to the evaluation panel, such as:
• The information on the level of the field given in indicator group A
• Field and type of research
• Mission, size and resources of the Evaluated Unit, as given in the self-evaluation and in other statistical information provided for the evaluation
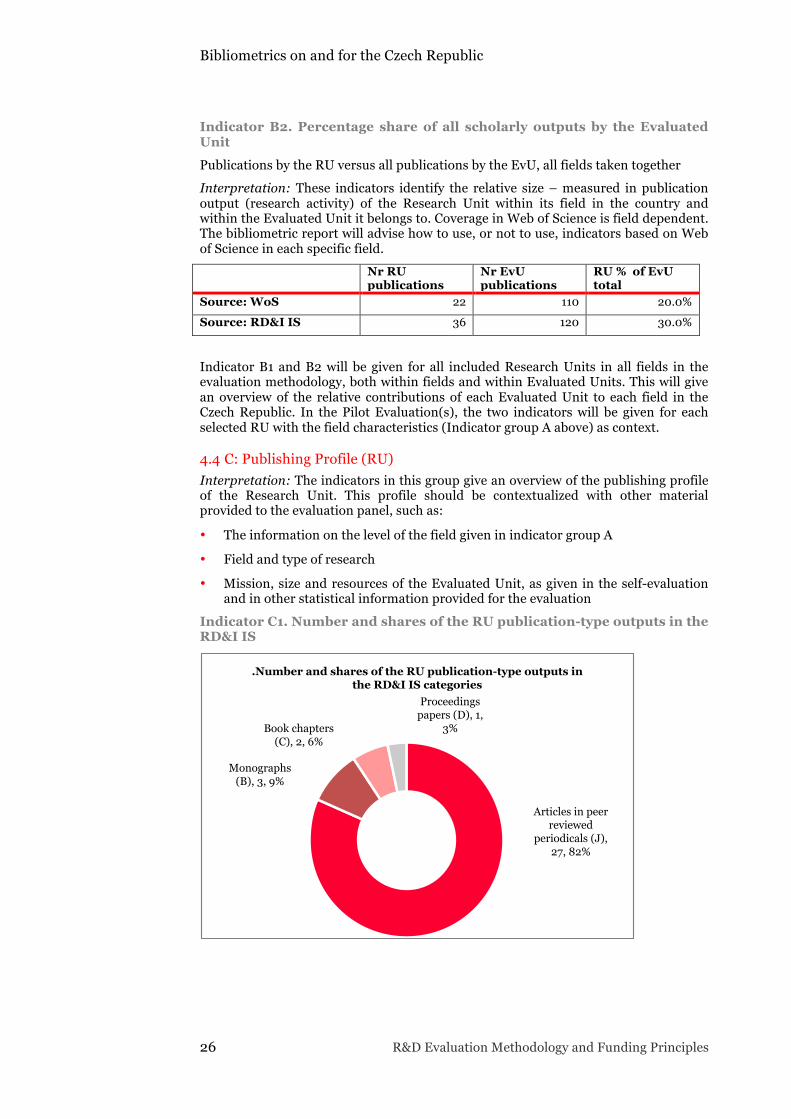
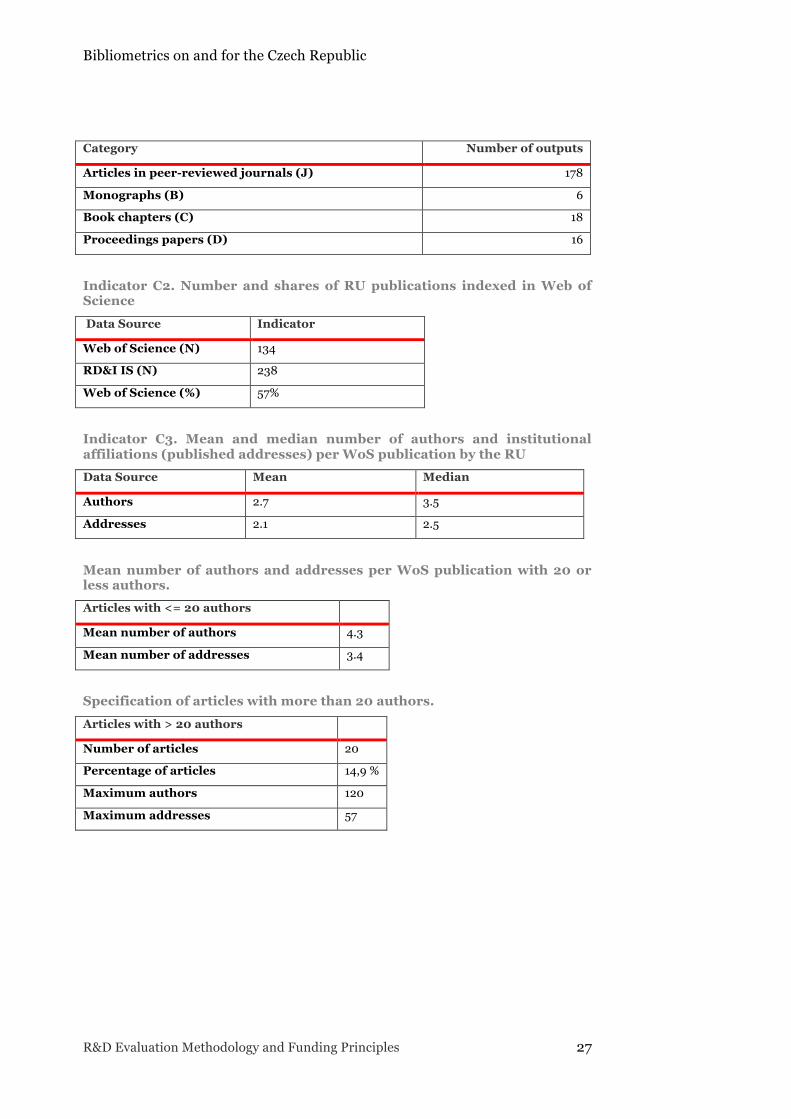
Indicator C1. Number and shares of the RU publication-type outputs in the RD&I IS
Articles in peer reviewed
periodicals (J), 27, 82%
Monographs (B), 3, 9%
Book chapters (C), 2, 6%
Proceedings papers (D), 1,
3%
.Number and shares of the RU publication-type outputs in the RD&I IS categories
Bibliometrics on and for the Czech Republic
R&D Evaluation Methodology and Funding Principles 27
Category Number of outputs
Articles in peer-reviewed journals (J) 178
Monographs (B) 6
Book chapters (C) 18
Proceedings papers (D) 16
Indicator C2. Number and shares of RU publications indexed in Web of Science Data Source Indicator
Web of Science (N) 134
RD&I IS (N) 238
Web of Science (%) 57%
Indicator C3. Mean and median number of authors and institutional affiliations (published addresses) per WoS publication by the RU Data Source Mean Median
Authors 2.7 3.5
Addresses 2.1 2.5
Mean number of authors and addresses per WoS publication with 20 or less authors. Articles with <= 20 authors
Mean number of authors 4.3
Mean number of addresses 3.4
Specification of articles with more than 20 authors. Articles with > 20 authors
Number of articles 20
Percentage of articles 14,9 %
Maximum authors 120
Maximum addresses 57
Bibliometrics on and for the Czech Republic
28 R&D Evaluation Methodology and Funding Principles
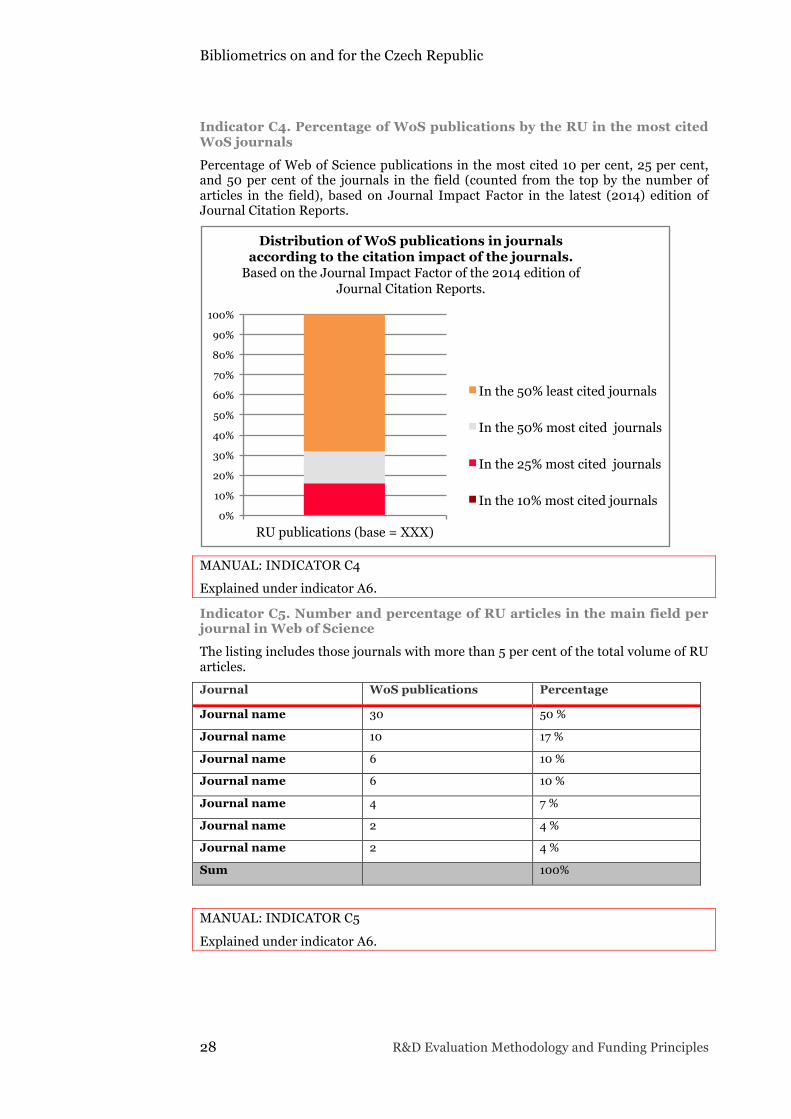
Indicator C4. Percentage of WoS publications by the RU in the most cited WoS journals
Percentage of Web of Science publications in the most cited 10 per cent, 25 per cent, and 50 per cent of the journals in the field (counted from the top by the number of articles in the field), based on Journal Impact Factor in the latest (2014) edition of Journal Citation Reports.
MANUAL: INDICATOR C4
Explained under indicator A6.
Indicator C5. Number and percentage of RU articles in the main field per journal in Web of Science
The listing includes those journals with more than 5 per cent of the total volume of RU articles. Journal WoS publications Percentage
Journal name 30 50 %
Journal name 10 17 %
Journal name 6 10 %
Journal name 6 10 %
Journal name 4 7 %
Journal name 2 4 %
Journal name 2 4 %
Sum 100%
MANUAL: INDICATOR C5
Explained under indicator A6.
0%
10%
20%
30%
40%
50%
60%
70%
80%
90%
100%
RU publications (base = XXX)
Distribution of WoS publications in journals according to the citation impact of the journals.
Based on the Journal Impact Factor of the 2014 edition of Journal Citation Reports.
In the 50% least cited journals
In the 50% most cited journals
In the 25% most cited journals
In the 10% most cited journals
Bibliometrics on and for the Czech Republic
R&D Evaluation Methodology and Funding Principles 29
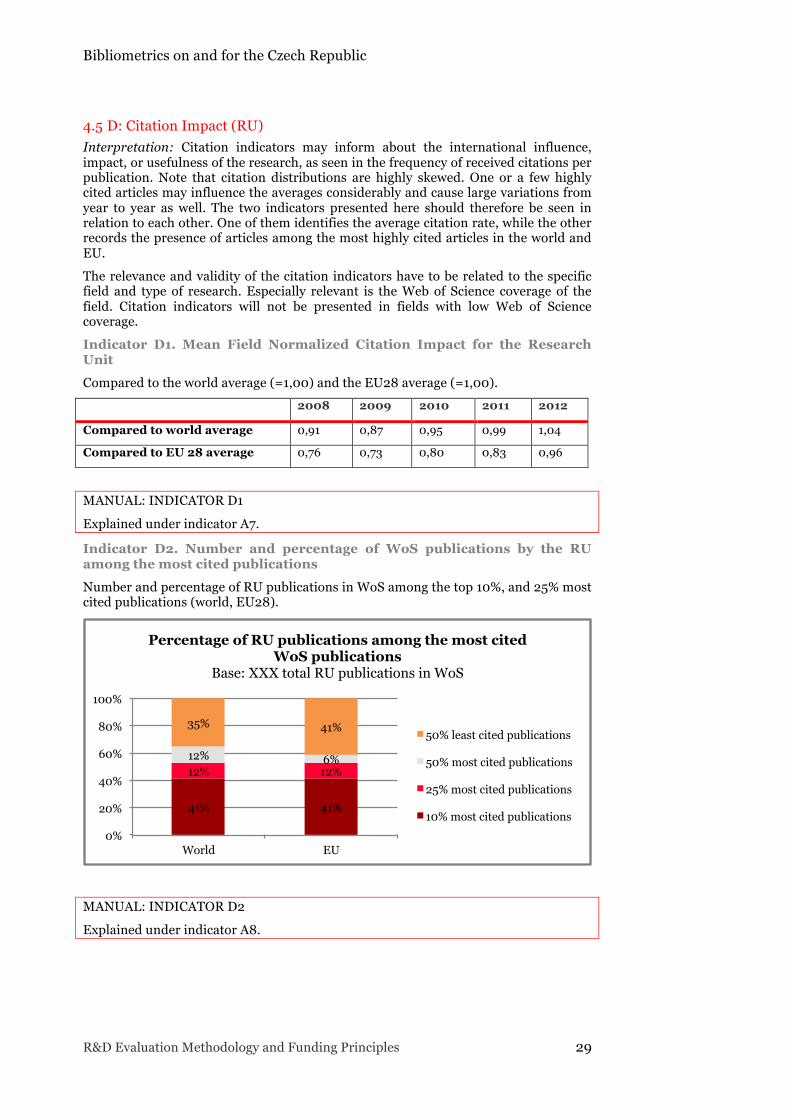
4.5 D: Citation Impact (RU) Interpretation: Citation indicators may inform about the international influence, impact, or usefulness of the research, as seen in the frequency of received citations per publication. Note that citation distributions are highly skewed. One or a few highly cited articles may influence the averages considerably and cause large variations from year to year as well. The two indicators presented here should therefore be seen in relation to each other. One of them identifies the average citation rate, while the other records the presence of articles among the most highly cited articles in the world and EU.
The relevance and validity of the citation indicators have to be related to the specific field and type of research. Especially relevant is the Web of Science coverage of the field. Citation indicators will not be presented in fields with low Web of Science coverage.
Indicator D1. Mean Field Normalized Citation Impact for the Research Unit
Compared to the world average (=1,00) and the EU28 average (=1,00). 2008 2009 2010 2011 2012
Compared to world average 0,91 0,87 0,95 0,99 1,04
Compared to EU 28 average 0,76 0,73 0,80 0,83 0,96
MANUAL: INDICATOR D1
Explained under indicator A7.
Indicator D2. Number and percentage of WoS publications by the RU among the most cited publications
Number and percentage of RU publications in WoS among the top 10%, and 25% most cited publications (world, EU28).
MANUAL: INDICATOR D2
Explained under indicator A8.
41% 41%
12% 12% 12% 6%
35% 41%
0%
20%
40%
60%
80%
100%
World EU
Percentage of RU publications among the most cited WoS publications
Base: XXX total RU publications in WoS
50% least cited publications
50% most cited publications
25% most cited publications
10% most cited publications

Bibliometrics on and for the Czech Republic
30 R&D Evaluation Methodology and Funding Principles
4.6 E: Collaboration (RU) Interpretation: These indicators provide information about the relations to main partners in international and national collaboration in the field, as seen in the addresses of co-authored publications. Caution has to be taken with regard to publishing practices in the field, see Indicator B3: Mean and median number of authors and addresses per WoS publication. Generally, the relevance and validity of the collaboration indicators will have to be related to the publication practices in the specific field of research and their Web of Science coverage. The collaboration indicators will not be presented in fields with low Web of Science coverage. (The R&D IS needs further development to make the basis for similar indicators.)
Indicator E1. Percentage of RU publications exhibiting international and national collaboration in the addresses 2008 2009 2010 2011 2012 2013
International collaboration (Source: WoS)
17% 26% 26% 33% 33% 35%
National collaboration (Source: RD&I IS)
10% 17% 26% 17% 26% 24%
MANUAL: INDICATOR E1
Explained under indicator A9.
Indicator E2. Five most frequent collaborating countries, their shares of the RU’s publications, and the Mean Field Normalized Citation Impact of articles in each country relation, compared to EU28 in the field. Share of international
co-publications Citation impact (compared to EU 28)
Country name 50 % 0,87
Country name 17 % 1,01
Country name 10 % 1,15
Country name 10 % 0,63
Country name 7 % 0,71
The five most frequent collaborating Research Organisations in the main field are also listed (but without indicators because of missing address unification in InCites for several Czech institutions):
Names of five Czech institutions in descending order.
MANUAL: INDICATOR E2
Explained under indicator A10.
Bibliometrics on and for the Czech Republic
R&D Evaluation Methodology and Funding Principles 31
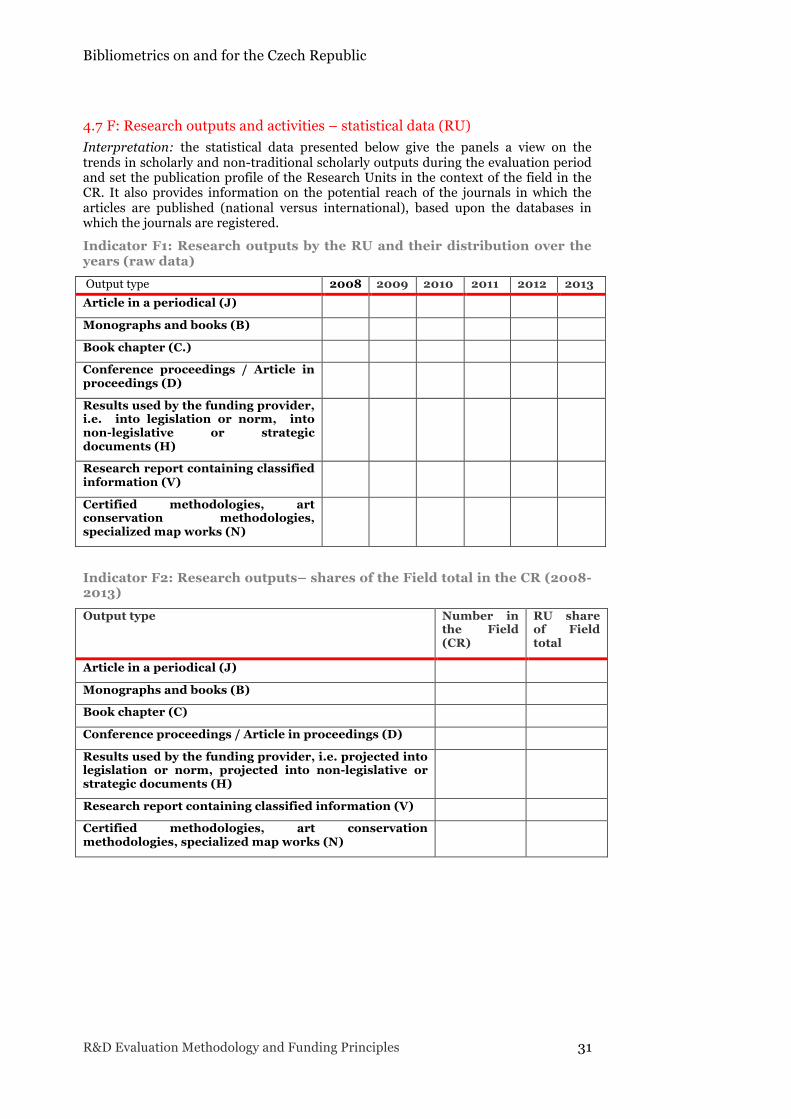
4.7 F: Research outputs and activities – statistical data (RU) Interpretation: the statistical data presented below give the panels a view on the trends in scholarly and non-traditional scholarly outputs during the evaluation period and set the publication profile of the Research Units in the context of the field in the CR. It also provides information on the potential reach of the journals in which the articles are published (national versus international), based upon the databases in which the journals are registered.
Indicator F1: Research outputs by the RU and their distribution over the years (raw data) Output type 2008 2009 2010 2011 2012 2013 Article in a periodical (J)
Monographs and books (B)
Book chapter (C.)
Conference proceedings / Article in proceedings (D)
Results used by the funding provider, i.e. into legislation or norm, into non-legislative or strategic documents (H)
Research report containing classified information (V)
Certified methodologies, art conservation methodologies, specialized map works (N)
Indicator F2: Research outputs– shares of the Field total in the CR (2008-2013) Output type Number in
the Field (CR)
RU share of Field total
Article in a periodical (J)
Monographs and books (B)
Book chapter (C)
Conference proceedings / Article in proceedings (D)
Results used by the funding provider, i.e. projected into legislation or norm, projected into non-legislative or strategic documents (H)
Research report containing classified information (V)
Certified methodologies, art conservation methodologies, specialized map works (N)
Bibliometrics on and for the Czech Republic
32 R&D Evaluation Methodology and Funding Principles
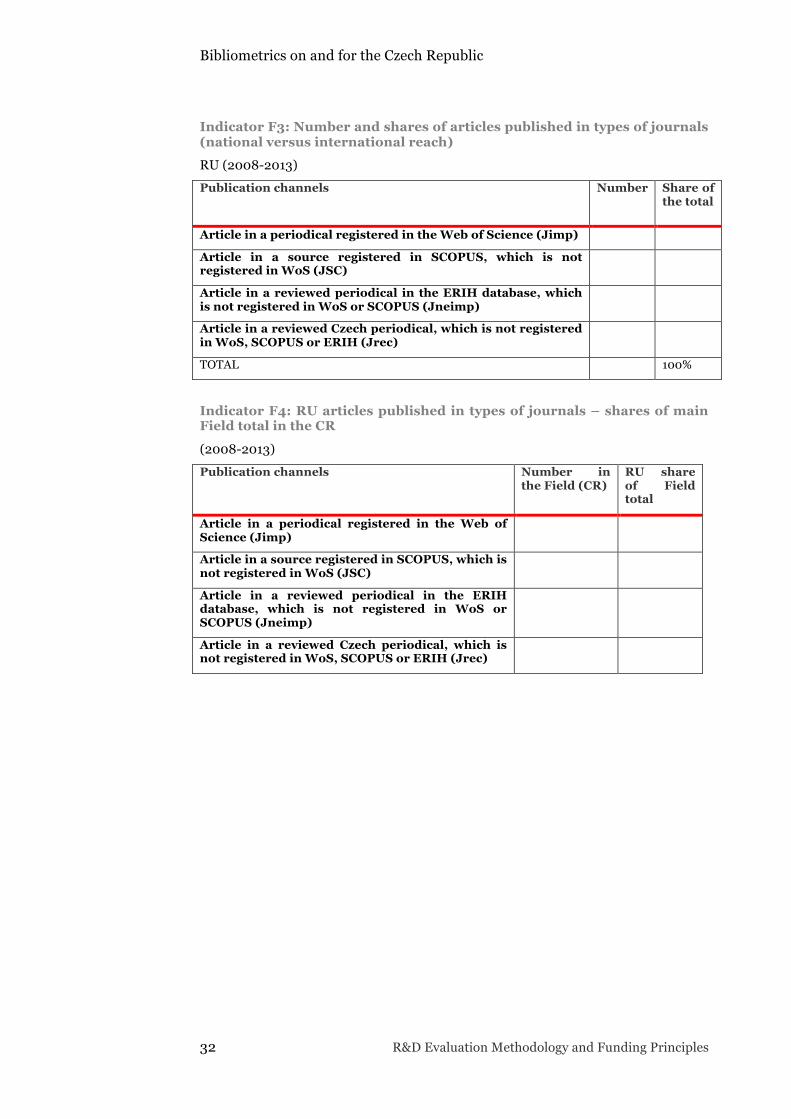
Indicator F3: Number and shares of articles published in types of journals (national versus international reach)
RU (2008-2013) Publication channels Number Share of
the total
Article in a periodical registered in the Web of Science (Jimp)
Article in a source registered in SCOPUS, which is not registered in WoS (JSC)
Article in a reviewed periodical in the ERIH database, which is not registered in WoS or SCOPUS (Jneimp)
Article in a reviewed Czech periodical, which is not registered in WoS, SCOPUS or ERIH (Jrec)
TOTAL 100%
Indicator F4: RU articles published in types of journals – shares of main Field total in the CR
(2008-2013) Publication channels Number in
the Field (CR) RU share of Field total
Article in a periodical registered in the Web of Science (Jimp)
Article in a source registered in SCOPUS, which is not registered in WoS (JSC)
Article in a reviewed periodical in the ERIH database, which is not registered in WoS or SCOPUS (Jneimp)
Article in a reviewed Czech periodical, which is not registered in WoS, SCOPUS or ERIH (Jrec)
Bibliometrics on and for the Czech Republic
R&D Evaluation Methodology and Funding Principles 33
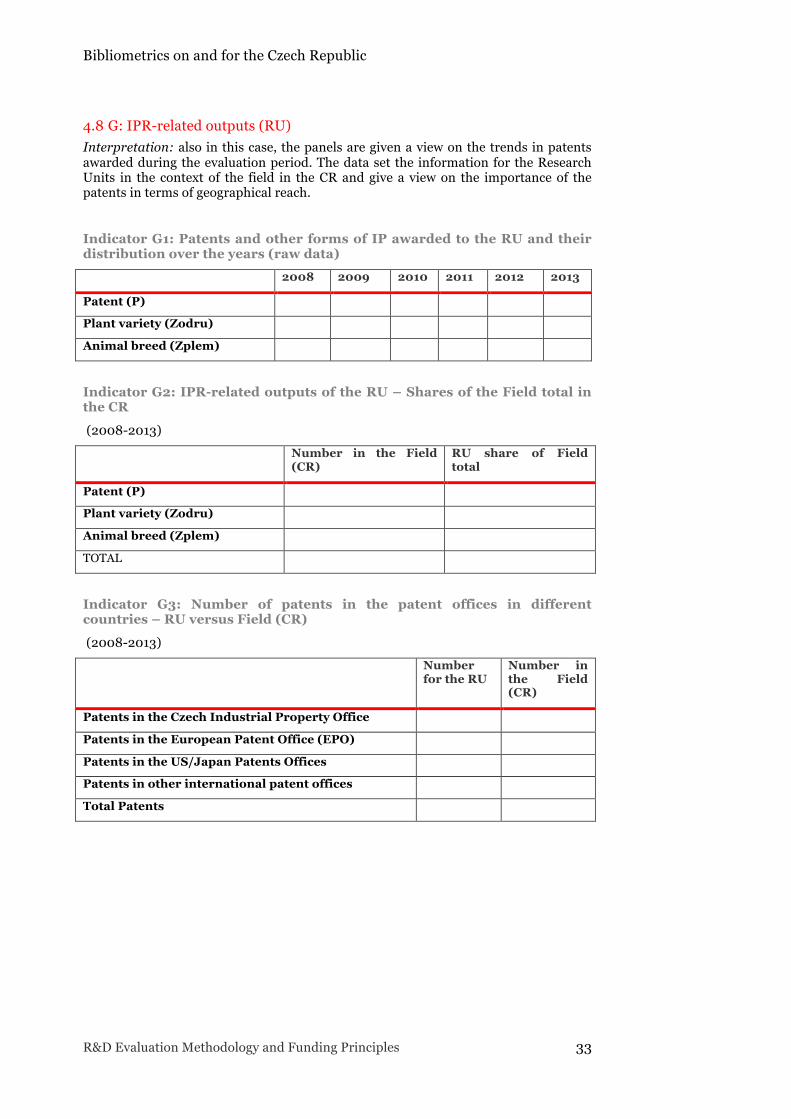
4.8 G: IPR-related outputs (RU) Interpretation: also in this case, the panels are given a view on the trends in patents awarded during the evaluation period. The data set the information for the Research Units in the context of the field in the CR and give a view on the importance of the patents in terms of geographical reach.
Indicator G1: Patents and other forms of IP awarded to the RU and their distribution over the years (raw data) 2008 2009 2010 2011 2012 2013
Patent (P)
Plant variety (Zodru)
Animal breed (Zplem)
Indicator G2: IPR-related outputs of the RU – Shares of the Field total in the CR
(2008-2013) Number in the Field
(CR) RU share of Field total
Patent (P)
Plant variety (Zodru)
Animal breed (Zplem)
TOTAL
Indicator G3: Number of patents in the patent offices in different countries – RU versus Field (CR)
(2008-2013) Number
for the RU Number in the Field (CR)
Patents in the Czech Industrial Property Office
Patents in the European Patent Office (EPO)
Patents in the US/Japan Patents Offices
Patents in other international patent offices
Total Patents
Bibliometrics on and for the Czech Republic
34 R&D Evaluation Methodology and Funding Principles
4.9 Appendix A: Listing of WoS journals in the fields of the Disciplinary Area
The listing specifies each journal that contains more than 5 per cent of the total volume of Czech articles in the fields.
The listing of WoS journals is ranked by the number of articles from the Czech Republic.
4.10 Appendix B: Full list of publications by the RU
All publications will be listed indicating at least the links to the abstracts in English stored in the RD&I IS.
4.10.1 Articles in periodicals (J) Ranked by journal - author
4.10.2 Monographs and books (B)
4.10.3 Book chapters (C)
4.10.4 Conference proceedings / Article in proceedings (D) Ranked by conference – author
Bibliometrics on and for the Czech Republic
R&D Evaluation Methodology and Funding Principles 35
5. Guidelines for the panels’ use of bibliometric information
Two main practical lessons from the Small Pilot Evaluation seem to be:
• Panels in different fields may have different needs for explanations of the bibliometric information.
• If possible, there should be direct contact between bibliometric experts and the panels as they are presented with the information the first time, thereby giving room for questions and comments.
• On the background of our experiences with the SPE, we recommend that full lists of publications should be provided for all journals used by the EvU – in descending order by number of publications in the evaluation and with alphabetical order as the second criterion.
More generally, the project has resulted in a shared understanding of the role of bibliometrics in the collaboration between our bibliometric team and the IPN KA1 team as well as in larger meetings within the project:
• The quantitative information about research outputs is only part of the material provided for the evaluation and should be read in relation to the other material, e.g. the self-evaluation reports.
• Furthermore, the quantitative information is designed to support, not to replace, the qualitative judgement of the panel.
• In all panels, it is necessary to take into consideration that the research practices and outputs vary not only by field, but also by the purpose of the organization that is hosting the evaluated unit.
• An understanding of the limitations of international data sources – e.g. as explained in the section above about the social sciences and humanities – is also needed for a careful use of bibliometric information.
When confronted with the bibliometric indicators, the panels should not judge them one by one, but instead see them in the context and look for how they might enlighten each other. One reason is that peer review – much more than the performance indicators themselves – allows for overview, understanding, discussion and formative judgements. Another reason is that the indicators can enlighten each other, e.g an indicator of the number of authors per article in a field can enlighten the indicator of the presence of international co-authorship in the same field. The last mentioned indicator might also enlighten the indicators for citation impact.
Specific guidelines for the use and interpretation of the indicators are presented in the following.
5.1.1 Specific guidelines for the indicators The bibliometric indicators for which we provide guidelines below are categorised in five main groups. The first group (A) are indicators on country level (Czech Republic); the other four groups are on the level of Research Units.
• A: Characteristics of the field (CR)
• B: Characteristics of the Research Unit (RU)
• C: Publishing Profile (RU)
• D: Citation Impact (RU)
• E: Collaboration (RU)
Bibliometrics on and for the Czech Republic
36 R&D Evaluation Methodology and Funding Principles
In addition to these indicators, we provide guidelines for the understanding of statistical information based on data registered in the Czech RD&I Information System. Here, the groups are:
• F: All RD&I Information System registered outputs (RU)
• G: IPR-related outputs (RU)
The group A of indicators are meant to give the panel an overview of the characteristics of the field at country level, thereby providing a context for interpreting the indicators for a specific Research Unit in a specific field.
The group B indicators provide an overview of the field structure of a specific RU in terms of its publications counts as well as its relative size and weight within the EvU and the share of knowledge generation againstin the whole Czech R&D system.
The group C indicators give an overview of the publishing profile of the Research Unit. This profile should be contextualized with other material provided to the evaluation panel, such as, the information on the level of the field given in indicator group A, the field and type of research, and the mission, size and resources of the Evaluated Unit, as given in the self-evaluation and in other statistical information provided for the evaluation.
There are two indicators in group D, Citation Impact. They may inform about the international influence, impact, or usefulness of the research, as seen in the frequency of received citations per publication. The relevance and validity of the citation indicators have to be related to the specific field and type of research. Especially relevant is the Web of Science coverage of the field. Citation indicators should not be used in fields with low Web of Science coverage.
The group E indicators on collaboration provide information about the relations to main partners in international and national collaboration in the field, as seen in the addresses of co-authored publications. Generally, the relevance and validity of the collaboration indicators will have to be related to the publication practices in the specific field of research and their Web of Science coverage.
The group F indicators provide statistical data which give the panels a view on the trends in scholarly and non-traditional scholarly outputs during the evaluation period and set the publication profile of the Research Units in the context of the field in the CR. It also provides information on the potential reach of the journals in which the articles are published (national versus international), based upon the databases in which the journals are registered.
Also in group G, the panels are given a view on the trends in patents awarded during the evaluation period. The data set the information for the Research Units in the context of the field in the CR and give a view on the importance of the patents in terms of geographical reach.
Indicators requiring the same methodology and guidelines may appear in more than one group. Hence, similar indicators from each group are given the same guidelines below.
A1. Relative size of the Disciplinary Area (DA) - publication data from WoS and RD&I IS
This indicator gives the overall view of the research activity in Disciplinary Areas in terms of contribution to the whole publication output of the Czech Republic. Both the publications recorded by the WoS and RD&I IS are given. As the RD&I IS indexes all peer reviewed journals, ERIH PLUS titles and a non-impacted Czech peer reviewed titles, it provides a more realistic description of the publication activities in Engineering, Social Sciences and Humanities. This indicator depicts also the limitations of the use of WoS based indicators for the description of the publication activities of the Czech researchers/ROs.
Bibliometrics on and for the Czech Republic
R&D Evaluation Methodology and Funding Principles 37
A2. Relative size of the fields within the Disciplinary Area - WoS and R&D IS
This indicator depicts the research intensity in the CR on field level within a Disciplinary Area. The inclusion of the broader RD&I IS data balances out the underrepresentation of social sciences, humanities and some engineering fields. On the other hand, the indicator demonstrates in what fields WoS has a more comprehensive coverage.
A3 and C1. Number of publications in the fields of the Disciplinary Area registered in the RD&I IS
This indicator gives the number of publications from the Czech Republic with a breakdown by RD&I publication output types. Thus, it characterizes the typical publication pattern of the Area.
A4 and C2. Number and share of scholarly publications in the RD&I IS that are indexed in Web of Science
This indicator shows to what degree the Czech publication output is covered in WoS, and how representative, in general, the WoS is as a data source in the Area. From the viewpoint of any country, the WoS has a more comprehensive coverage in some fields than in others. The percentage indicating the coverage of a field should therefore as an indicator of field specific traits rather than as a performance indicator for the Czech Republic. Note the comparison of WoS and the RD&I IS is based on two different field classifications which have been mapped against each other, and not on the same classification.
A5 and C3. Mean number of authors and addresses per WoS publication with 20 or less authors
With this indicator, one can observe field differences in publication practices that are important to take into consideration when measuring research productivity and collaboration activity in publications. Fields with high numbers of authors and addresses per publication can be expected to have a higher productivity and collaboration activity if publications and co-author relations are measured in whole counts (and not fractionalized) per EvU.
Specification of articles with more than 20 authors
Indicator A5 includes a specification of articles with more than 20 authors. Without this specification, the mean numbers would have been highly influenced by so-called the hyper-authorships, which occur in very frequent collaborative publications originating from large international research consortiums, especially in the field of nuclear and high energy physics, space sciences and some life sciences fields. In these consortiums, all members are usually credited in all publications.
A6, C4, and C5. Percentage of WoS publications in the most cited WoS journals
This indicator only concerns publications that are indexed by WoS. The indicator answers the question: To what degree are the publications published in the most cited journals? Note that the indicator is based on the Journal Impact Factor (JIF), which measures the average citation rate of all articles in a journal, not only those from the Czech Republic. In addition, the JIF cannot predict the actual citation impact of an article, since the distribution of citations among the articles in a journal is highly skewed (a few articles receive most of the citations). Consequently, indicator A6 demonstrates an aspect of the publication pattern of Czech science, and not of the citation impact of Czech science.
In some fields, WoS indexes journals with articles that mainly originate from Czech institutions. Indicator A6 may be influenced by such national journals. For this reason, and in order to provide a more detailed view of the publication pattern of Czech research within WoS in each Disciplinary Area, indicator A6 is supplemented with a
Bibliometrics on and for the Czech Republic
38 R&D Evaluation Methodology and Funding Principles
listing of WoS journals in each field, ranked by the number of articles from the Czech Republic. The listing will specify each journal that has published more than 5 per cent of the total volume of articles in the fields. This listing constitutes Appendix A to the bibliometric report.
C5. Number and percentage of RU articles in the main field per journal in Web of Science
On the level of research units (RU), indicator C4 is supplemented by indicator C5 with a listing of WoS journals in each field, ranked by the number of articles from the Czech Republic. The listing will specify each journal that has published more than 5 per cent of the total volume of articles in the fields. This listing is a parallel at the RU level to Appendix A which is a supplement to indicator A6.
A7 and D1. Mean Field Normalized Citation Impact of Czech WoS publications
While indicator A6 demonstrates an aspect of the publication pattern of Czech research (choice of journals), indicator A7 measures the citation impact of Czech research directly. Here, the indicator is based on the actual number of citations that each article from the Czech Republic actually receives.
Citation impact is measured as the number of times a publication has been cited in subsequent publications, compared to the average in the world or in the EU for the same field in the same year (=1,00). There is no basis in the bibliometric literature for interpreting citation impact as a direct expression of “research quality”. However, there is general agreement that citation impact indicates the influence or usefulness of the results of research on the international level. It is not possible for a publication to reach a high number of citations – compared to the average – without being cited by a large number of publications originating from many different authors and countries. Hence, there is no need for considering self-citations when this indicator is used on country level.
As explained above (indicator A6), the number of citations are highly skewed among publications. This is also true on country level. A few highly cited publications may influence the annual variations of the indicator. On the other hand, large numbers of seldom or never cited publications may bring the indicator below the international average.
A8 and D2. Number and percentage of Czech publications in WoS among the most cited publications
Because of the skewed distribution of citations over publications, indicator A7 (above) has a limitation in measuring only the average. As a supplement, indicator A8 shows the number and percentage of Czech WoS publications among the top 10%, 25% and 50% most cited publications within the totals for the world and EU28 in each field. This indicator will reveal to what extent the country takes part in publishing the most influential publications in a field, and also, to what extent in contributes to the seldom or never cited publications.
A9 and E1. Percentage of WoS publications exhibiting international or national collaboration in the addresses
The indicator is based the institutional affiliations of the authors as they are recorded as the published addresses in WoS or directly as the institutional affiliation in RD&I IS. Only one occurrence of a relation between two different institutions or countries is counted per publication. The indicator describes to what extent there is collaboration with researchers abroad or with researchers at other institutions with the Czech Republic, measured as a percentage of the total of articles per unit in the field. Note that in cases of hyper-authorship (see indicator A5 above), these articles may heavily influence the statistics in indicator A9.
Bibliometrics on and for the Czech Republic
R&D Evaluation Methodology and Funding Principles 39
A10 and E2. International collaboration
This indicator is a supplement to indicator A9. It shows the most frequent collaborating countries, their shares of the WoS publications (numbers are given in indicator A4), and the Mean Field Normalized Citation Impact (similar to indicator A7) of publications in each country relation, compared to EU28 in the field.
B1. RU publications - percentage share of all Czech scholarly publications in the main fields
Indicators B1 and NB2 identify the relative size – measured in publication output (research activity) of the Research Unit within its field in the country and within the Evaluated Unit it belongs to. Figures are based on both WoS and RD&I IS data. Indicator B1 and B2 should be calculated for all included Research Units in all fields in the evaluation methodology, both within fields and within Evaluated Units. This will give an overview of the relative contributions of each Evaluated Unit to each field in the Czech Republic. Note that coverage in Web of Science is field dependent and not a performance indicator in itself. The bibliometric report will advise how to use, or not to use, indicators based on Web of Science in each specific field.
B2. Percentage share of all scholarly outputs by the Evaluated Unit
See under indicator B1 above.
F1. Research outputs by the RU and their distribution over the years (raw data)
This is an output profile with annual counts per RD&I IS category. An output profile should reflect the type and field of research of the RU and the mission of its Research Organization.
F2. Research outputs– shares of the Field total in the CR (2008-2013)
The indicator F2 gives the measure of the relative performance of the evaluated RU and thus its national importance within a particular field of research. As this indicator is a function of the RU size it should be combined with the D family indicators when drawing general conclusion on the importance of a particular RU within the national R&D system. The non-publication outputs are more characteristic for EvUs/RUs involved in applied research and innovations.
F3. Number and shares of articles published in types of journals (national versus international reach)
The indicator provides information on the potential reach of the journals in which the articles are published (national versus international), based upon the databases in which the journals are registered.
F4. RU articles published in types of journals – shares of main Field total in the CR
This indicator is a supplement to F3 by widening the comparative perspective. In general, the F2 –F4 indicators serve mainly the understanding of what databases are most relevant for the evaluation purposes, but they also provide a basis for a judgement of the output profile in relation to the mission, field of research and type of research of the RU.
Bibliometrics on and for the Czech Republic
40 R&D Evaluation Methodology and Funding Principles
G1: Patents and other forms of IP awarded to the RU and their distribution over the years (raw data)
G2: IPR-related outputs of the RU – Shares of the Field total in the CR
G3: Number of patents in the patent offices in different countries – RU versus Field (CR)
These indicators should serve the panel members with information on the existence and extent of the IPR outputs. Note that they can only give partial information about innovation and societal impact activities. Their appraisal rests on the peer review process which should represent expertise in what types of outputs can be expected from the RU.


In collaboration with