building better...role of mini-grid (companies) • mini-grids are a tool of the government to reach...
TRANSCRIPT


Building betterpolicy & financethrough data.

AMDA:Who we areWe are a Trade Association that acts as the voice for Mini-Grids & Decentralized Utility Companies in Africa:
29 members across 6 countries (estimated 65% of active developers in Africa)
Minigrid Companies that develop and operate minigrids
Service Level uptime of more than 20 hours a day
INDUSTRY INTELLIGENCE
Provide a platform that enables transparency in industry performance through comprehensive market data and analytics in order to establish, evaluate and promote key financial, business and policy solutions to overcoming the major barriers to growth for the sector
ADVOCACY
Collaborating with industry, policy-makers, government authorities, donors, and other stakeholders to advocate for optimal policies and efficient capital deployment that will benefit the mini-grid sector and the people it serves
COORDINATION
Serving as the voice of the mini-grid development industry in Africa to promote the growth and sustainable development of the mini-grid sector and act as a unified focal point for stakeholders to engage the sector

Why Mini-grids in Africa
Mini-gridsmore connection impact per investment dollar with Rapidly declining costs
$938 per connection
Estimated Costs for 2018, including generation costs
19% APEX
reduction between 2017 & 2018
97.8%Reliability and customer service for end-users Current Service Level
6 Weeks
Minigrids can be deployed in as little as 6 weeks
Solar PV Mini-grids
Can be deployed anywhere in the country and are not limited to particular geographic locations

Why Mini-grids in Africa
Mini-gridsmore connection impact per investment dollar with Rapidly declining costs
Goal #7Ensure access to affordable, reliable, sustainableand modern energy for all.
573 Million people in SSA
The global electrification rate is an impressive 89% but still 573 million people in SSA do not have access.
30have electrification rates below 50% - all but 2 are in SSA
144 Countries
have electrification rates above 75% -only 7 of these are in SSA
100
Between 100 million and 300 million are best electrified using mini-grids (IEA, UNDESA and Cross Boundary)Countries
300
Million and
Million

0
1000
2000
3000
4000
5000
2014 2015 2016 2017 2018
CAPEX PER CONNECTION No. OF CONNECTIONS
Declining cost with scale
Significant cost reduction as numbers of connections increase
• 2017: $1,163/connection • 2018: $938/connection • 2020 (estimated): $600 to $700/connection

• Estimated Costs for 2018 are $938 per connection including generation costs
• 19% CAPEX reduction between 2017 & 2018 • Reliability and customer service for end-users Current Service
Level is 97.8%• Mini-grids can be deployed in as little as 6 weeks • Solar PV MiniGrids can be deployed anywhere in the country and
are not limited to particular geographic locations
Grant
PrivateCAPEX
Initial AMDAData insights –Sector Funding
Mini-gridsmore connection impact per investment dollar with Rapidly declining costs

0
50
100
150
200
250
300
350
GRID MINIGRID OFF - GRID
POPULATION GAINING ACCESS
FOSSIL FUEL WIND HYDRO SOLAR PV OTHER
Mini-grids Potential
IEA says that with supportive policy and finance, mini-grids can serve 450 million people
Mini-grids and other decentralized renewables are most affordable option for 75% of the un-electrified

Mini-grids Potential
IEA says that with supportive policy and finance, mini-grids can serve 450 million people
Mini-grids and other decentralized renewables are most affordable option for 75% of the un-electrified

-
20,000,000
40,000,000
60,000,000
80,000,000
100,000,000
120,000,000
140,000,000
160,000,000
180,000,000
Estimated CAPEX Finance Secured Financing Gap
54,307,922
22,725,277 31,582,645
45,730,669
7,768,445
37,962,224
65,317,838
-
65,317,838
2018 2019 2020
Financing Gap (TZ & Kenya)

Initial AMDA data insights –Kenya pipeline
133MGs being actively built out 2019-2020
370Sites identified as viable with GIS and site visits
54,396Connections through visible pipeline
2,850Additional sites identified as likely viable through GIS

• Only 2 of 39 Utilities in Africa are solvent • They are massively subsidies and still can’t provide quality
service • Riddled with Poor Management and inefficiencies • Grid extension costs for communities more than 10km from the
grid cost between 1500-$26,000 a connection
Existing Utility Companies

0
5
10
15
20
25
30
35
40
45
50
0 200 400 600 800 1000 1200 1400 1600 1800
AR
PU
($
/mo
nth
)
CAPEX ($/connection)
ARPU required to maintain different Project IRRs at varying Capex
15%
13%
11%
9%
7%
5%
Unfinanceable
Financeable
Typical African Mini-Grids
Typical SHS1
systems
Rural Grid Extension (>4km from grid)
Project IRR
Typical rural Tanzanian’s
energy budget -10% of monthly
income
Sources: World Bank, McKinsey Power Africa Report , Tanzania Rural Energy Authority, Tanzania Rural Electrification Expansion Program. Note: 1. ESMAP Tier 2 SHS providing General lighting and Phone Charging and Television Chart developers by Cross Boundary
Need for subsidy: Most rural customers cannot afford SHS1, and mini-grids and main grid extensions are unfinanceable without government support
Although commercially viable, SHS1 are too expensive for most rural consumers’ energy budget. Main grid rural extensions and mini-grids require subsidy.

Currently there are 2 parallel funding streams for rural electrification that are not speaking to each other
Policy Implications
Governments have no mechanism to compare how their policies impact pricing and spread of deployment
Benchmarking costs for MG’s is a first step to creating comparative analytics between traditional utilities and new decentralized utility companies

SHS Micro-grids National Utility
Electricity Delivered DC AC AC
Capex / Connection $100 – 400 $700 – 1,200 $2,000 – 5,000
Installation Time ✓ ✓
Reliability ✓ ✓
Service Level
Only Low-Power DC
Devices
✓
Grid-equivalent power
✓
Grid-equivalent power
Energy Cost
>$4.00 per kWh✓
$0.20-$2.00 per kWh
✓
$0.15-$0.50 per kWh
Main Grid Integration
Not Possible✓ N/A
Convergent with Global Future Power System
No clear path to
convergence with global
system
✓
Micro-grids are building
blocks of future grid
Grid of the 20th century,
not 21st
Least Cost Option for Electrification

What MG Developers in Africa Are Being Asked to DO
Deliver better than utility quality Power Infrastructure :
Build Generation and Distribution system that are compatible with the national utility for less than Utilities:
Build Infrastructure with limited & unreliable concessional money:
Fix Rural Economies:
AMDA Members provide 97% service uptime (there is no good way to compare to utilities as they do not provide information on service level for rural consumers)
Average MG cost in East Africa was 938$ per connection in 2018 – KPLC is > 1500 TANESCO is > 2500
Between 2014 – May 2018 14% of minigrid costs were paid for with concessional funds. 86% was equity
Minigrid developers are also now being tasked and evaluated on the basis of education performance/ Health Performance as well as improved economic outcomes
Show Commercial returns in 5-7 years:
While competing with subsidies utility companies and virtually NO access to debt

AMDA Data for: Policy Makers
Approach
Private sector as Contractor (Senegal) Private sector as Owner (Nigeria)
• Public ownership of generation and distribution to retain energy as a publicly provided service.
• Government dictates mini-grid location• Government determines price
Role of mini-grid (companies)
• Mini-grids are a tool of the government to reach underserved areas.
• Mini-grid companies are government service providers, and do not own the mini-grids.
Advantages • Easy access to finance for grids (government backed)• Potentially easier to cross subsidize rural connections
Disadvantages • Little incentive to improve demand / rural economies• Little incentive to improve quality• Little incentive for good customer service• Little options for communities left behind• Little incentive to increase efficiency / reduce subsidy• Little incentive to bring external investment• Little incentive to expand and create jobs
• Private ownership to maximize speed and efficiency of rural electrification.
• Mini-grid firm (decentralized utility) bids on concessions• Decentralized utilities negotiate price w/ communities
• Decentralized utilities reduce rural burden for governments so they can focus on improving “big” grid.
• Decentralized utilities are private sector owners and operators of grids they build.
• High incentive to improve demand / rural economies• High incentive for good quality energy service• High incentive for good customer service • High incentive to improve efficiency / reduce costs• High incentive to bring external investment• High incentive to expand and create jobs
• Difficult for companies to access finance (new sector) without support
• Pricing can be political – but mostly happens only when politicians make it political – not a community issue.

Donors Donors Donors Donors
Gov’ts Gov’ts Gov’ts Gov’ts
MonopolyUtility
MonopolyUtility
MonopolyUtility
MonopolyUtility
Donors Donors Donors Donors
Gov’ts Gov’ts Gov’ts Gov’ts
Coordination / Aggregation / Standardization
Utilities UtilitiesUtilitiesUtilitiesUtilitiesUtilitiesUtilitiesUtilities
Focus is on injecting money into public monopoly utilities while trying to reform/improve them with TA
Utility management improvement driven by de-monopolization
Myriad donor efforts which can be challenging to coordinate and standardize
Donors coordinate to create a un1if1ied results-based subsidy policy
Having multiple utilities can help de-politicize tariffs
Ecosystem schematic of both Philosophies in action
1. Institution-Driven (now) 2. Market-Driven (goal)

+
How do weCreate a Market-DrivenSolution to the problem?
Basic Policy Reform
• Lightweight mini-grid permitting process• Tariff liberalization (cost reflective)• Multi-utility integration framework
Market-Driven Incentives
• SMART RBF (unified among donors)• Urban/Rural Cross Subsidies
Healthy Utilities
• Management Capacity• Scale• Customer Centric
(demand stimulation, payments)• Ability to Utilize: Grid Extensions,
Mini-Grids, SHS
=

Global pan-African RBF concept
Global donors fund the Global RBF Facility with$50b over 15 years.
Decisions on electrification are done on a
least cost, best service level basis
Funds available in all countries who are willing to enact basic reforms and sector liberalization
Funds available to both private and public utilities deploying grid extensions, mini-grids, and SHS, according to a simple 3- zone plan agreed upon by Apollo and host government.
Project Financiers
Utilities deploy assets with private finance, and receive a rebate from the Global RBF facility after validation that they are built to standard.
100m connection, future grid, diversified energy economies
$50B $$$
$$$
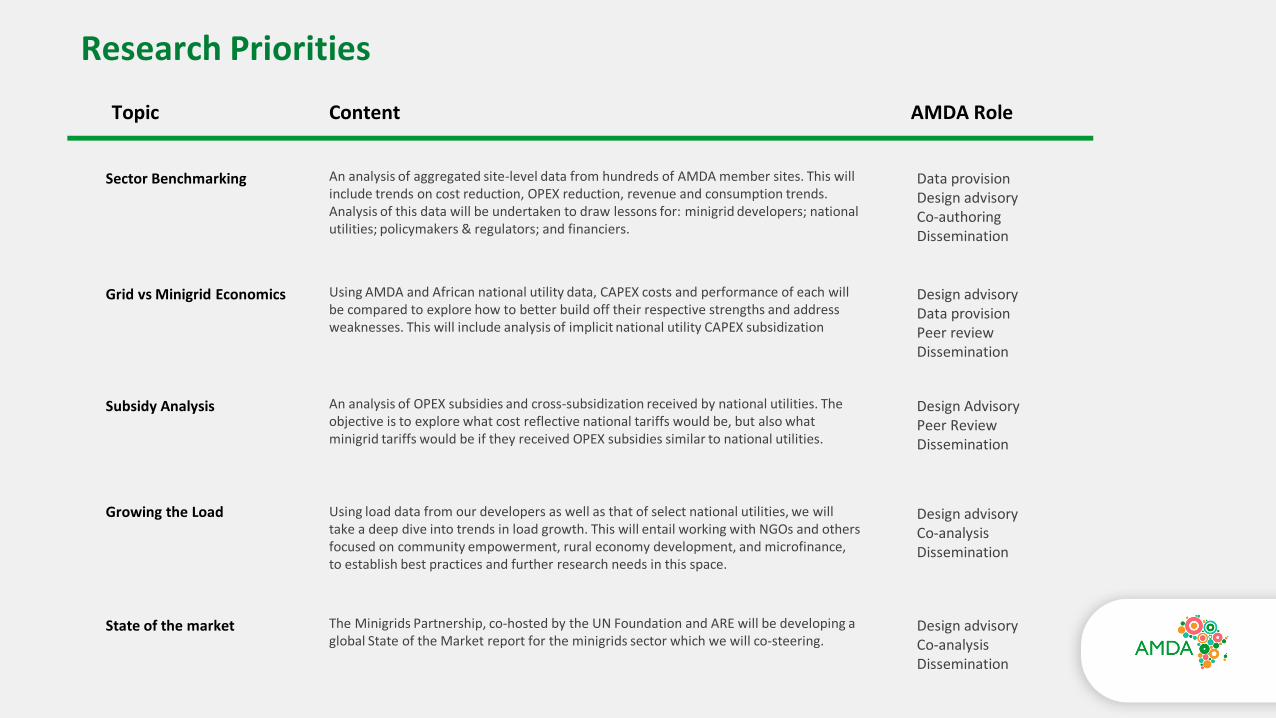
Research Priorities
Topic
Sector Benchmarking
Content AMDA Role
An analysis of aggregated site-level data from hundreds of AMDA member sites. This will include trends on cost reduction, OPEX reduction, revenue and consumption trends. Analysis of this data will be undertaken to draw lessons for: minigrid developers; national utilities; policymakers & regulators; and financiers.
Data provisionDesign advisoryCo-authoringDissemination
Grid vs Minigrid Economics Using AMDA and African national utility data, CAPEX costs and performance of each will be compared to explore how to better build off their respective strengths and address weaknesses. This will include analysis of implicit national utility CAPEX subsidization
Design advisoryData provisionPeer reviewDissemination
Subsidy Analysis An analysis of OPEX subsidies and cross-subsidization received by national utilities. The objective is to explore what cost reflective national tariffs would be, but also what minigrid tariffs would be if they received OPEX subsidies similar to national utilities.
Design AdvisoryPeer ReviewDissemination
Growing the Load Using load data from our developers as well as that of select national utilities, we will take a deep dive into trends in load growth. This will entail working with NGOs and others focused on community empowerment, rural economy development, and microfinance, to establish best practices and further research needs in this space.
Design advisoryCo-analysisDissemination
State of the market The Minigrids Partnership, co-hosted by the UN Foundation and ARE will be developing a global State of the Market report for the minigrids sector which we will co-steering.
Design advisoryCo-analysis Dissemination


Thank You