bushfire management statement · otway ranges and grassland areas are a key bushfire risk and a...
TRANSCRIPT
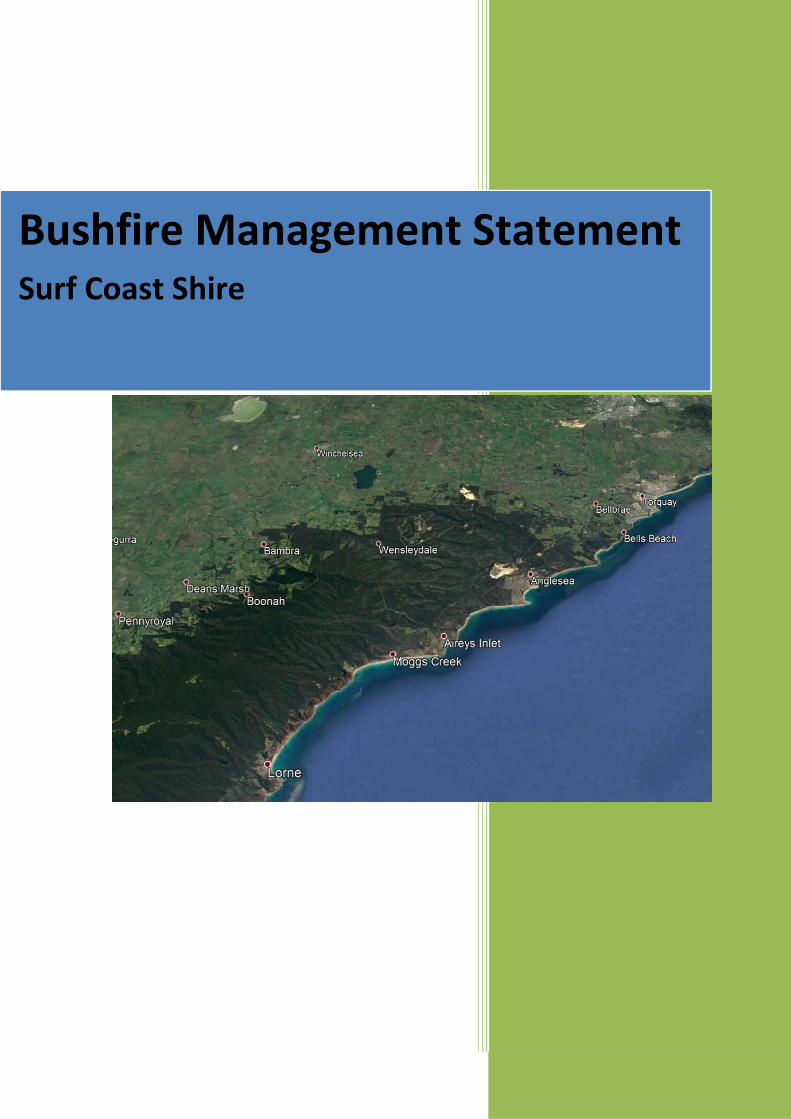
Bushfire Management StatementSurf Coast Shire
Table of Contents
Plan Details ............................................................................................................................................. 2
Site Description ....................................................................................................................................... 2
Planning Context ..................................................................................................................................... 3
Summary ......................................................................................................................................... 3
Bushfire Hazard Landscape Assessment ................................................................................................. 4
Vegetation and landform extent in the broader landscape ........................................................... 4
Other Landscape Factors ................................................................................................................ 6
Bushfire History of the Area ............................................................................................................ 7
Bushfire Risk .................................................................................................................................... 8
Bushfire Hazard Assessment ................................................................................................................. 10
Distance to NSP Minutes ............................................................................................................... 10
Tree Fall Potential Across Road .................................................................................................... 11
Using Pheonix to show risk ........................................................................................................... 12
Using all the risk information to build Landscape Types .............................................................. 14
PlanDetails
Municipality: Surf Coast Shire
Title description: General overview of Surf Coast Shire
Overlays: Bushfire Management Overlay (BMO) Bushfire Prone Area (BPA)
Zoning: Multiple
Site Description
Site Dimensions: 35 km x 50km
Site Area (approx.) Approx. 150 sq km
Any other features of the site relevant to bushfire considerations:
The shire has the Otway Ranges National Park to the South and grass land to the North.
PlanningContext
Summary
The Otway District is recognised as being one of the highest bushfire risk areas in Australia and the
world (Bradstock 2010). The factors that make up that risk include: extensive and highly flammable
vegetation, rugged terrain and occasional extreme weather, combined with the proximity of houses
to the bush, the nature of house construction and limited road access. Traversing the Shire, the
Otway ranges and grassland areas are a key bushfire risk and a regional priority for risk
management.
Fire has long been a part of the Otway District landscape. As history shows, there is considerable
potential for devastating bushfires, and effective management of that risk is needed to minimise
bushfire impacts
13.05 Bushfire
Objective
To strengthen the resilience of settlements and communities to bushfire through risk‐based
planning that prioritises the protection of human life.
This report will detail the response to the planning scheme 13.05, to show where development is
encouraged and where planning for development will have increased complexity, giving due regard
to the above objective.
BushfireHazardLandscapeAssessment
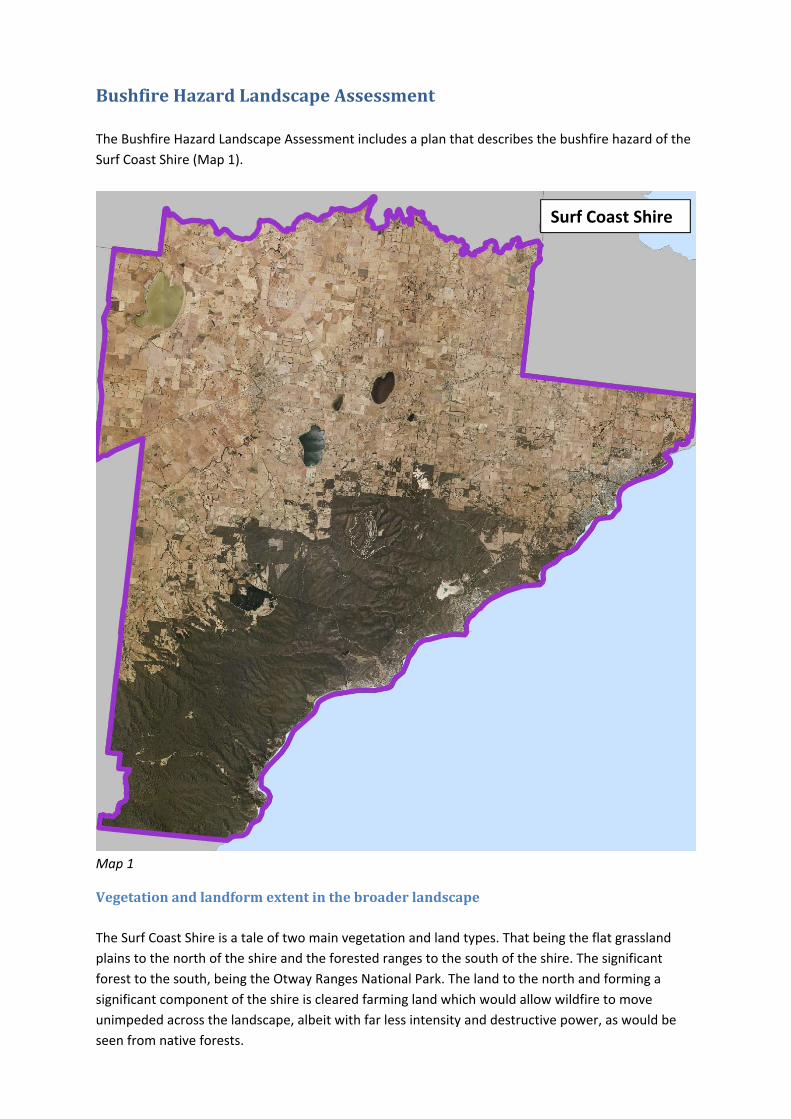
The Bushfire Hazard Landscape Assessment includes a plan that describes the bushfire hazard of the
Surf Coast Shire (Map 1).
Map 1
Vegetationandlandformextentinthebroaderlandscape
The Surf Coast Shire is a tale of two main vegetation and land types. That being the flat grassland
plains to the north of the shire and the forested ranges to the south of the shire. The significant
forest to the south, being the Otway Ranges National Park. The land to the north and forming a
significant component of the shire is cleared farming land which would allow wildfire to move
unimpeded across the landscape, albeit with far less intensity and destructive power, as would be
seen from native forests.
Surf Coast Shire
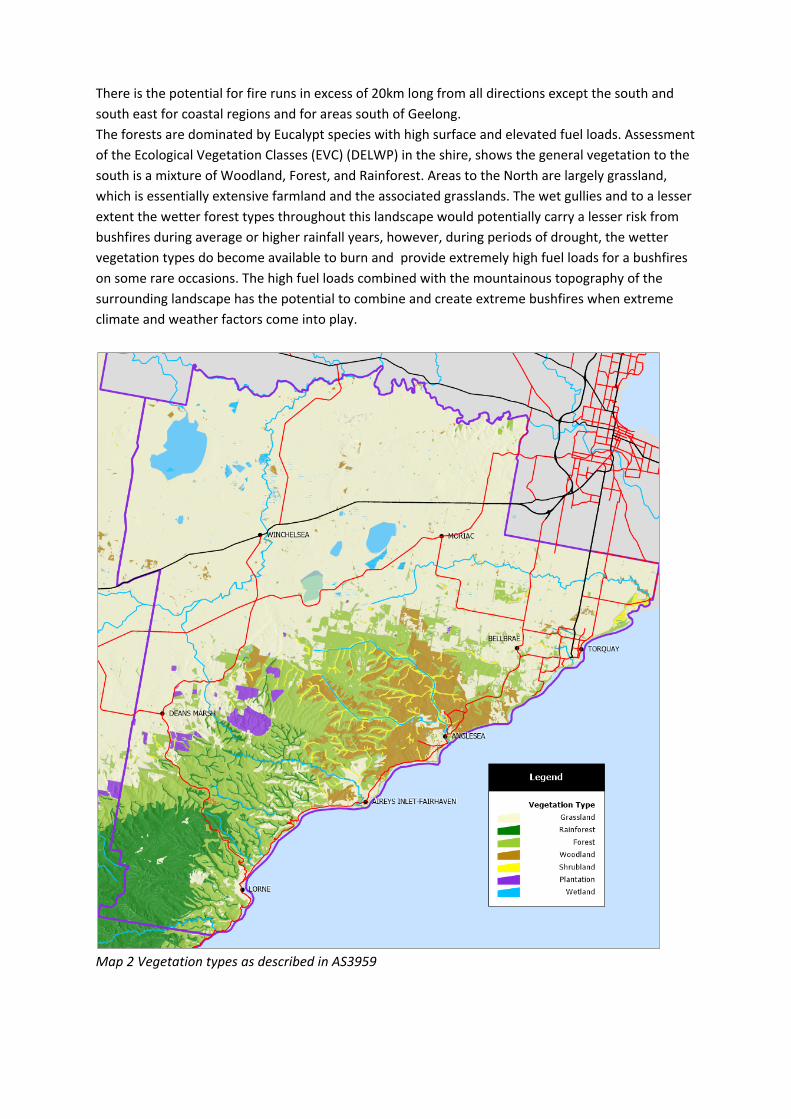
There is the potential for fire runs in excess of 20km long from all directions except the south and
south east for coastal regions and for areas south of Geelong.
The forests are dominated by Eucalypt species with high surface and elevated fuel loads. Assessment
of the Ecological Vegetation Classes (EVC) (DELWP) in the shire, shows the general vegetation to the
south is a mixture of Woodland, Forest, and Rainforest. Areas to the North are largely grassland,
which is essentially extensive farmland and the associated grasslands. The wet gullies and to a lesser
extent the wetter forest types throughout this landscape would potentially carry a lesser risk from
bushfires during average or higher rainfall years, however, during periods of drought, the wetter
vegetation types do become available to burn and provide extremely high fuel loads for a bushfires
on some rare occasions. The high fuel loads combined with the mountainous topography of the
surrounding landscape has the potential to combine and create extreme bushfires when extreme
climate and weather factors come into play.
Map 2 Vegetation types as described in AS3959
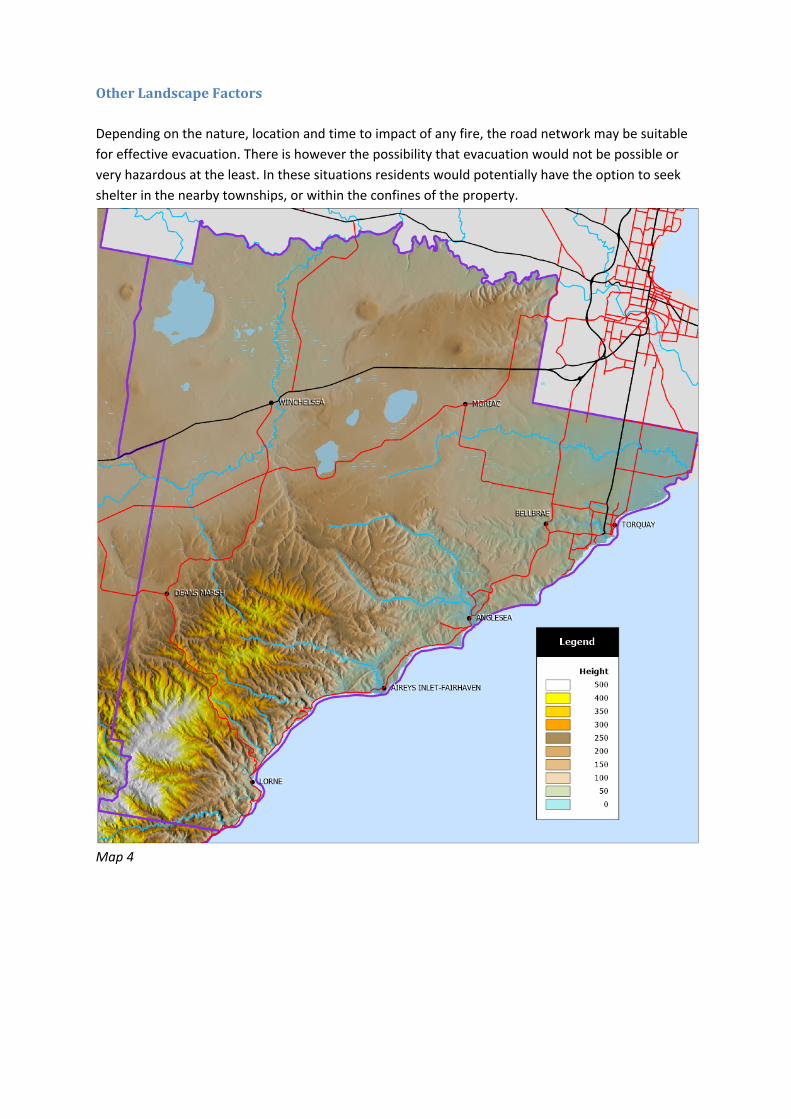
OtherLandscapeFactors
Depending on the nature, location and time to impact of any fire, the road network may be suitable
for effective evacuation. There is however the possibility that evacuation would not be possible or
very hazardous at the least. In these situations residents would potentially have the option to seek
shelter in the nearby townships, or within the confines of the property.
Map 4
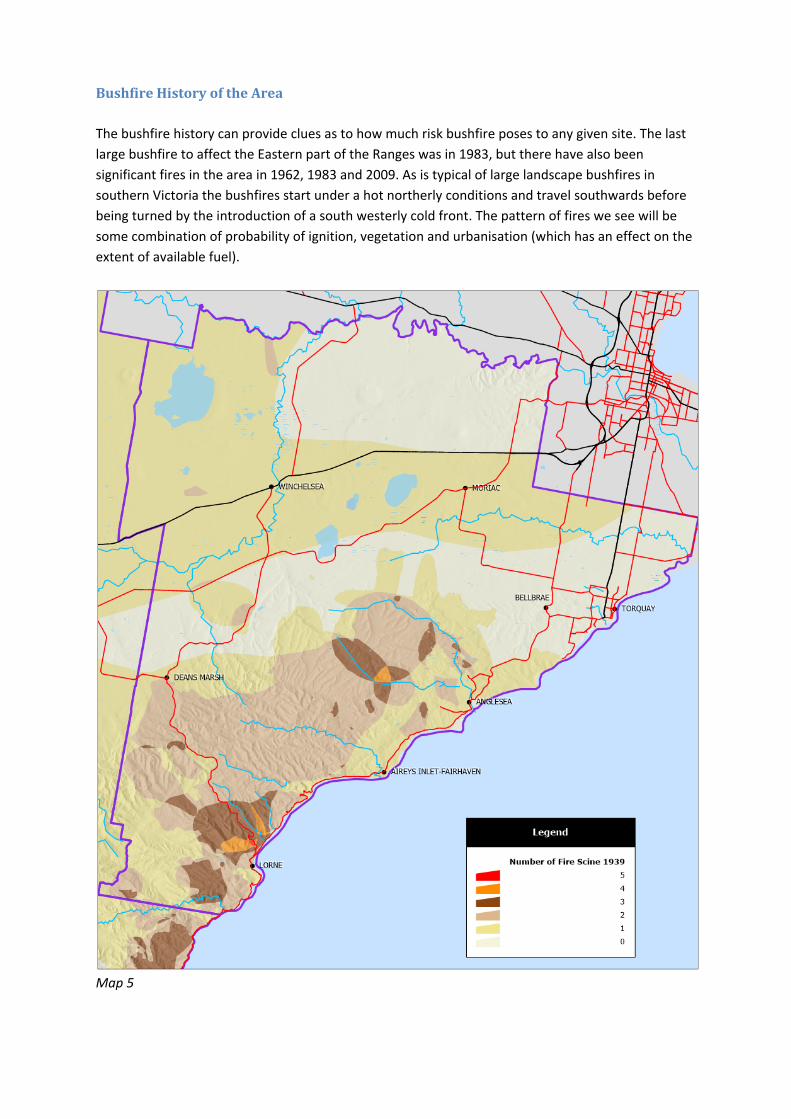
BushfireHistoryoftheArea
The bushfire history can provide clues as to how much risk bushfire poses to any given site. The last
large bushfire to affect the Eastern part of the Ranges was in 1983, but there have also been
significant fires in the area in 1962, 1983 and 2009. As is typical of large landscape bushfires in
southern Victoria the bushfires start under a hot northerly conditions and travel southwards before
being turned by the introduction of a south westerly cold front. The pattern of fires we see will be
some combination of probability of ignition, vegetation and urbanisation (which has an effect on the
extent of available fuel).
Map 5
BushfireRisk
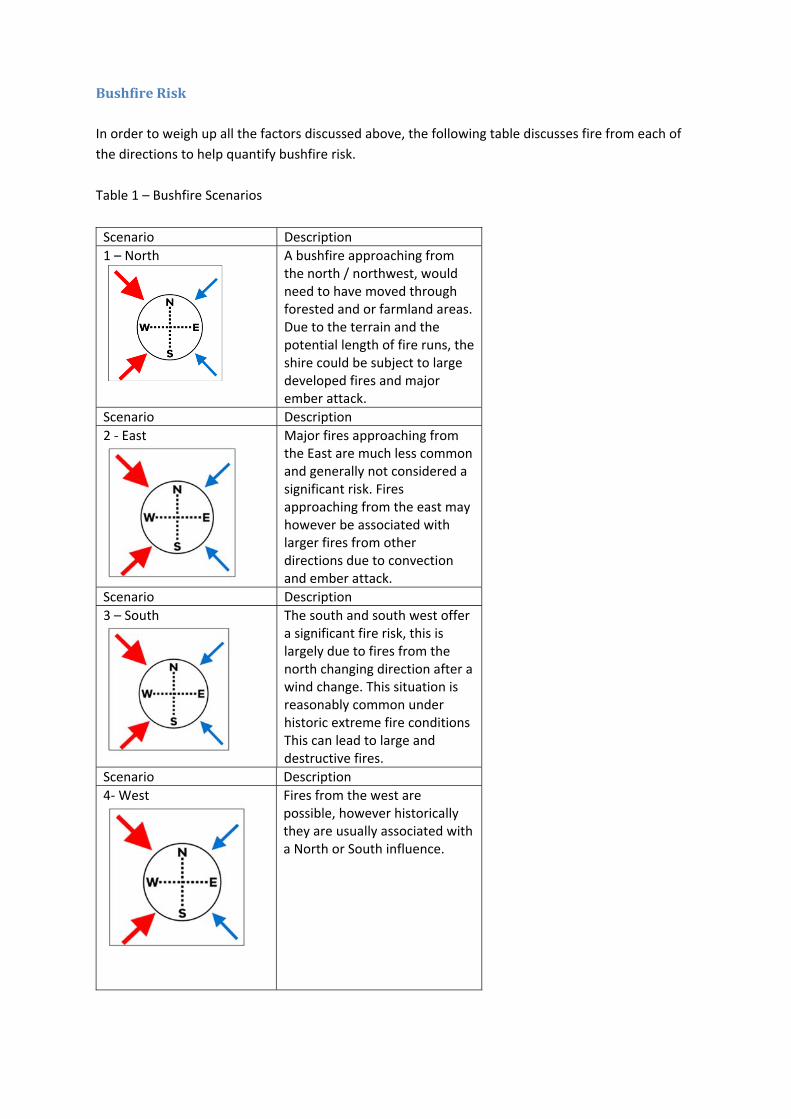
In order to weigh up all the factors discussed above, the following table discusses fire from each of
the directions to help quantify bushfire risk.
Table 1 – Bushfire Scenarios
Scenario Description
1 – North
A bushfire approaching from the north / northwest, would need to have moved through forested and or farmland areas. Due to the terrain and the potential length of fire runs, the shire could be subject to large developed fires and major ember attack.
Scenario Description
2 ‐ East
Major fires approaching from the East are much less common and generally not considered a significant risk. Fires approaching from the east may however be associated with larger fires from other directions due to convection and ember attack.
Scenario Description
3 – South
The south and south west offer a significant fire risk, this is largely due to fires from the north changing direction after a wind change. This situation is reasonably common under historic extreme fire conditions This can lead to large and destructive fires.
Scenario Description
4‐ West
Fires from the west are possible, however historically they are usually associated with a North or South influence.

Map 6
The surf Coast Shire presents numerous fire combinations and situations. This is due to the varying
vegetation, landform and potential for large scale fire to approach from the North, North West and
south west. Whilst other directions are possible, they are much less likely to be broad scale and
devastating.
Potential Major Fire Runs
With significant terrain features
in some areas which would aid
powerful fire development.

BushfireHazardAssessmentIn analysing the bushfire risk we have considered a number of factors, included in the following
maps.
DistancetoNSPMinutes
Map 7
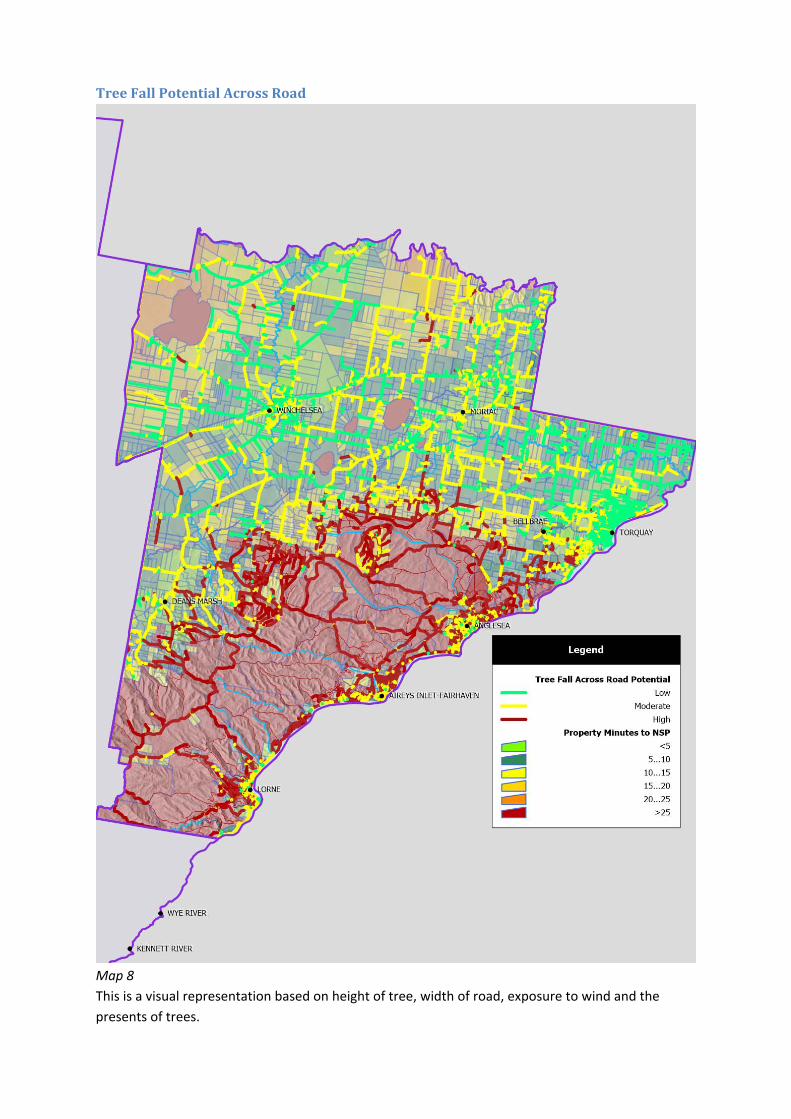
TreeFallPotentialAcrossRoad
Map 8
This is a visual representation based on height of tree, width of road, exposure to wind and the
presents of trees.

UsingPheonixtoshowriskDELWP through the SBRASS process modelled tens of thousands of fires to measure effectiveness of
prescribed burning. In the below example we extracted the average house loss and number of fires
impacting each cell in the landscape and combined this with distance from a safer area. The risk is
highest when average house loss is higher, a higher number of modelled fires has crossed that point
in the landscape and if the cell is further from a safer area.
It should be noted that this data is an average and not a worst case senario.
Basic Methodology
TimetosafeareaRaster
Multiple time surfaces were created from each of the
nominated safer areas. The image represents the time it
would take to get to the safer area for each town from any
point in the shire. These locations included: Geelong, West
Geelong, Bannockburn, Inverleigh, Apollo Bay, Lorne,
Anglesea, Aireys Inlet, Highton, Barwon Heads, Colac
Birregurra, Deans Marsh, Torquay, Moriac.
The surfaces were combined into one surface that
represents the minimum time from any location in the shire
to the closest safer area.
Anglesea
Surface
Geelong
Surface
Combined surface minimum
time to safer area
Development of the risk surface
The time surface was then combined with two output
surfaces from the SBRASS (Strategic Bushfire Risk
Assessment and Strategy Selection ‐ DELWP) All 3 surfaces
were classified into a 1 to 4 rating. The surfaces were
simply combined by adding the values of the corresponding
cells, that number was divided by the number of surfaces
(3) and a final file of relative building complexity and
bushfire risk based on 4 categories was created.
Time to safe area
scored 1 ‐ 4
Modelled
average house
loss (SBRASS)
grouped 1 ‐4
Modelled
number of
times burnt
group 1 ‐ 4 Final risk based map surface created, was
grouped into 1 – 4 and matched to property
boundaries. Having the 4 risk categories seemed
to simplify the output to a logical and usable

Map 9
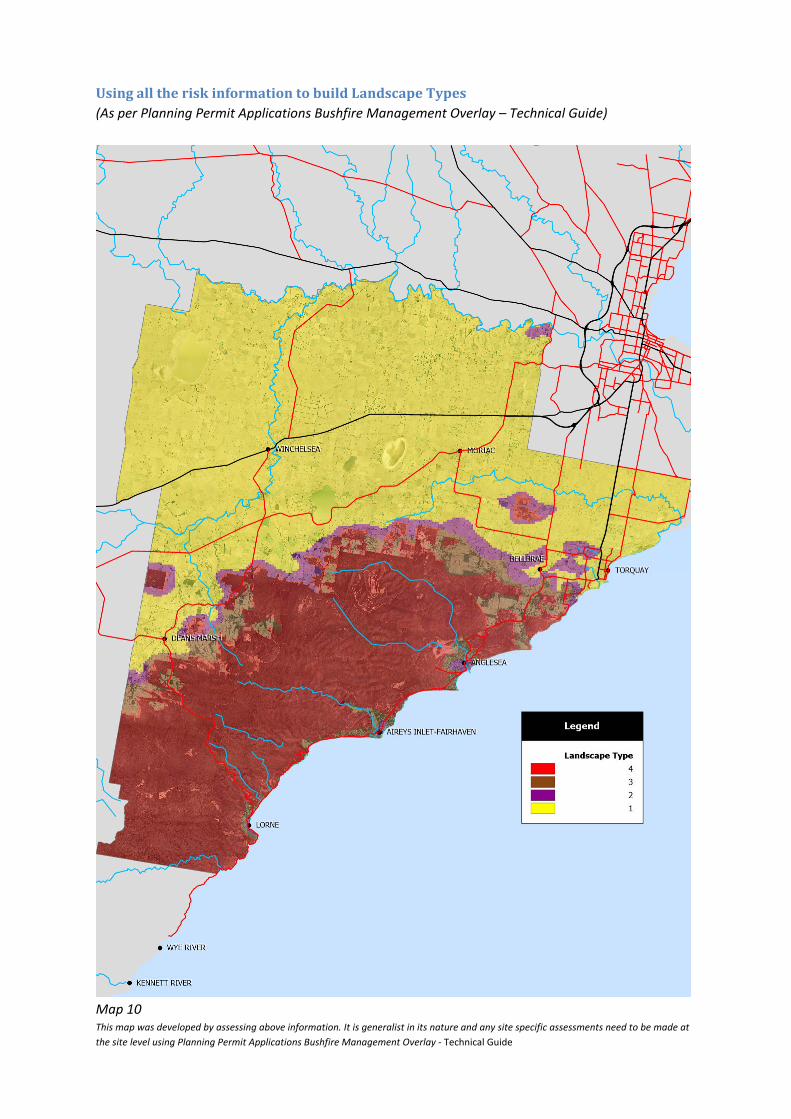
UsingalltheriskinformationtobuildLandscapeTypes(As per Planning Permit Applications Bushfire Management Overlay – Technical Guide)
Map 10 This map was developed by assessing above information. It is generalist in its nature and any site specific assessments need to be made at
the site level using Planning Permit Applications Bushfire Management Overlay ‐ Technical Guide