business plan & annual budget 2014–15
TRANSCRIPT

A L G O N Q U I N C O L L E G E
Business Plan & Annual Budget2014–15

PRESIDENT’S LETTER
Dear Colleagues,
I am honoured to present to the College community the 2014-15 Business Plan and Annual Budget, the result of a maturing process aimed at ensuring all stakeholders feel engaged and consulted in the setting of the institution’s annual priorities. Changing client expectations, shrinking government funding, shifting demographics, and the rise of competitive alternatives will continue to place a heavy emphasis on the need for transformation, both across the sector and at Algonquin.
Fortunately, the College has a long history of adapting to the changing needs of the marketplace. As an example, Algonquin was the first Ontario college to embrace the use of technology, realizing early on that investments in IT had the unique ability to improve access, increase quality and lower costs. This willingness to lead has been a hallmark of the institution, and the skills and culture that have allowed Algonquin to be an early adopter in so many areas will become increasingly more important in the years ahead.
The initiatives detailed and funded in our 2014-15 Business Plan and Annual Budget continue the efforts begun over the last few years to broaden the markets we serve and prepare ourselves for the ongoing transformation of higher education.
This year, the College Leadership Council identified four areas of particular priority;
•StudentSuccessandRetention •International •Digital •EmployeeEngagementandInnovation
Student Success and RetentionThe greatest effort and investment in this year’s business plan and budget is focused appropriately on enhancing our commitment to applied education and student success. To ensure the entire college community is aware of the academic directionsbeingset,eachSchoolandInstitutewilldraftandsharetheirrespectivevisionandbusinessplan.2014-15will also continue our efforts to make available work-integrated learning (WIL) activities to all interested full-time students, expanding co-ops, internships, placements, applied research and volunteer opportunities.
The coming year will also see the College make significant investments in both academic equipment and new facilities. Renewedeffortsonthefundraisingfrontwillbematchedbyarequesttouseasmallportionofthecollege’saccumulatedsurplustoenabletherepatriationoftheHairstylingandEstheticianprogramsfromConfederationHighSchoolandsupportthelaunchthefirstphaseofouraHealthyLivingEducationinitiative.
Insupportofourstudents,2014-15willseethecollegehostitsfirstStudentSuccessSymposium,shiningthelightonbestpractices being implemented by leading faculty and staff, both at Algonquin and at other leading institutions across North America.Armedwithnewinsights,theCollegewillworktoimplementitsStrategicEnrollmentPlan,craftastudentsuccessplan,andwiththeinvaluablesupportoftheStudents’Associationimprovetheoverallstudentexperience.
InternationalWith our recently updated vision for international education, the coming year will see the college focus its efforts on both offshore and onshore activities. Abroad, our sights are set on putting into practice a revised program quality assurance process,deliveringonourcommitmentsinSaudiArabia,andopeningournewcampusinKuwait.Domestically,wewilllookto offset expected declines in Canadian enrollments brought on by demographic changes with an increase in recruitment of students from around the world. Aligned with this effort is a commitment to invest in the required services and employee training needed to ensure all students receive the support they need to be successful.

DigitalThis coming year will also see the College set aside time for a broad college-wide discussion on the opportunities andchallenges brought on by advances in technology. The impact of technology on higher education has and will continue to be significant. Taking the time to listen to those most affected by the changes is an essential step in charting our future path.
At the same time that we work on a renewed digital strategy, we will continue to make investments in areas we knowbring great value to our stakeholders. In 2014-15, we will work to improve the reliability of our wireless network, finish the conversion of appropriate mobile learning programs, expand the e-textbook initiative and work to eliminate time consuming paper-based processes.
Perhapsmostexciting,2014-15willusherinthelaunchoftheInstituteforDigitalEducationatAlgonquin,aresearch-drivenincubator that tests, scales and shares emerging educational pedagogies and technologies.
Employee Engagement and InnovationOver the past few years, no area of the College has had a greater amount of focus than employee engagement. The 2014-15 BusinessPlancontinuesthatcommitmentwithplanstoformallycompletetheprioritiesestablishedbytheEmployee EngagementTigerTeam.Inaddition,wewillexpandprofessionaldevelopmentacrossthecollegeandcontinuetogrowour commitment to open leadership. At Algonquin, we realize our greatest differentiator is the talent of our employees and believe it is critical that we continue to invest in this area.
While too numerous to mention, the initiatives detailed and funded in the 2014-15 Business Plan and Annual Budget continueoureffortstodeliveronthestrategiesandtargetssetoutinthe2012-17StrategicPlan.Theytacklehead-onthechallenges and opportunities faced by the fast-changing higher education market while moving us a step closer to realizing our vision of being “a global leader in digitally-connected applied education and training”.
Please join me in thanking all those who have worked so diligently on our behalf. To all those who attended departmentalplanning sessions, prepared countless documents, and worked on the College’s Budget Committee, you have our sincere appreciation.
Yours sincerely,
Dr. Kent MacDonaldPresident

Algonquin’s organizational philosophy is defined by its mission, vision and core values. Through the course of the recent strategic planning process, stakeholders paid tribute to the current set of College values believing they accurately reflect the principles and beliefs shared by the community. At the same time, they encouraged the College to revise the current mission and vision statements to more accurately reflect our aspirations for the future.
The following are intended to serve as points of inspiration and provide clear differentiation from other colleges, carefully articulating our purpose.
OUR MISSION To transform hopes and dreams into skills and knowledge, leading to lifelong career success. OUR VISION To be a global leader in digitally-connected applied education and training.
OUR VALUES
MISSION, VISION AND VALUES
CaringWe have a sincere and compassionate interest in the well-being of the individual.
IntegrityWe believe in trust, honesty and fairness in all relationships and transactions.
LearningWe believe in the pursuit of knowledge, personal growth and development.
RespectWe value the dignity and uniqueness of the individual. We value equity and diversity in our community.


Business Plan 2014–15


STRATEGIC PLAN 2012 - 2017At Algonquin, we believe students learn best by applying knowledge through experience. We believe that understanding is not a destination but rather the product of a lifelong ‘knowledge journey’, made richer and more compelling when mixed with the power of technology. Experiential education is about being able to utilize new concepts in non-textbook contexts; to conceptually make sense of complex, real-world situations and to express such concepts meaningfully to others. Such learning also gives students the opportunity to improve their life skills — self-direction, collaboration and teamwork, information gathering, and clear communication.
These are the traits today’s employers seek in their employees. This kind of technologically enhanced, experiential knowledge fuels economic growth and community prosperity. It is the fun-damental speciality of Algonquin College and the foundation of our aspiration to be The Connected College offering the greatest range of choices for all students. Today’s economic realities make delivering on this mission increasingly more chal-lenging. This Strategic Plan addresses the current fiscal realities head on, seeking to be efficient stewards of public funds while building a strong financial foundation from which to make strategic investments which will enhance the overall experience of our students.
To deliver on our mission and vision we have identified 4 strategic pillars and 12 supporting goals. These commitments guide our strategic priorities and budget process.
APPLIED EDUCATION AND TRAININGGoal 1: Deliver an exemplary applied education and training experience.
Goal 2: Create a unique suite of programs, products and services geared to meet the needs and expectations of our clients and students.
Goal 3: Leverage technology to enhance the educational experience
Goal 4: Provide opportunities for every full-time student to have a work experience outside of the classroom.
STUDENT AND CLIENT SUCCESSGoal 5: Deliver exceptional service to our diverse student and client
populations.
Goal 6: Leverage technology to automate and modernize our business processes, fostering an environment of continuous improvement.
EMPOWERED PEOPLEGoal 7: Attract, develop and retain employees who have the knowledge and
skills to be fully contributing members of the College.
Goal 8: Create and foster an environment in which the College’s model of leadership competencies and behaviours is supported.
FINANCIAL SUSTAINABILITYGoal 9: Align our funded operational expenditures with provincial funding
Goal 10: Expand non-funded opportunities to increase revenue.
Goal 11: Leverage strategic business partnerships to meet the capital needs of the College.
Goal 12: Create the technological foundation to align with the digital direction.

Algonquin College - Business Plan 2014–15
2014
-15
Go
als,
Init
iati
ves
and
Mea
sure
s
2
OPERATIONAL OUTCOMES, MAJOR ACTIONS AND MEASURES
2012-17 Strategic Goals
2014-15Initiatives/Leveraged Action
2014-15Measures
Goal 1: Deliver an exemplary applied education and training experience.
ACADEMICEnhance first year student persistence through effective intervention and remedial activities.
ACADEMICOverall term to term retention rate increased by 1% over 2013/2014.
ACADEMICEnhance student mobility and graduation by creating more efficient program pathways, laddering and articulations.
ACADEMICPathways, laddering and credit transfer plans developed for each School.
ADVANCEMENTImplement Year 1 of the Strategic Enrolment Manage-ment (SEM) Plan.
ADVANCEMENT (1) Benchmark metrics established for Recruitment, Admissions, Orientation, Student Support Specialists & Retention.(2) Top 3 Strategic Enrolment Management (SEM) projects completed. (3) First College-wide Strategic Enrolment Management (SEM) conference with 100 faculty & 100 support staff in attendance hosted with participants ranking the event an average of 4 out of 5 in total satisfaction.
Goal 2: Create a unique suite of programs, products and services geared to meet the needs and expectations of our clients and students.
ADVANCEMENT Integrate marketing, recruitment and admission pro-cesses to create a comprehensive admission funnel.
ADVANCEMENT College applications outperform the system average by 2%.
ACADEMICCreate a vision document and business case for each School.
ACADEMICDeans vision document and business case developed for each School by end of Fall 2014.
ACADEMICEnhance the choice and flexibility of student learning options by increasing the availability of fully online offerings.
ACADEMIC3,300 full-time equivalent students (FTEs) enroled in online and hybrid course offerings.
ACADEMICImplement onshore initiatives from International Educa-tion Strategy.
ACADEMIC1,140 full-time international equivalent students enroled in onshore programs of study.
ACADEMICIncrease number of international students in high-demand programs.
ACADEMIC 50 additional international students in high-demand programs.
ACADEMICWiden access by developing new programs of study and diversifying delivery modalities.
ACADEMIC(1) 575 students enroled in applied degrees and 840 graduate certificates. (2) Year 3 of the sector programming plans developed. (3) 3% increase to post-secondary enrolment over 2013/14 baseline.
ACADEMIC & ADVANCEMENT Draft and implement the Healthy Living Education (HLE) advocacy plan.
ACADEMIC & ADVANCEMENT 1) Healthy Living Education advocacy plan approved by President’s Council.2) Hair Stylist and Esthetician programs re-patriated to Woodroffe campus.
Metric 2014-15 Target
2016-17 Target
Graduation Rate 66.5% 70%
Retention Rate 87% 89%
Metric 2014-15 Target
2016-17Target
Enrolment (PSE) and others
20,345 21,107
Enrolment (online — FTE equivalents)
3,300 3,500
Enrolment (PSE international — FTE equivalents)
1,140 1,400
Students enroled in applied degrees
575 800
Students enroled in graduate certificates
840 1,000

Algonquin College - Business Plan 2014–15
2014
-15
Go
als,
Init
iati
ves
and
Mea
sure
s
3
OPERATIONAL OUTCOMES, MAJOR ACTIONS AND MEASURES
2012-17 Strategic Goals
2014-15Initiatives/Leveraged Action
2014-15Measures
Goal 3: Leverage technology to enhance the educational experience
ACADEMICEnhance the choice and flexibility of student learning options.
ACADEMICA total of 1,140 courses offered as hybrid courses.
ACADEMIC Improve the quality of online learning options.
ACADEMIC50% of online programs assessed and validated against the College’s quality assurance standards.
ACADEMICArticulate the vision and strategy that will further the College’s leadership in the Digital domain.
ACADEMICDigital strategy developed and presented to President’s Council by November, 2014.
ACADEMICImplement the final year of the four-year mobile learn-ing plan.
ACADEMIC100% of eligible full-time post-secondary education programs converted to mobile programs.
Goal 4: Provide opportunities for every full-time student in Ontario College Credentialed programs to have a work-integrated learning experience.
ACADEMICImplement Year 2 of the work-integrated learning plan.
ACADEMIC85% of programs have a work-integrated learning component.
ACADEMICContinue to imbed applied research activities in full-time programs of study
ACADEMIC 825 students engaged in applied research projects
Goal 5: Deliver exceptional service to our diverse student and client populations.
ACADEMICCreate a comprehensive student success strategy.
ACADEMIC(1) Student success strategy developed and presented to Presidents Council.(2) College services inventory completed and presented to Col-lege Leadership Council. (3) Top two (2) student success strategy projects completed.
STUDENT SUPPORT SERVICESEnhance overall College experience for students.
STUDENT SUPPORT SERVICES(1) Increase College orientation participation rate by 10%.(2) Increase the percentage of those very satisfied with the College orientation program from 25% to 35%.(3) Lower the percentage of students reporting they need help knowing who to turn to for assistance from 50% to 40%.(4) Serve 1500 individual students via the student experience “Hub”. (5) Respond to 10,000 requests for information via the student information desk.
REGISTRAR’S OFFICE & STUDENT SUPPORT SERVICESUpdate the current Student Services strategy to improve the student experience and maximize efficiencies.
REGISTRAR’S OFFICE & STUDENT SUPPORT SERVICES(1) Student Services goals and metrics established for each department. (2) Student satisfaction benchmark established for each department. (3) Plan of action developed for each department based upon student satisfaction goals and metrics.
ADVANCEMENT(1) Complete Employer Engagement survey to identify current employer opinions and identify opportunities. (2) Draft Employer Engagement Plan.
ADVANCEMENT Survey results and Employer Engagement Plan presented to College Leadership Council for review and feedback.
Metric 2014-15 Target
2016-17 Target
Online courses offered
127 150
Unique hybrid courses offered
1,140 1,424
Enrolment (PSE — mobile)
90% 100%
Metric 2014-15 Target
2016-17Target
Programs with work experience opportunities
85% 100%
Students engaged in applied research and development
825 950
Metric 2014-15 Target
2016-17Target
Student Satisfaction
82.1% 83.5%
Employer Satisfaction
93% 94%
Alumni Satisfaction
87.5% 90%
Algonquin College - Business Plan 2014–15
2014
-15
Go
als,
Init
iati
ves
and
Mea
sure
s
4
OPERATIONAL OUTCOMES, MAJOR ACTIONS AND MEASURES
2012-17 Strategic Goals
2014-15Initiatives/Leveraged Action
2014-15Measures
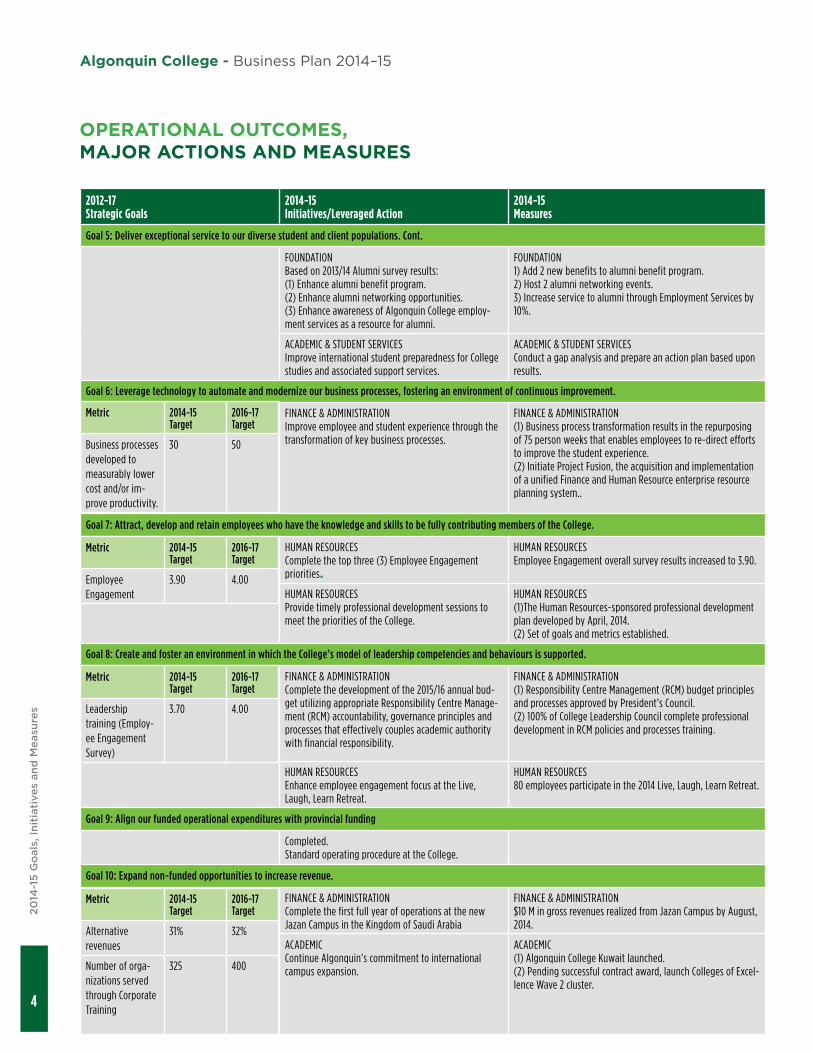
Goal 5: Deliver exceptional service to our diverse student and client populations. Cont.
FOUNDATIONBased on 2013/14 Alumni survey results: (1) Enhance alumni benefit program. (2) Enhance alumni networking opportunities. (3) Enhance awareness of Algonquin College employ-ment services as a resource for alumni.
FOUNDATION1) Add 2 new benefits to alumni benefit program.2) Host 2 alumni networking events.3) Increase service to alumni through Employment Services by 10%.
ACADEMIC & STUDENT SERVICES Improve international student preparedness for College studies and associated support services.
ACADEMIC & STUDENT SERVICESConduct a gap analysis and prepare an action plan based upon results.
Goal 6: Leverage technology to automate and modernize our business processes, fostering an environment of continuous improvement.
FINANCE & ADMINISTRATION Improve employee and student experience through the transformation of key business processes.
FINANCE & ADMINISTRATION (1) Business process transformation results in the repurposing of 75 person weeks that enables employees to re-direct efforts to improve the student experience.(2) Initiate Project Fusion, the acquisition and implementation of a unified Finance and Human Resource enterprise resource planning system..
Goal 7: Attract, develop and retain employees who have the knowledge and skills to be fully contributing members of the College.
HUMAN RESOURCESComplete the top three (3) Employee Engagement priorities.
HUMAN RESOURCES Employee Engagement overall survey results increased to 3.90.
HUMAN RESOURCESProvide timely professional development sessions to meet the priorities of the College.
HUMAN RESOURCES(1)The Human Resources-sponsored professional development plan developed by April, 2014. (2) Set of goals and metrics established.
Goal 8: Create and foster an environment in which the College’s model of leadership competencies and behaviours is supported.
FINANCE & ADMINISTRATIONComplete the development of the 2015/16 annual bud-get utilizing appropriate Responsibility Centre Manage-ment (RCM) accountability, governance principles and processes that effectively couples academic authority with financial responsibility.
FINANCE & ADMINISTRATION (1) Responsibility Centre Management (RCM) budget principles and processes approved by President’s Council.(2) 100% of College Leadership Council complete professional development in RCM policies and processes training.
HUMAN RESOURCES Enhance employee engagement focus at the Live, Laugh, Learn Retreat.
HUMAN RESOURCES80 employees participate in the 2014 Live, Laugh, Learn Retreat.
Goal 9: Align our funded operational expenditures with provincial funding
Completed. Standard operating procedure at the College.
Goal 10: Expand non-funded opportunities to increase revenue.
FINANCE & ADMINISTRATIONComplete the first full year of operations at the new Jazan Campus in the Kingdom of Saudi Arabia
FINANCE & ADMINISTRATION$10 M in gross revenues realized from Jazan Campus by August, 2014.
ACADEMICContinue Algonquin’s commitment to international campus expansion.
ACADEMIC(1) Algonquin College Kuwait launched.(2) Pending successful contract award, launch Colleges of Excel-lence Wave 2 cluster.
Metric 2014-15 Target
2016-17Target
Business processes developed tomeasurably lower cost and/or im-prove productivity.
30 50
Metric 2014-15 Target
2016-17Target
Employee Engagement
3.90 4.00
Metric 2014-15 Target
2016-17Target
Leadership training (Employ-ee Engagement Survey)
3.70 4.00
Metric 2014-15 Target
2016-17Target
Alternative revenues
31% 32%
Number of orga-nizations served through Corporate Training
325 400

Algonquin College - Business Plan 2014–15
2014
-15
Go
als,
Init
iati
ves
and
Mea
sure
s
5
OPERATIONAL OUTCOMES, MAJOR ACTIONS AND MEASURES
2012-17 Strategic Goals
2014-15Initiatives/Leveraged Action
2014-15Measures
Goal 10: Expand non-funded opportunities to increase revenue.
ACADEMICExpand program licensing partnership agreements to offshore international activities.
ACADEMICOne (1) new program licensing partnership agreement approved.
ACADEMICIncrease the number of client organizations receiving Corporate Training services
ACADEMIC325 client organizations that have received training through Corporate Training.
Goal 11: Leverage strategic business partnerships to meet the capital needs of the College.
FOUNDATIONLaunch year-one of multi-year fundraising plan.
FOUNDATION1) $750K raised from stewarding & renewal of campaign pledges.2) $1M raised from alumni revenue, annual & endowment student bursary/scholarship contributions.3) $800K in interest disbursed and stewarded from donor named endowment funds.4) $750K raised from new major gift-in-kind and cash dona-tions.
FINANCE & ADMINISTRATIONComplete Phase 1 and Phase 2 of ESCO Energy Savings Project.
FINANCE & ADMINISTRATIONSuccessful renewal of B Building HVAC infrastructure, replace-ment of plant cooling tower and optimizing strategies for building controls.
Goal 12: Create the technological foundation to align with the digital direction.
FINANCE & ADMINISTRATIONEnhance College Leadership Council’s ability to access College data to support decision-making for academic programming and services.
FINANCE & ADMINISTRATIONAccessible College data improves to 50%.
FINANCE & ADMINISTRATIONDevelop a scenario-based planning framework and suite of tools that enables the Board of Governors and Management to assess the feasibility of alternative strategic directions.
FINANCE & ADMINISTRATIONA scenario-based software planning tool will be developed and demonstrated at the Fall 2014 Board of Governors Retreat.
FINANCE & ADMINISTRATIONContinue investment in the College’s Information Technology (IT) network to ensure a consistent level of internet, wireless and network connectivity.
FINANCE & ADMINISTRATION(1) Internet connectivity performance improves to 96% by Sept 2014. (2) Availability of wireless network improves to 96%.
Metric 2014-15 Target
2016-17Target
Cash, in-kind contributions, and returns from alter-native financing
$6.5M $10M
Metric 2014-15 Target
2016-17Target
College data accessible through a common BI portal
50% 100%
Availability of wireless network to all stakeholders
96% 99.9%
Availability of College networks and internet access
96% 99.9%

Algonquin College - Annual Budget 2014–15
Annual Budget 2014–15

2
Algonquin College - Annual Budget 2014–15
TREASURER’S REPORT OF THE 2014-15 ANNUAL BUDGETIn compliance with both Board of Governors direction and Ministry operating directives, the 2014-15 Annual Budget returns a net operating surplus and maintains the College’s commitment to balancing government funded activities with expenses.
The 2014-15 Annual Budget also provides the College with the resources required to deliver on the commitments de-tailed in the 2014-15 Business Plan and the College’s 2012-17 Strategic Plan.
At the same time, the College’s annual budget prepara-tion process concludes with a budgeted net contribution of ($2,655,000), the result of President’s Council’s request to use internally restricted funds to finance needed capital investments and strategic investments through accumulated surpluses.
Accumulated Surplus
Last year, the College concluded fiscal year 2012-13 with a net contribution of $6.1 million, which exceeded the 2012-13 Approved Budget surplus of $3.3 million by $2.8 million. In addition to various operating savings, this positive variance was achieved primarily due to securing greater than bud-geted enrolment growth (5.5% actual vs 3.5% budgeted) and not utilizing contingency budgets.
The College has consistently achieved surpluses and grown its accumulated surplus balance over the past 9 years in the Internally Restricted Net Asset accounts. These funds are managed and grown to provide resources to fund Strategic Investment Priorities that will enhance the overall experience of students.
Business Plan Priorities Aligned with the College’s Strategic Plan
This year, in alignment with the direction confirmed in Algon-quin’s 2012-17 Strategic Plan, the College Leadership Council identified four key areas of priority:
•StudentSuccessandRetention •International •Digital •EmployeeEngagementandInnovation
Through a business planning process that continues efforts to engage all areas of the College, a series of major initiatives aimed at addressing improvements to academic facilities, student services and business process automation were identified that require the drawing down of funds from inter-nally restricted accounts.
The President is submitting a recommendation to the Board of Governors to approve spending from the College’s Specific Reserve funds for the following significant capital projects in 2014/15:
General Reserve Funds
The 2014-15 Annual Budget also includes a provision to increase the General Reserve Funds by $2 million. Additional contributions to General Reserve Funds will be realized as cash donations are received to return funds utilized to com-plete construction of the new Perth and Pembroke campuses andtheAlgonquinCentreforConstructionExcellence.
The sale of the former Pembroke campus is still pending and is not reflected in this annual budget. Once this property sale has been finalized, the College will update its financial projections to reflect the impact on its Statement of Opera-tions and internally restricted net assets.
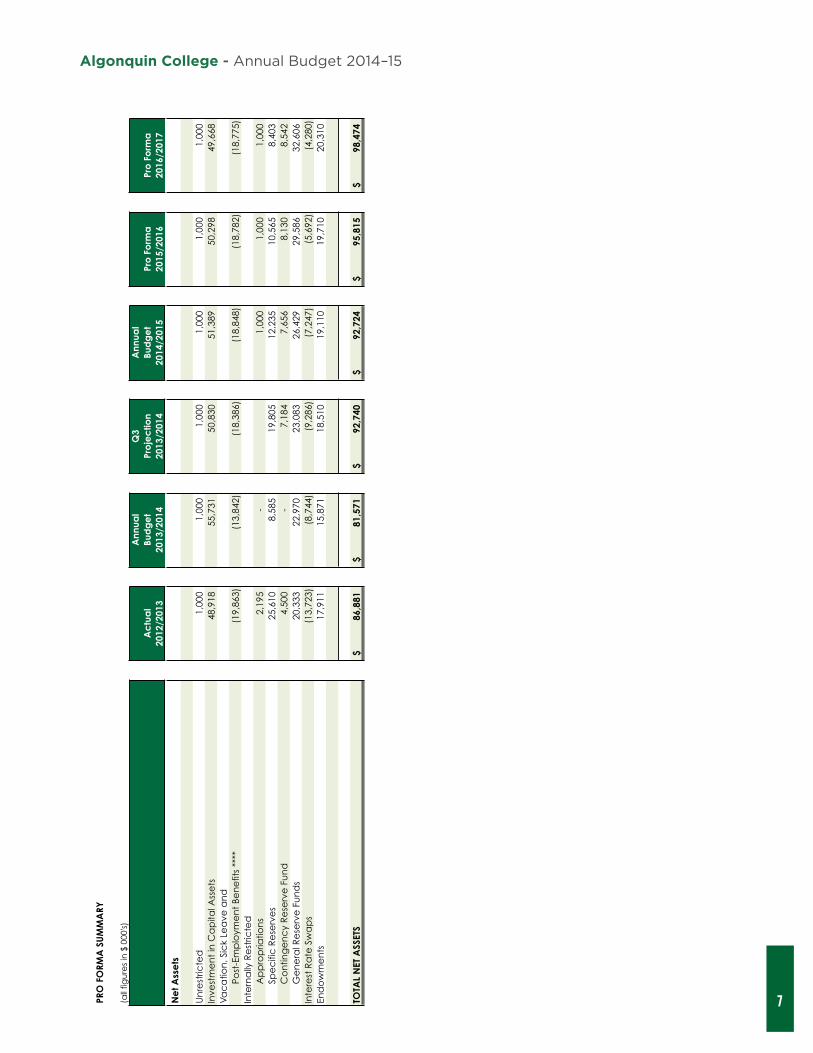
Refer to the Net Assets Continuity Schedule for more infor-mation on budgeted contributions and expenditures from Internally Restricted Funds.
Expenditures from Internally
Restricted Funds - Specific Reserves
Enterprise Resource Planning Project (Finance/Human Resources)
2,000,000$ 4,050,000$
Dental Programs Facilities/Re-Patriation of HairStylist and Esthetician Programs to Woodroffe Campus
3,500,000$ 6,700,000$ *
College Ancillary Services - Residence Upgrades, Point-of-Sale/Accounting Software System, Equipment Renewal
1,400,000$ 1,400,000$
Total Expenditures from Internally Restricted Funds - Specific Reserves
6,900,000$
Total Project Budget
* Design in progress, scope and final
estimated costs still under development

3
Algonquin College - Annual Budget 2014–15
Unrestricted Net Assets 1,000,000$ Internally Restricted Net Assets
Appropriations 1,000,000 Specific Reserves
Other Projects and Initiatives 6,183,000 Ancillary Services Reserve Fund 5,427,000 Infrastructure Renewal Fund 250,000 Employment Stabilization Fund 560,000 Other Student Aid 16,000
Contingency Reserve Fund 7,636,000 General Reserve Funds 26,248,000
Total Unrestricted and Internally Restricted Net Assets 48,320,000$
Challenges and Opportunities Facing the College
Deliveringabudgetthatreturnsanetoperatingsurplushasnot been without its challenges. In March 2012, the Ontario Government accurately predicted that our economy would experience lackluster expansion. In 2013, the Province re-stated its commitment to eliminating the Ontario deficit by 2017-18 and followed through on planned reductions to Ontario colleges funding. The annualized impact of these reductions to Algonquin’s 2014-15 base funding is approxi-mately $4.5 million.
Algonquin ImpactProvincial Budget Measure 2013/14 2014/15International Student Recovery Fee (442,125)$ (936,908)$ Elimination of Small Northern and Rural Grant (922,425) (1,844,850) 'Policy Levers' - Operating Grant Reductions (807,522) (1,745,543) International Student Municipal Tax (86,000) (86,000) TOTAL IMPACT ON ALGONQUIN COLLEGE (2,258,072)$ (4,613,301)$ * Note: The Ontario Special Bursary Program was also eliminated and replaced by the Ontario 30% Tuition Grant.
More positively, Algonquin saw enrolments to the College increase 5.5% year-over-year, with the majority of these increases coming as a result of new program development, online offerings, and international enrolments. Recent Min-istry restrictions placed on new program development and projected demographic declines will continue to place pres-sure on the College to think creatively and look for new ways of transforming education.
Assumptions
A number of assumptions were made in the preparation of estimates to be included in the budget. A list of the most significant assumptions for 2014-15 follows:
Revenues
•Grantprojectionsarebasedontheassumptionthatthe existing College Funding Framework (released in June 2009) for operating and enrolment growth grants will be extended for a sixth year and will be funded at the reduced rates most recently communicated by the Ministry;
•Tuitionfeeratesforfundedprogramshasbeenbudgeted with a 3% increase;
•Enrolmentgrowthinfull-timepost-secondaryprograms is projected to increase by 3% over 2013-14 enrolment levels due to growth in existing programs, the launch of new programs, and improved retention; and
•Thefollowingothernon-fundedrevenuesourceshave been updated to respond to the projected enrolment changes, the economy, international opportunities and anticipated market conditions:
o Contract Activity
o International Premium and Tuition
o College Ancillary Services
Operating Expenditures
•Wageincreasesforallfacultyandstaffwillnotexceed the current range of wage increases in the public sector;
•TheCollegewillaugmentitsexistingfacultycomplement with additional hires to accommodate projected enrolment growth; and
•Otherexpenditureswillincreaseatarateconsistentwith the rate of inflation.
Funding for Strategic Investment Priorities
Through the alignment of operating revenues and expenditures within the Province’s funding and tuition fee framework, the College is able to direct contributions from non-funded activities to strategic investment priori-ties. Priority setting has been based on investments that are deemed to be ‘essential’, support the College’s strategic directions, renew curriculum and develop new programs, deliver high quality instructional equipment for students, and mitigate the risk of physical and technological infrastructure
failure.

4
Algonquin College - Annual Budget 2014–15
TREASURER’S REPORT OF THE 2014-15 ANNUAL BUDGETMore specifically, the annual budget provides funding for the following initiatives:
•Adaptteachingenvironmentstoaccommodatestudents with mobile devices as part of the mobile learning program project;
•Developingadditionalhybridcourses,onlineprograms, graduate certificates and degree programs to meet the needs of today’s student;
•Continuewiththelaunchofthee-textstrategyfor students that will result in lower costs for students and provide increased flexibility for learning;
• Launchtheacquisitionandimplementationofaunified FinanceandHumanResourcesEnterpriseResource Planning system;
•Initiateupgradestothedentalprogramsfacilities
•RepatriateHairStylist,HairstylistApprenticeshipand EstheticianprogramsandfacilitiestotheWoodroffe campus (design and final cost estimates still under development);
•EnhanceandexpandtheCollege’sclientrelationship management system;
•Implementstrategiestoimproveemployeeengagement; and
•Continuetoupgradeandimprovetheserviceand reliability of wired and wireless networks.
Risks
Webelievethatthisbudgetisreasonableunderthecircum-stances. The following identifies and assesses major risks:

5
Algonquin College - Annual Budget 2014–15
I would like to conclude by thanking all of those involved in the development of the Annual Budget for their hard work and ongoing commitment to the College, with a special men-tion of the efforts of the College Budget Committee (CBC):
•LindaRees(Chair),Dean,CentreforContinuingand Online Learning
•MichelleCurran(Recorder),BudgetOfficer,Centrefor Continuing and Online Learning
•CathyDempsey(Resource),Director,Financeand Administrative Services
•MikeGawargy,Director,InformationTechnologyServices
•GlennMacDougall,Director,LearningandTeaching Services
•PeterMackie,Director,SalesandStudentRecruitment
•JeffMacnab,Registrar
•DianeMcCutcheon,Director,LabourRelations
•DougOuderkirk,ExecutiveDirector,Academic Operations and Planning
•JohnTattersall,Director,PhysicalResources
Re-configured in 2012, the CBC was established to deepen awareness, foster cross-unit collaboration, and broaden re-sponsibility for tackling the financial challenges and opportunities facing the College. Through the dedication of the members of the CBC, we have achieved what we set out to accomplish – deliver a balanced budget while setting the College on a path for a more engaged budget process.
Duane McNair Treasurer and Vice-President, Finance and Administration
THANK YOU TO THE COLLEGE BUDGET COMMITTEE

6
Algonquin College - Annual Budget 2014–15
Ann
ual B
udge
t 201
4/20
15
PR
O F
ORM
A S
UM
MA
RY
(a
ll fig
ure
s in
$ 0
00's)
Ann
ual
Q3
Ann
ual
Ac
tua
lBu
dg
et
Pro
jec
tion
Bud
ge
tPr
o F
orm
aPr
o F
orm
a20
12/2
013
2013
/201
420
13/2
014
2014
/201
520
15/2
016
2016
/201
7
Fund
ed
Ac
tivity
/Co
lleg
e O
pe
ratio
ns
Re
ven
ue
196,
969
$
19
7,98
5$
199,
782
$
21
1,66
9$
218,
905
$
22
5,05
0$
Exp
en
ditu
res
*18
6,47
7
194,
385
19
3,12
4
203,
944
21
4,52
5
221,
285
N
et
Co
ntr
ibu
tion
10,4
92
3,60
0
6,
658
7,72
5
4,
380
3,76
5
Co
ntra
ct A
ctiv
ity &
Oth
er N
on-
Fund
ed
Ac
tivity
Re
ven
ue
26
,187
27
,866
27
,564
26
,870
27
,675
28
,505
Ex
pe
nd
iture
s 23
,428
25
,902
25
,769
25
,830
26
,605
27
,400
N
et
Co
ntr
ibu
tion
2,75
9
1,
964
1,79
5
1,
040
1,07
0
1,
105
Co
lleg
e A
ncill
ary
Se
rvic
es
Re
ven
ue
39,7
74
40,2
85
40,9
63
41,3
78
44,2
10
46,7
50
Exp
en
ditu
res
*34
,256
33
,613
35
,159
34
,795
36
,810
38
,790
N
et
Co
ntr
ibu
tion
5,51
8
6,
672
5,80
4
6,
583
7,40
0
7,
960
Inte
rna
tiona
l Ed
uca
tion
Ce
ntre
Re
ven
ue
14,7
75
14,8
64
15,6
55
19,7
69
24,9
30
29,3
70
Exp
en
ditu
res
10,1
05
11,2
62
11,6
47
13,5
87
15,6
50
17,3
60
Ne
t C
on
trib
utio
n4,
670
3,60
2
4,
008
6,18
2
9,
280
12,0
10
Stra
teg
ic In
vest
me
nt P
riorit
ies
Re
ven
ue
20,4
69
2,90
0
5,
581
1,87
2
60
0
600
Ex
pe
nd
iture
s **
53,1
16
16,4
33
20,4
91
23,6
95
18,1
60
21,4
00
Ne
t C
on
trib
utio
n(3
2,64
7)
(13,
533)
(1
4,91
0)
(21,
823)
(1
7,56
0)
(20,
800)
No
n-C
ash
Re
venu
e A
dju
stm
ent
sC
ap
ital G
ran
ts re
co
rde
d a
s D
efe
rre
d C
ap
ital C
on
trib
utio
ns
(18,
277)
(2
,560
)
(1
,560
)
(9
00)
(7
00)
(4
00)
A
mo
rtiz
atio
n o
f De
ferr
ed
Ca
pita
l Co
ntr
ibu
tion
s8,
024
7,90
0
7,
810
7,00
0
7,
000
7,00
0
No
n-C
ash
Exp
end
iture
Ad
just
me
nts
Exp
en
ditu
res
to b
e C
ap
italiz
ed
40,2
87
7,00
0
4,
240
6,00
0
4,
000
4,00
0
A
mo
rtiz
atio
n E
xpe
nse
(14,
811)
(1
5,00
0)
(14,
500)
(1
4,00
0)
(14,
000)
(1
4,00
0)
Ch
an
ge
in V
ac
atio
n, S
ick
Lea
ve &
Po
st-E
mp
loym
en
t Be
ne
fits
38
1,
168
1,47
7
(4
62)
66
7
N
et C
ont
ribut
ion
as
pe
r
Pub
lic S
ec
tor A
cc
oun
ting
Sta
nda
rds
(PSA
S) *
**6,
053
$
813
$
82
2$
(2,6
55)
$
93
6$
647
$
*
Exp
en
ditu
res
do
no
t in
clu
de
'Co
ntr
ibu
tion
s to
Re
serv
e F
un
ds'
an
d 'P
rinc
ipa
l Re
pa
yme
nts
of D
eb
t'.
** S
tra
teg
ic In
vest
me
nt
Prio
ritie
s Ex
pe
nd
iture
s in
clu
de
s a
uth
oriz
ed
an
d p
rop
ose
d s
pe
nd
ing
fro
m In
tern
ally
Re
stric
ted
Ne
t A
sse
ts.
***
2012
/201
3 A
ctu
als,
201
3/20
14 A
pp
rove
d B
ud
ge
t, a
nd
201
3/20
14 Q
3 Pr
oje
ctio
n N
et
Co
ntr
ibu
tion
s a
re p
rese
nte
d a
s p
er G
en
era
lly A
cc
ep
ted
Ac
co
un
ting
Prin
cip
les
(GA
AP)
.
Algonquin College - Annual Budget 2014–15
7
Ann
ual B
udge
t 201
4/20
15
PR
O F
ORM
A S
UM
MA
RY
(a
ll fig
ure
s in
$ 0
00's)
Ann
ual
Q3
Ann
ual
Ac
tua
lBu
dg
et
Pro
jec
tion
Bud
ge
tPr
o F
orm
aPr
o F
orm
a20
12/2
013
2013
/201
420
13/2
014
2014
/201
520
15/2
016
2016
/201
7
Ne
t Ass
ets
Un
rest
ricte
d1,
000
1,00
0
1,
000
1,00
0
1,
000
1,00
0
In
vest
me
nt
in C
ap
ital A
sse
ts48
,918
55
,731
50
,830
51
,389
50
,298
49
,668
V
ac
atio
n, S
ick
Lea
ve a
nd
Po
st-E
mp
loym
en
t Be
ne
fits
****
(19,
863)
(1
3,84
2)
(18,
386)
(1
8,84
8)
(18,
782)
(1
8,77
5)
Inte
rna
lly R
est
ricte
dA
pp
rop
riatio
ns
2,19
5
-
1,
000
1,00
0
1,
000
Sp
ec
ific
Re
serv
es
25,6
10
8,58
5
19
,805
12
,235
10
,565
8,
403
Co
ntin
ge
nc
y R
ese
rve
Fu
nd
4,50
0
-
7,
184
7,65
6
8,
130
8,54
2
G
en
era
l Re
serv
e F
un
ds
20,3
33
22,9
70
23,0
83
26,4
29
29,5
86
32,6
06
Inte
rest
Ra
te S
wa
ps
(13,
723)
(8
,744
)
(9
,286
)
(7
,247
)
(5
,692
)
(4
,280
)
En
do
wm
en
ts17
,911
15
,871
18
,510
19
,110
19
,710
20
,310
TOTA
L N
ET A
SSET
S86
,881
$
81
,571
$
92
,740
$
92
,724
$
95
,815
$
98
,474
$

Algonquin College - Annual Budget 2014–15
8
Annual B
udget 2014/2
015
STA
TEM
EN
T O
F FI
NA
NC
IAL
PO
SIT
ION
(all
fig
ure
s in
$ 0
00's
)
Ma
rch
31
, 2
01
4M
arc
h 3
1,
20
14
Ma
rch
31
, 2
01
5A
nn
ua
l B
ud
ge
tQ
3 P
roje
ctio
nP
rop
ose
d B
ud
ge
tA
SSETS
Cu
rre
nt
Ass
ets
Ca
sh a
nd
Sh
ort
Te
rm In
ve
stm
en
ts2
5,4
52
$
2
5,1
20
$
2
5,0
67
$
A
cc
ou
nts
Re
ce
iva
ble
22
,50
0
17
,00
0
16
,00
0
Inv
en
tory
1,7
00
1,9
00
1,9
00
Pre
pa
id E
xpe
nse
s1
,40
0
1
,40
0
1
,30
0
51
,05
2
45
,42
0
44
,26
7
Inv
est
me
nts
47
,26
9
46
,65
2
46
,55
3
En
do
wm
en
t A
sse
ts1
7,6
56
1
8,5
10
1
9,1
10
C
ap
ita
l A
sse
ts
27
5,7
99
26
9,4
59
26
1,4
59
TOTA
L A
SSETS
39
1,7
76
$
38
0,0
41
$
37
1,3
89
$
LIA
BIL
ITIE
S A
ND
NET
ASSETS
Cu
rre
nt
Lia
bili
tie
sA
cc
ou
nts
Pa
ya
ble
& A
cc
rue
d L
iab
ilitie
s2
0,0
00
1
5,0
00
1
4,0
00
A
cc
rue
d S
ala
rie
s &
Em
plo
ye
e D
ed
uc
tio
ns
Pa
ya
ble
6,0
00
6,0
00
7,5
00
De
ferr
ed
Re
ve
nu
e2
0,0
00
2
0,0
00
2
1,0
00
C
urr
en
t P
ort
ion
of
Lon
g T
erm
De
bt
2,6
47
2,4
59
2,6
09
48
,64
7
43
,45
9
45
,10
9
Lon
g T
erm
De
bt
59
,71
8
56
,47
9
53
,87
0
Va
ca
tio
n,
Sic
k L
ea
ve
& P
ost
-Em
plo
ym
en
t B
en
efits
19
,14
7
18
,38
6
18
,84
8
De
ferr
ed
Ca
pita
l C
on
trib
utio
ns
15
8,2
94
15
9,6
91
15
3,5
91
Inte
rest
Ra
te S
wa
ps
13
,91
6
9,2
86
7,2
47
Ne
t A
sse
tsU
nre
stric
ted
1,0
00
1,0
00
1,0
00
Inv
est
me
nt
in C
ap
ita
l Ass
ets
55
,14
0
50
,83
0
51
,38
9
Va
ca
tio
n,
Sic
k L
ea
ve
& P
ost
-Em
plo
ym
en
t B
en
efits
(19
,14
7)
(18
,38
6)
(18
,84
8)
Inte
rna
lly R
est
ric
ted
51
,32
1
50
,07
2
47
,32
0
Inte
rest
Ra
te S
wa
ps
(13
,91
6)
(9,2
86
)
(7,2
47
)
En
do
wm
en
t Fu
nd
17
,65
6
18
,51
0
19
,11
0
92
,05
4
92
,74
0
92
,72
4
TOTA
L LI
AB
ILIT
IES A
ND
NET
ASSETS
39
1,7
76
$
38
0,0
41
$
37
1,3
89
$

Algonquin College - Annual Budget 2014–15
9
Ann
ual B
udge
t 201
4/20
15
REV
ENU
E SC
HED
ULE
(all
figu
res
in $
000
's)
Fund
ed
Ac
tivity
/C
ont
rac
tC
olle
ge
Inte
rna
tiona
lSt
rate
gic
Ann
ual
Q3
Ann
ual
C
olle
ge
Ac
tivity
& O
the
rA
ncill
ary
Educ
atio
nIn
vest
me
nt
Bud
ge
tPr
oje
ctio
nBu
dg
et
Ac
tua
lO
pe
ratio
nsN
on-
Fund
ed
Ac
tivity
Serv
ice
sC
ent
rePr
iorit
ies
2014
/201
520
13/2
014
2013
/201
420
12/2
013
Gra
nts
Post
Se
co
nd
ary
Ac
tivity
96,0
66$
-$
-$
-$
-$
96,0
66$
94,1
83$
94,5
84$
94,5
12$
Ca
pita
l & E
qu
ipm
en
t-
-
-
-
78
0
780
4,
567
2,90
0
5,
383
Ap
pre
ntic
e4,
779
-
-
-
-
4,77
9
5,
021
4,97
2
4,
824
Flo
w-T
hro
ug
h S
tud
en
t A
id1,
226
-
-
-
-
1,22
6
1,
710
1,71
0
1,
400
TOTA
L G
RAN
TS10
2,07
0
-
-
-
780
10
2,85
1
105,
481
10
4,16
6
106,
119
Tuiti
on
Fee
s
Full-
Tim
e P
ost
Se
co
nd
ary
61,8
73
104
-
16
,220
-
78
,197
72
,172
69
,470
65
,112
Fu
ll-Ti
me
No
n-F
un
de
d-
1,
714
-
-
-
1,71
4
1,
667
1,95
5
1,
603
Part
-Tim
e9,
793
1,01
9
-
-
-
10
,812
10
,758
11
,804
11
,159
A
du
lt Tr
ain
ing
1,29
1
-
-
-
-
1,
291
1,54
0
88
4
1,67
6
St
ud
en
t IT
& M
ob
ile C
om
pu
ting
Fe
es
7,78
0
-
-
-
-
7,
780
6,87
2
6,
707
4,52
8
TOTA
L TU
ITIO
N F
EES
80,7
37
2,83
7
-
16
,220
-
99
,794
93
,009
90
,820
84
,078
Co
ntra
ct E
duc
atio
nal S
erv
ice
s
Pro
vin
cia
lly F
un
de
d P
rog
ram
s-
8,
323
-
-
-
8,32
3
8,
637
8,
406
11,8
56
Co
rpo
rate
& O
the
r Pro
gra
ms
3,29
8
14
,540
-
3,
361
-
21,1
99
18,2
36
18,5
80
13,9
93
Gra
nts
, Fe
es
& O
the
r In
co
me
Ass
oc
iate
d w
ith
C
on
tra
ct
Ac
tivity
-
865
-
-
-
86
5
1,17
6
1,
182
1,86
2
TOTA
L C
ON
TRA
CT
EDU
CA
TIO
NA
L SE
RVIC
ES3,
298
23,7
28
-
3,36
1
-
30
,387
28
,049
28
,168
27
,711
CO
LLEG
E A
NC
ILLA
RY S
ERV
ICES
SA
LES
-
-
41,3
78
-
-
41
,378
40
,963
40
,285
39
,774
Oth
er
Stu
de
nts
' Ass
oc
iatio
n C
on
trib
utio
n
(Stu
de
nt
Co
mm
on
s &
Pe
mb
roke
)-
-
-
-
25
7
257
31
4
-
13,5
48
Ca
pita
l Ca
mp
aig
n-
-
-
-
83
5
835
70
0
-
1,40
6
Ea
rly L
ea
rnin
g C
en
tre
960
-
-
-
-
96
0
946
94
6
902
St
ud
en
t A
nc
illa
ry F
ee
s5,
314
56
-
-
-
5,
370
4,63
2
4,
702
5,06
9
St
ud
en
t Se
rvic
es
Gra
nt
-
-
-
-
-
-
-
80
In
vest
me
nt
Inc
om
e1,
528
-
-
-
-
1,52
8
1,
108
1,40
0
1,
667
Inte
rna
l Tra
nsf
er o
f In
tern
atio
na
l Re
ven
ue
7,22
7
24
9
-
-
-
7,
476
6,48
3
5,
948
5,60
9
M
isce
llan
eo
us
10,5
35
-
-
188
-
10
,723
7,
860
7,46
5
12
,211
TOTA
L O
THER
25,5
64
305
-
18
8
1,
092
27,1
49
22,0
43
20,4
61
40,4
92
TOTA
L RE
VEN
UE
211,
669
$
26
,870
$
41
,378
$
19
,769
$
1,87
2$
30
1,55
8$
289,
545
$
28
3,90
0$
298,
174
$
Fu
nde
d A
ctiv
ity/C
olle
ge
Op
era
tions
211,
669
$
19
9,78
2$
197,
985
$
19
6,96
9$
Co
ntra
ct A
ctiv
ity &
Oth
er N
on-
Fund
ed
Ac
tivity
26,8
70
27,5
64
27,8
66
26,1
87
Co
lleg
e A
ncill
ary
Op
era
tions
41,3
78
40,9
63
40,2
85
39,7
74
In
tern
atio
nal E
duc
atio
n C
ent
re19
,769
15
,655
14
,864
14
,775
Stra
teg
ic In
vest
me
nt P
riorit
ies
1,87
2
5,
581
2,90
0
20
,469
Tota
l Re
venu
e30
1,55
8$
289,
545
$
28
3,90
0$
298,
174
$

Algonquin College - Annual Budget 2014–15
10
Ann
ual B
udge
t 201
4/20
15
EXPE
ND
ITU
RES
SCH
EDU
LE
(all
figu
res
in $
000
's)Fu
nde
d A
ctiv
ity/
Co
ntra
ct
Co
lleg
eIn
tern
atio
nal
Stra
teg
icA
nnua
lQ
3A
nnua
l
Co
lleg
eA
ctiv
ity &
Oth
er
Anc
illa
ryEd
uca
tion
Inve
stm
ent
Bu
dg
et
Pro
jec
tion
Bud
ge
tA
ctu
al
Op
era
tions
No
n-Fu
nde
d A
ctiv
itySe
rvic
es
Ce
ntre
Prio
ritie
s20
14/2
015
2013
/201
420
13/2
014
2012
/201
3Fu
ll-Ti
me
Sa
larie
s &
Be
nefit
sFu
ll-Ti
me
Sa
larie
s &
Be
ne
fits
- A
ca
de
mic
63,0
94$
2,16
9$
-
$
-
$
-
$
65
,263
$
61
,716
$
64
,161
$
61
,459
$
Fu
ll-Ti
me
Sa
larie
s &
Be
ne
fits
- A
dm
inist
ratio
n18
,768
2,
312
1,78
1
75
4
-
23,6
15
21,8
74
22,3
37
20,3
98
Full-
Tim
e S
ala
ries
& B
en
efit
s -
Sup
po
rt34
,030
2,
054
4,32
9
52
1
-
40,9
34
37,8
57
39,1
65
35,5
64
Tota
l Ful
l-Ti
me
Sa
larie
s &
Be
nefit
s11
5,89
2
6,53
5
6,
110
1,27
5
-
12
9,81
2
121,
447
12
5,66
3
117,
421
Oth
er S
taff
Sala
ries
& B
ene
fits
Oth
er S
taff
Sa
larie
s &
Be
ne
fits
- A
ca
de
mic
21,7
67
2,46
9
-
3
-
24,2
39
25,5
80
23,4
50
23,9
82
Oth
er S
taff
Sa
larie
s &
Be
ne
fits
- A
dm
inist
ratio
n1,
370
2,93
3
51
242
-
4,
596
3,17
0
4,
007
2,90
7
O
the
r Sta
ff S
ala
ries
& B
en
efit
s -
Sup
po
rt5,
310
1,61
1
1,
732
30
-
8,
683
9,63
5
8,
424
8,96
4
Tota
l Oth
er S
taff
Sala
ries
& B
ene
fits
28,4
47
7,01
3
1,
783
275
-
37
,518
38
,384
35
,881
35
,853
TOTA
L SA
LARY
& B
ENEF
ITS
144,
339
13
,548
7,
893
1,55
0
-
16
7,33
0
159,
831
16
1,54
4
153,
274
Oth
er O
pe
ratin
gM
an
da
ted
Stu
de
nt
Aid
5,60
5
-
-
5
-
5,61
0
4,
864
4,86
2
6,
054
Co
ntin
ge
nc
ies
5,77
5
-
-
-
-
5,
775
3,48
7
5,
342
4,59
8
Lo
ng
Te
rm D
eb
t In
tere
st92
2
-
2,58
1
-
-
3,
503
4,68
0
3,
600
3,59
4
C
on
tra
ct
Serv
ice
s9,
118
6,42
8
1,
645
1,84
1
-
19
,032
17
,222
19
,325
14
,744
In
stru
ctio
na
l Su
pp
lies
& E
qu
ipm
en
t3,
794
1,69
4
-
3
-
5,49
1
5,
268
4,67
6
5,
043
Info
rma
tion
Te
ch
no
log
y5,
835
590
15
8
51
6,
634
6,35
3
6,
137
5,31
1
Pr
om
otio
n2,
292
549
25
0
310
-
3,
401
3,28
9
3,
088
2,73
8
Bu
ildin
g M
ain
ten
an
ce
& U
tiliti
es
10,7
58
32
2,
365
10
-
13
,165
12
,698
11
,343
10
,772
Fl
ow
-Th
rou
gh
Stu
de
nt
Aid
1,21
8
-
-
-
-
1,
218
1,71
0
1,
710
1,40
0
C
ost
of G
oo
ds
Sold
1,14
5
-
16
,866
-
-
18
,011
18
,282
17
,509
18
,149
In
tern
al T
ran
sfe
r of I
nte
rna
tion
al R
eve
nu
e-
-
7,
476
-
7,47
6
6,
483
5,94
8
5,
618
Oth
er
13,1
43
2,98
9
3,
037
2,34
1
-
21
,510
21
,532
20
,078
22
,971
TOTA
L O
THER
OPE
RATI
NG
59,6
05
12,2
82
26,9
02
12,0
37
-
110,
826
10
5,86
8
103,
618
10
0,99
2
FUN
DIN
G F
OR
STRA
TEG
IC IN
VES
TMEN
T PR
IORI
TIES
-
-
-
-
23,6
95
23,6
95
20,4
91
16,4
33
53,1
16
TOTA
L EX
PEN
DIT
URE
S20
3,94
4$
25,8
30$
34,7
95$
13,5
87$
23,6
95$
301,
851
$
28
6,19
0$
281,
595
$
30
7,38
2$
Fu
nde
d A
ctiv
ity/C
olle
ge
Op
era
tions
203,
944
$
19
3,12
4$
194,
385
$
18
6,47
7$
Co
ntra
ct A
ctiv
ity &
Oth
er N
on-
Fund
ed
Ac
tivity
25,8
30
25,7
69
25,9
02
23,4
28
C
olle
ge
Anc
illa
ry O
pe
ratio
ns34
,795
35
,159
33
,613
34
,256
In
tern
atio
nal E
duc
atio
n C
ent
re13
,587
11
,647
11
,262
10
,105
St
rate
gic
Inve
stm
ent
Prio
ritie
s23
,695
20
,491
16
,433
53
,116
To
tal E
xpe
nditu
res
301,
851
$
28
6,19
0$
281,
595
$
30
7,38
2$

Algonquin College - Annual Budget 2014–15
11
Ann
ual B
udge
t 201
4/20
15
FUN
DIN
G F
OR
STRA
TEG
IC IN
VES
TMEN
T PR
IORI
TIES
SC
HED
ULE
(all
figu
res
in $
000
's)A
nnua
lQ
3 A
nnua
l
Gra
nts
&C
olle
ge
Bud
ge
tPr
oje
ctio
nBu
dg
et
Ac
tua
lFu
ndra
isin
gFu
nde
d20
14/2
015
2013
/201
420
13/2
014
2012
/201
3Re
venu
eFa
cili
ties
Re
ne
wa
l Gra
nt
600
$
-
$
60
0$
600
$
60
0$
601
$
C
olle
ge
Eq
uip
me
nt
Re
ne
wa
l Fu
nd
Gra
nt
-
-
-
559
-
55
9
Kno
wle
dg
e In
fra
stru
ctu
re P
rog
ram
-
-
-
-
-
Ap
pre
ntic
esh
ip E
nh
an
ce
me
nt
Fun
d G
ran
t-
-
-
98
0
-
938
St
ud
en
ts' A
sso
cia
tion
Co
ntr
ibu
tion
(S
tud
en
t C
om
mo
ns
& P
em
bro
ke)
257
-
25
7
314
-
13
,548
C
ap
ital C
am
pa
ign
835
-
83
5
700
-
1,
406
Dig
ital C
olle
ge
180
-
18
0
2,42
8
2,
300
2,30
8
En
ab
ling
Ac
ce
ssib
ility
Fu
nd
-
-
-
-
-
977
O
the
r-
-
-
-
-
13
2
TOTA
L SO
URC
E O
F RE
VEN
UE
1,87
2
-
1,
872
5,58
1
2,
900
20,4
69
Exp
end
iture
sC
am
pu
s Ex
pa
nsio
nR
e-p
atr
iatio
n o
f Ha
ir St
ylist
/Est
he
ticia
n P
rog
ram
Fa
cili
ties
4,15
0
4,
150
De
nta
l Clin
ic U
pg
rad
es
1,00
0
1,
000
Dig
ital C
olle
ge
-
-
3,59
1
3,
900
3,81
9
A
lgo
nq
uin
Ce
ntr
e fo
r Co
nst
ruc
tion
Exc
elle
nc
e-
20
0
200
50
0
-
-
Pem
bro
ke C
am
pu
s70
0
700
70
0
-
15,6
28
Stu
de
nt
Co
mm
on
s25
7
193
45
0
550
-
20
,711
Tota
l Ca
mp
us
Exp
an
sion
257
6,
243
6,50
0
5,
341
3,90
0
40
,158
Oth
er
Co
lleg
e T
ec
hn
olo
gie
s
-
4,73
4
4,
734
1,22
8
2,
650
1,17
9
C
olle
ge
Sp
ac
e &
Infr
ast
ruc
ture
600
2,
950
3,55
0
3,
917
2,65
0
3,
615
Ne
w P
rog
ram
Initi
ativ
es
-
1,25
0
1,
250
845
1,
000
245
A
ca
de
mic
& O
the
r Eq
uip
me
nt
-
1,96
0
1,
960
1,62
0
1,
800
1,45
5
In
itia
tive
s &
Op
po
rtu
niti
es
-
4,70
1
4,
701
4,74
1
4,
433
5,53
1
A
pp
rop
riatio
ns
1,00
0
1,
000
1,81
9
A
pp
ren
tice
ship
En
ha
nc
em
en
t Fu
nd
-
-
-
980
-
93
3
Tota
l Oth
er
600
16
,595
17
,195
15
,150
12
,533
12
,958
TOTA
L EX
PEN
DIT
URE
S85
7
22,8
38
23,6
95
20,4
91
16,4
33
53,1
16
NET
CO
NTR
IBU
TIO
N1,
015
$
(22,
838)
$
(2
1,82
3)$
(14,
910)
$
(1
3,53
3)$
(32,
647)
$

12
Algonquin College - Annual Budget 2014–15
Ann
ual B
udge
t 201
4/20
15
2014
/201
5 N
ET A
SSET
S C
ON
TIN
UIT
Y S
CH
EDU
LE(a
ll fig
ure
s in
$ 0
00's)
Q3
Pro
jec
tion
Ma
rch
31, 2
014
2014
/201
5 Bu
dg
ete
d In
Ye
ar
Use
of F
und
s
2014
/201
5 Bu
dg
ete
d Y
ea
r En
d A
dju
stm
ent
s
Bud
ge
ted
Ba
lanc
e M
arc
h 31
, 201
5
A
pp
rop
riatio
ns-
$
-
$
1,
000
$
1,00
0$
Sp
ec
ific
Re
serv
es
O
the
r Pro
jec
ts &
Initi
ativ
es
13,6
07
7,
452
28
6,
183
An
cill
ary
Se
rvic
es
Re
serv
e F
un
d5,
636
1,
400
1,19
1
5,
427
In
fra
stru
ctu
re R
en
ew
al F
un
d-
25
0
250
E
mp
loym
en
t St
ab
iliza
tion
Fu
nd
s54
2
30
48
56
0
Oth
er S
tud
en
t A
id20
85
81
16
19
,805
8,96
7
1,
598
12,4
36
Co
ntin
ge
ncy
Rese
rve
Fun
d7,
184
-
45
2
7,63
6
Re
serv
e F
und
s
F
utu
re C
ap
ital E
xpa
nsio
n
23,0
83
20
0
3,36
5
26
,248
TO
TAL
INTE
RNA
LLY
RES
TRIC
TED
NET
ASS
ETS
50,0
72$
9,
167
$
6,41
5$
47
,320
$
*
TO
TAL
UN
REST
RIC
TED
NET
ASS
ETS
1,00
0$
-$
-$
1,
000
$
*
Inve
stm
ent
in C
ap
ital A
sse
ts50
,830
$
-$
559
$
51
,389
$
Va
ca
tion,
Sic
k Le
ave
& P
ost
-Em
plo
yme
nt B
ene
fits
**(1
8,38
6)
-
(4
62)
(18,
848)
Inte
rest
Ra
te S
wa
ps
(9,2
86)
-
2,03
9
(7
,247
)
End
ow
me
nt F
und
18,5
10
-
60
0
19,1
10
TO
TAL
NET
ASS
ETS
92,7
40$
9,
167
$
9,15
1$
92
,724
$
* Bu
dg
ete
d b
ala
nc
es
of I
nte
rna
lly R
est
ricte
d N
et
Ass
ets
an
d U
nre
stric
ted
Ne
t A
sse
ts in
clu
de
s th
e im
pa
ct
of b
ud
ge
ted
exp
en
ditu
res
fro
m A
pp
rop
riatio
ns,
Sp
ec
ific
Re
serv
es
an
d R
ese
rve
Fu
nd
s a
nd
co
ntr
ibu
tion
s to
Re
serv
e F
un
ds
for t
he
fisc
al y
ea
r 201
4/20
15.
The
Bo
ard
of G
ove
rno
rs F
ina
nc
ial M
an
ag
em
en
t Po
licy
req
uire
s th
at
the
Bo
ard
of G
ove
rno
rs a
pp
rove
an
y sp
en
din
g fr
om
Re
serv
e F
un
ds.

13
Algonquin College - Annual Budget 2014–15
Ann
ual B
udge
t 201
4/20
15
SUM
MA
RY O
F FU
ND
ED P
OSI
TIO
NS
Ad
min
Sup
po
rtA
ca
de
mic
Tota
lPo
sitio
ns
Op
ene
d#
Posi
tions
C
lose
dPo
sitio
ns
Tra
nsfe
rre
dA
dm
inSu
pp
ort
Ac
ad
em
icTo
tal
Pre
sid
ent
& B
oa
rd o
f Go
vern
ors
Pr
esid
en
t's O
ffic
e4
-
-
4
4
-
-
4
Tota
l4
-
-
4
-
-
-
4
-
-
4
Hum
an
Reso
urc
es
Hu
ma
n R
eso
urc
es
22
2
1
25
22
2
1
25
Tota
l22
2
1
25
-
-
-
22
2
1
25
Fina
nce
and
Ad
min
istr
atio
nV
ice
-Pre
side
nt's
Off
ice
2
-
-
2
2
-
-
2
C
olle
ge
An
cill
ary
Se
rvic
es
17
70
-
87
17
70
-
87
Fin
an
ce
& A
dm
inist
rativ
e S
erv
ice
s8
28
-
36
8
28
-
36
Info
rma
tion
Te
ch
no
log
y Se
rvic
es
11
68
79
4
12
71
83
Ph
ysic
al R
eso
urc
es
15
39
-
54
15
39
-
54
Tota
l53
205
-
25
8
4
-
-
54
20
8
-
262
Stud
ent
Se
rvic
es
Vic
e-P
resid
en
t's O
ffic
e2
-
-
2
2
-
-
2
Stu
de
nt
Sup
po
rt S
erv
ice
s9
37
18
64
2
9
39
18
66
Alg
on
qu
in C
olle
ge
Fo
un
da
tion
4
2
6
4
2
6
R
eg
istra
r10
58
-
68
10
58
-
68
To
tal
25
97
18
140
2
-
-
25
99
18
142
Ac
ad
em
ic S
erv
ice
sV
ice
-Pre
side
nt's
Off
ice
17
6
13
36
7
(2)
15
8
18
41
Ass
oc
iate
Vic
e-P
resid
en
t A
ca
de
mic
1-
2
2
2
Sc
ho
ol/
Co
lleg
e W
ork
Initi
ativ
e-
1
-
1
-
1
-
1
Fac
ulty
of A
rts,
Me
dia
& D
esig
n7
27
112
14
6
(1)
6
27
11
2
145
Sc
ho
ol o
f Bu
sine
ss5
9
85
99
5
9
85
99
Sc
ho
ol o
f Ho
spita
lity
& T
ou
rism
3
9
40
52
3
9
40
52
Fac
ulty
of T
ec
hn
olo
gy
& T
rad
es
6
26
14
3
175
1
6
27
143
17
6
Alg
on
qu
in C
olle
ge
He
rita
ge
Inst
itute
3
10
12
25
3
10
12
25
Fa
cu
lty o
f He
alth
, Pu
blic
Sa
fety
& C
om
mu
nity
Stu
die
s8
31
123
16
2
8
31
12
3
162
Le
arn
ing
& T
ea
ch
ing
Se
rvic
es
1
5
-
6
1
5
-
6
Mo
bile
Co
mp
utin
g7
-
7
-
7
-
7
Ce
ntr
e fo
r Co
ntin
uin
g &
On
line
Le
arn
ing
4
18
-
22
2
1
7
18
-
25
Pers
on
al D
eve
lop
me
nt
Inst
itute
2
2
2
2
A
pp
lied
Re
sea
rch
& D
eve
lop
me
nt
2
1
3
2
1
3
Bu
sine
ss D
eve
lop
me
nt
& C
orp
ora
te T
rain
ing
5
3
8
5
3
8
In
tern
atio
na
l & C
orp
ora
te B
usin
ess
De
velo
pm
en
t7
9
21
37
2
8
10
21
39
A
lgo
nq
uin
Co
lleg
e in
th
e O
tta
wa
Va
lley
6
29
27
62
6
29
27
62
To
tal
74
19
3
57
6
843
12
-
- -
77
19
7
581
85
5
Ad
vanc
em
ent
Exe
cu
tive
Dire
cto
r's O
ffic
e3
2
-
5
1
3
3
-
6
R
ec
ruitm
en
t2
7
-
9
2
7
-
9
M
ark
etin
g S
erv
ice
s1
10
-
11
1
1
11
-
12
Tota
l6
19
-
25
2
-
-
6
21
-
27
CO
LLEG
E TO
TAL
18
4
516
595
1,
295
20
-
-
18
8
52
7
600
1,
315
3rd
Qua
rte
r 201
3/20
14Po
sitio
n C
hang
es
Pro
po
sed
Bud
ge
t 201
4/20
15

14
Algonquin College - Annual Budget 2014–15
Annual Budget 2014/2015
2014/2015 PROJECTED ENROLMENT vs. 2013/2014 ACTUAL ENROLMENT
ProjectedActual
(unaudited) ProjectedActual
(unaudited) ProjectedActual
(unaudited)FACULTY/SCHOOL 2014/2015 2013/2014 Change 2014/2015 2013/2014 Change 2014/2015 2013/2014 ChangeArts, Media & Design
Level 1 2,650 2,588 62 45 41 4 - - - Returning 4,483 4,136 347 189 221 (32) - - -
TOTAL 7,133 6,724 409 234 262 (28) - - -
BusinessLevel 1 1,895 1,931 (36) 60 60 - - - -
Returning 5,003 4,759 244 328 301 27 - - - TOTAL 6,898 6,690 208 388 361 27 - - -
Hospitality & TourismLevel 1 1,215 1,058 157 40 39 1 - - -
Returning 1,636 1,603 33 195 147 48 - - - TOTAL 2,851 2,661 190 235 186 49 - - -
Technology & TradesLevel 1 2,363 2,352 11 24 7 17 - - -
Returning 5,398 5,253 145 90 6 84 - - - TOTAL 7,761 7,605 156 114 13 101 - - -
Health, Public Safety & Community Studies
Level 1 2,142 2,154 (12) - - - - - - Returning 5,148 5,217 (69) - - - - - -
TOTAL 7,290 7,371 (81) - - - - - -
Centre for Continuing &Online Learning
Level 1 845 786 59 - - - - - - Returning 939 838 101 - - - - - -
TOTAL 1,784 1,624 160 - - - - - -
Business Development
Level 1 97 105 (8) - - - - - - Returning 163 102 61 - - - - - -
TOTAL 260 207 53 - - - - - -
Algonquin CollegeHeritage Institute
Level 1 216 213 3 - - - - - - Returning 449 390 59 - - - - - -
TOTAL 665 603 62 - - - - - -
Algonquin College in the Ottawa Valley
Level 1 484 483 1 - - - 18 19 (1) Returning 870 853 17 - - - 26 20 6
TOTAL 1,354 1,336 18 - - - 44 39 5
TOTAL Level 1 11,907 11,670 237 169 147 22 18 19 (1) 2.2%TOTAL Returning 24,089 23,151 938 802 675 127 26 20 6 4.5%
TOTAL 35,996 34,821 1,175 971 822 149 44 39 5 3.7%
In addition to the above, the budget supports: 1,999 semestered enrolments in the Collaborative Programs; 1,687 semestered enrolments in Full-Time Non-Funded Programs; and 2,597 Seat Purchases in the Apprentice Programs.
Co-op
% C
hang
e
Post Secondary / Applied DiplomaPost Diploma Degree Apprenticeship

15
Algonquin College - Annual Budget 2014–15
Annual Budget 2014/2015
2014-15 Proforma Summary Financial Health Indicators - Net Assets
Net Assets: Net Asset Summary
Objec2ve: To measure a net asset balance for opera1ng purposes. Benchmark: Less than zero indicates an accumulated deficit. Note: Compare with 2003/04 Net Assets Summary of $(5,143k)
0
10000
20000
30000
40000
50000
60000
70000
Net
Ass
et S
umm
ary
(Col
lege
) ($
000'
s)
Net Assets
2014-15 PRO FORMA SUMMARYFinancial Health Indicators - Net Assets
Net Assets:Net assets Summary

16
Algonquin College - Annual Budget 2014–15
2014
-15
PR
O F
OR
MA
SU
MM
AR
YF
inan
cial
Hea
lth
Ind
icat
ors
- O
per
atin
g R
esul
ts
Ann
ual B
udge
t 201
4/20
15
2014
-15
Pro
form
a S
umm
ary
Fi
nanc
ial H
ea
lth In
dic
ato
rs -
Op
era
ting
Re
sults
Ope
ratin
g Re
sults
: Net
Ass
ets t
o Ex
pens
e Ra
tioO
pera
ting
Resu
lts: N
et In
com
e to
Rev
enue
Rat
io
Obj
ec;v
e:
A trad
i(on
al in
dica
tor t
o as
certain the ab
ility of a
college
to con
(nue
ope
ra(o
ns in
the ev
ent t
here is a
delay in re
venu
e stream
s.
Benc
hmar
k:
Less th
an 60%
may
be a co
ncern sin
ce it cou
ld in
dica
te th
at a college
may
not hav
e su
fficien
t interna
lly
accu
mulated
reso
urce
s in the future to
fund
ope
ra(o
ns and
may
be he
ading towards
a defi
cit p
osi(on
. A ne
ga(v
e pe
rcen
tage
indica
tes t
he college
is alre
ady in a defi
cit p
osi(on
. Note: Com
pare with
200
3/04
Net Assets to Expense Ra
9o of 4
8%
Obj
ec;v
e:
This ra(o
is an indica
tor o
f fiscal perform
ance
that m
easu
res t
he exten
t of a
balan
ced bu
dget.
Benc
hmar
k:
Less th
an 1.5% m
ay be a co
ncern be
caus
e it may
indica
te th
at th
e co
llege
may
not be ab
le to
reco
ver
from
a defi
cit p
osi(on
in a re
ason
able period of (me.
Note: Com
pare with
200
3/04
Net Income to Revenue Ra9
o of (0
.24)%
50%
55%
60%
65%
70%
75%
80%
85%
90%
95%
100%
Net Assets to Expense Ra;o
Colle
ge
Benc
hmark
-‐1%
0%
1%
2%
3%
4%
5%
Net Income to Revenue Ra;o
Colle
ge
Benc
hmark

17
Algonquin College - Annual Budget 2014–15
2014
-15
PR
O F
OR
MA
SU
MM
AR
YF
inan
cial
Hea
lth
Ind
icat
ors
- D
ebt
Man
agem
ent
Ann
ual B
udge
t 201
4/20
15
2014
-15
Pro
form
a S
umm
ary
Fi
nanc
ial H
ea
lth In
dic
ato
rs -
De
bt M
ana
ge
me
nt
Man
aging De
bt: To
tal D
ebt to Assets Ratio
Man
aging De
bt: D
ebt S
ervicing Ratio
Objec8v
e:
Measures the propor,on of total assets that are financed by debt. A high or increasing value may be
predic,ve of future liquidity problem
s or a reduced ability to borrow money in the future.
Benchm
ark:
Greater than 35% leads to a concern as this may indicate that a college will not be able to finance their
ongoing opera,ons due to the debt burden.
Note: Com
pare with
200
3/04
Total Debt to Assets Ra9
o of 52%
Objec8v
e:
This ra,o measures the College’s spending on servicing the debt porDolio and could be used as an indicator
that the college may be over-‐leveraged in debt.
Benchm
ark:
A ra,o greater than 3% indicates that the college is spending less than 97% on core services which leads to a
possibility that the college may be over-‐leveraged with debt payments.
Note: Com
pare with
200
3/04
Debt Servicing
Ra9
o of 2.7%
5%
10%
15%
20%
25%
30%
35%
40%
Total Debt to Assets Ra8o
College
Benchm
ark
1%
2%
2%
3%
3%
4%
2009/10
2010/11 O2011/12
2012/13
2013/14
Q3
Projec,on
2014-‐15
2015-‐16
2016-‐17
Debt Servicing Ra8o
College
Benchm
ark

18
Algonquin College - Annual Budget 2014–15
Annual Budget 2014/2015
2014-15 Proforma Summary Financial Health Indicators - Liquidity
Measuring Liquidity: Quick Ratio
Objec9ve: Fiscal performance indicator tes1ng the college’s ability to pay its short term maturing obliga1ons (e.g. biweekly payroll payments). Benchmark: Less than 1.00 is typically a concern because it begins to indicate that a college may not be able to meet its short term obliga1ons. Note: When including surplus cash invested in longer term investments (greater than 1 year) Algonquin’s Quick Ra>o is at 2.0 for 2014/15.
0.8
0.9
1
1.1
1.2
1.3
1.4
1.5
Quick Ra9
o
College
Benchmark
2014-15 PRO FORMA SUMMARYFinancial Health Indicators - Liquidity
Measuring Liquidity: Quick Ratio
