canaccord genuity europe non-deal road show · renewable fuel standards program (rfs2) and tax...
TRANSCRIPT

CANACCORD Genuity Europe Non-Deal Road ShowSeptember 2015
Creating sustainable food, feed and fuel ingredients for a growing population
Randall C. Stuewe, Chairman and CEO
John O. Muse, EVP Chief Financial Officer

Creating sustainable food, feed and fuel ingredients for a growing population
Safe Harbor Statement
2
This presentation contains “forward-looking” statements regarding the business operations and prospects of Darling Ingredients Inc. and industry factors affecting it. These statements are identified by words such as “believe,” “anticipate,” “expect,” “estimate,” “intend,” “could,” “may,” “will,” “should,” “planned,” “potential,” “continue,” “momentum,” and other words referring to events that may occur in the future. These statements reflect Darling Ingredient’s current view of future events and are based on its assessment of, and are subject to, a variety of risks and uncertainties beyond its control, each of which could cause actual results to differ materially from those indicated in the forward-looking statements. These factors include, among others, existing and unknown future limitations on the ability of the Company's direct and indirect subsidiaries to make their cash flow available to the Company for payments on the Company's indebtedness or other purposes; unanticipated costs or operating problems related to the acquisition and integration of Rothsay and Darling Ingredients International (including transactional costs and integration of the new enterprise resource planning (ERP) system); global demands for bio-fuels and grain and oilseed commodities, which have exhibited volatility, and can impact the cost of feed for cattle, hogs and poultry, thus affecting available rendering feedstock and selling prices for the Company’s products; reductions in raw material volumes available to the Company due to weak margins in the meat production industry as a result of higher feed costs, reduced consumer demand or other factors, reduced volume from food service establishments, reduced demand for animal feed, or otherwise; reduced finished product prices; continued decline in fat and used cooking oil finished product prices; changes to worldwide government policies relating to renewable fuels and greenhouse gas emissions that adversely affect programs like the Renewable Fuel Standards Program (RFS2) and tax credits for biofuels both in the United States and abroad; possible product recall resulting from developments relating to the discovery of unauthorized adulterations to food or food additives; the occurrence of Bird Flu including, but not limited to H5N1 flu, bovine spongiform encephalopathy (or "BSE"), porcine epidemic diarrhea ("PED") or other diseases associated with animal origin in the United States or elsewhere; unanticipated costs and/or reductions in raw material volumes related to the Company’s compliance with the existing or unforeseen new U.S. or foreign regulations (including, without limitation, China) affecting the industries in which the Company operates or its value added products (including new or modified animal feed, Bird Flu, PED or BSE or similar or unanticipated regulations); risks associated with the renewable diesel plant in Norco, Louisiana owned and operated by a joint venture between Darling Ingredients and Valero Energy Corporation, including possible unanticipated operating disruptions; risks relating to possible third party claims of intellectual property infringement; increased contributions to the Company’s pension and benefit plans, including multiemployer and employer-sponsored defined benefit pension plans as required by legislation, regulation or other applicable U.S. or foreign law or resulting from a U.S. mass withdrawal event; bad debt write-offs; loss of or failure to obtain necessary permits and registrations; continued or escalated conflict in the Middle East, North Korea, Ukraine or elsewhere; and/or unfavorable export or import markets. These factors, coupled with volatile prices for natural gas and diesel fuel, climate conditions, currency exchange fluctuations, general performance of the U.S. and global economies, disturbances in world financial, credit, commodities and stock markets, and any decline in consumer confidence and discretionary spending, including the inability of consumers and companies to obtain credit due to lack of liquidity in the financial markets, among others, could negatively impact the Company's results of operations. Among other things, future profitability may be affected by the Company’s ability to grow its business, which faces competition from companies that may have substantially greater resources than the Company. The Company’s announced share repurchase program may be suspended or discontinued at any time and purchases of shares under the program are subject to market conditions and other factors, which are likely to change from time to time. Other risks and uncertainties regarding Darling Ingredients Inc., its business and the industries in which it operates are referenced from time to time in the Company’s filings with the Securities and Exchange Commission. Darling Ingredients Inc. is under no obligation to (and expressly disclaims any such obligation to) update or alter its forward-looking statements whether as a result of new information, future events or otherwise.

3
Seeking to be the global leader in
FOOD
FEEDFUEL
INGREDIENTS for a growing population.
We will build, acquire and develop businesses within geographies where
we can achieve a sustainable Top 3 market position within 5 years.
To be THE RECOGNIZED Global Leader
in the production, development and value-adding of
sustainable animal and nutrient recovered ingredients.

OUR PROMISES
FINANCIAL – FOR OUR SHAREHOLDERS
1. We seek investments and growth in businesses and geographies where
sustainable and predictable margins can be achieved.
2. We will deliver superior financial results relative to our defined peer group.
3. We will maintain a capital structure that is capable of withstanding commodity
and currency swings that are typical within our segments and geographies.
4. We will employ risk management tools that help to reduce volatility where possible.
OPERATIONS – FOR OUR CUSTOMERS AND SUPPLIERS
1. We will continuously develop new products and improve customer intimacy.
2. We will deploy best available control technologies to minimize our impact on
the environment, our employees, and our communities in which we operate.
3. We will constantly seek improvement in our supply chain, our processes, our
products, and our operations .
PEOPLE – FOR OUR EMPLOYEES
1. We will follow our core values of integrity, transparency and entrepreneurship at all times.
2. We will create a family culture globally that speaks “One” language.3. We will seek out and develop talent at all levels and locations in order to sustain
the organization for generations to come.4. We will be socially responsible to the environment, our communities, and
our people.
4

Creating sustainable food, feed and fuel ingredients for a growing population
5
We have created a new global platform

Creating sustainable food, feed and fuel ingredients for a growing population
• Gelatin • Casings
• Functional Proteins
• Food Grade Fats
• Heparin • Bone China
• Proteins • Fats
• Bakery Feeds
• Organic Fertilizers
• Plasmas
• Hides
• Renewable Fuels
• Biofuels
• Green Gas
• Green ElectricityF
UE
LF
EE
DF
OO
D
Employees: Approx. 10,000
Headquarters: Irving, Texas, USA
Industries served: Pharma, food, feed, pet food, technical, fuel, bio-energy, fertilizer
6
Global platform: 5 continents, 200+ locations
Founded: 1882 Listed: 1994
Publicly traded: NYSE: DAR
2014 revenue: ~$4.0 billion

Creating sustainable food, feed and fuel ingredients for a growing population
7
Creates Margin OpportunityDAR is operated as a spread business
Operating Costs
Transportation Costs
Energy Costs
Raw Material
Availability
Competing Ingredient
Supply
Some sources estimate strong growth in world
population which will drive Food, Feed & Fuel demand
When wealth & population grow….people eat better
Creating sustainable food, feed and fuel ingredients for a growing population
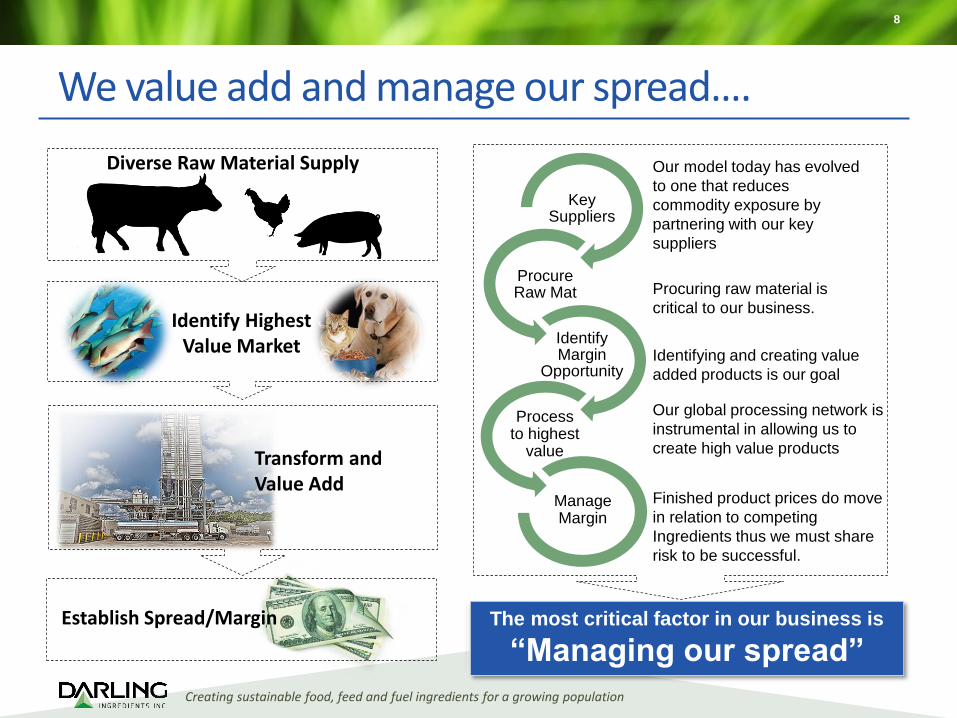
We value add and manage our spread….
8
Diverse Raw Material Supply
Establish Spread/Margin
Transform andValue Add
Key Suppliers
Procure Raw Mat
Identify Margin
Opportunity
Process to highest
value
Manage Margin
Our model today has evolved
to one that reduces
commodity exposure by
partnering with our key
suppliers
Procuring raw material is
critical to our business.
Identifying and creating value
added products is our goal
Our global processing network is
instrumental in allowing us to
create high value products
Finished product prices do move
in relation to competing
Ingredients thus we must share
risk to be successful.
The most critical factor in our business is
“Managing our spread”
Identify Highest Value Market
Food, Feed & FuelOur Business Segments
Creating sustainable food, feed and fuel ingredients for a growing population

Creating sustainable food, feed and fuel ingredients for a growing population
The ingredients we produce are used in three primary segments:
- Food (pharmaceutical, gelatin, natural casings, edible fats)- Feed (fats & proteins, pet food, nutritional feed supplements, fertilizers)- Fuel (renewable and bio-diesel, green gas, green energy)
Globally Recognized Brands
10

Creating sustainable food, feed and fuel ingredients for a growing population
11
Food Segment - Ingredients for living
Business Overviewo Collection and processing of animal by-
products into gelatin and hydrolyzed collageno Collection and processing of porcine/bovine
intestines into natural casingso Production of crude heparin and edible fat
Key Driverso Supply and competing uses for bones, hides and pig skinso Global demand for gelatin/sausage products in end marketso Palm oil, food grade glues and binders (animal fats)o Supply of hogs & sheep/competition from collagen casings
Financials (Fiscal 2014)
o Net Sales: $1,248mm (32% of total)
o Adjusted EBITDA: $137mm (10.9% of sales)
End Marketso Pharmaceuticalo Gelatin for food marketo Bone Chinao Natural casingso Edible fats
Business Highlights
o Rousselot is a global leading supplier of gelatin and hydrolyzed collagen with 13 production facilities selling to more than 75 countries
o Sonac food-grade fat has processing facilities in Germany and the Netherlands providing high-quality fats for baking, frying & spreads
o Sonac Bone provides raw materialfor our gelatin plants
o CTH supplies natural casings andmeat products to the food and meat industries
Creating sustainable food, feed and fuel ingredients for a growing population
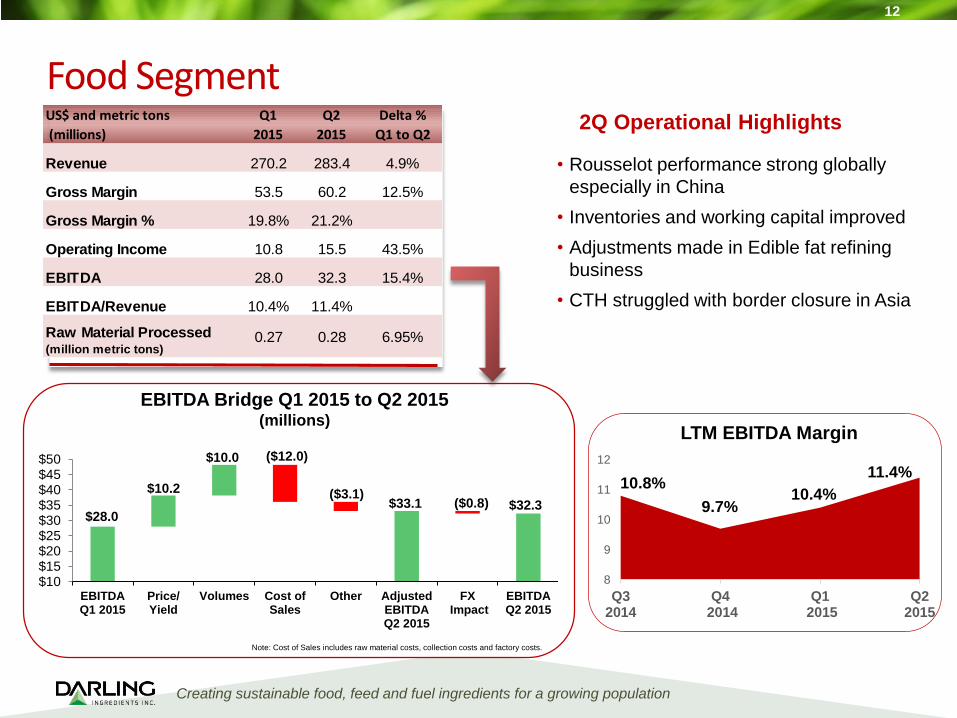
2Q Operational Highlights
Food Segment
12
• Rousselot performance strong globally
especially in China
• Inventories and working capital improved
• Adjustments made in Edible fat refining
business
• CTH struggled with border closure in Asia
Note: Cost of Sales includes raw material costs, collection costs and factory costs.
EBITDA Bridge Q1 2015 to Q2 2015(millions)
$28.0
$10.2
$10.0 ($12.0)
$33.1 $32.3($3.1)
($0.8)
$10$15$20$25$30$35$40$45$50
EBITDAQ1 2015
Price/Yield
Volumes Cost ofSales
Other AdjustedEBITDAQ2 2015
FX Impact
EBITDAQ2 2015
10.8%
9.7%10.4%
11.4%
US$ and metric tons
(millions)
Q1
2015
Q2
2015
Delta %
Q1 to Q2
Revenue 270.2 283.4 4.9%
Gross Margin 53.5 60.2 12.5%
Gross Margin % 19.8% 21.2%
Operating Income 10.8 15.5 43.5%
EBITDA 28.0 32.3 15.4%
EBITDA/Revenue 10.4% 11.4%
Raw Material Processed(million metric tons)
0.27 0.28 6.95%
8
9
10
11
12
Q32014
Q4 2014
Q1 2015
Q22015
LTM EBITDA Margin

Creating sustainable food, feed and fuel ingredients for a growing population
13
Feed Segment - Nutrients for growth
Business Overviewo Rendering: Collection & processing of animal by-products into
oils and protein meals / blood plasma powder and hemoglobin o Bakery: Collection & processing of residuals into Cookie Meal®o Restaurant Services: Collection & processing of used cooking
oil into non-food grade fats
Key Driverso Raw material availabilityo Commodity prices (e.g. corn)o Competing agricultural-based ingredientso Feed/consumer protein/pet food demando Global biofuel production
Financials (Fiscal 2014)
o Net Sales: $2,421mm (61% of total)
o Adjusted EBITDA: $368mm (15.2% of sales)
End Marketso Feed & nutritional feed supplements o Bakery feedso Pet foodo Fertilizerso Hides
Business Highlights
o Feed Ingredients is our largest segment, predominantly attributable to operations in North America
o Sonac and Sonac Blood are Europe’s leading supplier of consistent and high quality proteins, fats and minerals from food-grade animal by-products, used in pet food, animal feed, aquaculture & fertilizers
o The segment is operated as margin management business, i.e. majority of US rendering raw materials are procured on formula-based pricing arrangements

Creating sustainable food, feed and fuel ingredients for a growing population
11
12
13
14
15
Q32014
Q4 2014
Q1 2015
Q22015
LTM EBITDA Margin
Feed Segment2Q Operational Highlights
14
• Global rendering making necessary adjustments
• Volumes seasonally declined
• Europe and Canada both steady
• USA formulas lagging somewhat due to declining fat and
compressing feed grade/pet food premiums
• UCO business made adjustments and showing signs of
improvement
• Bakery showed small improvement, with more expected
• TRS, Nature Safe and our Premium Proteins businesses
all had improved performances
Note: Cost of Sales includes raw material costs, collection costs and factory costs.
EBITDA Bridge Q1 2015 to Q2 2015(millions)
$75.5($4.7)
($11.7)
$17.7($0.8)
($0.1)$76.0 $75.9
$40
$50
$60
$70
$80
EBITDAQ1 2015
Price/Yield
Volumes Cost ofSales
Other AdjustedEBITDAQ2 2015
FXImpact
EBITDAQ2 2015
US$ and metric tons
(millions)
Q1
2015
Q2
2015
Delta %
Q1 to Q2
Revenue $547.5 $529.4 -3.3%
Gross Margin 123.5 124.5 0.8%
Gross Margin % 22.6% 23.5%
Operating Income 35.4 35.4 0.0%
EBITDA 75.5 75.9 0.5%
EBITDA/Revenue 13.8% 14.3%
Raw Material Processed (million metric tons)
1.87 1.83 -1.95%
13.9%
12.6%
13.8%14.3%

Creating sustainable food, feed and fuel ingredients for a growing population
15
Fuel Segment - Energy for today’s world
Business Overviewo Conversion of animal fats and recycled greases into biodieselo Conversion of organic sludge and food waste into biogaso Processing of manure into natural bio-phosphateo DGD 50/50 JV with Valero – convert feedstock into
renewable diesel
Key Driverso Raw material volumeo Government disposal regulationso Energy / fertilizer priceso Customer service requirementso Manure and organics supply
Financials (Fiscal 2014)
o Net Sales: $287mm (7% of total)
o Adjusted EBITDA: $50mm (17.6% of sales)
o Excludes DGD
End Marketso Renewable fuelso Biofuelso Green electricityo Green gas
Business Highlights
o Rendac operates multiple facilities and a specialized collection fleet of approx. 300 trucks in Europe to collect and safely process mortalities and slaughter designated unfit for animal feed (Category 1 & 2)
o Ecoson is the largest industrial digestion operation in the Netherlands; organic residuals are convertedinto biogas for renewable electricity, and process manure into biophosphate used as fertilizer
o DAR PRO converts animal fats and used cooking oils into biodiesel
Creating sustainable food, feed and fuel ingredients for a growing population
0
5
10
15
20
25
Q32014
Q4 2014
Q1 2015
Q22015
LTM EBITDA Margin
16
2Q Operational Highlights Fuel Segment• Canada biodiesel continues to struggle losing $1.6 mm
EBITDA during the 2nd quarter of fiscal 2015
• Rendac and Ecoson steady
Note: Cost of Sales includes raw material costs, collection costs and factory costs.
Note:
Assuming the $1.00/gallon biodiesel tax credit is reinstated for 2015 the Q2
EBITDA for Darling’s share of DGD would have been approximately $30.2
million. This includes a $1.00/gallon per 44.6 million gallons shipped of
renewable diesel in 2Q 2015. Although the Company remains optimistic, there
can be no assurance the tax credit will be reinstated.
Diamond Green Diesel (50% Joint Venture)
US$ (millions)Q1
2015
Q2
2015
Delta %
Q1 to Q2
EBITDA (Darling's share) 2.3 7.9 243.5%
Gallons Produced 37.5 41.9 11.7%
• DGD performed as anticipated
$9.1 ($8.8)
($1.9)$3.3
$7.0 ($0.1)$8.7 $8.6
-$2
$2
$6
$10
EBITDAQ1 2015
Price/Yield
Volumes Cost ofSales
Other AdjustedEBITDAQ2 2015
FXImpact
EBITDAQ2 2015
EBITDA Bridge Q1 2015 to Q2 2015(millions)
*Excludes raw material processed at the DGD joint venture.
US$ and metric tons
(millions)
Q1
2015
Q2
2015
Delta %
Q1 to Q2
Revenue 57.0 46.5 -18.4%
Gross Margin 13.2 6.3 -52.3%
Gross Margin % 23.1% 13.5%
Operating Income 2.5 2.0 -20.0%
EBITDA 9.1 8.6 -5.5%
EBITDA/Revenue 16.0% 18.5%
Raw Material Processed *(million metric tons)
0.30 0.29 -4.72%
16.4%23.4%
16.0%18.5%

Creating sustainable food, feed and fuel ingredients for a growing population
Fuel Ingredients – DGD
• 50/50 Joint Venture with Valero
• Unconsolidated subsidiary for DAR; now capable of processing in excess of 12,000 barrels per day of input making it North America’s single largest demand point
• Lowest variable cost processing facility in North America
• Today, Darling ships between 30-40 percent of its North American fats and greases to DGD
MARKET DRIVERS
• Renewable Fuel Standard (RFS)/Government regulations
• Ultra low sulfur diesel price
• Feedstock cost
• Co-product values
• Hydrogen costs
17
Creating sustainable food, feed and fuel ingredients for a growing population
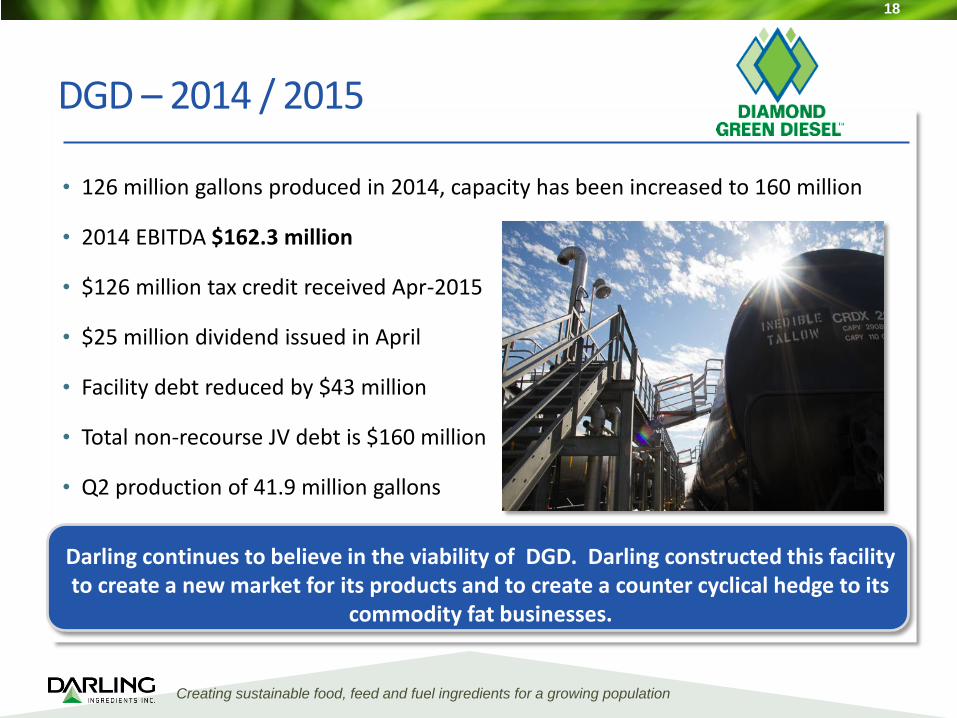
DGD – 2014 / 2015
• 126 million gallons produced in 2014, capacity has been increased to 160 million
• 2014 EBITDA $162.3 million
• $126 million tax credit received Apr-2015
• $25 million dividend issued in April
• Facility debt reduced by $43 million
• Total non-recourse JV debt is $160 million
• Q2 production of 41.9 million gallons
Darling continues to believe in the viability of DGD. Darling constructed this facility to create a new market for its products and to create a counter cyclical hedge to its
commodity fat businesses.
18

Operating Environment & StrategyHow we will grow and sustain our business
Creating sustainable food, feed and fuel ingredients for a growing population

Creating sustainable food, feed and fuel ingredients for a growing population
• Bio Fuels
• RFS Clarity
• Trade constraints
• Strong Dollar
• Volatile petroleum
• China
• Protein expansion
• Pet food demand
• Global weather
• No Acreage reductions
Supply Demand
Policy
Currency &
Petroleum Complex
Drivers for 2015
20
• Overall healthy supplies of grain-based ingredients
• Biofuel policies will determine direction
• Global supply chains will be currency influenced
Creating sustainable food, feed and fuel ingredients for a growing population
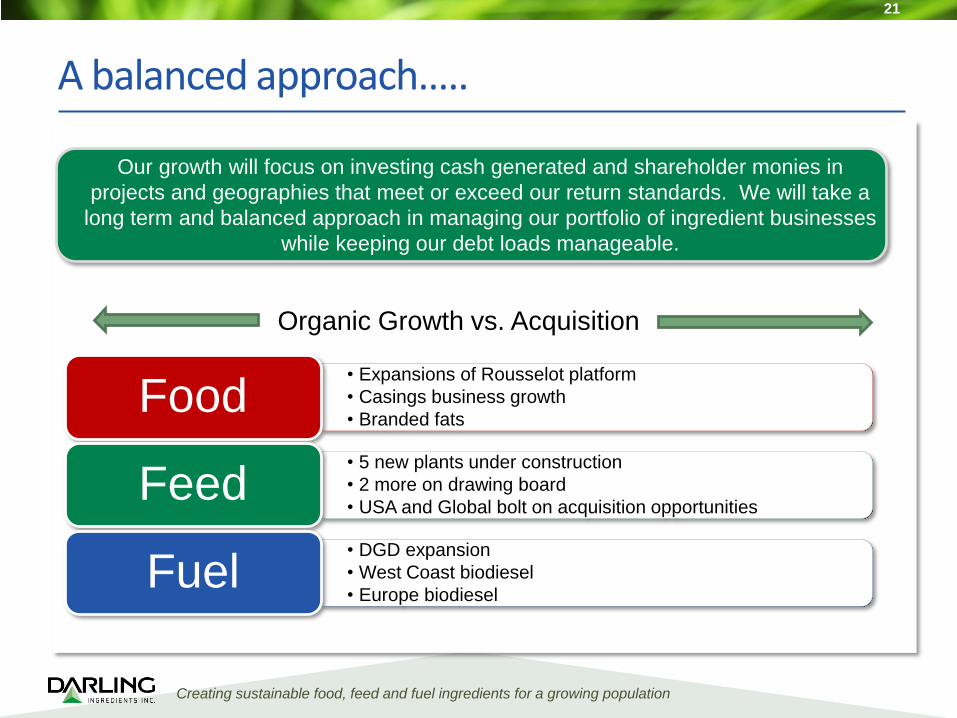
A balanced approach…..
21
• Expansions of Rousselot platform
• Casings business growth
• Branded fatsFood
• 5 new plants under construction
• 2 more on drawing board
• USA and Global bolt on acquisition opportunitiesFeed
• DGD expansion
• West Coast biodiesel
• Europe biodieselFuel
Our growth will focus on investing cash generated and shareholder monies in
projects and geographies that meet or exceed our return standards. We will take a
long term and balanced approach in managing our portfolio of ingredient businesses
while keeping our debt loads manageable.
Organic Growth vs. Acquisition

Creating sustainable food, feed and fuel ingredients for a growing population
Growth happening in 2015 and 2016…..
Food
• Dubuque Iowa Expansion
• Europe modernizations and debottlenecking
• Specialty product developments
• China debottlenecking
• Packaged fat
• New casings plant in China
Feed
• European rendering bolt-ons
• New Arkansas rendering plant early 2016
• New Ohio rendering plant 2016
• New Nebraska wet pet food plant
• New Kentucky wet pet food plant
• New Texas bakery plant Fall 2015
• 2 new blood plants under consideration
Fuel
• DGD now capable of producing 160 million gallons
• ECOSON bio-phosphate on line
• RENDAC added new location in Germany in 2015
22
Creating sustainable food, feed and fuel ingredients for a growing population
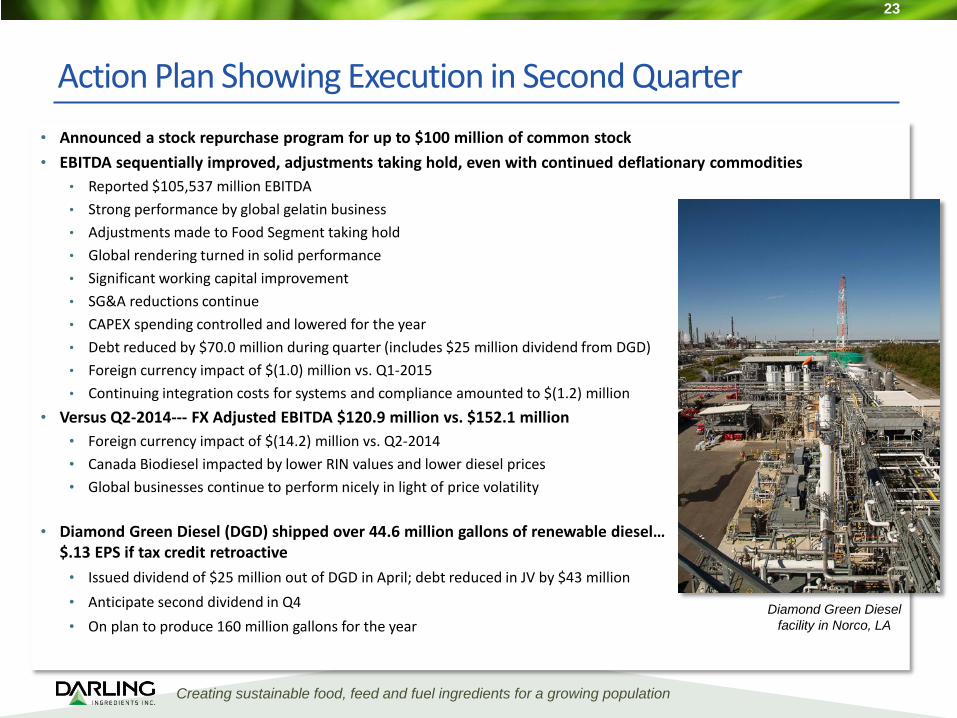
Action Plan Showing Execution in Second Quarter
23
• Announced a stock repurchase program for up to $100 million of common stock
• EBITDA sequentially improved, adjustments taking hold, even with continued deflationary commodities
• Reported $105,537 million EBITDA
• Strong performance by global gelatin business
• Adjustments made to Food Segment taking hold
• Global rendering turned in solid performance
• Significant working capital improvement
• SG&A reductions continue
• CAPEX spending controlled and lowered for the year
• Debt reduced by $70.0 million during quarter (includes $25 million dividend from DGD)
• Foreign currency impact of $(1.0) million vs. Q1-2015
• Continuing integration costs for systems and compliance amounted to $(1.2) million
• Versus Q2-2014--- FX Adjusted EBITDA $120.9 million vs. $152.1 million
• Foreign currency impact of $(14.2) million vs. Q2-2014
• Canada Biodiesel impacted by lower RIN values and lower diesel prices
• Global businesses continue to perform nicely in light of price volatility
• Diamond Green Diesel (DGD) shipped over 44.6 million gallons of renewable diesel… $.13 EPS if tax credit retroactive
• Issued dividend of $25 million out of DGD in April; debt reduced in JV by $43 million
• Anticipate second dividend in Q4
• On plan to produce 160 million gallons for the yearDiamond Green Diesel
facility in Norco, LA

24
We
are
DARLING INGREDIENTS

Financials
Creating sustainable food, feed and fuel ingredients for a growing population

Creating sustainable food, feed and fuel ingredients for a growing population
Earnings Summary
26
Note: (1) The three months ended July 4, 2015 includes approximately $10.6 million write-off of deferred loan costs related to the retirement of the Euro
Term Loan B borrowings under the term B facility.
July 4, April 4, June 28, July 4, June 28,
2015 2015 2014 2015 2014
Revenues 859,315$ 874,694$ 1,031,283$ 1,734,009$ 1,977,575$
Gross profit 191,039 190,173 241,778 381,212 412,864
Selling, general and administrative expenses 84,294 86,631 94,630 170,925 184,663
Depreciation and amortization 66,245 66,398 67,498 132,643 133,167
Acquisition and integration costs 1,208 5,319 4,165 6,527 20,113
Interest expense (1) 34,285 23,109 26,571 57,394 85,428
Foreign currency gain/(loss) 1,622 (2,460) 11 (838) (13,803)
Other income/(expense), net (1,199) (509) (887) (1,708) (2,025)
Equity in net income/(loss) of unconsolidated subsidiary 4,172 (1,808) 2,040 2,364 7,117
Income before taxes 9,602 3,939 50,078 13,541 (19,218)
Income tax expense/(benefit) 4,665 2,115 15,503 6,780 (2,787)
Net income/(loss) 4,937 1,824 34,575 6,761 (16,431)
Net (income)/loss attributable in minority interests (1,857) (1,715) (1,818) (3,572) (3,615)
Net income/(loss) attributable to Darling 3,080$ 109$ 32,757$ 3,189$ (20,046)$
Earnings/(loss) per share (fully diluted) 0.02$ -$ 0.20$ 0.02$ (0.12)$
Three Months Ended - Sequential and Year over Year Six Months Ended - Year over Year

Creating sustainable food, feed and fuel ingredients for a growing population
Adjusted EBITDA
27
(1) January 7, 2014 closed on VION Ingredients, thus the 13th week would be revenue adjusted for January 1, 2014 through January 7, 2014
(2) Foreign currency exchange rates held constant for comparable quarters (USD/Euro 1.1267 rate April 4, 2015 quarter and USD/Euro 1.3744 June 28, 2014 quarter
(3) Darling's pro forma adjusted EBITDA (Non-GAAP)in the above table does not include the DGD Joint Venture adjusted EBITDA (Darling's share) if we had consolidated the DGD
Joint Venture
Adjusted EBITDA and Pro Forma Adjusted EBITDA
(US$ in thousands) July 4, April 4, July 4, June 28,
2015 2015 2015 2014
Net income/(loss) attributable to Darling $ 3,080 $ 109 $ 3,189 $ (20,046)
Depreciation and amortization 66,245 66,398 132,643 133,167
Interest expense 34,285 23,109 57,394 85,428
Income tax expense/(benefit) 4,665 2,115 6,780 (2,787)
Foreign currency (gain)/loss (1,622) 2,460 838 13,803
Other expense/(income), net 1,199 509 1,708 2,025
Equity in net (income)/loss of unconsolidated subsidiaries (4,172) 1,808 (2,364) (7,117)
Net income attributable to noncontrolling interests 1,857 1,715 3,572 3,615
Adjusted EBITDA $ 105,537 $ 98,223 $ 203,760 $ 208,088
Non-cash inventory step-up associated with VION Acquisition − − − 49,803
Acquisition and integration-related expenses 1,208 5,319 6,527 20,113
Darling Ingredients International - 13th week (1) − − − 4,100
Pro Forma Adjusted EBITDA (Non-GAAP) $ 106,745 $ 103,542 $ 210,287 $ 282,104
Foreign currency exchange impact $ 924 − $ 27,137 −
Pro Forma Adjusted EBITDA to Foreign Currency (Non-GAAP) (2) $ 107,669 $ 103,542 $ 237,424 $ 282,104
DGD Joint Venture Adjusted EBITDA (Darling's Share) (3) $ 7,909 $ 2,346 $ 10,255 $ 14,975
Six Months Ended - Year over YearThree Months Ended - Sequential

Creating sustainable food, feed and fuel ingredients for a growing population
Balance Sheet Highlights and Debt Summary
28
Debt SummaryBalance Sheet Highlights
(US$, in thousands) July 4, 2015
Amended Credit Agreement
Revolving Credit Facility 57,552$
Term Loan A 295,370
Term Loan B 592,500
5.375% Senior Notes due 2022 500,000
4.750% Euro Senior Notes due 2022 571,521
Other Notes and Obligations 28,358
Total Debt: 2,045,301$
(US$, in thousands) July 4, 2015
Cash 126,360$
Accounts receivable 368,434
Total Inventories 396,423
Net working capital 445,127
Net property, plant and equipment 1,515,573
Total assets 4,938,800$
Total debt 2,045,301$
Shareholders' equity 1,969,111$
Creating sustainable food, feed and fuel ingredients for a growing population
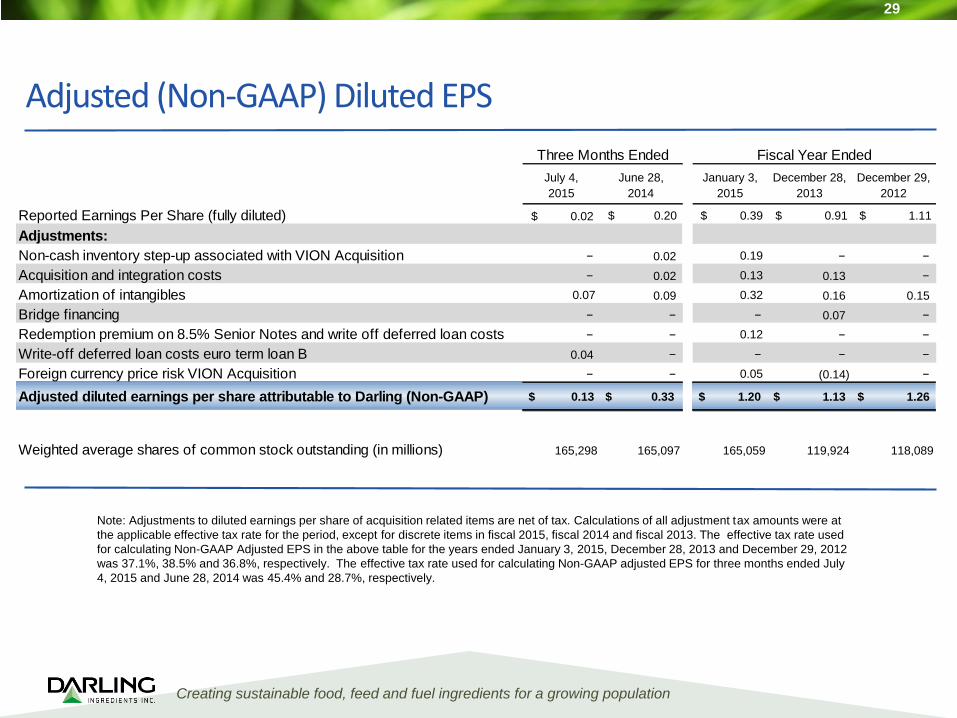
Adjusted (Non-GAAP) Diluted EPS
29
Note: Adjustments to diluted earnings per share of acquisition related items are net of tax. Calculations of all adjustment tax amounts were at
the applicable effective tax rate for the period, except for discrete items in fiscal 2015, fiscal 2014 and fiscal 2013. The effective tax rate used
for calculating Non-GAAP Adjusted EPS in the above table for the years ended January 3, 2015, December 28, 2013 and December 29, 2012
was 37.1%, 38.5% and 36.8%, respectively. The effective tax rate used for calculating Non-GAAP adjusted EPS for three months ended July
4, 2015 and June 28, 2014 was 45.4% and 28.7%, respectively.
July 4, June 28, January 3, December 28, December 29,
2015 2014 2015 2013 2012
Reported Earnings Per Share (fully diluted) 0.02$ $ 0.20 $ 0.39 $ 0.91 $ 1.11
Adjustments:
Non-cash inventory step-up associated with VION Acquisition − 0.02 0.19 − −
Acquisition and integration costs − 0.02 0.13 0.13 −
Amortization of intangibles 0.07 0.09 0.32 0.16 0.15
Bridge financing − − − 0.07 −
Redemption premium on 8.5% Senior Notes and write off deferred loan costs − − 0.12 − −
Write-off deferred loan costs euro term loan B 0.04 − − − −
Foreign currency price risk VION Acquisition − − 0.05 (0.14) −
Adjusted diluted earnings per share attributable to Darling (Non-GAAP) $ 0.13 $ 0.33 $ 1.20 $ 1.13 $ 1.26
Weighted average shares of common stock outstanding (in millions) 165,298 165,097 165,059 119,924 118,089
Three Months Ended Fiscal Year Ended

Creating sustainable food, feed and fuel ingredients for a growing population
Feed Ingredients SegmentChange in Net Sales -Three Months Ended
30
Change in Net Sales - 2Q14 to 2Q15 Fats
Used
Cooking Oil Proteins Bakery Other Total
Net Sales Second Quarter 2014 165.9$ 58.3$ 251.9$ 59.4$ 86.6$ 622.1$
Changes:
Increase in sales volumes 12.3 1.4 12.0 12.9 - 38.6
Decrease in finished good prices (32.1) (16.3) (34.4) (18.0) - (100.8)
Decrease due to currency exchange rates (6.2) (0.3) (19.6) - (9.9) (36.0)
Other change - - - - 5.5 5.5
Total Change: (26.0)$ (15.2)$ (42.0)$ (5.1)$ (4.4)$ (92.7)$
Net Sales Second Quarter 2015 139.9$ 43.1$ 209.9$ 54.3$ 82.2$ 529.4$
Change in Net Sales – 2Q14 to 2Q15
Change in Net Sales - 1Q14 to 1Q15 Fats
Used
Cooking Oil Proteins Bakery Other Total
Net Sales First Quarter 2014 157.0$ 44.8$ 233.2$ 54.2$ 96.9$ 586.1$
Changes:
Increase in sales volumes 10.1 0.9 7.0 10.9 - 28.9
Decrease in finished good prices (13.8) (9.2) (3.1) (11.3) - (37.4)
Decrease due to currency exchange rates (6.6) (0.4) (17.1) - (10.4) (34.5)
Other change - - - - 4.4 4.4
Total Change: (10.3)$ (8.7)$ (13.2)$ (0.4)$ (6.0)$ (38.6)$
Net Sales First Quarter 2015 146.7$ 36.1$ 220.0$ 53.8$ 90.9$ 547.5$
Change in Net Sales – 1Q14 to 1Q15
Creating sustainable food, feed and fuel ingredients for a growing population
31
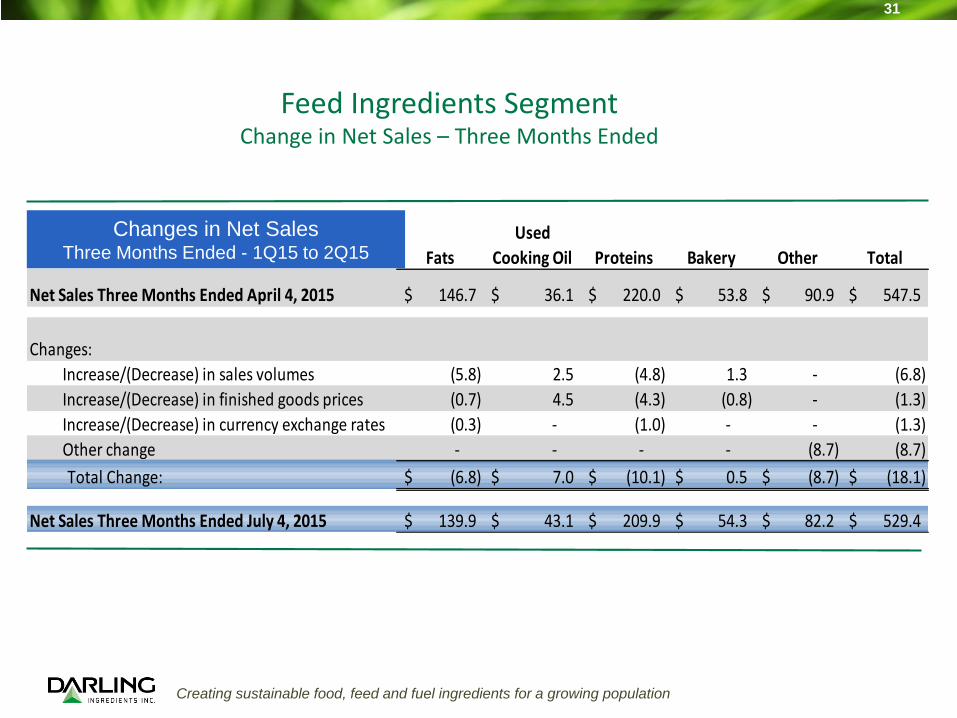
Changes in Net SalesThree Months Ended - 1Q15 to 2Q15 Fats
Used
Cooking Oil Proteins Bakery Other Total
Net Sales Three Months Ended April 4, 2015 146.7$ 36.1$ 220.0$ 53.8$ 90.9$ 547.5$
Changes:
Increase/(Decrease) in sales volumes (5.8) 2.5 (4.8) 1.3 - (6.8)
Increase/(Decrease) in finished goods prices (0.7) 4.5 (4.3) (0.8) - (1.3)
Increase/(Decrease) in currency exchange rates (0.3) - (1.0) - - (1.3)
Other change - - - - (8.7) (8.7)
Total Change: (6.8)$ 7.0$ (10.1)$ 0.5$ (8.7)$ (18.1)$
Net Sales Three Months Ended July 4, 2015 139.9$ 43.1$ 209.9$ 54.3$ 82.2$ 529.4$
Feed Ingredients SegmentChange in Net Sales – Three Months Ended

Creating sustainable food, feed and fuel ingredients for a growing population
Feed Ingredients SegmentChange in Net Sales – Six Months Ended
32
Change in YTD Net Sales - 2Q14 to 2Q15 Fats
Used
Cooking Oil Proteins Bakery Other Total
Net Sales YTD Second Quarter 2014 322.9$ 103.1$ 485.1$ 113.6$ 183.5$ 1,208.2$
Changes:
Increase in sales volumes 22.4 2.3 19.0 23.8 - 67.5
Decrease in finished good prices (45.9) (25.5) (37.5) (29.3) - (138.2)
Decrease due to currency exchange rates (12.8) (0.7) (36.7) - (20.3) (70.5)
Other change - - - - 9.9 9.9
Total Change: (36.3)$ (23.9)$ (55.2)$ (5.5)$ (10.4)$ (131.3)$
Net Sales YTD Second Quarter 2015 286.6$ 79.2$ 429.9$ 108.1$ 173.1$ 1,076.9$
Change in YTD Net Sales
2Q14 to 2Q15

Creating sustainable food, feed and fuel ingredients for a growing population
(1) Has impact of inventory step-up in 1st and 2nd quarter.
(2) Exclusive of non-cash inventory step-up and Darling Ingredients International 13th week.
(3) Raw material process volumes have been adjusted to include additional blending materials.
33
(A) Quarters 1, 2 and 3 revenues have been adjusted for re-class between sales and cost of sales.
• Rendering weekly raw
material volumes up globally;
extra processing week in Q4
2014
• Rendering margins improved
in light of continued price
erosion in fats
• Bakery Feeds business
challenged by lower corn
markets and expansion
demands from acquisition
• USA Restaurant Services
business showed strong
volume with additional
adjustments forthcoming
Q1 Operational Highlights
Feed SegmentUS$ and metric tons
(millions)
Q1
2014
Q2
2014
Q3
2014
Q4
2014
Total
2014
Q1
2015
Revenue (A) $586.1 $622.1 $607.3 $606.0 $2,421.5 $547.5
Gross Margin (1) 142.5 165.4 132.5 132.5 572.9 123.5
Gross Margin % (1) 24.3% 26.6% 21.8% 21.9% 23.7% 22.6%
Operating Income (2) 37.5 74.7 46.4 33.6 192.2 35.4
Adjusted Operating Income (1) 52.4 76.2 46.4 33.6 208.6 35.4
EBITDA (2) 76.1 114.6 84.2 76.4 351.3 75.5
Adjusted EBITDA (1) 90.9 116.1 84.2 76.4 367.6 75.5
Adjusted EBITDA/Revenue 15.5% 18.7% 13.9% 12.6% 15.2% 13.8%
Raw Material Processed (3)
(millions of metric tons) 1.73 1.73 1.73 1.92 7.11 1.87

Creating sustainable food, feed and fuel ingredients for a growing population
Food Segment
34
(1) Has impact of inventory step-up in 1st and 2nd quarter.
(2) Exclusive of non-cash inventory step-up and Darling Ingredients International 13th week.
(3) Raw material process volumes for the first quarter have been adjusted to be consistent with the
presentation of the second quarter figures.
(A) Quarters 1, 2 and 3 revenues have been adjusted for re-class between sales and cost of sales.
$ and metric tons
(millions)
Q1
2014
Q2
2014
Q3
2014
Q4
2014
Total
2014
Q1
2015
Revenue (A) 293.5$ 331.4$ 301.4$ 322.0$ 1,248.3$ 270.2$
Gross Margin (1) 62.3 65.3 64.2 63.4 255.2 53.5
Gross Margin % (1) 21.2% 19.7% 21.3% 19.7% 20.4% 19.8%
Operating Income/(Loss) (2) (12.1) 11.3 14.0 13.7 26.9 10.8
Adjusted Operating Income (1)19.8 14.7 14.0 13.7 62.2 10.8
EBITDA (2) 5.3 30.9 32.6 31.4 100.2 28.0
Adjusted EBITDA (1) 38.3 34.3 32.6 31.4 136.6 28.0
Adjusted EBITDA/Revenue 13.0% 10.4% 10.8% 9.7% 10.9% 10.4%
Raw Material Processed(millions of metric tons) 0.25 (3) 0.27 0.26 0.28 1.06 0.27
• Rousselot performance
steady
• Weekly raw material
volumes up; extra
processing week in Q4 2014
• Edible fat melting margins
under pressure. Russian
border closure putting
additional supplies to
market.
• CTH improving
• Operating delta is FX impact
1Q Operational Highlights

Creating sustainable food, feed and fuel ingredients for a growing population
35
(1) Has impact of inventory step-up in 1st quarter.
(2) Exclusive of non-cash inventory step-up and Darling Ingredients Int'l 13th week.
(3) Raw material process volumes for the first quarter have been adjusted to be consistent
with the presentation of the second quarter figures.(A) Quarters 1, 2 and 3 revenues have been adjusted for re-class between sales and cost of sales.
$ and metric tons
(millions)
Q1
2014
Q2
2014
Q3
2014
Q4
2014
Total
2014
Q1
2015
Revenue $66.7 $77.7 $70.0 $72.2 $286.6 $57.0
Gross Margin 15.3 15.9 17.8 10.0 59.0 13.2
Gross Margin % 21.1% 20.5% 25.4% 13.9% 20.6% 23.1%
Operating Income (2) 2.3 5.2 2.8 10.9 21.2 2.5
Adjusted Operating Income (1) 3.5 5.2 2.8 10.9 22.4 2.5
EBITDA (2) 9.7 11.1 11.5 16.9 49.2 9.1
Adjusted EBITDA (1) 10.9 11.1 11.5 16.9 50.4 9.1
Adjusted EBITDA/Revenue 16.3% 14.3% 16.4% 23.4% 17.6% 16.0%
Raw Material Processed *(millions of metric tons) 0.23 (3) 0.24 0.26 0.33 1.07 0.30
*Excludes raw material processed at the DGD joint venture.
Diamond Green Diesel (50% Joint Venture)
US$ (millions)Q1
2014
Q2
2014
Q3
2014
Q4
2014
Total
2014
Q1
2015
EBITDA (Darling's share) $9.1 $5.9 $2.9 $63.7 $81.6 $2.3
• Ecoson delivering solid results,
improving margins
• Rendac volumes moderated
compared to Q4 some margin
compression with lower crude oil
• Weekly raw material volumes up,
extra processing week in Q4
2014
• Variance is energy credits
received in Q4
1Q Operational Highlights
Note:
Assuming the $1.00/gallon biodiesel tax credit is
reinstated for 2015 the Q1 EBITDA for Darling’s
share of DGD would have been approximately
$17.3 million. This includes a $1.00/gallon per
34.6 million gallons shipped of renewable diesel in
1Q 2015.
Fuel Segment

Creating sustainable food, feed and fuel ingredients for a growing population
Process USA Canada Europe China S. America Australia Total:
Rendering - (C3 By-products & UCO) 93 5 18 116
Bakery 10 10
Used Cooking Oil processing only 8 1 9
Disposal Rendering - (C1 & C2) 6 6
Food Grade Fat Processing 5 5
Blood Processing 1 4 5 1 11
Bone Processing 2 2
Bio Diesel 1 1 2
Renewable Diesel 1 1
Gelatin 2 4 4 3 13
Casings 4 1 5
Environmental Services 4 1 5
Fertilizer 1 1
Petfood 1 1 2
Hides 3 3 6
125 6 49 10 3 1 194Under Construction:
Rendering 2
Pet Food 2
Bakery 1
Locations by Continent and Process
European categories for rendering of animal by-products:
• C3 – food-grade material, for food and feed products
• C2 – unfit for food or animal feed, can be used as fertilizer
• C1 – must be destroyed; used to generate green energy
*
Note: List excludes administrative and dedicated sales offices.
36
*Includes transfer stations and blending
*

Creating sustainable food, feed and fuel ingredients for a growing population
Adjusted EBITDA is presented here not as an alternative to net income, but rather as a measure of the Company’s operating
performance and is not intended to be a presentation in accordance with GAAP. Since EBITDA (generally, net income plus interest
expenses, taxes, depreciation and amortization) is not calculated identically by all companies, this presentation may not be
comparable to EBITDA or adjusted EBITDA presentations disclosed by other companies. Adjusted EBITDA is calculated in this
presentation and represents, for any relevant period, net income/(loss) plus depreciation and amortization, goodwill and long-lived
asset impairment, interest expense, (income)/loss from discontinued operations, net of tax, income tax provision, other
income/(expense) and equity in net loss of unconsolidated subsidiary. Management believes that Adjusted EBITDA is useful in
evaluating the Company’s operating performance compared to that of other companies in its industry because the calculation of
Adjusted EBITDA generally eliminates the effects of financing income taxes and certain non-cash and other items that may vary for
different companies for reasons unrelated to overall operating performance.
As a result, the Company’s management uses Adjusted EBITDA as a measure to evaluate performance and for other discretionary
purposes. However, Adjusted EBITDA is not a recognized measurement under GAAP, should not be considered as an alternative to
net income as a measure of operating results or to cash flow as a measure of liquidity, and is not intended to be a presentation in
accordance with GAAP. In addition to the foregoing, management also uses or will use Adjusted EBITDA to measure compliance
with certain financial covenants under the Company’s Senior Secured Credit Facilities and 5.375% Notes and 4.75% Notes that
were outstanding at July 4, 2015. However, the amounts shown in this presentation for Adjusted EBITDA differ from the amounts
calculated under similarly titled definitions in the Company’s Senior Secured Credit Facilities and 5.375% Notes and 4.75% Notes,
as those definitions permit further adjustments to reflect certain other non-recurring costs and non-cash charges.
In addition, the Company’s management used adjusted diluted earnings per share as a measure of earnings due to the significant
merger and acquisition activity of the Company. However, adjusted earnings per share is not a recognized measurement under
GAAP and should not be considered as an alternative to diluted earnings per share presented in accordance with GAAP. Adjusted
diluted earnings per share is defined as adjusted net income attributable to Darling divided by the weighted average shares of
diluted common stock. Adjusted net income attributable to Darling is defined as a reconciliation of net income attributable to Darling,
net of tax (i) adjusted for net of tax acquisition and integration costs related to merger and acquisitions, (ii) net of tax amortization of
acquisition related intangibles and (iii) net of tax certain non-recurring items that are not part of normal operations. This measure is
solely for the purpose of calculating adjusted diluted earnings per share and is not intended to be a substitute of presentation in
accordance with GAAP.
Non-U.S. GAAP Measures
37