capital structure, product market competition and firm ... · market competition and firm...
TRANSCRIPT

DEPARTMENT OF ECONOMICS
Capital Structure, Product Market Competition and
Firm Performance: Evidence from South
Africa
Samuel Fosu, University of Leicester, UK
Working Paper No. 13/11 May 2013
Capital structure, product market competition and firm
performance: Evidence from South Africa
Samuel Fosu∗
University of Leicester, Department of Economics, University Road, Leicester, LE1 7RH, UnitedKingdom
Abstract
This paper investigates the relationship between capital structure and firm perfor-mance, paying particular attention to the degree of industry competition. The pa-per applies a novel measure of competition, the Boone indicator, to the leverage-performance relationship. Using panel data consisting of 257 South African firmsover the period 1998 to 2009, this paper examines the effect of capital structure onfirm performance and investigates the extent to which the relationship depends onthe level of product market competition. The results suggest that financial leveragehas a positive and significant effect on firm performance. It is also found that prod-uct market competition enhances the performance effect of leverage. The results arerobust to alternative measures of competition and leverage.
JEL classification: G32; L11; L25
Keywords: Capital structure; Product market competition; Firm performance
1. Introduction
Despite several decades of research, there is no generally accepted conclusionabout the relationship between capital structure and firm performance. Followingthe seminal papers of Modigliani & Miller (1958, 1963) suggesting that, but for thetax-advantage of debt, capital structure is irrelevant to firm performance, the rela-tionship between financial leverage and firm performance has attracted much debateand mixed empirical findings. The trade-off between agency costs of debt and equity
∗Tel.: +447930600874Email address: [email protected] (Samuel Fosu)
(Jensen & Meckling, 1976); the limited liability effect of debt (Brander & Lewis,1986); and the disciplining effect of debt (Grossman & Hart, 1983; Jensen, 1986)all suggest a positive effect of leverage on performance. However, possible underin-vestment problems associated with debt (Myers, 1977) and stakeholder reactions toleverage (Maksimovic & Titman, 1991; Titman, 1984) suggest negative effects. Ex-tensions of these theories (Bolton & Scharfstein, 1990; Chevalier & Scharfstein, 1996;Dasgupta & Titman, 1998) suggest that leverage opens up opportunities for rivalrypredation in concentrated product markets, thus conditioning the performance effectof leverage on the degree of competition in the product market. The existing evi-dence of these interaction effects of leverage and competition is based on U.S. firms(Campello, 2003, 2006; Chevalier, 1995a,b; Kovenock & Phillips, 1997; Opler & Tit-man, 1994). The South African experience offers an opportunity to gain new insight.Distinct from the U.S., South Africa features a highly concentrated and pyramidalownership structure of firms (Barr et al., 1995; Kantor, 1998), overly concentratedproduct markets (Fedderke et al., 2007), and a less robust regulatory and legal envi-ronment (Roberts, 2004, 2008). These attributes suggest distinctively severe agencycosts of equity and product market predation.
Using panel data consisting of 257 South African firms over the period 1998 to2009, this study seeks to address three questions: (1) Does knowledge about productmarket competition improve our understanding of leverage-performance relationshipin developing countries? (2) To what extent does this relationship hold or vary acrossalternative measures of competition? (3) To what extent do the effects of leverageon performance and its interaction with competition depend on rival firms’ leveragelevels?
The findings of this paper show a significant positive effect of leverage on firmperformance. This effect is non-linear but remains significantly positive over therelevant range of leverage. It is also found that the interaction effect of leverageand competition on firm performance is positive. The findings imply that competi-tion enhances the benefits of leverage. Using relative-to-rival firms’ leverage yieldsconsistent results.
These findings are broadly consistent with Opler & Titman (1994) and Kovenock& Phillips (1997) in respect of the adverse interaction effect of leverage and productmarket concentration (uncompetitiveness). However, these authors find statisticallyinsignificant direct negative effects of leverage on firm performance, contrary to thedirect positive effects reported in this paper. The observed difference in the directeffect of leverage could be attributed to the nature and severity of agency costs ofequity faced by South African firms.
This paper contributes to the existing literature in the following ways: first, by
2
focusing on South African firms, the paper provides firsthand developing countryevidence of the interaction effect of leverage and competition on performance. Giventhe unique characteristics of South African product markets, this paper providesevidence from a potentially highly predatory environment with severe agency costsof equity. To the author’s knowledge, this issue has not been previously addressed.Second, in addition to the Herfindahl-Hirschman Index, this study adopts a new mea-sure of competition, the Boone indicator (Boone et al., 2005, 2007; Boone, 2008),which estimates the extent to which firms suffer lost earnings (or market share) asa result of being inefficient. The Boone indicator helps address potential setbacks inconcentration indexes used in all previous studies (Opler & Titman, 1994; Chevalier,1995a,b; Kovenock & Phillips, 1997; Campello, 2003, 2006). For instance, a highlevel of product market concentration could simply be the outcome of pronouncedefficiency (Demsetz, 1973) or the exit of inefficient firms from the market as compe-tition intensifies, in which case the profits of the more efficient firms increase (Booneet al., 2005, 2007; Boone, 2008).
The remainder of this paper is organised as follows. Section 2 provides briefmotivation for the study of South African firms. Section 3 presents a review ofthe relevant theoretical literature and empirical evidence; whilst Section 4 outlinesthe research hypothesis. Section 5 describes the data and variables used for thestudy. Section 6 discusses the empirical estimation methods. Section 7 presents theempirical results. The summary and conclusion of the study are presented in Section8.
2. South African corporate context
Concentrated and pyramidal ownership structures, as well as overly concentratedproduct markets, are some of the key features that distinguish South African firmsfrom their U.S. counterparts. A considerably large proportion of Johannesburg StockExchange (JSE) listings are effectively controlled by groups with a pyramidal owner-ship structure.1 Hence, South African firms are distinct from U.S. firms by way of theagency problems they face. Conflict of interest is largely between minority and ma-jority shareholders, rather than between managers and shareholder or creditors andshareholders as in the U.S. and U.K. (Barr et al., 1995; Kantor, 1998). In this agencyrelationship, the minority shareholders are the agents; the majority shareholders, the
1For instance, almost 80% of JSE listings was controlled by groups in 1995 and this groupstructure has seen little change over time (Barr et al., 1995; Kantor, 1998). In fact, as at the endof 2002, 56.2% of the market capitalisation of JSE listings was controlled by four companies (seeRossouw et al., 2002).
3

principals. As noted in Morck et al. (1998), such a system of ownership leads to anextreme level of expropriation of the minority shareholders since significant controlrights can be exercised with little equity stake. This ownership structure, largely sus-tained by the tax advantage of equity investment, holding companies, cross-holdingand voting trusts, has seen little change over time.2 The agency problems associ-ated with such a system of ownership may possibly be mitigated by the disciplinarymeasures embodied in debt contracts. Although debt financing comes with its ownpotential agency problems, with such a system of ownership the disciplinary measuresembodied in debt contracts should logically be more desirable.
Although high levels of concentrated ownership, which have emerged from thepyramidal ownership structure (Ntim et al., 2012), may be associated with loweragency costs (Fama & Jensen, 1983; Villalonga & Amit, 2006), the robustness ofthe regulatory environment plays a major role (Anderson & Reeb, 2003). Comparedto the U.S., regulatory quality is less robust in South Africa (Roberts, 2004, 2008),suggesting that the agency benefits of a concentrated ownership, relative to the asso-ciated agency costs, may be less. It is reasonable to suggest that the legal structuresin South Africa may offer relatively less protection to investors, thus making theagency problems worse.
Another distinctive feature of South African firms is the degree of concentrationin their product markets. Traditionally, South African firms are faced with a veryhigh degree of concentration in market shares, which does not encourage competition.Using both firm level and aggregate industry data, Aghion et al. (2008) find thatcompetition is relatively low in South Africa.3 Consistent evidence is provided byFedderke et al. (2007), who document mark-ups twice as high among South Africanmanufacturing firms as among U.S. manufacturing firms. These findings, coupledwith relatively suboptimal regulation, suggest a higher likelihood of rivalry predationin South Africa than in the U.S.
Over the past few years, stringent efforts have been made to improve productmarket competition. In 1999, South Africa’s Competition Board was replaced witha new Competition Commission following the implementation of the Competition Actof 1998. These steps are meant to effectively address anticompetitive practices andto promote regulatory independence (Roberts, 2008). Unsurprisingly, Fedderke &Simbanegavi (2008) note that South African manufacturing industries are becomingless concentrated.
2For full a review of this control process, see Kantor (1998).3Their proxy for competition is price cost margin measured alternatively as the ratio of price to
production cost; the ratio of value added to sales; and the ratio of operating income to sales.
4
The uniqueness of the agency problems faced by South African firms makes itworthwhile to conduct further studies regarding the relationship between leverage,competition and performance. Since the existing evidence is in respect of U.S. firms,the findings may provide a strong indication of the extent to which the disciplinaryeffect of leverage can mitigate the agency costs of equity in a potentially highlypredatory environment.
3. Literature review
3.1. Leverage and firm performance
Following the seminal paper of Modigliani & Miller (1958), the study of cap-ital structure has attracted much attention with differing theoretical predictions.Modigliani & Miller (1958) predict that, in a perfect capital market, capital structureof a firm is irrelevant to its value (hence, performance). Capital structure, however,matters for firms for several reasons, which arise mainly from the tax-deductibilityof debt interest and agency theory.
Jensen & Meckling (1976) identify two main types of agency costs. The first,agency costs of outside equity, arises from the conflict of interest between the shareholder-manager and outside equity participant. As the shareholder-manager shares profitswith the outside equity participant, the former has an incentive to maximise hisutility by engaging in moral hazard. Such behaviour calls for increased monitoringand incentive mechanisms or contractual relations. These translate into higher costswhich increase with higher outside equity participation. Hence, higher leverage hasthe potential to reduce costs and enhance performance. Extending this proposi-tion, the benefits of leverage have been attributed to the discipline that comes withleverage through interest payment pre-commitments (Jensen, 1986), the threat ofbankruptcy (Grossman & Hart, 1983), and the informational content of debt (Harris& Raviv, 1990).
The second type of agency costs identified by Jensen & Meckling (1976) arisesfrom a conflict of interest between shareholders and debt holders. Shareholders findit rewarding to engage in excessive risk-taking since profits accrue to them but lossesare shared proportionally with creditors. As such behaviour will be anticipated bydebtholders, the cost of borrowing to the firm may be higher.4 This suggests thatleverage can also have an adverse effect on firm performance, especially if the firmis already highly leveraged. Myers (1977) extends this analysis to the case whereleverage may rather lead to suboptimal investment. As debt transfers part of the
4Higher borrowing costs reflect monitoring and bonding expenses.
5

benefits of investment options to the debtholders, under certain conditions, valuableinvestment opportunities may be rejected by the levered firm, leading to subopti-mal investment and reduced market value of the firm.5 In another developmentStulz (1990) shows that whilst debt financing may be a credible device in mitigatingoverinvestment problems, it can worsen the underinvestment problems, as regularoutflows of cash to debtholders place further resource constraints on managers.
The literature extends the agency costs of debt to the conflict of interest betweenthe firm and its stakeholders. Titman (1984) argues that leverage affects the likeli-hood of a firm’s liquidation, which can be costly to both its customers and creditorsdepending on the firm’s liquidation policy. Customers may then be willing to tradewith a highly leveraged firm only if its prices are low. Also, debt holders will bemore inclined to impose restrictive covenants. Maksimovic & Titman (1991) arguethat customers, under certain circumstances, may perceive the product quality of ahighly leveraged firm to be compromised, making them reluctant to transact withit. Thus, they also suggest that a high level of leverage can be detrimental to firmperformance.
Based on these theories, mixed empirical conclusions have been documented. Sev-eral studies report negative effects of leverage on firm performance (King & Santor,2008; Ghosh, 2008; Bhagat & Bolton, 2008), whilst others report positive effects(Berger & Bonaccorsi di Patti, 2006; Margaritis & Psillaki, 2010; Weill, 2008) orinsignificant effects (Phillips & Sipahioglu, 2004). A few studies suggest that theleverage-performance relationship is conditional on the degree of agency problemsassociated with firms (Ruland & Zhou, 2005; Schoubben & Van Hulle, 2006). Forinstance, Schoubben & Van Hulle (2006) show that leverage has a positive effect onquoted firms but a negative effect on non-quoted firms. Similarly, Ruland & Zhou(2005) find that leverage enhances the performance of diversified firms, especiallysmall-sized diversified firms that are associated with higher agency costs. Evidencein Ghosh (2008) also conditions the effects of leverage on foreign market participa-tion, noting that, for a sample of Indian firms, the (negative) impact of leverage ishigher for firms with foreign debt, and that a leveraged firm’s performance is moresensitive to changes in nominal exchange rate.
Recent extensions of the literature (Bolton & Scharfstein, 1990; Chevalier, 1995a,b;Chevalier & Scharfstein, 1996; Dasgupta & Titman, 1998) attach strong significanceto product market competition in the leverage-performance relationship, since itgives an indication of the likelihood and the nature of rival firms’ reaction following
5For example, when the firm is highly leveraged such that the net present value of the investmentopportunity is less than debt payment to creditors.
6
a firm’s leverage increase.
3.2. Leverage, pricing strategy, competition and firm performance
Leverage has a complex interaction with product market competition. Brander &Lewis (1986) suggest that leverage permits firms to compete more aggressively in aproduct market due to limited liability. The strategic effect of such behaviour couldoffset the associated costly agency problems. Wanzenried (2003), however, conditionsthe effects on profit of such strategic behaviour on the nature of competition andproduct characteristics. This suggests that the limited liability effect of debt couldfail to boost the profitability of the leveraged firm. Specifically, the limited liabilityeffect of debt can lead to a decrease in profit if competition is Cournot. The reasonis that limited liability induces a more aggressive production which leads to lower re-alised prices. The decrease in profit is higher the more substitutable the products are.Also, predation theories and related literature (Fudenberg & Tirole, 1986; Bolton &Scharfstein, 1990; Chevalier & Scharfstein, 1996; Dasgupta & Titman, 1998) suggestthat leveraged firms could suffer a significant competitive disadvantage in productmarkets.
Leveraged firms may be more vulnerable to predation in concentrated productmarkets. Fudenberg & Tirole (1986) suggest that, given that current period profitis a signal for future prospects in a product market, incumbent firms may havean incentive to predate on entrant firms. Such action lowers the current periodprofits of the entrant firms and sends incorrect signals about future prospects. Asleveraged firms may be more financially constrained than their less leveraged rivalsin concentrated product markets, their sensitivity to product market signals is likelyto be relatively higher.
A similar argument, which does not make “signal-jamming” a necessary conditionfor predation, is presented by Bolton & Scharfstein (1990). They show that debtcontracts designed to align the interest of managers to creditors often create anopportunity for rivalry predation. An optimal contract requires periodic payment bythe leveraged firms to the creditors; failing this, the firm is liquidated. This contract,however, encourages rivalry predation since this can lower the leveraged firm’s currentperiod profit, making it more likely to be liquidated and exit the market. This rivalrypredation continues for as long as it accrues positive net benefits for the rival firm.In a perfect (or more) competitive industry, each firm accounts for a relatively smallproportion of the market. Hence, there should be less incentive to predate in morecompetitive markets.
Chevalier & Scharfstein (1996) extend the above-mentioned model along the linesof switching cost models. They note that leverage constrains a firm’s ability to invest
7
in market shares since the fear of default restricts attention to current period perfor-mance. Consistently, they show that highly leveraged firms charge higher prices thantheir less leveraged counterparts during recession. This suggests that high leveragedfirms are expected to have a competitive disadvantage in concentrated or uncom-petitive industries, given that firms behave less competitively during recession. Themagnitude of this disadvantage should decrease with the degree of competitivenessin the product market.
Chevalier (1995a) provides evidence in respect of the competitive disadvantageassociated with leverage. In her study of the U.S. supermarket industry, she finds thatan increase in leverage leads to increased market value of competitors. Also, whenincumbents are highly leveraged, entry and expansion of new firms are likely. Theresults suggest that leverage softens product market competition. Again, Chevalier(1995b) shows that market prices rise following an increase in leverage if rival firmsare also highly leveraged. The highly leveraged firms are found to charge higherprices than their less leveraged competitors. The reverse is true when rivals are lessleveraged and markets are concentrated: prices drop as highly leveraged firms leavethe market. The findings suggest that highly leveraged firms are more vulnerable topredation in product markets with less competition and less leveraged rivals.
Perhaps the most direct evidence of the interaction effects of capital structureand competition is provided by Opler & Titman (1994). They find that highly lever-aged firms lose market share to their less leveraged counterparts during industrydownturns. Particularly, they find that the lost market share is severe for firms inconcentrated markets. In another development, Kovenock & Phillips (1997) find thatleverage has an adverse effect on a firm’s investment and is positively associated withplant closure. Interestingly, they find that the significance of these effects dependshighly on the capital structure and concentration interaction terms, suggesting se-vere agency problems in concentrated markets. The fact that the evidence presentedin these studies is more pronounced in concentrated product markets suggests thathighly leveraged firms are more vulnerable to predatory pricing in concentrated (un-competitive) product markets.
Recent evidence is provided by Campello (2003, 2006). Campello (2003) inves-tigates the impact of leverage on the relative growth of firms’ sales in the productmarket. He finds that leverage has a negative impact on relative-to-industry salesgrowth of firms in relatively less leveraged industries during recession, but not duringboom. This finding can be attributed to less competitive behaviour associated withmacroeconomic downturns. The finding further indicates that the effects of leveragesignificantly depend on the severity of agency problems in the product market. Thisview agrees, at least in part, with his 2006 study which finds that moderate levels
8
of debt are associated with high sales performance, whilst high levels are associatedwith poor performance. Particularly, he finds significantly higher effects for firms inconcentrated markets compared to their counterparts in competitive markets.
It must be emphasized that, besides the predation-mitigating benefits of compe-tition, the discipline that comes with competition (Aghion et al., 1997; Hart, 1983)reinforces the disciplining effects of leverage or mitigates the agency problems of debt.For instance, Nickell (1996) shows a positive relationship between several measuresof competition and firm performance measured as total factor productivity (TFP)growth. In contrast, Aghion et al. (1997) note that fierce competition could causefirms to reduce their leverage, resulting in the reduced disciplining effect of leverage.This effect could be higher than the direct disciplining effect of competition, implyinga net reduction in product market discipline. Recent work by Beiner et al. (2011) inrespect of 200 Swiss firms suggests a negative relationship between product marketcompetition (measured as HHI) and firm performance.
The review of the theoretical and empirical evidence presented in this sectionthus far points to appealing interactions between capital structure, competition andfirm performance. It is worth emphasising that the empirical evidence taking thisinteraction into account is all based on U.S. data and employ concentration-basedmeasures of competition. In what follows, the measure of and issues relating tocompetition are discussed.
3.3. Leverage and product market competition: Measurement issues
Whilst a few studies provide some evidence on the interaction between lever-age, competition and performance, the proxies for competition may be problematic.Measuring competition normally takes a structural or non-structural approach. Thestructural approach infers competition from the degree of product market concentra-tion, notably the Herfindahl-Hirschman Index (HHI) as in Campello (2006) and four-firm concentration ratio as in Opler & Titman (1994), Chevalier (1995a,b), Kovenock& Phillips (1997) and Campello (2003). Higher product market concentration is as-sociated with lower competition and vice versa. The non-structural approach, onthe other hand, derives the degree of competition from market behaviour. The pref-erence for a non-structural measure of competition stems from the fact that higherconcentration may not necessarily imply lower competition. In fact, the efficiency-structure hypothesis notes that a high level of product market concentration couldsimply be the outcome of pronounced efficiency (Demsetz, 1973). In this regard,differential efficiency may cause some firms to grow relatively fast whilst for otherfirms efficiency may require downsizing. Likewise, Boone et al. (2005, 2007) arguethat a high level of concentration can arise from strong competition forcing inefficient
9
firms out of the market. In this sense, concentration may fail to accurately predictthe degree of competition.6
In view of these setbacks, Boone et al. (2005, 2007) and Boone (2008) proposea new measure of competition, the Boone indicator (BI). The BI measures the sen-sitivity of firms’ profits (or market shares) to their inefficiency in product markets.It is based on the assumption that in a more competitive product market firms arepenalised severely in lost profits or market shares for being inefficient. It assumesthat profits increase with efficiency and this increase is higher in more competitiveindustries. Thus, unlike concentration-based measures of competition, the BI doesnot suffer from reallocation effects within product markets.7 In addition to its ap-pealing theoretical properties, the BI is simple in data requirements. Following itspioneering application by van Leuvensteijn et al. (2007) to the European bankingindustry, the BI has gained increased popularity in the banking literature. A simi-lar measure of competition based on the sensitivity of a firm’s profit to rival firms’strategic decisions is proposed by Kedia (2006). However, improper identification ofstrategic decisions, or the use of proxies such as sales makes this measure of compe-tition most useful for identifying the nature rather than the intensity of competition.Hence, the BI is the most suitable measure of competition in this study.
In summary, evidence on the interaction of leverage and competition on firmperformance is generally limited and particularly lacking for developing countries ingeneral and Africa in particular. This work is hoped to fill in the gap. It is alsoclear that evidence provided in respect of the leverage-competition relationship usesmainly concentration-based measures of competition. For the first time, this studyemploys a direct measure of competition in the leverage-performance relationship.
6For instance, consider the case of a monopoly. Here monopoly price is charged in the marketand concentration is highest. Compare this to a duopoly, where firms with asymmetric cost competeunder Bertrand. The efficient firm has a lower cost (c1) compared to the cost (c2) borne by the lessefficient firm (i.e. c1 > c2). The efficient firm can drive the less efficient firm out of the market bycharging a price slightly less than the latter’s (i.e. p1 = c2 − e < monopoly price). Assuming thisstance leads to the exit of the less efficient firm, concentration is now as high as is the case for themonopoly. However, the market price is lower than the monopoly price; the incumbent firm keepsthe price below the monopoly price to keep potential entrants out of the market. Concentration-based measures fail to capture this selection effect of competition: they indicate the same degreeof competition under the two scenarios.
7That is the reallocation of output from less efficient to more efficient firms. For a detailedreview, see Boone et al. (2005, 2007) and Boone (2008)
10
4. Research hypotheses
Based on theoretical predictions and past empirical evidence, as well as the SouthAfrican corporate context, three main testable hypotheses are formulated.
The balance between agency costs of equity and debt, emphasised by Jensen &Meckling (1976) tilts in favour of the latter, given the equity culture and the agencyproblems associated with South African firms, as well as the regulatory environmentwithin which these firms operate. Furthermore, any increased monitoring necessi-tated by debt-financing (Jensen & Meckling, 1976), though costly, might be expectedto reinforce the discipline that comes with leverage (Grossman & Hart, 1983; Harris& Raviv, 1990; Jensen, 1986). Moreover, the relatively suboptimal regulatory en-vironment in South Africa is expected to reinforce the strategic advantage (limitedliability effect) of leverage suggested by Brander & Lewis (1986). Thus, leverageis expected to yield a positive effect on firm performance. This effect is, however,expected to decrease at very high levels of leverage given the likely debt overhangproblems emphasised in Myers (1977). This expectation leads to the first hypothesis:
H1: Leverage has a nonlinear positive effect on firm performance.
Leverage makes firms vulnerable to rivalry predation in concentrated or un-competitive product markets, as shown in the extant literature (Bolton & Scharf-stein, 1990; Campello, 2003, 2006; Chevalier, 1995a,b; Chevalier & Scharfstein, 1996;Kovenock & Phillips, 1997; Opler & Titman, 1994). Given that the competitive-disadvantage of leverage may be only partially offset by the strategic benefits ofleverage emphasised in Brander & Lewis (1986), it is expected that the benefits ofleverage are improved (reduced) by product market competition (concentration). Asecond hypothesis is formulated as follows:
H2: The agency benefits of leverage increase (decrease) with product market compe-tition (concentration).
Finally, to the extent that predatory incentives may be driven by rival firms’ levelsof leverage (Campello, 2003, 2006; Chevalier, 1995b; Chevalier & Scharfstein, 1996),a related composite hypothesis that the effects of leverage may be competitor-drivenis formulated:
H3: High relative-to-rival leverage is associated with high firm performance whichincreases (decreases) with product market competition (concentration).
11
5. Data
The study uses an unbalanced panel data consisting of 257 South African firmslisted on the Johannesburg Stock Exchange (JSE) Limited from the period 1998 to2009, available from DataStream. The sample selection was guided by data avail-ability. Every non-financial firm with three or more years of consecutive observationwas included.
The sample firms were classified into 8 distinct industries using the IndustryClassification Benchmark (ICB), equivalent to the Datastream Global Equity Indiceslevel 2. Firms from the financial and utility industries were excluded. These sectorsconsisted of firms in banking, insurance, equity investment and real estate, includinginvestment trusts. These exclusions were motivated by regulatory differences and forthe ease of comparability of results.
5.1. Firm-specific variables
The choice of variables and proxies is guided by the literature. The measureof performance is return on assets (ROA), measured as total operating profit plusdepreciation and amortization (EBITDA) divided by total assets. By construction,ROA is a good approximation of the extent to which managers put firms’ resources toefficient use. ROA, being an accounting measure of performance, has been criticisedbecause it suffers from the effects of differing accounting standards. However, marketmeasures of performance, including Tobin’s Q, are not faultless. Demsetz & Lehn(1985) suggest that ROA better reflects current business conditions whilst Tobin’sQ mirrors expected future development. In similar fashion, Demsetz & Villalonga(2001) argue that Tobin’s Q suffers from the use of tangible assets whose depreciationfalls short of their true economic depreciation. Also, they emphasise that, unlikeaccounting measure of performance, Tobin’s Q is not independent of psychologicalinfluences. These notwithstanding, evidence points to a high degree of correlationbetween ROA and Tobin’s Q, suggesting that either is an appropriate measure ofperformance (Scherer & Ross, 1990). As the study employs data from differentindustries and firms of varying size, the use of ROA mitigates any size bias in theresults.8
Leverage (Lev) is measured as total debt divided by total assets. Relative leverage(Rlev) is measured as the difference between each firm’s leverage and the meanindustry leverage. This is employed to control for the extent to which rival firms areless (or more) leveraged.
8see Lev & Sunders (1979) for detailed review.
12
The research controls for other relevant firm-specific variables such as sales growth,firm size and mean earnings. Sales growth (Growth), a proxy for growth opportu-nities (King & Santor, 2008; Maury, 2006), is measured as the difference betweensales of firm i at time t and its one-period lagged sales divided by the latter - that is,(Salesi,t − Salesi,t−1) /Salesi,t−1, where the subscripts i and t indexes firm i at timet.
Firm size (Size) is measured as the natural logarithm of total assets. While largefirms may be associated with a high degree of moral hazard and increased need formonitoring, they may also have the benefits of diversification and economies of scalein monitoring top management (Himmelberg et al., 1999).
Following Ghosh (2008), mean earnings (MROA) is measured as 2-year movingaverage of profitability (ROA).9
Two additional variables are also employed in this paper to serve as externalinstruments for leverage in order to mitigate possible bias resulting from reversecausality between leverage and profitability. These are tangible assets and non-debttax shield. Tangibility of assets (Tan) is measured as the ratio of tangible assetsto total assets. It plays a major role in firms’ access to debt finance (Booth et al.,2001; Campello, 2006). This is especially so in developing countries where creditorprotection and contract enforcement is suboptimal. Non-debt tax shield (NDTAX)is depreciation and amortization divided by total assets.
5.2. Competition variables
The variables used to capture competition are alternatively Herfindahl-HirschmanIndex (HHI) and the Boone indicator (BI). Following Beiner et al. (2011), HHI ismeasured as the sum of squared market shares of each firm in a given industry.10
That is:
HHIjt = ΣNji=1
(Salesijt/Σ
Nji=1Salesijt
)2
, (1)
where HHIjt is the HHI for industry j at time t; Salesijt represents sales of firm iin industry j at time t. Higher values of the HHI indicate more concentration and
9Ghosh (2008) controls for lagged values of these variables.10Beiner et al. (2011) follow the standard measurement approach used by the Census of Manu-
facturers to calculate sales-based HHI as the sum of the squared market shares for the top 50 firms(or all firms if less than 50). Ideally, the calculation of the HHI should incorporate all the firmsin the various industries. In this paper, data unavailability restricts the number of firms in eachindustry to the corresponding numbers in the sample. Hence, the actual values could be differentfrom the ‘strict’ HHI. This notwithstanding, the estimated HHI should still be able to capture thedynamics of competition
13
less competitive markets.The Boone indicator is a new measure of competition based on the theoretical
assumption that, in a more efficient or competitive industry, firms are punishedseverely for being inefficient (Boone et al., 2005, 2007; Boone, 2008). Hence, for anindustry with a high level of competition, it is expected that an increase in marginalcost leads to a drastic fall in variable profits. Therefore, the Boone indicator ismeasured by estimating the following regression:
V ROAit = α + βtlnMcij + εi,t, (2)
where V ROAit is the variable profit (measured as sales revenue less cost of goodssold of firm i in industry j divided by its total assets; lnMcij is the natural logarithmof the marginal cost (approximated by cost of goods sold divided by sales revenue)of firm i in industry j; and βt is the time-varying parameter, the absolute value ofwhich measures competition. The sign of the coefficients is expected to be negative.The higher the absolute value of the coefficients, the higher is the level of competitionin the industry. Hence, BI is the absolute value of βt.
11
Table 1 provides the mean values of each variable by industry. There is a con-siderable degree of variability in return on assets, leverage and competition acrossindustries. The basic materials industry has the least (mean) return on assets. Thisindustry is less concentrated and relatively highly leveraged. At the other extreme isthe telecommunications industry with the highest return on assets, which is highlyconcentrated and generally debt-funded.
Although the regression variables exhibit a modest correlation, the correlationmatrix shown in Table 2 shows no evidence of multicollinearity.
6. Empirical model
In order to estimate the effect of leverage on firm performance, a baseline model(Equation (3)) is formulated as
ROAi,t = α + λt + µi + β1Levi,t−1 + β2Comj,t + ψ′xi,t + εi,t, (3)
whereROAi,t is return on assets of firm i at time t; α is the constant term; λt is a set oftime dummies controlling for macroeconomic events; µi represents firm-specific fixedeffect; Levi,t−1 is lagged leverage of firm i at time t; Comj,t measures the degree ofcompetition in industry j at time t proxied alternatively by the Herfindahl-Hirschman
11Thus, the coefficients are multiplied by -1 so that higher values represent higher competition.
14
Index (HHI) and the Boone indicator (BI); xi,t is a set of control variables describedin section 5, including the squared term of lagged leverage (Lev2
i,t−1); and εi,t is theerror term. The lagged value of leverage helps address any possible reverse causalitybetween leverage and performance. Also, the inclusion of the squared term of laggedleverage takes account of the possible nonlinear effect of leverage on performance.Likewise the effect of size is unlikely to be linear, hence warrants the inclusion of thesquared term (Size2
i,t) as in Ghosh (2008)As pointed out in the preceding sections, product market competition is an impor-
tant factor in the analysis of leverage and firm performance. In order to capture theeffect of competition, equation (3) is rewritten to include the interaction of leverageand product market competition as shown below:
ROAi,t = α+λt +µi +β1Levi,t−1 +β2Comj,t +β3Levi,t−1×Comj,t +ψ′xi,t +εi,t, (4)
where Levi,t−1×Comj,t is an interaction term: the product of lagged leverage of firmi in industry j at time t and competition in industry j at time t. All other termsare as previously defined. Again, particular attention is paid to the possibility ofnon-monotonic effect of leverage on performance.
Differentiating equation (4) with respect to leverage and competition, alterna-tively, gives the following:
∂ (ROAi,t)
∂ (Levi,t−1)= β1 + β3Comj,t (5)
which is modified in all specifications involving the squared term of leverage; and
∂ (ROAi,t)
∂ (Comj,t)= β2 + β3Levi,t−1. (6)
From equation (5), when HHI is used as a measure of competition the effectof leverage on performance of firms in an unconcentrated (perfectly competitive)industry is captured by β1 whilst β1 + β3HHIj,t shows the effect of leverage atspecified levels of concentration or competition. When BI is used as the measureof competition, however, the interpretation is reversed: β1 captures the effect ofleverage for firms in an uncompetitive industry whilst β1 + β3BIj,t captures theeffect of leverage at specified levels of competition. Using equation (5), it is possibleto probe the marginal effect of leverage at specified values of HHI or BI. Usingthe variance-covariance matrix, the standard errors corresponding to the marginal
15
effects of leverage can be obtained (see Aiken & West, 1991).12 Equation (6) alsoshows that the marginal effect of competition on firm performance is given by β2 +ψLevi,t−1. Here β2 captures the effects of competition for non-leveraged firms whilstβ2 + ψLevi,t−1 captures the same effect for leveraged firms.
Also, in order to verify that the leverage effect is driven by rivalry predation,variants of equations (3) and (4) are estimated by replacing leverage with relative-to-industry mean leverage or simply relative leverage. For marginal effect analysis,equations (5) and (6) are modified accordingly.
All equations are estimated using panel fixed effect models. The Hausman (1978)specification test is performed in order to assess the suitability of the fixed effectmodels against random effect models. The Hausman (1978) test is motivated by thefact that the fixed effect and the random effect should not be different for the casewhere µi is uncorrelated with the regressors.
Finally, the study uses cluster-robust standard error estimations to control forpossible heteroskedasticity and autocorrelation within firms.
6.1. Endogeneity issues
Although lagged values of (relative) leverage are used in the above models to mit-igate simultaneity bias, to fully address the simultaneity issues and omitted variablebias in respect of leverage, and also measurement errors in respect of the proxiesfor competition, equations (3) and (4) are re-estimated using the 2-step GeneralisedMethod of Moments (GMM) technique. As instruments for leverage, the paper em-ploys tangible assets as in Campello (2006), and non-debt tax shield (up to two lags).13 The competition variables are instrumented with up to two lags of their own.
The use of tangible assets and non-debt tax shield as instruments is intuitivelyappealing and diagnostically satisfactory. First, tangibility of assets is a major de-terminant of firms’ access to finance (Booth et al., 2001; Campello, 2006), and itseffect on performance is only through financing, making it a valid instrument for the
12For instance, the standard errors corresponding to these marginal effects for the modelwith only leverage and competition interaction term are given by SE(β1 + β3Com) =√V (β1) + Com2V (β3) + 2ComCov(β1, β3) where V (β1) and V (β3) are respectively the variances
of β1 and β3; Cov(β1, β3) is the covariance between β1 and β3; and Com is the specified value ofHHI or BI. For models involving the squared term of leverage the formula is modified. See Aiken& West (1991).
13Lagged values of leverage are not used as instruments due to likely persistence in leverage.Persistence in financial leverage is documented in Lemmon et al. (2008), noting that Compustatnonfinancial firms’ financial leverage exhibits very little variation over time, as its determinants arestable over long periods of time.
16
leverage-performance equation (Campello, 2006). Second, firms with a larger non-debt tax shield are expected to have lower leverage (DeAngelo & Masulis, 1980),14
and non-debt tax shield is not expected to have a direct effect on firms’ operatingprofits before depreciation and amortisation. This suggests that non-debt tax shieldis a valid instrument for leverage. In fact, Fama & French (2002) provide empiricalsupport for the inverse relationship between non-debt tax shields and the level offirms’ leverage.
7. Results
7.1. Leverage-performance relationship
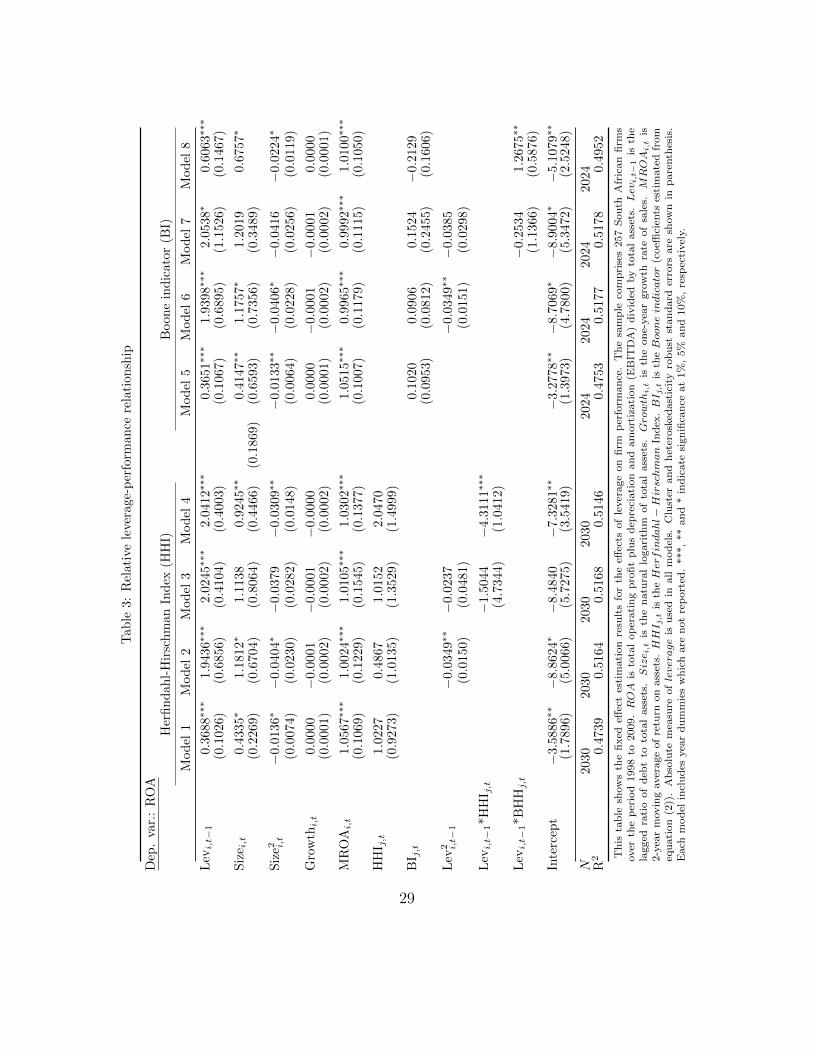
Table 3 presents the estimation results of equations (3) and (4). Models 1 to4 are alternative specifications in which the HHI is used as the inverse measure ofcompetition. Models 5 to 8, on the other hand, are the models using BI as the mainmeasure of competition. Models 1, 2, 5 and 6 show the baseline results obtainedfrom the estimation of equation (3).
The results show that financial leverage has positive effects on firm performance.These results suggest that financial leverage mitigates the agency costs of outsideequity as noted in Jensen & Meckling (1976), particularly given the conservative useof debt among South African firms. With relatively higher use of equity finance,it is expected that the agency costs of equity will outweigh the agency costs ofdebt, making the agency benefits of debt much more realisable for South Africanlisted firms. At this point, this finding is broadly consistent with the empiricalevidence in Weill (2008) and Berger & Bonaccorsi di Patti (2006). Controlling forthe squared term of leverage (models 2 and 6) does not change the results. Thecoefficients of the leverage squared terms are significantly negative, implying thatexcessive levels of leverage may have an adverse effect on firm performance. However,given the magnitude of these coefficients, the overall effect of leverage on performanceis positive.15 These findings provide support for Hypothesis 1.
The results show no statistically significant effect of competition on firm perfor-mance. The results also show that most of the control variables are significantlyrelated to performance. Consistent with Ghosh (2008), firm size is nonlinearly andsignificantly related to profitability. Thus, whilst the benefit of size (including diver-sification and economies of scale) may help boost firm performance, excessive expan-
14Non-debt tax shields are inversely related to expected taxable profits and, therefore, the ex-pected payoff from interest tax shields.
15Marginal effects are discussed in detail in section 7.3
17
sion may make moral hazard pervasive (see Himmelberg et al., 1999). Also, growthis found to be insignificantly related to profitability. Expected return (MROA) hasa significant positive effect on profitability.
The estimation results for equation (4) are shown in models 3, 4, 7 and 8. Theseestimations differ from the previous regressions by the inclusion of interaction termsbetween leverage and competition. The effect of leverage on the performance of firmsis, again, positive and increases (decreases) with product market competition (con-centration). Although the leverage-competition interaction terms and the squaredterms of leverage are not significant when jointly included in the same model, a jointtest of significance (White F test) confirms they are jointly significant.16 Hence,models 3 and 7 are re-specified without the squared terms of leverage as shown inmodels 4 and 8; the coefficients of the interaction terms are significant. Interestingly,concentration (competition) is significant only when interacted with leverage, sug-gesting the presence of predatory product market interactions which vary directlywith financial leverage. The interaction term between leverage and the HHI (model4) is negative whilst the one between leverage and the BI (model 8) is positive. Thesefindings suggest that the benefits of leverage increase (decrease) with product marketcompetition (concentration), lending support for Hypothesis 2.
These findings broadly provide support for a number of theoretical predictions(Bolton & Scharfstein, 1990; Chevalier & Scharfstein, 1996) and evidence that suggestthat increase in financial leverage is associated with predatory behaviour in concen-trated (uncompetitive) product markets (Chevalier, 1995a,b; Opler & Titman, 1994;Kovenock & Phillips, 1997).17
7.2. Relative leverage-performance relationship
In what follows, the paper seeks to substantiate the possibility that the marginaleffect of leverage is, at least to some extent, competitor-driven. Employing relativeleverage, which measures the difference between a firm’s leverage and the meanindustry leverage, may corroborate the existence of predatory behaviour as outlinedin Chevalier & Scharfstein (1996) and Bolton & Scharfstein (1990). Additionally, thisapproach helps to check the robustness of the preceding results. Hence, equations
16The non-significance of the interaction term and squared term of lagged leverage may be due tohigh correlation between them. Correlation between these two variables ranges between 0.74 and0.80.
17Opler & Titman (1994) and Kovenock & Phillips (1997), however, find a direct negative effectof leverage on firm performance. Also, as discussed earlier, their performance measures are differentfrom the one used in this paper.
18
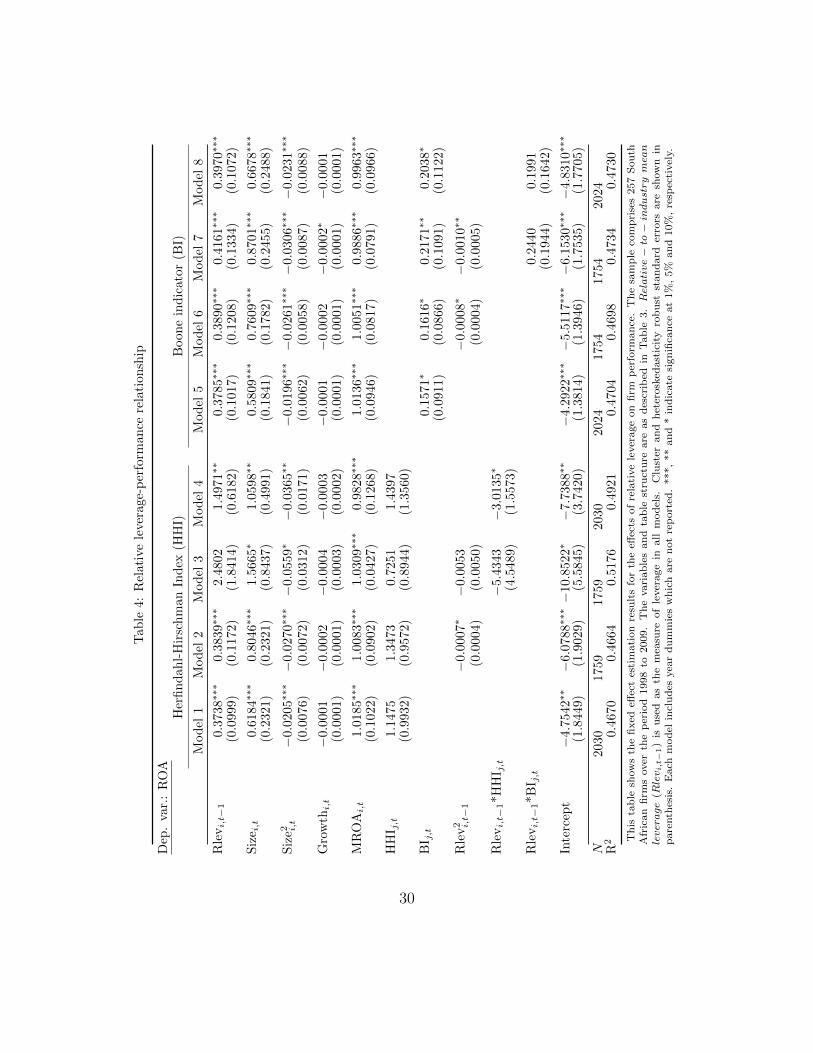
(3) and (4) are revised such that leverage is replaced with relative leverage. Theresults are shown in Table 4.
Consistent with the previous findings, the coefficient of relative leverage is positiveand significant; the interaction term involving the HHI is negative and significant;whilst the one involving the BI is positive but statistically insignificant.18 Thus,the results show that firms that are more leveraged than their rivals have higherperformance which increases (decreases) with product market competition (concen-tration), lending support for Hypothesis 3. The results are robust when takingpossible non-monotonicity into account, and to alternative proxies for competition.Also, competition (the BI) is found to exert a statistically significant positive effecton firm performance. These results, coupled with the preceding findings, suggestthat the disciplining effects of competition as argued by Hart (1983) and Aghionet al. (1997) outweigh the crowding-out effect of competition as indicated also inAghion et al. (1997). Thus, competition has a net disciplining effect which reinforcesthe disciplining effect of leverage and results in higher performance.
7.3. Marginal effect analysis
The natural progression at this stage is to probe the interaction terms betweenleverage and competition in order to analyse the moderating impact of competitionon the leverage-performance relationship. The models are evaluated at the mean, low(one standard deviation below the mean) and high (one standard deviation abovethe mean) values of the Herfindahl-Hirschman Index (HHI) and the Boone indicator(BI).19 Where the squared terms of (relative) leverage are involved, the marginaleffects are evaluated at the mean of (relative) leverage.20 Table 5 summarizes themarginal effect analysis. The first two columns show the marginal effects involvingHHI whilst the last two show those involving the Boone indicator.
In Panel 1, attention is restricted to the models involving only the squared termsof leverage. This corresponds to models 2 and 6 in Tables 3 and 4. It shows thatthe marginal effects of leverage and relative leverage are positive and statisticallysignificant. Similarly, in Panel 2, where the interaction and the squared terms ofleverage and relative leverage are involved, the marginal effects on performance ofleverage and relative leverage are positive over the relevant levels (mean, low and
18Although the coefficient of the interaction term between lagged leverage and BI is statisticallyinsignificant, it is jointly significant with the coefficient on lagged leverage.
19The mean and standard deviation of Boone indicator are respectively 0.43 and 0.66. For theHHI, they are respectively 0.15 and 0.13.
20The mean of leverage and relative leverage are respectively 0.23 and 0.00.
19
high) of HHI and the Boone indicator (BI). Surprisingly, the marginal effects ofrelative leverage with respect to HHI are significant only at high values of HHI. Thismight be due to the concern raised earlier about this specification. Panel 3 relatesto models in which the squared terms of leverage and relative leverage are dropped.The results, again, indicate that the marginal effects of leverage and relative leverageare positive over the relevant levels of HHI and the BI, and vary directly (inversely)with product market competition (concentration).
The above findings suggest that, even though the performance effects of leverageand relative leverage depend, to a large extent, positively (negatively) on productmarket competition (concentration), which is consistent with the presence of signifi-cant predatory market behaviour, the overall effect is significantly positive.
7.4. GMM results
The 2-step Generalised Method of Moments estimation results for equation (4) arepresented in Table 6. Leverage is instrumented with tangible assets as in Campello(2006), and non-debt tax shield (up to two lags). Competition proxies are instru-mented with up to two lags of themselves, with appropriate modification of the in-teraction terms. Appropriate test are conducted to verify the validity and relevanceof the instrument.
The results are similar to those presented in previous sections. As before, financialleverage is shown to have a significant positive effect on firm performance and thiseffect increases (decreases) with product market competition (concentration). Thesefindings are robust to alternative measures of leverage and competition. For instance,using HHI as the inverse measure of competition (models 1 and 2), the coefficientsof leverage and relative leverage are positive and significant whilst the interactioneffects are significantly negative. This is consistent with models 3 and 4 whereleverage, relative leverage and their interactions with the Boone indicator are allsignificantly positive.
The marginal effects of leverage and relative leverage are probed, again, at mean,low and high levels of product market competition (concentration). For brevity ofthis paper, the results are not shown here. First, the marginal effect of leverage onfirm performance is positive over the relevant range of HHI. Using relative leverageinstead of absolute leverage yields similar results. The results remain qualitativelyunchanged when the Boone indicator is used as the proxy for competition.
7.4.1. Model diagnostics
To assess the extent to which the instruments satisfy the orthogonality condi-tion, Hansen J-statistic is computed. The Hansen J-statistic follows a χ2 distribu-tion where the number of overidentifying restrictions gives the degrees of freedom.
20
The null hypothesis is that the overidentifying restrictions are valid. Where the or-thogonality condition is not satisfied, either because the instruments are not trulyexogenous or the instruments are wrongly excluded from the model (see Baum et al.,2003), the null hypothesis is rejected. The p-values of the Hansen J-statistics are wellabove 0.1, meaning that we cannot reject the null hypothesis that the instrumentsare valid.
Although the instruments are valid, they could be weakly correlated with the en-dogenous regressors. Hence, a weak identification test is also performed by computingthe Kleibergen-Paap rk Wald F statistic and comparing it with the Stock-Yogo IVcritical values. The null hypothesis is that the instruments are weakly identified. Asa rule of thumb, a Kleibergen-Paap Wald rk F statistic greater than 10 is required toreject the null hypothesis (Baum, 2006). As shown in Table 6, the Kleibergen-PaapWald rk F statistics are all greater than 10. Hence, we can reject the null hypothesisand conclude that the instruments are not weakly correlated with the endogenousregressors.
7.5. Other robustness test
The study tests for the robustness of the results in various ways. Besides usingdifferent measures of leverage, and different proxies for competition, in unreportedregressions, different measures of performance (return on equity and after-tax returnon assets) were also used with qualitatively similar results. In addition, the sensitivityof the results to alternative and additional control variables, including volatilityof returns on assets and dividend, are analysed. The results are not qualitativelydifferent from the above. In relation to outliers, fairly robust results are observed formodels in which all variables are winsorised within 5% and 95%.21
8. Conclusion
In this paper, the effects of leverage on firm performance are investigated. Thestudy further investigates the extent to which the leverage-performance relationshipis influenced by product market competition. Using a panel dataset of South Africanlisted firms, it is found that financial leverage has a significant positive effect on firmperformance. Also, using the Herfindahl-Hirschman Index and the Boone indica-tor as alternative measures of competition, it is found that firms in unconcentrated(competitive) industries significantly benefit from leverage whilst those in concen-trated (uncompetitive) industries are likely to suffer adverse effects of leverage. This
21The estimation results for winsorised variables are available on request.
21
notwithstanding, the marginal effect of leverage is positive across the relevant rangeof product market concentration (competition). Accounting for nonlinearity in theleverage performance relationship does not qualitatively alter these findings. In ad-dition, the results are robust to alternative measures of leverage, competition, andto different estimators.
The findings of this paper have two main policy implications. First, South Africanfirms could significantly improve their performance if there is a shift from the currentconservative use of debt. Second, whilst policies aimed at popularising debt-financeto firms could have significant positive effects on their performance, the benefits ofsuch policies would be much better realised if matched with effective pro-competitionproduct market regulations.
Acknowledgement
I am very grateful to Barbara Roberts and Jim O’Hare for their invaluable sup-port. I am also thankful to the seminar participants at the Department of Economics,University of Leicester, for their helpful suggestions. My gratitude extends to theanonymous referees and the editor, Hadi Salehi Esfahani, The Quarterly Review ofEconomics and Finance, for their constructive comments. All remaining errors aremine.
References
Aghion, P., Braun, M., & Fedderke, J. (2008). Competition and productivity growthin South Africa. Economics of transition, 16 , 741–768.
Aghion, P., Dewatripont, M., & Rey, P. (1997). Corporate governance, competitionpolicy and industrial policy. European Economic Review , 41 , 797–805.
Aiken, L. S., & West, S. G. (1991). Multiple regression: Testing and interpretinginteractions . London: Sage.
Anderson, R. C., & Reeb, D. M. (2003). Founding-family ownership and firm perfor-mance: Evidence from the S&P 500. The Journal of Finance, 58 , pp. 1301–1328.
Barr, G., Gerson, J., & Kantor, B. (1995). Shareholders as agents and principals: Thecase for South Africa’s corporate governance system. Journal of Applied CorporateFinance, 8 , 1–32.
Baum, C. F. (2006). Introduction to modern econometrics using Stata. Texas: SataPress.
22
Baum, C. F., Schaffer, M. E., & Stillman, S. (2003). Instrumental variables andGMM: Estimation and testing. Stata Journal , 3 , 1–31.
Beiner, S., Schmid, M. M., & Wanzenried, G. (2011). Product market competition,managerial incentives and firm valuation. European Financial Management , 17 ,331–366.
Berger, A. N., & Bonaccorsi di Patti, E. (2006). Capital structure and firm per-formance: A new approach to testing agency theory and an application to thebanking industry. Journal of Banking & Finance, 30 , 1065–1102.
Bhagat, S., & Bolton, B. (2008). Corporate governance and firm performance. Jour-nal of Corporate Finance, 14 , 257–273.
Bolton, P., & Scharfstein, D. S. (1990). A theory of predation based on agencyproblems in financial contracting. American Economic Review , 80 , 93–106.
Boone, J. (2008). A new way to measure competition. Economic Journal , 118 ,1245–1261.
Boone, J., Griffith, R., & Harrison, R. (2005). Measuring competition. AdvancedInstitute of Management Research Paper No. 022.
Boone, J., van Ours, J. C., & van der Wiel, H. (2007). How (not) to measurecompetition. TILEC Discussion Paper No. 2007-014.
Booth, L., Aivazian, V., Demirguc-Kunt, A., & Maksimovic, V. (2001). Capitalstructure in developing countries. Journal of Finance, 56 , 87–130.
Brander, J. A., & Lewis, T. R. (1986). Oligopoly and financial structure: The limitedliability effect. The American Economic Review , 76 , pp. 956–970.
Campello, M. (2003). Capital structure and product markets interactions: Evidencefrom business cycles. Journal of Financial Economics , 68 , 353–378.
Campello, M. (2006). Capital structure and product markets interactions: Evidencefrom business cycles. Journal of Financial Economics , 68 , 353–378.
Chevalier, J. A. (1995a). Capital structure and product-market competition: Em-pirical evidence from the supermarket industry. The American Economic Review ,85 , 415–435.
23
Chevalier, J. A. (1995b). Do LBO supermarkets charge more? An empirical analysisof the effects of LBOs on supermarket pricing. Journal of Finance, 50 , 1095–1112.
Chevalier, J. A., & Scharfstein, D. S. (1996). Capital-market imperfections andcountercyclical markups: Theory and evidence. The American Economic Review ,86 , pp. 703–725.
Dasgupta, S., & Titman, S. (1998). Pricing strategy and financial policy. The Reviewof Financial Studies , 11 , pp. 705–737.
DeAngelo, H., & Masulis, R. W. (1980). Optimal capital structure under corporateand personal taxation. Journal of Financial Economics , 8 , 3 – 29.
Demsetz, H. (1973). Industry structure, market rivalry, and public policy. Journalof Law and Economics , 16 , 1–9.
Demsetz, H., & Lehn, K. (1985). The structure of corporate ownership: Causes andconsequences. Journal of Political Economy , 93 , 1155–1177.
Demsetz, H., & Villalonga, B. (2001). Ownership structure and corporate perfor-mance. Journal of Corporate Finance, 7 , 209–33.
Fama, E. F., & French, K. R. (2002). Testing trade-off and pecking order predictionsabout dividends and debt. The Review of Financial Studies , 15 , pp. 1–33.
Fama, E. F., & Jensen, M. C. (1983). Separation of ownership and control. Journalof Law and Economics , 26 , pp. 301–325.
Fedderke, J., Kularatne, C., & Mariotti, M. (2007). Mark-up pricing in south africanindustry. Journal of African Economies , 16 , 28–69.
Fedderke, J., & Simbanegavi, W. (2008). South African manufacturing industrystructure and its implications for competition policy. Economic Research SouthernAfrica working Papers 111.
Fudenberg, D., & Tirole, J. (1986). A “signal-jamming” theory of predation. RANDJournal of Economics , 17 , 366–376.
Ghosh, S. (2008). Leverage, foreign borrowing and corporate performance: Firm-level evidence for india. Applied Economics Letters , 15 , 607–616.
Grossman, S. J., & Hart, O. D. (1983). Corporate financial structure and managerialincentives. National Bureau of Economic Research Working Paper No. R0398.
24
Harris, M., & Raviv, A. (1990). Capital structure and the informational role of debt.Journal of Finance, 45 , 321–349.
Hart, O. (1983). The market mechanism as an incentive scheme. Bell Journal ofEconomics , 14 , 366–382.
Hausman, J. (1978). Specification tests in econometrics. Econometrica, 46 , 1251–1271.
Himmelberg, C. P., Hubbard, R., & Palia, D. (1999). Understanding the determi-nants of managerial ownership and the link between ownership and performance.Journal of Financial Economics , 53 , 353 – 384.
Jensen, M., & Meckling, W. (1976). Theory of the firm: Managerial behaviour,agency costs and ownership structure. Journal of Financial Economics , 3 , 305–360.
Jensen, M. C. (1986). Agency costs of free cash flow, corporate finance, and takeovers.American Economic Review , 76 , 323–29.
Kantor, B. (1998). Ownership and control in South Africa under black rule. Journalof Applied Corporate Finance, 10 , 69–78.
Kedia, S. (2006). Estimating product market competition: Methodology and appli-cation. Journal of Banking & Finance, 30 , 875–894.
King, M. R., & Santor, E. (2008). Family values: Ownership structure, performanceand capital structure of Canadian firms. Journal of Banking & Finance, 32 , 2423–2432.
Kovenock, D., & Phillips, G. (1997). Capital structure and product market be-haviour: An examination of plant exit and investment decisions. The Review ofFinancial Studies , 10 , 767–803.
Lemmon, M. L., Roberts, M. R., & Zender, J. F. (2008). Back to the beginning: Per-sistence and the cross-section of corporate capital structure. Journal of Finance,63 , 1575–1608.
van Leuvensteijn, M., Bikker, J. A., van Rixtel, A., & Kok Srensen, C. (2007). A newapproach to measuring competition in the loan markets of the euro area. EuropeanCentral Bank Working Paper No. 768.
25
Lev, B., & Sunders, S. (1979). Methodological issues in the use of financial ratios.Journal of Accounting and Economics , 1 , 187–210.
Maksimovic, V., & Titman, S. (1991). Financial policy and reputation for productquality. The review of Financial Studies , 4 , 175–200.
Margaritis, D., & Psillaki, M. (2010). Capital structure, equity ownership and firmperformance. Journal of Banking & Finance, 34 , 621–632.
Maury, B. (2006). Family ownership and firm performance: Empirical evidence fromWestern European corporations. Journal of Corporate Finance, 12 , 321–341.
Modigliani, F., & Miller, M. (1958). The cost of capital, corporation finance andtheory of investment. American Economic Review , 48 , 261–297.
Modigliani, F., & Miller, M. (1963). Corporate income taxes and the cost of capital:A correction. American Economic Review, vol. 53 (3), pp. 433-443 , 53 , 433–443.
Morck, R. K., Stangeland, D. A., & Yeung, B. (1998). Inherited wealth, corporatecontrol and economic growth: The canadian disease. National Bureau of EconomicResearch Working Paper 6814.
Myers, S. C. (1977). The determinants of corporate borrowing. Journal of FinancialEconomics , 5 , 147–175.
Nickell, S. (1996). Competition and corporate performance. Journal of PoliticalEconomy , 104 , 724–746.
Ntim, C. G., Opong, K. K., & Danbolt, J. (2012). The relative value relevance ofshareholder versus stakeholder corporate governance disclosure policy reforms inSouth Africa. Corporate Governance: An International Review , 20 , 84–105.
Opler, T. C., & Titman, S. (1994). Financial distress and corporate performance.The Journal of Finance, 49 , pp. 1015–1040.
Phillips, P. A., & Sipahioglu, M. A. (2004). Performance implications of capitalstructure: Evidence from quoted U.K. organisations with hotel interests. TheService Industries Journal , 24 , 31–51.
Roberts, S. (2004). The role of competition policy in economic development: Thesouth african experience. Trade and Industry Policy Strategie Working paperWP8-2004.
26
Roberts, S. (2008). Assessing excessive pricing: The case of flat steel in south africa.Journal of Competition Law and Economics , 4 , 871–891.
Rossouw, G., van der Watt, A., & Rossouw, D. (2002). Corporate governance insouth africa. Journal of Business Ethics , 37 , 289–302. 10.1023/A:1015205511601.
Ruland, W., & Zhou, P. (2005). Debt, diversification, and valuation. Review ofQuantitative Finance and Accounting , 25 , 277–291.
Scherer, F., & Ross, D. (1990). Industrial market structure and economic perfor-mance. (2nd ed.). Boston, MA: Houghton Mifflin.
Schoubben, F., & Van Hulle, C. (2006). The impact of a stock listing on the deter-minants of firm performance. Katholieke Universiteit Leuven working paper No.AFI 0608.
Stulz, R. M. (1990). Managerial discretion and optimal financing policies. Journalof Financial Economics , 26 , 3–27.
Titman, S. (1984). The effect of capital structure on a firm’s liquidation decision.Journal of Financial Economics , 13 , 137–151.
Villalonga, B., & Amit, R. (2006). How do family ownership, control and manage-ment affect firm value? Journal of Financial Economics , 80 , 385–417.
Wanzenried, G. (2003). Capital structure decisions and output market competitionunder demand uncertainty. International Journal of Industrial Organization, 21 ,171–200.
Weill, L. (2008). Leverage and corporate performance: Does institutional environ-ment matter? Small Business Economics , 30 , 251–265.
27
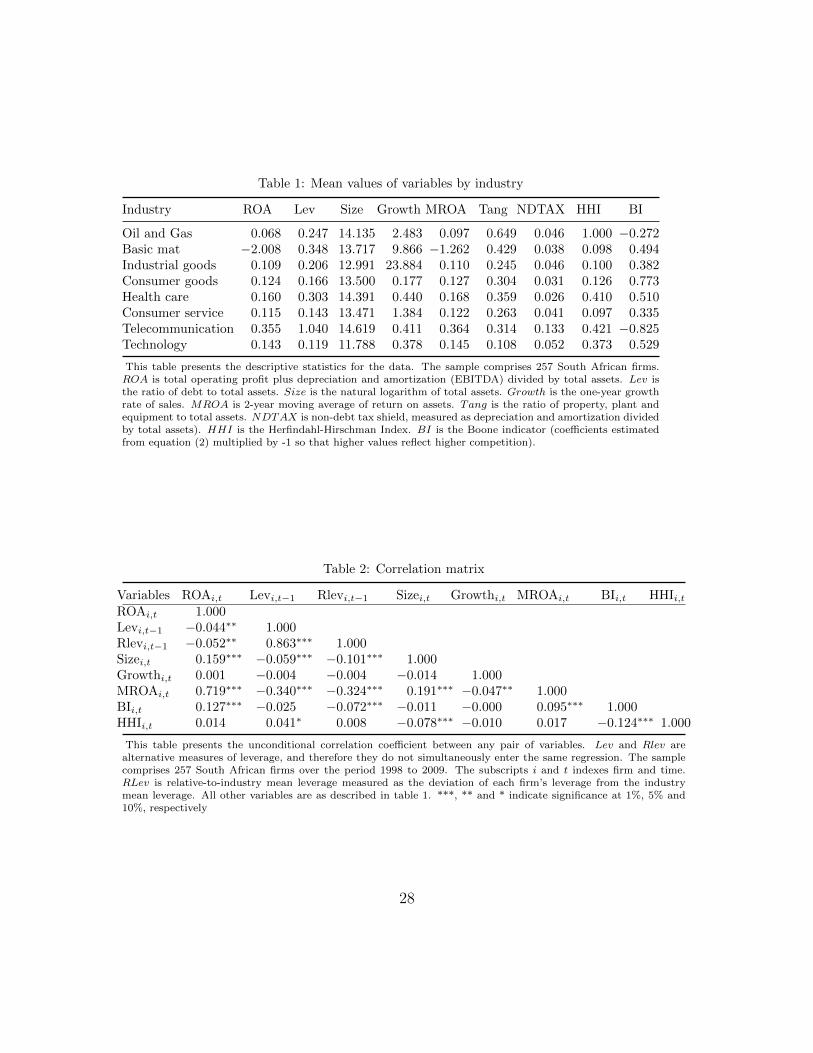
Table 1: Mean values of variables by industry
Industry ROA Lev Size Growth MROA Tang NDTAX HHI BI
Oil and Gas 0.068 0.247 14.135 2.483 0.097 0.649 0.046 1.000 −0.272Basic mat −2.008 0.348 13.717 9.866 −1.262 0.429 0.038 0.098 0.494Industrial goods 0.109 0.206 12.991 23.884 0.110 0.245 0.046 0.100 0.382Consumer goods 0.124 0.166 13.500 0.177 0.127 0.304 0.031 0.126 0.773Health care 0.160 0.303 14.391 0.440 0.168 0.359 0.026 0.410 0.510Consumer service 0.115 0.143 13.471 1.384 0.122 0.263 0.041 0.097 0.335Telecommunication 0.355 1.040 14.619 0.411 0.364 0.314 0.133 0.421 −0.825Technology 0.143 0.119 11.788 0.378 0.145 0.108 0.052 0.373 0.529
This table presents the descriptive statistics for the data. The sample comprises 257 South African firms.ROA is total operating profit plus depreciation and amortization (EBITDA) divided by total assets. Lev isthe ratio of debt to total assets. Size is the natural logarithm of total assets. Growth is the one-year growthrate of sales. MROA is 2-year moving average of return on assets. Tang is the ratio of property, plant andequipment to total assets. NDTAX is non-debt tax shield, measured as depreciation and amortization dividedby total assets). HHI is the Herfindahl-Hirschman Index. BI is the Boone indicator (coefficients estimatedfrom equation (2) multiplied by -1 so that higher values reflect higher competition).
Table 2: Correlation matrix
Variables ROAi,t Levi,t−1 Rlevi,t−1 Sizei,t Growthi,t MROAi,t BIi,t HHIi,tROAi,t 1.000Levi,t−1 −0.044∗∗ 1.000Rlevi,t−1 −0.052∗∗ 0.863∗∗∗ 1.000Sizei,t 0.159∗∗∗ −0.059∗∗∗ −0.101∗∗∗ 1.000Growthi,t 0.001 −0.004 −0.004 −0.014 1.000MROAi,t 0.719∗∗∗ −0.340∗∗∗ −0.324∗∗∗ 0.191∗∗∗ −0.047∗∗ 1.000BIi,t 0.127∗∗∗ −0.025 −0.072∗∗∗ −0.011 −0.000 0.095∗∗∗ 1.000HHIi,t 0.014 0.041∗ 0.008 −0.078∗∗∗ −0.010 0.017 −0.124∗∗∗ 1.000
This table presents the unconditional correlation coefficient between any pair of variables. Lev and Rlev arealternative measures of leverage, and therefore they do not simultaneously enter the same regression. The samplecomprises 257 South African firms over the period 1998 to 2009. The subscripts i and t indexes firm and time.RLev is relative-to-industry mean leverage measured as the deviation of each firm’s leverage from the industrymean leverage. All other variables are as described in table 1. ***, ** and * indicate significance at 1%, 5% and10%, respectively
28
Tab
le3:
Rel
ati
ve
leve
rage-
per
form
an
cere
lati
on
ship
Dep
.va
r.:
RO
AH
erfi
nd
ahl-
Hir
sch
man
Ind
ex(H
HI)
Boon
ein
dic
ato
r(B
I)
Mod
el1
Mod
el2
Mod
el3
Mod
el4
Mod
el5
Mod
el6
Mod
el7
Mod
el8
Lev
i,t−
10.
3688
∗∗∗
1.9
436∗
∗∗2.
0245∗
∗∗2.0
412∗∗
∗0.
3651
∗∗∗
1.9
398∗
∗∗2.
0538∗
0.6
063∗
∗∗
(0.1
026)
(0.6
856)
(0.4
104)
(0.4
003)
(0.1
067
)(0.6
895)
(1.1
526)
(0.1
467)
Siz
e i,t
0.43
35∗
1.1
812∗
1.1138
0.9
245∗∗
0.4147∗∗
1.1
757∗
1.2019
0.6
757∗
(0.2
269)
(0.6
704)
(0.8
064)
(0.4
466)
(0.1
869)
(0.6
593
)(0.7
356)
(0.3
489)
Siz
e2 i,t
−0.
0136
∗−
0.0
404∗
−0.
0379
−0.0
309∗∗
−0.
0133∗∗
−0.0
406∗
−0.
0416
−0.0
224∗
(0.0
074)
(0.0
230)
(0.0
282)
(0.0
148)
(0.0
064
)(0.0
228)
(0.0
256)
(0.0
119)
Gro
wth
i,t
0.00
00−
0.0
001
−0.
0001
−0.0
000
0.0000
−0.0
001
−0.
0001
0.0
000
(0.0
001)
(0.0
002)
(0.0
002)
(0.0
002)
(0.0
001
)(0.0
002)
(0.0
002)
(0.0
001)
MR
OA
i,t
1.05
67∗∗
∗1.0
024∗
∗∗1.
0105∗
∗∗1.0
302∗∗
∗1.
0515
∗∗∗
0.9
965∗
∗∗0.
9992∗
∗∗1.0
100∗
∗∗
(0.1
069)
(0.1
229)
(0.1
545)
(0.1
377)
(0.1
007
)(0.1
179)
(0.1
115)
(0.1
050)
HH
I j,t
1.02
270.4
867
1.0
152
2.0
470
(0.9
273)
(1.0
135)
(1.3
529)
(1.4
999)
BI j,t
0.1020
0.0
906
0.1
524
−0.2
129
(0.0
953)
(0.0
812)
(0.2
455)
(0.1
606)
Lev
2 i,t−
1−
0.0
349∗
∗−
0.02
37
−0.0
349∗
∗−
0.0385
(0.0
150)
(0.0
481)
(0.0
151)
(0.0
298)
Lev
i,t−
1*H
HI j,t
−1.
5044
−4.
3111∗∗
∗
(4.7
344)
(1.0
412)
Lev
i,t−
1*B
HH
j,t
−0.
2534
1.2
675∗∗
(1.1
366)
(0.5
876)
Inte
rcep
t−
3.58
86∗∗
−8.8
624∗
−8.
4840
−7.
3281∗∗
−3.
2778∗∗
−8.7
069∗
−8.
9004∗
−5.
1079∗∗
(1.7
896)
(5.0
066)
(5.7
275)
(3.5
419)
(1.3
973
)(4.7
800)
(5.3
472)
(2.5
248)
N20
3020
30
2030
2030
2024
2024
2024
2024
R2
0.47
390.5
164
0.5
168
0.5
146
0.4753
0.5
177
0.5
178
0.4
952
Th
ista
ble
show
sth
efi
xed
effec
tes
tim
ati
on
resu
lts
for
the
effec
tsof
lever
age
on
firm
per
form
an
ce.
Th
esa
mp
leco
mp
rise
s257
Sou
thA
fric
an
firm
sover
the
per
iod
1998
to2009.ROA
isto
tal
op
erati
ng
pro
fit
plu
sd
epre
ciati
on
an
dam
ort
izati
on
(EB
ITD
A)
div
ided
by
tota
lass
ets.
Lev
i,t−
1is
the
lagged
rati
oof
deb
tto
tota
lass
ets.
Size i
,tis
the
natu
ral
logari
thm
of
tota
lass
ets.
Growth
i,t
isth
eon
e-yea
rgro
wth
rate
of
sale
s.M
ROA
i,t
is2-y
ear
movin
gaver
age
of
retu
rnon
ass
ets.
HHI j
,tis
theHer
fin
dahl−
Hirschman
Ind
ex.BI j
,tis
theBoonein
dicator
(coeffi
cien
tses
tim
ate
dfr
om
equ
ati
on
(2))
.A
bso
lute
mea
sure
oflever
age
isu
sed
inall
model
s.C
lust
eran
dh
eter
osk
edast
icit
yro
bu
stst
an
dard
erro
rsare
show
nin
pare
nth
esis
.E
ach
mod
elin
clu
des
yea
rd
um
mie
sw
hic
hare
not
rep
ort
ed.
***,
**
an
d*
ind
icate
sign
ifica
nce
at
1%
,5%
an
d10%
,re
spec
tivel
y.
29
Tab
le4:
Rel
ati
ve
leve
rage-
per
form
an
cere
lati
on
ship
Dep
.va
r.:
RO
AH
erfi
nd
ahl-
Hir
sch
man
Ind
ex(H
HI)
Boon
ein
dic
ato
r(B
I)
Mod
el1
Mod
el2
Mod
el3
Mod
el4
Mod
el5
Mod
el6
Mod
el7
Mod
el8
Rle
vi,t−
10.3
738∗
∗∗0.
3839
∗∗∗
2.4
802
1.4
971∗
∗0.3
785∗
∗∗0.
3890∗
∗∗0.4
161∗
∗∗0.
3970∗
∗∗
(0.0
999)
(0.1
172)
(1.8
414)
(0.6
182)
(0.1
017)
(0.1
208)
(0.1
334)
(0.1
072)
Siz
e i,t
0.6
184∗
∗∗0.
8046
∗∗∗
1.5
665∗
1.0598∗
∗0.5
809∗
∗∗0.
7609∗
∗∗0.8
701∗∗
∗0.
6678∗
∗∗
(0.2
321)
(0.2
321)
(0.8
437)
(0.4
991)
(0.1
841)
(0.1
782)
(0.2
455)
(0.2
488)
Siz
e2 i,t
−0.0
205∗
∗∗−
0.02
70∗∗
∗−
0.0559∗
−0.
0365∗
∗−
0.0
196∗
∗∗−
0.0261∗
∗∗−
0.0306∗∗
∗−
0.0231∗
∗∗
(0.0
076)
(0.0
072)
(0.0
312)
(0.0
171)
(0.0
062)
(0.0
058)
(0.0
087)
(0.0
088)
Gro
wth
i,t
−0.0
001
−0.
0002
−0.
0004
−0.0
003
−0.0
001
−0.
0002
−0.
0002∗
−0.0
001
(0.0
001)
(0.0
001)
(0.0
003)
(0.0
002)
(0.0
001)
(0.0
001)
(0.0
001)
(0.0
001)
MR
OA
i,t
1.0
185∗∗
∗1.
0083
∗∗∗
1.0309∗∗
∗0.9
828∗
∗∗1.0
136∗∗
∗1.
0051∗
∗∗0.
9886∗∗
∗0.9
963∗
∗∗
(0.1
022)
(0.0
902)
(0.0
427)
(0.1
268)
(0.0
946)
(0.0
817)
(0.0
791)
(0.0
966)
HH
I j,t
1.1
475
1.3
473
0.7
251
1.4
397
(0.9
932)
(0.9
572)
(0.8
944)
(1.3
560)
BI j,t
0.1
571∗
0.1616∗
0.2171∗∗
0.2
038∗
(0.0
911)
(0.0
866)
(0.1
091)
(0.1
122)
Rle
v2 i,t−
1−
0.00
07∗
−0.
0053
−0.
0008∗
−0.
0010∗∗
(0.0
004)
(0.0
050)
(0.0
004)
(0.0
005)
Rle
vi,t−
1*H
HI j,t
−5.
4343
−3.0
135∗
(4.5
489)
(1.5
573)
Rle
vi,t−
1*B
I j,t
0.2440
0.1
991
(0.1
944)
(0.1
642)
Inte
rcep
t−
4.7
542∗∗
−6.
0788
∗∗∗−
10.8
522∗
−7.7
388∗
∗−
4.2
922∗∗
∗−
5.5117∗
∗∗−
6.1530∗∗
∗−
4.8
310∗
∗∗
(1.8
449)
(1.9
029)
(5.5
845)
(3.7
420)
(1.3
814)
(1.3
946)
(1.7
535)
(1.7
705)
N20
3017
5917
592030
2024
1754
1754
2024
R2
0.4
670
0.4
664
0.5
176
0.4
921
0.4
704
0.4
698
0.4
734
0.4
730
Th
ista
ble
show
sth
efi
xed
effec
tes
tim
ati
on
resu
lts
for
the
effec
tsof
rela
tive
lever
age
on
firm
per
form
an
ce.
Th
esa
mp
leco
mp
rise
s257
Sou
thA
fric
an
firm
sover
the
per
iod
1998
to2009.
Th
evari
ab
les
an
dta
ble
stru
ctu
reare
as
des
crib
edin
Tab
le3.Relative−
to−
industrymea
nlever
age
(Rlevi,t−
1)
isu
sed
as
the
mea
sure
of
lever
age
inall
mod
els.
Clu
ster
an
dh
eter
osk
edast
icit
yro
bu
stst
an
dard
erro
rsare
show
nin
pare
nth
esis
.E
ach
mod
elin
clu
des
yea
rd
um
mie
sw
hic
hare
not
rep
ort
ed.
***,
**
an
d*
ind
icate
sign
ifica
nce
at
1%
,5%
an
d10%
,re
spec
tivel
y.
30
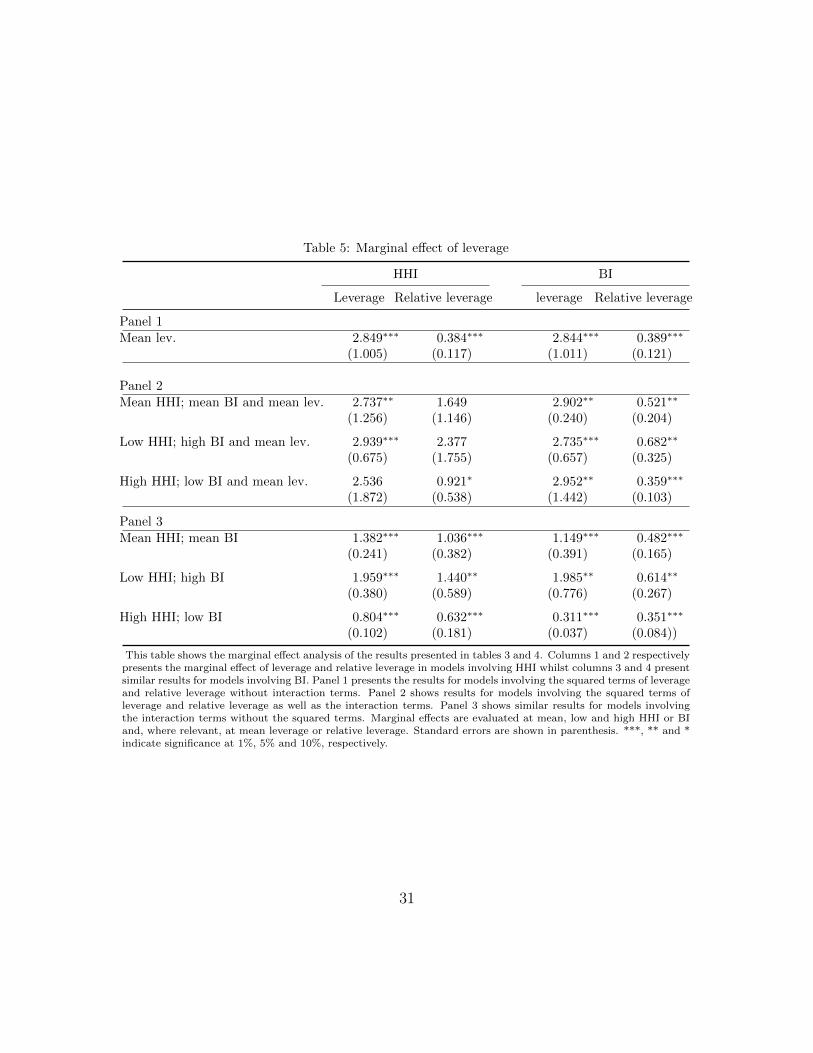
Table 5: Marginal effect of leverage
HHI BI
Leverage Relative leverage leverage Relative leverage
Panel 1Mean lev. 2.849∗∗∗ 0.384∗∗∗ 2.844∗∗∗ 0.389∗∗∗
(1.005) (0.117) (1.011) (0.121)
Panel 2Mean HHI; mean BI and mean lev. 2.737∗∗ 1.649 2.902∗∗ 0.521∗∗
(1.256) (1.146) (0.240) (0.204)
Low HHI; high BI and mean lev. 2.939∗∗∗ 2.377 2.735∗∗∗ 0.682∗∗
(0.675) (1.755) (0.657) (0.325)
High HHI; low BI and mean lev. 2.536 0.921∗ 2.952∗∗ 0.359∗∗∗
(1.872) (0.538) (1.442) (0.103)
Panel 3Mean HHI; mean BI 1.382∗∗∗ 1.036∗∗∗ 1.149∗∗∗ 0.482∗∗∗
(0.241) (0.382) (0.391) (0.165)
Low HHI; high BI 1.959∗∗∗ 1.440∗∗ 1.985∗∗ 0.614∗∗
(0.380) (0.589) (0.776) (0.267)
High HHI; low BI 0.804∗∗∗ 0.632∗∗∗ 0.311∗∗∗ 0.351∗∗∗
(0.102) (0.181) (0.037) (0.084))
This table shows the marginal effect analysis of the results presented in tables 3 and 4. Columns 1 and 2 respectivelypresents the marginal effect of leverage and relative leverage in models involving HHI whilst columns 3 and 4 presentsimilar results for models involving BI. Panel 1 presents the results for models involving the squared terms of leverageand relative leverage without interaction terms. Panel 2 shows results for models involving the squared terms ofleverage and relative leverage as well as the interaction terms. Panel 3 shows similar results for models involvingthe interaction terms without the squared terms. Marginal effects are evaluated at mean, low and high HHI or BIand, where relevant, at mean leverage or relative leverage. Standard errors are shown in parenthesis. ***, ** and *indicate significance at 1%, 5% and 10%, respectively.
31
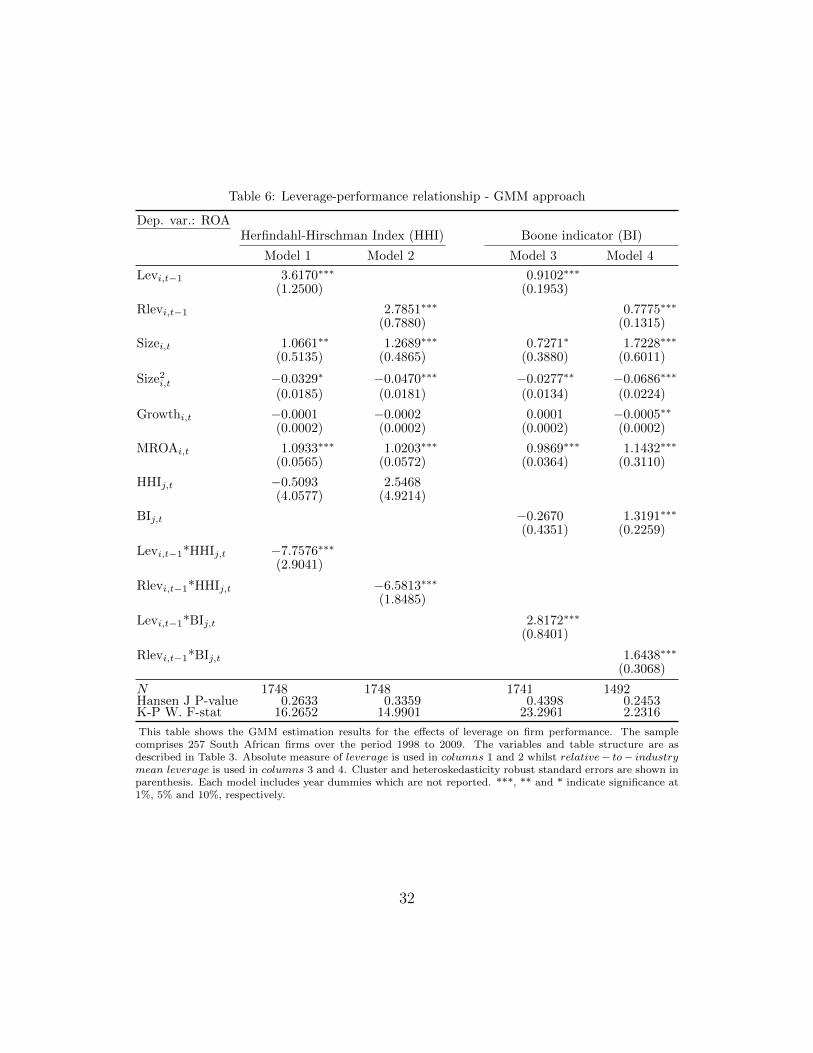
Table 6: Leverage-performance relationship - GMM approach
Dep. var.: ROAHerfindahl-Hirschman Index (HHI) Boone indicator (BI)
Model 1 Model 2 Model 3 Model 4
Levi,t−1 3.6170∗∗∗ 0.9102∗∗∗
(1.2500) (0.1953)
Rlevi,t−1 2.7851∗∗∗ 0.7775∗∗∗
(0.7880) (0.1315)
Sizei,t 1.0661∗∗ 1.2689∗∗∗ 0.7271∗ 1.7228∗∗∗
(0.5135) (0.4865) (0.3880) (0.6011)
Size2i,t −0.0329∗ −0.0470∗∗∗ −0.0277∗∗ −0.0686∗∗∗
(0.0185) (0.0181) (0.0134) (0.0224)
Growthi,t −0.0001 −0.0002 0.0001 −0.0005∗∗
(0.0002) (0.0002) (0.0002) (0.0002)
MROAi,t 1.0933∗∗∗ 1.0203∗∗∗ 0.9869∗∗∗ 1.1432∗∗∗
(0.0565) (0.0572) (0.0364) (0.3110)
HHIj,t −0.5093 2.5468(4.0577) (4.9214)
BIj,t −0.2670 1.3191∗∗∗
(0.4351) (0.2259)
Levi,t−1*HHIj,t −7.7576∗∗∗
(2.9041)
Rlevi,t−1*HHIj,t −6.5813∗∗∗
(1.8485)
Levi,t−1*BIj,t 2.8172∗∗∗
(0.8401)
Rlevi,t−1*BIj,t 1.6438∗∗∗
(0.3068)
N 1748 1748 1741 1492Hansen J P-value 0.2633 0.3359 0.4398 0.2453K-P W. F-stat 16.2652 14.9901 23.2961 2.2316
This table shows the GMM estimation results for the effects of leverage on firm performance. The samplecomprises 257 South African firms over the period 1998 to 2009. The variables and table structure are asdescribed in Table 3. Absolute measure of leverage is used in columns 1 and 2 whilst relative− to− industrymean leverage is used in columns 3 and 4. Cluster and heteroskedasticity robust standard errors are shown inparenthesis. Each model includes year dummies which are not reported. ***, ** and * indicate significance at1%, 5% and 10%, respectively.
32