cd projekt group q3 2021 earnings
TRANSCRIPT

Adam Kiciński // President, Joint CEO
Piotr Nielubowicz // Member of the Board, CFO
CD PROJEKT Group Q3 2021 Earnings29 November 2021
2
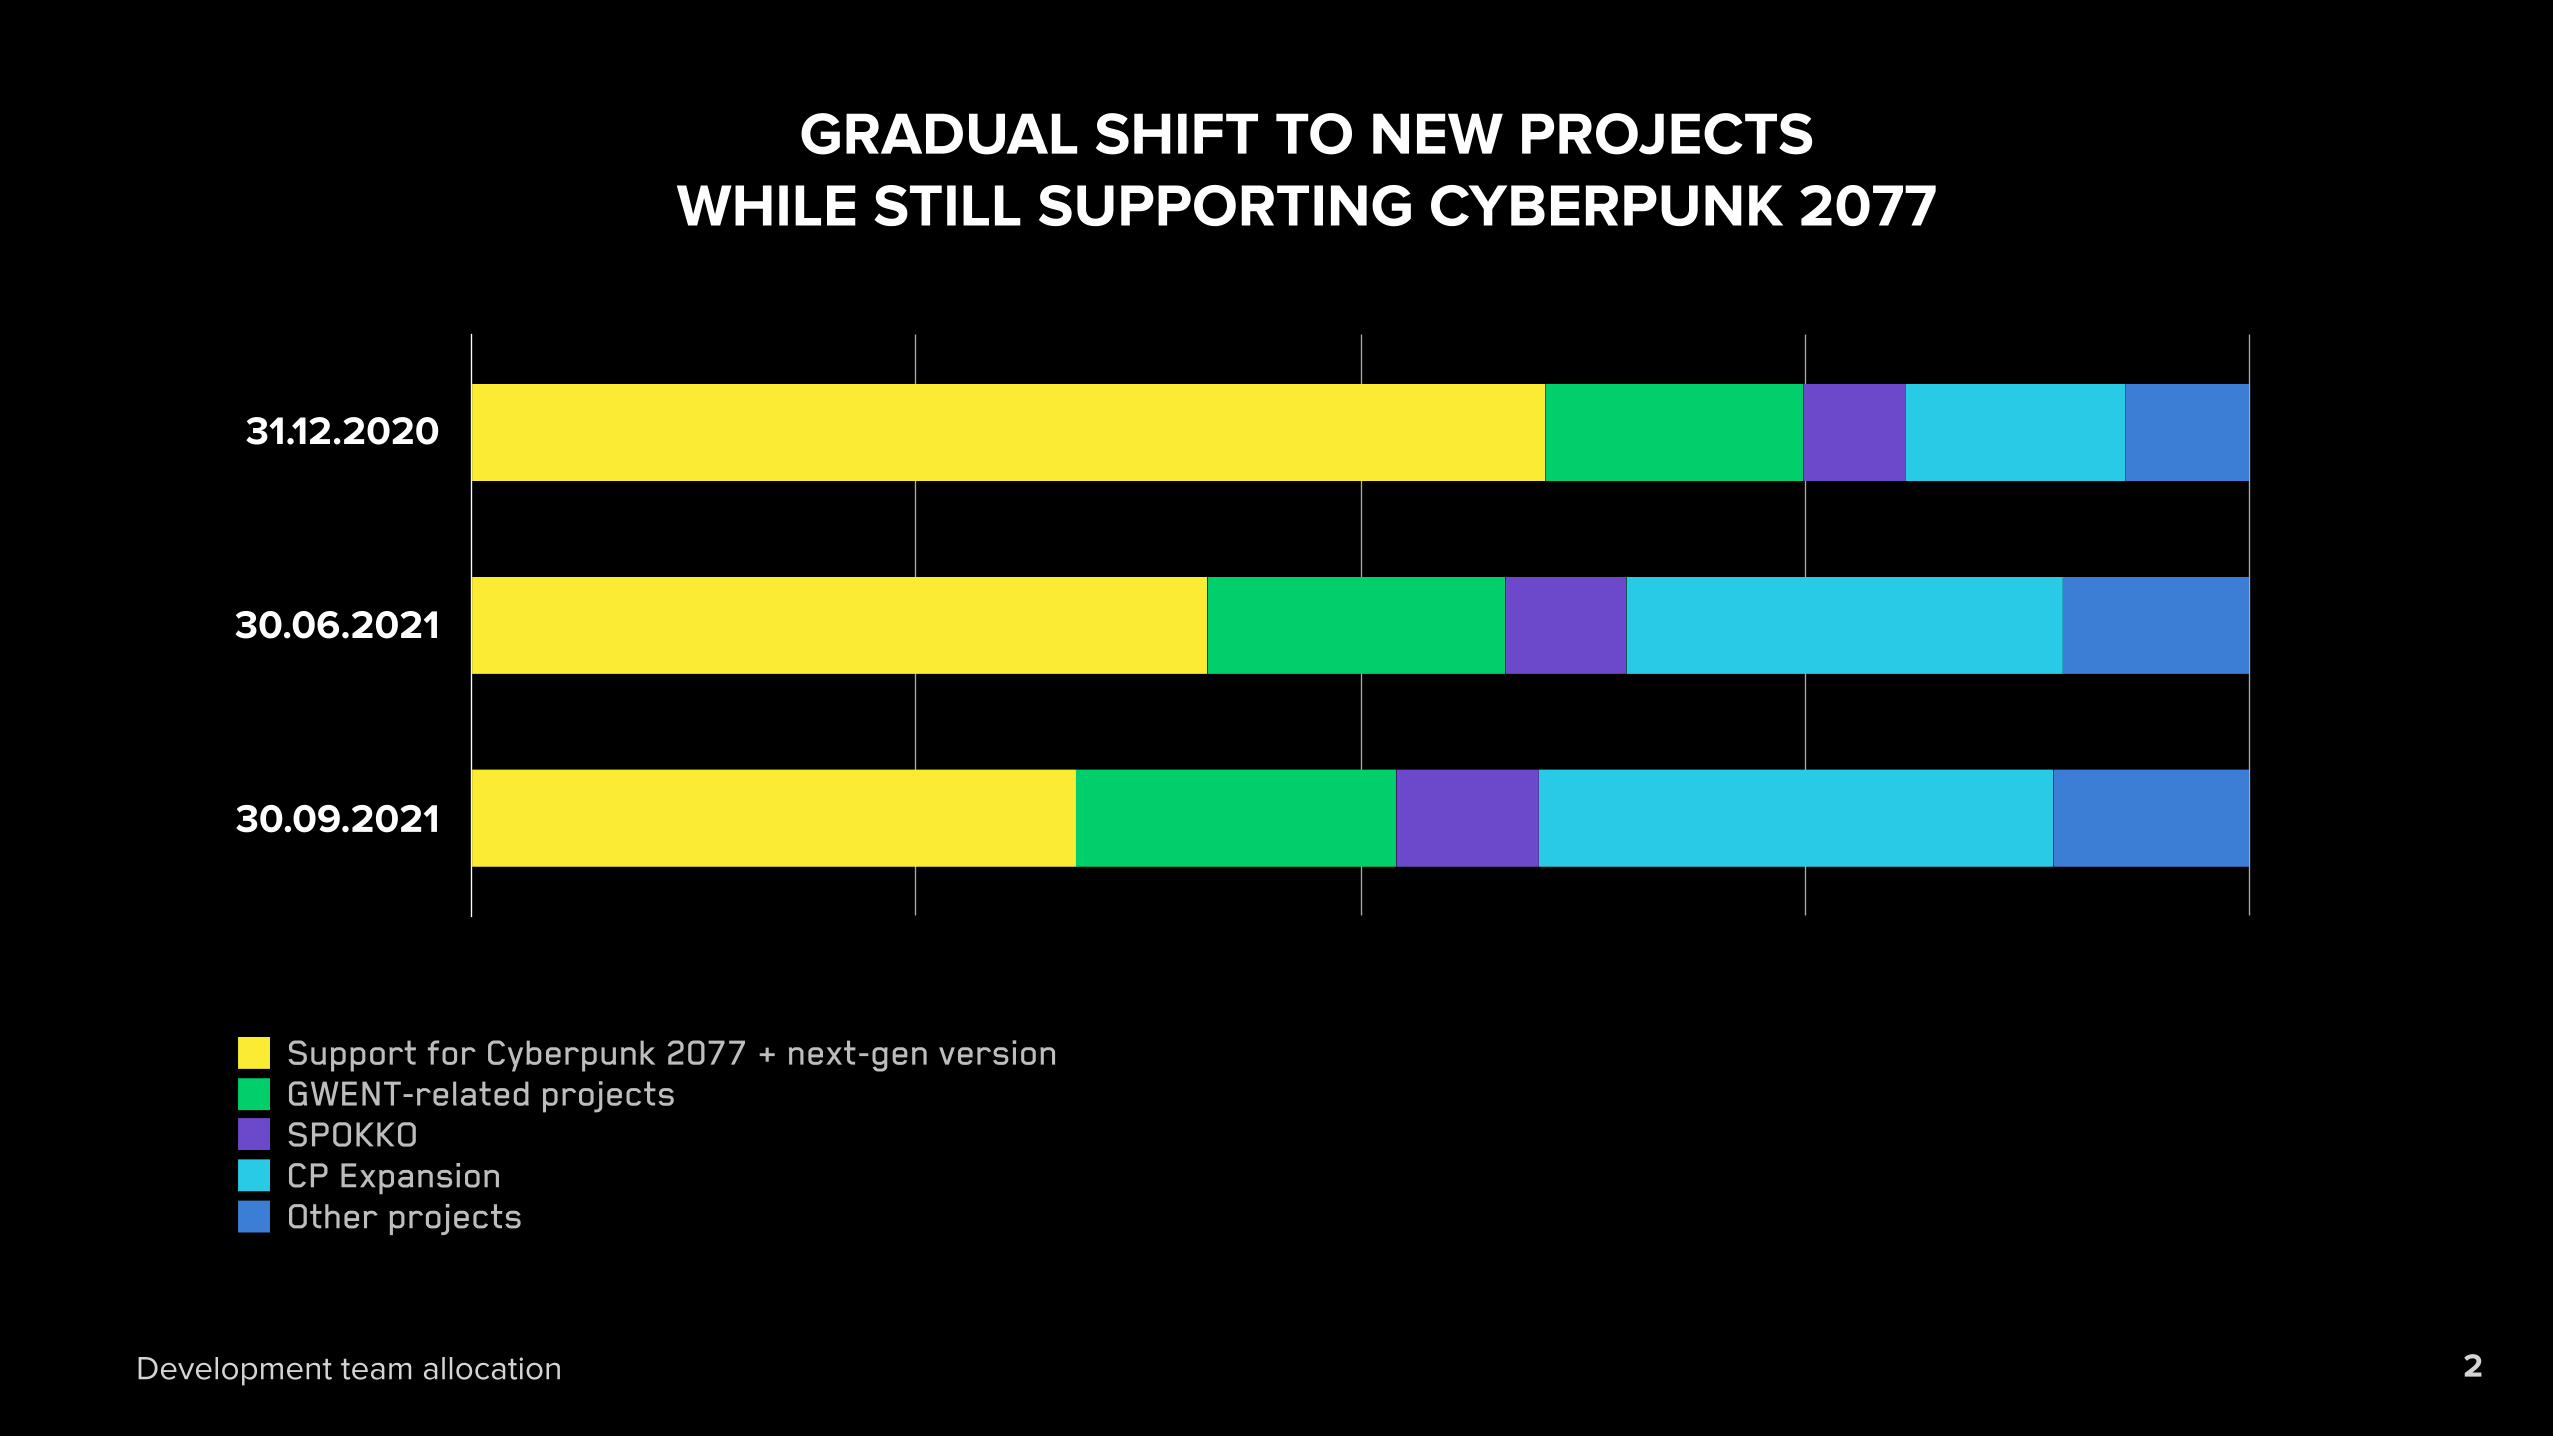
31.12.2020
30.06.2021
30.09.2021
Support for Cyberpunk 2077 + next-gen versionGWENT-related projectsSPOKKOCP ExpansionOther projects
GRADUAL SHIFT TO NEW PROJECTS WHILE STILL SUPPORTING CYBERPUNK 2077
Development team allocation

TARGET RELEASE DATE: Q1 2022 TARGET RELEASE DATE: Q2 20223
NEXT-GEN VERSIONS ARE ON TRACK TO MEET THEIR TARGET DATES

Optimization of GWENT operations based on
developed technology and experience gained
over the last 5 years of operating the game
Scale of activities and team size adjusted to
achieve optimal results
Further support for the project with regular
updates and content drops
Detailed roadmap of 2022 releases to be
presented during GWENT Masters Season 3
finale on December 5th
FUTURE PLANS FOR GWENT: THE WITCHER CARD GAME
4

5
THE WITCHER: MONSTER SLAYER
Current priority: improve retention and
monetization of the game
More effective live ops system rolled out on
November 24th, based on first regular task
feature
Content update coming soon

RECENT ACQUISITIONS OPEN OPPORTUNITIES FOR NEW TALENT POOL AND FUTURE PROJECTS
6

7
FINANCIAL RESULTS

CD PROJEKT GROUP RED GOG Q3 2021Q3 2020 Q3 2021 Q3 2021 Q3 2021 eliminations vs Q3 2020
Sales revenues 104 518 144 463 104 770 41 784 -2 091 38%Revenues from sales of products 61 902 104 262 101 642 1 984 636 68%Revenues from sales of services 467 420 964 73 -617 -10%Revenues from sales of goods and materials 42 149 39 781 2 164 39 727 -2 110 -6%
Cost of products, goods and materials sold 36 428 52 927 24 023 30 546 -1 642 45%Cost of products and services sold 6 620 23 217 22 051 1 357 -191 251%
– CP77 depreciation 17 024 17 024Cost of goods and materials sold 29 808 29 710 1 972 29 189 -1 451 0%
Gross profit from sales 68 090 91 536 80 747 11 238 -449 34%
Operating costs 39 573 75 904 59 901 16 440 -437 92%Selling costs 31 198 55 322 40 976 14 511 -165 77%
– CP77 service 17 912 17 912General and administrative costs 8 597 23 231 21 344 2 013 -126 170%
– early projects research phase costs 356 4 320 4 320– "stock option plan" 8 901 8 641 260
Other revenues and costs 222 2 649 -2 419 -84 -146 1093%
EBIT 28 517 15 632 20 846 -5 202 -12 -45%Financial revenues less expenses -762 768 1 567 -826 27 -201%Income tax 4 373 58 1 332 -1 276 2 -99%
Net profit 23 382 16 342 21 081 -4 752 13 -30%
Net profitability 22.4% 11.3% 20.1% -11.4%
CD PROJEKT GROUP — PROFIT AND LOSS ACCOUNT
8All figures in PLN thousands

40 000
80 000
120 000
160 000
Q3 2018 Q3 2019 Q3 2020 Q3 2021
128 121
81 13677 976
51 680
16 34223 38214 89515 487
Net profitCosts & expences
CD PROJEKT GROUP REVENUES — PROFIT VS. COSTS AND EXPENSES
All figures in PLN thousands 9

40 000
80 000
120 000
160 000
Q3 2018 Q3 2019 Q3 2020 Q3 2021
Net profitCP77 serviceCP77 depreciationEarly projects reseach phase costsOther costs & expences
CD PROJEKT GROUP REVENUES — PROFIT VS. COSTS AND EXPENSES
All figures in PLN thousands 10

ASSETS 30.06.2021 30.09.2021 change change %Fixed assets 945 128 931 541 -13 587 -1%
Expenditures on development projects 379 387 376 973 -2 414 -1%Other financial assets * 211 961 173 808 -38 153 -18%Other fixed assets 353 780 380 760 26 980 8%
Working assets 1 202 302 1 216 539 14 237 1%Inventories 16 903 16 564 -339 -2%Receivables 248 040 166 072 -81 968 -33%Deferrals 11 382 13 658 2 276 20%Other financial assets* 206 804 279 491 72 687 35%Cash and bank deposits* 719 173 740 754 21 581 3%
TOTAL ASSETS 2 147 430 2 148 080 650 0%
* Cash, bank deposits and T-bonds – total 1 129 406 1 184 648 55 242 5%
EQUITY AND LIABILITIES 30.06.2021 30.09.2021 change change %Equity 1 806 363 1 833 522 27 159 2%Liabilities 341 067 314 558 -26 509 -8%
Liabilities 138 181 159 401 21 220 15%Deferred revenues 41 591 43 108 1 517 4%Provisions 161 295 112 049 -49 246 -31%
– Bonuses 22 268 25 823 3 555 16%– Sales 85 985 33 247 -52 738 -61%– Costs 53 042 52 979 -63 0%
TOTAL EQUITY AND LIABILITIES 2 147 430 2 148 080 650 0%
CD PROJEKT GROUP — BALANCE SHEET
11All figures in PLN thousands

40 000
80 000
120 000
160 000
Q1 2019 Q2 2019 Q3 2019 Q4 2019 Q1 2020 Q2 2020 Q3 2020 Q4 2020 Q1 2021 Q2 2021 Q3 2021
Development expenditures – new products (Assets – capitalised)Research costs – new projects (P&L – G&A costs)Service costs – released products (P&L – Selling costs)
CD PROJEKT RED — PRODUCT RESEARCH, DEVELOPMENT & SERVICE COSTS
All figures in PLN thousands 12

350 000
700 000
1 050 000
1 400 000
1 129 406
-366 055
1 029 641
16 34236 716
1 184 648
Cash, deposits and T-bonds 01.07.2021
Cash, deposits and T-bonds 30.09.2021
OtherChange in liabilities
and provisions
Net profit for the period
Change in receivables
All figures in PLN thousands 13
CD PROJEKT GROUP — CASH FLOW
26 530
Depreciation of expenditures
on development projects recognized as cost of products and services sold
88 877 22 876 9 607
Expenditures on
development projects

Q&A
14

16
LEGAL DISCLAIMERThis presentation was created by CD PROJEKT S.A. (“CD PROJEKT”).
Data contained in this presentation is valid as of the day of its preparation. Consequently, this presentation will not be subject to changes, updates or modifications to account for events which might occur after this day.
The presentation outlines the activities of CD PROJEKT and the CD PROJEKT Group. It is purely informative in scope and should not be regarded as offering investment advice. Information contained in this presentation must not be construed as assurances, projections or forecasts regarding future accomplishments or earnings of CD PROJEKT or of the CD PROJEKT Group.
Although due diligence was applied in preparing this presentation, it may nevertheless contain ambiguities. Under no circumstances should this presentation be construed as a purchase recommendation, an invitation to subscribe to, or an offer to recommend purchase or subscription to any securities issued by CD PROJEKT.
The recipients of this presentation bear all responsibility for their own analyses and assessments regarding the status of the market as well as the condition and potential future earnings of CD PROJEKT which may be based on information contained herein. CD PROJEKT wishes to advise all parties accessing this presentation that the sole authoritative source of information concerning the Company’s earnings, projections, events and indicators is represented by the current and periodic reports published by CD PROJEKT in the course of discharging its reporting obligations under Polish law.
This presentation is not to be circulated in territories and states where public circulation and sharing of information contained herein may be subject to legal restrictions. Parties accessing this presentation are advised to familiarize themselves with any such restrictions beforehand.
CD PROJEKT S.A. or any of its affiliates in the capital group (“CD PROJEKT”) with regards to any kind of, either sponsored or unsponsored ADR (“alternative depositary receipts”) or any other financial instruments of this kind (“Financial Instruments”) does not (i) make any warranties, expressed or implied, as to the accuracy, adequacy or completeness or any of the information connected with the Financial Instruments, (ii) support or encourage the creation of any kind of the Financial Instruments. CD PROJEKT does not represent any depository institution, bank or anyone nor should any such entity/person.
CD PROJEKT shall have no responsibility or liability for the Financial Instruments. In case of any question, the holder of any Financial Instruments (as defined above) shall receive all the essential information at the institution issuing such Financial Instruments or any institution supporting such issuance of the Financial Instruments.