center for international development at harvard …...2016 and if there is evidence of countries...
TRANSCRIPT
Who Wins in the World Economy and English Football?
And is it possible for lower tier participants to ‘catch up’
Matt Andrews
CID Faculty Working Paper No. 345
January 2019
Copyright 2019 Andrews, Matt; and the President and Fellows of Harvard College
at Harvard University Center for International Development Working Papers
1
Who Wins in the World Economy and English Football?
And is it possible for lower tier participants to ‘catch up’
Matt Andrews
Harvard Kennedy School
Abstract
Globalization has fed significant economic gains across the world. The gains lead some policymakers in developing countries to believe in the potential of ‘catch up’—where they leverage the gains of an open world economy to foster rapid progress and compete with more developed nations. This belief is particularly evident in countries like Rwanda, where policymakers aspire to turn the country into ‘Africa’s Singapore’. This paper asks if such aspiration is realistic: Do developing countries really gain enough from globalization to catch up to more developed countries? The paper examines the world economy as a league in which countries compete for winnings (manifest in higher income and production). Wealthier countries are in the top tiers of this league and poorer countries are in the lower tiers. The paper asks if gains from the last generation of growth have been distributed in such a way to foster ‘catch up’ by lower tier countries, and if we see these countries ‘catching up’ by moving into higher tiers. This analysis of the world economy is compared with a study of English football, where over 90 clubs play in an multi-tier league system. Prominent examples of ‘catch up’ in this system include Leicester City’s rise from the third tier in 2008 to become first tier champion in 2015. The paper asks if such ‘catch up’ is common in English football, given the way winnings are distributed, and if ‘catch up’ is more common in this context than in the world economy more generally.

2
“Proponents of globalization say that it helps developing nations ‘catch up’ to industrialized nations … ” Lisa Smith, Journalist1 “We … focus on economic performance … because the ultimate goal of any nation aspiring to develop, aspiring to catch up, is to improve the livelihoods of the people.” Arkebe Oqubay, Minister, Prime Minister’s Office, Ethiopia2 “…because of the Premier League’s global footprint, the economic gap between the elite and the rest has become a chasm.” Tim Wigmore, Journalist3
Can lower tier participants ‘catch up’ in globalized competitions?
Economic globalization has accelerated over the last generation. This is reflected in the expansion of world exports, which grew from about $7 trillion in 1990 to $25 trillion in 2016.4 This acceleration is also evidenced in the increased flow of migrants over borders, which the United Nations estimates have doubled since 1990.5 Another telling indicator is the explosion in air travel;6 the number of annual global air travelers grew from 1 billion in 1990 to 4 billion in 2016, global freight transfers grew from 56,000 to 214,000 tons per year, and the number of registered flight departures grew from 14.5 million to 35.8 million per year.
The economist Branko Milanovic notes that these and other impacts of globalization have reduced “obstacles between people in the world” and generated historically high levels of participation in the world economy.7 This has led to significant economic gains, felt across the world. Countries in Latin America and the Caribbean, for instance, more than doubled regional gross domestic product between 1990 and 2016. Real per capita incomes have also risen; from about $2,000 in 1990 to over $12,000 in 2016 in East Asia and the Pacific and by about 35% in Africa in the same period.8 Some countries grew more rapidly; Rwanda, for example, doubled its average real per capita income between 1990 and 2016.
1 Smith, L. 2007. The Good and Bad of Globalization. Forbes. May 11, 2007. https://www.forbes.com/2007/05/11/globalization-outsourcing-nafta-pf-education-in_ls_0511investopedia_inl.html#44539f062d08 2 Aglionby, John. 2017. Ethiopia bids to become the last development frontier. Financial Times. July 3, 2017. https://www.ft.com/content/76968dc4-445f-11e7-8d27-59b4dd6296b8 3 Wigmore, T. 2018. The Premier League is losing its competitive balance – that should be cause for concern. iNews. February 2, 2018. https://inews.co.uk/sport/football/premier-league-competitive-balance/ 4 Exports are measured in 2010 prices to capture the real value. Data from the World Development Indicators, available at https://data.worldbank.org/indicator/NE.EXP.GNFS.KD 5 The UN-DESA international migrant stock data show that migrants have grown in number from 150 million to 260 million in the last twenty-five years. See data at https://migrationdataportal.org/data?i=stock_abs_&t=2017 6 Air travel data comes from the World Bank. See https://data.worldbank.org/indicator/IS.AIR.PSGR 7 Bevins, V. 2016. To Understand 2016’s Politics, Look at the Winners and Losers of Globalization. An interview with economist Branko Milanovic. New Republic. December 20, 2016. https://newrepublic.com/article/139432/understand-2016s-politics-look-winners-losers-globalization 8 Measured in 2011 dollar values and controlling for purchasing power parity.
3
This kind of evidence leads luminaries like Bill Gates to say, “On the whole, the world is getting better.”9 Such evidence also inspires a belief that developing countries can ‘catch up’ to more developed nations and compete more in the world economy. Rwanda is a country that exudes this belief, with the government regularly suggesting it will become ‘Africa’s Singapore’.10 The belief is also apparent in respect of countries like Georgia and Colombia, where recent growth has led to both being called ‘economic miracles’.11 Some East Asian countries are similarly heralded, with observers identifying nations like Vietnam and Myanmar as the next Asian Tigers—developing countries that can ‘catch up’ to compete with traditionally richer nations.12
I encounter this belief in policymakers across the developing world, all trying to design policies that leverage new global opportunities to promote economic ‘catch up’ for their nations. They often ask about lessons from countries that seem to be examples of ‘catch up’—like Rwanda and Georgia and Colombia and many in East Asia. The hope of such officials is captured in the words of Arkebe Oqubay, Minister in Ethiopia’s Prime Minister’s Office, used to explain why his country focuses on economic policies in development initiatives: “Because the ultimate goal of any nation aspiring to develop, aspiring to catch up, is to improve the livelihoods of the people.” 13
One wonders if such hope is realistic: Do developing countries really gain enough from globalization to catch up to more developed countries in the world economy?
I address this question here, by examining patterns of ‘winning’ in the world economy over the last generation. I treat the world economy as a ‘league’ in which countries fall into different tiers, with top tiers comprising wealthier countries and lower tiers housing poorer countries. I look at how economic winnings—income and production—are distributed across these tiers in 1990 and 2016 and if there is evidence of countries improving their league position and ‘leapfrogging’ tiers over time (to ‘catch up’ and gain more winnings).
To add a comparative angle to the paper, I augment this study of the world economy with a similar investigation of English football. Ninety-two clubs participate in this league system each year, in four tiers; all ostensibly competing for the financial winnings that fuel professional football. The league system has globalized significantly since the 1990s, becoming more popular, powerful, and
9 See Gates, W. (2018). Why I decided to Edit an Issue of Time. Time Magazine, January 4, 2018. In this op-ed, Gates notes that, “This [his views on the world getting getter] is not some naively optimistic view; it’s backed by data. Look at the number of children who die before their fifth birthday. Since 1990, that figure has been cut in half. That means 122 million children have been saved in a quarter- century, and countless families have been spared the heartbreak of losing a child.” 10 Economist. 2012. Africa’s Singapore? February 25, 2012. https://www.economist.com/business/2012/02/25/africas-singapore 11 See, for instance, Economist. 2010. Georgia’ Mental Revolution. August 19, 2010 (https://www.economist.com/europe/2010/08/19/georgias-mental-revolution); and Forero, J. 2012. ‘Colombian Miracle’ takes off. Washington Post, April 13, 2012. (https://www.washingtonpost.com/world/the_americas/colombian-miracle-takes-off/2012/04/13/gIQAsnEdET_story.html?noredirect=on&utm_term=.c38e8e210f30). 12 Fuller, E. 2016. Vietnam Poised To Be Asia's Next Economic Tiger. Forbes. September 7, 2016. (https://www.forbes.com/sites/edfuller/2016/09/07/vietnam-poised-to-be-asias-next-economic-tiger/#505cdf8a44cf) 13 Aglionby, John. 2017. Ethiopia bids to become the last development frontier. Financial Times. July 3, 2017. https://www.ft.com/content/76968dc4-445f-11e7-8d27-59b4dd6296b8
4
wealthy in the process.14 Similar to believing that globalization helps developing countries ‘catch up’ with developed economies, some observers argue that a more globally connected English football sector creates opportunities for traditionally less successful clubs to ‘catch up’ to traditionally more successful clubs.15 As evidence, proponents of this belief point to the fact that unheralded Leicester City Football Club rose from the third tier of competition in 2008 to win the top tier Premier League title in 2015.16 ‘Lessons from Leicester’ are now regularly offered to policymakers across the world trying to promote ‘catch up’.17
Various observers suggest that Leicester’s story is an aberration, however, and that globalization causes more English football clubs to ‘fall back’ instead of ‘catch up’. Pointing to growing gaps between ‘winners’ at the “top” of the league system and “those struggling at the bottom” since the league’s globalization,18 these observers argue that clubs in lower tiers of the English football league system have become less capable of competing for winnings over time. In contrast, they suggest that a few top tier clubs have become more dominant in the competition. In the words of journalist Tim Wigmore, “the economic gap between the elite and the rest has become a chasm.”19
The argument is that traditionally richer clubs have gained relatively more from the newly globalized league than traditionally poorer clubs. This, it is suggested, has cemented a highly exclusive competitive order in English football, increasingly excluding many smaller clubs from competing for most of the sector’s winnings. If this argument is true, the English football experience would cause us to be skeptical about the potential for developing country ‘catch up’ in the world economy. In contrast, we would expect to see developing countries ‘fall back’ in the world economic order. This paper asks if the argument is indeed true—in respect of English football and the world economy; who does win in these globalized competitions, and is ‘catch’ up possible for lower tier participants (developing countries and smaller football clubs)?
14 Bond, D. 2013. Has the evolution of the beautiful game been for better or worse? BBC.Com. April 29, 2013. https://www.bbc.com/sport/football/22314015 15 This is just one of the potential gains some economists suggest globalization will bring to a sport like football. As Binyamin Applebaum noted in a 2015 New York Times article, “Economists have long held up soccer — which has become one of the most globalized markets for skilled labor — as a shining example of the benefits of open borders. The Premier League now draws capital and labor from around the world, and produces a spectacle consumed around the world … And economists say that’s good for the players, their countries — and for England.” (Applebaum, B. 2015. Harry Kane, Globalization and the Push to Limit Foreign Players in the Premier League. New York Times. April 1, 2015. https://www.nytimes.com/2015/04/02/upshot/globalization-under-attack-on-the-soccer-field.html). 16 Bagehot, J. 2016. Leicester City’s success suggests globalization is strengthening, not killing, English football. Economist. May 3, 2016. https://www.economist.com/bagehots-notebook/2016/05/03/leicester-citys-success-suggests-globalisation-is-strengthening-not-killing-english-football 17 See, for instance, the ‘Leadership lessons from Leicester City’ by management consultants Stuart Crainer and Des Dearlove on the ‘Thinkers50. come web site (https://thinkers50.com/blog/leadership-lessons-leicester-city/). 18 Wright, J. 2013. The Ugly Business of the Beautiful Game: How Football List its Soul. Huffington Post. June 13, 2013. https://www.huffingtonpost.co.uk/john-wight/football-lost-its-soul_b_3433753.html 19 Wigmore, T. 2018. The Premier League is losing its competitive balance – that should be cause for concern. iNews. February 2, 2018. https://inews.co.uk/sport/football/premier-league-competitive-balance/
5
Leagues, participation, and competitiveness
‘Leagues’ exist all over the world,. They fulfill two purposes, as captured in different definitions:
• One definition sees a league as ‘a collection of people, countries, or groups that combine for a particular purpose, typically mutual protection or cooperation’.
• A second definition holds that leagues are ‘group[s] of sports clubs that play each other over a period for championship[s].’
The English football league system demonstrates how both definitions of ‘league’ often overlap in the same context. This league system is a collection of member clubs that combine and cooperate to play the sport professionally; given agreed rules and structures. The member clubs also compete with each other, in championships where some win and others do not. Winnings manifest in more than on-field victories and trophies. Winning clubs earn more money than others, and these financial gains are arguably the focal point of professional football.
The English football league system is large, and different clubs in the system have different capabilities. This means that it is not possible—or desirable, perhaps—for all members to play against all other members.20 As a result, the 92 clubs are divided into smaller groups of 20-24 clubs that play at similar competitive levels. These different tiers are then organized into a hierarchy. Clubs in the top tiers—now called the Premier League and the Championship—are considered better quality (and more competitive) than clubs in lower tiers—League One and League Two.21 The financial winnings associated with each tier are different, and clubs in higher tiers receive greater financial benefits simply by qualifying for these higher tiers. ‘Promotion’ to higher tiers is thus a valuable prize in itself, and a competitive mechanism allows the better performing clubs to rise in the hierarchy, one tier at a time. Similarly, a relegation mechanism forces clubs that perform poorly to drop to lower (and less financially rewarding) tiers.
As described, it is beneficial for all clubs wanting to play professional football to participate in the English professional football league system (any club wanting to professionalize has a body it can join, where others have already created the institutions needed to play professional football). The benefits to participation are not equal for all members, however, as more competitive clubs are likely to win more (and thus be more economically successful) than others. Clubs that become more competitive over time can rise in the system and earn more economic success, however, such that all participants have a hope of ‘winning’ more in future.
The analysis that follows in future sections asks questions about this league:
• How much do the economic winnings differ across and within league tiers? • Has this pattern of winnings changed over time? • How ‘competitive’ is this system (do the same clubs win again and again)? • How real is the ‘hope of winning’ for lower tier participants?
20 The Football Association (FA) Cup is a championship that does include all clubs in the main leagues, but this is not the main competition for any of the clubs. 21 Beyond these primary leagues one also finds lower leagues where less competitive clubs are members, like the National League, Southern League, Northern League, and Isthmian League.
6
I ask the same questions of countries in the global economic community. This community has many of the hallmarks of a league system.22 At a macro level, countries are the members of this system, and ‘participate’ in various ways. Formal league structures include membership of global organizations (like the United Nations, World Trade Organization, World Bank, and International Monetary Fund (IMF)). These organizations exist to help foster processes, rules, and norms of communication and commerce between countries (and firms in countries) so that every country does not have to develop its own communication and commerce mechanisms. The work of these organizations helps to smooth interaction across countries and to lessen transaction costs in the economic ‘game’. These organizations can also provide community assistance to member countries (with members accessing subsidized loans or assistance from the World Bank, for instance, or ‘lender of last resort’ help from the IMF).
Beyond these participatory structures, countries actively compete against each other in this league; for talent and production and economic growth.23 The competition is fierce, and manifests in governments employing all sorts of policies to try and attract new businesses that will bring jobs and economic benefits to their shores. Many developing and emergent countries have worked hard to improve their performance on ‘Doing Business’ indicators, for example, to show that they are competitive destinations for globally mobile firms and talent to locate and engage.24
As with clubs in the English football league system, countries in this competition have different capabilities. Unlike the English football league, however, the global economic system does not have formal league hierarchies to organize countries into different competitive tiers. The closest one gets to this kind of organization are the various structures that group countries according to some or other similar characteristic or for a specific economic purpose. The Organization for Economic Cooperation and Development (OECD) is an example. This is a country grouping that brings higher income countries together to (among other things) further their interests in learning
22 Many analysts use the league metaphor to order and analyze the world system, in areas as diverse as education, scientific advancement, and health. See, for instance: Marginson, S. and Van der Wende, M. 2007. To rank or to be ranked: The impact of global rankings in higher education. Journal of studies in international education, 11(3-4), pp.306-329; King, D.A. 2004. The scientific impact of nations. Nature, 430(6997), p.311. 23 There is a large literature describing the industrial and economic policies used to foster competition between nations in the hope of ‘catch up’. Recent examples include Hausmann et al., Nayyar, Noman and Stiglitz, Popov and Jomo, Rodrik, and Whitfield et al. Hausmann, R. 2016. Economic Development and the Accumulation of Know-how. Welsh Economic Review, 24, pp.13-16; Hausmann, R., Cheston, T., Santos, M. and Pietrobelli, C. 2016. Towards a Prosperous and Productive Chiapas: Institutions, Policies, and Public-Private Dialog to Promote Inclusive Growth. Harvard School Center for International Development Working Paper 317; Nayyar, D. 2013. Catch Up: Developing Countries in the World Economy. New York: Oxford University Press; Noman, A. and Stiglitz, J.E. eds. 2015. Industrial policy and economic transformation in Africa. Columbia University Press; Popov, V and Jomo, K.S. 2018. Are developing countries catching up? Cambridge Journal of Economics, 42(1): 33– 46; Rodrik, D., 2017. Straight talk on trade: Ideas for a sane world economy. Princeton University Press; Rodrik, D. 2018. Populism and the Economics of Globalization. Journal of International Business Policy, pp.1-22; Whitfield, L., Therkildsen, O., Buur, L. and Kjær, A.M. 2015. The politics of African industrial policy: A comparative perspective. Cambridge University Press. 24 For a discussion of such reforms, see Besley and Oto-Peralias and Romero-Avila. Besley, T. 2015. Law, regulation, and the business climate: The nature and influence of the World Bank Doing Business project. Journal of Economic Perspectives, 29(3), pp.99-120; Oto-Peralías, D. and Romero-Ávila, D. 2017. Literature Review on the Effect of the Ease of Doing Business on Economic and Financial Outcomes. In Legal Traditions, Legal Reforms and Economic Performance (pp. 37-56). Springer.
7
about addressing common challenges. Another example is the European Union, which groups geographically proximate countries together to advance common interests related to (among other things) trade and other issues of movement and interaction.
Beyond these particular groupings (and the many like them), there is no one formal league hierarchy that differentiates the ‘economic competition’ different countries will participate in. All countries, therefore, compete with each other.
There is, however, an informal understanding in the global development community that countries are different. This is reflected in the way organizations like the World Bank have traditionally differentiated countries based on their income levels—with high income, upper middle income, lower middle income, and low income groupings.25 The argument behind such differentiation is that different countries need different support, depending on their economic status. One could extend the argument to suggest that different countries will also be differently competitive depending on their economic status.
Given such argument, this paper employs a version of the approach to examine the world economy, breaking the world’s economic league system into five tiers (using real total Gross Domestic Product (GDP) and Gross Domestic Product Per Capita (GDPPK) data drawn from the World Development Indicators). The world’s countries are organized into a long list, and the top 20% of countries in that list—by either real GDP or real GDPPK—makes up the top (first) tier, with the lowest 20% of countries making up the bottom (fifth) tier. This kind of arrangement allows one to ask the same questions raised in respect of English football, in sections that follow:
• How much do the economic winnings differ across and within league tiers? • Has this pattern of winnings distribution changed over time? • How ‘competitive’ is this system (do the same countries win and again)? • How real is the ‘hope of winning’ for lower tier participants?
Patterns of competitiveness in English football
This section looks into patterns of economic competitiveness in the English men’s football league system. It does so by examining patterns of winnings distributions across clubs playing in the various tiers of the league system over the last generation (since the Premier League was created in 1992). Data on the financial conditions in English football were obtained from various sources, including Deloitte’s reviews of soccer, the European Football Association (UEFA), and the media.26 The data is considered as reliable as possible (given that other academic studies routinely use such),27 and provides the picture needed to see where ‘economic winnings’ accrue in the league system and how this pattern has changed in the last generation.
25 Fantom, N. and Serajuddin, U., 2016. The World Bank's classification of countries by income. The World Bank. 26 For a discussion of these sources, see Andrews, M. and Harrington, P. 2015. Off Pitch: Football's Financial Integrity Weaknesses, and How to Strengthen Them. HKS Working Paper No. RWP16-009. Refer, also, to the Deloitte reviews on football finance (with the 2015 report available at http://www2.deloitte.com/uk/en/pages/sports-business-group/articles/annual-review-of-football-finance.html). 27 Studies using similar data include the following: Institute of Chartered Accountants in England and Wales (ICAEW) study on ‘Accounting for Football Clubs’ (http://www.icaew.com/en/library/subject-
8
How much do the economic winnings differ across and within league tiers?
Revenue was used to capture economic winnings; of clubs across the entire league’s tiers. This includes money earned from matches (gate receipts), media offerings (broadcast revenue), and sponsorships, merchandise and other marketing products (commercial revenue). This is a broad measure of ‘economic winnings’ that obviously extends beyond the prize money obtained when a club wins a league.28 The broader measure shows how much a club earns through its efforts to win fans who attend matches, viewers who watch broadcasts, broadcasters who choose to screen one club’s match over another’s, sponsors who pay to have one club represent their product instead of another’s, consumers who decide to buy one club’s shirt rather than another’s, and more. These—it is argued—are the real economic winnings professional clubs vie for.
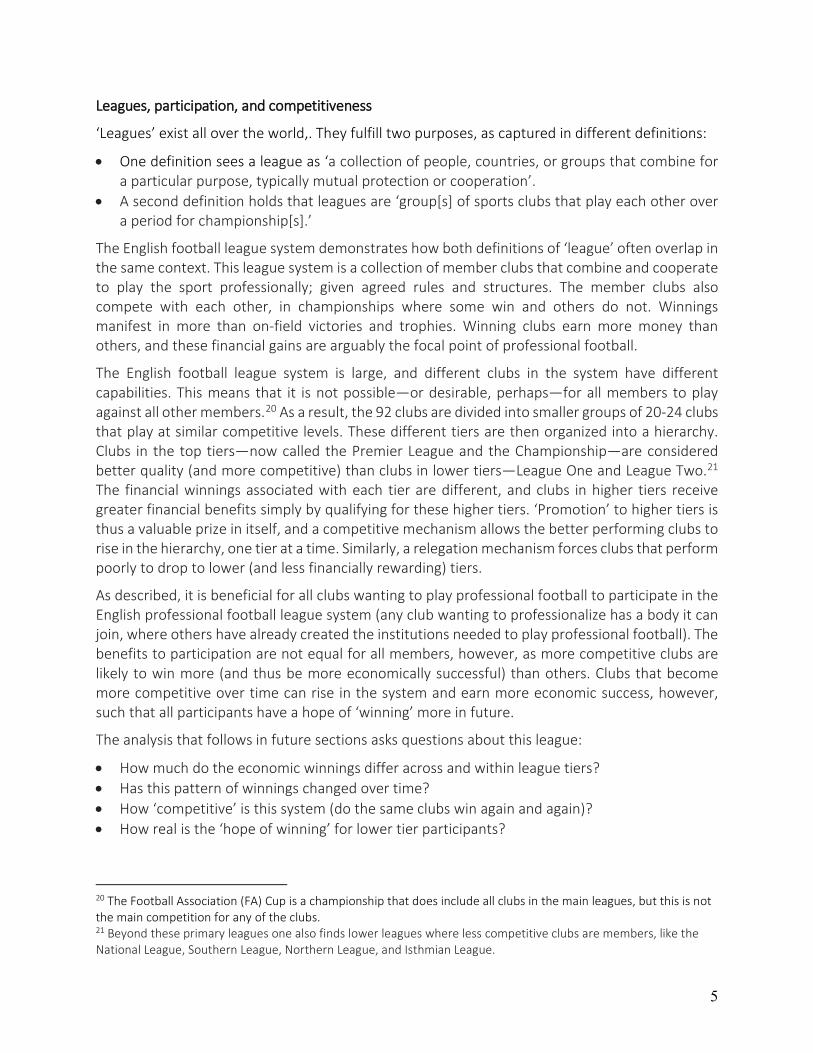
Considering proceeds from all these activities, sources estimate that the English football league system—at least the top four tiers thereof—generated about £3 billion in ‘economic winnings’ in the 2012/13 season (the most recent season in which data was accessible across all leagues).29 These winnings were not equally distributed, however. As Figure 1 shows, 80% of the top four tiers’ spoils were accumulated in the top 20 clubs in the top tier Premier League (which accounted for only 22% of all the clubs in the top four tiers). The remaining 20% of economic winnings was shared between 72 clubs in the other three tiers. The 24 clubs in the second tier Championship generated 14% of the revenue, or £435 million. The 24 clubs in third tier League One generated 4% of the revenue, or £120 million. The 24 clubs in fourth tier League Two generated 3% of the revenue, or £86 million.
Figure 1. Revenue Share Across the Top Four Tiers in the English Football League System
Premier League: 80% of total league system winnings (22%
of clubs in system)
Championship: 14% of total league system winnings (26% of
clubs in system)
League 1: 4% of total league system winnings (26% of clubs in system)
League 2: 3% of total league system winnings (26% of
clubs in system)
Top club share: 11.5%
Average club share: 4%
Top club share: 0.6%
Average club share: 0.58%
Average club share: 0.016%
Average club share: 0.0126%
Source: Data drawn from Deloitte publications on English football finances, various years.
gateways/accounting/accounting-by-industry/football-clubs). Kesenne, S. 2007. The Peculiar Economics of Professional Football in Europe, Scottish Journal of Political Economy 54(3), pp.388-399; Morrow, S. 2003. The People’s Game: Football, Finance and Society. London: Palgrave MacMillan; Szymanksi, S. 2012. Insolvency in English professional football: Irrational Exuberance or Negative Shocks? International Association of Sports Economists Working Paper No. 12-02.; Szymanski, S. 2015. Money and Football: A Soccernomics Guide. New York: Nation Books.; Szymanski, S., and Kuypers, T. 1999. Winners and Losers: The Business Strategy of Football, London: Viking Press. Szymanski, S., and Smith, R. 1997. The English Football Industry: Profit, Performance and Industrial Structure, International Review of Applied Economics, 11, pp. 135-153. 28 For a thorough discussion of the economic model of football clubs—and hence the ‘winnings’ these clubs are competing for—see Andreff and Staudohar (who have done particularly interesting work differentiating the Spectator-Subsidies-Sponsor-Local financing model (SSSL) and the Media-Corporations-Merchandising-Markets-Global model (MCMMG)). Andreff, W., and Staudohar, P. 2002. European and Sports Business Models. In Barros, I., and Szymanski, S. (Eds.). Transatlantic Sport: The Comparative Economics of North American and European Sports. Northampton: Edward Elgar, pp.23-49. 29 For a fuller analysis of the league system’s finances in 2013, see Andrews, M. and Harrington, P. 2015. Off Pitch: Football's Financial Integrity Weaknesses, and How to Strengthen Them. HKS Working Paper No. RWP16-009.

9
This data shows that there is varied distribution of economic winnings across the English football league system. The overall winner of the league system gets about 12% of the full economic winnings, with the average top tier club enjoying 4% of the entire system’s winnings. The average club in the next tier gets only 0.58% of the winnings, but this is high compared with the 0.016% and 0.0126% flowing to the average clubs in tiers three and four of this league system. The difference between the club at the top of all tiers and the average club sitting in the fourth tier is huge, with Manchester United earning about 2,400 times what a League Two club like Accrington Stanley earns (nearly £400 million compared with about £200,000).
This winnings gap is also reflected in wages earned by players in different tiers.30 The average player in the top paying club in the English Premier League earned £30 million in 2010, compared with £11 million pounds for the average Premier League player, and £200,000 in the next tier Championship, £70,000 in the next tier League One, and £38,000 in the next tier League Two. The difference, from top-to-bottom, is huge, with ‘winners’ in the top position Manchester United earning (on average) 1,500 times more than those playing in the fifth tier.
This evidence suggests that while there are many participants in this professional football league, the economic winners are few. The winning clubs and players win big but most clubs are just participants, and most of these participants (clubs or players) enjoy very little of the community’s spoils. This confirms what political commentator John Wright identifies as “extreme disparity” between a narrow set of ‘winners’ at the “top of football and those struggling at the bottom.”31 Hamish McRae, a columnist for the Independent, has a more direct view on the matter: “the few at the top [take] much of the pot” and leave the rest with very little.32
Has the share of economic winnings changed over time?
The economic situation in English football has changed in the last generation, and all participants in the league system have arguably benefited from the changes. Revenues have increased across all league tiers—with the aggregate winnings in English football growing exponentially between 1992 and the present.33 As an indicator of this growth, wages for football players have grown at a faster rate than the average English worker’s salary. The compound average growth rate of a player’s wages in even the fourth tier of English football was 6.3% between 1990 and 2010, compared with a growth rate of 4.3% for the average English wage.
30 The discussion on wages is based on Nick Harris’s analysis of wage rates in leading football leagues. (See the article in London’s Daily Mail: http://www.dailymail.co.uk/sport/football/article-2833020/Premier-League-wages-dwarf-Europe-flight-players-England-earning-average-2-3million-year.html). These data resonate with evidence in the 2015 SportingIntelligence Global Sports Salary Survey (http://www.globalsportssalaries.com/GSSS%202015.pdf). An exchange rate calculation produced the dollar estimates, based on an approximate rate of £1=$1.6. For similar analysis in other contexts, see also Papanikolaou, P. undated. The impact of the Bosman ruling on football leagues. (available at http://easm.avito.nl/download/2006/5f98f30070fb07eb80446bb568516415.pdf). 31 Wright, J. 2013. The Ugly Business of the Beautiful Game: How Football List its Soul. https://www.huffingtonpost.co.uk/john-wight/football-lost-its-soul_b_3433753.html 32 McRae, H. 2004. Economic View: A few winners, lots of losers. Independent. March 7, 2004. https://www.independent.co.uk/news/business/comment/economic-view-a-few-winners-lots-of-losers-72467.html 33 As in footnote 22, the discussion on wages is based on Nick Harris’s work on the subject.
10
In a sense, thus, ‘the tide has risen’ for all English football clubs. And all clubs (and players) should be better off as a result. But the gains have not been equally distributed, and the share of winnings has changed over time—being more concentrated at the top than it was a generation ago.
This is probably best exemplified in the differential rate of wage growth across tiers of the league system. Top tier Premier League salaries were about four times those in the 4th tier in 1990, for instance, but are now over 300 times larger. This is because top tier Premier League salaries grew at a compound annual growth rate of about 20% between 1990 and 2010, whereas growth rates were 6% in lower tiers. Wage growth in lower tiers was still higher than the growth rate in average English wages, but much lower than growth in higher tiers. This signals lower rates of ‘winning’ (in an economic sense) by players in lower tiers as compared with players in higher tiers. Players in top tiers seemed to have gained more from the newly globalized sector than those in lower tiers.
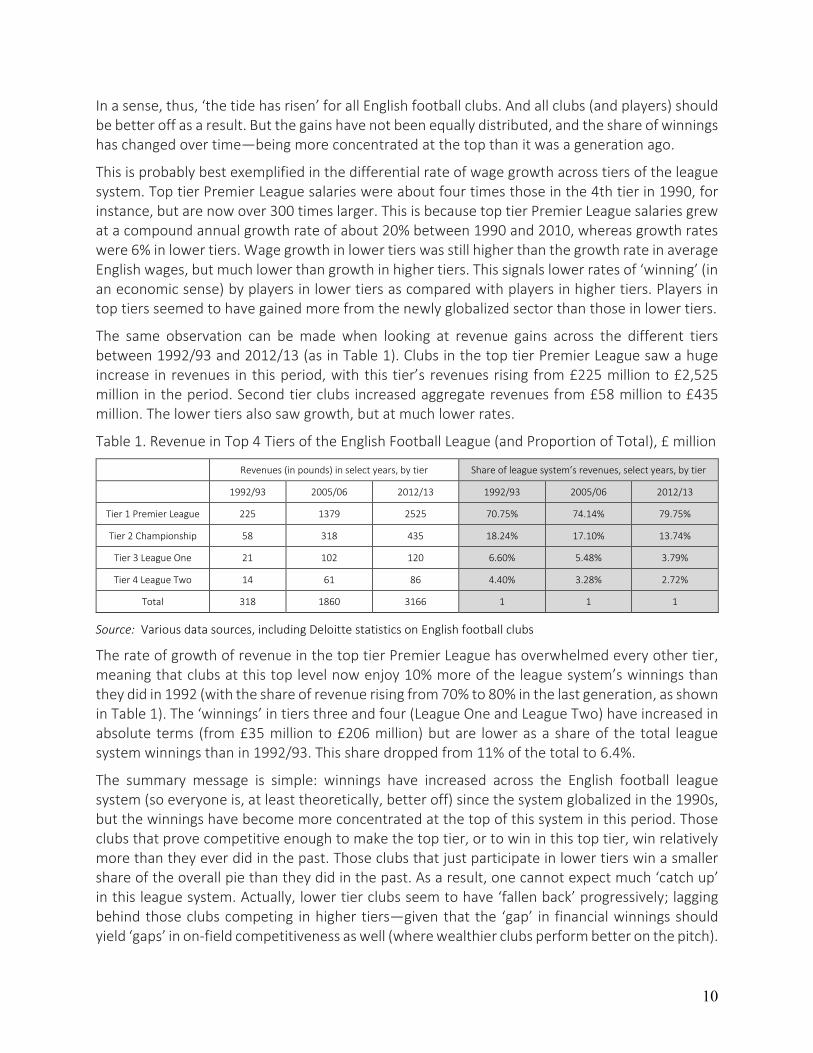
The same observation can be made when looking at revenue gains across the different tiers between 1992/93 and 2012/13 (as in Table 1). Clubs in the top tier Premier League saw a huge increase in revenues in this period, with this tier’s revenues rising from £225 million to £2,525 million in the period. Second tier clubs increased aggregate revenues from £58 million to £435 million. The lower tiers also saw growth, but at much lower rates.
Table 1. Revenue in Top 4 Tiers of the English Football League (and Proportion of Total), £ million
Revenues (in pounds) in select years, by tier Share of league system’s revenues, select years, by tier
1992/93 2005/06 2012/13 1992/93 2005/06 2012/13
Tier 1 Premier League 225 1379 2525 70.75% 74.14% 79.75%
Tier 2 Championship 58 318 435 18.24% 17.10% 13.74%
Tier 3 League One 21 102 120 6.60% 5.48% 3.79%
Tier 4 League Two 14 61 86 4.40% 3.28% 2.72%
Total 318 1860 3166 1 1 1
Source: Various data sources, including Deloitte statistics on English football clubs
The rate of growth of revenue in the top tier Premier League has overwhelmed every other tier, meaning that clubs at this top level now enjoy 10% more of the league system’s winnings than they did in 1992 (with the share of revenue rising from 70% to 80% in the last generation, as shown in Table 1). The ‘winnings’ in tiers three and four (League One and League Two) have increased in absolute terms (from £35 million to £206 million) but are lower as a share of the total league system winnings than in 1992/93. This share dropped from 11% of the total to 6.4%.
The summary message is simple: winnings have increased across the English football league system (so everyone is, at least theoretically, better off) since the system globalized in the 1990s, but the winnings have become more concentrated at the top of this system in this period. Those clubs that prove competitive enough to make the top tier, or to win in this top tier, win relatively more than they ever did in the past. Those clubs that just participate in lower tiers win a smaller share of the overall pie than they did in the past. As a result, one cannot expect much ‘catch up’ in this league system. Actually, lower tier clubs seem to have ‘fallen back’ progressively; lagging behind those clubs competing in higher tiers—given that the ‘gap’ in financial winnings should yield ‘gaps’ in on-field competitiveness as well (where wealthier clubs perform better on the pitch).
11
This relationship between off field and on field winnings is reflected in a high correlation between the off-field economic rank order of clubs (determined by annual revenues) and the league positions associated with on-field performance. In 2012/13, for instance, the top performing four clubs on the field were also the top four performers in terms of economic winnings (Manchester United, Manchester City, Chelsea, and Arsenal). Eight of the top ten on-field performers were also in the top ten list of revenue generators. Going beyond the ‘top of the table’ clubs, one finds a strong statistical correlation between on-field playing rankings (end of season results) and off-field economic rankings (revenue generation) for the top 50 clubs (where data on economic performance are accessible). This correlation was 0.88 in 2012/13.
The strong relationship between league status, playing performance, and economic winnings is not at all surprising. A virtuous cycle connects winning of all kinds in this league.34 Clubs win economically when they win on the field—becoming more popular among fans, more likely to be chosen for peak-hour and prime dollar broadcasts, and such. Clubs that win economically are also more likely to win on the field—because they can use economic winnings to set themselves up for playing success, especially by buying better players and managers and facilities.
This virtuous cycle has become stronger over time; as winners have taken home relatively more of the economic winnings and other participants go home with an increasingly lower share.
How economically ‘competitive’ is the system (do the same clubs always win)?
So far, the data shows that being in the top tiers of English football yields significant ‘winnings’ to clubs. It also shows a relationship between off-field and on-field winnings: in a virtuous cycle, clubs with higher financial gains tend to also enjoy higher end of season league positions.
So, which clubs are in the higher tiers, and winning? Are these the same clubs, year after year?
One way to look at this is to consider which clubs started in the top tiers (the Premier and Championship) in 1992 and were still in those leagues in 2016. The numbers are relatively high, especially considering just the clubs that started in the Premier League in 1992: 82% of these clubs were still in top tiers in 2016, playing in either the Premier League or the Championship, with 45% of the clubs still in the top Premier League itself. This means that—over a generation—clubs that started in the top tier had an 82% chance of staying in the top two tiers and a 45% chance of staying in the top tier itself. Beyond this, 62% of the clubs competing in either the Premier League or Championship in 1992 were still competing at this high level in 2016.
So, clubs playing in the top two tiers in 1992 were highly likely to still be there a generation later, suggesting a concentration of winning with a limited number of clubs.
34 For a discussion of this virtuous cycle, see Andrews, M. 2015. Being Special: The Rise of Super Clubs in European Football. Harvard Center for International Development Working Paper 299. See also Krabbenbos, T. 2013. Commercialization strategies in football. Thesis at University of Twente, covering work on Belgium and the Netherlands. http://essay.utwente.nl/62826/1/Masterthesis_TPKrabbenbos.pdf. See also the discussion of this issue in Tim Wigmore’s article on the topic (Wigmore, T. 2018. The Premier League is losing its competitive balance – that should be cause for concern. iNews. February 2, 2018. https://inews.co.uk/sport/football/premier-league-competitive-balance/).
12
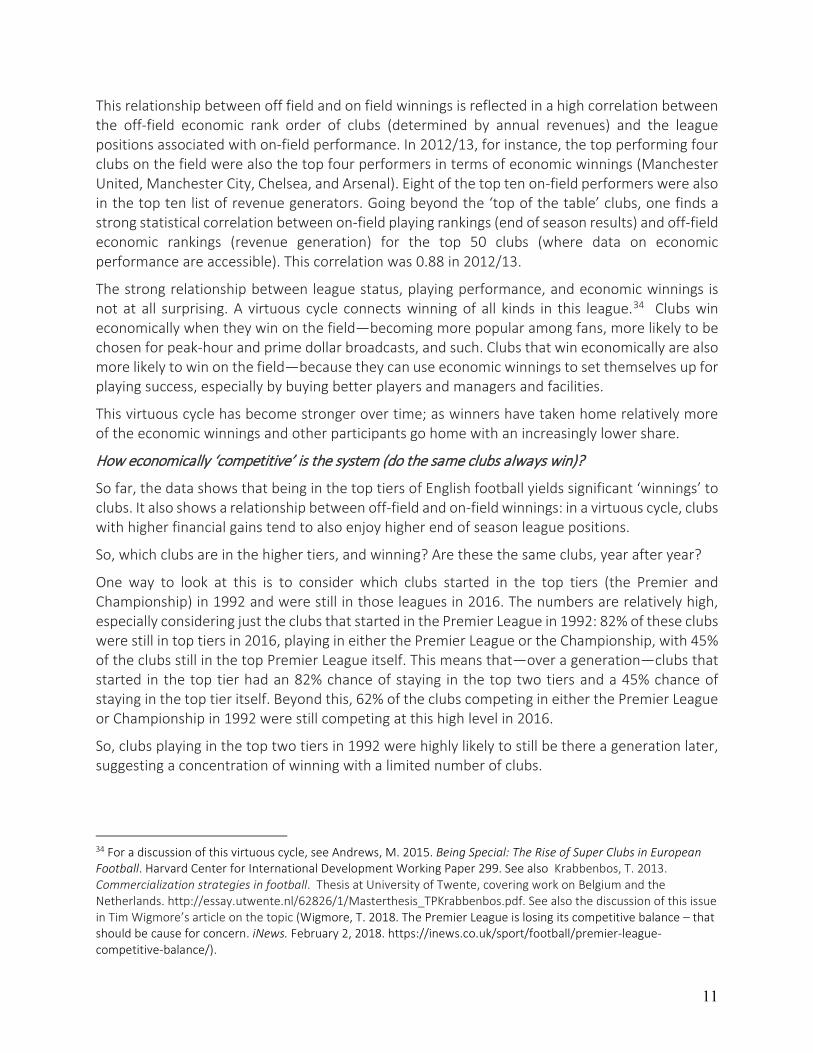
This analysis does not show the movement of clubs in the years between 1992 and 2016, however. There was quite a lot of such shifting in this period, with 47 clubs playing Premier League football in the 25 years. Figure 2 shows which other leagues these clubs played in over the period.
Figure 2. Number of clubs playing in the top league (47), and which other leagues they played in
7 clubs played only in Tier 1
10 clubs played in Tiers 1 and 2
22 clubs played in Tiers 1, 2 and 3 8 clubs played in Tiers 1, 2, 3 and 4
Source: Author’s analysis of club performances across seasons.
This group of 47 Premier League contenders was drawn from the 92 league clubs in the top four tiers in 1992. This means that 52% of all clubs playing in the four tiers in 1992 played at least one Premier League season between 1992 and 2016. This is a high number. As the figure shows, only 7 of these clubs played in just the top tier Premier League in this period. A similar number (8 clubs) played in all four tiers in the football league system in this period.
In all, over 80% of clubs that played in the top tier also played in lower tiers.
This evidence suggests that while many clubs that started in the Premier League or Championship in 1992 ended up there in 2016, the set of clubs that moved in and out of the top tier during the entire period was actually quite large. Of particular interest is the finding that 26% of clubs that started in tiers three or four of English football in 1992/93 made it to the Premier League at some point during the last generation. So, some clubs can rise to this top tier (which will be discussed in more detail later). However, further data does shows that most of these clubs do not win in that top tier. Rather, a small subset dominates the tier’s winnings.
Consider, for instance, that the top ten tier one clubs (by income) in 2016/17 accounted for 47% of all performances in the Premier League in the last 25 years.35 What this means is that 229 of 484 seasons played in the top league in that period were occupied by just ten clubs—that are also the biggest economic winners—Manchester United, Arsenal, Chelsea, Liverpool, Tottenham Hotspur, Everton, Aston Villa, Newcastle United, Manchester City, and West Ham United. Put differently, these ten clubs participated in over 8,500 of the 18,000 matches played in the Premier League between 1992 and 2016. These matches symbolize the opportunities to ‘win’ and earn money in the top tier. Ten clubs benefited from nearly half of these opportunities—with the remaining 37 clubs splitting the other half.
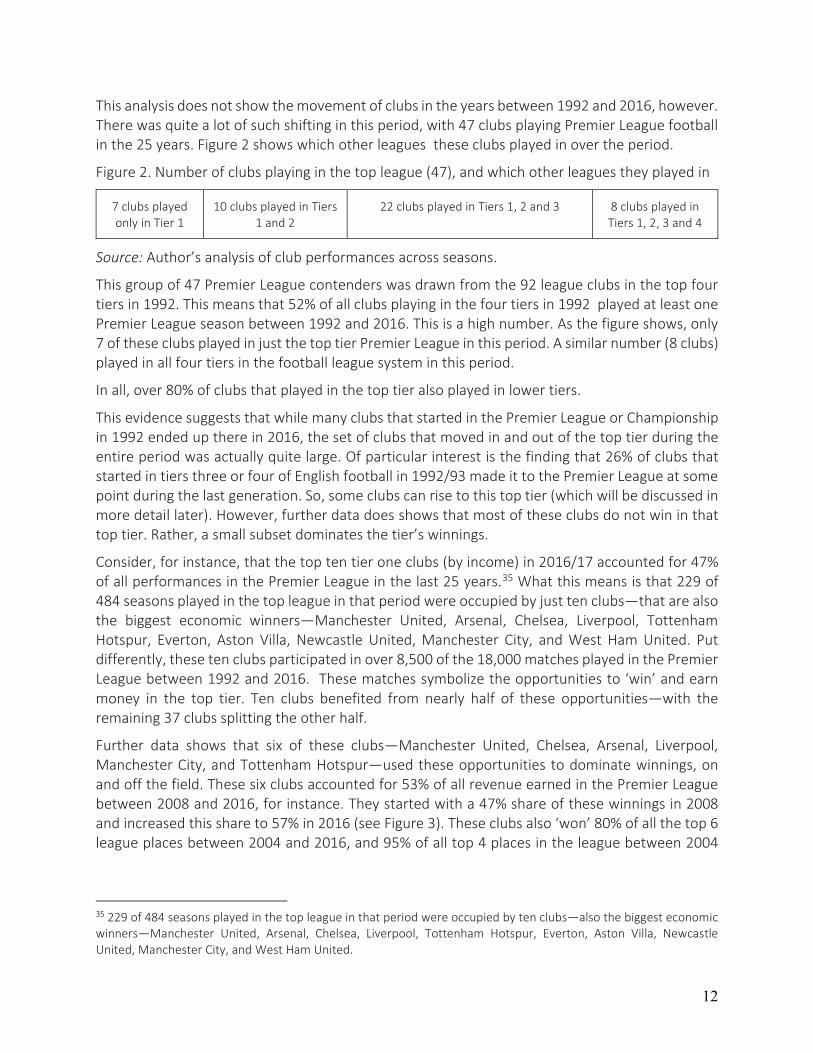
Further data shows that six of these clubs—Manchester United, Chelsea, Arsenal, Liverpool, Manchester City, and Tottenham Hotspur—used these opportunities to dominate winnings, on and off the field. These six clubs accounted for 53% of all revenue earned in the Premier League between 2008 and 2016, for instance. They started with a 47% share of these winnings in 2008 and increased this share to 57% in 2016 (see Figure 3). These clubs also ‘won’ 80% of all the top 6 league places between 2004 and 2016, and 95% of all top 4 places in the league between 2004
35 229 of 484 seasons played in the top league in that period were occupied by ten clubs—also the biggest economic winners—Manchester United, Arsenal, Chelsea, Liverpool, Tottenham Hotspur, Everton, Aston Villa, Newcastle United, Manchester City, and West Ham United.
13
and 2016. Three of these clubs (Chelsea, Manchester City, and Manchester United) won every Premier League title in this period, but one—the 2015 championship that went to Leicester City.
Figure 3. Premier League Revenues, Top 6 Clubs and Other 14 Clubs (2008-2016)
Source: Authors’ analysis of various sources.
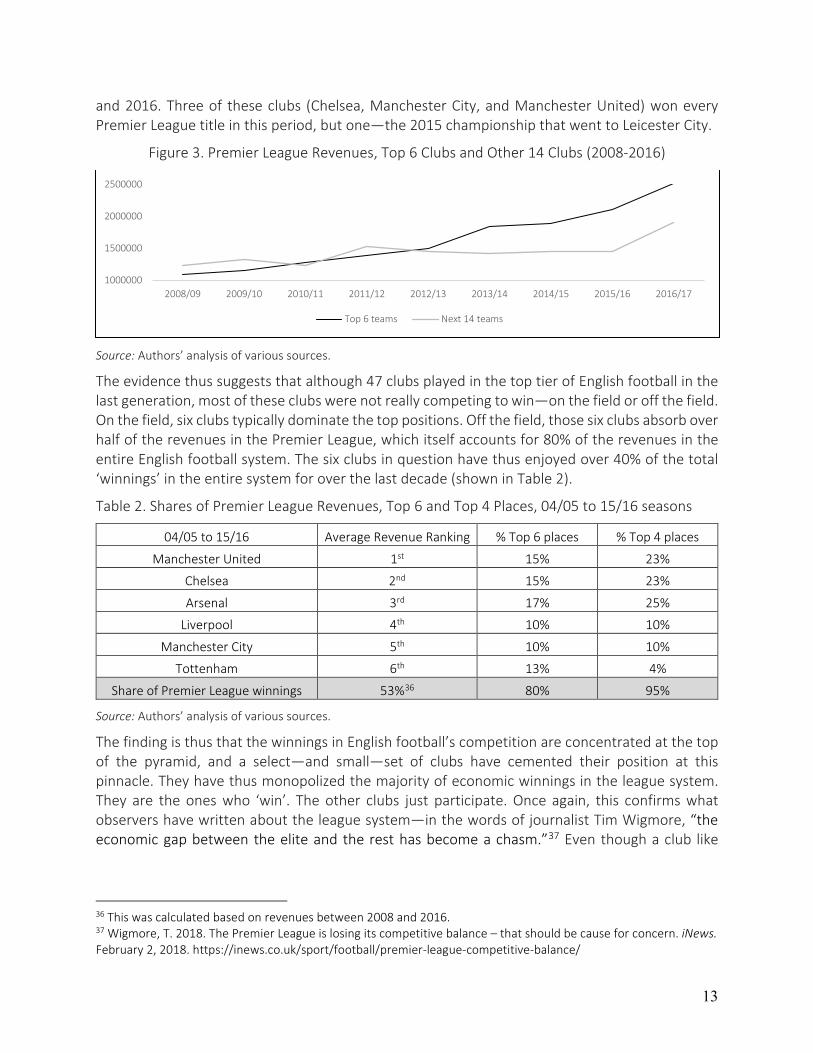
The evidence thus suggests that although 47 clubs played in the top tier of English football in the last generation, most of these clubs were not really competing to win—on the field or off the field. On the field, six clubs typically dominate the top positions. Off the field, those six clubs absorb over half of the revenues in the Premier League, which itself accounts for 80% of the revenues in the entire English football system. The six clubs in question have thus enjoyed over 40% of the total ‘winnings’ in the entire system for over the last decade (shown in Table 2).
Table 2. Shares of Premier League Revenues, Top 6 and Top 4 Places, 04/05 to 15/16 seasons
04/05 to 15/16 Average Revenue Ranking % Top 6 places % Top 4 places
Manchester United 1st 15% 23%
Chelsea 2nd 15% 23%
Arsenal 3rd 17% 25%
Liverpool 4th 10% 10%
Manchester City 5th 10% 10%
Tottenham 6th 13% 4%
Share of Premier League winnings 53%36 80% 95%
Source: Authors’ analysis of various sources.
The finding is thus that the winnings in English football’s competition are concentrated at the top of the pyramid, and a select—and small—set of clubs have cemented their position at this pinnacle. They have thus monopolized the majority of economic winnings in the league system. They are the ones who ‘win’. The other clubs just participate. Once again, this confirms what observers have written about the league system—in the words of journalist Tim Wigmore, “the economic gap between the elite and the rest has become a chasm.”37 Even though a club like
36 This was calculated based on revenues between 2008 and 2016. 37 Wigmore, T. 2018. The Premier League is losing its competitive balance – that should be cause for concern. iNews. February 2, 2018. https://inews.co.uk/sport/football/premier-league-competitive-balance/
1000000
1500000
2000000
2500000
2008/09 2009/10 2010/11 2011/12 2012/13 2013/14 2014/15 2015/16 2016/17
Top 6 teams Next 14 teams

14
Leicester City might have risen to win a title in 2015, it is indeed the rarest of exception to the rule. The rule is simply that most clubs are progessively ‘falling back’ behind a small group of winners.
How regularly do lower tier clubs rise (is the ‘hope of winning’ real for these clubs)?
So, what can be made of Leicester City’s 2015 Premier League title win? It is an example, surely, of the potential to ‘catch up’ in the modern English football league, having risen from the third tier of the league in 2008 to win the entire league in just seven years?
Beyond Leicester, we see that a number of clubs have made it into the top tier of English football over the last generation—often rising from lower tiers. Table 3 illustrates this kind of movement with a sample of end of season league positions (rank) and tiers for 20 of the 117 clubs included in my overall database (of clubs that were in one of the top 4 tiers in both 1992/93 and 2016/17).
Table 3. A Sample of 24 English Football Clubs Showing Rank and League in 1992/93 and 2016/17 Rank 92/93 Club
Tier 92/93
Rank 16/17 Club Tier 16/17
Rank change Tier Change
1 Manchester United (C) 1 6 Manchester United 1 - 5 0
2 Aston Villa 1 33 Aston Villa 2 -31 -1
3 Norwich City 1 28 Norwich City 2 -25 -1
4 Blackburn Rovers 1 42 Blackburn Rovers 2 -38 -1
5 Queens Park Rangers 1 38 Queens Park Rangers 2 -33 -1
6 Liverpool 1 4 Liverpool 1 2 0
7 Sheffield Wednesday 1 24 Sheffield Wednesday 2 -17 -1
8 Tottenham Hotspur 1 2 Tottenham Hotspur 1 6 0
9 Manchester City 1 3 Manchester City 1 6 0
10 Arsenal 1 5 Arsenal 1 5 0
28 Leicester City 2 12 Leicester City 1 -16 +1
47 Stoke City 3 13 Stoke City 1 34 + 2
50 West Bromwich Albion 3 10 West Bromwich
Albion 1 40 + 2
51 Swansea City 3 15 Swansea City 1 36 + 2
52 Stockport County 3 128 Stockport County 5 -76 -2
53 Leyton Orient 3 92 Leyton Orient 4 -39 -1
61 Huddersfield Town 3 25 Huddersfield Town 2 36 1
62 Hartlepool United 3 91 Hartlepool United 4 -29 -1
63 Bournemouth 3 9 AFC Bournemouth 1 54 + 2
64 Blackpool 3 75 Blackpool 4 -11 -1
65 Exeter City 3 73 Exeter City 4 -8 -1
66 Hull City 3 18 Hull City 1 48 + 2
The table should be read as follows, using the first row as an example: Manchester United was ranked 1st in 1992/93, having won tier 1 in that year; the same club was ranked 6th in 2016/17, having finished 6th in tier 1 that year; the rank change between these periods was -5 (a drop from 1 to 6) but there was no tier change (given that the club played in the top tier in both years). Using
15
another example, of Leicester City (shaded): the club was ranked 28th in 1992/93, in tier 2 of English football (now called the Championship) and improved its ranking to 12th in 2016 (a rank change of -16) in jumping to the tier 1 Premier League.
Reading the table through, one can see that some clubs in this sample saw significant rank and tier shifts changes between the two years. Hull City (bolded, at the bottom of the table), for instance, was ranked 66th in 1992/93 but rose to a rank of 18th in 2016/17, having leapfrogged two tiers from the third tier (League One) to the first tier (Premier League). Other clubs that leapfrogged two tiers (also shown in bold) include AFC Bournemouth, Swansea City, West Bromwich Albion, and Stoke City. AFC Bournemouth recorded the highest ranking improvement over the period, rising from 63rd in 1992 to 9th in 2016. In contrast, Stockport County dropped 76 places from 52nd to 128th (plummeting from the third to fifth tier National League).
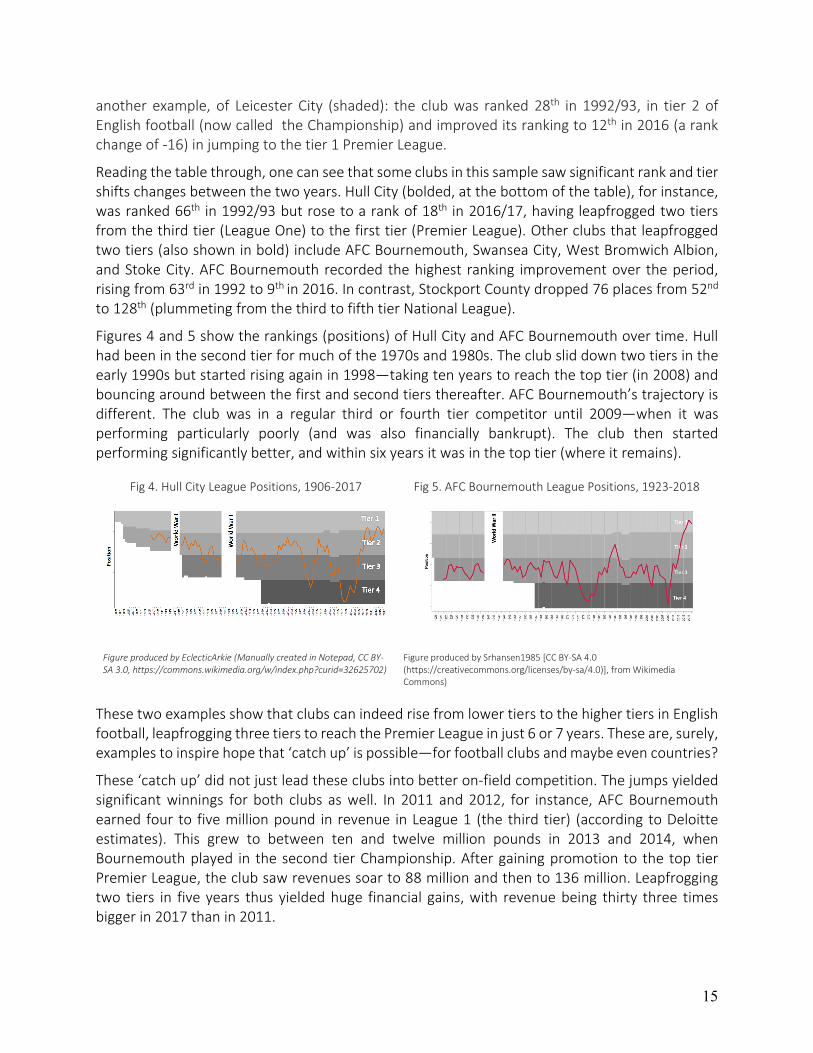
Figures 4 and 5 show the rankings (positions) of Hull City and AFC Bournemouth over time. Hull had been in the second tier for much of the 1970s and 1980s. The club slid down two tiers in the early 1990s but started rising again in 1998—taking ten years to reach the top tier (in 2008) and bouncing around between the first and second tiers thereafter. AFC Bournemouth’s trajectory is different. The club was in a regular third or fourth tier competitor until 2009—when it was performing particularly poorly (and was also financially bankrupt). The club then started performing significantly better, and within six years it was in the top tier (where it remains).
Fig 4. Hull City League Positions, 1906-2017 Fig 5. AFC Bournemouth League Positions, 1923-2018
Figure produced by EclecticArkie (Manually created in Notepad, CC BY-SA 3.0, https://commons.wikimedia.org/w/index.php?curid=32625702)
Figure produced by Srhansen1985 [CC BY-SA 4.0 (https://creativecommons.org/licenses/by-sa/4.0)], from Wikimedia Commons)
These two examples show that clubs can indeed rise from lower tiers to the higher tiers in English football, leapfrogging three tiers to reach the Premier League in just 6 or 7 years. These are, surely, examples to inspire hope that ‘catch up’ is possible—for football clubs and maybe even countries?
These ‘catch up’ did not just lead these clubs into better on-field competition. The jumps yielded significant winnings for both clubs as well. In 2011 and 2012, for instance, AFC Bournemouth earned four to five million pound in revenue in League 1 (the third tier) (according to Deloitte estimates). This grew to between ten and twelve million pounds in 2013 and 2014, when Bournemouth played in the second tier Championship. After gaining promotion to the top tier Premier League, the club saw revenues soar to 88 million and then to 136 million. Leapfrogging two tiers in five years thus yielded huge financial gains, with revenue being thirty three times bigger in 2017 than in 2011.
16
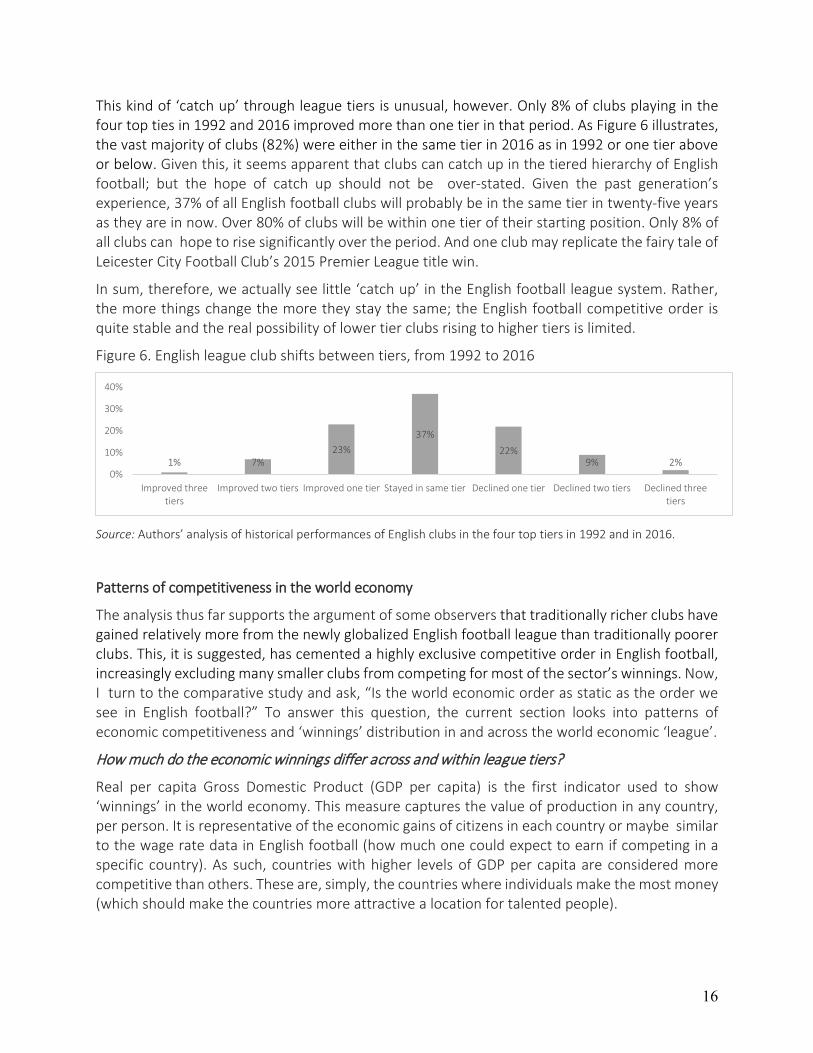
This kind of ‘catch up’ through league tiers is unusual, however. Only 8% of clubs playing in the four top ties in 1992 and 2016 improved more than one tier in that period. As Figure 6 illustrates, the vast majority of clubs (82%) were either in the same tier in 2016 as in 1992 or one tier above or below. Given this, it seems apparent that clubs can catch up in the tiered hierarchy of English football; but the hope of catch up should not be over-stated. Given the past generation’s experience, 37% of all English football clubs will probably be in the same tier in twenty-five years as they are in now. Over 80% of clubs will be within one tier of their starting position. Only 8% of all clubs can hope to rise significantly over the period. And one club may replicate the fairy tale of Leicester City Football Club’s 2015 Premier League title win.
In sum, therefore, we actually see little ‘catch up’ in the English football league system. Rather, the more things change the more they stay the same; the English football competitive order is quite stable and the real possibility of lower tier clubs rising to higher tiers is limited.
Figure 6. English league club shifts between tiers, from 1992 to 2016
Source: Authors’ analysis of historical performances of English clubs in the four top tiers in 1992 and in 2016.
Patterns of competitiveness in the world economy
The analysis thus far supports the argument of some observers that traditionally richer clubs have gained relatively more from the newly globalized English football league than traditionally poorer clubs. This, it is suggested, has cemented a highly exclusive competitive order in English football, increasingly excluding many smaller clubs from competing for most of the sector’s winnings. Now, I turn to the comparative study and ask, “Is the world economic order as static as the order we see in English football?” To answer this question, the current section looks into patterns of economic competitiveness and ‘winnings’ distribution in and across the world economic ‘league’.
How much do the economic winnings differ across and within league tiers?
Real per capita Gross Domestic Product (GDP per capita) is the first indicator used to show ‘winnings’ in the world economy. This measure captures the value of production in any country, per person. It is representative of the economic gains of citizens in each country or maybe similar to the wage rate data in English football (how much one could expect to earn if competing in a specific country). As such, countries with higher levels of GDP per capita are considered more competitive than others. These are, simply, the countries where individuals make the most money (which should make the countries more attractive a location for talented people).
1% 7%23%
37%
22%9% 2%
0%
10%
20%
30%
40%
Improved threetiers
Improved two tiers Improved one tier Stayed in same tier Declined one tier Declined two tiers Declined threetiers

17
Table 4 shows how GDP per capita ‘winnings’ were distributed in 2016, across 182 countries organized into five tiers (with the top tier 1 being the quintile of wealthiest countries and the lowest quintile tier 5 being the poorest countries).
Table 4. Differences in GDP per capita, by country tier, 2016
Tier 1, 2016
Tier 2, 2016
Tier 3, 2016
Tier 4, 2016
Tier 5, 2016
Average GDP per capita ($, constant 2011 values, ppp controlled)
$50,187 $21,458 $12,060 $4,677 $3,438
Distance from top league 0 $28,729 $38,126 $45,509 $46,748
Source: Data on real 2011 per capita incomes (PPP) from World Development Indicators (WDIs)
As the table shows, average GDP per capita in tier 1 countries was $50,187 in 2016. This was over twice the average GDP per capita in tier 2 countries (with an average of $21,458), and over four times the average in tier 3 countries (where the average was $12,060), and more than ten times that of average incomes in tier 4 countries (where averages were $4,677). Tier 1 countries had per capita incomes about 15 times those in tier 5 countries, with residents in the wealthier countries enjoying over $46,748 more income than citizens in tier 5 countries.
Given this measure, the distribution of income is not quite as severe as one finds in the English football league in 2016. It is still very unequal, however, which suggests that countries in different tiers are differently competitive. Tier 1 countries will be able to attract the best and brightest talent in the world more easily than other countries (because they can promise them higher incomes), which one expects will help these countries attract high-value-producing firms (looking for talent), which one expects will maintain a winning edge in these countries.
Gross Domestic Product (GDP) was used as the second indicator of economic winnings in the world economy. This measure captures the value of overall production in any country; representing how much a country is able to attract, support, maintain, and expand business. Countries with higher levels of GDP are considered more competitive than others. Given such rationale, the world economy had aggregate economic production winnings of $77 trillion in 2016 (using data from 178 countries, with GDP for each measured at constant 2010 prices).
Figure 7. Global GDP Share Across the World Economic League System
1st Quintile: 88% of total league system winnings (20% of clubs in
system)
2nd Quintile: 7% of total league system winnings (20%
of clubs in system)
3rd Quintile: 1.5% of total league system winnings (20% of clubs in system)
4th Quintile: 0.52% of total league system winnings (20% of clubs in system)
Top country share: 22%
Average country share: 2.5%
Average country share: 0.19%
Average club share: 0.04% Average club share: 0.014%
Source: Data on real 2011 per capita incomes (PPP) from World Development Indicators (WDIs)
The United States of America (USA) was the overall winner of this league, as the top producing country (akin to the Manchester United of the English football league) with a GDP of $17 trillion. China (akin to Manchester City, perhaps) was second, with a GDP of about $9 trillion. As shown in Figure 7, the top tier of countries in 2016 (in the top quintile of 178 countries) enjoyed 88% of the system’s winnings. The remaining 80% of countries shared 12% of the spoils.
18
The details in Figure 7 should make it clear that a huge gap exists between the few competitive countries (that produce most of the world’s value because they attract, keep and grow more business) and the rest. The USA—sitting in top spot across all tiers of the league—has a GDP that is 11,269 times bigger than that of the Central African Republic (CAR) (a country in the 5th quintile—perhaps like Aldershot Town in the English football league—where GDP is about $1.5 billion). This gap is, of course, biased; because the USA has a much bigger population than the CAR. Accounting for the size difference, the USA has a per capita GDP of about $54,000, which is 87 times the per capita GDP of the Central African Republic (where the value is $650).
This is still a very significant gap, and shows that the global economic league system in 2016 looks very similar to the English football league system in 2016. There are few true competitors in the top league who absorb most of the winnings. Most other league members are just participating, with limited gains from such participation.
Has the share of economic winnings changed over time?
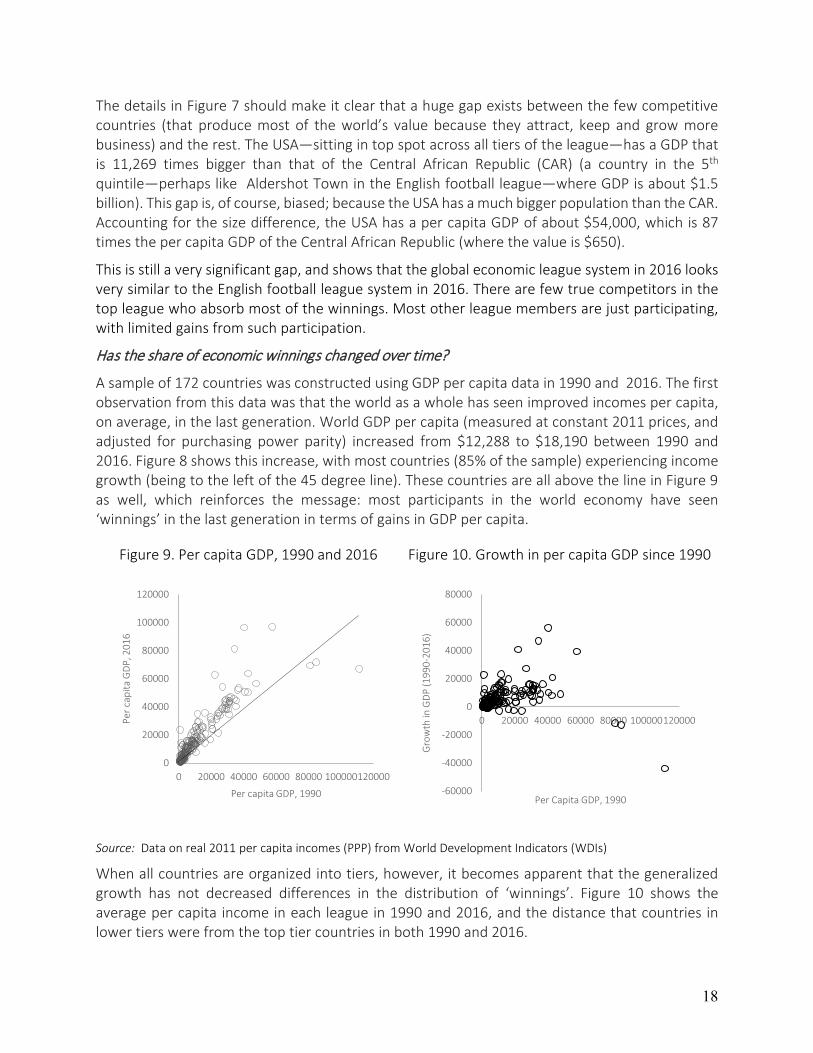
A sample of 172 countries was constructed using GDP per capita data in 1990 and 2016. The first observation from this data was that the world as a whole has seen improved incomes per capita, on average, in the last generation. World GDP per capita (measured at constant 2011 prices, and adjusted for purchasing power parity) increased from $12,288 to $18,190 between 1990 and 2016. Figure 8 shows this increase, with most countries (85% of the sample) experiencing income growth (being to the left of the 45 degree line). These countries are all above the line in Figure 9 as well, which reinforces the message: most participants in the world economy have seen ‘winnings’ in the last generation in terms of gains in GDP per capita.
Figure 9. Per capita GDP, 1990 and 2016 Figure 10. Growth in per capita GDP since 1990
Source: Data on real 2011 per capita incomes (PPP) from World Development Indicators (WDIs)
When all countries are organized into tiers, however, it becomes apparent that the generalized growth has not decreased differences in the distribution of ‘winnings’. Figure 10 shows the average per capita income in each league in 1990 and 2016, and the distance that countries in lower tiers were from the top tier countries in both 1990 and 2016.
0
20000
40000
60000
80000
100000
120000
0 20000 40000 60000 80000 100000120000
Per c
apita
GD
P, 2
016
Per capita GDP, 1990 -60000
-40000
-20000
0
20000
40000
60000
80000
0 20000 40000 60000 80000 100000120000
Gro
wth
in G
DP
(199
0-20
16)
Per Capita GDP, 1990
19
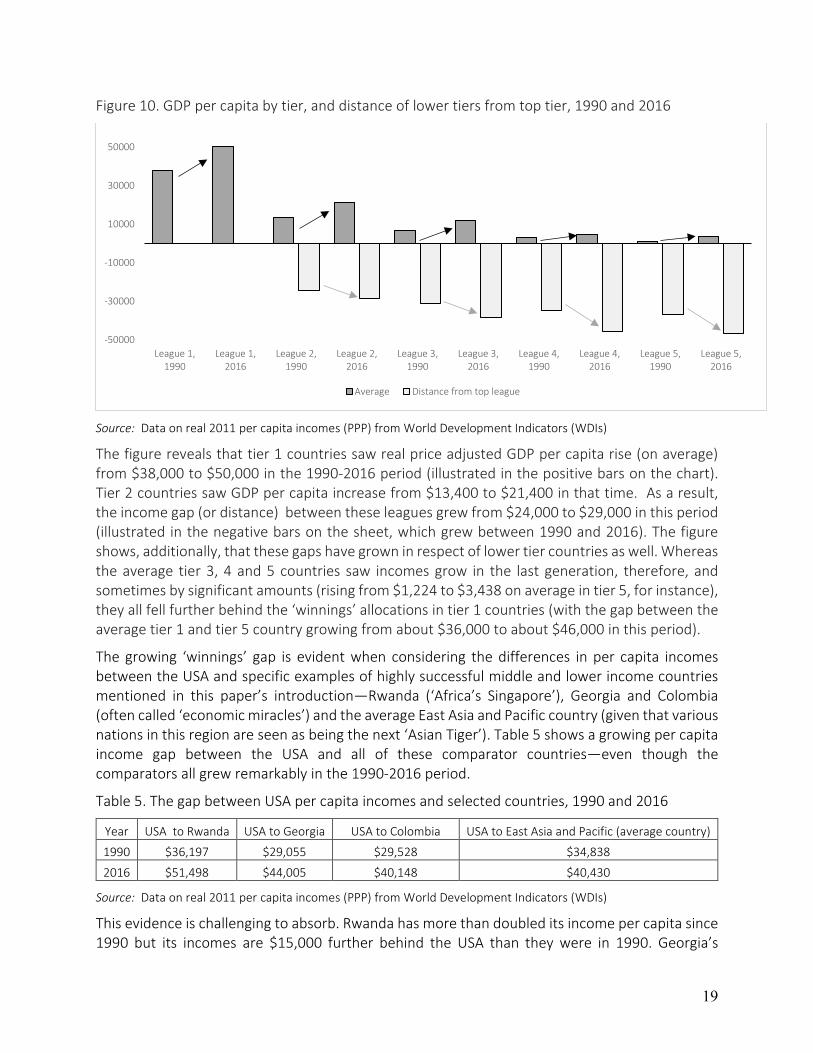
Figure 10. GDP per capita by tier, and distance of lower tiers from top tier, 1990 and 2016
Source: Data on real 2011 per capita incomes (PPP) from World Development Indicators (WDIs)
The figure reveals that tier 1 countries saw real price adjusted GDP per capita rise (on average) from $38,000 to $50,000 in the 1990-2016 period (illustrated in the positive bars on the chart). Tier 2 countries saw GDP per capita increase from $13,400 to $21,400 in that time. As a result, the income gap (or distance) between these leagues grew from $24,000 to $29,000 in this period (illustrated in the negative bars on the sheet, which grew between 1990 and 2016). The figure shows, additionally, that these gaps have grown in respect of lower tier countries as well. Whereas the average tier 3, 4 and 5 countries saw incomes grow in the last generation, therefore, and sometimes by significant amounts (rising from $1,224 to $3,438 on average in tier 5, for instance), they all fell further behind the ‘winnings’ allocations in tier 1 countries (with the gap between the average tier 1 and tier 5 country growing from about $36,000 to about $46,000 in this period).
The growing ‘winnings’ gap is evident when considering the differences in per capita incomes between the USA and specific examples of highly successful middle and lower income countries mentioned in this paper’s introduction—Rwanda (‘Africa’s Singapore’), Georgia and Colombia (often called ‘economic miracles’) and the average East Asia and Pacific country (given that various nations in this region are seen as being the next ‘Asian Tiger’). Table 5 shows a growing per capita income gap between the USA and all of these comparator countries—even though the comparators all grew remarkably in the 1990-2016 period.
Table 5. The gap between USA per capita incomes and selected countries, 1990 and 2016
Year USA to Rwanda USA to Georgia USA to Colombia USA to East Asia and Pacific (average country)
1990 $36,197 $29,055 $29,528 $34,838
2016 $51,498 $44,005 $40,148 $40,430
Source: Data on real 2011 per capita incomes (PPP) from World Development Indicators (WDIs)
This evidence is challenging to absorb. Rwanda has more than doubled its income per capita since 1990 but its incomes are $15,000 further behind the USA than they were in 1990. Georgia’s
-50000
-30000
-10000
10000
30000
50000
League 1,1990
League 1,2016
League 2,1990
League 2,2016
League 3,1990
League 3,2016
League 4,1990
League 4,2016
League 5,1990
League 5,2016
Average Distance from top league
20
incomes per capita have also risen in an absolute sense but fallen behind USA incomes per capita by about $15,000. The gaps have grown in respect of Colombia and the average East Asian and Pacific country as well (but not by as much).
These growing income gaps are not evidence of ‘catch up’ by these countries. Indeed, the growing gaps suggest that developing countries may be doing better as participants of the world economy, and gain in terms of higher per capita incomes, but traditionally wealthy countries continue to dominate the winnings and may be dominating more than in the past. As these countries dominate the winnings, we should expect that to also dominate the means of winning. For instance, one expects that the USA and other top tier countries continue to attract the most talented people from places like Rwanda and Georgia and Colombia with significantly higher incomes. This is much like we saw in the English football league system, where Premier League clubs have been able to pay significantly more money to players over time—such that “the economic gap between the elite and the rest has become a chasm.”38
One sees a similar pattern of change when looking at world GDP shares. As with GDP per capita, most countries have experienced GDP growth in the last generation. The growth has been felt all over. East Asia added $10 trillion in value to the regional economy between 1990 and 2016 (measured in constant 2010 dollars), for instance; Latin America and the Caribbean added about $3 trillion, South Asia about $2.3 trillion, and Africa over $1 trillion.
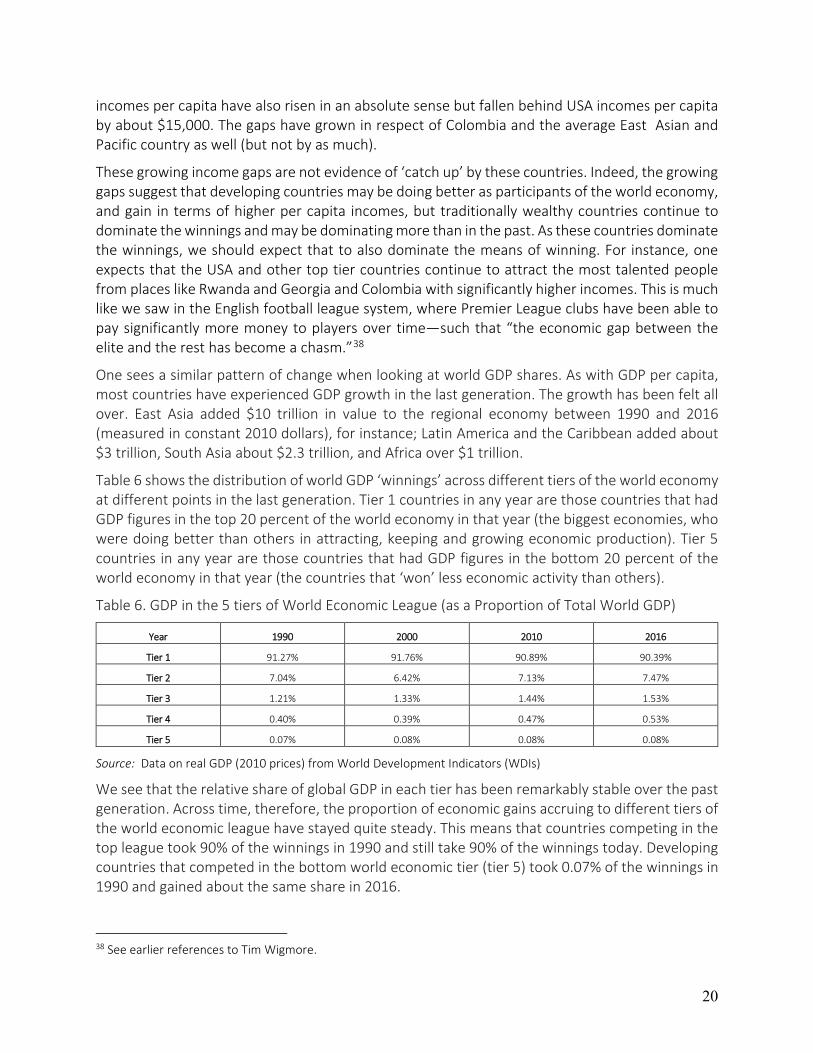
Table 6 shows the distribution of world GDP ‘winnings’ across different tiers of the world economy at different points in the last generation. Tier 1 countries in any year are those countries that had GDP figures in the top 20 percent of the world economy in that year (the biggest economies, who were doing better than others in attracting, keeping and growing economic production). Tier 5 countries in any year are those countries that had GDP figures in the bottom 20 percent of the world economy in that year (the countries that ‘won’ less economic activity than others).
Table 6. GDP in the 5 tiers of World Economic League (as a Proportion of Total World GDP)
Year 1990 2000 2010 2016
Tier 1 91.27% 91.76% 90.89% 90.39%
Tier 2 7.04% 6.42% 7.13% 7.47%
Tier 3 1.21% 1.33% 1.44% 1.53%
Tier 4 0.40% 0.39% 0.47% 0.53%
Tier 5 0.07% 0.08% 0.08% 0.08%
Source: Data on real GDP (2010 prices) from World Development Indicators (WDIs)
We see that the relative share of global GDP in each tier has been remarkably stable over the past generation. Across time, therefore, the proportion of economic gains accruing to different tiers of the world economic league have stayed quite steady. This means that countries competing in the top league took 90% of the winnings in 1990 and still take 90% of the winnings today. Developing countries that competed in the bottom world economic tier (tier 5) took 0.07% of the winnings in 1990 and gained about the same share in 2016.
38 See earlier references to Tim Wigmore.
21
Summing this evidence, it seems that the world economy’s winners have always won big. Other participants receive much less. Just as one sees in the English football league system.
How economically ‘competitive’ is the system (do the same countries always win)?
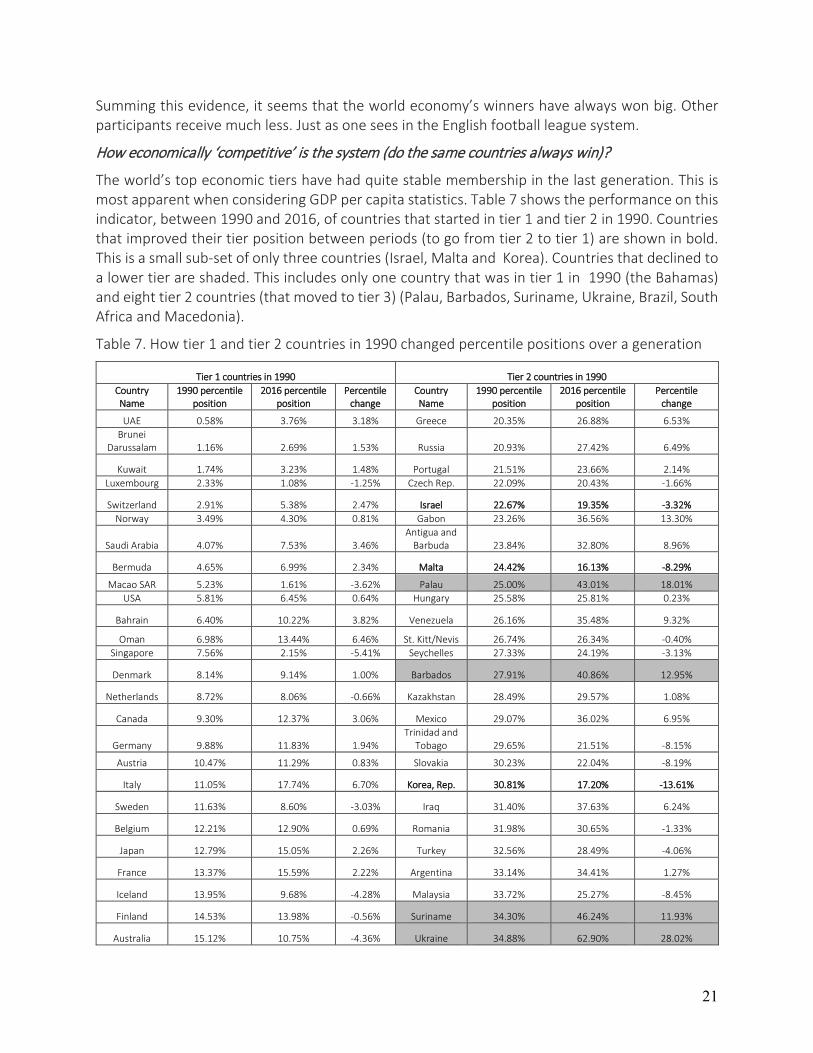
The world’s top economic tiers have had quite stable membership in the last generation. This is most apparent when considering GDP per capita statistics. Table 7 shows the performance on this indicator, between 1990 and 2016, of countries that started in tier 1 and tier 2 in 1990. Countries that improved their tier position between periods (to go from tier 2 to tier 1) are shown in bold. This is a small sub-set of only three countries (Israel, Malta and Korea). Countries that declined to a lower tier are shaded. This includes only one country that was in tier 1 in 1990 (the Bahamas) and eight tier 2 countries (that moved to tier 3) (Palau, Barbados, Suriname, Ukraine, Brazil, South Africa and Macedonia).
Table 7. How tier 1 and tier 2 countries in 1990 changed percentile positions over a generation
Tier 1 countries in 1990 Tier 2 countries in 1990 Country Name
1990 percentile position
2016 percentile position
Percentile change
Country Name
1990 percentile position
2016 percentile position
Percentile change
UAE 0.58% 3.76% 3.18% Greece 20.35% 26.88% 6.53% Brunei
Darussalam 1.16% 2.69% 1.53% Russia 20.93% 27.42% 6.49%
Kuwait 1.74% 3.23% 1.48% Portugal 21.51% 23.66% 2.14% Luxembourg 2.33% 1.08% -1.25% Czech Rep. 22.09% 20.43% -1.66%
Switzerland 2.91% 5.38% 2.47% Israel 22.67% 19.35% -3.32% Norway 3.49% 4.30% 0.81% Gabon 23.26% 36.56% 13.30%
Saudi Arabia 4.07% 7.53% 3.46% Antigua and
Barbuda 23.84% 32.80% 8.96%
Bermuda 4.65% 6.99% 2.34% Malta 24.42% 16.13% -8.29%
Macao SAR 5.23% 1.61% -3.62% Palau 25.00% 43.01% 18.01% USA 5.81% 6.45% 0.64% Hungary 25.58% 25.81% 0.23%
Bahrain 6.40% 10.22% 3.82% Venezuela 26.16% 35.48% 9.32%
Oman 6.98% 13.44% 6.46% St. Kitt/Nevis 26.74% 26.34% -0.40% Singapore 7.56% 2.15% -5.41% Seychelles 27.33% 24.19% -3.13%
Denmark 8.14% 9.14% 1.00% Barbados 27.91% 40.86% 12.95%
Netherlands 8.72% 8.06% -0.66% Kazakhstan 28.49% 29.57% 1.08%
Canada 9.30% 12.37% 3.06% Mexico 29.07% 36.02% 6.95%
Germany 9.88% 11.83% 1.94% Trinidad and
Tobago 29.65% 21.51% -8.15%
Austria 10.47% 11.29% 0.83% Slovakia 30.23% 22.04% -8.19%
Italy 11.05% 17.74% 6.70% Korea, Rep. 30.81% 17.20% -13.61%
Sweden 11.63% 8.60% -3.03% Iraq 31.40% 37.63% 6.24%
Belgium 12.21% 12.90% 0.69% Romania 31.98% 30.65% -1.33%
Japan 12.79% 15.05% 2.26% Turkey 32.56% 28.49% -4.06%
France 13.37% 15.59% 2.22% Argentina 33.14% 34.41% 1.27%
Iceland 13.95% 9.68% -4.28% Malaysia 33.72% 25.27% -8.45%
Finland 14.53% 13.98% -0.56% Suriname 34.30% 46.24% 11.93%
Australia 15.12% 10.75% -4.36% Ukraine 34.88% 62.90% 28.02%
22
Hong Kong 15.70% 5.91% -9.78% Brazil 35.47% 44.09% 8.62% United
Kingdom 16.28% 14.52% -1.76% Poland 36.05% 24.73% -11.32%
Puerto Rico 16.86% 18.28% 1.42% Algeria 36.63% 44.62% 8.00%
Bahamas 17.44% 31.18% 13.74% Iran 37.21% 38.17% 0.96%
New Zealand 18.02% 16.67% -1.36% South Africa 37.79% 48.92% 11.13%
Spain 18.60% 18.82% 0.21% Uruguay 38.37% 33.33% -5.04%
Cyprus 19.19% 19.89% 0.71% Macedonia 38.95% 46.77% 7.82%
Ireland 9 4.84%
19.77% 4.84% -14.93% Bulgaria 39.53% 34.95% -4.59%
Source: Data on real 2011 per capita incomes (PPP) from World Development Indicators (WDIs)
The data in Table 7 suggests that countries starting in top leagues tended to stay there over the generation. Indeed, if a country was in tier 1 in 1990 it had a 97% chance of being in tier 1 in 2016; if a country was in tier 1 or tier 2 in 1990 it had an 87% chance of being in tier 1 or tier 2 in 2016. Interestingly, these odds of staying in the top tiers of the world economic league over a generation are much higher than the odds of staying in the top tiers of English football (where the odds of a club starting and ending the 1992-2016 period in the top two tiers was 62%).
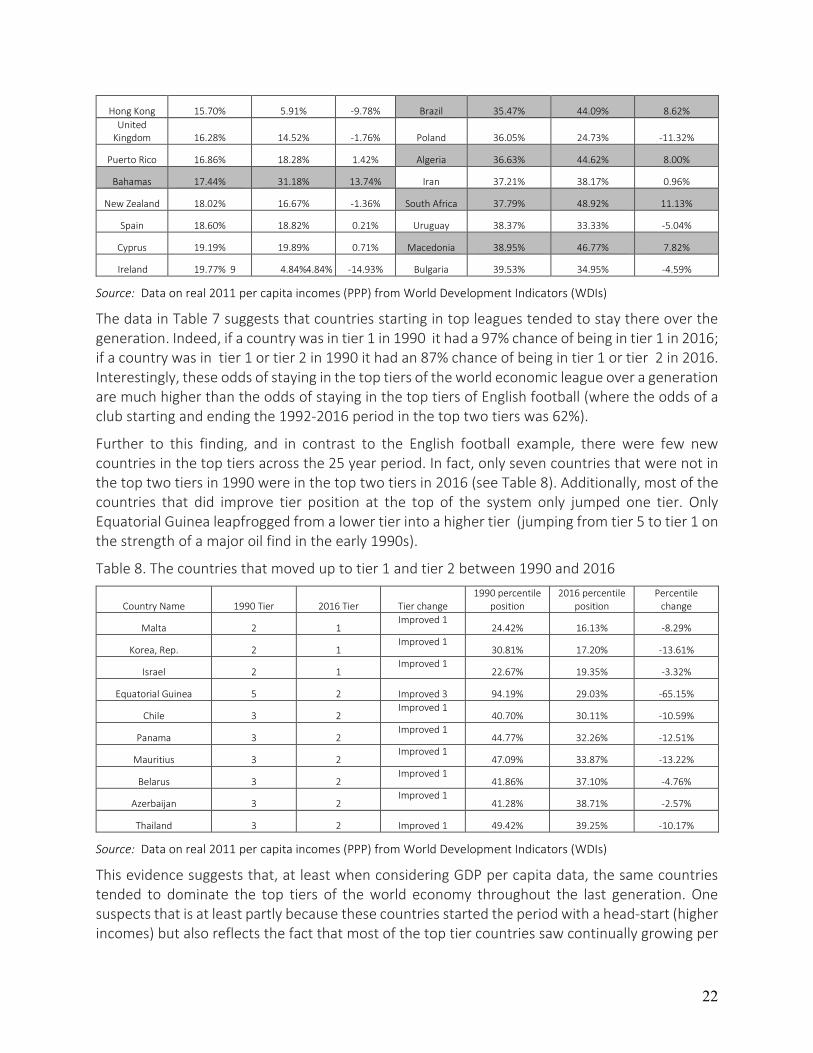
Further to this finding, and in contrast to the English football example, there were few new countries in the top tiers across the 25 year period. In fact, only seven countries that were not in the top two tiers in 1990 were in the top two tiers in 2016 (see Table 8). Additionally, most of the countries that did improve tier position at the top of the system only jumped one tier. Only Equatorial Guinea leapfrogged from a lower tier into a higher tier (jumping from tier 5 to tier 1 on the strength of a major oil find in the early 1990s).
Table 8. The countries that moved up to tier 1 and tier 2 between 1990 and 2016
Country Name 1990 Tier 2016 Tier Tier change 1990 percentile
position 2016 percentile
position Percentile
change
Malta 2 1 Improved 1
24.42% 16.13% -8.29%
Korea, Rep. 2 1 Improved 1
30.81% 17.20% -13.61%
Israel 2 1 Improved 1
22.67% 19.35% -3.32%
Equatorial Guinea 5 2 Improved 3 94.19% 29.03% -65.15%
Chile 3 2 Improved 1
40.70% 30.11% -10.59%
Panama 3 2 Improved 1
44.77% 32.26% -12.51%
Mauritius 3 2 Improved 1
47.09% 33.87% -13.22%
Belarus 3 2 Improved 1
41.86% 37.10% -4.76%
Azerbaijan 3 2 Improved 1
41.28% 38.71% -2.57%
Thailand 3 2 Improved 1 49.42% 39.25% -10.17%
Source: Data on real 2011 per capita incomes (PPP) from World Development Indicators (WDIs)
This evidence suggests that, at least when considering GDP per capita data, the same countries tended to dominate the top tiers of the world economy throughout the last generation. One suspects that is at least partly because these countries started the period with a head-start (higher incomes) but also reflects the fact that most of the top tier countries saw continually growing per
23
capita incomes in the period. Over 90% of the tier 1 countries in 2016 enjoyed positive income per capita growth since 1990. One can expect that these top tier countries will likely stay in the top tiers, given the combination of continued growth and a strong starting advantage.
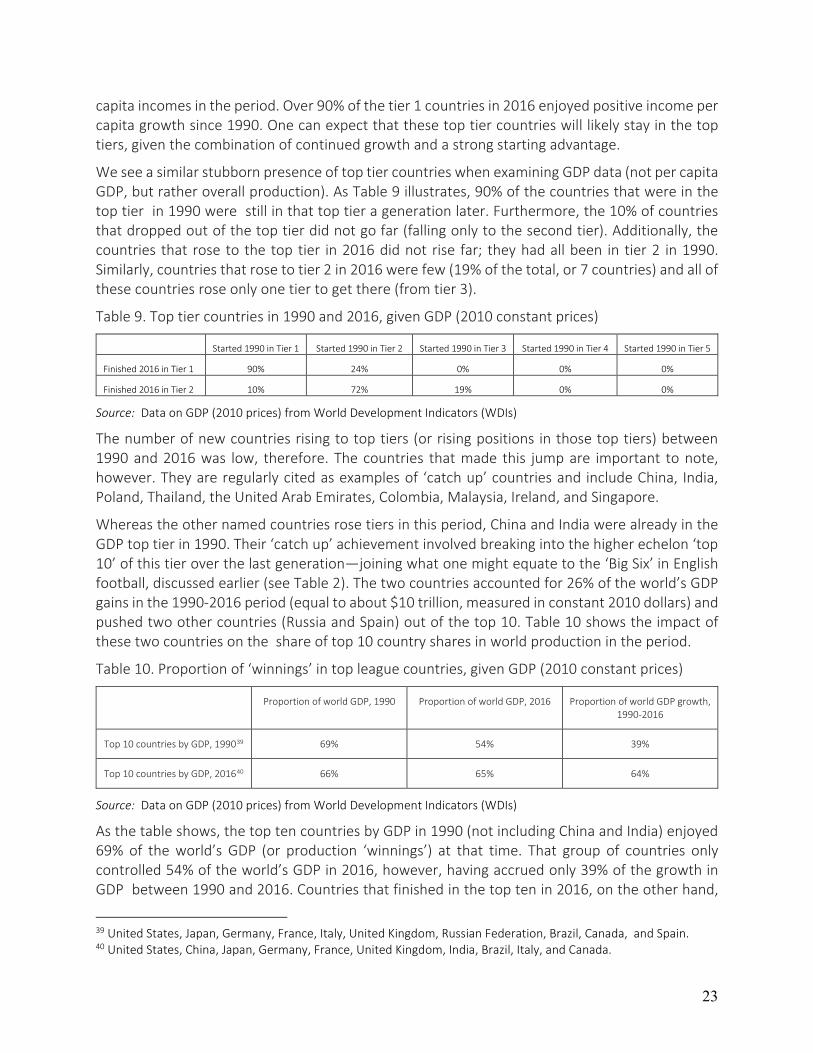
We see a similar stubborn presence of top tier countries when examining GDP data (not per capita GDP, but rather overall production). As Table 9 illustrates, 90% of the countries that were in the top tier in 1990 were still in that top tier a generation later. Furthermore, the 10% of countries that dropped out of the top tier did not go far (falling only to the second tier). Additionally, the countries that rose to the top tier in 2016 did not rise far; they had all been in tier 2 in 1990. Similarly, countries that rose to tier 2 in 2016 were few (19% of the total, or 7 countries) and all of these countries rose only one tier to get there (from tier 3).
Table 9. Top tier countries in 1990 and 2016, given GDP (2010 constant prices)
Started 1990 in Tier 1 Started 1990 in Tier 2 Started 1990 in Tier 3 Started 1990 in Tier 4 Started 1990 in Tier 5
Finished 2016 in Tier 1 90% 24% 0% 0% 0%
Finished 2016 in Tier 2 10% 72% 19% 0% 0%
Source: Data on GDP (2010 prices) from World Development Indicators (WDIs)
The number of new countries rising to top tiers (or rising positions in those top tiers) between 1990 and 2016 was low, therefore. The countries that made this jump are important to note, however. They are regularly cited as examples of ‘catch up’ countries and include China, India, Poland, Thailand, the United Arab Emirates, Colombia, Malaysia, Ireland, and Singapore.
Whereas the other named countries rose tiers in this period, China and India were already in the GDP top tier in 1990. Their ‘catch up’ achievement involved breaking into the higher echelon ‘top 10’ of this tier over the last generation—joining what one might equate to the ‘Big Six’ in English football, discussed earlier (see Table 2). The two countries accounted for 26% of the world’s GDP gains in the 1990-2016 period (equal to about $10 trillion, measured in constant 2010 dollars) and pushed two other countries (Russia and Spain) out of the top 10. Table 10 shows the impact of these two countries on the share of top 10 country shares in world production in the period.
Table 10. Proportion of ‘winnings’ in top league countries, given GDP (2010 constant prices)
Proportion of world GDP, 1990 Proportion of world GDP, 2016 Proportion of world GDP growth, 1990-2016
Top 10 countries by GDP, 199039 69% 54% 39%
Top 10 countries by GDP, 201640 66% 65% 64%
Source: Data on GDP (2010 prices) from World Development Indicators (WDIs)
As the table shows, the top ten countries by GDP in 1990 (not including China and India) enjoyed 69% of the world’s GDP (or production ‘winnings’) at that time. That group of countries only controlled 54% of the world’s GDP in 2016, however, having accrued only 39% of the growth in GDP between 1990 and 2016. Countries that finished in the top ten in 2016, on the other hand,
39 United States, Japan, Germany, France, Italy, United Kingdom, Russian Federation, Brazil, Canada, and Spain. 40 United States, China, Japan, Germany, France, United Kingdom, India, Brazil, Italy, and Canada.
24
accounted for 65% of the world production in 2016, having started the period with 66% of the GDP and garnering 64% of the increase in world GDP in the period.
Even while Table 10 shows that the identity of countries in the ‘top 10’ producers has changed over time, the data also speak to a fairly stable share of global GDP in the world’s top 10 countries (between 65 and 69%). Interestingly, this reflects more dominance at the top of the world economic hierarchy than one sees in the English football league pyramid. The ‘Big 6’ in the English league of 92 (Manchester United, Manchester City, Arsenal, Chelsea, Liverpool and Tottenham Hotspur) enjoys about 40% of the total system’s revenues, whereas the ‘top 10’ in the world economy accounts for a fairly stable two-thirds of all the system’s production.
The bottom line is that few countries in the top tiers of the world economy have maintained their hold on most of the economic winnings in this system. There have been some newcomers to these top tiers, but not many. Countries in the top tiers of the world economy tend to stay there over time, and a few countries tend to enjoy much of the winnings in even these elite tiers.
How regularly do lower tier countries rise (is the ‘hope of winning’ real for these countries)?
So, is there evidence of ‘catch up’ in the world economy? Are there examples of countries resembling Leicester City Football Club or AFC Bournemouth of Hull in the English football league—leapfrogging multiple tiers to compete for the league winnings? The answer, unsurprisingly given prior analysis, is no—or at least ‘not really’. Lower tier developing countries seldom if ever rise to higher tiers in the world economic league.
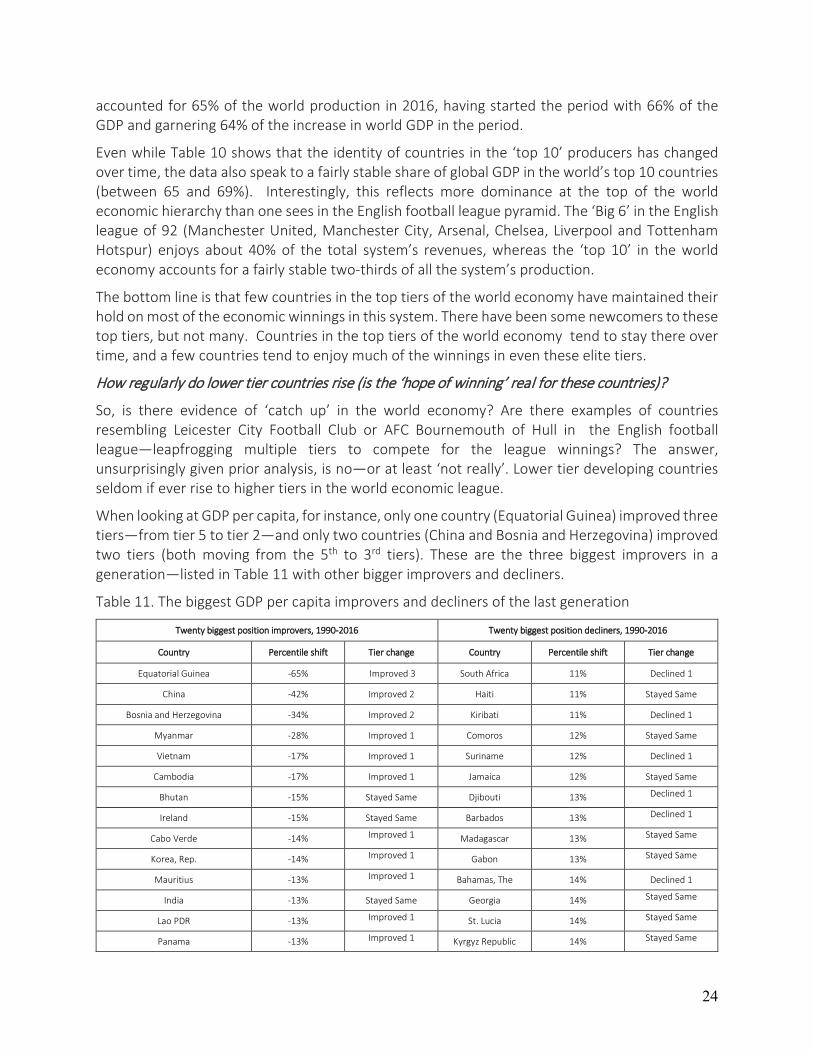
When looking at GDP per capita, for instance, only one country (Equatorial Guinea) improved three tiers—from tier 5 to tier 2—and only two countries (China and Bosnia and Herzegovina) improved two tiers (both moving from the 5th to 3rd tiers). These are the three biggest improvers in a generation—listed in Table 11 with other bigger improvers and decliners.
Table 11. The biggest GDP per capita improvers and decliners of the last generation
Twenty biggest position improvers, 1990-2016 Twenty biggest position decliners, 1990-2016
Country Percentile shift Tier change Country Percentile shift Tier change
Equatorial Guinea -65% Improved 3 South Africa 11% Declined 1
China -42% Improved 2 Haiti 11% Stayed Same
Bosnia and Herzegovina -34% Improved 2 Kiribati 11% Declined 1
Myanmar -28% Improved 1 Comoros 12% Stayed Same
Vietnam -17% Improved 1 Suriname 12% Declined 1
Cambodia -17% Improved 1 Jamaica 12% Stayed Same
Bhutan -15% Stayed Same Djibouti 13% Declined 1
Ireland -15% Stayed Same Barbados 13% Declined 1
Cabo Verde -14% Improved 1 Madagascar 13% Stayed Same
Korea, Rep. -14% Improved 1 Gabon 13% Stayed Same
Mauritius -13% Improved 1 Bahamas, The 14% Declined 1
India -13% Stayed Same Georgia 14% Stayed Same
Lao PDR -13% Improved 1 St. Lucia 14% Stayed Same
Panama -13% Improved 1 Kyrgyz Republic 14% Stayed Same
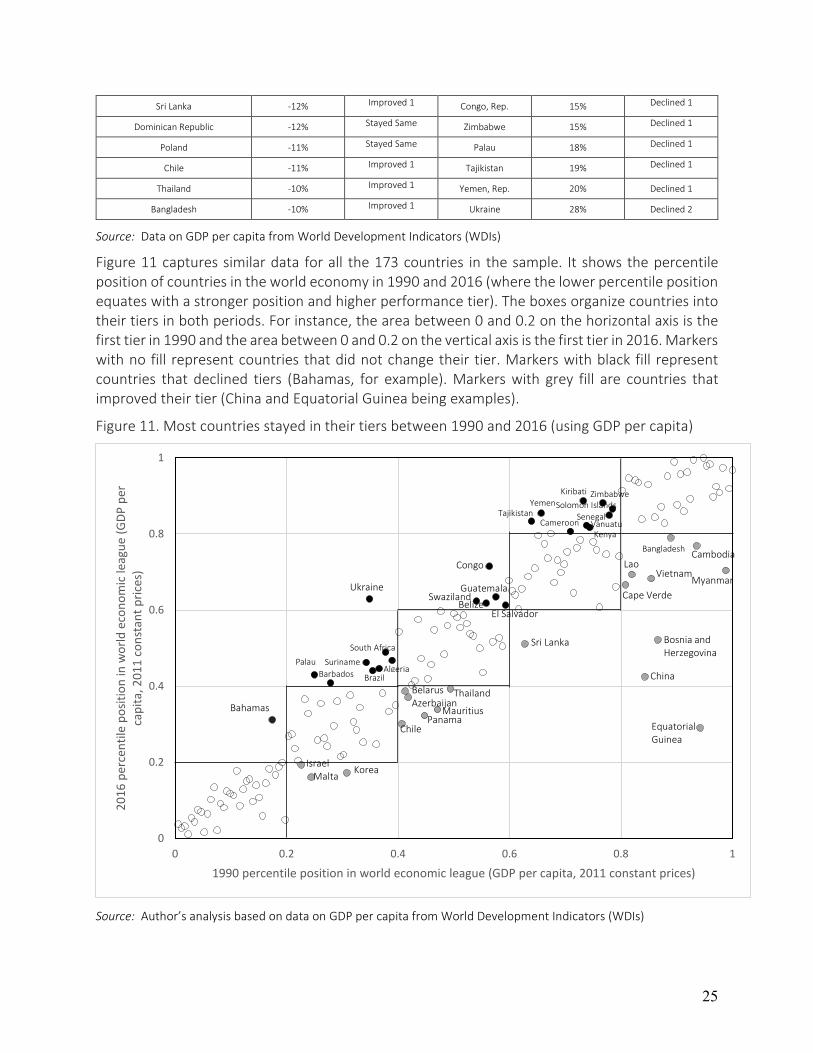
25
Sri Lanka -12% Improved 1 Congo, Rep. 15% Declined 1
Dominican Republic -12% Stayed Same Zimbabwe 15% Declined 1
Poland -11% Stayed Same Palau 18% Declined 1
Chile -11% Improved 1 Tajikistan 19% Declined 1
Thailand -10% Improved 1 Yemen, Rep. 20% Declined 1
Bangladesh -10% Improved 1 Ukraine 28% Declined 2
Source: Data on GDP per capita from World Development Indicators (WDIs)
Figure 11 captures similar data for all the 173 countries in the sample. It shows the percentile position of countries in the world economy in 1990 and 2016 (where the lower percentile position equates with a stronger position and higher performance tier). The boxes organize countries into their tiers in both periods. For instance, the area between 0 and 0.2 on the horizontal axis is the first tier in 1990 and the area between 0 and 0.2 on the vertical axis is the first tier in 2016. Markers with no fill represent countries that did not change their tier. Markers with black fill represent countries that declined tiers (Bahamas, for example). Markers with grey fill are countries that improved their tier (China and Equatorial Guinea being examples).
Figure 11. Most countries stayed in their tiers between 1990 and 2016 (using GDP per capita)
Source: Author’s analysis based on data on GDP per capita from World Development Indicators (WDIs)
0
0.2
0.4
0.6
0.8
1
0 0.2 0.4 0.6 0.8 1
2016
per
cent
ile p
ositi
on in
wor
ld e
cono
mic
leag
ue (G
DP p
er
capi
ta, 2
011
cons
tant
pric
es)
1990 percentile position in world economic league (GDP per capita, 2011 constant prices)
Korea
Bahamas
IsraelMalta
PanamaChile
BelarusAzerbaijan
Mauritius
Thailand
Equatorial Guinea
Sri Lanka
China
Bosnia andHerzegovina
Cape Verde
LaoVietnam
Cambodia
Myanmar
SwazilandBelize
El Salvador
Guatemala
Congo
Ukraine
Bangladesh
Zimbabwe
South Africa
Palau Algeria
Brazil
Suriname Barbados
Cameroon Kenya
Vanuatu
Yemen Tajikistan
Solomon Islands Senegal
Kiribati
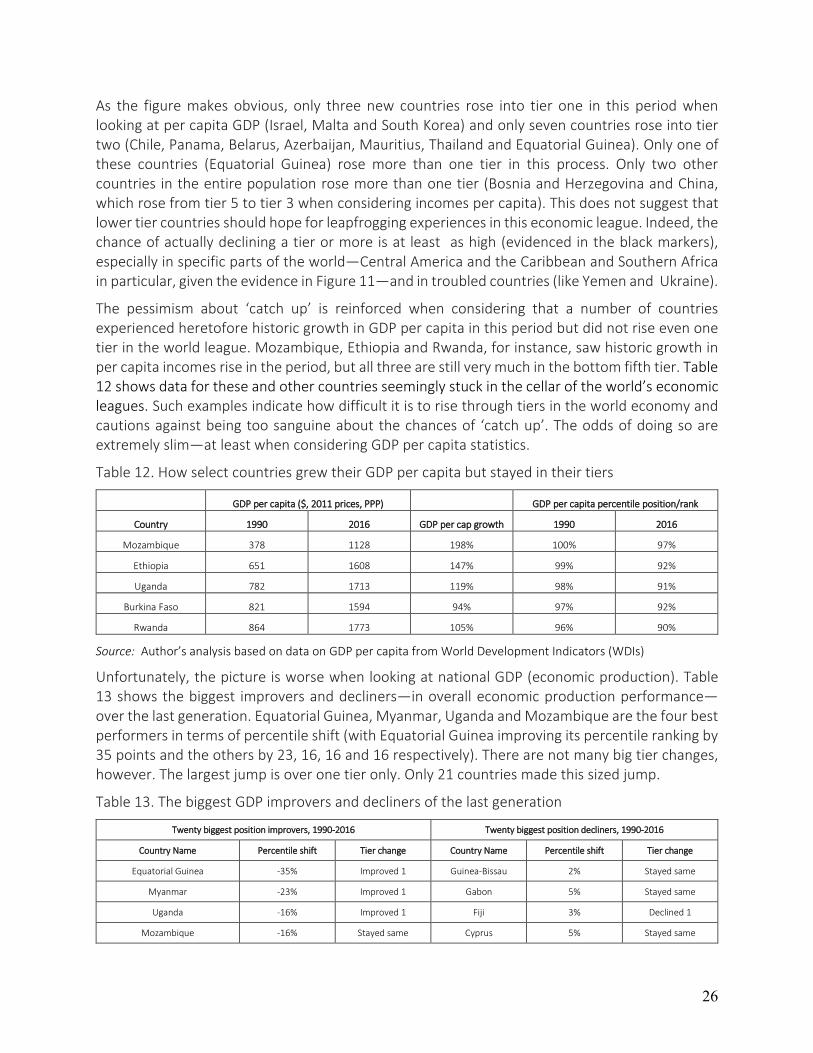
26
As the figure makes obvious, only three new countries rose into tier one in this period when looking at per capita GDP (Israel, Malta and South Korea) and only seven countries rose into tier two (Chile, Panama, Belarus, Azerbaijan, Mauritius, Thailand and Equatorial Guinea). Only one of these countries (Equatorial Guinea) rose more than one tier in this process. Only two other countries in the entire population rose more than one tier (Bosnia and Herzegovina and China, which rose from tier 5 to tier 3 when considering incomes per capita). This does not suggest that lower tier countries should hope for leapfrogging experiences in this economic league. Indeed, the chance of actually declining a tier or more is at least as high (evidenced in the black markers), especially in specific parts of the world—Central America and the Caribbean and Southern Africa in particular, given the evidence in Figure 11—and in troubled countries (like Yemen and Ukraine).
The pessimism about ‘catch up’ is reinforced when considering that a number of countries experienced heretofore historic growth in GDP per capita in this period but did not rise even one tier in the world league. Mozambique, Ethiopia and Rwanda, for instance, saw historic growth in per capita incomes rise in the period, but all three are still very much in the bottom fifth tier. Table 12 shows data for these and other countries seemingly stuck in the cellar of the world’s economic leagues. Such examples indicate how difficult it is to rise through tiers in the world economy and cautions against being too sanguine about the chances of ‘catch up’. The odds of doing so are extremely slim—at least when considering GDP per capita statistics.
Table 12. How select countries grew their GDP per capita but stayed in their tiers
GDP per capita ($, 2011 prices, PPP) GDP per capita percentile position/rank
Country 1990 2016 GDP per cap growth 1990 2016
Mozambique 378 1128 198% 100% 97%
Ethiopia 651 1608 147% 99% 92%
Uganda 782 1713 119% 98% 91%
Burkina Faso 821 1594 94% 97% 92%
Rwanda 864 1773 105% 96% 90%
Source: Author’s analysis based on data on GDP per capita from World Development Indicators (WDIs)
Unfortunately, the picture is worse when looking at national GDP (economic production). Table 13 shows the biggest improvers and decliners—in overall economic production performance—over the last generation. Equatorial Guinea, Myanmar, Uganda and Mozambique are the four best performers in terms of percentile shift (with Equatorial Guinea improving its percentile ranking by 35 points and the others by 23, 16, 16 and 16 respectively). There are not many big tier changes, however. The largest jump is over one tier only. Only 21 countries made this sized jump.
Table 13. The biggest GDP improvers and decliners of the last generation
Twenty biggest position improvers, 1990-2016 Twenty biggest position decliners, 1990-2016
Country Name Percentile shift Tier change Country Name Percentile shift Tier change
Equatorial Guinea -35% Improved 1 Guinea-Bissau 2% Stayed same
Myanmar -23% Improved 1 Gabon 5% Stayed same
Uganda -16% Improved 1 Fiji 3% Declined 1
Mozambique -16% Stayed same Cyprus 5% Stayed same
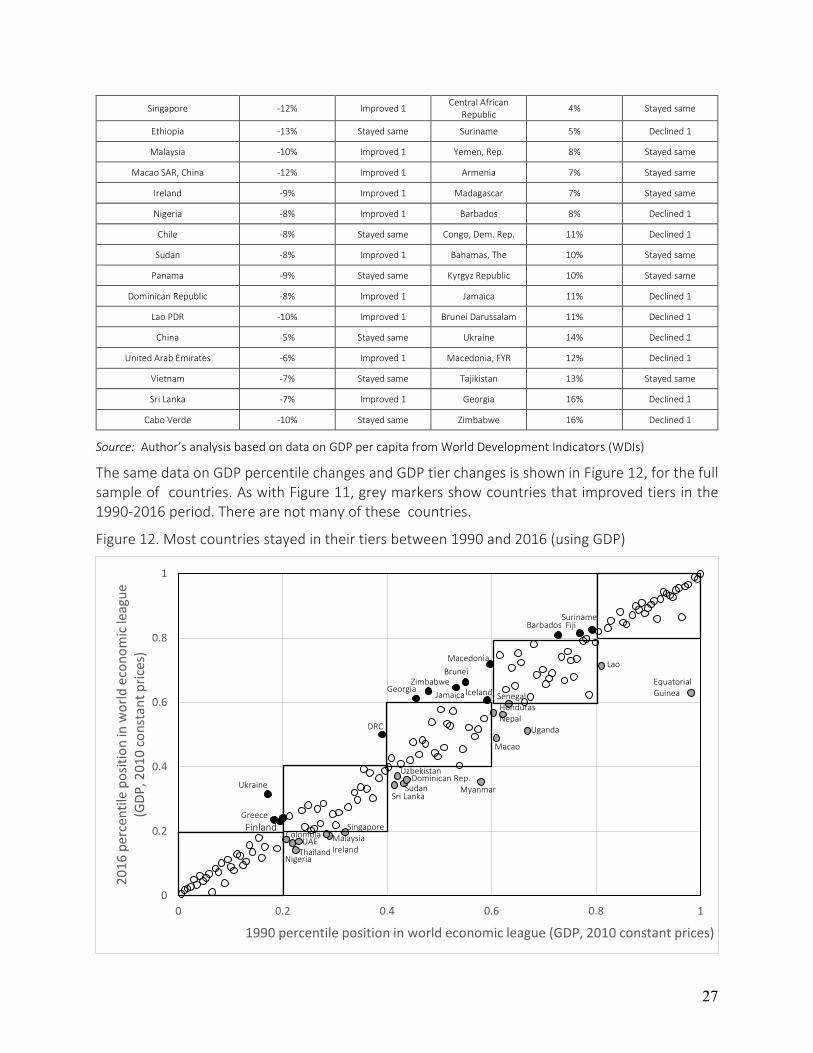
27
Singapore -12% Improved 1 Central African Republic 4% Stayed same
Ethiopia -13% Stayed same Suriname 5% Declined 1
Malaysia -10% Improved 1 Yemen, Rep. 8% Stayed same
Macao SAR, China -12% Improved 1 Armenia 7% Stayed same
Ireland -9% Improved 1 Madagascar 7% Stayed same
Nigeria -8% Improved 1 Barbados 8% Declined 1
Chile -8% Stayed same Congo, Dem. Rep. 11% Declined 1
Sudan -8% Improved 1 Bahamas, The 10% Stayed same
Panama -9% Stayed same Kyrgyz Republic 10% Stayed same
Dominican Republic -8% Improved 1 Jamaica 11% Declined 1
Lao PDR -10% Improved 1 Brunei Darussalam 11% Declined 1
China -5% Stayed same Ukraine 14% Declined 1
United Arab Emirates -6% Improved 1 Macedonia, FYR 12% Declined 1
Vietnam -7% Stayed same Tajikistan 13% Stayed same
Sri Lanka -7% Improved 1 Georgia 16% Declined 1
Cabo Verde -10% Stayed same Zimbabwe 16% Declined 1
Source: Author’s analysis based on data on GDP per capita from World Development Indicators (WDIs)
The same data on GDP percentile changes and GDP tier changes is shown in Figure 12, for the full sample of countries. As with Figure 11, grey markers show countries that improved tiers in the 1990-2016 period. There are not many of these countries.
Figure 12. Most countries stayed in their tiers between 1990 and 2016 (using GDP)
0
0.2
0.4
0.6
0.8
1
0 0.2 0.4 0.6 0.8 1
2016
per
cent
ile p
ositi
on in
wor
ld e
cono
mic
leag
ue
(GDP
, 201
0 co
nsta
nt p
rices
)
1990 percentile position in world economic league (GDP, 2010 constant prices)
SurinameFiji
Nigeria
Sri Lanka
MalaysiaIrelandThailand
ColombiaUAE
SingaporeGreeceFinland
Ukraine Sudan MyanmarDominican Rep.
Uzbekistan
DRC
Macao
Uganda
HondurasNepal
SenegalIceland
Barbados
Georgia Zimbabwe Jamaica
Brunei Macedonia
Equatorial Guinea
Lao
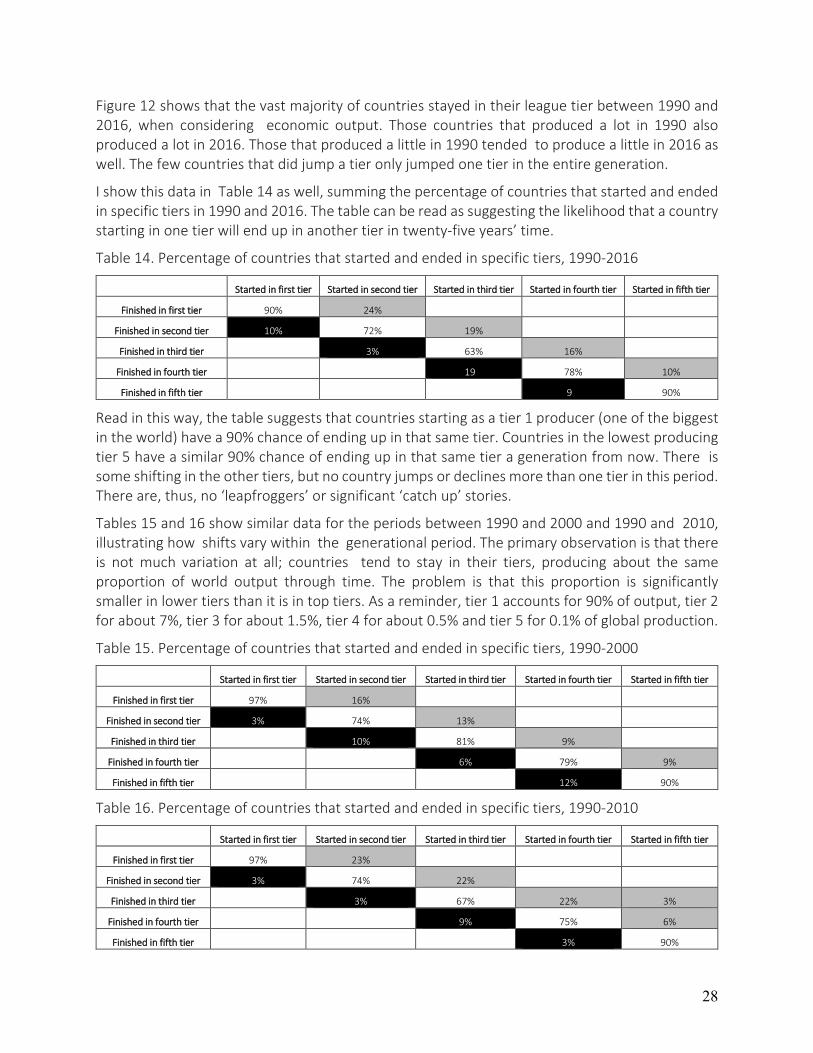
28
Figure 12 shows that the vast majority of countries stayed in their league tier between 1990 and 2016, when considering economic output. Those countries that produced a lot in 1990 also produced a lot in 2016. Those that produced a little in 1990 tended to produce a little in 2016 as well. The few countries that did jump a tier only jumped one tier in the entire generation.
I show this data in Table 14 as well, summing the percentage of countries that started and ended in specific tiers in 1990 and 2016. The table can be read as suggesting the likelihood that a country starting in one tier will end up in another tier in twenty-five years’ time.
Table 14. Percentage of countries that started and ended in specific tiers, 1990-2016
Started in first tier Started in second tier Started in third tier Started in fourth tier Started in fifth tier
Finished in first tier 90% 24%
Finished in second tier 10% 72% 19%
Finished in third tier 3% 63% 16%
Finished in fourth tier 19% 78% 10%
Finished in fifth tier 9% 90%
Read in this way, the table suggests that countries starting as a tier 1 producer (one of the biggest in the world) have a 90% chance of ending up in that same tier. Countries in the lowest producing tier 5 have a similar 90% chance of ending up in that same tier a generation from now. There is some shifting in the other tiers, but no country jumps or declines more than one tier in this period. There are, thus, no ‘leapfroggers’ or significant ‘catch up’ stories.
Tables 15 and 16 show similar data for the periods between 1990 and 2000 and 1990 and 2010, illustrating how shifts vary within the generational period. The primary observation is that there is not much variation at all; countries tend to stay in their tiers, producing about the same proportion of world output through time. The problem is that this proportion is significantly smaller in lower tiers than it is in top tiers. As a reminder, tier 1 accounts for 90% of output, tier 2 for about 7%, tier 3 for about 1.5%, tier 4 for about 0.5% and tier 5 for 0.1% of global production.
Table 15. Percentage of countries that started and ended in specific tiers, 1990-2000
Started in first tier Started in second tier Started in third tier Started in fourth tier Started in fifth tier
Finished in first tier 97% 16%
Finished in second tier 3% 74% 13%
Finished in third tier 10% 81% 9%
Finished in fourth tier 6% 79% 9%
Finished in fifth tier 12% 90%
Table 16. Percentage of countries that started and ended in specific tiers, 1990-2010
Started in first tier Started in second tier Started in third tier Started in fourth tier Started in fifth tier
Finished in first tier 97% 23%
Finished in second tier 3% 74% 22%
Finished in third tier 3% 67% 22% 3%
Finished in fourth tier 9% 75% 6%
Finished in fifth tier 3% 90%
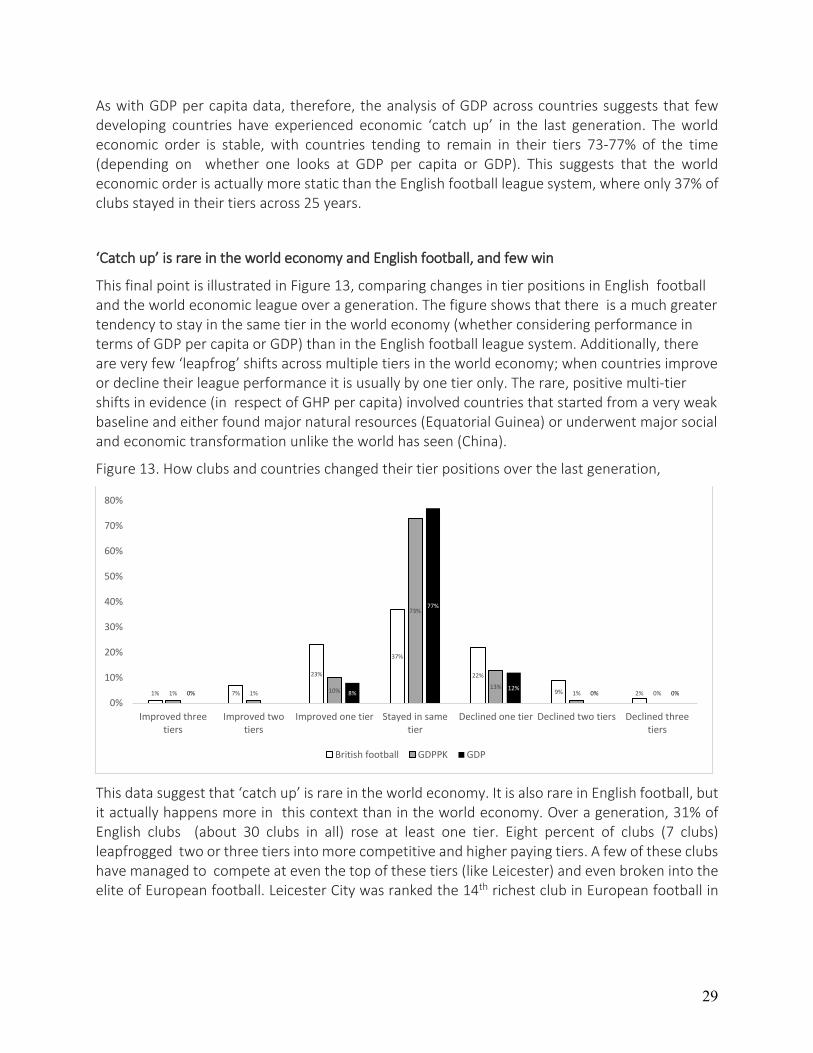
29
As with GDP per capita data, therefore, the analysis of GDP across countries suggests that few developing countries have experienced economic ‘catch up’ in the last generation. The world economic order is stable, with countries tending to remain in their tiers 73-77% of the time (depending on whether one looks at GDP per capita or GDP). This suggests that the world economic order is actually more static than the English football league system, where only 37% of clubs stayed in their tiers across 25 years.
‘Catch up’ is rare in the world economy and English football, and few win
This final point is illustrated in Figure 13, comparing changes in tier positions in English football and the world economic league over a generation. The figure shows that there is a much greater tendency to stay in the same tier in the world economy (whether considering performance in terms of GDP per capita or GDP) than in the English football league system. Additionally, there are very few ‘leapfrog’ shifts across multiple tiers in the world economy; when countries improve or decline their league performance it is usually by one tier only. The rare, positive multi-tier shifts in evidence (in respect of GHP per capita) involved countries that started from a very weak baseline and either found major natural resources (Equatorial Guinea) or underwent major social and economic transformation unlike the world has seen (China).
Figure 13. How clubs and countries changed their tier positions over the last generation,
This data suggest that ‘catch up’ is rare in the world economy. It is also rare in English football, but it actually happens more in this context than in the world economy. Over a generation, 31% of English clubs (about 30 clubs in all) rose at least one tier. Eight percent of clubs (7 clubs) leapfrogged two or three tiers into more competitive and higher paying tiers. A few of these clubs have managed to compete at even the top of these tiers (like Leicester) and even broken into the elite of European football. Leicester City was ranked the 14th richest club in European football in
1% 7%
23%
37%
22%
9% 2%1% 1% 10%
73%
13%1% 0%0% 0% 8%
77%
12%0% 0%
0%
10%
20%
30%
40%
50%
60%
70%
80%
Improved threetiers
Improved twotiers
Improved one tier Stayed in sametier
Declined one tier Declined two tiers Declined threetiers
British football GDPPK GDP
30
2018, having been in the third tier League One in 2008.41 Stoke, West Bromwich Albion and AFC Bournemouth— clubs that started the 1990s struggling in lower tiers—were all in the top thirty richest clubs in Europe in 2018. These clubs benefited significantly from shares of the large broadcasting revenues enjoyed in the top tier Premier League, and from other revenue raising opportunities that come from being in this tier (like merchandise sales). These opportunities have grown since the English league system globalized, and the experience shows that lower tier clubs can ‘catch up’ to enjoy these gains and to growth more on the basis of such gains.
The experience of these and other clubs also speaks to the difficulty of staying in the top tiers, however, and the financial vulnerability of being in these tiers. These and other clubs have seen their wage bills explode in size, for instance, as they are forced to fight for the world’s top talent. They have also been forced to invest in new forms of infrastructure and business operations, to ensure they can take the most advantage possible of their time ‘at the top’. They all know that they will face significant losses if and when they drop tiers again, with average tier 2 clubs earning about 16% of the annual revenues earned by average tier 1 clubs.
The huge differences in revenues and wages across English football’s tiers is startling and speaks to the fact that few clubs really win much in the system. Most clubs and players just participate, struggling to make-do with limited revenues and wages. The football experience of these lower tier participants—and the financial opportunities such brings—is local, not global, and may be better than it was a generation ago but is by no means as impressive and lucrative as the experience enjoyed by clubs and players in the top tiers.
The world economic system looks much the same, only worse. A small group of top tier countries in this system enjoy much better economic performance than others, with growing gaps between incomes in these countries and others. These small groups are very hard to penetrate, with membership staying the same over decades. This means that poorer countries in lower tiers have very little chance of ‘catch up’ even if they grow significantly, which means that these lower tier countries will continue to ‘fall back’ in terms of incomes and production shares. As such, the hope of widespread and dramatic ‘catch up’ is not realistic: Developing countries do not seem to gain enough from globalization to catch up to more developed countries in the world economy.
Where does this conclusion leave developing country officials committed to crafting policies that help their countries progress—in the hopes of ‘catching up’? It could fuel pessimism and a sense of defeat: “If ‘catch up’ is so rare, can we ever do it?” It could also fuel realism and clear-eyed focus: “Yes, ‘catch up’ is rare, but it does happen, so what does it take to be the exception?” My hope is that officials reading this paper choose the second reaction and ask seriously what it takes to leapfrog across tiers and if their country is doing what it takes to do so. They should be particularly interested in asking what policy capabilities are needed to effect ‘catch up’ change.
I will address these questions in future working papers, drawing on cases from the world of football and economics to identify why some clubs and countries do indeed become exceptions and to describe ways in which aspiring ‘catch up’ policymakers might act on these lessons in their own countries. In the meanwhile, please give me any comments you have on this paper.
41 Conn, D. 2018. Premier League has 14 of the 30 highest-earning clubs in the world. Guardian. January 22, 2018. https://www.theguardian.com/football/2018/jan/23/premier-league-highest-earners-world-manchester-united