changes, drivers, and challenges in the north american steel industry thomas a. danjczek president...
TRANSCRIPT

Changes, Drivers, and Challenges in the North American Steel Industry
Thomas A. DanjczekPresidentSteel Manufacturers AssociationNovember 8, 2012Scottsdale, Arizona
CHAIN LINK FENCE MANUFACTURERS INSTITUTE ANNUAL MEETING
Update 10-24-2012

Outline
•About the SMA
•Set the Tone - Economy
•Set the Tone - Steel
•Changes Impacting Steel
•Drivers Impacting Steel
•Challenges Impacting Steel
•Final Thoughts
CLFMI – Annual Meeting

3
About the SMA- Composed of 35 North American electric arc furnace (“EAF”) steel producing Member Companies, and 123 Associate Member steel industry suppliers
- SMA Members account for approximately 80% of U.S. domestic steel capacity
- Today, roughly two-thirds of North American steel production comes from the scrap-based EAF process, up from just 10% in the early 1970s
CLFMI – Annual Meeting SMA
1989 1990 1991 1992 1993 1994 1995 1996 1997 1998 1999 2000 2001 2002 2003 2004 2005 2006 2007 2008 2009 2010 201120.0%
25.0%
30.0%
35.0%
40.0%
45.0%
50.0%
55.0%
60.0%
65.0%
U.S. EAF Share of Total Production
% of EAF Production
Approximately 2/3 of U.S. Steel Production

4
CLFMI – Annual Meeting Set the Tone - Economy
• U.S. & Canada GDP Growth Around 2%
NEAR STAGNATION
• U.S. Manufacturing Production Rebounding
STILL 6% BELOW PEAK & MAY BE DROPPING
• Global Slowdown Weakens Demand, Poor Earnings
ARE WE LOSING MOMENTUM?
• U.S. Auto, Aerospace, Machinery Strong
WILL IT CONTINUE? MAY BE DROPPING…
• “Trimming Profits”
• Second Recession in U.S.???

US GOOds
CLFMI – Annual Meeting Set the Tone - Economy
$620 Billion Annual Deficit projected in 2012 is most significant barrier to U.S. economic recovery
UNSUSTAINABLE

6
Set the Tone - SteelCLFMI – Annual Meeting
• Primary metal 4% growth YTD 2012 over 2011 in US
• U.S. capacity utilization approx. 76.5% through October 2012
Up 6.4% over 2011, but…Recent weeks around 70%, now 69%
• Scrap price volatility (75% of minimill costs)
$100/150 drop in 45 days – half back; maybe $20 down in September, maybe $50 in October???
• U.S. may hit 97ms tons in 2012
• Inventories remains LOW
• Changes in mill orders lead time from 6 weeks to 2.5weeks, back to 5 weeks…all in 2 months – VOLATILE
• Iron ore prices down 36% YTD

7
CLFMI – Annual Meeting
Source: Gerdau NA, US Census Bureau & AISI

NAFTA Auto Production
Source: Wards Automotive
0
2
4
6
8
10
12
14
16
18
Units (m
illions)
CLFMI – Annual Meeting

Construction Activity*Non-building structures (e.g., infrastructure) not included
Source: McGraw-Hill (Dodge)
0
500,000
1,000,000
1,500,000
2,000,000
2,500,000
2007 2008 2009 2010 2011 2012 2013 2014 2015
Squa
re F
oota
ge (0
00)
Residential (1 & 2 family dwellings) Non-Residential
CLFMI – Annual Meeting

10
CLFMI – Annual Meeting

Energy Production
Source: Baker Hughes, U.S. Dept. of Energy
0
500
1,000
1,500
2,000
2,500
JAN
APR
JUL
OCT
JAN
APR
JUL
OCT
JAN
APR
JUL
OCT
JAN
APR
JUL
OCT
Jan
Apr
Jul
2008 2009 2010 2011 2012
RIG
CO
UN
T
$0.0
$2.0
$4.0
$6.0
$8.0
$10.0
$12.0
$ M
cf
Total RIGS
Verticle RIGS
Horizontal RIGS
Natural Gas Price at Wellhead
CLFMI – Annual Meeting

World Steel Association Global Overview NAFTAApparent Steel Use, finished steel (SRO October 2012)
2011 Actual
1380.9 million tonnes 6.2% growth 121.3 9.0% growth
2012 forecast
1409.4 million tonnes 2.1% growth 130.4 7.5% growth
2013 forecast
1454.9 million tonnes 3.2% growth 135.1 3.6% growth
2013 As PCT 2007 119.5% growth 95.3% growth
CLFMI – Annual Meeting
Source: AISI
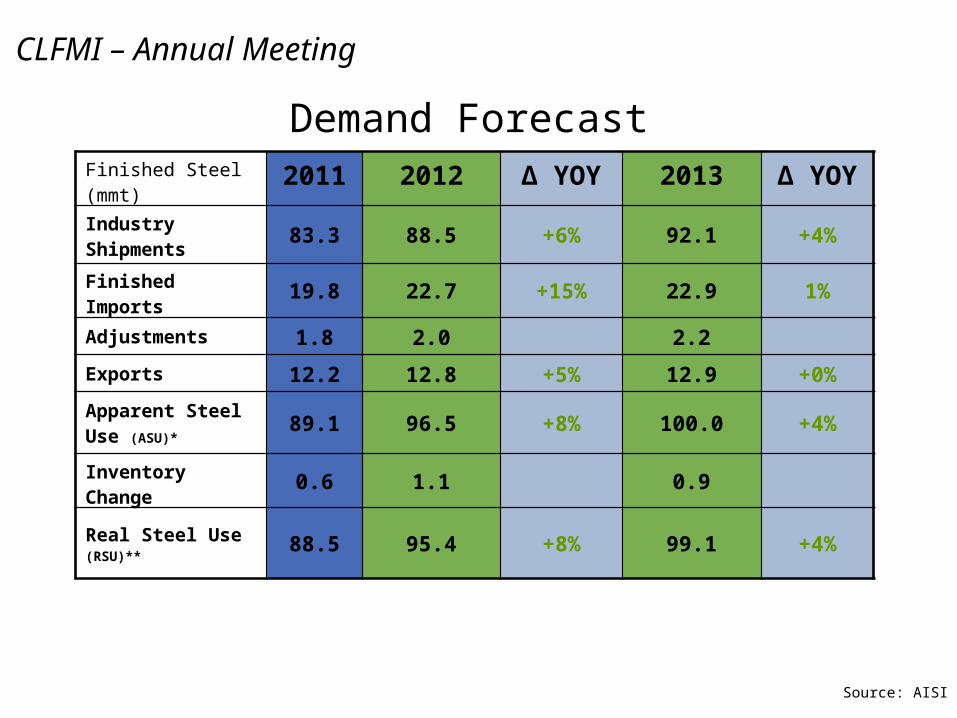
Demand ForecastFinished Steel (mmt)
2011 2012 ∆ YOY 2013 ∆ YOY
Industry Shipments 83.3 88.5 +6% 92.1 +4%
Finished Imports 19.8 22.7 +15% 22.9 1%
Adjustments 1.8 2.0 2.2
Exports 12.2 12.8 +5% 12.9 +0%
Apparent Steel Use (ASU)*
89.1 96.5 +8% 100.0 +4%
Inventory Change 0.6 1.1 0.9
Real Steel Use (RSU)**
88.5 95.4 +8% 99.1 +4%
CLFMI – Annual Meeting

Imports – 2012
Russia Taiwan Germany Turkey China Japan South Korea
0
500,000
1,000,000
1,500,000
2,000,000
2,500,0002011 YTD vs. 2012 YTD Finished Steel Imports
from Key Offshore Countries
2011 YTD (NT) - 7 months 2012 YTD (NT) - 7 months
+28.04%+26.97%
+94.18% +29.12%
+33.63%
+23.35%
+52.51%
CLFMI – Annual Meeting
Source: DOC

15
CLFMI – Annual Meeting
U.S. Steel Imports
Year M-Metric Tons
2010 21.7
2011 25.9
2012(e) 32.0
U.S. steel imports are a growing problem.

CLFMI – Annual Meeting Changes Impacting Steel
Deeper Recession
Variable Cost Control
Engineers
Scrap Availability
High Unemployment
Labor Intensity
Inventory Levels
CHINA
Safety
ConsolidationsCustomer
Requirements
Environmental Regulations
Foreign Ownership
Transportation Costs
Ore Availability
Energy Costs
Currency
State-Owned Enterprises
Other Factors…
Skilled Jobs Shortages
Semi-finished Imports
Union Contracts
Scrap Exports

• Underlying Weak Economy, with less than 3% GDP growth and estimates downward.
• Recovery underway, but very slow – “Fragile”
• North American steel market under pressure with unused capacity
• Increased import percentages YOY, Impact of currency changes
• Not normal cycle of recession, overcapacity; new supply coming on
• Relative strong demand in auto; construction lagging
• Raw material costs, energy, and variable cost controls are major drivers
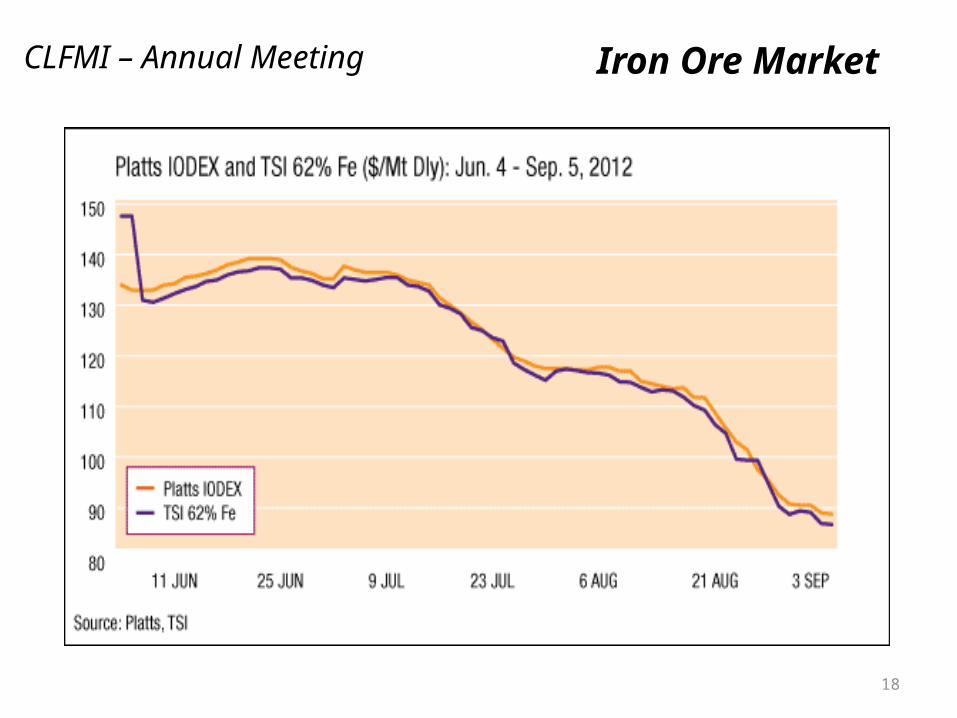
• Ore price evolution and recent developments-Platts graph
• Scrap price impact, growth of EAFs, developing world slowing down
• Economic growth turning point is always two quarters away
• Company market cap values at historic lows
Drivers Impacting SteelCLFMI – Annual Meeting
18
CLFMI – Annual Meeting Iron Ore Market

CLFMI – Annual Meeting Challenges Impacting Steel
Scrap Exports
Restrictions
Import Penetration
SOEs
Capital
Scrap Price Volatility
China, China, China Gov’t Subsidies
Trained Workforce
Abundant Natural Gas is a
“Game Changer”
WTO Disputes
Health Care Costs
Tax Manipulation
& Reforms
Trade Restrictions
Another Recession
Indirect Steel %
Environmental Regulations
Global Steel Capacity Growth
Role of Developing World
Anti-Competitive
Behavior
Labor Regulations
Infrastructure Investment
Currency Undervaluation

Final Thoughts
• Volatile times continue, May be between recessions• U.S. is in a traffic jam, moving slightly forward, but don’t know other
consequences. Don’t look to Washington, DC for help. Gridlock continues
• Uncertainty will continue especially in U.S. industry until economic fundamentals are in equilibrium. Limited visibility…
• Other countries increasing steel capacity without regard to market forces or comparative advantage.
• Current status of scrap restrictions is unsustainable• Reasons for optimism in steel in North America:
– Favorable gains with reemerging manufacturing base– Scrap-based, 75% of cost – local supply– Low cost on global basis (energy is positive, labor less than 10%, others have
higher transportation costs)– Relatively strong market and resiliency– Better & stronger company balance sheets
CLFMI – Annual Meeting