chaos in the music of the spheres · arxiv:astro-ph/0106329v1 19 jun 2001 chaos in the music of the...
TRANSCRIPT
arX
iv:a
stro
-ph/
0106
329v
1 1
9 Ju
n 20
01
Chaos in the Music of the Spheres
J. Robert Buchler∗, Zoltan Kolláth† and Robert Cadmus∗∗
∗University of Florida, USA†Konkoly Observatory, HUNGARY
∗∗Grinnell College, USA
Abstract. The light curves (time series of the radiated energy) of mostlarge amplitude, pulsatingstars such as the well known Cepheid stars are regular. However, a smaller group of variable starsthat are located next to them in the Hertzsprung- Russell diagram undergoes irregular light variationsand exhibits irregular radial velocities as well. The mechanism behind this irregular behavior wasa long standing mystery. A flow reconstruction technique based on the observed lightcurves ofsix separate stars shows that their underlying dynamics is chaotic and low dimensional (d = 4).Furthermore, we present evidence that the physical mechanism behind the behavior is the nonlinearinteraction of just two pulsation eigenmodes. In a generalized Shil’nikov scenario, the pulsationenergy alternates continuously, but irregularly between alower frequency mode that is linearlyunstable and thus growing, and a stable overtone that gets entrained through a low order resonance(2:1), but that wants to decay. The flow reconstruction from the stellar light curve thus yieldsinteresting physical insight into the pulsation mechanism.
INTRODUCTION
Almost every type of star becomes unstable to self-excited vibrations at least onceduring its lifetime. Typically, the stars that exhibit large amplitude variations in lightare undergoing radial pulsations,i.e. pulsations in which the star remains sphericallysymmetric at all times. Typically, only the fundamental pulsation mode or the first twoovertones are involved in the pulsation. In contrast, most small amplitude variable starssuch as the Sun or white dwarfs undergo nonradial pulsations, but with many modesparticipating in the motion.
The classical Cepheid variables and RR Lyrae variables are the best known and beststudied variable stars of the radial pulsator category. They owe this interest at least inpart to their role as primary cosmological distance indicators; they are almost perfectlyperiodic and obey a period-luminosity relation that can be used for measuring theirdistances.
This paper concerns itself with variable stars that lie nextto and slightly belowthe classical Cepheids in a long and broad curved strip in theHertzsprung - Russelldiagram (luminosity vs. temperature diagram) [1]. For historical reasons the stars at thelower luminosity end of the strip are called W Virginis type stars, further up RV Tauritype stars, then Semiregular stars and finally Mira variables, even though the transitionbetween the different classes appears to be gradual. For convenience we shall refer toall of them here as semiregular stars,largo sensu. The W Vir stars that lie at the lowluminosity end of the strip with concomitantly low period (P<∼20d) have regular lightcurves, but for the slightly more luminous stars stars the observations show alternations

FIGURE 1. Smoothed observed light curves
in the pulsation cycles that appear to be due to period doubling [2]. In fact, numericalhydrodynamical models display cascades of period doublings [3], [4], [5] as well astangent bifurcations [6], [7]. Observations also show thatstars with higher luminosityhave increasingly irregular pulsations [8].
Traditional astronomers like to think of stars are being multi-periodic (meaning that

they consider the pulsation to be a superposition of a numberof pulsation frequencieswith steady amplitudes). It is true that a phenomenologically motivated multiperiodic fitwill always be ’successful’ (as an interpolation), but on physical grounds it is possibleto rule out such a description [9]. In a nutshell:
(1) The frequency peaks in the Fourier spectrum of the light curve are numerous, butin this type of star, and in the frequency range of interest, there do not exist enoughradial pulsation eigenmodes, nor even low order nonradial pulsation modes that couldbe observable and excitable to such large amplitudes. No multi-periodic fits are possiblethat can reproduce the light curves within the observational accuracy while using modalfrequencies that are acceptable on aphysical basis.
(2) The frequencies in the Fourier spectra appear randomly variable from one sectionof the light curve data to another (for R Sctcf. [10]). If a multi-periodic star wereevolving slowly, the structure of the peaks should evolve slowly as well. The absence ofsuch correlations eliminates any explanation of the lightcurve as that of slowly evolvingmulti-periodic stars.
(3) One recent paper ([11]) ’explains’ the irregular behavior of R Sct as the superpo-sition of stochastically excited linear oscillators. While such a stochastic ’explanation’is perhaps mathematically valid, it is not meaningful on physical grounds because nomechanism is proposed (nor can be found) that could excite damped modes to suchlarge pulsation amplitudes (up to factors of 40 in the light curve of R Sct).
Unfortunately the cycling times of these variable stars vary from as low as 20 daysfor the lower luminosity W Vir stars to as much as a year for theSemiregular variables.It is almost needless to say that very few stars have been observed with a coverage thatlends itself to modern nonlinear analyses such as a flow reconstruction. Furthermore, forobvious reasons, the observations are generally not spacedwith equal time intervals, sothat an interpolation with concomitant introduction of noise is unavoidable.
A few years ago we were fortunate to obtain access to and analyze the data sets oftwo irregular variable stars, called R Scuti [12] [13] and ACHerculis [14], that have asufficiently good coverage and exhibit a large enough numberof pulsation cycles (cf.Fig. 1) to be representative of their long term behavior.
Our analysis was based on a flow reconstruction with a multivariate polynomial mapM (or o.d.e.) in an embedding space of dimensionde
Xn+1 = M ·Xn
where the state vectorX ∈ Rde is constructed from the scalar time-series{xi},
Xn = (xi, xi−τ, xi−2τ, . . . xi−(de−1)τ)
whereτ is a delay parameter that should be long enough so that noise does not kill thereconstruction, but small enough so that the map does not become too nonlinear [15].We briefly summarize here the results that were obtained.
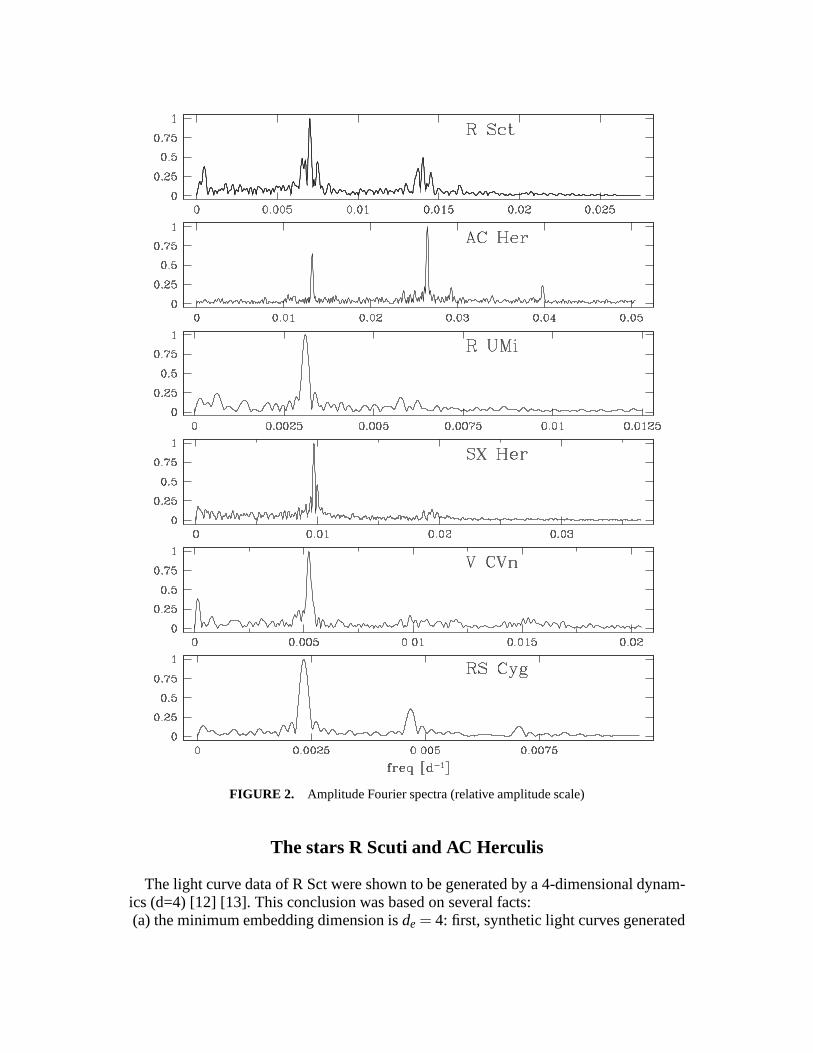
FIGURE 2. Amplitude Fourier spectra (relative amplitude scale)
The stars R Scuti and AC Herculis
The light curve data of R Sct were shown to be generated by a 4-dimensional dynam-ics (d=4) [12] [13]. This conclusion was based on several facts:(a) the minimum embedding dimension isde = 4: first, synthetic light curves generated

in 3D bear no resemblance to the observations; second, the error of the fit levels offat de = 4; third, the nearest neighbor method indicates 4 as the minimum dimension.However, the strongest argument comes from a comparison of the Fourier spectra ofthe synthetic light curves (generated through an iterationof the map) with those of thatobservational data, and of a comparison of the respective Broomhead-King projections(onto the eigenvectors of the correlation matrix).(b) the fractal (Lyapunov) dimensions [16] derived from theLyapunov exponents of thesynthetic signals fell in the range 3.1 – 3.2 for R Sct,independently of the embeddingdimension. This is therefore a lucky situation where the boundsdL ∼ 3.15< d ≤ de = 4uniquely determine the physical dimension to bed = 4.(c) There is noa priori guarantee that a map or flow should capture the underlying
dynamics. The fact that one of the Lyapunov exponents is always close to zero verystrongly suggests that we have been successful in the flow reconstruction. Indeed, amap with a short time-step should be close to a flow for which weknow that thecorresponding Lyapunov exponent is exactly zero. Actuallywe have also reconstructeda true flow (system of o.d.e.’s) for R Sct, although we find thatthe reconstruction of theflow is a little less robust than that of the map.(d) Perhaps the most interesting physical result comes fromthe linearization of the
successful maps around their fixed points: Two spiral roots±iω+ξ are found with thefollowing properties:ω2 ≈ 2ω1, with ξ2 > 0, andξ1 < 0, and|ξ2|> ξ1. This is of coursereminiscent of the Shil’nikov criterion [17].
These results allow us to give a physical interpretation of the motion. We alreadymentioned that the regular, classical Cepheid variables undergo pulsations in one of thetwo lowest modes of pulsation. It is seen that the semiregular stars to the same: thecomplex amplitudes of vibrational modes are the ’natural’ coordinates for the phasespace, so thatd = 4 implicates the involvement of two vibrational modes. Furthermore,the low frequency mode, of frequencyω1 is linearly unstable (self-excited) and growsin amplitude. In the nonlinear regime it interacts with a second mode because of a loworder resonance condition (ω2 = 2ω1). However, this entrained mode is linearly stableand wants to decay. A chaotic motion of alternating growth and decay ensues.
Our analysis of AC Herculis [14] was a little less conclusive. The constructed mapsand flows were less robust. By that we mean that for many seed values the iterationblew up much more rapidly. We believe that this lack of robustness may be due tothe lower signal to noise ratio (Fig. 1) for AC Her. Despite these short-comings of thereconstruction, however, everything points at the minimalembedding dimension againbeing 4. The fractal dimensiondL turned out to be lowerdL ∼ 2.3 than for R Sct.
As Fig. 1 shows the light curve of AC Her has a lot smaller amplitude swings, andhardly any phases of low amplitude oscillations. The linearpart of the map which de-scribes the vicinity of the fixed point is therefore less welldetermined, and so are thestability roots. We were therefore unable to verify whetherthe same resonant entrain-ment as in R Sct is operative in AC Her.
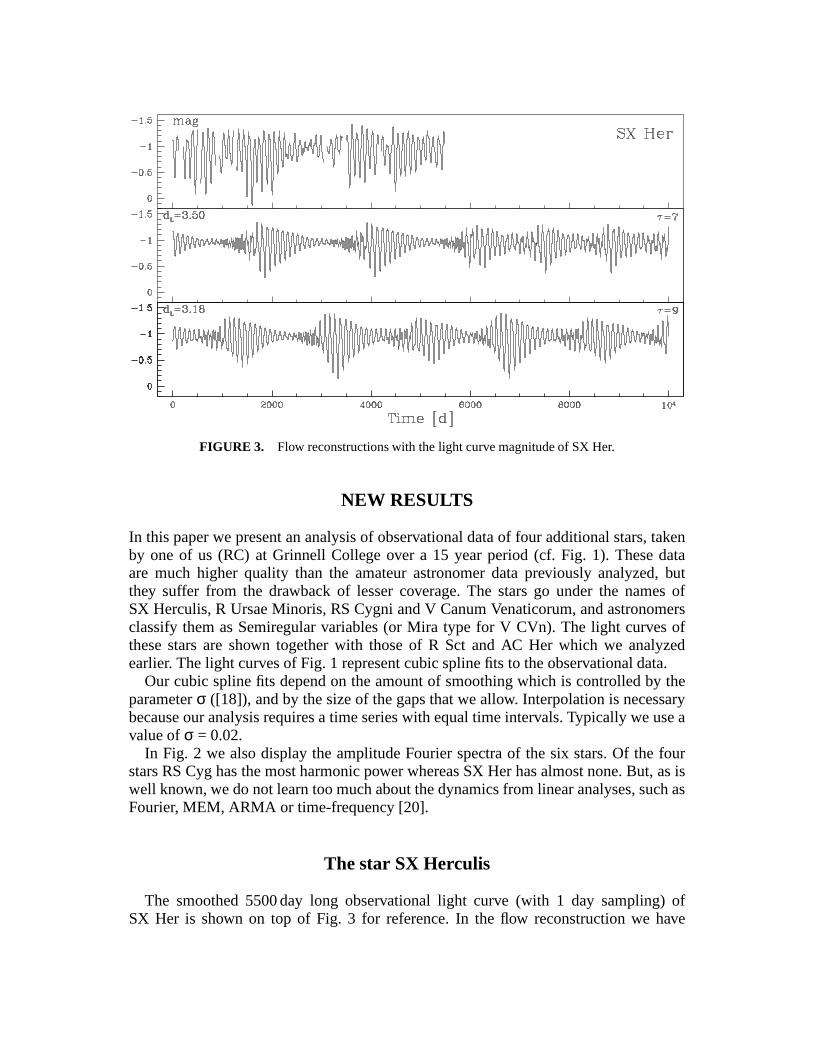
FIGURE 3. Flow reconstructions with the light curve magnitude of SX Her.
NEW RESULTS
In this paper we present an analysis of observational data offour additional stars, takenby one of us (RC) at Grinnell College over a 15 year period (cf.Fig. 1). These dataare much higher quality than the amateur astronomer data previously analyzed, butthey suffer from the drawback of lesser coverage. The stars go under the names ofSX Herculis, R Ursae Minoris, RS Cygni and V Canum Venaticorum, and astronomersclassify them as Semiregular variables (or Mira type for V CVn). The light curves ofthese stars are shown together with those of R Sct and AC Her which we analyzedearlier. The light curves of Fig. 1 represent cubic spline fits to the observational data.
Our cubic spline fits depend on the amount of smoothing which is controlled by theparameterσ ([18]), and by the size of the gaps that we allow. Interpolation is necessarybecause our analysis requires a time series with equal time intervals. Typically we use avalue ofσ = 0.02.
In Fig. 2 we also display the amplitude Fourier spectra of thesix stars. Of the fourstars RS Cyg has the most harmonic power whereas SX Her has almost none. But, as iswell known, we do not learn too much about the dynamics from linear analyses, such asFourier, MEM, ARMA or time-frequency [20].
The star SX Herculis
The smoothed 5500 day long observational light curve (with 1day sampling) ofSX Her is shown on top of Fig. 3 for reference. In the flow reconstruction we have
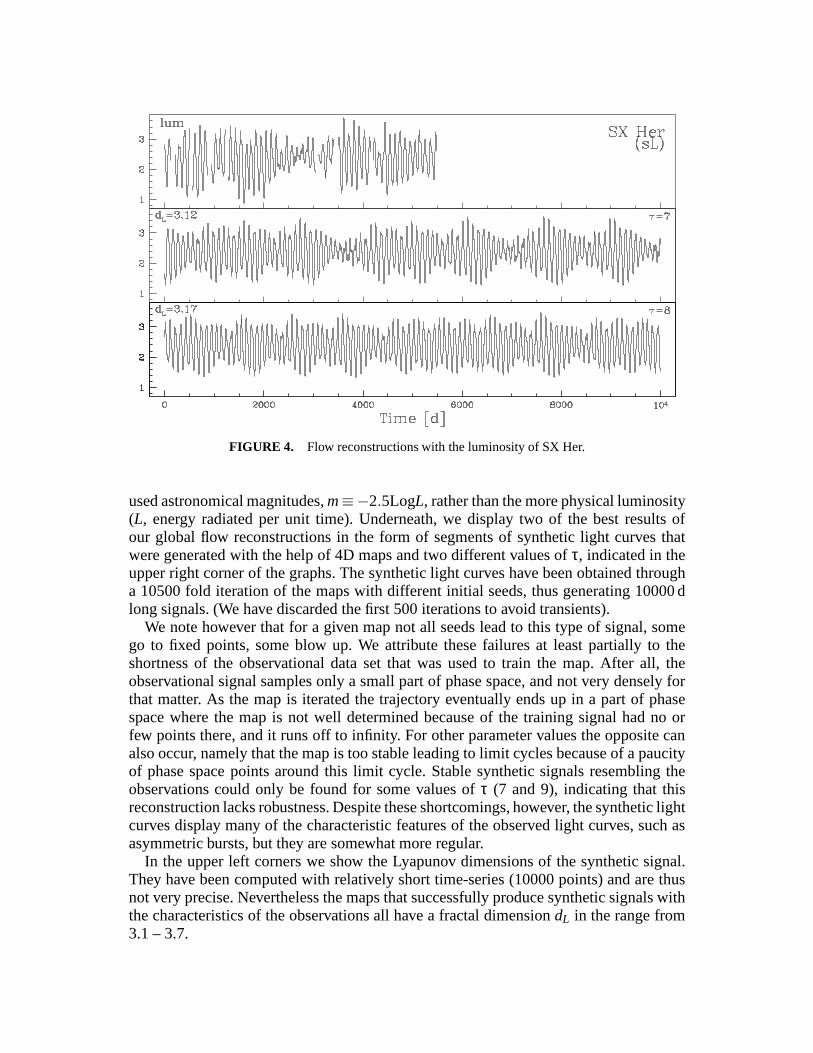
FIGURE 4. Flow reconstructions with the luminosity of SX Her.
used astronomical magnitudes,m≡−2.5LogL, rather than the more physical luminosity(L, energy radiated per unit time). Underneath, we display twoof the best results ofour global flow reconstructions in the form of segments of synthetic light curves thatwere generated with the help of 4D maps and two different values ofτ, indicated in theupper right corner of the graphs. The synthetic light curveshave been obtained througha 10500 fold iteration of the maps with different initial seeds, thus generating 10000 dlong signals. (We have discarded the first 500 iterations to avoid transients).
We note however that for a given map not all seeds lead to this type of signal, somego to fixed points, some blow up. We attribute these failures at least partially to theshortness of the observational data set that was used to train the map. After all, theobservational signal samples only a small part of phase space, and not very densely forthat matter. As the map is iterated the trajectory eventually ends up in a part of phasespace where the map is not well determined because of the training signal had no orfew points there, and it runs off to infinity. For other parameter values the opposite canalso occur, namely that the map is too stable leading to limitcycles because of a paucityof phase space points around this limit cycle. Stable synthetic signals resembling theobservations could only be found for some values ofτ (7 and 9), indicating that thisreconstruction lacks robustness. Despite these shortcomings, however, the synthetic lightcurves display many of the characteristic features of the observed light curves, such asasymmetric bursts, but they are somewhat more regular.
In the upper left corners we show the Lyapunov dimensions of the synthetic signal.They have been computed with relatively short time-series (10000 points) and are thusnot very precise. Nevertheless the maps that successfully produce synthetic signals withthe characteristics of the observations all have a fractal dimensiondL in the range from3.1 – 3.7.
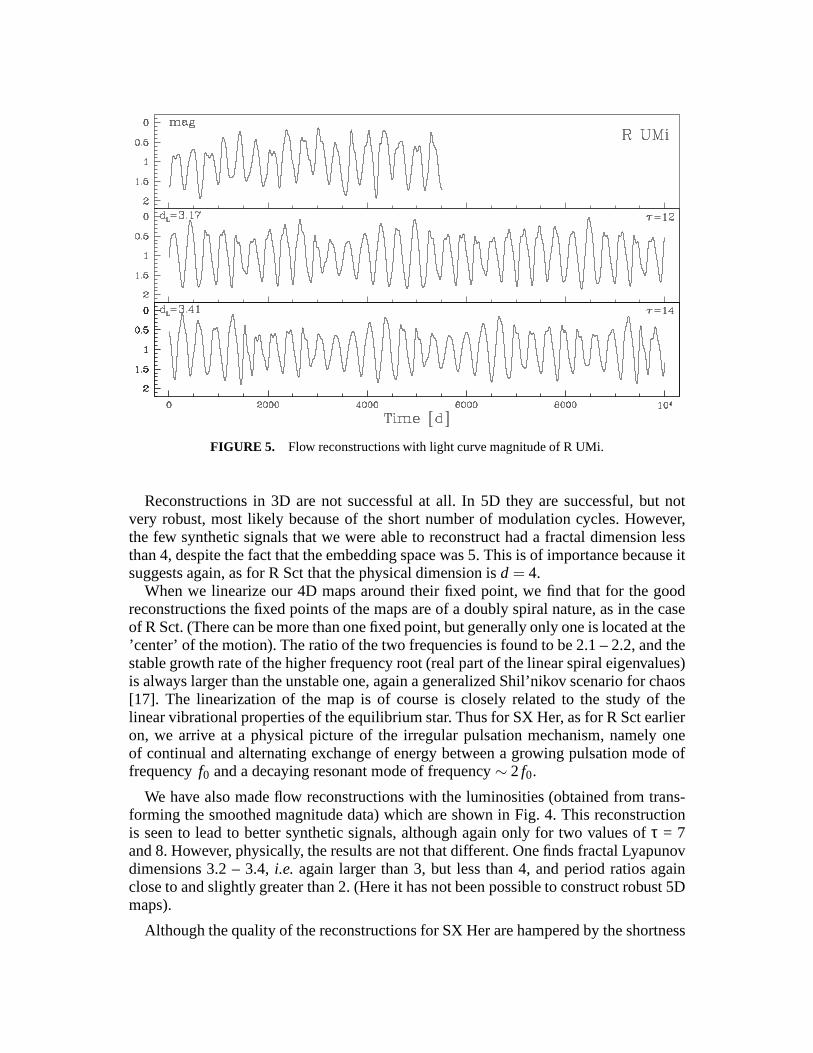
FIGURE 5. Flow reconstructions with light curve magnitude of R UMi.
Reconstructions in 3D are not successful at all. In 5D they are successful, but notvery robust, most likely because of the short number of modulation cycles. However,the few synthetic signals that we were able to reconstruct had a fractal dimension lessthan 4, despite the fact that the embedding space was 5. This is of importance because itsuggests again, as for R Sct that the physical dimension isd = 4.
When we linearize our 4D maps around their fixed point, we find that for the goodreconstructions the fixed points of the maps are of a doubly spiral nature, as in the caseof R Sct. (There can be more than one fixed point, but generallyonly one is located at the’center’ of the motion). The ratio of the two frequencies is found to be 2.1 – 2.2, and thestable growth rate of the higher frequency root (real part ofthe linear spiral eigenvalues)is always larger than the unstable one, again a generalized Shil’nikov scenario for chaos[17]. The linearization of the map is of course is closely related to the study of thelinear vibrational properties of the equilibrium star. Thus for SX Her, as for R Sct earlieron, we arrive at a physical picture of the irregular pulsation mechanism, namely oneof continual and alternating exchange of energy between a growing pulsation mode offrequencyf0 and a decaying resonant mode of frequency∼ 2 f0.
We have also made flow reconstructions with the luminosities(obtained from trans-forming the smoothed magnitude data) which are shown in Fig.4. This reconstructionis seen to lead to better synthetic signals, although again only for two values ofτ = 7and 8. However, physically, the results are not that different. One finds fractal Lyapunovdimensions 3.2 – 3.4,i.e. again larger than 3, but less than 4, and period ratios againclose to and slightly greater than 2. (Here it has not been possible to construct robust 5Dmaps).
Although the quality of the reconstructions for SX Her are hampered by the shortness

of the data set (not many modulation cycles), which shows up among other things in arelatively poor stability of the maps and in a narrow range ofvalues ofτ over whichthe reconstruction is possible, one can reasonably conclude that that the embeddingdimension is 4 and that the fractal dimension is between 3.1 and 3.8< 4.
The star R Ursae Minoris
In Figure 5 on top we display the smoothed 5500 d long R UMi observational signalthat we have used to train our maps. Underneath are two segments of synthetic signalsthat were generated from the iteration of four different reconstructed 4D maps, for valuesof τ going from 4 to 10 (days). Good synthetic signals are seen to be obtainable froma range ofτ values, even though there are some intermediate values for which no goodreconstruction has been obtained. The best 3D maps that we can construct are incapableof producing synthetic signals that bear a resemblance to the observational light curve,suggesting an embedding dimensionde = 4.
The maps for R UMi are not as robust as those for R Sct, even though the observationalaccuracy is much higher. One of the probable reasons is that there are fewer cycles in thedata. Indeed, for a successful flow reconstruction to be possible the data has to samplesufficiently well the dominant features of the dynamics in phase space. If some regionsare only covered very lightly, then the maps can have ’leaks’in such regions, and thelack of robustness manifests itself in trajectories that blow up quickly. The syntheticsignals that are constructed from the maps are therefore relatively short. It is also hardto obtain accurate Lyapunov exponents and fractal dimensions.
As for AC Her, the R UMi signal does not explore very well the linear neighborhoodof the fixed point. Consequently it is not possible to derive any information about apossible resonance.
We find that the fractal dimensions for good synthetic signals hover arounddL =3.25±0.15. Reassuringly this dimension is found to be stable in the sense that recon-structions in 5D also yielddL in the same range, and importantly that they are less than 4,i.e. independent of the dimension of the embedding space. The conclusion that imposesitself, at least tentatively, is that the physical dimension which is sandwiched betweendL ∼ 3.25 andde = 4, isd = 4 for this star as well.
The star V Canum Venaticorum
We have not been able to make a reconstruction with the smoothed magnitude datathemselves, even with various values of smoothing, although the light curve data spansome 27 cycles. The reason why our reconstruction is not successful could be that overthe 15 years of observations the light curve does not exploreits whole potential,i.e. itdoes not explore enough of the physical phase space to allow us to make a successfulreconstruction. We cannot exclude the possibility that a higher order dynamics might beat work, but then again we would need more observational information to lay it bare.Perhaps the star undergoes intermittent mass loss which causes obscuration and leads
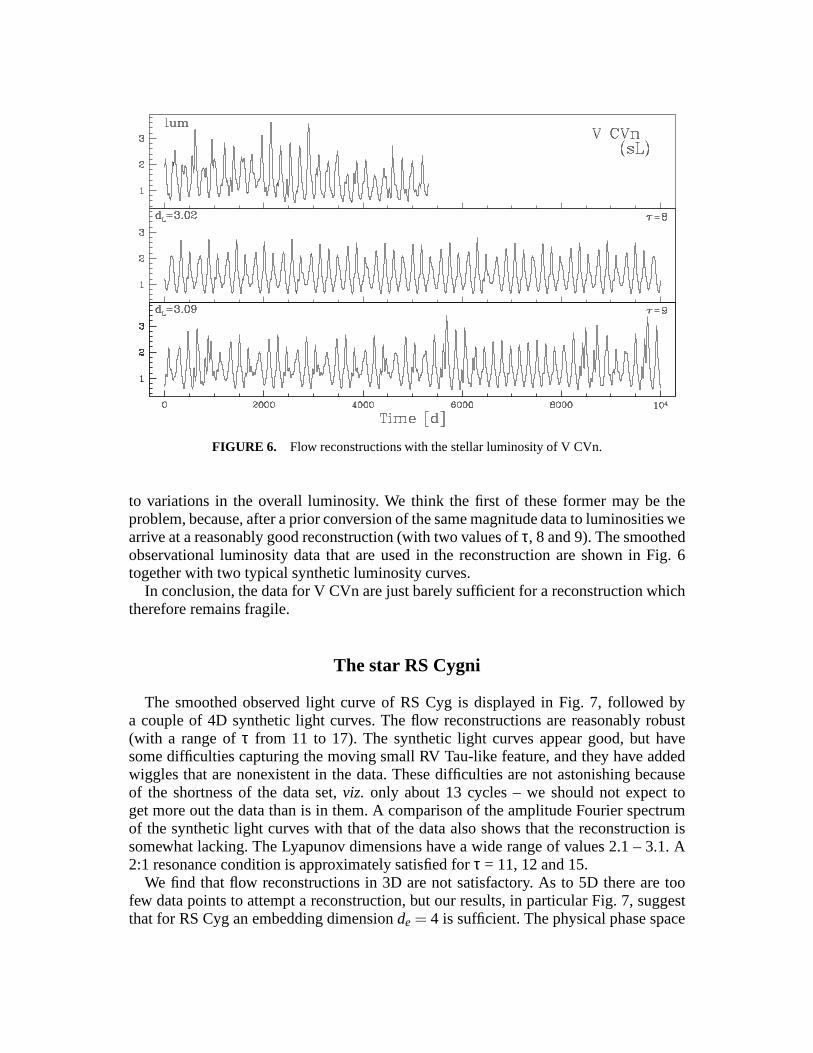
FIGURE 6. Flow reconstructions with the stellar luminosity of V CVn.
to variations in the overall luminosity. We think the first ofthese former may be theproblem, because, after a prior conversion of the same magnitude data to luminosities wearrive at a reasonably good reconstruction (with two valuesof τ, 8 and 9). The smoothedobservational luminosity data that are used in the reconstruction are shown in Fig. 6together with two typical synthetic luminosity curves.
In conclusion, the data for V CVn are just barely sufficient for a reconstruction whichtherefore remains fragile.
The star RS Cygni
The smoothed observed light curve of RS Cyg is displayed in Fig. 7, followed bya couple of 4D synthetic light curves. The flow reconstructions are reasonably robust(with a range ofτ from 11 to 17). The synthetic light curves appear good, but havesome difficulties capturing the moving small RV Tau-like feature, and they have addedwiggles that are nonexistent in the data. These difficultiesare not astonishing becauseof the shortness of the data set,viz. only about 13 cycles – we should not expect toget more out the data than is in them. A comparison of the amplitude Fourier spectrumof the synthetic light curves with that of the data also showsthat the reconstruction issomewhat lacking. The Lyapunov dimensions have a wide rangeof values 2.1 – 3.1. A2:1 resonance condition is approximately satisfied forτ = 11, 12 and 15.
We find that flow reconstructions in 3D are not satisfactory. As to 5D there are toofew data points to attempt a reconstruction, but our results, in particular Fig. 7, suggestthat for RS Cyg an embedding dimensionde = 4 is sufficient. The physical phase space
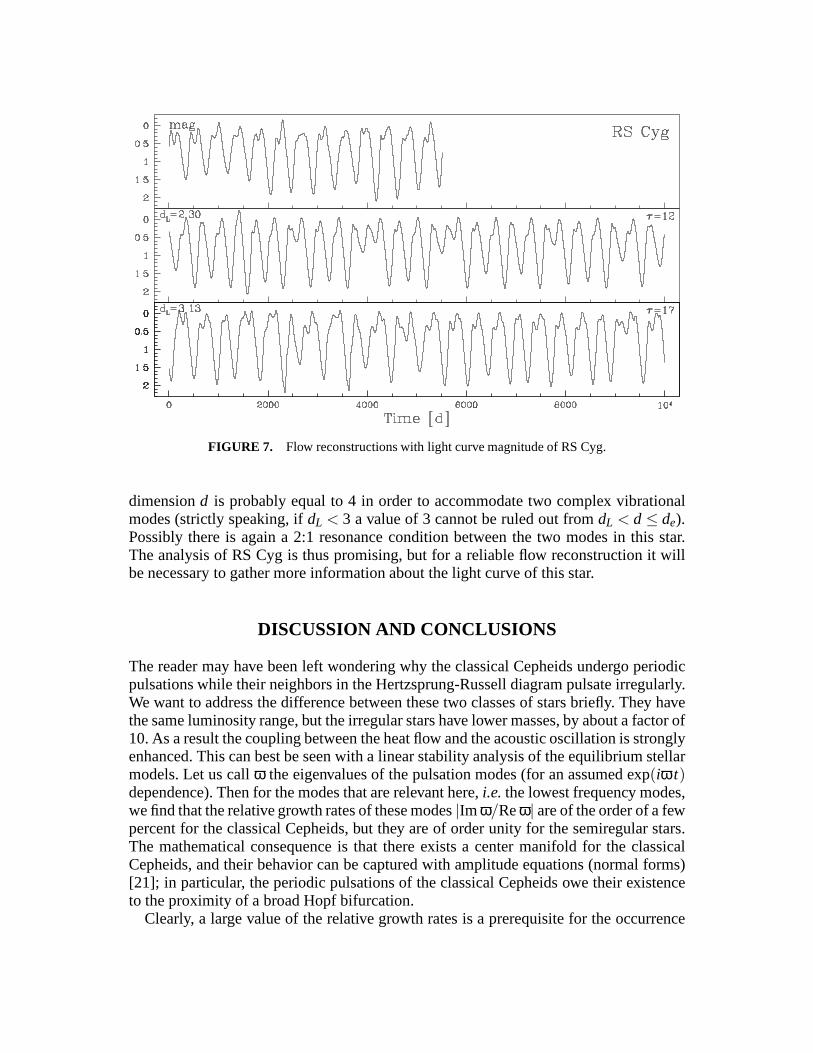
FIGURE 7. Flow reconstructions with light curve magnitude of RS Cyg.
dimensiond is probably equal to 4 in order to accommodate two complex vibrationalmodes (strictly speaking, ifdL < 3 a value of 3 cannot be ruled out fromdL < d ≤ de).Possibly there is again a 2:1 resonance condition between the two modes in this star.The analysis of RS Cyg is thus promising, but for a reliable flow reconstruction it willbe necessary to gather more information about the light curve of this star.
DISCUSSION AND CONCLUSIONS
The reader may have been left wondering why the classical Cepheids undergo periodicpulsations while their neighbors in the Hertzsprung-Russell diagram pulsate irregularly.We want to address the difference between these two classes of stars briefly. They havethe same luminosity range, but the irregular stars have lower masses, by about a factor of10. As a result the coupling between the heat flow and the acoustic oscillation is stronglyenhanced. This can best be seen with a linear stability analysis of the equilibrium stellarmodels. Let us callω the eigenvalues of the pulsation modes (for an assumed exp(iω t)dependence). Then for the modes that are relevant here,i.e. the lowest frequency modes,we find that the relative growth rates of these modes|Im ω/Reω| are of the order of a fewpercent for the classical Cepheids, but they are of order unity for the semiregular stars.The mathematical consequence is that there exists a center manifold for the classicalCepheids, and their behavior can be captured with amplitudeequations (normal forms)[21]; in particular, the periodic pulsations of the classical Cepheids owe their existenceto the proximity of a broad Hopf bifurcation.
Clearly, a large value of the relative growth rates is a prerequisite for the occurrence

of chaos (appreciable amplitude changes must be possible over a period). For the W Vir-ginis type stars at the low luminosity end the growth rates are still small, and periodicpulsations (limit cycles) prevail, just as for the classical Cepheids. For the more lumi-nous ones, such as the stars analyzed in this paper, the growth rates are of order unity,thus fulfilling the necessary condition for chaotic behavior.
We have applied the global flow reconstruction technique to the high quality observa-tional data of SX Her, R UMi, V CVn and RS Cyg. In view of the relatively small numberof observed cycles and the complexity of the light curves ourconclusions must be takenwith some caution. The flow reconstructions lack the robustness of those obtained earlierfrom the large amplitude variable star R Sct. Consequently,it is not possible to producevery long synthetic light curves by iterating the map, and the Lyapunov exponents andthe fractal dimension are therefore beset with large fluctuations from one synthetic sig-nal to another. Our flow reconstructions are best for SX Her and R UMi. For RS Cyg thetime span of the observed light curve is clearly too short. Our poor success with V CVnis perhaps related to the complexity of its light curve.
We find that the light curves of six different large amplitude, irregularly pulsating starsall indicate a minimum embedding dimension of 4, although the only reconstructionsthat have some robustness are those for R Sct and SX Her. For both of these thefractal Lyapunov dimensions fall in the range 3.1 – 3.5, and one can conclude that thedimension of the physical phase space of the dynamics is 4. This in turn suggests thatthe ’natural’ generalized coordinates in this phase space are the complex amplitudes oftwo vibrational modes.
Our analysis of both R Sct and SX Her suggests that the irregular behavior has thesame physical mechanism. The irregular behavior arises through the nonlinear interac-tion between two vibrational modes, one of lower frequency that is unstable and onewith higher frequency that is stable. Furthermore, the ratio of the two frequencies isclose to 2:1 in both stars. We thus arrive at the same physicalpicture of the underlyingmechanism for the irregular light curve. A lower frequency mode is self-excited andentrains an otherwise linearly stable overtone through a low order (2:1) resonance. Theirregular pulsation occurs as a result of continual exchange of energy between the tworesonant modes. The minimum embedding dimensions of the other four stars corrob-orate this finding although no information about a resonancecould be gotten from thelinearization of the map.
The fact that the underlying dynamics of these types of starsare low dimensionaland chaotic is not surprising, and it was in fact predicted bynumerical hydrodynamicalsimulations of W Vir type stars [15] [22]. Furthermore a topological analysis of theattractor [23] corroborated these conclusions.
The flow reconstruction technique thus has shed new light on the old mystery of thenature of the irregular pulsations of a large class of large amplitude pulsating variablestars..
ACKNOWLEDGMENTS
Work supported by the National Science Foundation and by MTA-OTKA (T-026031).

REFERENCES
1. Cox, J. P.Theory of Stellar Pulsation, Princeton Series in Astrophysics (1980).2. Arp, H. C.,Astron. J. 60, 1–11 (1955).3. Buchler, J.R. & Kovács, G.,Astrophys. J. Lett. 320, L57–62 (1987).4. Kovacs G. & Buchler J.R.,Astrophys. J. 334, 971–994 (1988).5. Aikawa, T.,Astrophys. & Space Sci. 164, 295–308 (1990).6. Buchler, J. R., Goupil, M. J. & Kovács, G.,Phys. Lett, A126, 177–180 (1987).7. Aikawa, T.,Astrophys. & Space Sci., 139, 281–293 (1987).8. Pollard, K. et al., "MACHO Observations of Type II Cepheids and RV Tauri Stars in the LMC", in
Variable Stars and the Astrophysical Returns of Microlensing Surveys, Eds. R. Ferlet, J.P. Maillard &B. Raban, Editions Frontières, pp. 219–223, (1996).
9. Buchler, J. R. & Kolláth, Z., "Nonlinear Analysis of Irregular Variables", inNonlinear Studies of StellarPulsation, Eds. M. Takeuti & D.D. Sasselov, Astrophy. & Space Sci. Lib.Ser. 257, pp. 185–213 (2000)[http://xxx.lanl.gov/abs/astro-ph/0003341].
10. Kolláth Z.,Month. Not. Roy. Astron. Soc., 247, 377–386 (1990).11. Konig, M., Paunzen, E. & Timmer,J.,Month. Not. Roy. Astron. Soc. 330, 297–301 (1999).12. Buchler, J. R., Serre, T., Kolláth, Z. & Mattei, J.Phys. Rev. Lett. 74, 842–845 (1995).13. Buchler, J. R., Kolláth, Z., Serre, T. & Mattei, J.,Astrophys. J. 462, 489–504 (1996).14. Kolláth, Z., Buchler, J. R., Serre, T. & Mattei, J.,Astron. & Astrophys. 329, 147–155 (1998).15. Serre, T., Kolláth, Z. & Buchler, J. R.,Astron. & Astrophys., 311, 833–844 (1996).16. Ott, E.,Chaos in Dynamical Systems, Cambridge Univ. Press (1993).17. Glendenning, P. & Tresser, C.,J. Physique Lett. 46, L347–352 (1985).18. Reinsch, C. H.,Numerische Mathematik, 10, 177–201 (1967).19. Buchler, J.R., "Search for Low-Dimensional Chaos in Observational Data", International School of
Physics "Enrico Fermi", Course CXXXIII,Past and Present Variability of the Solar-Terrestrial System:Measurement, Data Analysis and Theoretical Models, Eds. G. Cini Castagnoli & A. Provenzale, pp.275–288, Società Italiana de Fisica, Bologna, Italy (1996). [http://xxx.lanl.gov/abs/chao-dyn/9707012]
20. Weigend, A.S & Gershenfeld, N. A.,Time Series Prediction (Addison-Wesley: Reading) (1994).21. Buchler, J.R., "A Dynamical Systems Approach to Nonlinear Stellar Pulsations", inNonlinear Phe-
nomena in Stellar Variability, Eds. M. Takeuti & J.R. Buchler, Dordrecht: Kluwer Publishers, reprintedfrom Astrophys. & Space Sci, 210, pp. 1–31 (1993).
22. Serre, T., Kolláth, Z. & Buchler, J. R.,Astron. & Astrophys., 311, 845–851 (1996).23. Letellier, C., Gouesbet, G., Soufi, F., Buchler, J.R.& Kolláth, Z.Chaos, 6 (3), 466–476 (1996).