chapter 03 control charts · control charts for and r notation for variables control charts • n -...
TRANSCRIPT
08/02/1439
1
Prof. Mohamed Aichouni
Lectures notes adapted from: PowerPoint presentation to accompany
Besterfield, Quality Improvement, 9th edition
Prof. Mohamed Aichouni
Lectures notes adapted from: PowerPoint presentation to accompany
Besterfield, Quality Improvement, 9th edition
Chapter 03 Control Charts
University of Hail College of Engineering
QEM 511 - Total Quality Management
Process Variations and Quality
• Quality is inversely proportional to variability (Variability & Quality are enemies).
• The more variation in product characteristics, in delivery times, in work practices: the more waste, higher costs and poor quality, is delivered to our customers.
(Out of the Crisis, 1982)
08/02/1439
2
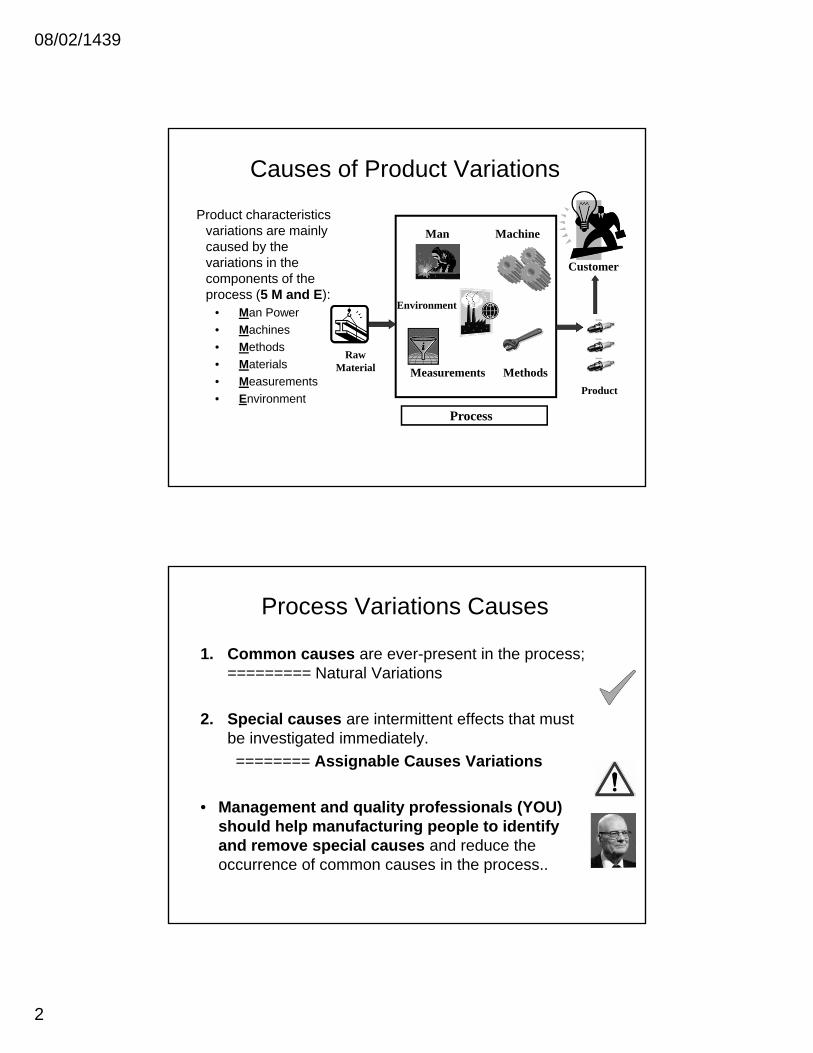
Causes of Product Variations
Product characteristics variations are mainly caused by the variations in the components of the process (5 M and E):
• Man Power
• Machines
• Methods
• Materials
• Measurements
• Environment
Raw Material
Process
Product
Man Machine
Measurements Methods
Customer
Environment
Process Variations Causes
1. Common causes are ever-present in the process; ========= Natural Variations
2. Special causes are intermittent effects that must be investigated immediately.
======== Assignable Causes Variations
• Management and quality professionals (YOU) should help manufacturing people to identify and remove special causes and reduce the occurrence of common causes in the process..
08/02/1439
3
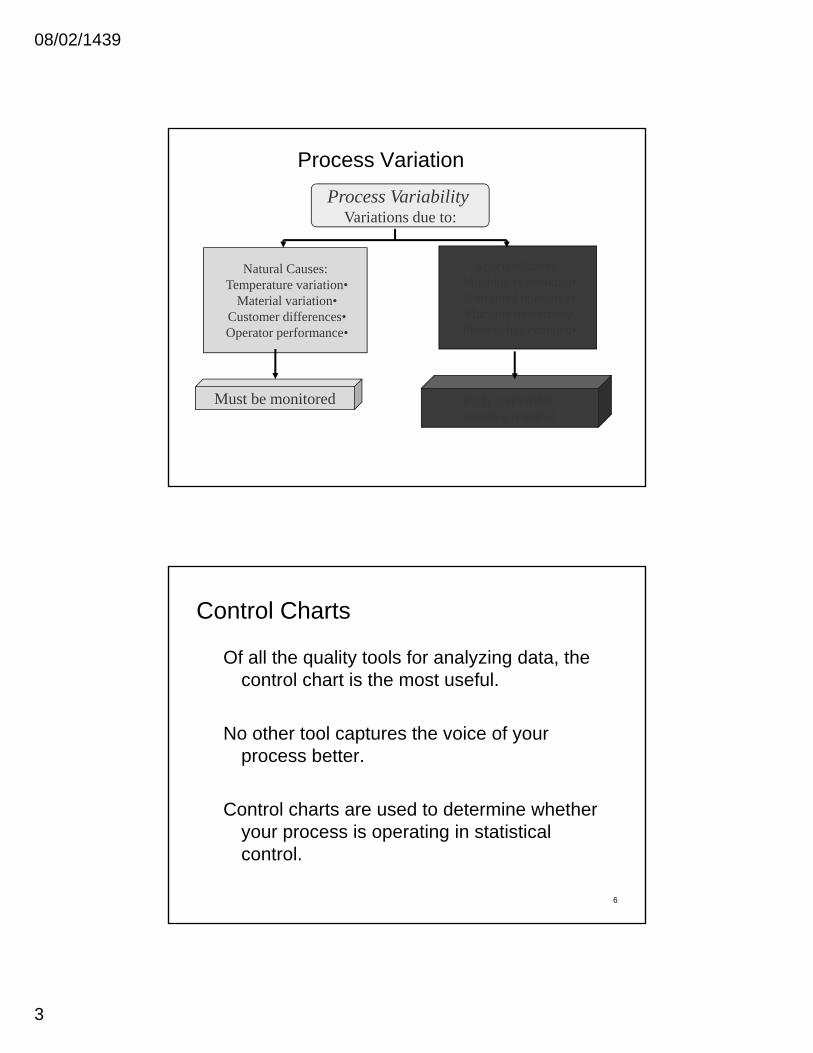
Process Variation
Process Variability Variations due to:
Natural Causes:•Temperature variation
•Material variation•Customer differences•Operator performance
Special Causes:•Machine is breaking•Untrained operative•Machine movement•Process has changed
Must be monitored Early and visible warning required
6
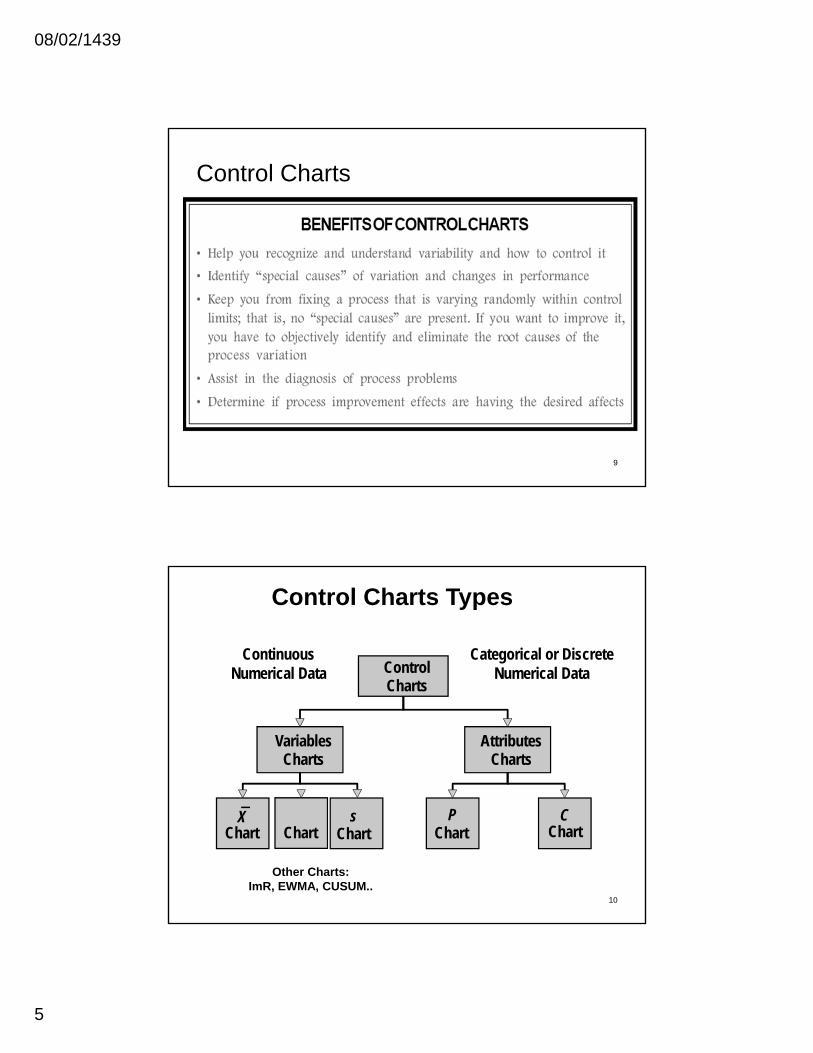
Of all the quality tools for analyzing data, the control chart is the most useful.
No other tool captures the voice of your process better.
Control charts are used to determine whether your process is operating in statistical control.
Control Charts
08/02/1439
4
7
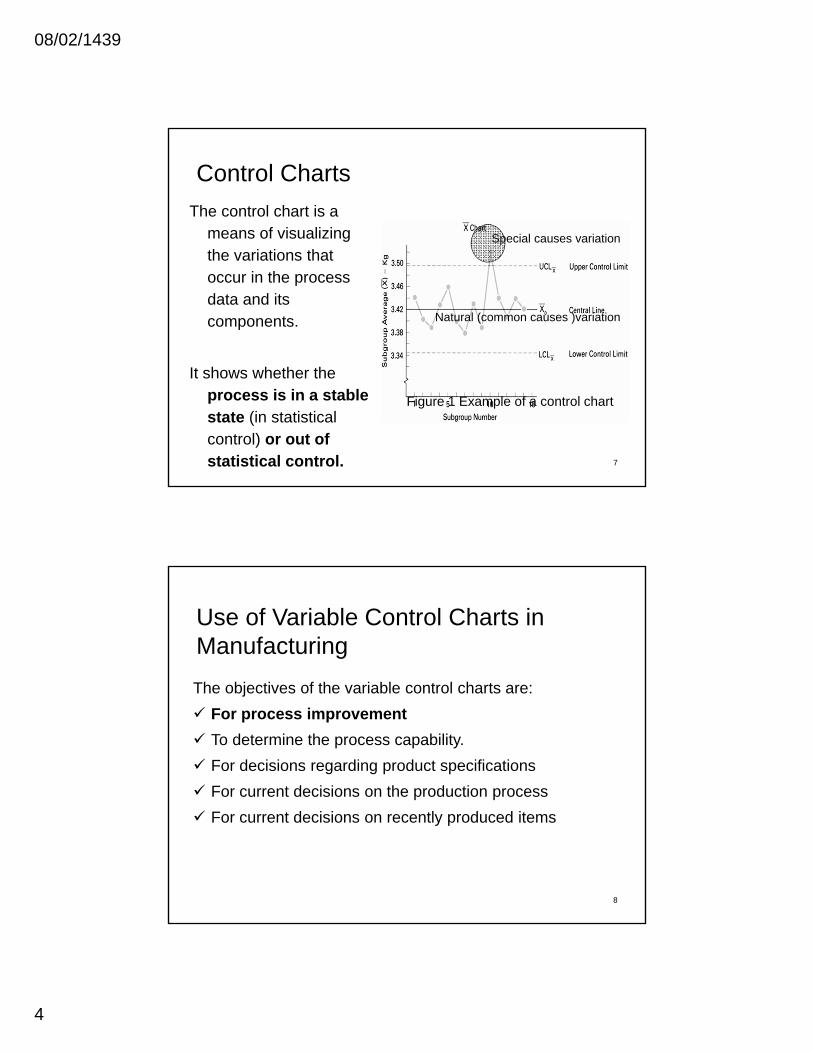
The control chart is a means of visualizing the variations that occur in the process data and its components.
It shows whether the process is in a stable state (in statistical control) or out of statistical control.
Control Charts
Figure 1 Example of a control chart
Special causes variation
Natural (common causes )variation
8
The objectives of the variable control charts are:
For process improvement
To determine the process capability.
For decisions regarding product specifications
For current decisions on the production process
For current decisions on recently produced items
Use of Variable Control Charts in Manufacturing
08/02/1439
5
9
Control Charts
10
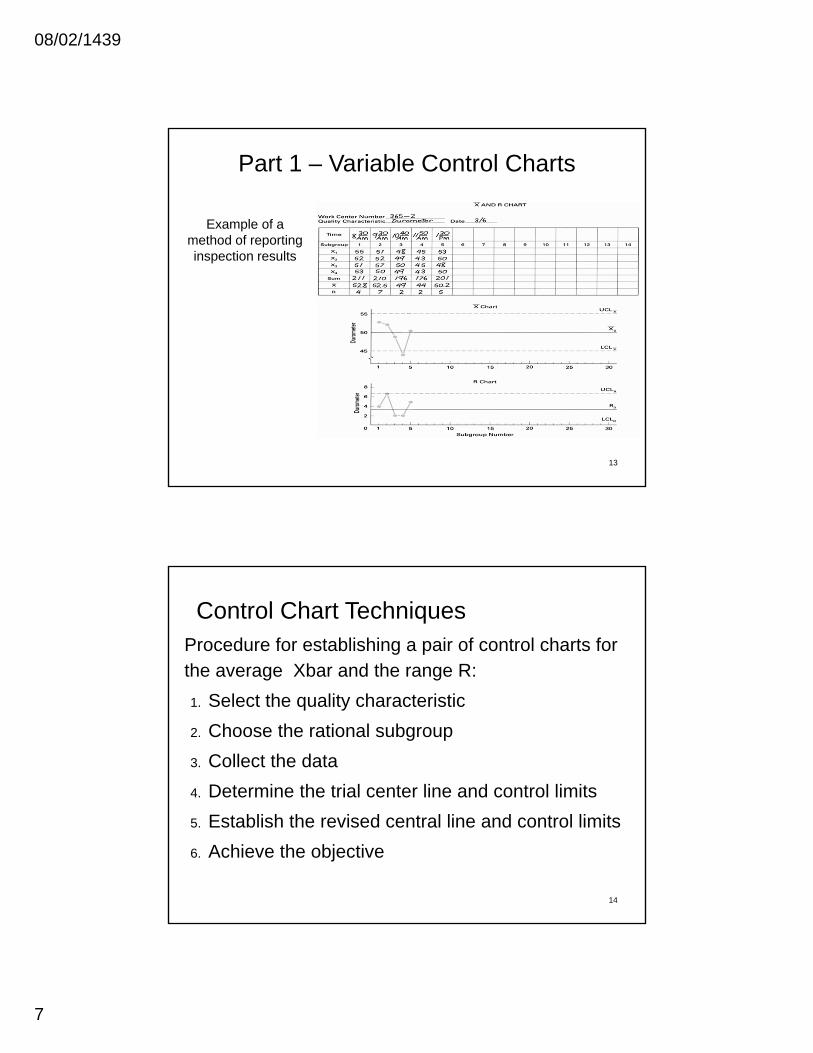
ControlCharts
RChart
VariablesCharts
AttributesCharts
XChart
PChart
CChart
Continuous Numerical Data
Categorical or Discrete Numerical Data
Control Charts Types
sChart
Other Charts: ImR, EWMA, CUSUM..

08/02/1439
6
11
control charts help to determine if the process is :
(a) in statistical control ; or (b) out of statistical control.
Variable Control Charts Interpretation
Quality Characteristic
• Variable - a single quality characteristic that can be measured on a numerical scale.
• When working with variables, we should monitor both the mean value of the characteristic and the variability associated with the characteristic.
The Quality characteristic must be measurable.
It can expressed in terms of the seven basic units:
1. Length
2. Mass
3. Time
4. Electrical current
5. Temperature
6. Substance
7. Luminosity
08/02/1439
7
13
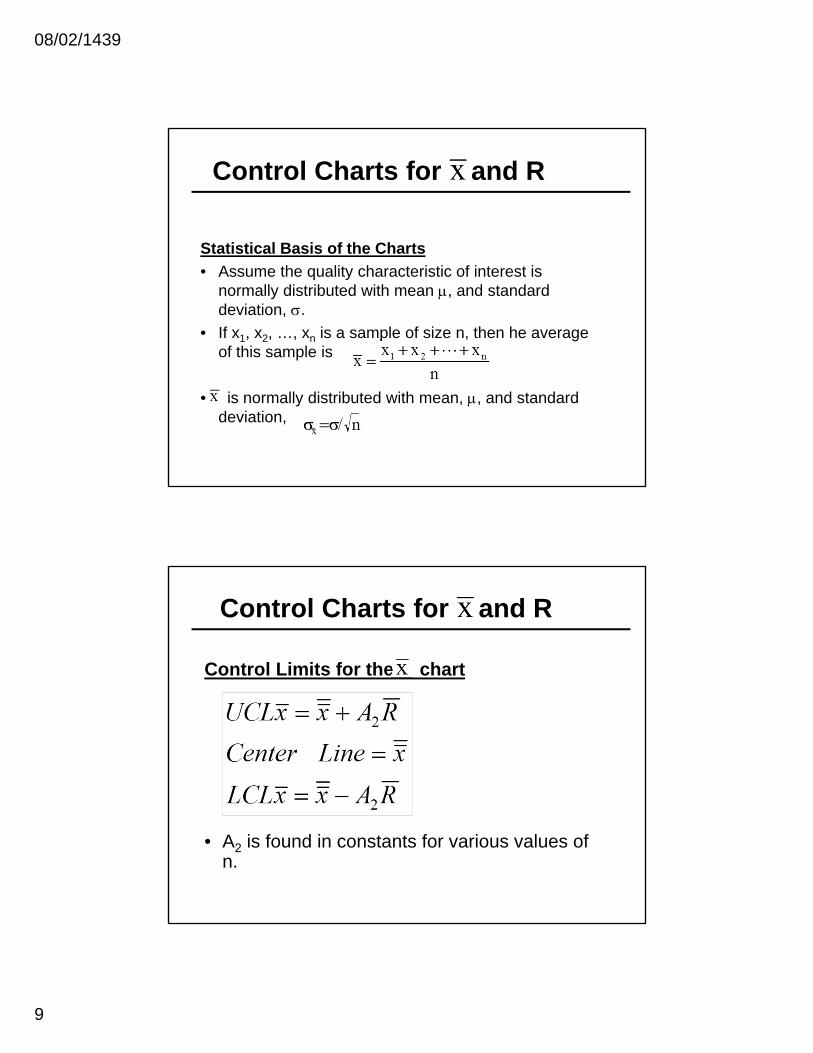
Part 1 – Variable Control Charts
Example of a method of reporting inspection results
14
Procedure for establishing a pair of control charts for the average Xbar and the range R:
1. Select the quality characteristic
2. Choose the rational subgroup
3. Collect the data
4. Determine the trial center line and control limits
5. Establish the revised central line and control limits
6. Achieve the objective
Control Chart Techniques

08/02/1439
8
Control Charts for and R
Notation for variables control charts• n - size of the sample (sometimes called a
subgroup) chosen at a point in time• m - number of samples selected• = average of the observations in the ith
sample (where i = 1, 2, ..., m)• = grand average or “average of the
averages (this value is used as the center line of the control chart)
Control Charts for and R
Notation and values
• Ri = range of the values in the ith sample
Ri = xmax - xmin
• = average range for all m samples
• is the true process mean
• is the true process standard deviation
08/02/1439
9
Control Charts for and R
Statistical Basis of the Charts
• Assume the quality characteristic of interest is normally distributed with mean , and standard deviation, .
• If x1, x2, …, xn is a sample of size n, then he average of this sample is
• is normally distributed with mean, , and standard deviation,
Control Charts for and R
Control Limits for the chart
• A2 is found in constants for various values of n.
08/02/1439
10
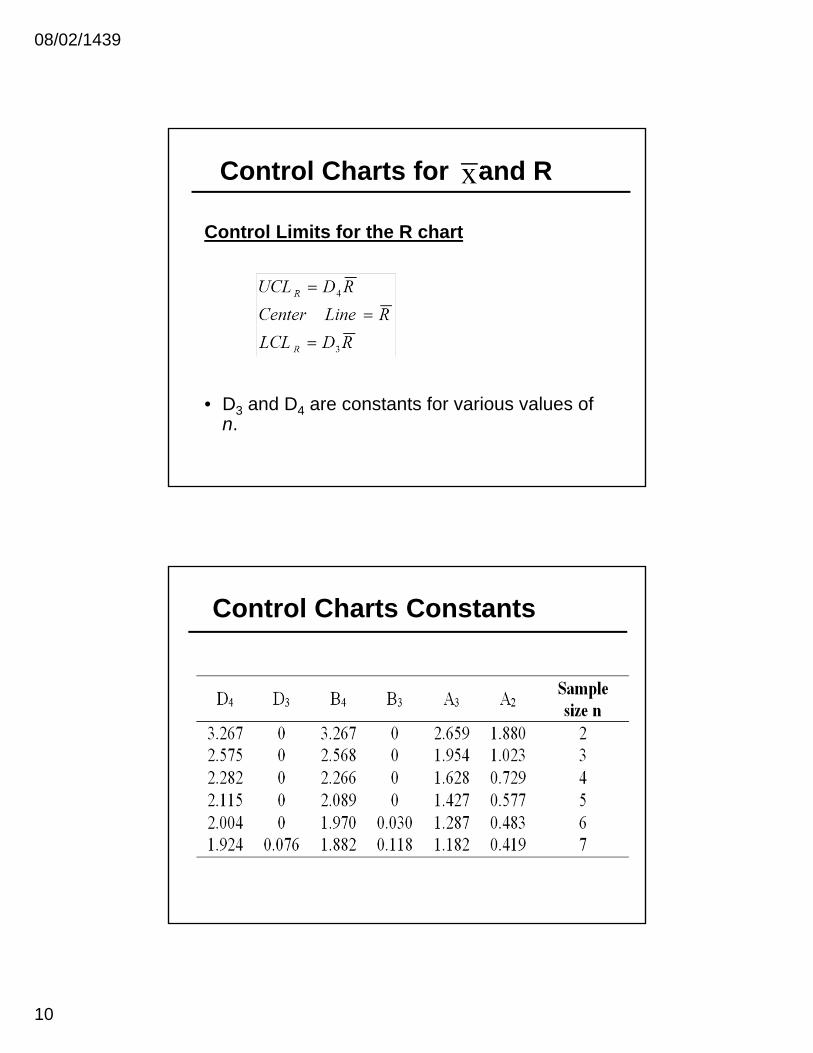
Control Charts for and R
Control Limits for the R chart
• D3 and D4 are constants for various values of n.
Control Charts Constants
08/02/1439
11
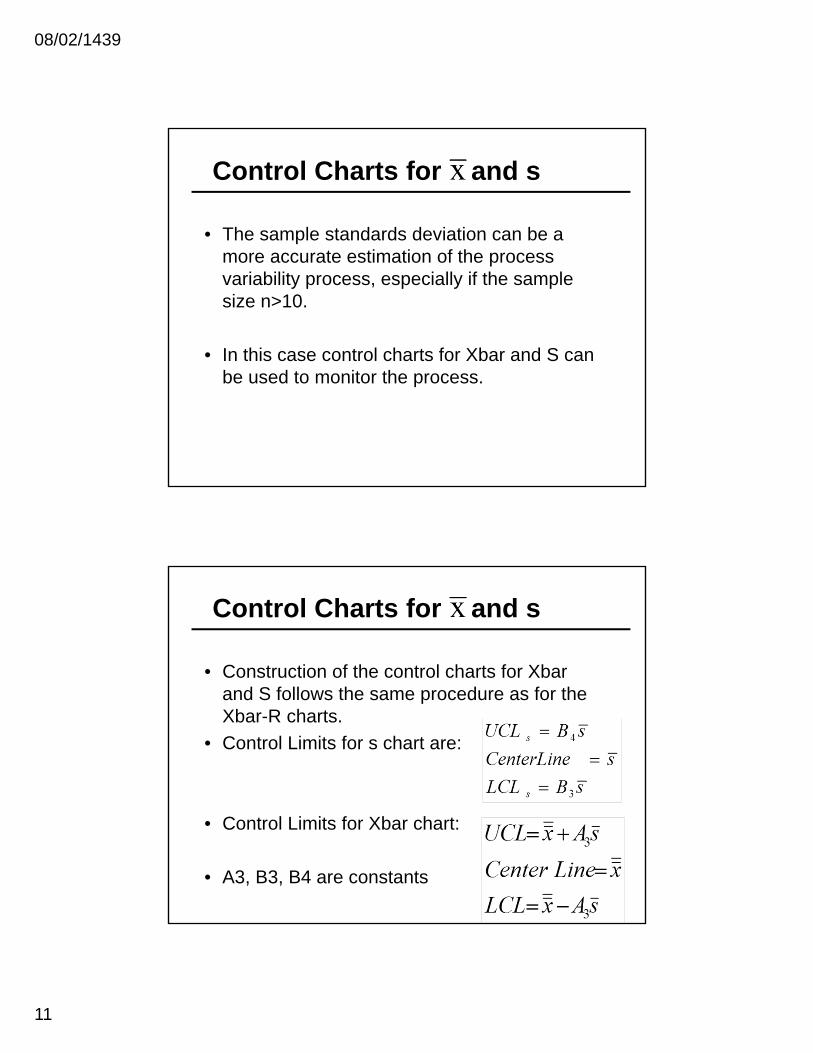
Control Charts for and s
• The sample standards deviation can be a more accurate estimation of the process variability process, especially if the sample size n>10.
• In this case control charts for Xbar and S can be used to monitor the process.
Control Charts for and s
• Construction of the control charts for Xbar and S follows the same procedure as for the Xbar-R charts.
• Control Limits for s chart are:
• Control Limits for Xbar chart:
• A3, B3, B4 are constants
08/02/1439
12
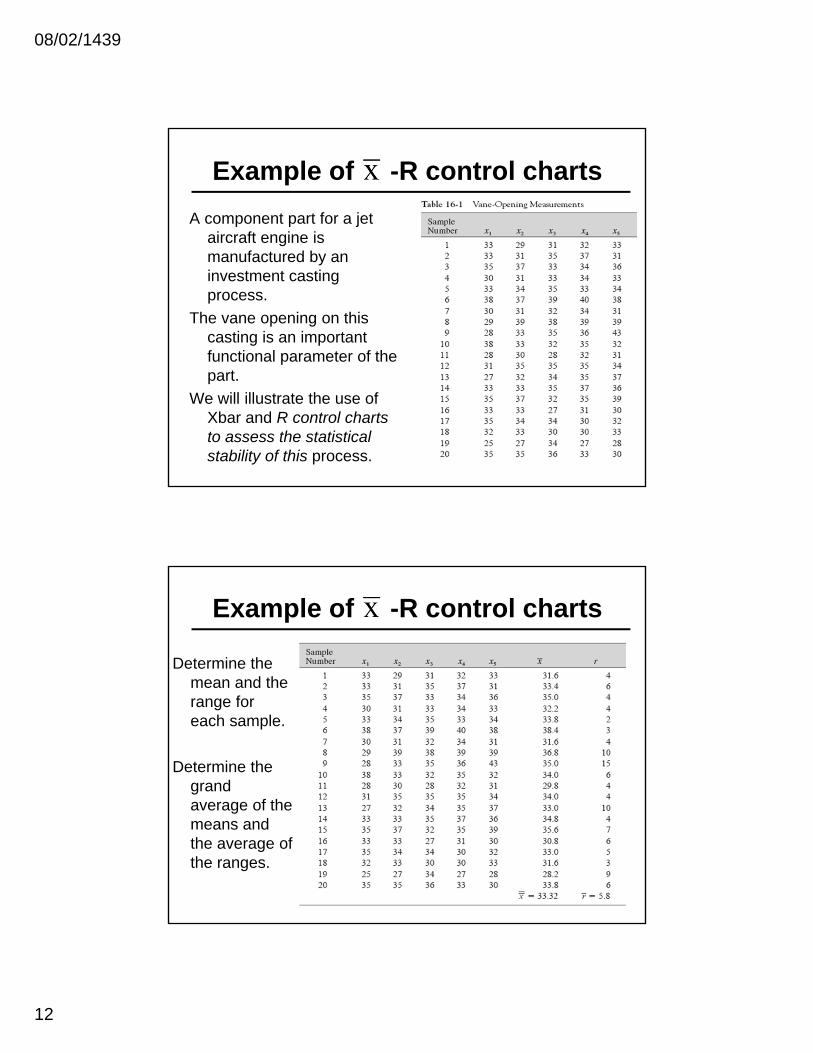
Example of -R control charts
A component part for a jet aircraft engine is manufactured by an investment casting process.
The vane opening on this casting is an important functional parameter of the part.
We will illustrate the use of Xbar and R control charts to assess the statistical stability of this process.
Example of -R control charts
Determine the mean and the range for each sample.
Determine the grand average of the means and the average of the ranges.
08/02/1439
13
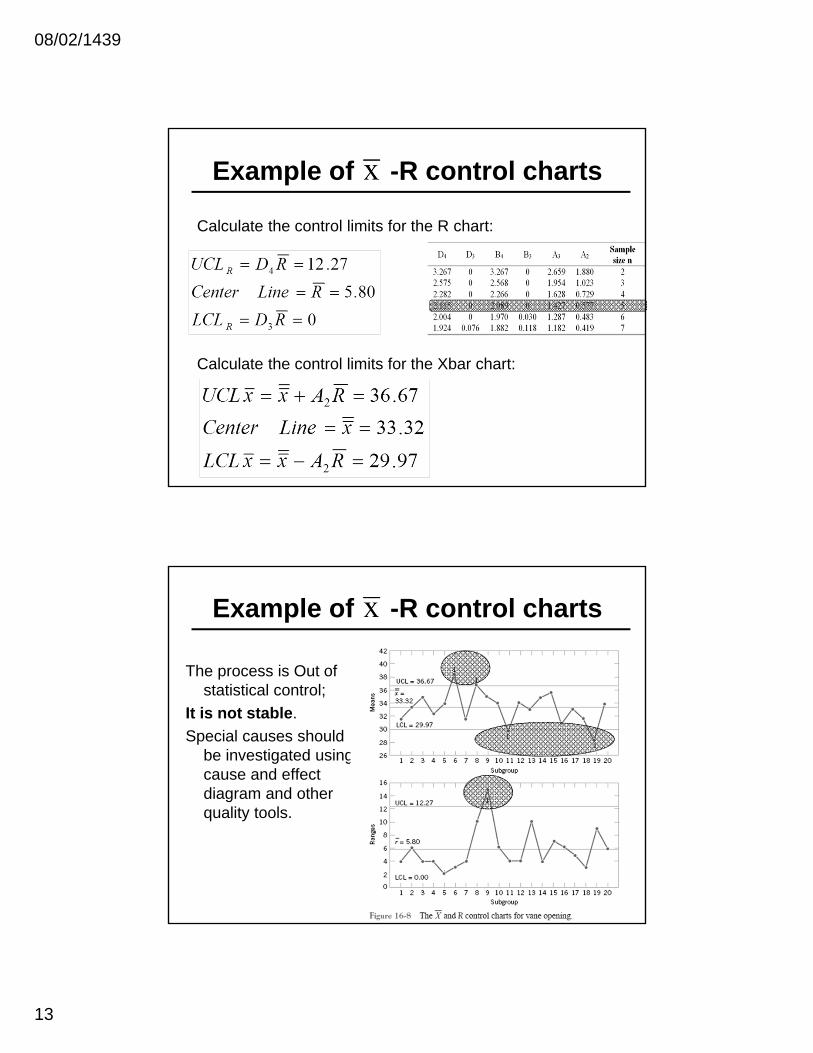
Example of -R control charts
Calculate the control limits for the R chart:
Calculate the control limits for the Xbar chart:
Example of -R control charts
The process is Out of statistical control;
It is not stable.
Special causes should be investigated using cause and effect diagram and other quality tools.
08/02/1439
14
Other Control Charts for variables
1. Individual Moving Range Charts
2. Exponentially Weighted Mean Average (EWMA) charts
3. Cumulative Sum (CUSUM) chart.
Student should search on the net for the use of these charts
PART 2
CONTROL CHARTS FOR ATTRIBUTES
08/02/1439
15
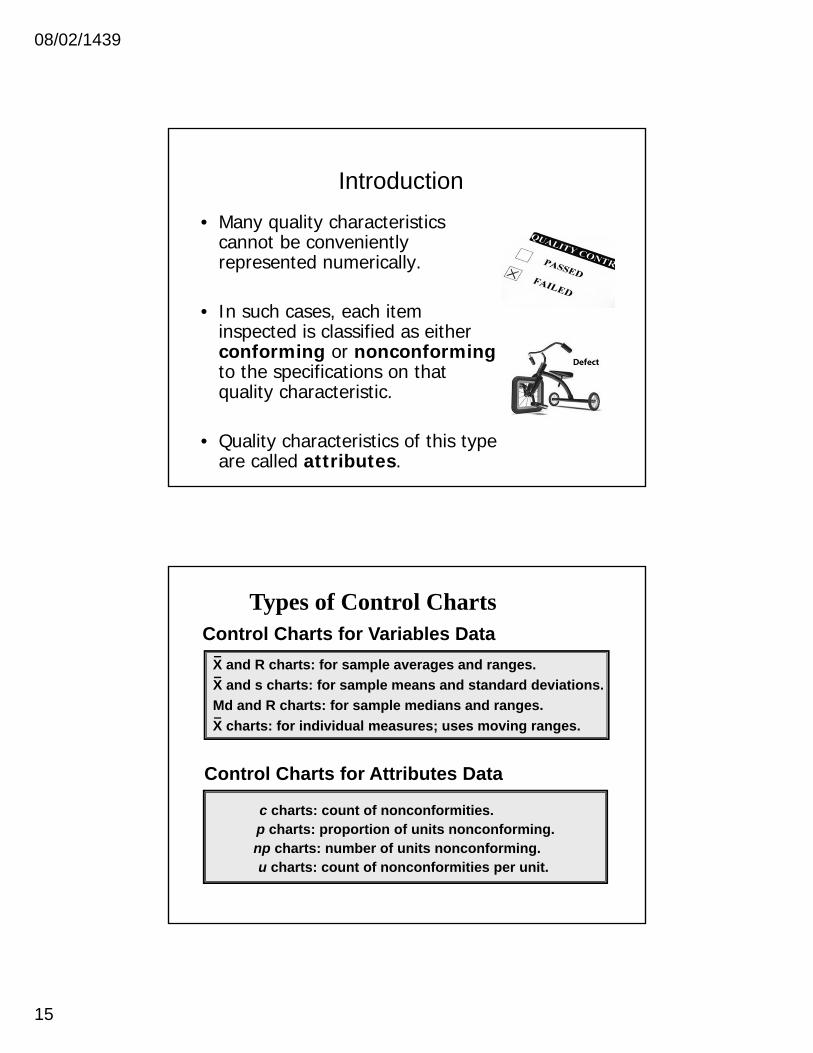
Introduction
• Many quality characteristics cannot be conveniently represented numerically.
• In such cases, each item inspected is classified as either conforming or nonconformingto the specifications on that quality characteristic.
• Quality characteristics of this type are called attributes.
p charts: proportion of units nonconforming.np charts: number of units nonconforming.
c charts: count of nonconformities.
u charts: count of nonconformities per unit.
Control Charts for Variables Data
X and R charts: for sample averages and ranges.
Md and R charts: for sample medians and ranges.
X and s charts: for sample means and standard deviations.
X charts: for individual measures; uses moving ranges.
Types of Control Charts
Control Charts for Attributes Data
08/02/1439
16
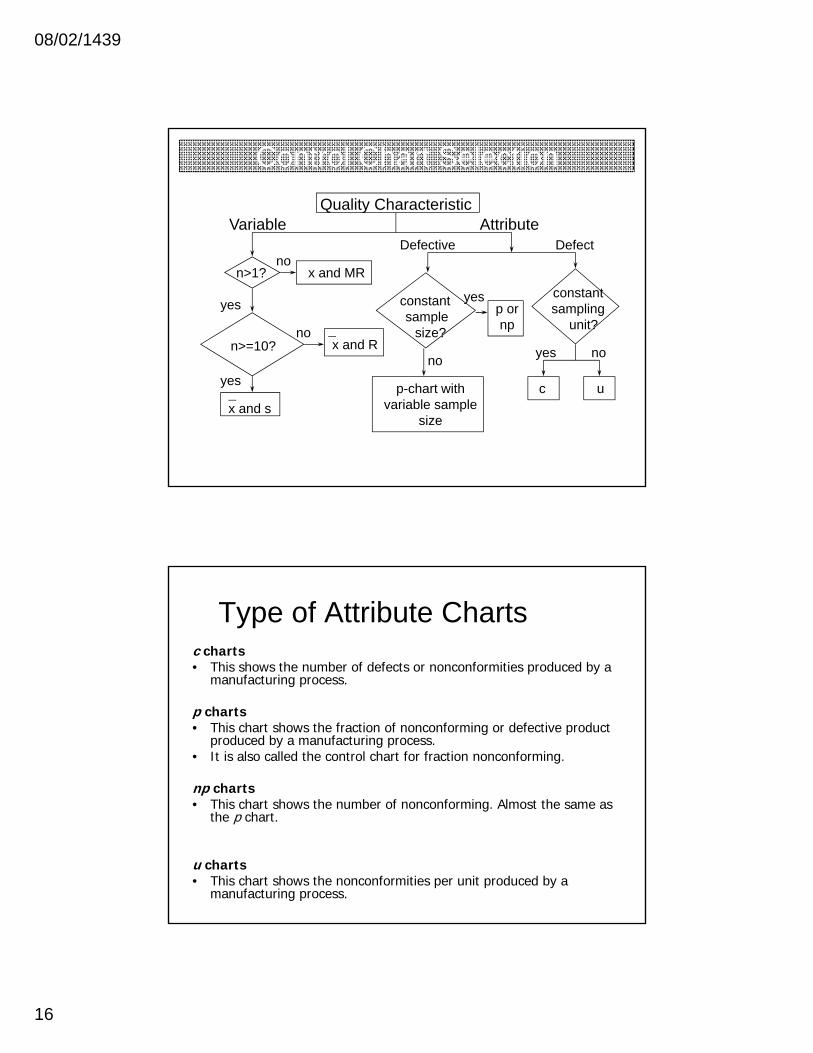
Quality CharacteristicVariable Attribute
n>1?
n>=10?
x and MRno
yes
x and s
x and Rno
yes
Defective Defect
constantsample
size?
p-chart withvariable sample
size
no
p ornp
yes constantsampling
unit?
c u
yes no
Control Chart Selection
Type of Attribute Chartsc charts• This shows the number of defects or nonconformities produced by a
manufacturing process.
p charts• This chart shows the fraction of nonconforming or defective product
produced by a manufacturing process. • It is also called the control chart for fraction nonconforming.
np charts• This chart shows the number of nonconforming. Almost the same as
the p chart.
u charts• This chart shows the nonconformities per unit produced by a
manufacturing process.
08/02/1439
17
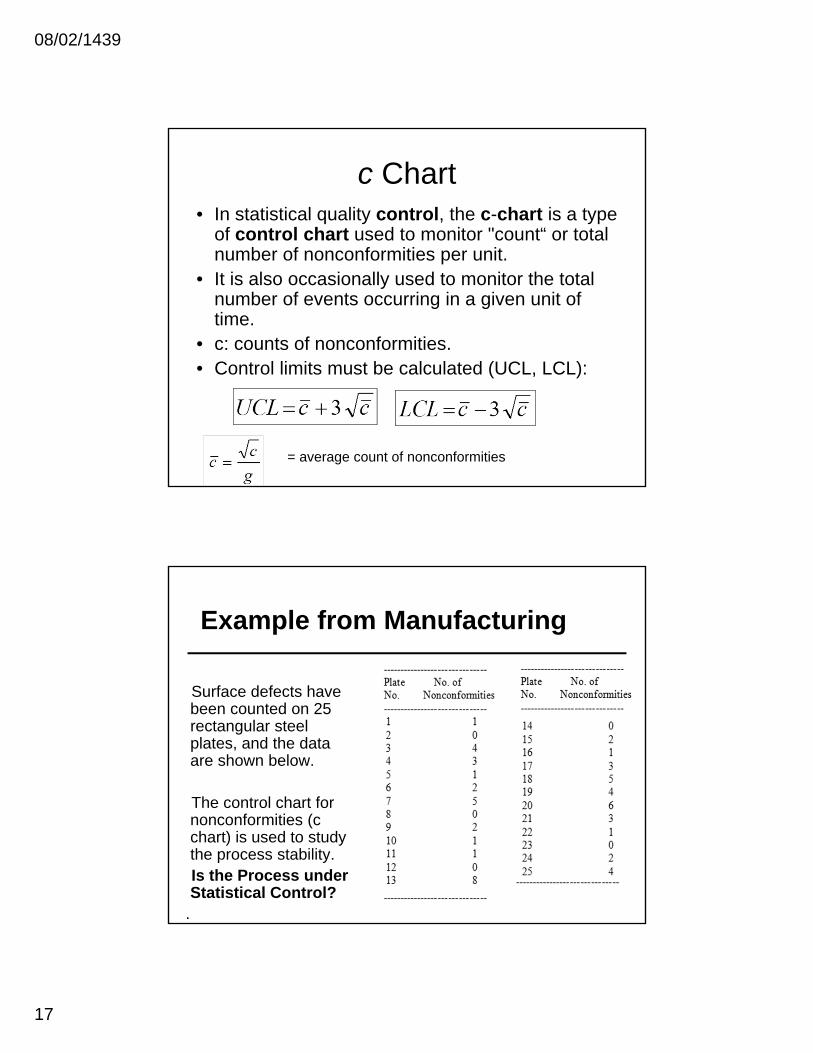
c Chart• In statistical quality control, the c-chart is a type
of control chart used to monitor "count“ or total number of nonconformities per unit.
• It is also occasionally used to monitor the total number of events occurring in a given unit of time.
• c: counts of nonconformities.• Control limits must be calculated (UCL, LCL):
= average count of nonconformities
Example from Manufacturing
Surface defects have been counted on 25 rectangular steel plates, and the data are shown below.
The control chart for nonconformities (c chart) is used to study the process stability.Is the Process under Statistical Control?
.
08/02/1439
18
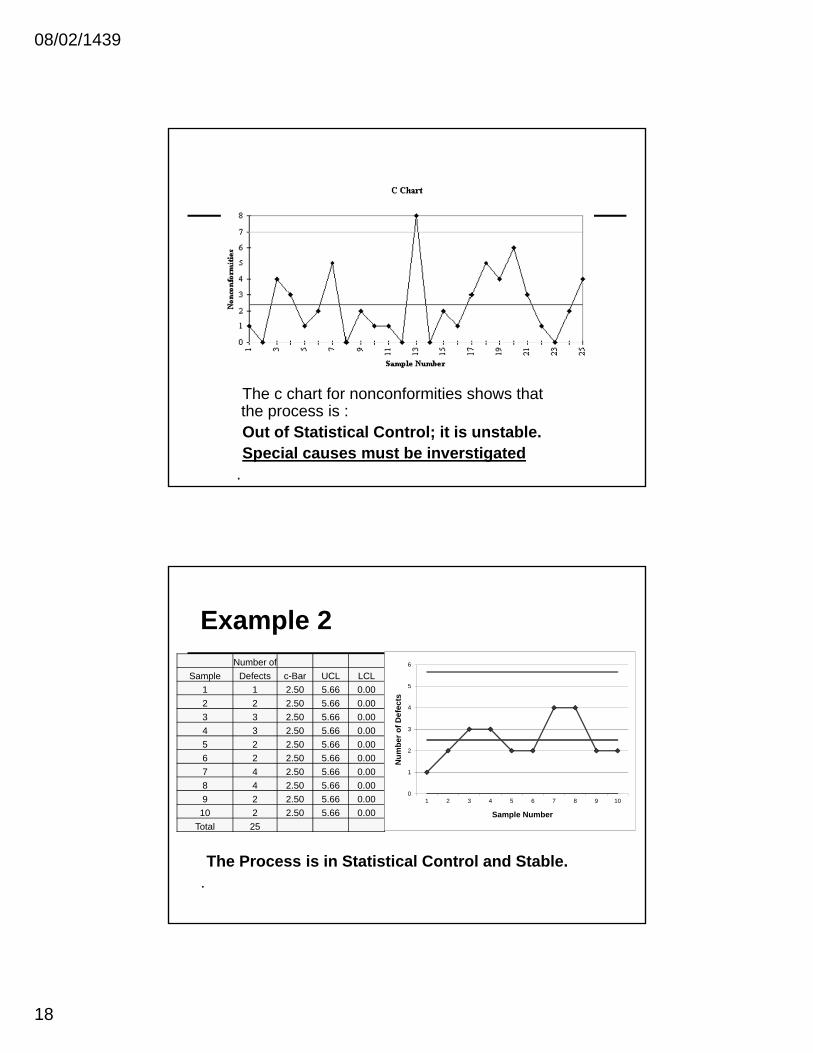
The c chart for nonconformities shows that the process is :Out of Statistical Control; it is unstable.Special causes must be inverstigated
.
Example 2
The Process is in Statistical Control and Stable..
Number of
Sample Defects c-Bar UCL LCL
1 1 2.50 5.66 0.00
2 2 2.50 5.66 0.00
3 3 2.50 5.66 0.00
4 3 2.50 5.66 0.00
5 2 2.50 5.66 0.00
6 2 2.50 5.66 0.00
7 4 2.50 5.66 0.00
8 4 2.50 5.66 0.00
9 2 2.50 5.66 0.00
10 2 2.50 5.66 0.00
Total 25
0
1
2
3
4
5
6
1 2 3 4 5 6 7 8 9 10
Nu
mb
er o
f D
efe
cts
Sample Number
08/02/1439
19
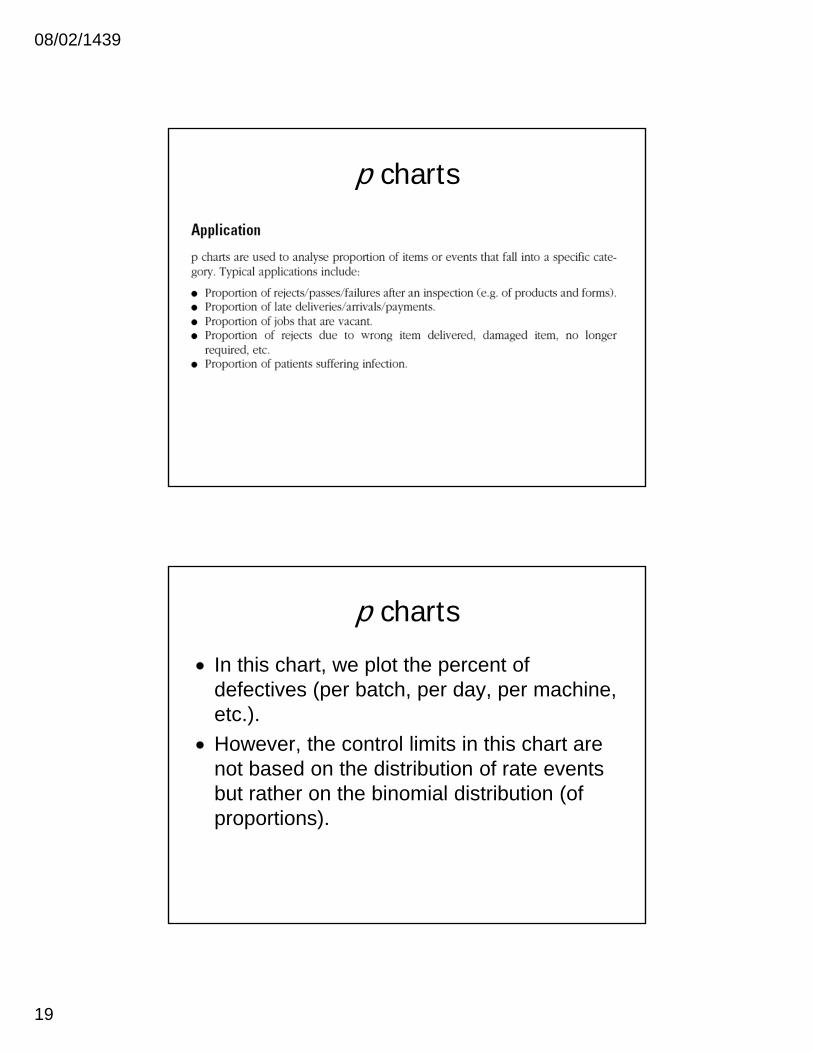
p charts
p charts
In this chart, we plot the percent of defectives (per batch, per day, per machine, etc.).
However, the control limits in this chart are not based on the distribution of rate events but rather on the binomial distribution (of proportions).
08/02/1439
20
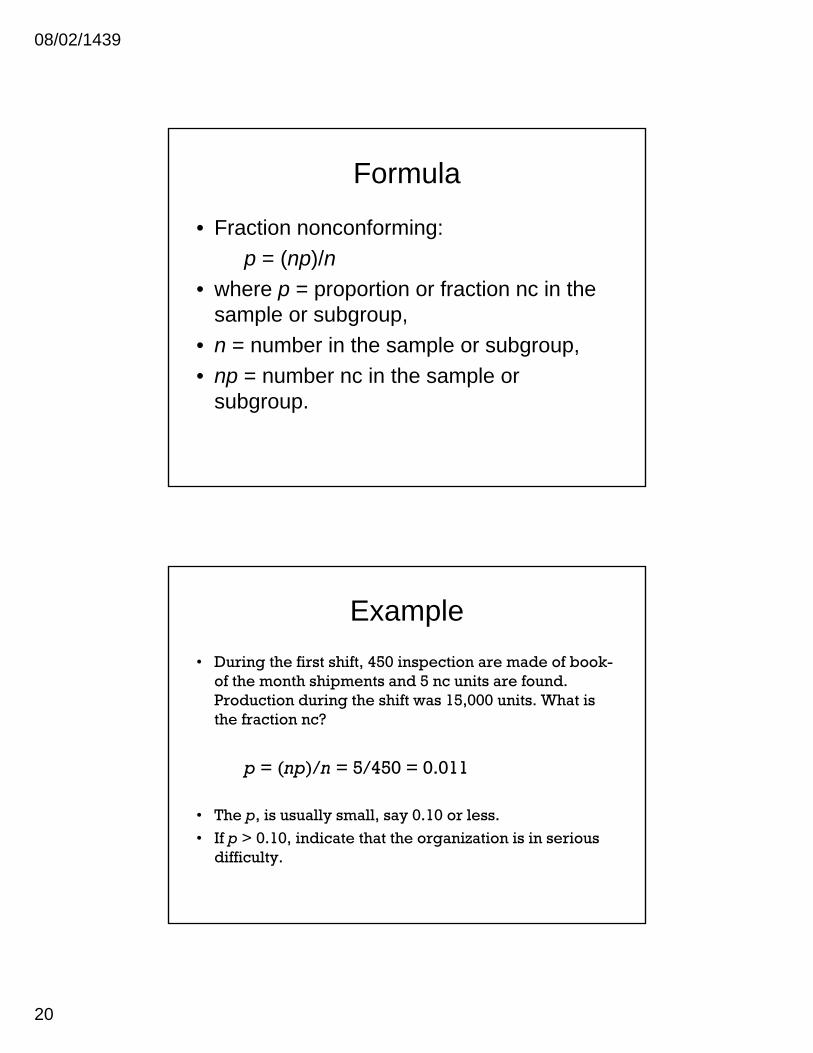
Formula
• Fraction nonconforming:
p = (np)/n
• where p = proportion or fraction nc in the sample or subgroup,
• n = number in the sample or subgroup,
• np = number nc in the sample or subgroup.
Example
• During the first shift, 450 inspection are made of book-of the month shipments and 5 nc units are found. Production during the shift was 15,000 units. What is the fraction nc?
p = (np)/n = 5/450 = 0.011
• The p, is usually small, say 0.10 or less.
• If p > 0.10, indicate that the organization is in serious difficulty.
08/02/1439
21
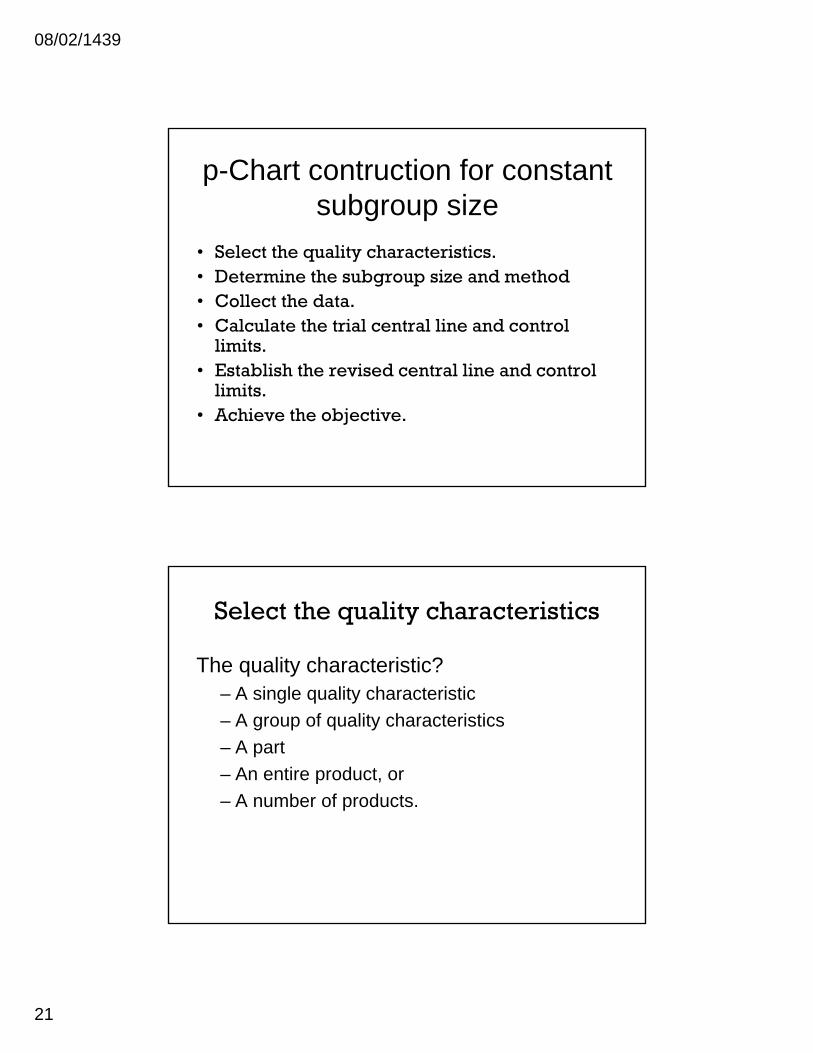
p-Chart contruction for constant subgroup size
• Select the quality characteristics.• Determine the subgroup size and method• Collect the data.• Calculate the trial central line and control
limits.• Establish the revised central line and control
limits.• Achieve the objective.
Select the quality characteristics
The quality characteristic?– A single quality characteristic
– A group of quality characteristics
– A part
– An entire product, or
– A number of products.
08/02/1439
22
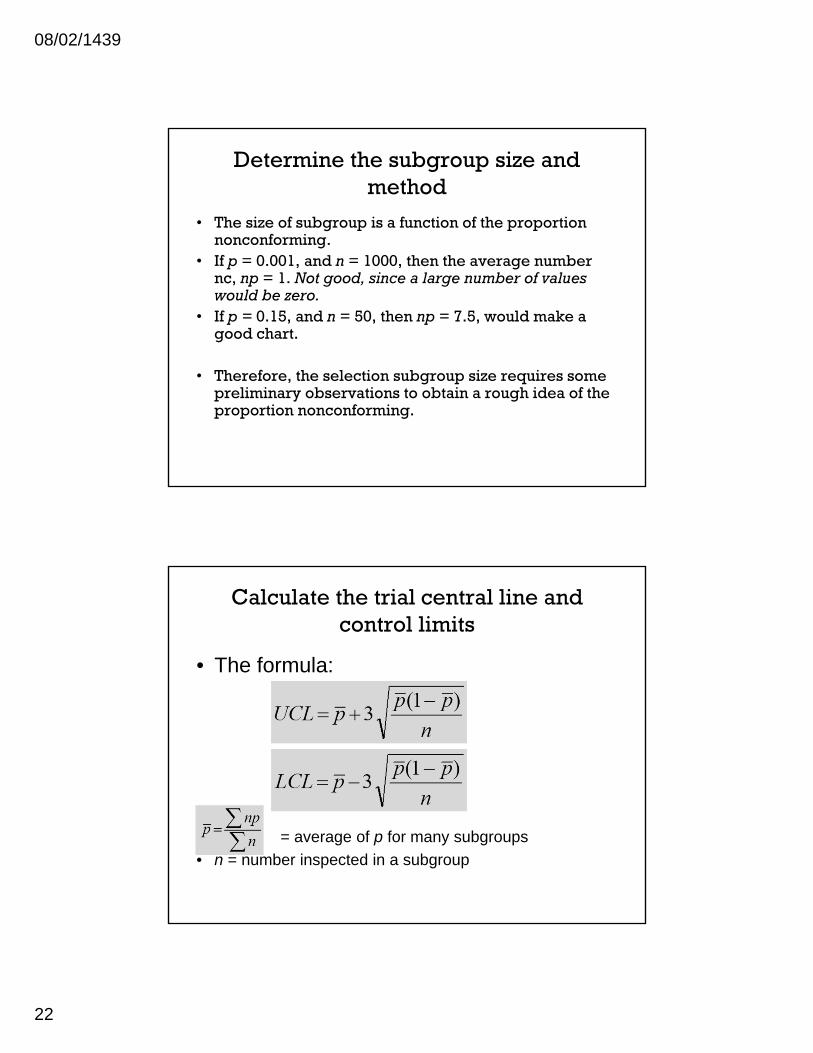
Determine the subgroup size and method
• The size of subgroup is a function of the proportion nonconforming.
• If p = 0.001, and n = 1000, then the average number nc, np = 1. Not good, since a large number of values would be zero.
• If p = 0.15, and n = 50, then np = 7.5, would make a good chart.
• Therefore, the selection subgroup size requires some preliminary observations to obtain a rough idea of the proportion nonconforming.
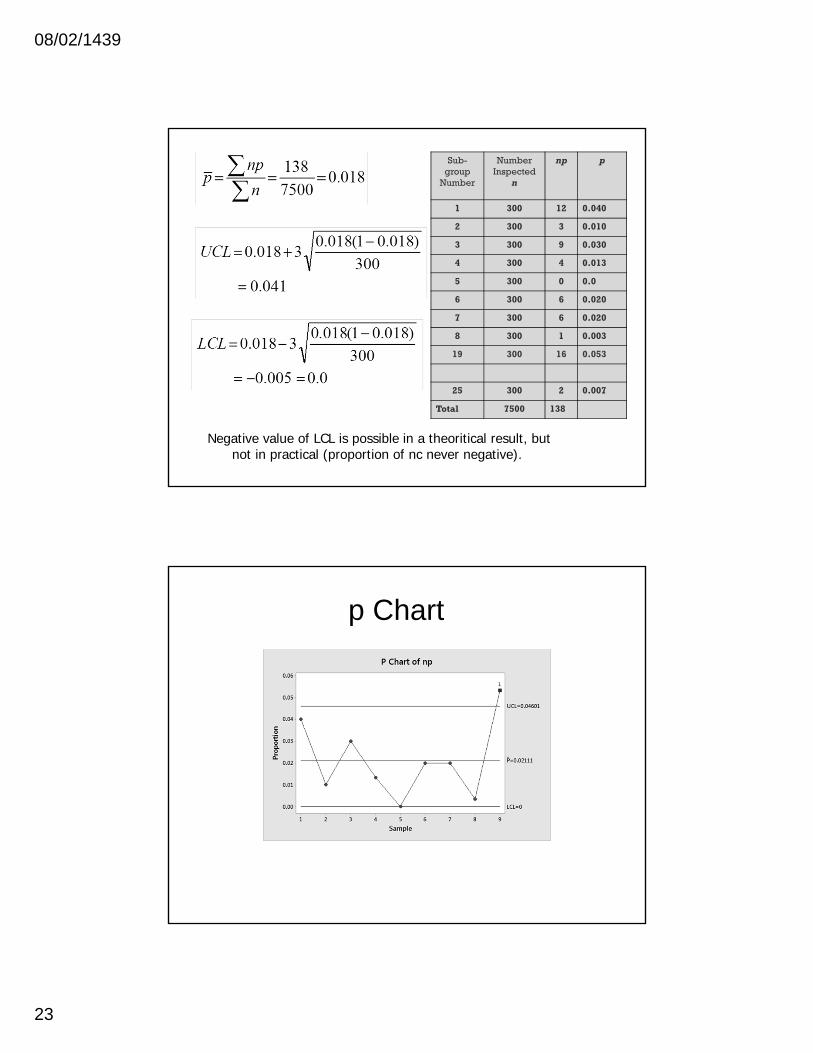
Calculate the trial central line and control limits
• The formula:
• = average of p for many subgroups
• n = number inspected in a subgroup
08/02/1439
23
Sub-group
Number
Number Inspectedn
np p
1 300 12 0.040
2 300 3 0.010
3 300 9 0.030
4 300 4 0.013
5 300 0 0.0
6 300 6 0.020
7 300 6 0.020
8 300 1 0.003
19 300 16 0.053
25 300 2 0.007
Total 7500 138
Negative value of LCL is possible in a theoritical result, but not in practical (proportion of nc never negative).
p Chart
0.053
08/02/1439
24
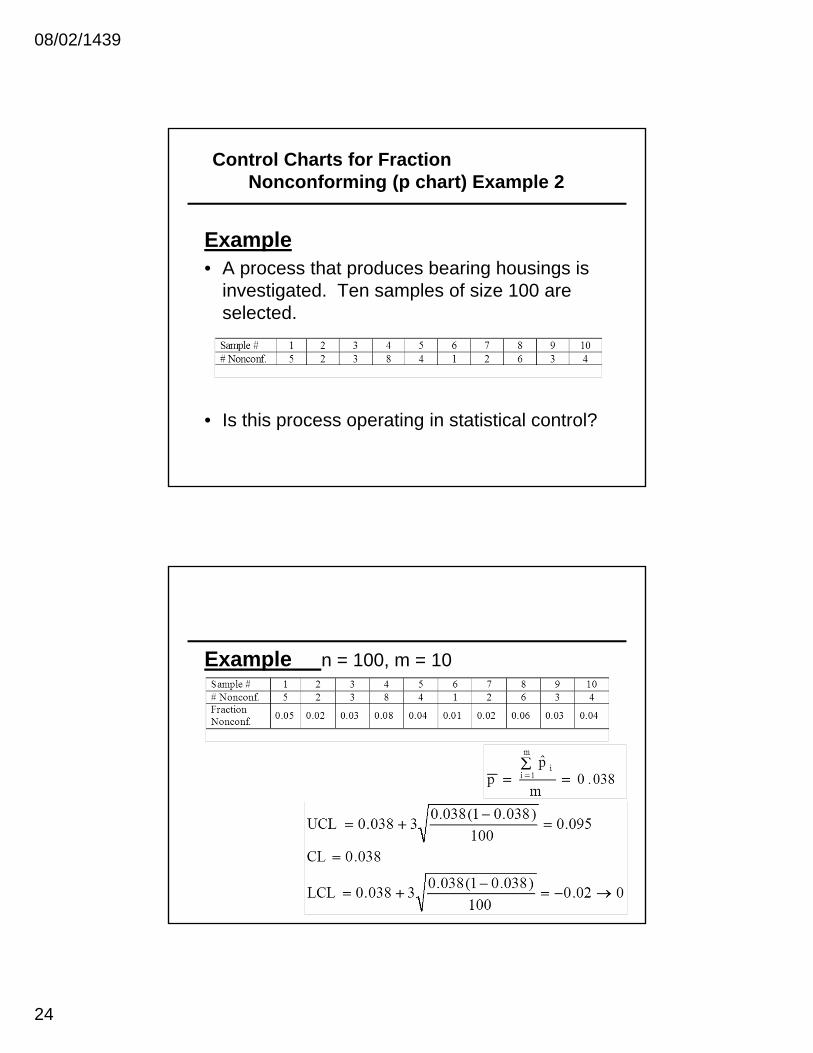
Control Charts for Fraction Nonconforming (p chart) Example 2
Example • A process that produces bearing housings is
investigated. Ten samples of size 100 are selected.
• Is this process operating in statistical control?
Example n = 100, m = 10
08/02/1439
25
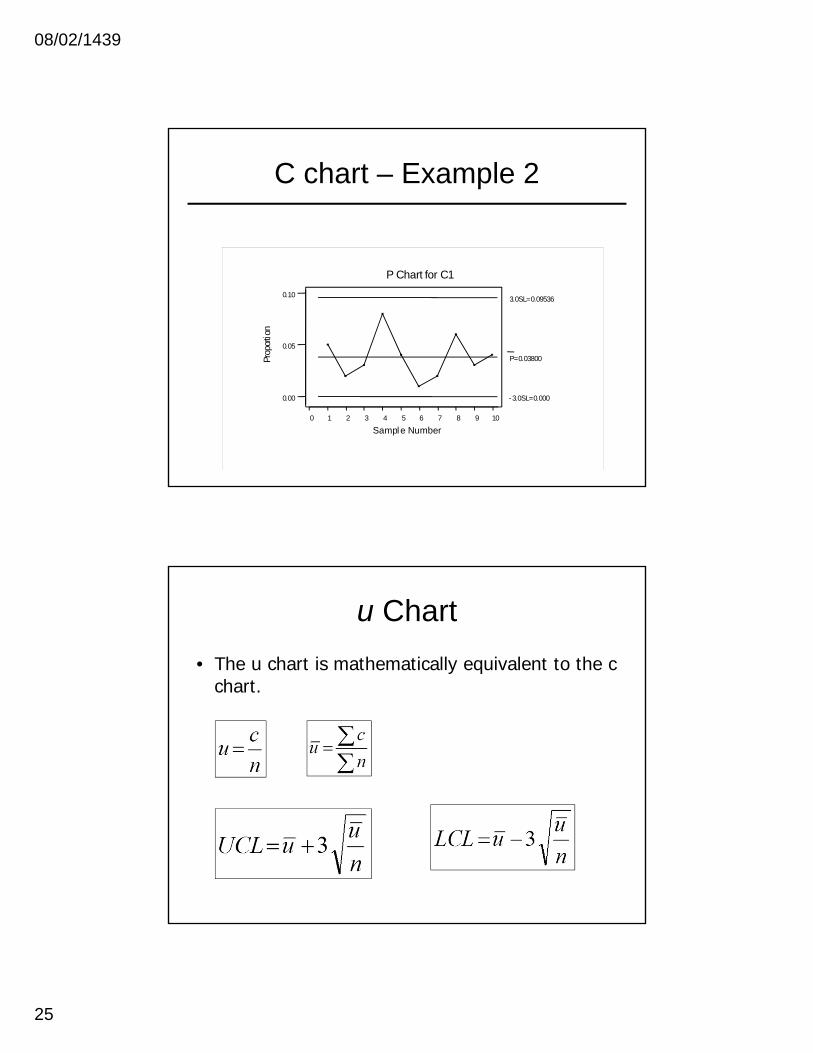
C chart – Example 2
109876543210
0.10
0.05
0.00
Sample Number
Prop
ortio
nP Chart for C1
P=0.03800
3.0SL=0.09536
-3.0SL=0.000
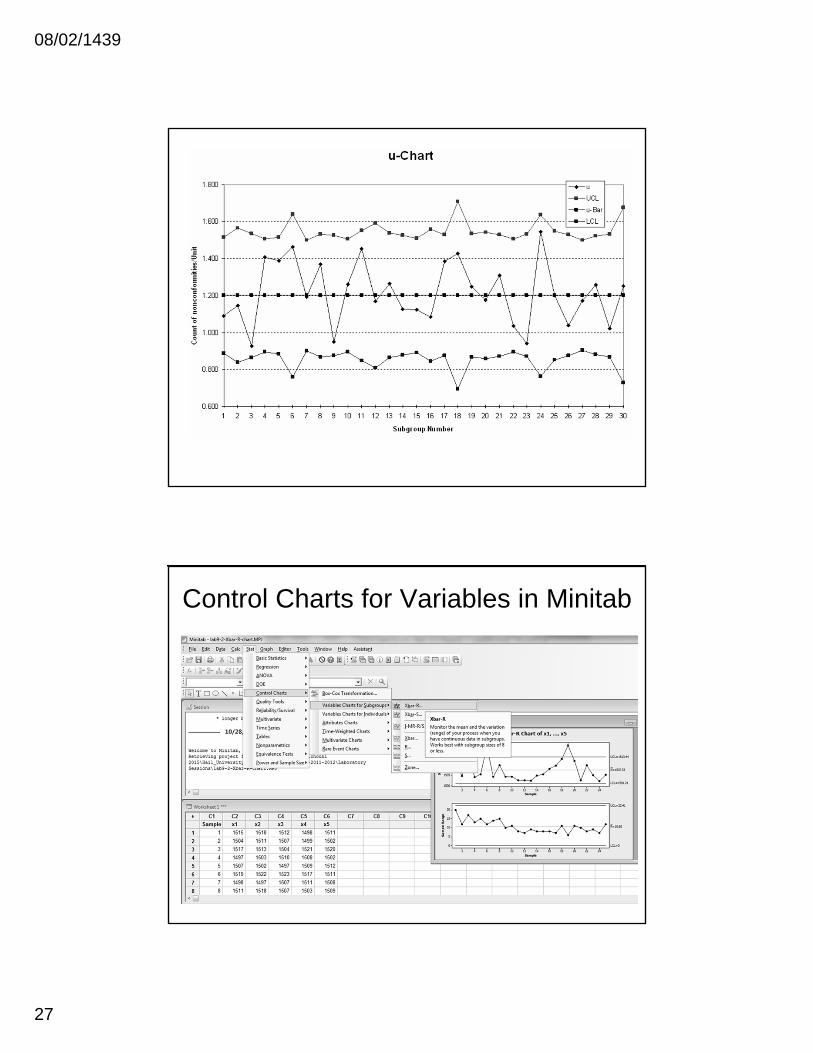
u Chart
• The u chart is mathematically equivalent to the c chart.
08/02/1439
26
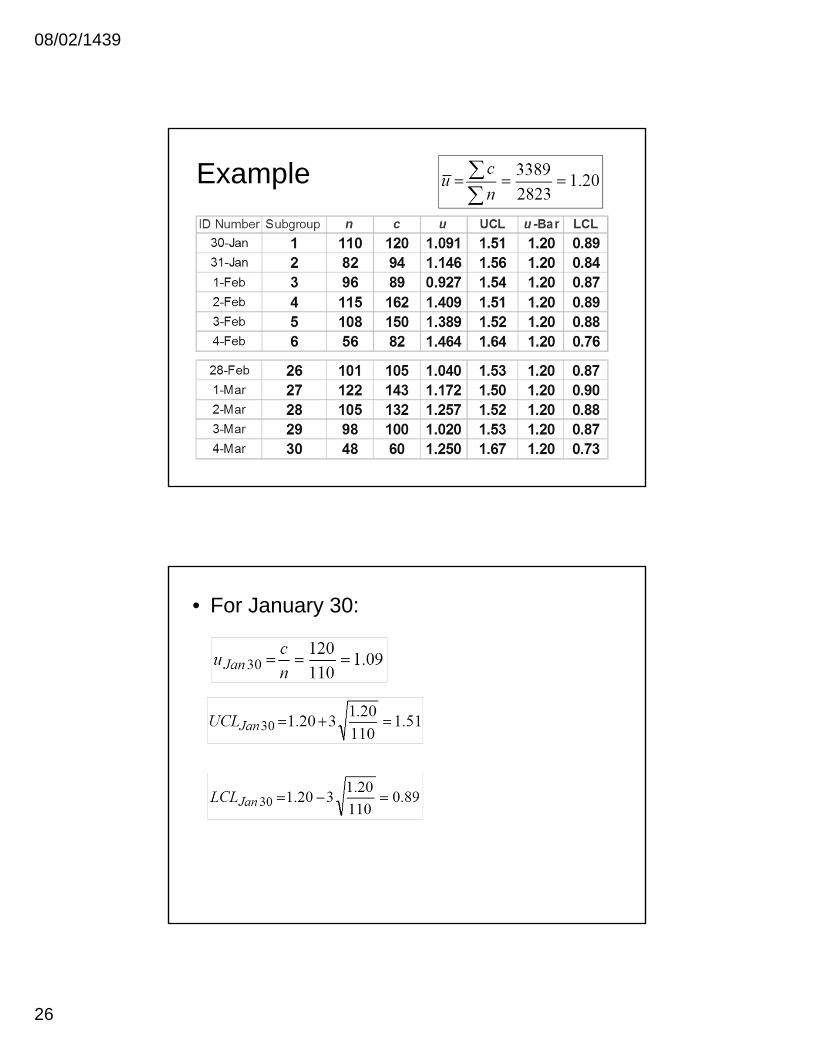
Example
• For January 30:
08/02/1439
27
Control Charts for Variables in Minitab
08/02/1439
28
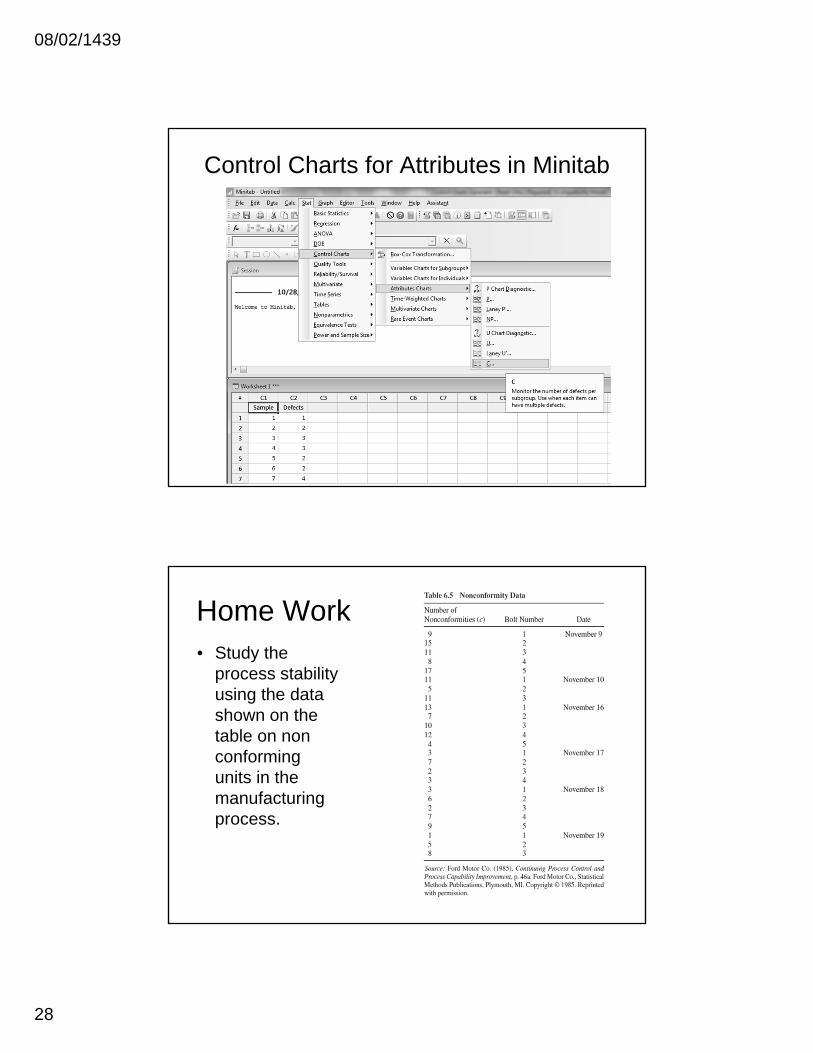
Control Charts for Attributes in Minitab
Home Work• Study the
process stability using the data shown on the table on non conforming units in the manufacturing process.
08/02/1439
29
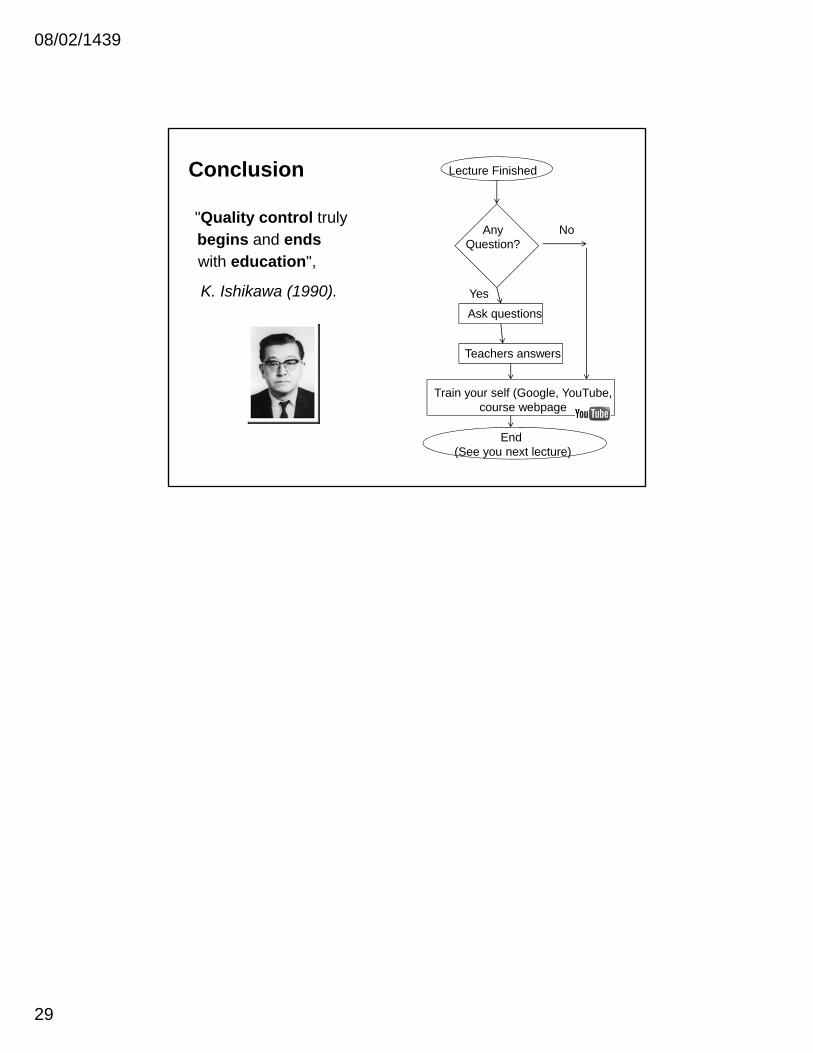
Conclusion
"Quality control truly begins and endswith education",
K. Ishikawa (1990).
Lecture Finished
Any Question?
Ask questions
Teachers answers
Train your self (Google, YouTube, course webpage
End (See you next lecture)
No
Yes