chapter 14: nonproliferation and nuclear …asimonet/publications/simonet... · simonetti et al. 1...
TRANSCRIPT
SIMONETTI ET AL.
1
CHAPTER 14: NONPROLIFERATION AND NUCLEAR FORENSICS: DETAILED, MULTI-ANALYTICAL INVESTIGATION OF TRINITITE POST-DETONATION MATERIALS
Antonio Simonetti, Jeremy J. Bellucci, Christine Wallace, Elizabeth Koeman, and Peter C. Burns, Department of Civil and Environmental Engineering and Earth Sciences, University of Notre Dame, Notre Dame, Indiana, 46544, USA e-mail: [email protected]
Mineralogical Association of Canada Short Course 43, Winnipeg MB, May 2013, p. 1-5.
INTRODUCTION In 2010, the Joint Working Group of the
American Physical Society and the American Association for the Advancement of Science defined Nuclear Forensics as “the technical means by which nuclear materials, whether intercepted intact or retrieved from post-explosion debris, are characterized (as to composition, physical condition, age, provenance, history) and interpreted (as to provenance, industrial history, and implications for nuclear device design).” Detailed investigation of post-detonation material (PDM) is critical in preventing and/or responding to nuclear-based terrorist activities/threats. However, accurate identification of nuclear device components within PDM typically requires a variety of instrumental approaches and sample characterization strategies; the latter may include radiochemical separations, mass spectrometry, decay-counting measurements, microscopy, and expertise from various fields, such as chemistry, geology and physics. Stanley (2012) indicated that cleverly designed approaches can simultaneously provide insight into a material’s ‘‘age’’ (i.e., time elapsed since last purification), actinide concentrations, and relevant isotopic ratios/enrichment values. Consequently, these signatures are invaluable in determining the origin, processing history, and intended purpose of a nuclear material, and are data that will be used by pertinent law enforcement agencies.
The fuel of established nuclear weapons consists primarily of uranium (U) or plutonium (Pu) metal, which are suitably enriched in a fissile isotope (e.g., 235U, or 239Pu). The latter are included in a definition of Special Nuclear Material (SNM), which consists of any substance enriched in 233U or 235U, or containing any of the isotopes of Pu (238 to 242). Moreover, the level of 235U enrichment is further subdivided into highly enriched uranium (HEU: > 90% 235U), intermediate (20–90% 235U), and low (LEU: <20% 235U). Analogously, “weapons grade” Pu refers to a make-up of at least 93% 239Pu
(and ≤7% 240Pu), whereas it is termed “reactor fuel grade” if the material consists >8% 240Pu. Production of enriched U is costly and an energy-intensive process, and the most widely used processes are gaseous diffusion of UF6 (employed by the United States and France) and high-performance centrifugation of UF6 (e.g., Russia, Europe, and South Africa). The uranium processed under the “Manhattan Project” and used within the device detonated over Hiroshima was produced by electromagnetic separation; the latter process was ultimately abandoned in the late 1940s because of its significant energy demands. The minimum amount of fissionable material required for a nuclear reaction is termed its “critical mass”, and the value depends on the isotope employed, properties of materials, local environment, and weapon design (Moody et al. 2005). Trinity test – Formation of ‘Trinitite’
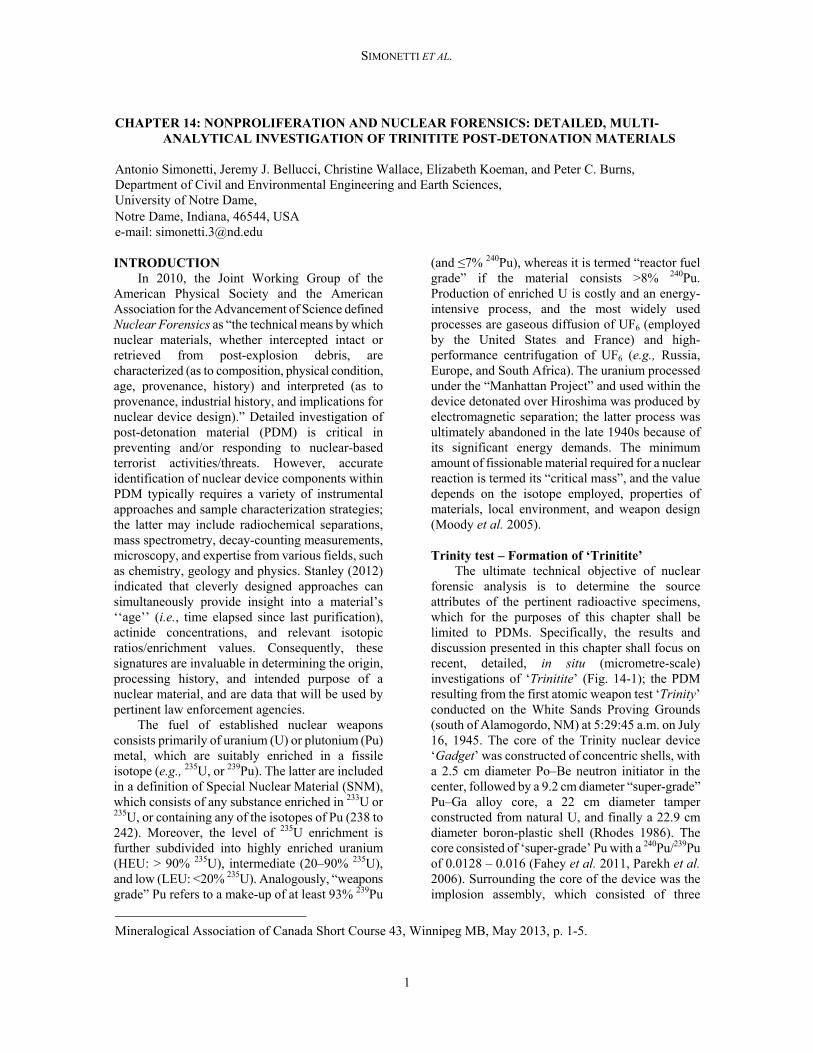
The ultimate technical objective of nuclear forensic analysis is to determine the source attributes of the pertinent radioactive specimens, which for the purposes of this chapter shall be limited to PDMs. Specifically, the results and discussion presented in this chapter shall focus on recent, detailed, in situ (micrometre-scale) investigations of ‘Trinitite’ (Fig. 14-1); the PDM resulting from the first atomic weapon test ‘Trinity’ conducted on the White Sands Proving Grounds (south of Alamogordo, NM) at 5:29:45 a.m. on July 16, 1945. The core of the Trinity nuclear device ‘Gadget’ was constructed of concentric shells, with a 2.5 cm diameter Po–Be neutron initiator in the center, followed by a 9.2 cm diameter “super-grade” Pu–Ga alloy core, a 22 cm diameter tamper constructed from natural U, and finally a 22.9 cm diameter boron-plastic shell (Rhodes 1986). The core consisted of ‘super-grade’ Pu with a 240Pu/239Pu of 0.0128 – 0.016 (Fahey et al. 2011, Parekh et al. 2006). Surrounding the core of the device was the implosion assembly, which consisted of three
SIMONETTI ET AL.
2
Fig. 1. Photographs of trinitite hand specimens exhibiting various types of inclusions: (A) red; (B) black; (C) “Coke bottle”; and glassy, green surface of “regular” trinitite (D). Of note, most samples are characterized by a ‘glassy’ side (surface at time of explosion) and the opposing ‘sandy’ side.
concentric circles of conventional explosives and Al shells (Rhodes 1986). The explosives used in the device were of RDX, TNT, and Baritol, which is a mixture of TNT and Ba(NO3)2 (Rhodes 1986). Several recent studies have documented components in trinitite likely originating from the Gadget, including Cu from the wiring used in the device or monitoring equipment (Bellucci & Simonetti 2012, Eby et al. 2010), Pb from the tamper (Bellucci & Simonetti 2012, Eby et al. 2010, Fahey et al. 2010), and W–Ta–Ga alloy, most probably a piece of the tamper or electronics (Bellucci & Simonetti 2012). Iron and Fe–Ti inclusions have also been observed in trinitite and interpreted as being derived from the blast tower (Bellucci & Simonetti 2012, Eby et al. 2010, Fahey et al. 2010).
PDMs from historic test sites, such as trinitite, provide an excellent opportunity to establish and verify forensic protocols, as the nature of the device components employed is relatively well docu-mented. Timely forensic investigations of PDMs are needed to reveal the elemental and isotopic compositions of the device and associated components so that source attribution can be made rapidly and accurately. Deciphering the chemical/
isotopic composition of a nuclear device from PDMs in a relatively rapid manner will also serve as a strong deterrent to nuclear terrorism. However, factors that complicate forensic analysis of PDMs include the inherent heterogeneity (mineralogical, chemical, isotopic) of the materials present at ground zero, and possible overlapping signatures of the natural and anthropogenic (device) components. Moreover, traditional investigative methods for post-detonation are time-consuming (e.g., Belloni et al. 2011, Bellucci et al. 2013, Parekh et al. 2006), and those involving bulk sample digestion followed by chemical separation tend to homogenize (average) the chemical and isotopic signatures; hence obliterating valuable forensic information present at the micrometre-scale (e.g., in situ U and Pu isotope ratios; Bellucci et al. in press).
University of Notre Dame (UND) – Scope of trinitite research
As of July 2011, a 3-year nuclear forensics research program began and is on-going at the University of Notre Dame (UND) under the stewardship and funding of the “Office of Nonproliferation and Verification Research and

SIMONETTI ET AL.
3
Development”, Department of Energy – National Nuclear Security Agency (NNSA, program NA-22). To date, the UND research team has focused its efforts into the detailed, micrometre-scale mineralogical, chemical, and isotopic characteriz-ation of ~70 samples of trinitite. Most of the results presented in this chapter were obtained using extra thick (~70 to 100 μm) standard petrographic thin sections of trinitite; in contrast, gamma spectroscopy experiments were conducted using bulk trinitite samples. Results reported here were obtained from various in situ, microanalytical techniques that provide relatively rapid, spatially resolved chemical and isotopic data of trinitite; several are based on laser ablation inductively coupled plasma mass spectrometry (LA–ICP–MS). Of importance, these in situ results document the inherent and significant chemical/isotopic variability present within individual trinitite samples at the 10s to 100s μm scale. Prior to presenting our most recent forensic findings for trinitite, the next sections provide some basic background information pertinent to the discussion and interpretation of our data.
Background – Radioactivity
Radioanalytical techniques exert an important role within the realm of nuclear forensics (e.g., Mayer et al. 2013). Detailed descriptions of the physical basis of nuclear forensic science, the radiochemistry and the applied analytical methods are presented in Moody et al. (2005). Thus, the reader is referred to Moody et al. (2005) for an in-depth analysis, whereas a brief overview from the latter is provided below so as to elucidate the gamma spectroscopy and alpha radiography results presented later in this chapter.
Within the field of nuclear forensic science, U and Pu are the elements of primary concern. There are three main types of ionizing radiation emitted by radioactive materials: alpha, beta and gamma. Alpha (α) decay is the spontaneous emission of a 4He nucleus, which consists of 2 protons and 2 neutrons. The kinetic energies associated with the emission of alpha particles are quite high, and the mass of α-particles is large enough that its velocity is only a few percent of the speed of light. The distance traversed by an α-particle passing through an intervening substance (referred to as “range”) is quite short in comparison to other types of radioactive emissions. The energies associated with ejected α-particles are well defined and characteristic of the emitting nuclei, which permit
measurement of the energy by spectroscopic methods. The latter must be exercised in a careful manner since α-particle energy loss is prevalent even in matter of little substance. Heavy elements (e.g., U) prominently display α-decay mode and its probability increases with decay energy in a regular manner for the isotopes of a given element.
The emission of an electron or positron at high velocity (~ speed of light) characterizes beta decay (i.e., β– or β+ decay). The latter results from the conversion of a neutron into a proton within the emitting nucleus, and is associated with a constant number of nucleons (and atomic mass number). Beta particles are characterized by a high charge/ mass ratio and can therefore be easily detected within an electric or magnetic field. Beta particles interact with matter in a complex manner, and the probability of absorption is approximately exponential until a certain thickness of matter is attained (absorption is then complete). The ‘ranges’ of β particles are in general longer than those for α-particles.
Gamma (γ) decay involves the emission of photons and is typically observed subsequent to either α or β decay schemes that leave daughter nuclides in excited states. The latter are analogous to the energy levels of atomic and molecular spectroscopy. These occur at discrete, well-defined energies and resulting γ rays are emitted from transitions between states. The energies of the emitted photons can be determined accurately and are related to the lifetimes of the transition levels involved. In relation to nuclear forensic science, γ rays of interest are characterized by nuclear stages that are long enough such that the uncertainty in the energies of the emitted photons is smaller than the resolution of even the best detector. The spectrometric measurements of γ rays being emitted from the decay of mixtures of radionuclides is a well-established laboratory method and is a valuable tool in the analysis of PDM; an example based on trinitite is provided in this chapter. Radioactive decay
The experiments by Rutherford & Soddy (1903) indicated that the radioactivity of a sample of gaseous nuclides decreased exponentially with time, with a decay constant that was characteristic of the radionuclide. Thus, if there are NA atoms of an unstable parent nuclide A present that are undergoing disintegration over a particular time interval t, then the radioactive decay rate can be expressed as:
SIMONETTI ET AL.
4
–dNA/dt = ANA (1)
The rate of change of the parent atoms (A) is given a negative sign because the rate decreases as a function of time. The constant of proportionality (), which is also referred to as the decay constant, is characteristic of the particular nuclide in question and is expressed in units of reciprocal time.
Integration of equation (1) above leads to:
– dNA/NA = dt (2)
– ln NA = t + C (3)
C is the constant of integration (e = 2.718…) and can be evaluated from the condition that NA = 0NA at t = 0. Thus, the equation above becomes
C = – ln 0NA (4)
Substituting the term above into equation 3 yields,
– ln NA = t - ln 0NA
ln NA - ln 0NA = – t
ln NA/0NA = – t
NA/0NA = exp( –t)
NA = 0NA exp( –t) (5)
The last equation gives the number of radioactive parent atoms (NA) remaining at any time t from an original number of nuclides (0NA) present at t = 0. In the special case where enough time has elapsed so that only one half of the material is left; i.e., the radionuclide’s half-life (T1/2), equation 5 then transforms into:
1/20NA = 0NA exp( –T1/2)
ln (1/2) = – T1/2
ln 2 = T1/2
T1/2 = ln 2/ = 0.693/
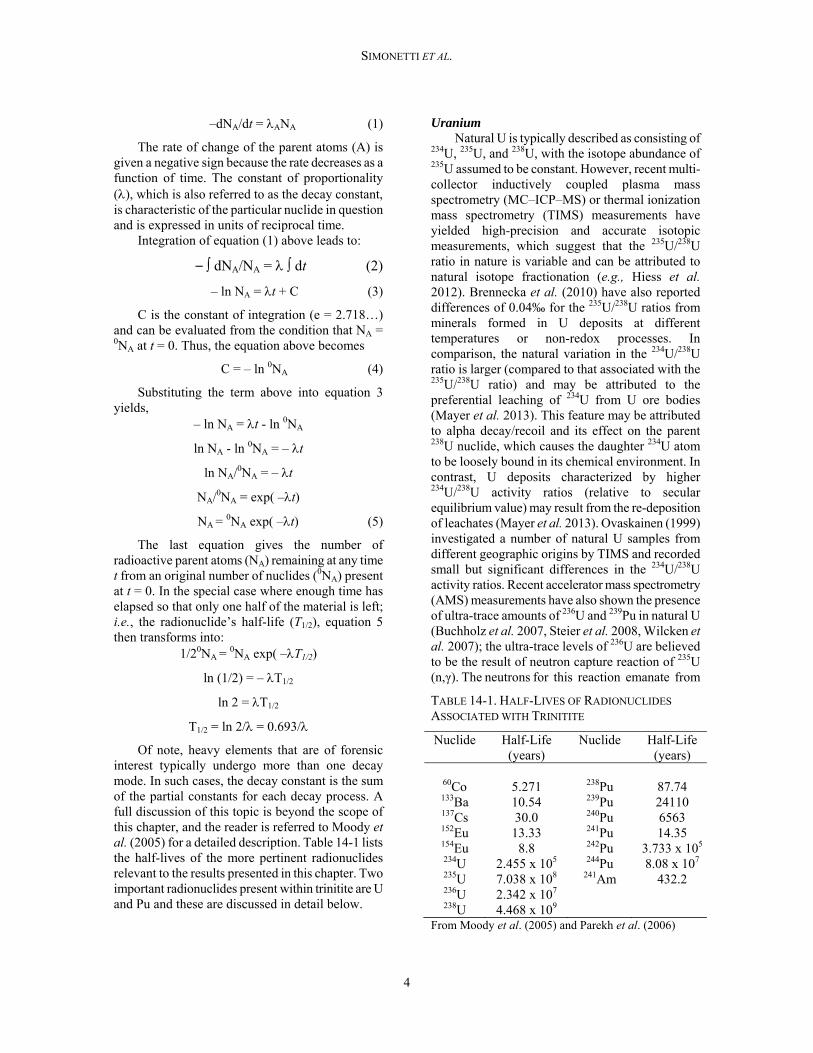
Of note, heavy elements that are of forensic interest typically undergo more than one decay mode. In such cases, the decay constant is the sum of the partial constants for each decay process. A full discussion of this topic is beyond the scope of this chapter, and the reader is referred to Moody et al. (2005) for a detailed description. Table 14-1 lists the half-lives of the more pertinent radionuclides relevant to the results presented in this chapter. Two important radionuclides present within trinitite are U and Pu and these are discussed in detail below.
Uranium Natural U is typically described as consisting of
234U, 235U, and 238U, with the isotope abundance of 235U assumed to be constant. However, recent multi-collector inductively coupled plasma mass spectrometry (MC–ICP–MS) or thermal ionization mass spectrometry (TIMS) measurements have yielded high-precision and accurate isotopic measurements, which suggest that the 235U/238U ratio in nature is variable and can be attributed to natural isotope fractionation (e.g., Hiess et al. 2012). Brennecka et al. (2010) have also reported differences of 0.04‰ for the 235U/238U ratios from minerals formed in U deposits at different temperatures or non-redox processes. In comparison, the natural variation in the 234U/238U ratio is larger (compared to that associated with the 235U/238U ratio) and may be attributed to the preferential leaching of 234U from U ore bodies (Mayer et al. 2013). This feature may be attributed to alpha decay/recoil and its effect on the parent 238U nuclide, which causes the daughter 234U atom to be loosely bound in its chemical environment. In contrast, U deposits characterized by higher 234U/238U activity ratios (relative to secular equilibrium value) may result from the re-deposition of leachates (Mayer et al. 2013). Ovaskainen (1999) investigated a number of natural U samples from different geographic origins by TIMS and recorded small but significant differences in the 234U/238U activity ratios. Recent accelerator mass spectrometry (AMS) measurements have also shown the presence of ultra-trace amounts of 236U and 239Pu in natural U (Buchholz et al. 2007, Steier et al. 2008, Wilcken et al. 2007); the ultra-trace levels of 236U are believed to be the result of neutron capture reaction of 235U (n,γ). The neutrons for this reaction emanate from
TABLE 14-1. HALF-LIVES OF RADIONUCLIDES
ASSOCIATED WITH TRINITITE
Nuclide Half-Life (years)
Nuclide Half-Life (years)
60Co 5.271 238Pu 87.74 133Ba 10.54 239Pu 24110 137Cs 30.0 240Pu 6563 152Eu 13.33 241Pu 14.35 154Eu 8.8 242Pu 3.733 x 10⁵
234U 2.455 x 10⁵ 244Pu 8.08 x 10⁷ 235U 7.038 x 10⁸ 241Am 432.2 236U 2.342 x 10⁷ 238U 4.468 x 10⁹
From Moody et al. (2005) and Parekh et al. (2006)

SIMONETTI ET AL.
5
the spontaneous fission of 238U or from (α,n) reactions within the sample (rock) matrix. Srncik et al. (2011) investigated the possibility of using 236U abundances within U ores world-wide as a nuclear forensics tool, and noted significant variations in the 236U/238U ratio for samples from Canada, Brazil, and Australia. Of note, the presence of 236U abundances in higher amounts than those determined in natural U samples is clearly an indication of neutron irradiation and reprocessing of the uranium. Varga & Suranyi (2009) used a combined laser ablation inductively coupled plasma mass spectrometry (LA–ICP–MS) and alpha spectrometry approach for quantifying 232U and 236U abundances as indicators of neutron capture.
The Gadget device used in the ‘Trinity’ test contained a 120 kg tamper composed of natural U; its role was to avert a premature disassembly of the Pu core and to restrict initial movement of neutrons (Semkow et al. 2006). Subsequently in the explosion, the U tamper was dispersed and incorporated into trinitite. Semkow et al. (2006) also indicated that ~30% of the Gadget’s explosive yield resulted from the fission of 235U within the tamper, and fission product ratios determined via gamma spectroscopy are consistent with fission of both 235U and 239Pu (Bellucci et al. 2013). Consequently, it is possible that the measured 235U/238U ratios in trinitite will be slightly lower than the natural value. Detailed discussion of the in situ U isotope values of trinitite glass (Bellucci et al. in press) is presented later in this chapter. Plutonium
Production of Pu is achieved primarily by neutron capture of 238U and transforms into short-lived 239U (T1/2 = 23.5 min), which then undergoes β− decay to 239Np and subsequently disintegrates (by β− decay) to 239Pu. The latter can fission under neutron irradiation but it may also form 240Pu via neutron capture. Given sufficient time in the reactor, 239Pu will continue to capture neutrons (which is also counteracted by neutron-induced fission) to produce 240Pu, 241Pu and 242Pu. In contrast, 238Pu can form in several ways: subsequent neutron capture, 238U can emit two neutrons (n,2n - reaction) to produce 237U, which then rapidly decays to 237Np. The latter then captures a neutron and after subsequent β− decay results in 238Pu. Alternatively, (n,γ) reactions involving 235U at the start will also produce 238Pu. Ultimately, the Pu/U isotopic composition of the irradiated nuclear fuel is a function of several parameters, such as neutron
energy spectrum, initial 235U enrichment, and neutron flux. For example, Wallenius (2001) presented a first systematic study on source attribution of reactor-produced Pu.
The Pu employed in the Trinity device was produced at the Hanford nuclear facility (Hanford, Washington). The natural U fuel was subjected to an extremely short irradiation time due to the urgency involving the Manhattan Project era (Rhodes 1986). The low burn-ups used to produce the Pu fuel for the Trinity device produced almost isotopically pure 239Pu since higher mass Pu isotopes did not have sufficient time to accumulate. Sublette (2012) estimated the original (pre-detonation) 240Pu content of the Trinity device at ~0.9–1.0%, with only trace amounts of other isotopes.
Glasstone & Dolan (1977) estimated that 1.45 x 10²³ fissions occur per kiloton of yield, therefore ~1.2 kg of 239Pu were fissioned in the Trinity explosion (Widner et al. 2009), and hence the remaining ~4.8 kg of unfissioned Pu was dispersed in the explosion. Previous investigations of trinitite have reported the presence of 239Pu (e.g., Belloni et al. 2011, Bellucci et al. 2013, Fahey et al. 2010, Parekh et al. 2006), as well as 238Pu, 240Pu, 241Pu, and 241Am (Belloni et al. 2011, Parekh et al. 2006). 238Pu, 240Pu, and 241Pu may have been produced during reactor irradiation via (n, 2n), (n, γ), and (2n, γ) reactions, respectively; alternatively, these isotopes may have formed during the explosion due to the high purity of the original fuel (Parekh et al. 2006). The 241Am present in trinitite has most probably accumulated since 1945 from the β-decay of 241Pu (T1/2 = 14.3 years; Belloni et al. 2011, Bellucci et al. 2013, Parekh et al. 2006).
Fission and Activation Products
In relation to fission products, only those with sufficiently long half-lives should still be detectable since the Trinity test occurred ~67 years ago. For example, 137Cs (T1/2 = 30.17 years) is formed from the beta decay of short-lived fission products 137Xe and 137I, whereas 90Sr (T1/2 = 28.8 years) is derived from the short-lived 90Rb. 90Sr and 137Cs have cumulative fission yields of 2.17% and 6.76% from the fission of 239Pu, respectively (Wahl 1988).
With regards to activation products at the Trinity site, detonation of the Gadget’s Pu core initiated a neutron flux that caused neutron activation of both device components and the surrounding arkosic sand. For example, previous investigations of trinitite have documented the presence of 60Co, 133Ba, 152Eu, and 154Eu (e.g.,

SIMONETTI ET AL.
6
Bellucci et al. 2013, Parekh et al. 2006). 60Co is derived from the (n, γ) reaction of 59Co, which was present in the steel tower. Similarly, 133Ba is produced via (n, γ) on 132Ba, which was derived from the explosive lens system within the Gadget, and in mineral phases (e.g., barite – BaSO4) within the desert sand (Bellucci et al. submitted). 152Eu and 154Eu are neutron activation products of 151Eu and 153Eu, respectively, and are abundant within constituent minerals (e.g., plagioclase feldspar – CaAl2Si2O8) of the arkosic sand at Ground Zero. SAMPLES
Samples of trinitite investigated here (Fig. 14-1) were purchased from Mineralogical Research Corporation (www.minresco.com), and include examples from various morphological groups (e.g., red inclusions, black inclusions, green trinitite). The Trinity site was bulldozed in 1954 and the glassy layer of trinitite was buried (US GPO 2000). Hence, all trinitite samples lack spatial constraints on their exact original location within the Trinity blast site. Thus, alternate methods can be employed so as to place the trinitite samples in a spatial context (e.g., Belloni et al. 2011, Bellucci et al. 2013, Parekh et al. 2006). Bellucci et al. (2013) measured the activity of 152Eu by gamma spectroscopy for 49 bulk samples of trinitite, and subsequently used these data to estimate the distance away from ground zero; this yielded calculated distances from ground zero for most samples investigated between 51 and 76 m (Bellucci et al. 2013). Prior to any subsequent type of imaging or microanalysis, trinitite samples were cut into polished thin sections with a thickness of 70–100 μm. METHODS SEM–BSE (EDS) and EMPA Analyses
Petrographic thin sections of trinitite were mapped using optical microscopy and scanning electron microscopy (SEM) instrumentation. Optical maps were generated in plane-polarized light using a petrographic microscope equipped with a digital camera. SEM analyses were performed at the University of Notre Dame Integrated Imaging Facility using an EVO 50 LEO Environmental SEM (Carl Zeiss). This instrument is equipped with both secondary electron and backscatter electron detectors. An accelerating voltage of 30 kV and magnifications of 100–200x were used for these measurements. Prior to analysis, thin sections were mounted onto SEM stubs with conductive carbon tape and sputtered with Ir to a thickness of ~5 nm.
Samples were imaged in back-scattered electron (BSE) mode in order to detect relative differences in chemical composition. Merging adjacent BSE images in Photoshop generated compositional maps of entire sections. Individual phases within each sample were examined for semi-quantitative elemental concentration determinations using an energy-dispersive spectroscopy (EDS) method.
All electron microprobe analyses (EMPA) of trinitite glass and constituent mineral phases (e.g., K-feldspar) were conducted at the University of Chicago with a Cameca SX-50 electron microprobe using an accelerating voltage of 15 kV, beam size of 15 μm, and beam current of 35 nA. Standardization was performed using well-characterized in-house standards of olivine (FeO, MgO, MnO), albite (Na2O), anorthite (CaO, Al2O3), asbestos (SiO2), microcline (K2O), and rutile (TiO2). Internal uncertainties (2σmean) are based on counting statistics, and are ≤2% for SiO2, Al2O3, and CaO; ≤5% for FeO, Na2O, and K2O; and ≤10% for MnO, MgO, and TiO2. Gamma Spectroscopy
The following description is taken from Bellucci et al. (2013). All analyses were performed at Radiation Safety Services, Inc. (Morton Grove, Illinois). Whole rock samples were put into a petri dish within a Marinelli container and subsequently placed directly on top of the Ge detector; this results in a sample-to-detector distance of 4–5 mm. Gamma spectra were obtained using a DART gamma spectrometer with a 30% efficiency high-purity Ge (HPGe) detector cooled with liquid nitrogen. The detector and sample were housed in a 9.5 cm thick vessel with graded Cu & Pb shielding. The DART gamma spectrometer is an 8k channel, multichannel analyzer, which provides functionality required to support a HPGe detector in a gamma spectrometer system. The DART system includes a computer controlled amplifier, a bias supply, a spectrum stabilizer, an analog-to-digital circuit, data memory, and a ratemeter. Detection and data reduction were performed with an Ortec GEM–30185 HPGe detector and Ortec GammaVision software, respectively.
Each sample was measured for 1 h, where total counts were reported for each channel. Activities for each isotope were taken at the energies shown in Figure 14-2 and were calculated by determining the area under each peak, after subtracting the background. To correct for sum and cascade peaks, the software uses a true coincidence correction

SIMONETTI ET AL.
7
factor, designed to correct for all pulses removed from the full energy peak due to cascade or sum-peak effects. The software calculates the sum-peak factor during the efficiency calibration. To perform the efficiency calibration an Eckert & Ziegler, NIST-certified multi-nuclide standard (#1369-10) was counted for 48 hours. After counting, data were used to best fit a 6-term polynomial efficiency curve incorporating the geometry correction for samples in a Marinelli container (~0.7). Errors in the activities were determined by counting statistics. A typical gamma energy spectrum is shown in Fig. 14-2, with important isotopes numbered and highlighted. Alpha Radiography
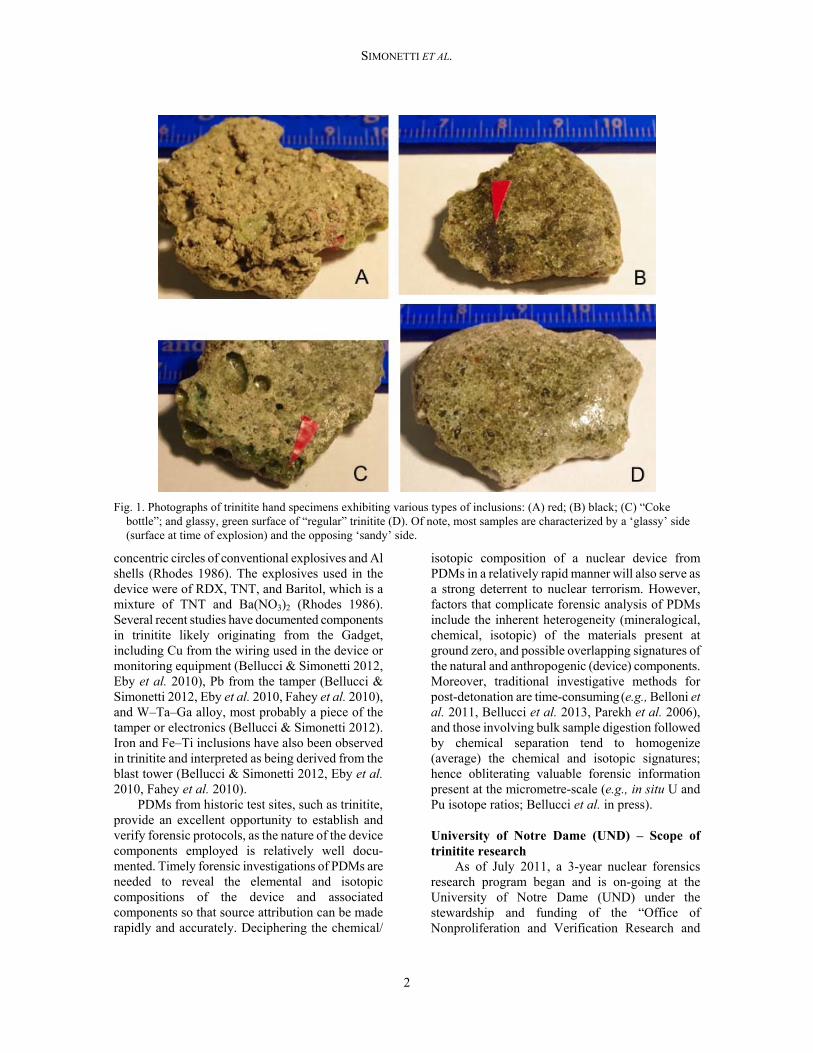
Of importance, alpha- and beta-emitting radionuclides are not uniformly distributed in trinitite, and therefore both alpha track and beta radiography techniques allow for alpha- and beta-rich areas to be identified, respectively. This is an extremely crucial and an important time-saving step prior to LA–ICP–MS analysis given the high spatial resolution scale (10s of μm) of the latter. The following description is summarized from Wallace et al. (in press). CR-39 plastic detectors were employed to record alpha tracks from trinitite thin sections. The samples were kept in tight contact with the detectors for 7–10 days. Subsequently, the CR-39 detectors were etched in 6.25 M NaOH at 98°C for four hours to reveal the alpha tracks. After
the detectors were removed from the etching solution, they were rinsed in distilled water and neutralized for 30 minutes in 2% glacial acetic acid. The plastic was then optically imaged with a light microscope to determine the areas of the sample that contain the highest alpha activity (e.g., Fig. 14-3b). Beta spectroscopy
As part of the Wallace et al. (in press) study on the distribution of radionuclides within trinitite, thin sections were placed two inches apart on Fujifilm BAS-SR2025 imaging plates and inserted into a lead cassette. Mylar film was placed between the samples and plates to avoid cross contamination. After 72 hours of exposure, the plates were scanned with a Fujifilm BAS-5000 Image Reader, and images were obtained using ImageReader software (Fig. 14-3c). In situ LA–(MC)–ICP–MS analyses
A detailed distribution of the trace element abundances within trinitite is reported in Bellucci et al. (submitted) and the analytical protocol employed is summarized here. In situ trace element analyses were performed within MITERAC (Midwest Isotope and Trace Element Research Analytical Center) at the University of Notre Dame. Measurements were carried out utilizing a New Wave Research UP-213 frequency quintupled Nd:YAG laser ablation system coupled with a
Fig. 2. A typical gamma spectrum for trinitite; relevant isotopes are numbered and highlighted (from Bellucci et al., in press).
SIMONETTI ET AL.
8
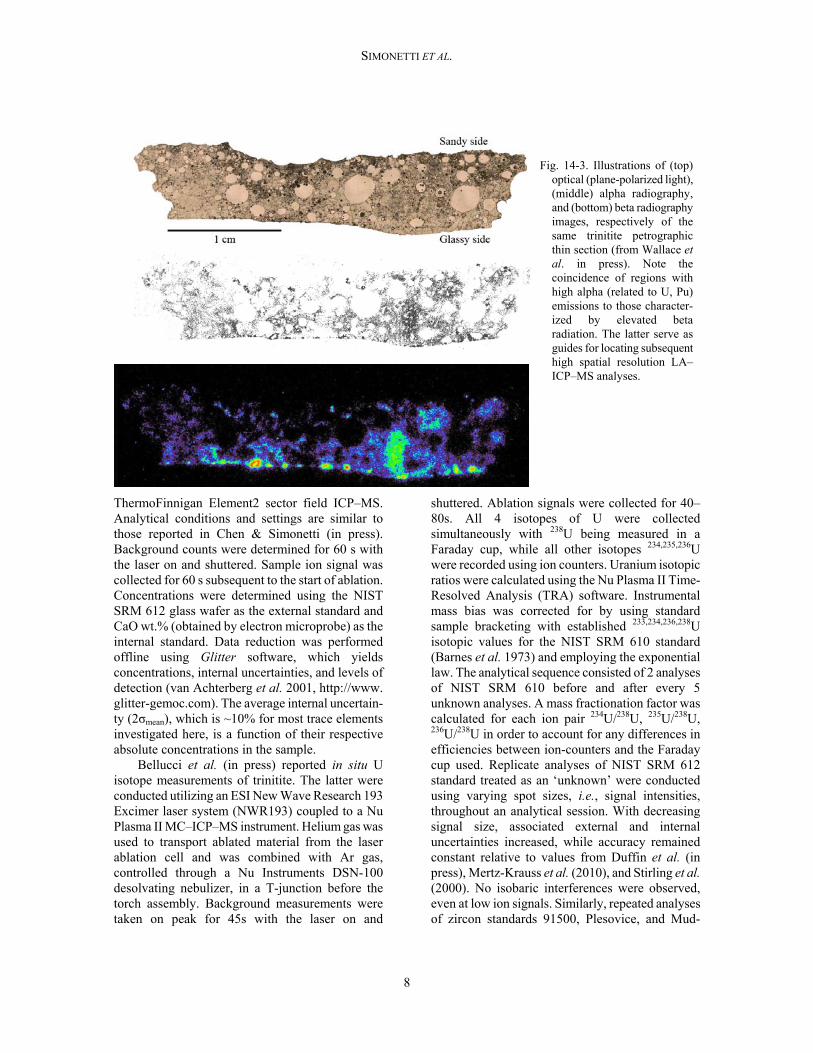
Fig. 14-3. Illustrations of (top)
optical (plane-polarized light), (middle) alpha radiography, and (bottom) beta radiography images, respectively of the same trinitite petrographic thin section (from Wallace et al. in press). Note the coincidence of regions with high alpha (related to U, Pu) emissions to those character-ized by elevated beta radiation. The latter serve as guides for locating subsequent high spatial resolution LA–ICP–MS analyses.
ThermoFinnigan Element2 sector field ICP–MS. Analytical conditions and settings are similar to those reported in Chen & Simonetti (in press). Background counts were determined for 60 s with the laser on and shuttered. Sample ion signal was collected for 60 s subsequent to the start of ablation. Concentrations were determined using the NIST SRM 612 glass wafer as the external standard and CaO wt.% (obtained by electron microprobe) as the internal standard. Data reduction was performed offline using Glitter software, which yields concentrations, internal uncertainties, and levels of detection (van Achterberg et al. 2001, http://www. glitter-gemoc.com). The average internal uncertain-ty (2σmean), which is ~10% for most trace elements investigated here, is a function of their respective absolute concentrations in the sample.
Bellucci et al. (in press) reported in situ U isotope measurements of trinitite. The latter were conducted utilizing an ESI New Wave Research 193 Excimer laser system (NWR193) coupled to a Nu Plasma II MC–ICP–MS instrument. Helium gas was used to transport ablated material from the laser ablation cell and was combined with Ar gas, controlled through a Nu Instruments DSN-100 desolvating nebulizer, in a T-junction before the torch assembly. Background measurements were taken on peak for 45s with the laser on and
shuttered. Ablation signals were collected for 40–80s. All 4 isotopes of U were collected simultaneously with 238U being measured in a Faraday cup, while all other isotopes 234,235,236U were recorded using ion counters. Uranium isotopic ratios were calculated using the Nu Plasma II Time-Resolved Analysis (TRA) software. Instrumental mass bias was corrected for by using standard sample bracketing with established 233,234,236,238U isotopic values for the NIST SRM 610 standard (Barnes et al. 1973) and employing the exponential law. The analytical sequence consisted of 2 analyses of NIST SRM 610 before and after every 5 unknown analyses. A mass fractionation factor was calculated for each ion pair 234U/238U, 235U/238U, 236U/238U in order to account for any differences in efficiencies between ion-counters and the Faraday cup used. Replicate analyses of NIST SRM 612 standard treated as an ‘unknown’ were conducted using varying spot sizes, i.e., signal intensities, throughout an analytical session. With decreasing signal size, associated external and internal uncertainties increased, while accuracy remained constant relative to values from Duffin et al. (in press), Mertz-Krauss et al. (2010), and Stirling et al. (2000). No isobaric interferences were observed, even at low ion signals. Similarly, repeated analyses of zircon standards 91500, Plesovice, and Mud-

SIMONETTI ET AL.
9
Tank yield 235U/238U values that are indistinguish-able (given their associated uncertainties) compared to the natural value of Hiess et al. (2012). The 234U/238U values for all zircon analyses are within error of secular equilibrium (0.000055) and are in agreement with measurements performed by Mertz-Krauss et al. (2010) on zircon standard 91500. RESULTS SEM–BSE imaging and alpha radiography
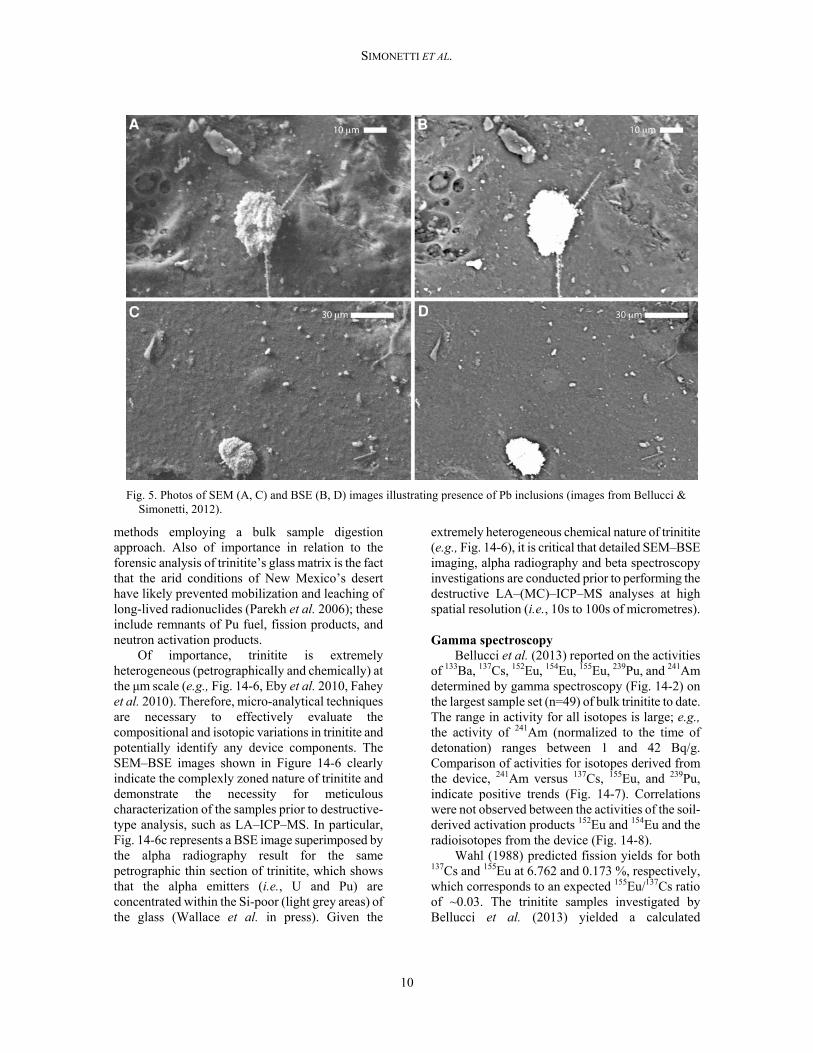
Bellucci & Simonetti (2012) documented the 3D morphology and chemical composition of trinitite-hosted metallic inclusions using SEM–BSE imaging and EDS X-ray analyses. Inclusions consisting of Fe–Ti–Si (Fig. 14-4) are the most abundant and presumably derived predominantly from the explosion tower. There are two types of Fe–Ti–Si inclusions based on their level of ‘topography’ or height above the trinitite surface; those lacking topography or height are dumbbell-shaped and likely formed and precipitated within the cloud along with the glassy trinitite (Fig. 14-4). The Cu inclusions likely derive from the device’s wiring. The Pb inclusions (Fig. 14-5) most probably originated from the tamper. The W, Ta, and Ga
alloy is a result of mixing between the core and the tamper. Of importance, the spherical morphology and the ubiquitous positioning of the heavy metal inclusions on the crater walls of the glassy trinitite surfaces indicate a two-step formation. Belloni et al. (2011) also proposed a two-stage formation process for trinitite: 1) formation of molten glass both on the ground and in the mushroom cloud, and 2) subsequent incorporation of solid material (non-molten mineral phases, metal, and droplets) raining down from the cloud on the upper surface of this solidifying glass. The precipitation of the latter from the cloud must have occurred at some point later in time so as to permit cooling and solidification of the trinitite matrix prior to the incorporation of solid-type inclusions (e.g., Fe–Ti; Fig. 14-4). A sustained precipitation of debris would be required in order to have the glass fuse and subsequently add debris. Additionally, the ‘strands’ radiating from the Pb inclusion (Fig. 14-5) resemble Pele’s Hair, a rock texture that is formed when lava is ejected into the atmosphere and is wind-spun into spindles (e.g., Philpotts & Ague 2009). The precarious positioning of these inclusions further emphasizes the need for analysis using non-destructive techniques prior to
Fig. 14-4. SEM (A) and BSE (B) images of a Fe–Si inclusion; SEM (C) and BSE (D) image of a Fe–Si inclusion with Fe crystallization inside the grain; the dendritic morphology is readily apparent in (D; images from Bellucci & Simonetti, 2012).
SIMONETTI ET AL.
10
Fig. 5. Photos of SEM (A, C) and BSE (B, D) images illustrating presence of Pb inclusions (images from Bellucci & Simonetti, 2012).
methods employing a bulk sample digestion approach. Also of importance in relation to the forensic analysis of trinitite’s glass matrix is the fact that the arid conditions of New Mexico’s desert have likely prevented mobilization and leaching of long-lived radionuclides (Parekh et al. 2006); these include remnants of Pu fuel, fission products, and neutron activation products.
Of importance, trinitite is extremely heterogeneous (petrographically and chemically) at the μm scale (e.g., Fig. 14-6, Eby et al. 2010, Fahey et al. 2010). Therefore, micro-analytical techniques are necessary to effectively evaluate the compositional and isotopic variations in trinitite and potentially identify any device components. The SEM–BSE images shown in Figure 14-6 clearly indicate the complexly zoned nature of trinitite and demonstrate the necessity for meticulous characterization of the samples prior to destructive-type analysis, such as LA–ICP–MS. In particular, Fig. 14-6c represents a BSE image superimposed by the alpha radiography result for the same petrographic thin section of trinitite, which shows that the alpha emitters (i.e., U and Pu) are concentrated within the Si-poor (light grey areas) of the glass (Wallace et al. in press). Given the
extremely heterogeneous chemical nature of trinitite (e.g., Fig. 14-6), it is critical that detailed SEM–BSE imaging, alpha radiography and beta spectroscopy investigations are conducted prior to performing the destructive LA–(MC)–ICP–MS analyses at high spatial resolution (i.e., 10s to 100s of micrometres). Gamma spectroscopy
Bellucci et al. (2013) reported on the activities of 133Ba, 137Cs, 152Eu, 154Eu, 155Eu, 239Pu, and 241Am determined by gamma spectroscopy (Fig. 14-2) on the largest sample set (n=49) of bulk trinitite to date. The range in activity for all isotopes is large; e.g., the activity of 241Am (normalized to the time of detonation) ranges between 1 and 42 Bq/g. Comparison of activities for isotopes derived from the device, 241Am versus 137Cs, 155Eu, and 239Pu, indicate positive trends (Fig. 14-7). Correlations were not observed between the activities of the soil-derived activation products 152Eu and 154Eu and the radioisotopes from the device (Fig. 14-8).
Wahl (1988) predicted fission yields for both 137Cs and 155Eu at 6.762 and 0.173 %, respectively, which corresponds to an expected 155Eu/137Cs ratio of ~0.03. The trinitite samples investigated by Bellucci et al. (2013) yielded a calculated

SIMONETTI ET AL.
11
Fig. 14-6. BSE images (A, B) of trinitite samples exhibiting intrinsic chemical heterogeneities present at the micrometre scale. Contrast in atomic mass (Z) within BSE map is indicated by varying shades of grey; lighter areas are indicative of higher Z, which represent the glassy component of trinitite. Remnant Si-rich grains are denoted by darker gray (lower Z) areas. (C) BSE image is overlain by alpha radiography results indicating positive correlation between Si-depleted areas with elevated alpha (i.e., U-, Pu-related) emissions (from Wallace et al., in press). Red color of alpha map was generated in Photoshop® for contrast against BSE map. Areas of high activity are indicated by increased concentration of red spots, and activity is concentrated predominantly within the glassy component (as shown in inset).
155Eu/137Cs ratio of 0.012 ± 0.006 (1, n=3). Figure 14-9 exhibits a plot of calculated ratios for the fission of 239Pu, 235U, and the activities measured for three samples of trinitite. Fission products for the thermal neutron induced fission of 238U are not available in the literature, but the A number of fission products are determined by the A number of the parent (Wahl 1988). Therefore, the yields of fission products of 238U should be close to those from the fission of 239Pu. Moreover, fast neutrons (1 MeV) are required to induce fission in 238U (Shoupp & Hill 1949), and these were limited in the Trinity event (Parekh et al. 2006). Consequently, abundant fission of 238U atoms is unlikely. The lower 155Eu/137Cs ratio is not temperature-dependent as the boiling point of Eu (1,527°C, Liede 2003) is significantly higher than that of Cs (671°C, Liede 2003); as discussed below, the spatial (geographic) distribution of the 137Cs activity is random and
hence not related to temperature (i.e., these would correlate negatively with increasing distance from ground zero). Thus, this same interpretation can also be extended to 155Eu. The data shown in Fig. 14-9 do not fall on the line predicted by the fission of 239Pu (~238U), and the lower 155Eu/137Cs ratio is likely the result of the thermal neutron-induced fission products of 235U mixing with those of 239Pu. On the basis of the modeling by Semkow et al. (2006), the Trinity test could have had up to 30% fission of U from the natural U tamper. Thus, the results reported by Bellucci et al. (2013) are consistent with those from Semkow et al. (2006) and indicate mixing between the modeled fission products of both 239Pu and 235U from Wahl (1988).
A spatial distribution was established for the trinitite samples investigated in Bellucci et al. (2013) based on the methodologies previously outlined in Belloni et al. (2011) and Parekh et al.

SIMONETTI ET AL.
12
Fig. 14-7. Activities of 241Am versus fission products 133Ba, 137Cs, 155Eu, and 239Pu (Bellucci et al., 2013). Error bars are 1. Units are Bq/g normalized to the time of detonation.
Fig. 14-8. Activities of 241Am versus activation products 152Eu and 154Eu (Bellucci et al., 2013). Error bars are 1. Units are Bq/g normalized to the time of detonation.
(2006). Calculated distances away from ground zero were determined by using the calculated slow neutron flux based on the following input parameters: (1) the activity of 152Eu; (2) the cross section of 151Eu; (3) the half-life of 152Eu; (4) the isotopic abundance of 151Eu; (5) the concentration of Eu in the desert sand; (6) the atomic mass of Eu and (7) an approximation of the contribution of fast neutrons. The contribution of the latter to the process of activation should be small, and therefore can be approximated with the cadmium ratio for a nuclear reactor (Brunfelt et al. 1977, Parekh et al.
2006). The slow neutron flux is then compared to the measured curve of the slow neutron flux measured by Klema (1945) and reported by Bainbridge (1976), which yields the absolute distance from the neutron source. Klema’s (1945) curve was measured for distances >300 m, whereas the distances involved in this study are an extrapolation to <300 m. This approach is similar to those employed in the studies of Belloni et al. (2011) and Parekh et al. (2006). In addition, the device was located on top of a 30.5 m high tower, and therefore the absolute distance (from the device)

SIMONETTI ET AL.
13
Fig. 14-9. Plot from Bellucci et al. (2013) illustrating activities of 137Cs versus 155Eu and predicted ratios of fission products from both the neutron induced fission of 239Pu and 235U (Wahl 1988). Error bars are 1. Units are Bq/g normalized to the time of detonation.
is converted into distance away from ground zero (base of the tower) using the Pythagorean theorem. The calculated distances do not correlate with any of the activities for the radioisotopes investigated here (Fig. 14-10), and suggest a relatively homogeneous distribution; however, the calculated distances reported here are associated with relative uncertainties that range between ~1% and ~20% (average =8%; 1 level; Fig. 14-10), which restrict to some degree their interpretive significance. Of importance, both 241Am and 137Cs, daughter products of 241Pu and 138Xe (T1/2 = 3.8 m), respectively, have contrasting boiling temperatures (3,232 °C vs. 671°C, Liede 2003) and do not define trends. If temperature-controlled fractionations prevailed, then these radionuclides would correlate
with calculated distances away from ground zero, assuming the latter is the site of highest temperature during the explosion. This result contrasts with those from previous studies, which observed depletions 137Cs for samples closer to ground zero (Belloni et al. 2011, Parekh et al. 2006). The latter studies both focused on a small number of trinitite samples (n=3), and the fractionations observed in their investigations may be the result of sampling bias. Moreover, samples that lack 152Eu activity and hence originating even farther away from ground zero, display the same range in activity for each isotope as samples located closer to ground zero. This finding also corroborates a homogeneous distribution for the radioisotopes here. However, trinitite samples with the highest activities for 137Cs, 239Pu, and 241Am yield the shortest calculated distances of 50–60 m away from ground zero.
Major element chemistry
Nuclear forensic analysis of PDM such as trinitite is most effectively carried out when investigations are based on the distribution and detection of device-related radionuclides (e.g., Wallace et al. in press). As the discussed in this chapter, these can be documented using gamma spectroscopy (e.g., Bellucci et al. 2013) or LA–ICP–MS analysis (e.g., Bellucci et al. in press, Wallace et al. in press). However, much forensic information from trinitite can also be retrieved in relation to identifying device components based on an investigation of the major and trace element composition of the melt glass. Hence, a detailed
Fig. 14-10. Various radionuclides plotted against distance away from the base of the tower. Units are Bq/g normalized to the time of detonation. Error bars are 1 (from Bellucci et al. 2013).

SIMONETTI ET AL.
14
major and trace element investigation of trinitite was conducted by Bellucci et al. (submitted) using EMPA and LA–ICP–MS methods in an attempt to delineate natural vs. anthropogenic (device) components. The rationale being that the chemical composition of the host arkosic sand (i.e., geological background) at ground zero can be realistically estimated and consequently the addition of chemical components can be attributed to the presence of device components.
Figure 14-11 presents plots for several major element abundances vs. FeO wt% contents, and most of the trends can be attributed to relative mixing between the phases present in arkosic sand: quartz, K-feldspar, and calcite/gypsum (Bellucci et al. submitted). There are elements that display concentrations greater than what can be expected based on the mineralogy of the arkosic sand; therefore, these elements (i.e., Al, Fe, Ti, Mn, and Mg) could in part originate from an anthropogenic source (Fig. 14-11). For example, K-feldspar and plagioclase are the major Al-bearing phases in arkosic sand, which typically have Al2O3 contents of ~18 wt.% (Fig. 14-11). There are several analyses of trinitite glass that contain Al2O3 contents ≥18 wt.% and therefore these cannot be attributed to a combination of precursor minerals present in the arkosic sand. Therefore, one possibility is that the higher Al contents derive from the Al shells contained within Gadget. Linear trends are also defined by the wt.%. abundances of ‘metallic’ major elements (i.e., TiO2, MnO, MgO) vs. FeO (Fig. 14-11). Enrichment in Fe could be due to mixing with trace mafic phases within the sand (e.g.,
amphibole, ilmenite). However, at high FeO wt.% contents the MgO/FeO, MnO/FeO, and TiO2/FeO ratios ‘fractionate’ (deviate), which is indicative of non-stoichiometric behavior. Stoichiometric behav-ior will result in linear trends in Fig. 14-11 and is expected if mixing occurs predominantly between mafic minerals; e.g., Fe, Mg, and Mn substitute for each other and the TiO2/FeO ratio in ilmenite is constant. Thus, deviation in the expected ratio between metals could be attributed to mixing between Fe and other metals from the steel bomb tower. Enrichment in CaO content is likely due to the incorporation of calcite, gypsum, or plagioclase, which are present (combined) as a natural Ca-rich component in the sand. Abundances of Na2O or SiO2 vs. FeO do not define any trends, and are likely the result of mixing of quartz, K-feldspar, plagioclase ± chlorite. Trends in the wt.%. abundances of K2O vs. FeO are clearly evident and are presumably due to variable mixing between K-feldspar and the FeO-rich anthropogenic component. Of note, there are no correlations between the abundances of the major elements and the calculated distance away from ground zero based on the 152Eu activities (Bellucci et al. 2013). Uranium and trace element chemistry
The variation in abundances of several trace elements analyzed (i.e., Sr, Rb, Nb, Ta) can be attributed to mixing between major and minor phases present in the arkosic sand (Fig. 14-12). The concentration of Sr in trinitite is dependent on the relative amount of mixing between calcite and/or gypsum (Sr-rich end-members) and K-feldspar and
Fig. 14-12. Plots exhibiting abundances of major elements versus trace elements contents for trinitite indicating mixing between different mineral phases (see text for details). Data marked with an (x) are not included in linear regression calculations (from Bellucci et al. submitted).

SIMONETTI ET AL.
15
Fig
. 14-
11. C
once
ntra
tion
s of
maj
or e
lem
ents
ver
sus
FeO
con
tent
s; a
ll u
nits
are
in w
t% (
Bel
lucc
i et a
l., s
ubm
itte
d).

SIMONETTI ET AL.
16
quartz (Sr-poor end-members) as shown in Figure 14-12. Rubidium contents define a positive correlation with K2O abundances, which suggests that the Rb budget in trinitite glass is determined by the amount K-feldspar present during melting. Niobium and Ta, which are geochemical surrogates, correlate with TiO2 contents and suggest that ilmenite may be largely responsible for the budget of these elements. Two data points do not fall on the main trend and display gross enrichments in both Nb and Ta (Fig. 14-12), which could likely have an anthropogenic origin. A Ta-bearing inclusion has previously been reported on the surface of trinitite (Bellucci & Simonetti 2012) and could be attributed to either the tamper or electronics used in the device.
Temperature-induced fractionation of the elemental abundances/ratios as a result of the explosion could have occurred due to the extreme heat. Therefore, normalizing trace element concen-trations to those for the upper continental crust (Rudnick & Gao 2005), and ordering them by decreasing condensation temperature (Lodders 2003) should yield insightful information (Fig. 14-13). As with the trends defined based on the major element abundances (Fig. 14-11), the trace elements contents reported here can be attributed to mixing between precursor minerals present within the sand. The normalized patterns shown in Figure 14-13 indicate that most of the trace elements contain concentrations similar to those of upper continental crust (Rudnick & Gao 2005). Outliers have been categorized and grouped based on minerals typically found in arkosic sandstone.
All trace element patterns shown in Fig. 14-13 display depletions in metals (i.e., Cr and Co). Copper, Pb, Th, and U indicate the largest variations in elemental concentrations, with each spanning several orders of magnitude. Additionally, there are no systematic trends from left to right in Fig. 14-13, which is consistent with the lack of temperature-controlled elemental fractionations. Analyses shown in Fig. 14-13a display the flattest patterns and therefore these are considered to represent “average” (most homogeneous) trinitite compos-itions. Figure 14-13b illustrates analyses that are similar to “average” trinitite, except for the relative enrichment in U; the origin of U will be discussed later.
The enrichments in specific trace elements (Figs. 14-13c,d,e) can be attributed to the presence of accessory minerals, such as ilmenite (Nb, Ta), zircon (Hf), monazite (light rare earth elements –
Sam
ple/
Upp
er C
ontin
enta
l Cru
st
1
10
1
10
0.1
1
10
0.1
1
10
0.1
1
10
100
Zr Y Gd Tb Dy Ho Er Tm Lu Hf Th U Nd SmNb Pr La Ta Ce Yb Sr Ba Co Eu Cr Cu Ga Rb Cs Pb Sn
“Th Enriched” (n=6)
“Zr Enriched” (n=25)
“Nb & Ta Enriched” (n=6)
“U Enriched” (n=44)
“Average” (n=36)
1000
0
A
B
C
D
E
Fig. 14-13. Normalized trace element diagrams (modified
from Bellucci et al., submitted). Elements ordered (left to right) in order of decreasing condensation temperatures (Lodders 2003), and normalized to the “average” composition of upper continental crust (Rudnick & Gao 2003).
LREE, Th), apatite (LREE, Th) that are common in arkosic sandstone. The presence of ilmenite (Fig. 14-13c) is diagnosed by elevated contents of Nb and Ta, which are positively correlated with TiO2 contents (Fig. 14-11). Of interest, the two samples of trinitite that contain significant enrichments in Nb and Ta also have trace element concentrations similar to the other trinitite samples. This feature suggests an anthropogenic source for Nb and Ta. The presence of zircon (Fig. 14-13d) is identified by the correlated enrichments in Zr, Hf, U, Y, and the
SIMONETTI ET AL.
17
heavy rare earth elements (HREE). The incorpor-ation of monazite and/or apatite (Fig. 14-13e) is identified by higher contents of Th, Y, and LREE.
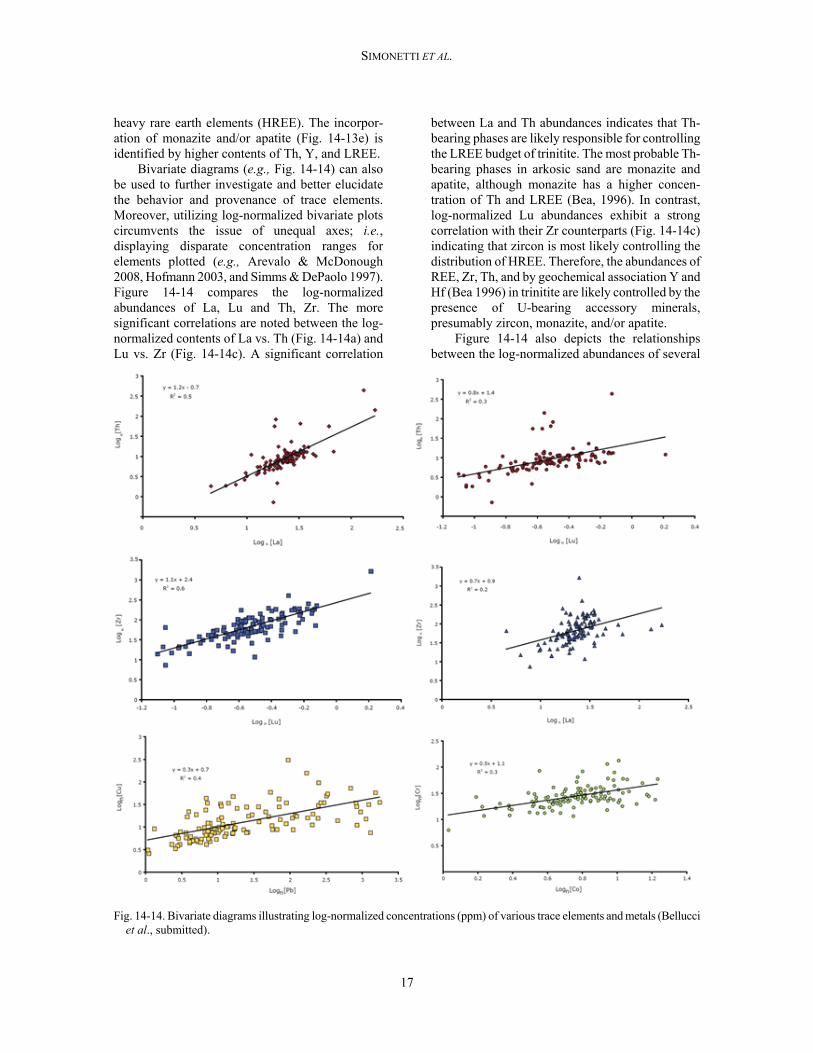
Bivariate diagrams (e.g., Fig. 14-14) can also be used to further investigate and better elucidate the behavior and provenance of trace elements. Moreover, utilizing log-normalized bivariate plots circumvents the issue of unequal axes; i.e., displaying disparate concentration ranges for elements plotted (e.g., Arevalo & McDonough 2008, Hofmann 2003, and Simms & DePaolo 1997). Figure 14-14 compares the log-normalized abundances of La, Lu and Th, Zr. The more significant correlations are noted between the log-normalized contents of La vs. Th (Fig. 14-14a) and Lu vs. Zr (Fig. 14-14c). A significant correlation
between La and Th abundances indicates that Th-bearing phases are likely responsible for controlling the LREE budget of trinitite. The most probable Th-bearing phases in arkosic sand are monazite and apatite, although monazite has a higher concen-tration of Th and LREE (Bea, 1996). In contrast, log-normalized Lu abundances exhibit a strong correlation with their Zr counterparts (Fig. 14-14c) indicating that zircon is most likely controlling the distribution of HREE. Therefore, the abundances of REE, Zr, Th, and by geochemical association Y and Hf (Bea 1996) in trinitite are likely controlled by the presence of U-bearing accessory minerals, presumably zircon, monazite, and/or apatite.
Figure 14-14 also depicts the relationships between the log-normalized abundances of several
Fig. 14-14. Bivariate diagrams illustrating log-normalized concentrations (ppm) of various trace elements and metals (Bellucci et al., submitted).

SIMONETTI ET AL.
18
metals in trinitite glass. The metals reported in Fig. 14-14 are not expected to be present in the precursor arkosic sand at the abundances reported by Bellucci et al. (submitted). Positive trends are noted in the log-normalized abundances of Cu vs. Pb (Fig. 14-14e) and Cr vs. Co (Fig. 14-14f). Chromium and Co are trace elements present in steel and could represent input from the blast tower, whereas Cu was present as wiring used in Gadget and monitoring equipment. The positive correlation between these metals indicates mixing between the same two end-members, namely anthropogenic (Gadget and blast tower) and the arkosic sand. Inclusions of CuS and PbO have been observed on the surface of trinitite glass and were attributed to melted wiring and piece of the tamper (Bellucci & Simonetti 2012). Such inclusions may also have been melted/incorporated within the trinitite glass.
The distribution of U abundances is not easily assessed by linear correlations in bivariate or log-normalized bivariate diagrams as three distinct trends are reported (Fig. 14-15). When U contents are plotted against those for Zr and Pb (Fig. 14-15), U appears to have three sources: 1) indigenous U from zircon, monazite and/or apatite; 2) the tamper used in the Gadget device (because of the correlation with extreme Pb concentrations, >50 μg/g); and 3) an unknown, high concentration U source.
Fig. 14-15. Plots of U (μg/g or ppm) versus contents of Zr
(ppm - top) and Pb (ppm - bottom) for trinitite samples investigated (Bellucci et al., submitted).
In situ U isotopes In the absence of U fission during detonation,
the U isotope systematics in trinitite should reflect mixing of U from the tamper and the desert sand. Both of these components had ‘natural’ U isotopic compositions (235U/238U=0.007256 ± 0.000002 (2), Hiess et al. 2012) and are therefore isotopically unresolvable. However, gamma spectroscopy results for trinitite from Bellucci et al. (2013) indicate that 235U present in the tamper did fission since fission product ratios were obtained (155Eu/137Cs=0.012 ± 0.006 – Bellucci et al. 2013, 90Sr/137Cs = 2.15 ± 0.02
(1) – Semkow et al. 2006) that reflect mixing between 235U and 239Pu fission products. Thus, the post-fission U signature in trinitite should be evidenced by a marked depletion in 235U and enrichment in 236U produced by neutron capture by un-fissioned 235U. Super-grade Pu (240Pu/239Pu of 0.0130 – 0.0176) was used in the device (Parekh et al. 2006, Fahey et al. 2010) and consisted of 4 isotopes: 238Pu, 239Pu, 240Pu, and 241Pu. 238Pu, 239Pu, and 240Pu decay via α-emission into 234U, 235U, and 236U, respectively; in contrast, 241Pu decays into 241Am via – decay. Hence, the U isotopic composition of historic PDMs involving a Pu device (i.e., trinitite) is intimately linked with the isotopic composition of the Pu employed, as un-fissioned Pu is entrained in the debris. Measurement of the U isotopic compositions in trinitite at high spatial resolution (scale of 10s of micrometres), therefore, should yield the signatures from the device, natural U (tamper and geologic background), and from the in situ decay of Pu over the 67 years since the Trinity explosion. All of the half-lives used in the modeling results reported in Bellucci et al. (in press) are from the following source: http://www.nndc.bnl. gov/chart/chartNuc.jsp.
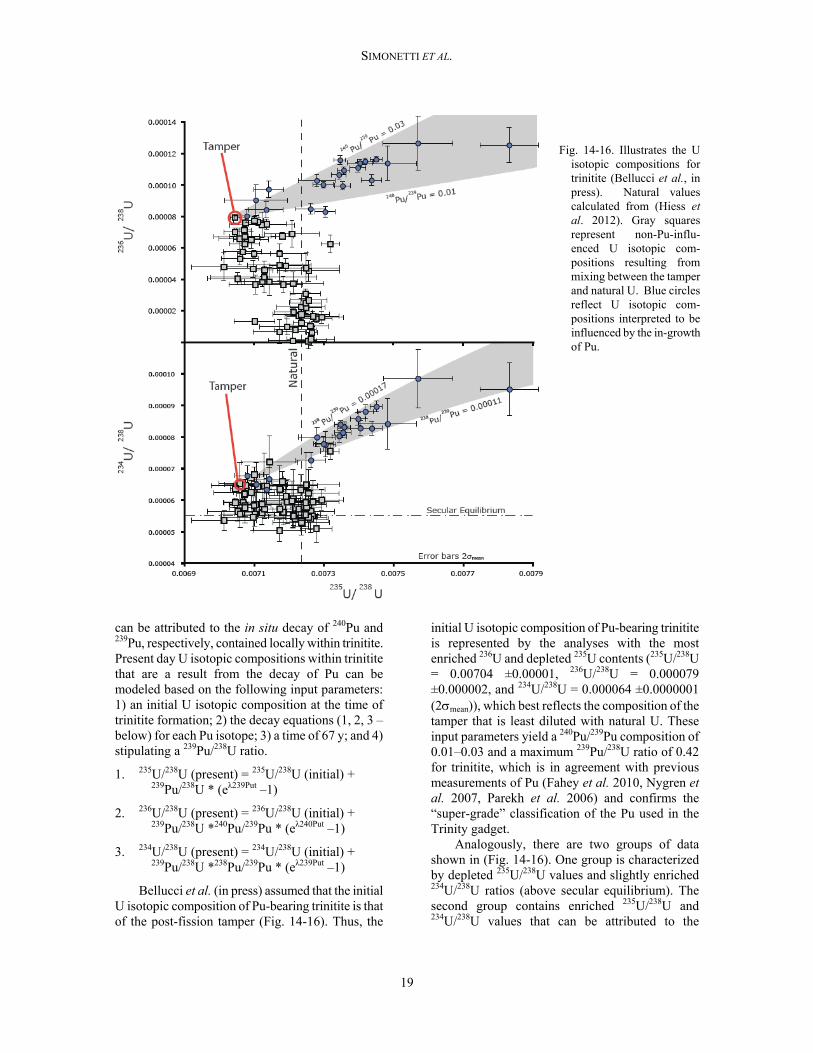
The U isotopic compositions of individual analyses (n=75) in 12 samples of trinitite glass were measured in situ by laser ablation multi-collector inductively coupled plasma mass spectrometry (LA–MC–ICP–MS) on polished thin sections (Bellucci et al. in press). The plot of 236U/238U vs. 235U/238U exhibits two groups of data (Fig. 14-16). One group is identified by enrichment in 236U and depletion in 235U, and can be attributed to fission of the natural U present within the tamper of the device. The data trending towards the isotope value for natural U can be attributed to the dilution by randomly distributed U-bearing minerals (e.g., zircon, apatite, monazite) present at trace amounts within the arkosic sand. The second group of data in Fig. 14-16 is defined by significant enrichments in both 236U and 235U and
SIMONETTI ET AL.
19
Fig. 14-16. Illustrates the U
isotopic compositions for trinitite (Bellucci et al., in press). Natural values calculated from (Hiess et al. 2012). Gray squares represent non-Pu-influ-enced U isotopic com-positions resulting from mixing between the tamper and natural U. Blue circles reflect U isotopic com-positions interpreted to be influenced by the in-growth of Pu.
can be attributed to the in situ decay of 240Pu and 239Pu, respectively, contained locally within trinitite. Present day U isotopic compositions within trinitite that are a result from the decay of Pu can be modeled based on the following input parameters: 1) an initial U isotopic composition at the time of trinitite formation; 2) the decay equations (1, 2, 3 – below) for each Pu isotope; 3) a time of 67 y; and 4) stipulating a 239Pu/238U ratio.
1. 235U/238U (present) = 235U/238U (initial) + 239Pu/238U * (eλ239Put –1)
2. 236U/238U (present) = 236U/238U (initial) + 239Pu/238U *240Pu/239Pu * (eλ240Put –1)
3. 234U/238U (present) = 234U/238U (initial) + 239Pu/238U *238Pu/239Pu * (eλ239Put –1)
Bellucci et al. (in press) assumed that the initial U isotopic composition of Pu-bearing trinitite is that of the post-fission tamper (Fig. 14-16). Thus, the
initial U isotopic composition of Pu-bearing trinitite is represented by the analyses with the most enriched 236U and depleted 235U contents (235U/238U = 0.00704 ±0.00001, 236U/238U = 0.000079 ±0.000002, and 234U/238U = 0.000064 ±0.0000001 (2mean)), which best reflects the composition of the tamper that is least diluted with natural U. These input parameters yield a 240Pu/239Pu composition of 0.01–0.03 and a maximum 239Pu/238U ratio of 0.42 for trinitite, which is in agreement with previous measurements of Pu (Fahey et al. 2010, Nygren et al. 2007, Parekh et al. 2006) and confirms the “super-grade” classification of the Pu used in the Trinity gadget.
Analogously, there are two groups of data shown in (Fig. 14-16). One group is characterized by depleted 235U/238U values and slightly enriched 234U/238U ratios (above secular equilibrium). The second group contains enriched 235U/238U and 234U/238U values that can be attributed to the

SIMONETTI ET AL.
20
presence of Pu. While the presence of 240Pu is seen as a contaminant in nuclear weapons because it undergoes spontaneous fission and possibly leading to early detonation and a reduction of the overall yield (Rhodes 1986), 238Pu was not monitored in the production of the device’s core. The latter is produced during the nuclear fuel cycle or during nuclear detonation. Due to the short irradiation times used to create the Pu for the Trinity device (Rhodes 1986) and the small time interval involved during detonation, 238Pu would have been present in trinitite in trace amounts. Consequently, time-integrated modeling of the U isotope systematics yields a 238Pu/239Pu ratio of 0.00011–0.00017 and represents the value in the un-fissioned Pu from the device after detonation.
SUMMARY
The results reported in this chapter clearly indicate that forensic investigation of PDMs is complex, and requires a multi-analytical approach in order to obtain an accurate assessment of the nuclear device’s chemical and isotopic composition. Accurate information regarding the presence and activities of radionuclides within PDMs can always be obtained by using more traditional radiochemical separation methods based on bulk sample analysis. However, these can be rather time-consuming and tend to “average out” the chemical and isotopic signals from the device and ‘matrix’ components. In our case, use of trinitite as the PDM possibly represents the least complex scenario in relation to unraveling natural vs. anthropogenic components given the relative simplicity of the host geological environment at ground zero. This latter situation will surely not always prevail, especially since future potential nuclear threats shall be most likely directed at major urban centers. In the event of a nuclear strike within an urban environment, the matrix of a PDM “urban jungle” sample will be extremely complex (in particular relative to trinitite), hence rendering forensic analysis of bulk samples that much more difficult. In contrast, the sample imaging and micro-analytical techniques described in this chapter are capable of discerning and honing into radionuclide-rich areas of PDMs; hence providing the opportunity to determine their chemical and isotopic compositions in a relatively rapid (hours) time frame. Although a significant number of individual laser analyses are required (as demonstrated in this chapter) in order to formulate interpretations with a significant level of confide-ence, the approach adopted here is nonetheless still
less time-consuming compared to bulk separation techniques. Development of ‘rapid’ forensic tools for accurate chemical and isotopic fingerprinting of nuclear weapons is essential for source attribution, and can serve as a strong deterrent against potential future aggressions and consequently increase international security. REFERENCES
AREVALO, R.A.J. & MCDONOUGH, W.F. (2008): Tungsten geochemistry and implications for understanding the Earth's interior. Earth Planet. Sci. Lett. 272, 656–665.
BAINBRIDGE, K.T. (1976): Trinity Report. LA-6300-H. Los Alamos Scientific Laboratory, Los Alamos, NM.
BARNES, I.L., GARNER, E.L., GRAMLICH, J.W., MOORE, L.J., MURPHY, T.J., MACHLAN, L.A., SHIELDS, W.R., TATSUMOTO, M. & KNIGHT, R.J. (1973): Determination of lead, uranium, thorium and thallium in silicate glass standard materials by isotope dilution mass spectrometry. Anal. Chem. 45, 880–885.
BEA, F. (1996): Residence of REE, Y, Th, and U in granites and crustal protoliths; Implications for the chemistry of crustal melts. J Pet. 37, 521-552.
BELLONI, F., HIMBERT, J., MARZOCCHI O. &
ROMANELLO, V. (2011): Investigating incorpor-ation and distribution of radionuclides in trinitite. J. Environ. Radioactiv. 102, 852-862.
BELLUCCI, J.J. & SIMONETTI, A. (2012): Nuclear forensics: searching for nuclear device debris in trinitite-hosted inclusions. J. Radioanal. Nucl. Chem. 293, 313-319.
BELLUCCI, J.J., WALLACE, C., KOEMAN, E.C., SIMONETTI, A., BURNS, P.C., KIESER, J., PORT, E. & WALCZAK, T. (2013): Distribution and behavior of some radionuclides associated with the Trinity nuclear test. J. Radioanal. Nucl. Chem. 295, 2049-2057.
BELLUCCI, J.J., SIMONETTI, A., WALLACE, C., KOEMAN, E.C. & BURNS, P.C. (in press): Isotopic Fingerprinting of the World’s First Nuclear Device Using Post-Detonation Materials. Anal. Chem.
BELLUCCI, J.J., SIMONETTI, A., WALLACE, C., KOEMAN, E.C. & BURNS, P.C. (submitted): A Detailed Geochemical Investigation of Post Nuclear Detonation Trinitite Glass at High Spatial Resolution: Delineating Anthropogenic vs. Natural Components. Chem. Geol.

SIMONETTI ET AL.
21
BRENNECKA, G.A., BORG, L.A., HUTCHEON, I.D., SHARP, M.A. & ANBAR, A.D. (2010): Natural variations in uranium isotope ratios of uranium ore concentrates: Understanding the 238U/235U fractionation mechanism. Earth Planet. Sci. Lett. 291, 228-233.
BRUNFELT, A.O., ROELANDTS, I. & STEINNES, E. (1977): Some new methods for the determination of rare-earth elements in geological materials using thermal and epithermal neutron activation. J Radioanal. Chem. 38, 451–459
BUCHHOLZ, B.A., BROWN, T.A., HAMILTON, T.F., HUTCHEON, I.D., MARCHETTI, A.A., MARTINELLI, R.E., RAMON, E.C., TUMEY, S.J. & WILLIAMS, R.W. (2007): Investigating uranium isotopic distributions in environmental samples using AMS and MC-ICPMS. Nucl. Instrum. Methods Phys. Res., Sect. B 259, 733-738.
CHEN, W. & SIMONETTI, A. (2012): In-situ determination of major and trace elements in calcite and apatite, and U-Pb ages of apatite from the Oka carbonatite complex: insights into a complex crystallization history. Chem. Geol. DOI:10.1016/j.chemgeo.2012.04.022.
DUFFIN, A.M., HART, G.L., HANLEN, R.C. & EIDEN, G.C. (in press): Isotopic Analysis of Uranium in NIST SRM glass by femtosecond laser ablation MC-ICPMS. J. Radioanal. Nucl. Chem. DOI 10.1007/s10967-012-2218-8
EBY, N., HERMES, R., CHARNLEY, N. & SMOLIGA, J.A. (2010): Trinitite-the atomic rock. Geol. Today 26, 180-185.
FAHEY, A.J., ZEISSLER, C.J., NEWBURY, D.E., DAVIS, J. & LINDSTROM, R.M. (2010): Post-detonation nuclear debris for attribution. Proc. Nat. Acad. Sci. 107, 20207-20212.
GLASSTONE, S. & DOLAN, P.J. (1977): In The Effects of Nuclear Weapons. US Department of Defense, US Energy Research and Development Agency: Washington, D.C., 670 p.
HIESS, J., CONDON, D.J., MCLEAN, N. & NOBLE, S.R. (2012): 238U/235U Systematics in Terrestrial Uranium-Bearing Minerals. Science 335, 1610-1614.
HOFMANN, A.W. (2003): Sampling mantle heterogeneity through oceanic basalts: Isotopes and trace elements, The Mantle and Core (ed. R.W. Carlson) Vol. 2 Treatise on Geochemistry (eds. H.D. Holland and K.K Turekian), Elsevier-Pergamon, Oxford, 61-101.
JOINT WORKING GROUP OF THE AMERICAN
PHYSICAL SOCIETY AND THE AMERICAN
ASSOCIATION FOR THE ADVANCEMENT OF
SCIENCE, NUCLEAR FORENSICS: Role, State of the Art, and Program Needs, AAAS Publication Services, USA, 2010. ISBN: 978-0-87168-720-3 (http://cstsp.aaas.org/files/Complete.pdf).
KLEMA, E.D. (1945): July 16th nuclear explosion: neutron measurements with gold-foil detectors. Los Alamos Scientific Laboratory Report, LA-362.
LIEDE, D.R. (ed) (2003): CRC handbook of chemistry and physics, 84th edn. CRC Press, Boca Raton.
LODDERS, K. (2003): Solar system abundances and condensation temperatures of the elements. Astrophys J 591, 1220-1247.
MAYER, K., WALLENIUS, M. & VARGA, Z. (2013): Nuclear Forensic Science: Correlating Measurable Material Parameters to the History of Nuclear Material. Chem. Rev. DX.DOI.ORG/ 10.1021/cr300273f.
MERTZ-KRAUS, R., JOCHUM, K.P., SHARP, W.D., STOLL, B., WEIS, U. & ANDRAEA, M.O. (2010): In situ 230Th-232Th-234U-238U analysis of silicate glasses and carbonates using laser ablation single-collector sector-field ICP-MS. J. Analyt. At. Spectrom. 25, 1895-1904.
MOODY, K.J., HUTCHEON, I.D., & GRANT, P.M. (2005): Nuclear Forensic Analysis. CRC Press, Taylor & Francis Group, Boca Raton, Florida, 485 p.
NYGREN, U., RAMEBACK, H. & NILSSON, C. (2007): Age determination of plutonium using inductively coupled plasma mass spectrometry. J Radioanal. Nucl. Chem. 272, 45-51.
OVASKAINEN, R. (1999): The determination of minor isotope abundances in naturally occurring uranium materials: the tracing power of isotopic signatures for uranium. Report Series in Radiochemistry, Volume 12; University of Helsinki, Helsinki, Finland.
PAREKH, P.P., SEMKOW, T.M., TORRES, M.A., HAINES, D.K., COOPER, J.M., ROSENBURG, P.M. & KITTO, M.E. (2006): Radioactivity in trinitite six decades later. J. Environ. Radioactiv. 85, 103-120.
PHILPOTTS, A.R. & AGUE, J.J. (2009): Principles of igneous and metamorphic petrology. Cambridge University Press, Cambridge, 667 p.

SIMONETTI ET AL.
22
RHODES, R. (1986): The making of the atomic bomb (1st edition). Simon and Schuster, New York, 657 p.
RUDNICK, R.L. & GAO, S. (2003): The composition of the continental crust. In: the Crust (ed. R.L. Rudnick) Vol. 3, Treatise on Geochemistry (eds. H.D. Holand and K.K. Turekian), Elsevier-Pergamon, Oxford, 1-64.
RUTHERFORD, E. & SODDY, F. (1903): Radioactive change. Phil. Mag. 5, 576-591.
SEMKOW, T.M., PAREKH, P.P. & HAINES, D.K. (2006): Modeling the Effects of the Trinity Test. Applied Modeling and Computations in Nuclear Science, 142-159.
SHOUPP, W.E. & HILL, J.E. (1949): Thresholds for fast neutron fission in thorium and uranium. Phys. Rev. 75, 785–789.
SIMS, K.W.W. & DEPAOLO, D.J. (1997): Inferences about mantle magma sources from incompatible element concentration ratios in oceanic basalts. Geochim. Cosmochim. Acta 61, 765-784.
SRNCIK, M., MAYER, K., HRNECEK, E., WALLENIUS, M., VARGA, Z., STEIER, P. & WALLNER, G. (2011): Investigation of the 236U/238U isotope abundance ratio in uranium ores and yellow cake samples. Radiochim. Acta 99, 335-339.
STANLEY, F.E. (2012): A beginner’s guide to uranium chronometry in nuclear forensics and safeguards. J. Analyt. At. Spectrom. 27, 1821-1830.
STEIER, P., BICHLER, M., FIFIELD, L. K., GOLSER, R., KUTSCHERA, W., PRILLER, A., QUINTO, F., RICHTER, S., SRNCIK, M., TERRASI, P., WACKER, L., WALLNER, A., WALLNER, G., WILCKEN, K.M. & WILD, E.M. (2008): Natural and anthropogenic 236U in environmental samples. Nucl. Instrum. Methods Phys. Res., Sect. B 266, 2246-2250.
STIRLING, C.H., LEE, D.C., CHRISTENSEN, J.N. &
HALLIDAY, A.N. (2000): High-precision in situ 238U–234U–230Th isotopic analysis using laser ablation multiple-collector ICPMS. Geochim.
Cosmochim. Acta, 64, 3737–3750.
SUBLETTE, C. (2012): Nuclear Weapons Frequently Asked Questions. http://nuclearweaponarchive .org/Nwfaq/Nfaq0.html.
US GPO, 2000. Trinity Site July 16, 1945. US Government Printing Office: 2000-844-916, Washington, DC.
VAN ACHTERBERGH, E., RYAN, C.G., JACKSON, S.E. & GRIFFIN, W. (2001): Data reduction software for LA-ICP-MS. In: Laser Ablation-ICPMS in the Earth Sciences. Mineral. Assoc. Canada Short Course 29, 239–243.
VARGA, Z. & SURANYI, G. (2009): Detection of previous neutron irradiation and reprocessing of uranium materials for nuclear forensic purposes. Appl. Radiat. Isot. 67, 516-522.
WAHL, A. (1988): Nuclear-Charge Distribution and Delayed-Neutron Yields for Thermal Neutron-Induced Fission of U-235, U-233 and Pu-239 and for Spontaneous Fission of Cf-252. Atom. Data Nucl. Data Tables 39, 1-156.
WALLACE, C., BELLUCCI, J.J., SIMONETTI, A., HAINLEY, T., KOEMAN, E.C. & BURNS, P.C. (in press): A multi-method approach for determination of radionuclide distribution in trinitite. J. Radioanal. Nucl. Chem.
WALLENIUS, M. (2001): Origin determination of reactor produced plutonium by mass spectrometric techniques: Application to nuclear forensic science and safeguards. http://ethesis.helsinki.fi/julkaisut/mat/kemia/vk/wallenius/originde.pdf.
WIDNER, T., SHONKA, J., BURNS, R., FLACK, S., BUDDENBAUM, J., O'BRIEN, J., ROBINSON, K. &
KNUTSEN, J. (2009): Final Report of CDC's LAHDRA Project.
WILCKEN, K.M., BARROWS, T.T., FIFIELD, L.K., TIMS, S.G. & STEIER, P. (2007): AMS of natural 236U and 239Pu produced in uranium ores. Nucl. Instrum. Methods Phys. Res., Sect. B 259, 727-732.