chapter 4: social conditions a. introduction and...
TRANSCRIPT

4-1
Chapter 4: Social Conditions
A. INTRODUCTION AND METHODOLOGY
This chapter addresses a variety of issues that support social conditions, including population andhousing characteristics, community facilities and open spaces, and neighborhood character. Thediscussion of social conditions considers the entire MESA study area (depicted in Figure 3-1 inChapter 3, above) with particular focus on the project corridor—the routes proposed for thevarious project alternatives—where the greatest potential for change would occur. Becausenone of the project alternatives have the potential to change social conditions in the secondarystudy area, where Build Alternatives 1 and 2 would add service along an existing subway line,this analysis is of the primary study area only.
The analysis was conducted by first compiling existing data for population and housing, com-munity facilities and open spaces, and neighborhood character. The source for the populationand housing data is the 1990 Census of Population and Housing. The inventory of communityfacilities is based on Community District Needs (1997) for Manhattan’s Community Boards, theDepartment of Parks and Recreation’s Property Lists (dated November 4, 1996), supplementaryinformation provided by the various Community Boards within the study area, and the informa-tion gathered for the analysis of land use, zoning, and public policy in Chapter 3. The assessmentof neighborhood character is based on information gathered for other chapters of this document,particularly including the analyses of land use (Chapter 3) and visual and aesthetic considerations(Chapter 6). After assessing the existing conditions in the study area, the expected changes inthe future are considered, based on information compiled in Chapter 3. Then, each alternative’seffects on population and housing, community facilities and open spaces, and neighborhoodcharacter are evaluated.
This chapter assesses the potential impacts that may result during operation of each project al-ternative. Impacts on social conditions during construction are documented in Chapter 15, “Con-struction and Construction Impacts.”
B. EXISTING CONDITIONS
OVERVIEW OF STUDY AREA
POPULATION AND HOUSING
As described in Chapter 3 (“Land Use, Zoning, and Public Policy”), much of the study area isresidential. In fact, the MESA study area is home to 45 percent of Manhattan’s total population(see Table 4-1). The portion of the study area with the greatest number of residents is the UpperEast Side (with more than 30 percent of the study area’s population and nearly 14 percent ofManhattan’s total population), followed closely by the Lower East Side (27.7 percent of thestudy area’s population) and then East Midtown. Although East Harlem is also predominantly

Manhattan East Side Transit Alternatives MIS/DEIS
4-2
Table 4-1Study Area Population
Zone 1970 1980 1990 Change Study Area Manhattan
1980-1990 1990 1990Percent Percent of Percent of
Lower Manhattan 10,445 13,725 23,631 72.2% 3.5% 1.6%
Lower East Side 200,442 177,207 186,176 5.1 27.7 12.5
East Midtown 133,253 141,950 150,140 5.8 22.4 10.1
Upper East Side 199,280 197,343 202,690 2.7 30.2 13.6
East Harlem 154,751 112,915 108,468 -3.9 16.2 7.3
Study Area Total 698,171 643,140 671,105 4.4 100.0 45.1
Manhattan Total 1,539,233 1,428,285 1,487,536 4.4 -- --
Source: U.S. Department of Commerce, U.S. Census of Population and Housing, 1970, 1980,1990.
residential, it is less populated than those three zones. Table 4-1 shows the population in each ofthe study area zones. More detailed information on selected population characteristics is pro-vided in Table 4-2 and information on the study area’s labor force is provided in Table 4-3.
Within the study area are a full range of income levels. The areas with the highest median annu-al household income are in the Upper East Side and East Midtown zones (as well as in BatteryPark City), while those with the lowest median incomes are the Lower East Side (with a medianhousehold income at 56 percent of the study area’s median household income) and East Harlem(at 36 percent). More than 27 percent of the households on the Lower East Side and 39 percentof the households in East Harlem are living below the poverty level, compared with 18 percentfor the study area as a whole.
In 1990, minority groups constituted 35 percent of the study area’s population. Most of the studyarea’s minority residents live on the Lower East Side and in East Harlem—some 54 percent ofthe residents of the Lower East Side and 78 percent of those in East Harlem are minority resi-dents. Many of the minority residents on the Lower East Side (as well as in the northern part ofLower Manhattan) are Asian people living in Chinatown: in both the Lower Manhattan andLower East Side zones, approximately 30 percent of the total population is Asian. In addition, 30percent of the population of the Lower East Side is Hispanic and 10 percent is African-American. In East Harlem, the large proportion of residents are African-American and/orHispanic: a total of 49 percent of this zone’s residents are African-American and more than half(52 percent) are Hispanic. (Hispanic is an ethnic group that can include members of any race,such as Caucasian or African-American).
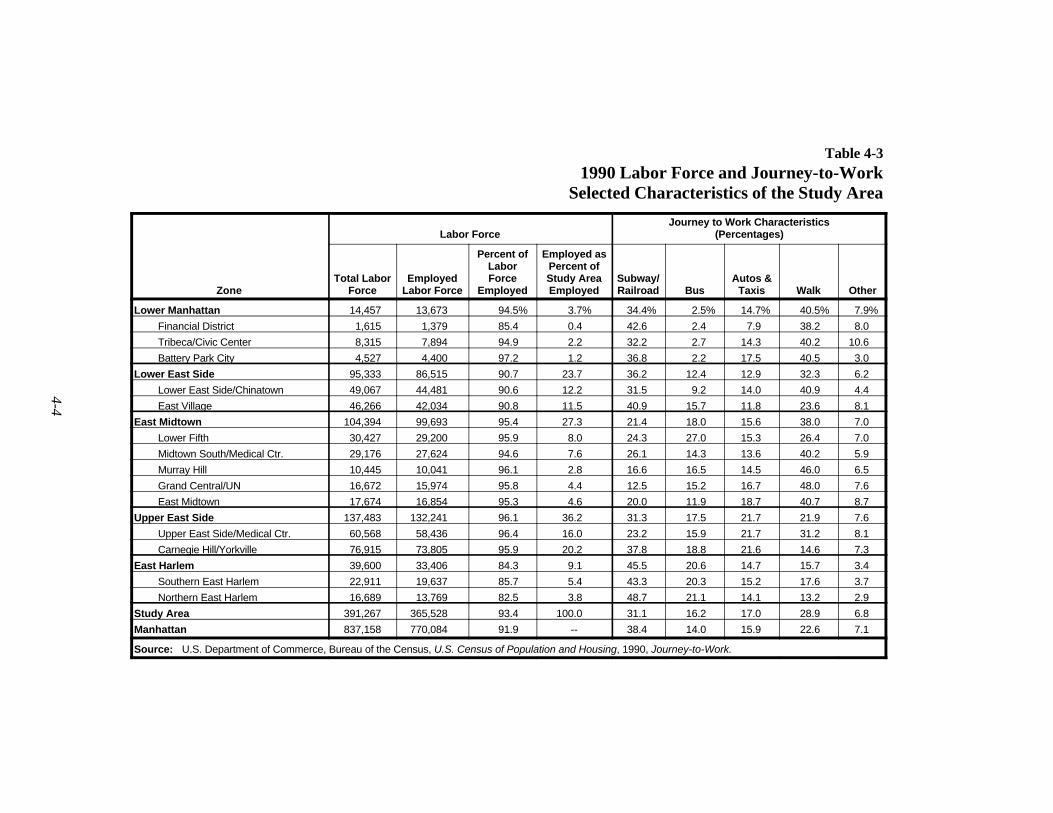
The study area includes a labor force of more than 391,000 people, of whom 93.4 percent(365,528) were employed in 1990. The employed labor force is concentrated in the same zonesand neighborhoods as the population: on the Lower East Side (with 23.7 percent of the studyarea’s employed labor force), in East Midtown (with 27.3 percent), and on the Upper East Side(with 36.2 percent of the study area’s employed labor force).

4-3
Table 4-21990 Population
Selected Characteristics of the Study Area
Zone Total 1980-1990 and Over (Persons) Income (Percent)**White Black Asian Hispanic*
Population Economic Profile
Percent Percent Household Annual PovertyChange, Age 65 Size Household Level
Race and Ethnicity (Percentage) Median BelowPopulation
Lower Manhattan 23,631 72.2% 58.9% 7.9% 30.6% 6.9% 12.4% 1.93 $49,554 13.4%
Financial District 2,326 82.3 69.7 17.4 10.5 12.2 12.8 1.67 $50,172 23.0
Tribeca/Civic Center 15,731 26.4 49.5 8.1 39.1 7.3 2.1 2.07 $46,755 15.7
Battery Park City 5,574 100.0 80.6 3.5 14.9 3.6 2.7 $72,489 3.91.65
Lower East Side 186,176 5.1 45.7 10.4 28.7 29.4 13.2 2.28 $23,616 27.3
Lower East Side/Chinatown 106,711 6.9 30.9 10.1 44.3 30.2 15.3 2.70 $17,780 28.6
East Village 79,465 2.7 65.6 10.7 7.6 28.4 10.4 1.88 $29,154 25.4
East Midtown 150,140 5.8 85.8 4.9 7.6 6.6 15.7 1.56 $47,926 8.1
Lower Fifth 45,666 -0.8 85.7 4.9 7.9 5.6 19.2 1.67 $47,660 5.8
Midtown South/Medical Ctr. 41,065 14.4 80.8 8.6 7.3 10.5 10.2 1.52 $39,160 14.2
Murray Hill 13,845 4.2 90.2 2.1 6.7 4.7 14.3 1.42 $48,398 4.9
Grand Central/UN 23,416 23.2 84.8 3.8 10.7 5.2 14.5 1.52 $53,088 7.0
East Midtown 26,148 -5.7 92.3 1.7 5.2 4.6 20.5 1.53 $56,255 5.7
Upper East Side 202,690 2.7 92.4 2.4 4.0 5.2 15.4 1.68 $59,763 5.4
Upper East Side/Medical Ctr. 88,772 -1.7 93.0 1.7 4.3 4.5 18.1 1.61 $60,633 5.0
Carnegie Hill/Yorkville 113,918 6.4 91.9 2.9 3.8 5.7 13.2 1.75 $59,030 5.6
East Harlem 108,468 -3.9 21.8 48.6 1.7 52.3 11.6 2.64 $15,490 39.4
Southern East Harlem 60,708 -3.7 27.2 40.8 2.7 57.0 11.8 2.61 $17,238 36.6
Northern East Harlem 47,760 -4.2 14.9 58.6 0.5 46.3 11.5 2.67 $13,231 43.0
Study Area 671,105 4.4 65.4 12.8 12.2 19.9 14.1 1.91 $42,473 17.8
Manhattan 1,487,536 4.1 58.3 22.0 7.4 26.0 13.3 1.99 $32,262 20.5
Notes: * An ethnic group that can include members of all different racial categories, including African-American and Caucasian residents.** Percent of persons with incomes below the established poverty level; poverty level varies depending on household size.
Source: U.S. Department of Commerce, Bureau of Census, U.S. Census of Population and Housing, 1980 and 1990.
4-4
Table 4-31990 Labor Force and Journey-to-Work
Selected Characteristics of the Study Area
Zone Force Labor Force Employed Employed Railroad Bus Taxis Walk Other
Labor Force (Percentages)Journey to Work Characteristics
Total Labor Employed Force Study Area Subway/ Autos &
Percent of Employed asLabor Percent of
Lower Manhattan 14,457 13,673 94.5% 3.7% 34.4% 2.5% 14.7% 40.5% 7.9%
Financial District 1,615 1,379 85.4 0.4 42.6 2.4 7.9 38.2 8.0
Tribeca/Civic Center 8,315 7,894 94.9 2.2 32.2 2.7 14.3 40.2 10.6
Battery Park City 4,527 4,400 97.2 1.2 36.8 2.2 17.5 40.5 3.0
Lower East Side 95,333 86,515 90.7 23.7 36.2 12.4 12.9 32.3 6.2
Lower East Side/Chinatown 49,067 44,481 90.6 12.2 31.5 9.2 14.0 40.9 4.4
East Village 46,266 42,034 90.8 11.5 40.9 15.7 11.8 23.6 8.1
East Midtown 104,394 99,693 95.4 27.3 21.4 18.0 15.6 38.0 7.0
Lower Fifth 30,427 29,200 95.9 8.0 24.3 27.0 15.3 26.4 7.0
Midtown South/Medical Ctr. 29,176 27,624 94.6 7.6 26.1 14.3 13.6 40.2 5.9
Murray Hill 10,445 10,041 96.1 2.8 16.6 16.5 14.5 46.0 6.5
Grand Central/UN 16,672 15,974 95.8 4.4 12.5 15.2 16.7 48.0 7.6
East Midtown 17,674 16,854 95.3 4.6 20.0 11.9 18.7 40.7 8.7
Upper East Side 137,483 132,241 96.1 36.2 31.3 17.5 21.7 21.9 7.6
Upper East Side/Medical Ctr. 60,568 58,436 96.4 16.0 23.2 15.9 21.7 31.2 8.1
Carnegie Hill/Yorkville 76,915 73,805 95.9 20.2 37.8 18.8 21.6 14.6 7.3
East Harlem 39,600 33,406 84.3 9.1 45.5 20.6 14.7 15.7 3.4
Southern East Harlem 22,911 19,637 85.7 5.4 43.3 20.3 15.2 17.6 3.7
Northern East Harlem 16,689 13,769 82.5 3.8 48.7 21.1 14.1 13.2 2.9
Study Area 391,267 365,528 93.4 100.0 31.1 16.2 17.0 28.9 6.8
Manhattan 837,158 770,084 91.9 -- 38.4 14.0 15.9 22.6 7.1
Source: U.S. Department of Commerce, Bureau of the Census, U.S. Census of Population and Housing, 1990, Journey-to-Work.

Chapter 4: Social Conditions
4-5
COMMUNITY FACILITIES AND OPEN SPACES
As would be expected in residential neighborhoods, the study area is also home to numerouscommunity facilities and open spaces. For purposes of this assessment, community facilities ex-amined include public and private schools, libraries, hospitals, police and fire stations, and reli-gious institutions. Open spaces include public parks, plazas, and sitting areas. Such resources arelocated throughout the study area, with particular concentrations where the population is great-est. Consequently, Lower Manhattan has fewer community facilities, while the other study areazones—and particularly the Lower East Side and East Harlem—have dense concentrations.Community facilities close to any of the project alignments are listed in Table 4-4 and shown inFigures 4-1 through 4-5.
NEIGHBORHOOD CHARACTER
The different neighborhoods in the MESA study area vary widely in character, covering the fullrange of types present in Manhattan. These include the dense Commercial Business Districts ofLower Manhattan and East Midtown, where the streets are lined with tall office buildings andbusy with traffic and pedestrians on weekdays, but quiet during nights and weekends. They alsoinclude mid- and high-rise residential neighborhoods in East Midtown and the Upper East Side,characterized by the city’s regular street grid, busy traffic patterns, and by taller buildings onmajor avenues with shorter buildings in the midblocks. The study area’s neighborhoods also in-clude those on the Lower East Side and in East Harlem, where mixes of low-rise older residen-tial and industrial buildings with large blocks of public housing are common. These neighborhoodshave less traffic and the associated noise than the more densely developed parts of the city.
LOWER MANHATTAN
POPULATION AND HOUSING
In 1990, Lower Manhattan contained just 3.5 percent of the study area’s population. These resi-dents live predominantly in and near Battery Park City, in Southbridge Towers (just south of theBrooklyn Bridge), and in the small portion of Chinatown that extends south of Canal Street andwest of the Bowery. With the construction of Battery Park City in the 1980’s (adding more than4,000 apartments by 1990) and the conversion of former loft space in Tribeca, Lower Manhattanexperienced a near-doubling of its population between 1980 and 1990 (from 13,725 to 23,631).These trends, coupled with the recent initiative toward redevelopment of the Financial Districtfor residential use, contributed to recent increases in population in this zone and will continue todo so in the near future. Between 1980 and 1990, population in the Financial District increasedby 82.3 percent, and that in Tribeca by 26.4 percent, and these increases have continued since1990.
Reflecting the proximity of Lower Manhattan’s residential units to the Central Business District,this zone has a relatively high percentage (67.6 percent, compared with 61.2 percent for thestudy area as a whole) of adults of working age (ages 25-64). The median household income inthis zone ($49,554) is higher than the study area median ($42,473) and second only to the UpperEast Side zone; of all the neighborhoods in the MESA study area, Battery Park City has thehighest median income ($72,489), some 20 percent higher than the next highest neighborhood

Manhattan East Side Transit Alternatives MIS/DEIS
4-6
Table 4-4Community Facilities Near Project Alternatives
No. Community Facility Location
Lower Manhattan
1 Vietnam Veterans Plaza South Street, Broad Street, Old Slip
2 Hanover Square Park Hanover Square and Pearl Street
3 Engine 4—Ladder 15 42 South Street
4 Seaport Park Pearl, Fulton, Water Streets
5 Engine 6 49 Beekman Street
6 NY Downtown Hospital 170 William Street
7 Pace University 1 Pace Place
8 Printing House Square Park Row and Spruce Streets
9 City Hall Park Broadway, Park Row, Chambers Street
10 African Burial Ground/Hist. Dist. Park Row at Dover Street
11 Farmers' Market Chambers and Lafayette Streets
12 Murray Bergtraum High School 411 Pearl Street
13 Police Headquarters 1 Police Plaza
14 Foley Square Worth and Pearl Streets
15 Thomas Paine Park Lafayette and Worth Streets
16 Chinatown Health Clinic 125 Walker Street
17 5th Precinct 19 Elizabeth Street
Lower East Side
1 Sara Delano Roosevelt Park Chrystie Street
2 I.S. 131—Dr. Sun Yat Sen School 100 Hester Street
3 Fire Engine 9 Ladder Co. 6 75 Canal Street
4 Allen Street Center Plots Allen Street
5 Straus Square Canal, Rutgers and East Broadway
6 Educational Alliance 197 East Broadway
7 Seward Park Essex and East Broadway
8 Seward Park Library 192 East Broadway
9 Captain Jacob Joseph Playground Rutgers, Henry and East Broadway
10 Tifereth Israel School 141 East Broadway
11 Fire Engine 15 269 Henry Street
12 P.S. 134 Playground Montgomery, Henry and East Broadway
13 P.S. 134—Henrietta Szold School 293 East Broadway
14 Ahearn Park Grand and East Broadway
15 P.S. 110 Playground Delancey and Lewis Streets
16 P.S. 110—Florence Nightingale School 285 Delancey Street
17 Seward Park High School 350 Grand Street
18 CPC Health Care Delancey at Essex Street
19 7th Precinct 19 Pitt Street
20 Fire Engine 17 25 Pitt Street
21 Beth Jacob School 142 Broome Street
22 Schiff Pkwy Center Plots Delancey Street, Bowery to Essex Streets
23 Teatro Solidaridad Humana School Rivington at Suffolk Street
24 P.S. 142—Amalia Castro School 100 Attorney Street

Chapter 4: Social Conditions
4-7
Table 4-4 (Continued)Community Facilities Near Project Alternatives
No. Community Facility Location
25 Hamilton Fish Park Houston and Pitt Streets
26 Hamilton Fish Library 415 East Houston Street
27 I.S. 22/Leadership Secondary School 111 Columbia Street
28 Gustav Hartman Square Houston Street, Avenue C, 2nd Street
29 P.S. 97—Mangin School 525 East Houston Street
30 P.S. 188/P.S. 94 442 East Houston Street
31 Lillian Wald Houses Playground East Houston Street
32 P.S. 15—Roberto Clemente School 333 East 4th Street
33 Dry Dock Pool and Park (Riis Houses) 10th Street and Avenue D
34 P.S. 34—Franklin D. Roosevelt School 730 East 12th Street
35 Immaculate Conception School 419 East 13th Street
36 Fire Engine 5 344 East 14th Street
37 NY Eye/Ear Infirmary 310 East 14th Street
38 Fire Station, Ladder 3 108 East 13th Street
39 Yeshiva University 55 Fifth Avenue
40 Parsons School of Design 25 East 13th Street
41 New School 13th-14th Streets at Fifth Avenue
42 Union Square Park 14th-17th Streets; Broadway-Fifth Avenue
43 Manhattan Comp. Night High School 240 Second Avenue
44 Strang Cancer Clinic 1230 York Avenue
45 Leadership/Public Service High School 15th-16th Streets; First-Second Avenues
East Midtown
1 Union Square Park 14th-17th Streets; Broadway-Fifth Avenue
2 Manhattan Comp. Night High School 240 Second Avenue
3 Strang Cancer Clinic 1230 York Avenue
4 Leadership/Public Service High School 15th-16th Streets; First-Second Avenues
5 Jack and Jill School 209 East 16th Street
6 Stuyvesant Square 15th-17th Streets; Rutherford-Perelman Place
7 Beth Israel Medical Center 10 Perelman Place
8 Joint Diseases Hosp/NYU Nursing 301 East 17th Street
9 Cabrini Medical Center 227 East 19th Street
10 P.S. 40 Playground 19th-20th Streets; Second Avenue
11 P.S. 40 319 East 19th Street
12 Police Academy 235 East 20th Street
13 13th Precinct 237 East 20th Street
14 JHS 104 Playground 20th-21st Streets; Second Avenue
15 JHS 104 330 East 21st Street
16 Epiphany School 234 East 22nd Street
17 Epiphany Library East 23rd Street; Second-Third Avenue
18 School of Visual Arts 209 East 23rd Street
19 P.S./JHS 47, School for the Deaf 225 East 23rd Street
20 P.S. 138 400 First Avenue
21 Veterans Administration Hospital 408 First Avenue
Manhattan East Side Transit Alternatives MIS/DEIS
Table 4-4 (Continued)Community Facilities Near Project Alternatives
No. Community Facility Location
4-8
22 NYU School of Dentistry 421 First Avenue
23 Phipps Plaza Park 330 East 26th Street
24 Acorn School 330 East 26th Street
25 NYU School of Medicine 341 East 25th Street
26 Fire Engine 16 234 East 29th Street
27 Albano Playground 29th Street; Second Avenue
28 NYU Medical Clinic 445 First Avenue
29 Bellevue Hospital 446 First Avenue
30 NYU Hospital 560 First Avenue
31 P.S. 116 210 East 33rd Street
32 Child School 317 East 33rd Street
33 Sacred Heart School 307 East 33rd Street
34 St. Vartan's Park 35th-36th Streets, First-Second Avenues
35 Fire Engine 21 238 East 40th Street
36 Tudor Park 41-43rd Streets, First-Second Avenues
37 Ralph J. Bunche Park 42nd-43rd Streets, First Avenue
38 Dag Hammarskjold Plaza 47th Street, First-Second Avenues
39 Douglas MacArthur Plaza 48th-49th Streets, East River Drive
40 Peter Detmold Park 49th-53rd Streets; East River Drive
41 Beekman School 220 East 50th Street
42 Turtle Bay Music School 244 East 52nd Street
43 P.S. 59 Beekman Hill School 228 East 57th Street
44 Art & Design High School 1075 Second Avenue
45 Montessori 347 East 55th Street
46 Cathedral High School 350 East 56th Street
47 Robert Moses Playground 41st-42nd Streets, First Avenue
Upper East Side
1 Tramway Plaza 59th-60th Streets; Second Avenue
2 Fourteen Honey Locusts 59th-60th Streets; First-Second Avenues
3 Queensboro Oval Park 59th Street & York Avenue
4 New York Blood Center 316 East 66th Street
5 Manhattan Eye, Ear & Throat 210 East 64th Street
6/7 Talent Unlimited High School/Julia 317 East 67th StreetRichman Education Complex
8 67th Street Library 328 East 67th Street
9 St. Catherine's Park 67th-68th Streets; Second Avenue
10 Memorial Sloan-Kettering Cancer Center 1275 York Avenue
11 P.S. 183 419 East 66th Street
12 Lenox Hill Neighborhood Association 321 East 70th Street
13 Marymount Manhattan College 221 East 71st Street
14 Buckley School (partial) 209 East 73rd Street
15 The Cathedral School 319 East 74th Street
16 NYH Payne Whitney Clinic 76th Street; York and First Avenues

Chapter 4: Social Conditions
Table 4-4 (Continued)Community Facilities Near Project Alternatives
No. Community Facility Location
4-9
17 JHS 167 (Robert F. Wagner JHS/JHS 220 East 76th Street167 Playground)
18 Engine 44 221 East 76th Street
19 Birch Wathen Lenox School 210 East 77th Street
20 Yorkville Library 222 East 79th Street
21 Webster Library 1465 York Avenue
22 Caedmon School 416 East 80th Street
23 St. Stephen of Hungary School 408 East 82nd Street
24 P.S. 190 311 East 82nd Street
25 St. Joseph School 420 East 87th Street
26 High School of Teaching 421 East 88th Street
27 Our Lady of Good Counsel School 323 East 91st Street
28 Ruppert Park 90th-91st Streets; Second Avenue
29 James Cagney Place 91st Street; Second-Third Avenues
30 Ruppert Playground 92nd-93rd Streets; Second-Third Avenues
31 Young Adult Learning Academy 95th Street; First-Second Avenues
32 Stanley M. Isaacs Park 95th-96th Streets; First Avenue
33 P.S. 151 1763 First Avenue
East Harlem
1 High School for Coop. Ed. Tech. 96th-97th Streets; First Avenue
2 School for Coop. Ed. Playground 96th-97th Streets; Second Avenue
3 Metropolitan Hospital Center 97th-99th Streets; First-Second Avenues
4 Mosque School 96th Street, Second-Third Avenues
5 NYPD Housing Bureau 98th-99th Streets; Third Avenue
6 GW Houses Park/Yorkville Playground 99th-102nd Streets; Second-Third Avenues
7 Cherry Tree Park 99th Street and Third Avenue
8 P.S. 109/P.S. 811 215 East 99th Street
9 Metro North Memorial Field 100th-101st Streets; First-Second Avenues
10 East Harlem School at Exodus House 309 East 103rd Street
11 St. Lucy's School 340 East 104th Street
12 P.S. 38 at P.S. 121 232 East 103rd Street
13 Blake Hobbs Park 102nd-104th Streets; Second Avenue
14 Park East High School 105th Street; Second-Third Avenues
15 Poor Richard's Park 108th-109th Streets; Second-Third Avenues
16 JHS 117 Jefferson Park 240 109th Street; Second-Third Avenues
17 P.S. 83 Park 109th-110th Streets; Second-Third Avenues
18 P.S. 83 109th Street; Second-Third Avenues
19 Fire Engine 91 242 East 111th Street
20 St. Ann School 314 East 110th Street
21 Our Lady Queen of Angels School 232 East 113th Street
22 Jefferson Houses Park East 115th Street; Third and Lexington Avenues
23 P.S. 102 315 East 113th Street
24 P.S. 155 Park 319 East 117th Street

Manhattan East Side Transit Alternatives MIS/DEIS
Table 4-4 (Continued)Community Facilities Near Project Alternatives
No. Community Facility Location
4-10
25 P.S. 155 319 East 117th Street
26 Roberts Education Complex 120th-121st Streets; First-Second Avenues
27 Wagner Park 120th-121st Streets; First-Second Avenues
28 P.S. 96 Playground 119th-120th Streets; Second-Third Avenues
29 P.S. 96 216 East 120th Street
30 St. Paul School 114 East 118th Street
31 25th Precinct 120 East 119th Street
32 P.S. 7 160 East 120th Street
33 Harlem Art Park 120th-121st Streets; Third and LexingtonAvenues
34 ACRMD School 121st Street and Third Avenue
35 McNair Park 122-123rd Streets; Lexington Avenue
36 Engine 36 120 East 125th Street
37 Fire Engine 35 2282 Third Avenue
38 125th St. Library 224 East 125th Street
39 Kings Academy 2341 Third Avenue40 Park Third Avenue at Harlem River Drive
(Upper East Side/Medical Center, discussed below). Consistent with this high income level,Lower Manhattan had a lower percentage of population living below the poverty level. In termsof ethnicity, Lower Manhattan is relatively diverse, with 7.9 percent of its residents African-American and 30.6 percent Asian (most located in the small portion of Chinatown located in thiszone).
Lower Manhattan’s population includes 3.7 percent of the study area’s employed labor force.In 1990, 40.5 percent of all journey-to-work trips originating in the zone were walk trips, and34.4 percent were subway trips, reflecting the increasing appeal of this zone for a more diversemix of residents, not only those working in the immediate area.
COMMUNITY FACILITIES AND OPEN SPACES
With a limited (although growing) residential population, Lower Manhattan has relatively fewcommunity facilities compared with the other study area zones (see Table 4-4 and Figure 4-1).As the area’s population continues to grow, community facilities will be added as well. Most ofthe community facilities in Lower Manhattan are located in and near Battery Park City and inthe Tribeca/Civic Center neighborhood (including in the southernmost portion of Chinatown).These include the College of Insurance near Battery Park City as well as the extensive openspaces and Stuyvesant High School within Battery Park City. In Tribeca/Civic Center near CityHall, the New York Downtown Hospital and Pace University both serve more regional com-munity needs.
Along the project corridor (which, in Lower Manhattan, is the route of the Light Rail Transitcomponent of Build Alternative 2), community facilities and open spaces include Peter Minuit
Chapter 4: Social Conditions
4-11
Plaza at State and Whitehall Streets, the Vietnam Veterans’ Plaza on the east side of WaterStreet at Coenties Slip, and Pace University, at Frankfort Street and Park Row.
NEIGHBORHOOD CHARACTER
Most of Lower Manhattan is characterized by the density of its development. Tall buildings frontonto narrow streets, turning the streets into canyons. The streets in this zone follow an irregularpattern dating to the city’s original settlement. Although it is gradually becoming more residential,most of Lower Manhattan appears as a commercial district. Streets in the Financial District andCivic Center are crowded during the day, particularly at lunchtime, but very quiet at night and onweekends. Battery Park City, as a recently created mixed-use neighborhood, is entirely differentfrom the rest of the zone. It is characterized by new buildings set within and beside landscapedopen spaces and parks, and a continuous waterfront park. With a mix of residential and officeusers, this neighborhood is busy both during the day and at night and on weekends. At thenorthern end of the Lower Manhattan zone, Tribeca is different from the other neighborhoodsin the zone as well. Buildings there are predominantly mid-rise warehouse buildings dating to the19th century, many of which are architecturally distinguished. Although this neighborhoodcontains many residences in the former industrial buildings, it is relatively quiet both during theday and at night.
LOWER EAST SIDE
POPULATION AND HOUSING
The Lower East Side zone houses almost 30 percent of the study area’s population, with a 1990population of more than 186,000 people. More of these residents (57 percent) live in the LowerEast Side/Chinatown neighborhood south of Houston Street than in the East Village to the north.Most live in the easternmost portion of the zone, where a number of large public housingcomplexes are located—more than ¼ of the zone’s apartments and more than a of its residentslive east of Avenue D or south of East Broadway. Farther west, particularly in the East Village,many residents are students or young professionals and, consequently, households tend to besmaller in size than in the eastern part of the zone.
The East Village neighborhood in particular saw a marked change in population trends over thelast two decades. After losing 20 percent of its population in the 1970’s, it regained 3 percent inthe 1980’s as rehabilitation of abandoned buildings and redevelopment of vacant lots began.Areas in the southern and eastern part of this neighborhood continued to lose population in the1980’s, however, while newly popular areas along 14th Street and Broadway gained substantialpopulations. Gradual redevelopment of the East Village is expected to continue over the nextdecades.
Reflecting the large number of families in the Lower East Side, this zone has a large proportionof residents younger than 25 years old (31 percent, compared with 25 percent for the study areaas a whole). Consistent with the presence of large areas of public housing on Lower East Side,the median annual household income in this zone ($23,616) was substantially lower than for thestudy area as a whole ($42,473) and lower than all other zones except East Harlem. The LowerEast Side/Chinatown neighborhood’s median income, at $17,780, is the third lowest of all

Manhattan East Side Transit Alternatives MIS/DEIS
4-12
neighborhoods in the study area. Approximately 27.3 percent of the zone’s residents live belowthe poverty level, again second only to East Harlem in the study area.
In terms of race and ethnicity, the Lower East Side zone has a large proportion of minority resi-dents. These residents are concentrated in particular in the Lower East Side/Chinatown neigh-borhood, where 69 percent of the population is not Caucasian. Some 44 percent of the residentshere are Asian, 10 percent are African-American, and 30 percent are Hispanic (an ethnic groupthat can include all racial categories, including both African-American and Caucasian residents).
Population on the Lower East Side included almost 24 percent of the study area’s employedlabor force in 1990. These workers commuted to their jobs largely by subway (36.2 percent) andwalking (32.3 percent), with smaller proportions using buses (12.4 percent) and autos and taxis(12.9 percent).
COMMUNITY FACILITIES AND OPEN SPACES
Of the five study area zones, the Lower East Side has the highest concentration of communityfacilities (see Table 4-4 and Figure 4-2). These include a large number of public and privateschools, as well as several post-secondary institutions (including Cooper Union and part of NewYork University). The area is also well served by public health and safety services includingseveral police and fire department stations and the New York Eye and Ear Infirmary on 14thStreet. The diverse ethnic makeup of this area is reflected in a variety of houses of worship. Thearea also includes several public open spaces in addition to the landscaped yards of its publichousing projects. These include the more than 40-acre East River Park, forming the easternboundary of much of the study area; the 10.5-acre Tompkins Square Park, between East 7thand 10th Streets and Avenues A and B; and the 7.8-acre Sara Delano Roosevelt Park, betweenChrystie and Forsyth Streets from Canal Street to Houston Street.
The route of the Light Rail Transit portion of Build Alternative 2 (described in Chapter 2 of thisdocument) passes numerous community facilities along Canal Street and East Broadway, andothers along Avenue D and 14th Street. Along Canal Street, the route passes the southern endof Sara Delano Roosevelt Park and I.S. 131 on the north side of the street between Chrystie andEldridge Streets, the Fire Department of New York’s Engine 9, Ladder 6 between Eldridge andAllen Streets, and the treed center plots on Allen Street. On East Broadway, communityfacilities include Seward Park (at the intersection of East Broadway and Canal Street), andseveral smaller parks, including Straus Square, in the triangle formed by the intersection of EastBroadway and Canal Street, and Ahearn Park, a triangle formed by the intersection of EastBroadway and Grand Street. A public library branch at Seward Park, P.S. 134 (the HenriettaSzold School) and its playground, and several other community facilities are also located on ornear East Broadway. Along Avenue D, the route passes several other schools (including a highschool at Masaryk Towers, I.S. 22 located adjacent to the Hamilton Fish branch of the NewYork Public Library at Avenue D and Houston Street, and P.S. 34 at East 12th Street), and theparks and playgrounds associated with the public housing along the route. Along 14th Street, theproject corridor passes an elementary school, the New York Eye and Ear Infirmary, and the FireDepartment’s Engine 5, all on the south side of 14th Street (community facilities on the northside of 14th Street are in the East Midtown zone).

Chapter 4: Social Conditions
4-13
The route to the proposed light rail yard also passes several community facilities. These includethe Beth Jacob Elementary School at Delancey Street and Broome Street, a nearby police andfire station on Delancey Street just west of Pitt Street, and the Seward Park High School, acrossEssex Street from the site.
NEIGHBORHOOD CHARACTER
The character of the Lower East Side was defined historically by its immigrant population, thetenements they lived in, and the enormous energy and activity that they created. Today, someof the population has changed, public housing has replaced many of the older buildings, but thatsense of the Lower East Side has prevailed. There are enough of the older structures to retainthis character, the shopping streets (Canal Street, Delancey Street, the Bowery, Orchard, Essex,etc.) are still lively and crowded, and strong ethnic communities are immediately apparent(Chinatown, Little Italy, the Hispanic communities of “Alphabet City”).
The redevelopment over the years is also a part of the character of the Lower East Side. Theseinclude the nation’s first public housing project (First Houses), the public and subsidized housingall along the East River and Avenue D, and middle-income projects near Grand Street. North ofHouston Street between Broadway and the Bowery, the mixed-use Noho district has emergedin the loft buildings that have stood there since the 19th century. These have been reused fortheaters, offices, stores, artist’s lofts, and residences, and for the dormitories, classrooms, andadministration of New York University. Along the Bowery/Third Avenue, this transformationhas also included new construction and the change has affected the area to the east as well,bringing shops, restaurants, clubs, and a mix of residents.
Most of the avenues and major crosstown streets in this zone are busy, lined with stores andother uses that bring pedestrians to the sidewalks and with heavy traffic along most of the ave-nue. Many other areas of this zone are relatively quiet, however, with less traffic or pedestrianactivity. Avenue D, for example, has low traffic volumes and little pedestrian activity at manytimes of the day.
EAST MIDTOWN
POPULATION AND HOUSING
East Midtown is a large area and, although it is most known as a business center, it contains asizable proportion of study area population (22.4 percent). More than half of its 150,140 residentslive south of 34th Street in the Lower Fifth and Midtown South/Medical Center neighborhoods(see Figure 3-1 for neighborhood boundaries). The Midtown South/Medical Center neighborhoodhas shown the greater proportional growth (14.2 percent) between 1980 and 1990; Lower Fifthremained stable during that period. The three remaining neighborhoods show relatively lowpopulation (ranging from 13,845 to 26,148), but with differing growth trends. Grand Central/UN,which saw considerable residential development in the 1980's, posted a population increase of23.2 percent from 1980 to 1990; Murray Hill grew at a more stately pace (4.2 percent), whilethe East Midtown neighborhood actually lost population (-5.7 percent). Household size for thezone, at 1.56 persons per household, reflects the area’s proximity to the central business districtand the predominance of single-person households.

Manhattan East Side Transit Alternatives MIS/DEIS
4-14
The population of the East Midtown zone is generally older than the other zones in the studyarea, with 15.7 percent age 65 and older. Of the five neighborhoods in the zone, only MidtownSouth/Medical Center contains less than the study area and Manhattan averages for persons age65 and older. Residents of this zone are predominantly White (85.8 percent), with small propor-tions of African-American, Asian, and Hispanic populations. Midtown South/Medical Centercontains the largest proportion of minorities, with 8.6 percent African-American, 7.3 percentAsian, and 10.5 percent Hispanic. Grand Central/UN neighborhood is notable within this zonefor its proportion of Asian residents (10.7 percent).
Median income for the zone ($47,926) is about average for the study area. Among neighbor-hoods, median income generally increases as one goes north. The exception is Midtown South/Medical Center, which contains public and subsidized housing developments. Here, income isbelow the average for the study area (but above the norm for Manhattan) and 14.2 percent ofthe population is classified as below the poverty level.
The East Midtown zone has about 100,000 workers in the resident labor force and a relativelylow unemployment rate (95.4 percent are employed). Their journey-to-work is characterized bya high walk-to-work component (not surprising, since they live so close to the central businessdistrict), which is almost equal to use of mass transit (38 and 39.4 percent, respectively). Autoand taxi use is 15.6 percent, with the breakdown among neighborhoods generally tracking in-come (see Tables 4-2 and 4-3, above).
COMMUNITY FACILITIES AND OPEN SPACES
The East Midtown zone has a dense concentration of community facilities near StuyvesantTown and Peter Cooper Village, with other resources throughout the zone as well (see Figure4-3 and Table 4-4). South of 25th Street is the Beth Israel Medical Center as well as numerousschools and religious institutions. Also in the southern part of the zone are Union Square Parkand Stuyvesant Square. Other major community facilities in the southern portion of East Mid-town include a complex of hospitals and medical schools along First Avenue and associatedmedical-related facilities. These include the Veterans Administration Medical Center, BellevueMedical Center, and New York University Medical Center, on the east side of First Avenue,with associated teaching facilities on the west side of the avenue. Cabrini Medical Center islocated to the east, between Second and Third Avenues. The zone also includes numerous ele-mentary, intermediate, and high schools, police and fire stations, smaller open spaces and play-grounds, as well as schools granting post-secondary degrees (such as the City University ofNew York’s Baruch College, and the School of Visual Arts.
The project corridor for the TSM Alternative—along Second and First Avenues—passes manyof the zone’s community facilities. This includes the medical complexes in the southern part ofthe zone along First Avenue, several schools, religious institutions, and parks—StuyvesantSquare, P.S. 40 Playground, JHS 104 playground and recreational area, Vincent Albano Jr.Park, St. Vartan Park, Robert Moses Playground, and Sharansky Freedom Plaza/HammarskjoldPlaza.
The project corridor for the Light Rail Transit component of Build Alternative 2 along 14thStreet passes three community facilities located on the north side of 14th Street. These are amedical center, Manhattan Comprehensive Night High School, and Union Square Park.

Chapter 4: Social Conditions
4-15
NEIGHBORHOOD CHARACTER
Below 34th Street in East Midtown, the character of First and Second Avenues is largely domi-nated by the hospitals that line the east side of First Avenue and several extensive residentialprojects: Stuyvesant Town, Peter Cooper Village, Kips Bay Houses, and Phipps Houses. Allhave created superblocks, which disrupt the normal street grid. The residential projects are builtwith towers arrayed among open spaces. These areas present a character different from theneighborhoods to the west, which contain tall buildings on the avenues and brownstones in themidblocks, leading to the Park Avenue South/Lower Fifth Avenue business district. Here, loftbuildings and both older and more newly constructed office buildings determine the area’s char-acter. The shopping district around Union Square has been rejuvenated and it now extends northup Broadway, across 14th Street, and up Park Avenue South. There are not many parks in thisportion of the East Midtown zone, and those that are here are important spaces, helping to defineneighborhoods such as Union Square Park and Stuyvesant Square.
North of 34th Street in East Midtown, development and traffic begins to intensify as it ap-proaches “midtown” proper. On First, Second, and Third Avenues, tenements and factories ofthe old Gasworks neighborhood have been mostly replaced by new market-rate high rises.These have helped to extend the Murray Hill residential neighborhood, centered on lower ParkAvenue, eastward. By 42nd Street, however, the character of Third Avenue and the avenuesto the west are entirely commercial in character. To the east, the neighborhoods retain a moreresidential character.
The complex of Grand Central Station, the Met Life tower, and the Helmsley building define thesouthern boundary of the core of East Midtown’s commercial district. The buildings straddlePark Avenue, forcing traffic onto an overpass around and through until it emerges again at abroad boulevard, with a carefully tended landscaped median, lined with office towers for abouta mile and a half. The strong central business district extends eastward to Third Avenue andwest to Fifth Avenue in the study area. East of Third Avenue, Second Avenue creates a transi-tion from commercial to residential uses, and the neighborhoods farther east are solidly resi-dential. The complex of the United Nations, east of First Avenue between 42nd and 48thStreets, is a strong feature of the Grand Central/UN neighborhood and, like Grand Central,marks its southern boundary. To the north, the East Midtown zone’s northern boundary isdefined east of Second Avenue by the Queensboro Bridge and, to the west, by a distinct changein land use and building type marking the beginning of the Upper East Side.
UPPER EAST SIDE
POPULATION AND HOUSING
The Upper East Side zone, with more than 200,000 residents, contains about 30 percent of thestudy area’s population. Even though it is a well-established neighborhood, it saw a small popula-tion growth (2.7 percent) from 1980 to 1990. The two neighborhoods within the zone are similarin racial and ethnic characteristics (more than 90 percent White) and high median annual house-hold income (approximately $60,000). However, the Upper East Side/Medical Center neigh-borhood is older: 18.1 percent of its population is 65 years and older. Also, its “maturity” as adeveloped neighborhood is reflected in its virtually stable population (a 1.7 percent loss from1980 to 1990). In contrast, Carnegie Hill/Yorkville is younger, with only 13.2 percent of its
Manhattan East Side Transit Alternatives MIS/DEIS
4-16
population at age 65 or older, and it experienced a 6.4 percent increase in population from 1980to 1990. Also, its median household size of 1.75 is higher than that of Upper East Side/MedicalCenter (1.61 persons per household), indicating a greater proportion of families and/or singlessharing apartments.
The zone’s 137,483-person residential labor force showed a very low unemployment rate in1990. Most travel to work using public transportation (48.8 percent), and nearly 22 percent walkto work. The proportion of residents using auto or taxi to get to work is high, 21.7 percent, andparticularly high in the Upper East Side/Medical Center neighborhood.
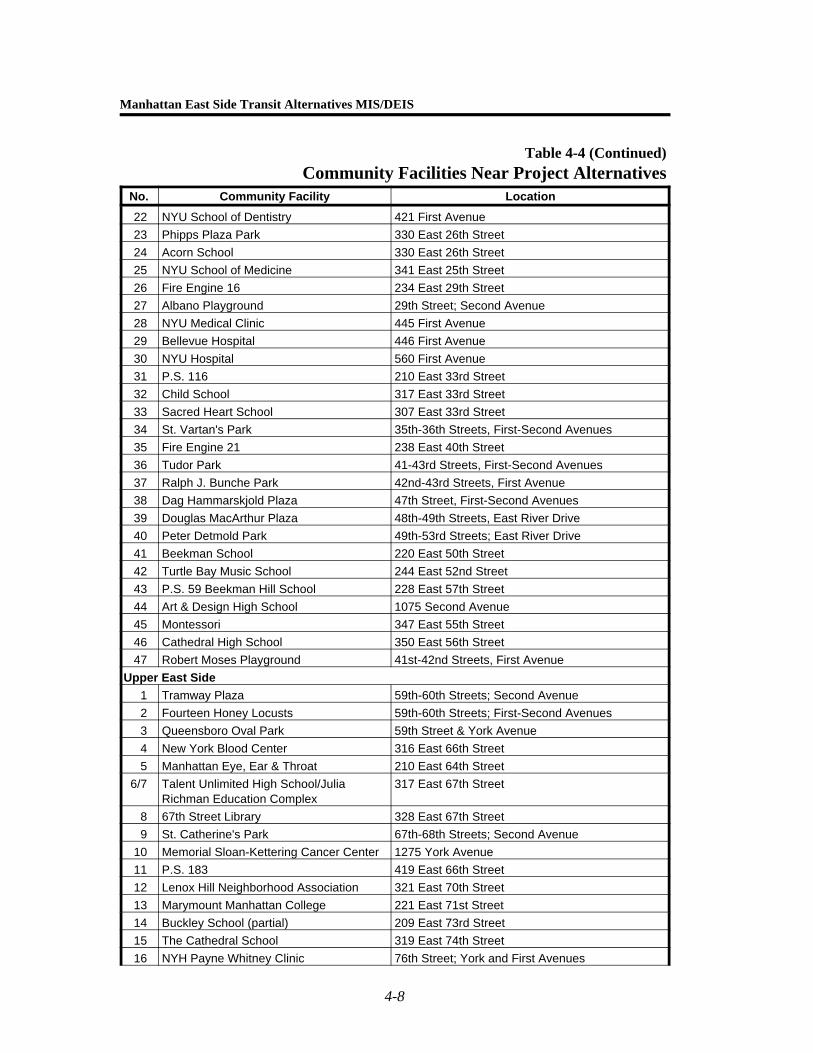
COMMUNITY FACILITIES AND OPEN SPACES
Like the other residential areas in Manhattan, the Upper East Side has numerous community fa-cilities to serve its residents (see Figure 4-5 and Table 4-4 at the end of this chapter). Theseconsist largely of public and private schools, houses of worship, and small parks and plazas. TheUpper East Side has one of the densest concentrations of private schools in the city. In addition,a group of medical facilities and related institutions is located in the southeast portion of the zone,mostly east of First Avenue. This area includes The Rockefeller University (a post-secondaryinstitution), New York Hospital-Cornell Medical Center, Memorial Sloan-Kettering CancerCenter, and the Hospital for Special Surgery. Lenox Hill Hospital is at 77th Street and LexingtonAvenue, and Beth Israel Medical Center is farther north (at 87th Street and First Avenue).Other major post-secondary institutions include Hunter College and the Hunter College Schoolof Social Work, at 68th and 79th Streets, respectively. Larger parks in this zone include the14.94-acre Carl Schurz Park along East End Avenue between 84th and 90th Streets, and thesmaller John Jay Park (along the FDR Drive between 76th and 78th Streets) and St. Catherine’sPark (along First Avenue between 67th and 68th Streets). Other recreational facilities are lo-cated at Murphy Center and Asphalt Green (at York Avenue and 90th Street).
In this zone, the project corridor for the northern subway included as part of Build Alternatives1 and 2 passes several parks and playgrounds, including Ruppert Park and the JHS 167Playground. One school is also located along Second Avenue—the Julia Richman High Schoolcomplex between 67th and 68th Streets. Also along Second Avenue is Memorial Sloan-Kettering Cancer Center, between 65th and 66th Streets. At the northern end of this zone, theYoung Adult Learning Academy is across 96th Street from the proposed subway constructionstaging site.
In addition to the community resources listed above, the project corridor for the TSM Alternativepasses several community facilities along First Avenue in this zone. These include P.S. 151 at91st Street and P.S. 190 at East 82nd Street. The project corridor also passes Memorial Sloan-Kettering Cancer Center. As mentioned above, St. Catherine’s Park, a 1.4-acre park locatedbetween 67th and 68th Streets, is located along the corridor route.
NEIGHBORHOOD CHARACTER
Virtually the entire Upper East Side zone is a prosperous residential neighborhood, reflected inits well-kept apartment buildings and brownstones and its strong shopping areas. In character,there is a difference between the older areas west of Third Avenue and those to the east. Es-tablished in the first decades of this century, the neighborhoods along Fifth, Madison, Park, andLexington Avenues contain luxury pre-War apartment buildings on the avenues and brownstones

Chapter 4: Social Conditions
4-17
and rowhouses along the side streets. Madison Avenue, particularly south of 79th Street, is ahigh-end shopping street with boutiques, antiques stores, and art galleries. Lexington Avenueprovides more of the neighborhood’s shopping needs. The physical distinction between this areaand the neighborhood to the east is due to the Second and Third Avenue els. Before these weredemolished, they formed a boundary, separating the middle and upper-middle class East Sidefrom the working class neighborhood to the east. Starting in the 1950's, after the Third Avenueel was removed, many of the tenements and small apartment houses that had lined the avenueswere demolished or refurbished and large new apartment towers were constructed. These tooka different form from those that had been built before the war, in that they generally had lowerstreet walls with tall towers set back and rising above. This development trend has continued tothis day. Once the residential districts were redeveloped, developers moved into the industrialdistricts along the East River and began a transformation of York Avenue as well. Today, thearea to the east of Third Avenue is, like its neighbor to the west, a prosperous residentialcommunity, with strong retail at street level.
Within this overall context, there are certain distinct locations: the area around the medical com-plex (62nd Street to 70th Street east of Second Avenue) is influenced physically and socioecono-mically by the hospitals and The Rockefeller University. To a lesser degree, this is also true inthe vicinity of Lenox Hill Hospital (77th Street and Lexington Avenue). Near the neighborhood’sparks—Central Park, Carl Schurz Park, and Asphalt Green—neighborhood character isinfluenced by the presence of the open space and vegetation in those parks. And, toward 96thStreet in the Carnegie Hill neighborhood, more of the East Side’s original tenements remain,along with several housing projects containing subsidized and public housing.
EAST HARLEM
POPULATION AND HOUSING
East Harlem is one of Manhattan’s lower-income, minority communities, and the characteristicsof its population (which represents about 16 percent of the MESA study area) stand in strongcontrast to the rest of the study area. The 108,468 residents of this zone are nearly 80 percentminority. In Southern East Harlem, 57 percent of the residents are Hispanic (an ethnic, ratherthan racial composition, that can include both White and African-American) and 49 percent areAfrican-American. In Northern East Harlem, these proportions are nearly reversed, with 46percent Hispanic and 59 percent African-American. Household size (2.64 persons per house-hold) is substantially higher than all but the Lower East Side/Chinatown neighborhood, indicatinga greater orientation toward families. This is consistent with the relatively low proportion ofelderly residents (11.6 percent), indicating a younger population. Incomes are low: median annualhousehold income is less than half of that for Manhattan and only 36 percent of the study areaaverage.
Total labor force in 1990 was 39,600, or about 36 percent of the zone’s residential population.This proportion is low: in the other study area zones, the number of residents in the labor forceranges from 60 to 70 percent of the population. In addition, unemployment is higher. Only 84.3percent of the labor force had a job in 1990, an unemployment rate of more than 15 percent. Ofthe employed workers, 66 percent use public transportation, the highest proportion of study areazones, about 15 percent go to work in cars or taxis, and approximately 16 percent walk to work.

Manhattan East Side Transit Alternatives MIS/DEIS
4-18
COMMUNITY FACILITIES AND OPEN SPACES
Community facilities in East Harlem, as with the other primarily residential neighborhoods inManhattan, are dominated by schools and houses of worship, with several medical institutions lo-cated at the southern end of the study area (see Table 4-4 and Figure 4-5). Hospitals in the EastHarlem zone include Metropolitan Hospital Center between Second and First Avenues between97th and 99th Streets, Mount Sinai Hospital (on Fifth Avenue), and North General Hospital (onMadison Avenue). There are five fire houses, three police precincts, and two public librarybranches in the zone. There are currently more than 45 schools in the East Harlem zone. Thetwo largest parks in the area are Marcus Garvey Park, a 20.17-acre park located on MadisonAvenue between East 120th and 124th Streets, and Thomas Jefferson Park, located on FirstAvenue and FDR Drive, between East 111th and 114th Streets.
Along the route of the proposed subway is the Manhattan Vocational/Technical High Schoolplayground and park, Metropolitan Hospital Center, and several parks and schools affiliated withthe numerous public housing developments in the area, including, from north to south, Metro-North Community Gardens, JHS playground at Wagner Houses, Blake Hobbs (WashingtonHouses), and Robert F. Wagner Park. Schools along the project corridor include the High Schoolfor Cooperative Technical Education at 96th Street, P.S. 99 at 99th Street, P.S. 121 at 103rdStreet, and J.H.S. 117 at 109th Street.
NEIGHBORHOOD CHARACTER
East Harlem, like the Upper East Side to its south, is a residential neighborhood. However, it isless dense than the other study area zones, and its character, particularly along First and SecondAvenues, is dominated by a large number of housing projects. These are generally slab construc-tion set on superblocks and oriented diagonally to the basic neighborhood street grid. The super-blocks interrupt the street grid, blocking off east-west streets. Along Second Avenue, for exam-ple, between 96th and 125th Streets, the projects cut off 10 east-west streets, more than a thirdof the total number of side streets. Along those streets that have not been redeveloped, tene-ments, row houses, and small apartment buildings can be found. Over the years, the whole zonewas subject to housing abandonment and demolition, so that today many blocks in the area arevacant. This condition is more prevalent in northern East Harlem, but it can be found in southernEast Harlem as well. Major cross streets and avenues have ground-floor retail uses, althoughthis is discontinuous where some of the housing projects are designed without storefronts orwhere lots are vacant.
The Metro-North railroad tracks, which emerge from the ground onto an elevated structurenorth of 96th Street, create a barrier between the neighborhoods to the east of Park Avenue andthose to the west. South of 106th Street, the area west of Park Avenue is dominated by MountSinai Hospital and its facilities and several museums along Central Park. The park itself ends at110th Street, and the neighborhood contains only two other major parks: Marcus Garvey andJefferson Parks.
C. FUTURE CONDITIONS COMMON TO ALL ALTERNATIVES
As part of the development of its Regional Transportation Plan, the New York MetropolitanTransportation Council (NYMTC) has developed a forecast for the 31 counties in the New

Chapter 4: Social Conditions
4-19
York metropolitan region of the expected growth in population, employment, and labor forcebetween 1995 and 2020 (the Regional Transportation Plan is discussed in more detail in Chapter1, “Project Purpose and Need”). The forecast indicates that population in New York City willgrow by nearly 3 percent, adding some 65,000 new residents. For the MESA study, NYMTC’scountywide projections were used as the basis for more detailed projections for the differentneighborhoods in the MESA study area.
As described in Chapter 3, “Land Use, Zoning, and Public Policy,” as part of the MESA study,a detailed projection of future land use conditions in Manhattan was undertaken as a means ofprojecting the future population, employment, and labor force in 2020. As described in Chapter 3,residential development is expected in all of the study area zones, with the greatest number ofunits in Lower Manhattan. Each of the zones in the MESA study area will see a correspondingincrease in population. A total of more than 17,000 new dwelling units are predicted, with apopulation increase of more than 33,000. With these changes in population together with demo-graphic shifts (such as an increase in the proportion of working-age residents, increases in thenumber of workers in households, and the results of welfare reform), the study area’s laborforce is expected to see a greater increase, of almost 39,000 people. No major changes in com-munity facilities are expected, although additional community facilities may be developed to ac-company residential growth. In most parts of the study area, neighborhood character will remainsimilar to the existing conditions. In the less densely settled portions of the Lower East Side andEast Harlem, the increase in residential development is likely to bring activity. These changesare summarized below.
LOWER MANHATTAN
As a result of recent public policy initiatives, Lower Manhattan is expected to continue its recenttrend of strong growth, adding some 8,200 residential units, and 15,700 residents. Approximately48 percent of the residential growth predicted for the MESA study area is expected in LowerManhattan. Much of the new residential space (approximately 6,700 apartments) will be addedin Battery Park City, where development of that growing community is expected to continue.Other residential space (some 2,700 units) will be added in the Financial District, both in the formof new apartment buildings and conversion of former office buildings as part of the recentinitiatives. Accompanying the growth in residents will be a corresponding, but smaller, increasein the zone’s labor force, adding 10,500 workers.
LOWER EAST SIDE
Residential growth is also expected on the Lower East Side, although at a slower pace. The7,500 new apartments predicted represent a growth rate of approximately 3 percent for thiszone, and constitute 15 percent of the residential growth expected in the MESA study area.Most of this development (some 2,240 units) is expected in the East Village portion of the zone,with more than half (1,230 units) focused along the south side of 14th Street between UnionSquare and Third Avenue. Together, these changes will bring an estimated 5,300 new residentsto this zone of the study area. The zone’s labor force is predicted to increase by nearly 7,500people.

Manhattan East Side Transit Alternatives MIS/DEIS
4-20
EAST MIDTOWN
East Midtown will see the smallest amount of residential growth of any of the study area zones,with the almost 2,000 apartments predicted representing 11 percent of the study area’s growth(and equivalent to a 1.9 percent growth rate for the zone). Most of the new residential develop-ment will be in the Midtown South/Medical Center neighborhood. Altogether, approximately3,000 new residents are predicted in East Midtown. The zone’s labor force is expected to growat a faster pace, with an increase of 7,100 predicted.
UPPER EAST SIDE
The strong trend of continued residential development on the Upper East Side is expected tocontinue over the next 20 years, but at a slower pace than the 1980’s. A total of nearly 2,400new apartments are expected to be constructed (14 percent of the study area total), providinghousing for nearly 4,000 new residents. Increases in labor force will be larger, with some 9,200people added to the area’s labor force pool.
EAST HARLEM
In East Harlem, the recently initiated trend toward residential development is expected to con-tinue at the same pace as predicted for the Upper East Side, producing a total of 2,049 new unitsadded throughout the zone. This will bring an estimated 5,400 new residents to East Harlem.Labor force is predicted to increase by some 3,800 people. These units will be in the form oflow-rise, infill development, rather than the large-scale projects that once typified publicly subsi-dized housing here. A large proportion of the new housing will stress owner occupancy of thebuildings.
D. PROBABLE IMPACTS OF THE PROJECT ALTERNATIVES
The following discussion considers the potential impacts on social conditions that may result fromoperation of the project alternatives. Impacts during construction are documented separately inChapter 15, “Construction and Construction Impacts.”
The project alternatives have the potential to affect social conditions in a neighborhood if theychange population trends, affect the community facilities supporting that population, and/orchange the overall character of the neighborhood. The resident population can be affected bychanges in land use composition or patterns, displacement of residents or of important businessesand services, change in neighborhood character, or deterioration of transportation service. Socialconditions can also be affected through changes in access to or availability of communityfacilities. As described in Chapters 3 and 5, no major changes in land use composition orpatterns are predicted for any of the project alternatives, nor would there be any displacementof key businesses serving the residential population. No displacement of residential populationwould be required for any of the alternatives. Other possible effects on social conditions are de-scribed below.
This project would be consistent with Executive Order 12898, “Federal Actions to Address Envi-ronmental Justice in Minority Populations and Low-Income Populations.” This Executive Orderis designed to ensure that “each Federal agency shall make achieving environmental justice partof its mission by identifying and addressing, as appropriate, disproportionately high and adverse

Chapter 4: Social Conditions
4-21
human health or environmental effects of its programs, policies, and activities on minoritypopulations and low-income populations.” A detailed analysis of the project’s effects in terms ofenvironmental justice is provided in Chapter 16, “Equity and Environmental Justice.”
NO BUILD ALTERNATIVE
The No Build Alternative would not introduce new transportation service to the MESA studyarea. Transportation service would instead worsen by 2020.
TSM ALTERNATIVE
The New York bus lanes would improve public transportation service to and from the areabetween Houston and 96th Streets. Although the benefit would affect most strongly those wholive and work within that area, the overall increase in travel speeds and decrease in travel timeswould also benefit residents of Lower Manhattan, the Lower East Side/Chinatown, and EastHarlem who are traveling to, from, or through the First and Second Avenue corridors betweenHouston and 96th Streets. The lanes would change the look of First and Second Avenues, butnot enough to alter neighborhood character. The introduction of bus traffic on Avenue C wouldincrease nighttime noise levels, but would not materially change neighborhood character on thestreet.
BUILD ALTERNATIVE 1
The new East Side subway extension’s impacts on social conditions would be almost entirelybeneficial. Build Alternative 1 would provide greatly improved transit service to residents andworkers on the Upper East Side and East Harlem. Residents and workers in the area served bythe new service (secondary area, East Midtown, Lower East Side, and Lower Manhattan)would also see transit service improvements.
In addition, if the addition of new subway stations in East Harlem (particularly at 96th Street and106th Street) would make the nearby underutilized sites more attractive for residential develop-ment and ground-floor retail (see Chapter 5, “Economic Conditions,” for further discussions), itis possible that such new development, if it occurred, would benefit neighborhood character inthe area by providing more retail services and new housing and by removing unsafe andunsightly vacant and underutilized lots.
BUILD ALTERNATIVE 2
Because it would include the same subway as Build Alternative 1, this alternative would havethe same effects as Built Alternative 1 related to operation of the subway, described above.Additional effects related to the light rail transit component of this alternative are discussedbelow.
The LRT would provide improved transit access to residents and workers on the Lower EastSide and in Lower Manhattan. The impacts of the LRT on social conditions would be almostentirely beneficial. Build Alternative 2 would provide the same great improvements to transitservice for residents and workers on the Upper East Side and East Harlem as Build Alternative1, and would add the benefit of providing service to the many residents (and workers) who livein the easternmost portion of the Lower East Side, where no rapid transit is currently available.

Manhattan East Side Transit Alternatives MIS/DEIS
4-22
As described in Chapter 2, “Project Alternatives,” the LRT stops to be located near StrausSquare, Seward Park, and Union Square Park would not include shelters or structures andtherefore would not interfere with those parks.
Overall, the addition of the new LRT service to the Lower East Side would not have significantadverse effects on the neighborhood character of that zone. The new tracks in existing streetsand the presence of overhead wires along the route would change the appearance of the area,but this change would not be considered significant given the developed and urban context of theproject corridor. Along Avenue D, the addition of new rapid transit service and the local retailuses that might be attracted would enliven an area that is currently often quiet.
E. MITIGATION
As described above, no significant adverse impacts on social conditions were identified for anyof the project alternatives, and therefore no mitigation is required. As mentioned above, the LRTcomponent of Build Alternative 2 would not include shelters or structures near Straus Square,Seward Park, or Union Square Park, to avoid any impacts to those parks. Potential effectsduring construction and measures to mitigate any construction-related impacts are discussed inChapter 15, “Construction and Construction Impacts.” v