chemical contaminants 2012-2013 - dtu
TRANSCRIPT

Chemical contaminants2012-2013
1
Chemical contaminants Food monitoring 2012-2013
This report is prepared by:
Annette Petersen Arvid Fromberg
Jens Hinge Andersen Jens J. Sloth Kit Granby
Lene Duedahl-Olesen Peter Have Rasmussen Tommy Licht Cederberg
National Food Institute
Division of Analytical Food Chemistry
2
Chemical contaminants
Food monitoring 2012-2013
1. edition, October 2015
Copyright: National Food Institute, Technical University of Denmark
Photo: colourbox.com
ISBN: 978-87-93109-61-2
This report is available at
www.food.dtu.dk
National Food Institute
Technical University of Denmark
Mørkhøj Bygade 19
DK-2860 Søborg
Tel: +45 35 88 70 00
Fax: +45 35 88 70 01
3
Table of content 1 Forord 6
2 Preface 7
3 Trace elements 8
3.1 Introduction 8 3.2 Methods of sampling, analysis and quality assurance 8
3.2.1 Sampling 8 3.2.2 Chemical analyses and quality assurance 8
3.3 Mercury 9 3.3.1 Introduction 9 3.3.2 Results and discussion 9
3.4 Lead 9 3.4.1 Introduction 9 3.4.2 Results and discussion 9
3.5 Cadmium 10 3.5.1 Introduction 10 3.5.2 Results and discussion 10
3.6 Arsenic 10 3.6.1 Introduction 10 3.6.2 Results and discussion for inorganic arsenic 10 3.6.3 Results and discussion for total arsenic 10
3.7 Aluminum Aluminium, copper, selenium, zinc and tin 11
4 Nitrate in vegetables 12
4.1 Introduction 12 4.2 Methods of sampling, analysis and quality assurance 12 4.3 Results and discussion 12
5 Mycotoxins 14
5.1 Introduction 14 5.2 Methods of sampling and analytical methods 14 5.3 Results and discussion of mycotoxins 14
5.3.1 Trichothecenes (Deoxynivalenol, HT-2 toxin and T-2 toxin) 14 5.3.2 Ochratoxin A (OTA) 16
6 Chlorinated organic environmental contaminants 17
6.1 Dioxins and PCB 17 6.1.1 Introduction 17 6.1.2 Methods of sampling, analysis and quality assurance 19 6.1.3 Results and discussion 19
6.2 Organochlorine pesticides and level of indicator PCB 23
4
6.2.1 Methods of sampling, analysis and quality assurance 23 6.2.2 Results and discussion 24
7 Polycyclic Aromatic hydrocarbons (PAH) 26
7.1 Introduction 26 7.2 Methods of sampling, analysis and quality assurance 26 7.3 Results and discussion 27
8 Acrylamide 29
8.1 Introduction 29 8.2 Methods of sampling, analysis and quality assurance 29 8.3 Results and discussion 29
9 Furan 31
9.1 Introduction 31 9.2 Methods of sampling, analysis and quality assurance 31 9.3 Results and discussion 31
10 References 33
11 Appendices 37
11.1 Appendices to trace elements 37 11.1.1 Mercury (mg/kg) 37 11.1.2 Lead (mg/kg, except for water, µg/L) 39 11.1.3 Cadmium (mg/kg except for water, µg/L) 41 11.1.4 Inorganic arsenic (mg/kg) 43 11.1.5 Total arsenic (mg/kg, except for water, µg/L) 45 11.1.6 Aluminum, copper, , selenium,tin and zinc (mg/kg, except for water, µg/L) 47
11.2 Nitrate (enhed mangler) (mg/kg) 48 11.3 Mycotoxins 49
11.3.1 Deoxynivalenol (µg/kg) 49 11.3.2 HT-2 (µg/kg) 49 11.3.3 T-2 (µg/kg) 49 11.3.4 Ochratoxin A (µg/kg) 50
11.4 Dioxin and PCB 51 11.4.1 WHO-TEQ2005 PCDD/F+PCB 51 11.4.2 WHO-TEQ2005 PCDD/F 53 11.4.3 WHO-TEQ2005 PCB 55 11.4.4 PCB-6 (sum of PCB 28, 52, 101, 138, 153 and 180) 57
11.5 PCB and organochlorine pesticides 59 11.5.1 Alpha-HCH 59 11.5.2 Beta-HCH 60 11.5.3 Lindane 61 11.5.4 HCB 62
5
11.5.5 Dieldrin 63 11.5.6 Chlordane, sum 64 11.5.7 Heptachlor, sum 65 11.5.8 DDT, sum 66 11.5.9 PCB (sum of PCB 28, 52, 101, 105, 118, 138, 153, 156, 170 and 180) 67
11.6 PAH 68 11.6.1 Benzo[a]pyrene 68 11.6.2 PAH 4 (sum of benz[a]anthracene, chrysene, benzo[b]fluoranthene and benzo[a]pyrene) 70
11.7 Acrylamide 72 11.8 Furan 73
6
1 Forord Denne rapport giver en oversigt over indholdet af udvalgte kemiske forureninger i fødevarer, der er analyseret i 2012 og 2013. Resultaterne for en del af disse forureninger kan man finde på Fødevare-styrelsens hjemmeside. Rapporten er en opfølgning af resultaterne, der er vist i rapporten Chemical Contaminants, Food Monitoring 2004-2011 (Petersen et al., 2013). I rapporten er vist resultater for cadmium, bly, kviksølv, total arsen, uorganisk arsen, aluminium, zink, kobber, nikkel, tin, mangan, selen, nitrat, dioxin, PCB, polycykliske aromatiske hydracarboner (PAH), akrylamid, deoxynivalenol (DON), HT-2 toksin og T-2 toksin samt ochratoksin A. Analy-serne er udført på Fødevarestyrelsens laboratorier i Ringsted og Aarhus.

7
2 Preface This report presents the results of analysis for various chemical contaminants in foods on the Dan-ish market. The time period covers the years 2012-2013. Included in this report are results from mercury, total and inorganic arsenic, cadmium, lead, selenium, manganese, copper, aluminium, zinc, tin , nitrate, dioxin, PCB, ochratoxin A, deoxynivalenole, HT-2 toxin, T-2 toxin, polycyclic aromatic hydrocarbons, acrylamide and furan. The analyses were carried out at the Danish Veteri-nary and Food Administration laboratories in Ringsted and Aarhus (Denmark).
8
3 Trace elements 3.1 Introduction
The following elements have been analysed in 2012 and/or 2013: Mercury (Hg) Lead (Pb) Cadmium (Cd) Arsenic, total (As) and inorganic (iAs) Copper (Cu) Selenium (Se) Aluminium (Al) Zinc Nickel (Ni)
3.2 Methods of sampling, analysis and quality assurance
3.2.1 Sampling
The samples were taken in the period 2012-2013. The sampling and analysis was organised in vari-ous projects, each covering a certain food-group or –subgroup. In contrast to the previous monitor-ing periods, no stratified sampling, with the same type of samples being analysed consecutively, was conducted. The projects were defined with respect to the types of foods and trace elements that were to be included on a project-by-project basis by the Danish Food Administration in collabora-tion with DTU Food. The sampling was conducted by local food inspectors from the Danish Food Administration in various parts of Denmark. The types and numbers of various foods included in the projects and the results of the analysis are given in Appendices 11.1.1 to 11.1.6. 3.2.2 Chemical analyses and quality assurance
The levels of trace elements were analysed by the regional laboratory of the Danish Food Admin-istration in Aarhus, Denmark. The samples were prepared in accordance with common household practices, but none of the foods were cooked prior to analysis. Only the edible parts of the foods were used and adhered soil was removed by brushing under clean water. The sample preparation involved isolation of the relevant tissue or part of the sample by utensils, which would not contami-nate the samples. To determine the total level of trace elements, representative subsamples of the homogenised food samples were digested by microwave-assisted wet-ashing in quartz vessels with concentrated nitric acid. Following this process the trace element level was determined using induc-tively coupled plasma mass spectrometry (ICP-MS). External calibration with internal standardisa-tion was used for the quantification of trace elements. For the selective determination of inorganic arsenic the samples were extracted with dilute acid at 90°C and the level of inorganic arsenic was determined using anion-exchange HPLC-ICP-MS. The analytical work was generally organised and run in batches comprising up to 15-20 unknown samples, minimum one blank, minimum one dou-ble determination for approximately each 10 unknown samples and one or more certified reference material(s). In the event of deviations from a set of criteria for tolerable variations of blanks, for values obtained for CRMs (x-charts) and for double determinations (R-charts), all the analyses in that batch were repeated. The LODs and LOQs, which were calculated in accordance with the three-sigma criterion, were estimated from the variance of the analytical blank values. Results indi-

9
cated by ”<” in Appendices 11.1.1 to 11.1.6 were below the LOD value for the analytical survey in which the result was produced.
The results are shown in appendix 11.1.1 to 11.1.6 and it should be noted that some results are quantified even if the results are below the LOD and LOQ. These results are also included in the in the calculation of the mean and median.
For some commodities both organic and conventional products are analysed. Results for both kinds of products are shown except in a few cases, where the data have been compiled. For example for infant food only one or two samples are not organic and hence it make no sense to show the results for both types as it is not possible to make comparison based on such limited number of data. If more samples of both types are analysed in the future a comparison may become possible.
Maximum levels for mercury, cadmium and lead in selected foodstuffs are regulated in the EU di-rective 1881/2006 and later amendments (EC, 2006). For drinking water maximum levels for a wide range of trace elements have been established in the Danish drinking water directive (DEPA, 2014)
3.3 Mercury
3.3.1 Introduction
Mercury (Hg) is naturally present in the Earth’s crust usually at levels around 0.02 mg/kg. The ele-ment can be found in various chemical forms, both inorganic and organic (e.g. methylmercury), and the organic form that is considered most toxic. It is used in various industrial applications and the main anthropogenic source of mercury is the incineration of waste.
3.3.2 Results and discussion
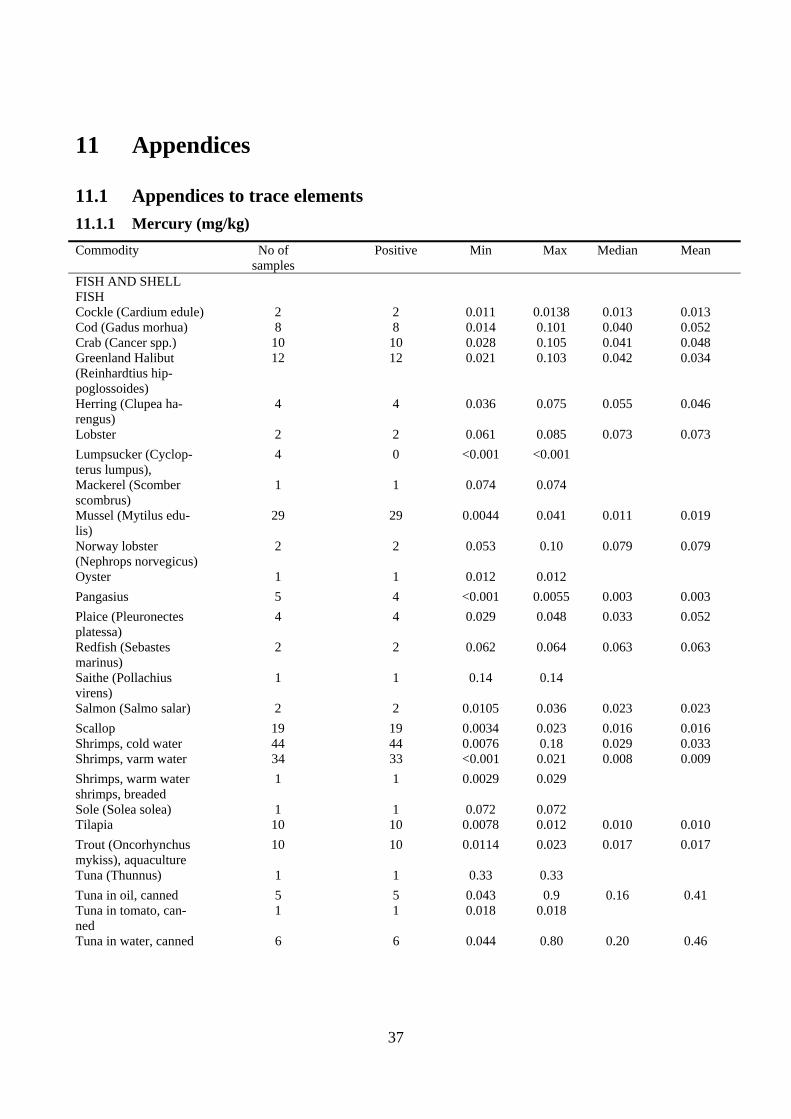
In the present study only data for the total amount of mercury (the sum of inorganic an organic bound mercury) has been determined. As can be seen from appendix 11.1.1 most of the samples analysed for mercury are seafood. Except for pangasius, all samples of fish contained amounts of mercury above LOD. However, none of the samples exceed the maximum levels for mercury in fish at 0.5 mg/kg for most fish species and 1.0 mg/kg for certain predatory fish types (EC, 2006). Also some samples of animal products are ana-lysed. For this kind of food most of the samples are below the LOD (<0.0007 mg/kg). Only for wild ducks and pig kidney levels above the LOD are found. . 3.4 Lead
3.4.1 Introduction
Lead is a ubiquitous element, found naturally in the Earth’s crust at an average level of 10 mg/kg. It is widespread in the environment due to its use in various industrial applications.
3.4.2 Results and discussion
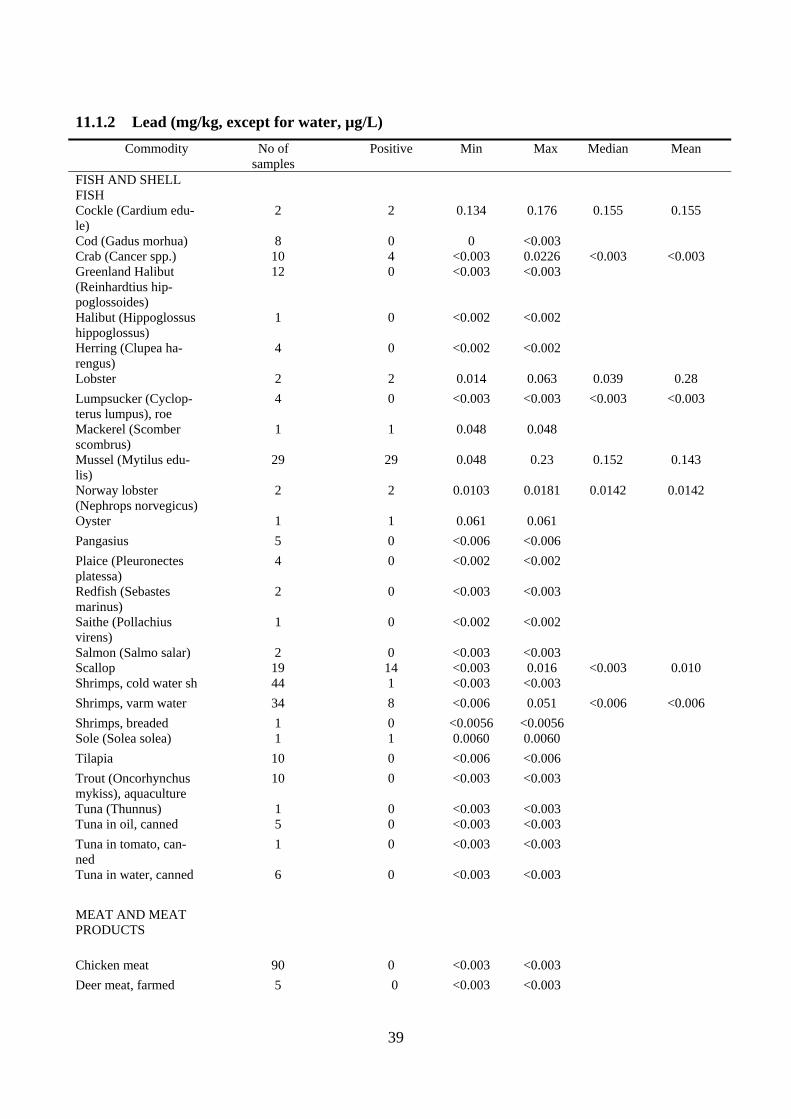
The results are shown in appendix 11.1.2. As can be seen except for water all samples belong to the groups of fish, shellfish and animal products. For a majority of the samples only low levels below
10
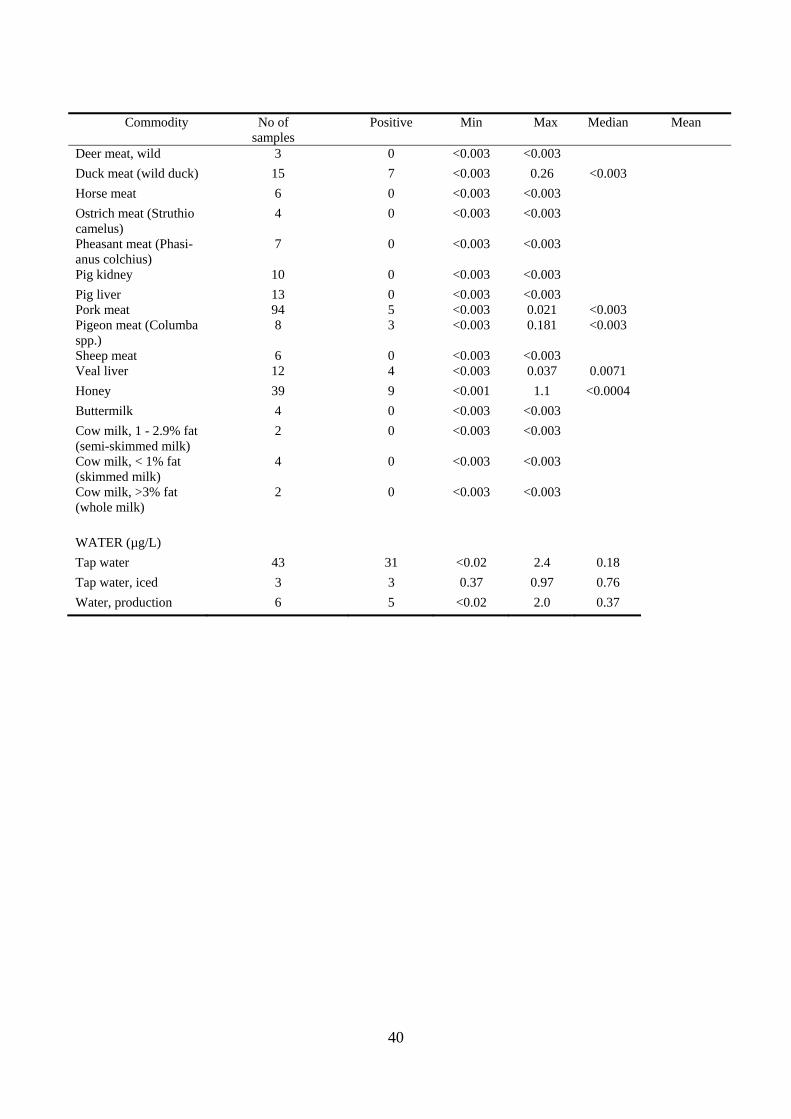
the LOD have been found. Exceptions are some of the samples belonging to the group of bivalves, a few fish, duck and pigeon meat and honey. None of the samples exceeded the current EU maximum levels for lead in food (EC, 2006) and drinking water (DEPA, 20149.
3.5 Cadmium
3.5.1 Introduction
Cadmium is a toxic trace element found as an environmental contaminant, both through natural occurrence and from industrial and agricultural sources. Cadmium has no known biological func-tion in humans. Foods are the main source of cadmium exposure for the non-smoking population. Tobacco smoking and work place air have also been identified as major contributors to cadmium exposure. 3.5.2 Results and discussion
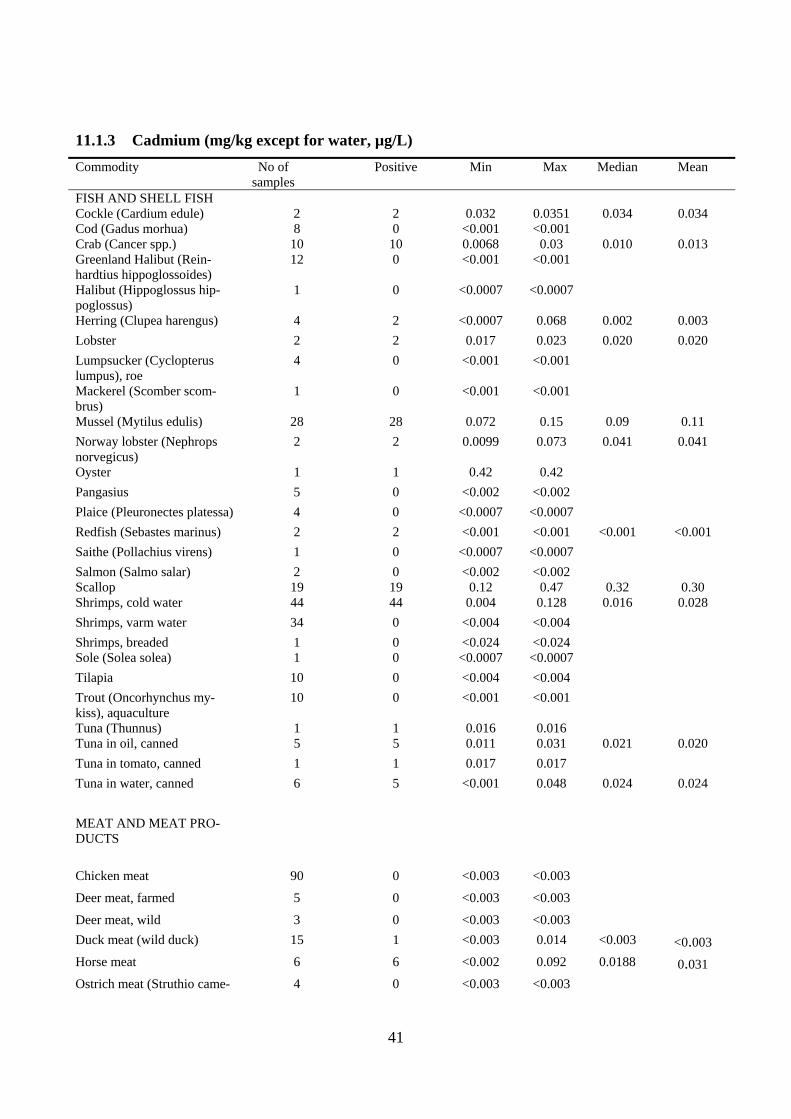
The results are shown in appendix 11.1.3. The samples analysed belong to the groups of seafood, animal products and drinking water. For many of the commodities within these food groups there are none or few positive results except for crabs, mussels, shrimps, horse meat and pig kidney and liver. In water a few positive samples are found and only in tap water. None of the samples exceed-ed the current maximum levels for cadmium in food (EC, 2006) and drinking water (DEPA, 2014). 3.6 Arsenic
3.6.1 Introduction
Arsenic is a ubiquitous element, which is introduced to the environment from both natural and an-thropogenic sources. The crust of the Earth contains arsenic, which is released through weathering of rocks and volcanic activity. The toxicity of arsenic compounds strongly depends on their chemi-cal forms (speciation). Inorganic arsenic is considered the most toxic of the arsenic species present in food. In the present period both results for total and inorganic arsenic have been obtained in a range of foodstuffs.
3.6.2 Results and discussion for inorganic arsenic
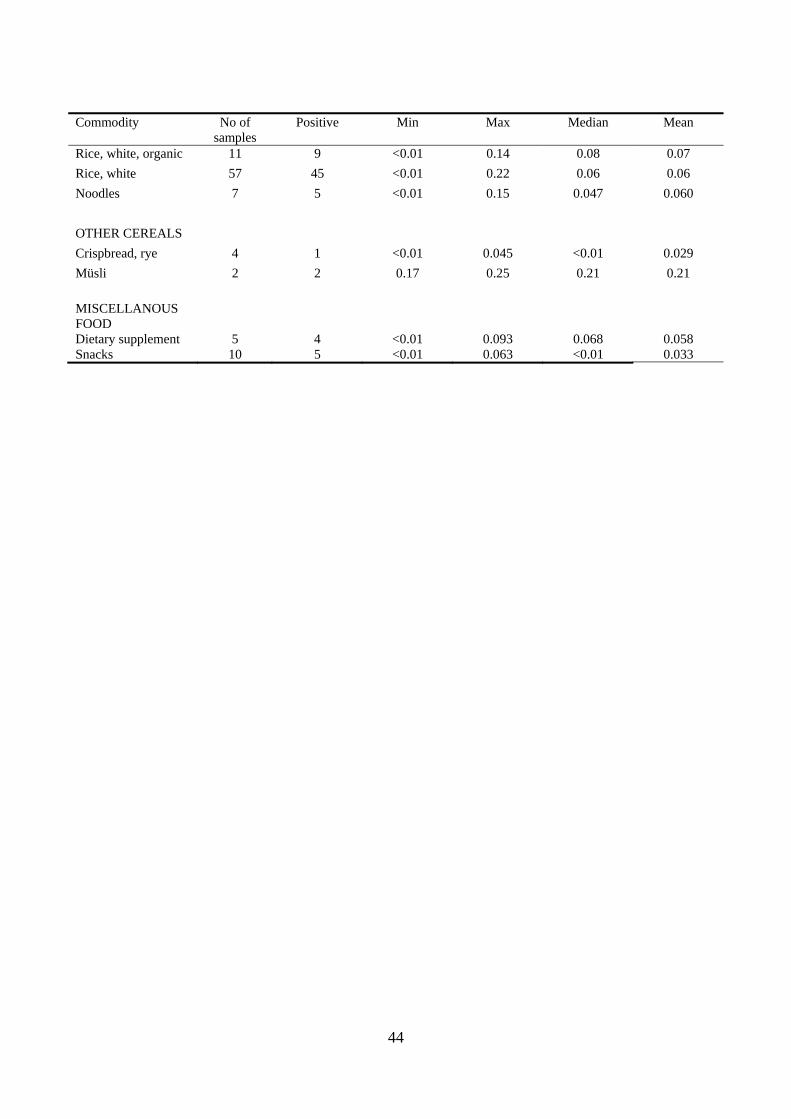
The results for inorganic arsenic are shown in appendix 11.1.4. It is primary fish and rice products that have been analysed. Compared to total arsenic few of the fish contain levels of inorganic arse-nic above the LOQ. As can be seen for the rice products there is no differences in levels for conventional and organic products. However, it can also be seen that brown rice has higher levels than white rice, which is in accordance with previous results (Chemical contaminants, 2004-2011). 3.6.3 Results and discussion for total arsenic
The results for total arsenic are shown in appendix 11.1.5 . It is primary fish and rice products that have been analysed. The majority of samples have total arsenic levels above the LOQ level.
11
3.7 Aluminium, copper, selenium, zinc and tin
Aluminium is the most abundant element in the Earth’s crust (8%) and it is used in numerous indus-trial applications. In the present period the total level of Al has been analysed in imported Chinese noodles of wheat in order to comply with EU regulation 878/2010. Selenium has been determined in ten samples of trout while tin has been determined in some sam-ples of canned tuna. Copper and zinc have been determined in different kind of waters. Copper, tin and zinc have not been included in the analytical programme before. The results for these five elements are shown together in appendix 11.1.6

12
4 Nitrate in vegetables 4.1 Introduction
Nitrate is a naturally occurring compound present in plants which may accumulate in different tis-sues of the plant. The level of nitrate varies between plant species, the extent of fertilisers use, hu-midity, temperature and amount of sunlight, e.g. the nitrate level in lettuce tends to be higher in samples from Northern Europe than from Mediterranean countries. The acute toxicity of nitrate is low, but in food and in the gastrointestinal tract nitrate can be reduced to nitrite, which has a higher acute toxicity. 4.2 Methods of sampling, analysis and quality assurance
The sampling was carried out on a nationwide basis by authorized personnel from local food control units. Samples were analysed for nitrate at the regional laboratory in Ringsted (Denmark). Samples were taken at vegetable markets all over Denmark. The analyses were performed in accordance with to the method for the determination of nitrate in fruits and vegetables of the Danish Veterinary and Food Administration (FIA-method, ANA-07.1481). The limit of quantification (LOQ) was 5 mg/kg for nitrate. The regional laboratories in Ringsted participate in intercalibrations and perfor-mance tests through the Food Analysis Performance Assessment Scheme (FAPAS). 4.3 Results and discussion
For nitrate EU has set maximum limits for lettuce, rucola, spinach and baby food (EC, 2011d). The results of nitrate are shown in the appendix. As it can be seen only four samples of lettuce were taken and none of these samples exceeded the maximum limits for lettuce. Most of the samples taken were rucula and beside a few samples of spring onions (2) and beet root (3) were taken. As it can be seen from table 4.2 the nitrate level in rucola was higher in the foreign samples than in the Danish samples. The minimum is about the same but the maximum, mean and median values were higher for the foreign samples. Among the samples of rucola of foreign origin six of them exceeded the maximum limits set for nitrate in rucola (see table 4.1) while none of the Danish samples ex-ceeded the maximum limits. All the samples are also analysed for nitrite but no levels above the LOQ of 3 mg/kg were found. Table 4.1. EU maximum limits for nitrate in analysed samples (mg/kg) Foodstuff Remarks Maximum limit
(mg nitrate/kg) Fresh lettuce (not mentioned otherwise)
Harvested 1 October to 31 March Grown under cover Grown in open air Harvested 1 April to 30 September Grown under cover Grown in open air
5000 4000
4000 3000
“Iceberg” type lettuce Grown under cover 2500

13
Grown in open air 2000 Rucola Grown under cover
Grown in open air 7000 6000

14
5 Mycotoxins 5.1 Introduction
Mycotoxins are secondary fungal metabolites with diverse structures and toxicological properties that induce a variety of toxic effects in humans and animals. In particular, fungi of the genera As-pergillus, Penicillium and Fusarium are significant in foods and feed all over the world. In Den-mark fungi of the genus Fusarium are the most important toxigenic fungi just as in other northern temperate regions. Fusarium produce various trichothecenes including deoxynivalenole (DON, vomitoxin), HT-2 toxin (HT-2) and T-2 toxin (T-2) which might be present in cereal grain intended for human consumption. The Tolerable Daily Intake (TDI) set by the European Food Safety Au-thority (EFSA, 2011b) for the sum of HT-2 and T-2 is 0.06 µg/kg body weight which is lower than for DON (1 µg/kg bw/day). Increased levels of DON in cereal grains are often observed in harvest years with frequent rainfall and high humidity during the flowering period and timing, rather than the amount of rain is the most critical factor. How the weather conditions affect the level of HT-2 and T-2 toxins in cereals are less known, but we can also here see great variations from year to year. Ochratoxin A (OTA) is produced by various Penicillium and Aspergillus species and represents a well-known hazard to human and animal health. The occurrence of OTA in cereals has been fol-lowed in several Danish monitoring programs since the mid -1980s. For this reason only a limited number of samples have been analysed during this monitoring period from 2012 to 2013 as the pre-vious monitoring programmes (DFVA, 2005 and Petersen et al, 2013) have shown low levels of OTA in cereal grains. 5.2 Methods of sampling and analytical methods
Sampling was carried out on a nationwide basis by authorised personnel from local food control units. Samples were analysed for DON, HT-2, T-2 and OTA by the Danish Veterinary and Food Administration at the regional laboratory in Ringsted. Samples were taken at mills all over Den-mark and could have either Danish or foreign origin. In Denmark most of the flour for human con-sumption is mainly produced from domestic grain and grain from the southern part of Sweden and the northern part of Germany, where the climate and growing conditions for fungi are similar to Denmark. The analyses of DON, HT-2 and T-2 in cereal and cereal products were carried out sim-ultaneously by the regional laboratory in Ringsted using an accredited LC-MS/MS method. OTA was also analysed at the regional laboratory in Ringsted by HPLC/FLD. The laboratory par-ticipates regularly in performance tests through FAPAS. The limit of quantification (LOQ) for DON, HT-2, T-2 and OTA was 20, 2, 1.6 and 0.1µg/kg, respectively. Samples with levels lower than LOQ were assumed to have a level of half the value of LOQ for determinations of the average value. 5.3 Results and discussion of mycotoxins
5.3.1 Trichothecenes (Deoxynivalenol, HT-2 toxin and T-2 toxin)
Different kind of cereals and cereal products of wheat, rye, oats and barley were analysed for DON, HT-2 and T-2 during the present monitoring period. In total 186 samples have been analysed and the results are shown in appendix 11.3-1 to 11.3-3. As for the foregoing monitoring period 2004 – 2011 (Petersen et al., 2013) the highest levels of DON were found in oat products with mean and maximum values of 113 and 2400 µg/kg, respectively. DON was found in less than half of the 40

15
analysed oat samples resulting in a median value below LOQ. Only two samples exceeded the EU maximum limit of 750 µg/kg for DON- both obtained in oatmeal. In accordance with the results from last monitoring period DON was more common found in kernels from wheat than for the bar-ley and rye. The highest mean and median values were obtained for wheat bran except for maize goats, but here only one single sample was analysed. It was remarkable that the levels of DON in rye and wheat bread were similar or even higher than in the flour, because the levels will generally be reduced during the manufacturing process. The number of analysed bread samples and especially for rye was low and for this reason the obtained results should be taken with reservations The levels of HT-2 toxin and T-2 toxin in samples of wheat and rye were generally low, and even for the positive samples the levels were close to the detection limit corresponding to 2 and 1.6 µg/kg, respectively. The level of HT-2 toxin was generally higher than for T-2 toxin in the analysed samples and HT-2 was also detected more frequently than T-2 (appendix 11.3.2 and 11.3.3). As for DON, the occurrence and contamination levels were higher for rolled oat than for flour of rye and wheat. There are at present no European maximum levels of HT-2 and T-2 in cereals but only guideline levels for the sum of the two toxins. In oats for human consumption the value is 100 µg/kg and for other cereals 50 µg/kg (EC, 2013a). In cereal based foods for infants and young children the guide-line level is 15 µg/kg. As shown in Appendix 11.3.2 and 11.3.3 none of the samples exceed 100 µg/kg (the sum of HT-2 and T-2), but several samples showed levels higher than 15 µg/kg. In this monitoring period cereal samples of organic and conventional origin were collected and ana-lysed for DON, HT-2 and T-2. The results for DON are shown in table 5.1. Both the average and median levels in products of oat and wheat were significant higher in the conventional samples of both Danish and foreign origin compared to the organic samples. The same distribution was found for the maximum values in oat and wheat, respectively. In products of rye the values for the mean and median levels were more similar between the organic and conventional samples, which were also true for the maximum values. The general frequency (number of positive) also appeared to be higher for DON in the conventional compared to the organic samples. The level of HT-2 and T-2 were low in most of the analysed samples and for many of the samples below LOQ, and it was therefore difficult to compare the level in the organic and conventional cereal samples. However, the data strongly indicate that the number of positive samples for the two mycotoxins were higher in conventional than in the organic samples (results not shown). Table 5.1. Comparison of deoxynivalenol in organic and conventional samples of flour and kernels of oat, wheat and rye.
Cereal Number of samples Positive Average (µg/kg)
Median (µg/kg)
Maximum (µg/kg)
Oat Organic (Danish) Conventional (Danish) Organic (foreign) Conventional (foreign)
10 9
9 12
3 5
1 8
37 344
22 72
<LOQ 94
<LOQ 69
200 2400
210 120
Wheat Organic (Danish) Conventional (Danish) Organic (foreign) Conventional (foreign)
18 13 9
32
11 9 3 24
32 80 17 52
24 45 49
200
87 230 49
250

16
Rye Organic (Danish) Conventional (Danish) Organic (foreign) Conventional (foreign)
9 9 5
10
6 6 5 7
20 30 24 44
21 19 45 18
36 83 60 58
5.3.2 Ochratoxin A (OTA)
During this monitoring period only 18 samples were analysed for OTA in kernels from oat, rye, wheat and in two samples of wheat bran. As shown in Appendix 11.3.4 the level of OTA were be-low LOQ in most of the samples, and OTA was only found in three rye samples with mean and maximum values of 0.079 and 0.21 µg/kg, respectively, which is far below the maximum EU limit corresponding to 3 µg/kg for these type of products. As in the previous monitoring period 2004-2011, the level of OTA in cereal and cereal products collected on the Danish market are all low and below the EU maximum limit.
17
6 Chlorinated organic environmental contaminants Dioxins, PCB and chlorinated pesticides have been included in the monitoring in 2012 og 2013. Dioxins and PCB (including indicator PCB) have been analysed by one analytical method and chlo-rinated pesticides have been analysed together with indicator PCB by another analytical method. Results of indicator PCB are therefore presented in both chapter 6.1 and 6.2.
6.1 Dioxins and PCB
6.1.1 Introduction
Dioxins are the short expression for a group of 210 compounds including 75 polychlorinated diben-zo-p-dioxins (PCDD) and 135 polychlorinated dibenzofuranes (PCDF). Dioxins have no technolog-ical use, but are generated in a number of thermal and industrial processes as unwanted, and often unavoidable, impurities or by-products. Important emission sources are metal production and pro-cessing, waste incineration and domestic furnaces. Dioxins are poorly soluble in water but highly soluble in lipids. Due to their lipophilic properties they accumulate in the food chain and are stored in the fatty tissues of animals and humans. PCB is a group of 209 organochlorine compounds that are synthesised by catalysed chlorination of biphenyl. Due to their physicochemical properties, such as non-flammability, chemical stability, high boiling point, low heat conductivity and high dielectric constants, technical PCB mixtures were widely used in a number of industrial and commercial closed and open applications. As a re-sult of their widespread use, leakages and inappropriate disposal practices, PCB has, like dioxins, a global distribution in the environment. Restrictions on production and use of PCB have decreased the environmental pollution with PCB since a peak level in the 1970s. Many PCB congeners are persistent because they are degraded poorly and therefore can bio-accumulate in the food chain. Dioxins and dioxin-like PCBs can cause reproductive and developmental problems, damage the immune system, interfere with hormones and also cause cancer. Long-term exposure to dioxins and dioxin-like PCBs in food increases the risk of adverse effects on fetal development. Based on their structural characteristics and toxicological effects, PCBs can be divided into two groups. One group consists of 12 congeners that can easily adopt a coplanar structure and show toxicological properties similar to the dioxins of concern. These are therefore called “dioxin-like PCBs” (DL-PCBs). The other PCBs do not show dioxin-like toxicity and have a different toxicolog-ical profile. These are called “non-dioxin like PCBs” (NDL-PCBs). In general, environmental and biological samples contain complex mixtures of various dioxin con-geners, so the concept of Toxic Equivalency Factors (TEFs) has been developed to facilitate risk assessment. TEFs have been established to express concentrations of mixtures of 2,3,7,8-substituted PCDDs and PCDFs, and some planar non-ortho and mono-ortho chlorine substituted DL-PCB in toxic equivalents (TEQs) of 2,3,7,8-TCDD. TEQ is calculated by multiplying the concentration of each congener with the assigned TEF. The weighted concentrations are summed to produce TEQ for dioxins, TEQ for DL-PCB and Total TEQ, which is the sum of TEQ for dioxins and DL-PCB.
18
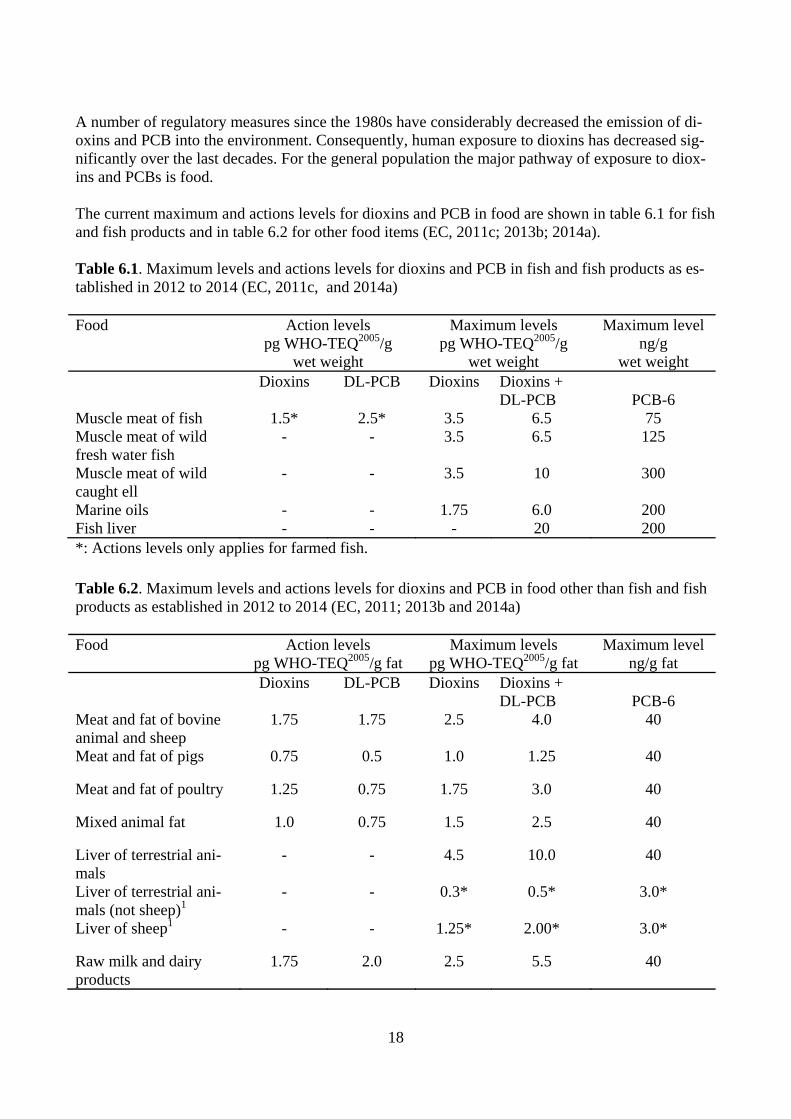
A number of regulatory measures since the 1980s have considerably decreased the emission of di-oxins and PCB into the environment. Consequently, human exposure to dioxins has decreased sig-nificantly over the last decades. For the general population the major pathway of exposure to diox-ins and PCBs is food. The current maximum and actions levels for dioxins and PCB in food are shown in table 6.1 for fish and fish products and in table 6.2 for other food items (EC, 2011c; 2013b; 2014a). Table 6.1. Maximum levels and actions levels for dioxins and PCB in fish and fish products as es-tablished in 2012 to 2014 (EC, 2011c, and 2014a) Food Action levels
pg WHO-TEQ2005/g wet weight
Maximum levels pg WHO-TEQ2005/g
wet weight
Maximum level ng/g
wet weight Dioxins DL-PCB Dioxins Dioxins +
DL-PCB
PCB-6 Muscle meat of fish 1.5* 2.5* 3.5 6.5 75 Muscle meat of wild fresh water fish
- - 3.5 6.5 125
Muscle meat of wild caught ell
- - 3.5 10 300
Marine oils - - 1.75 6.0 200 Fish liver - - - 20 200 *: Actions levels only applies for farmed fish.
Table 6.2. Maximum levels and actions levels for dioxins and PCB in food other than fish and fish products as established in 2012 to 2014 (EC, 2011; 2013b and 2014a) Food Action levels
pg WHO-TEQ2005/g fat Maximum levels
pg WHO-TEQ2005/g fat Maximum level
ng/g fat Dioxins DL-PCB Dioxins Dioxins +
DL-PCB
PCB-6 Meat and fat of bovine animal and sheep
1.75 1.75 2.5 4.0 40
Meat and fat of pigs 0.75 0.5 1.0 1.25 40
Meat and fat of poultry 1.25 0.75 1.75 3.0 40
Mixed animal fat 1.0 0.75 1.5 2.5 40
Liver of terrestrial ani-mals
- - 4.5 10.0 40
Liver of terrestrial ani-mals (not sheep)1
- - 0.3* 0.5* 3.0*
Liver of sheep1 - - 1.25* 2.00* 3.0*
Raw milk and dairy products
1.75 2.0 2.5 5.5 40
19
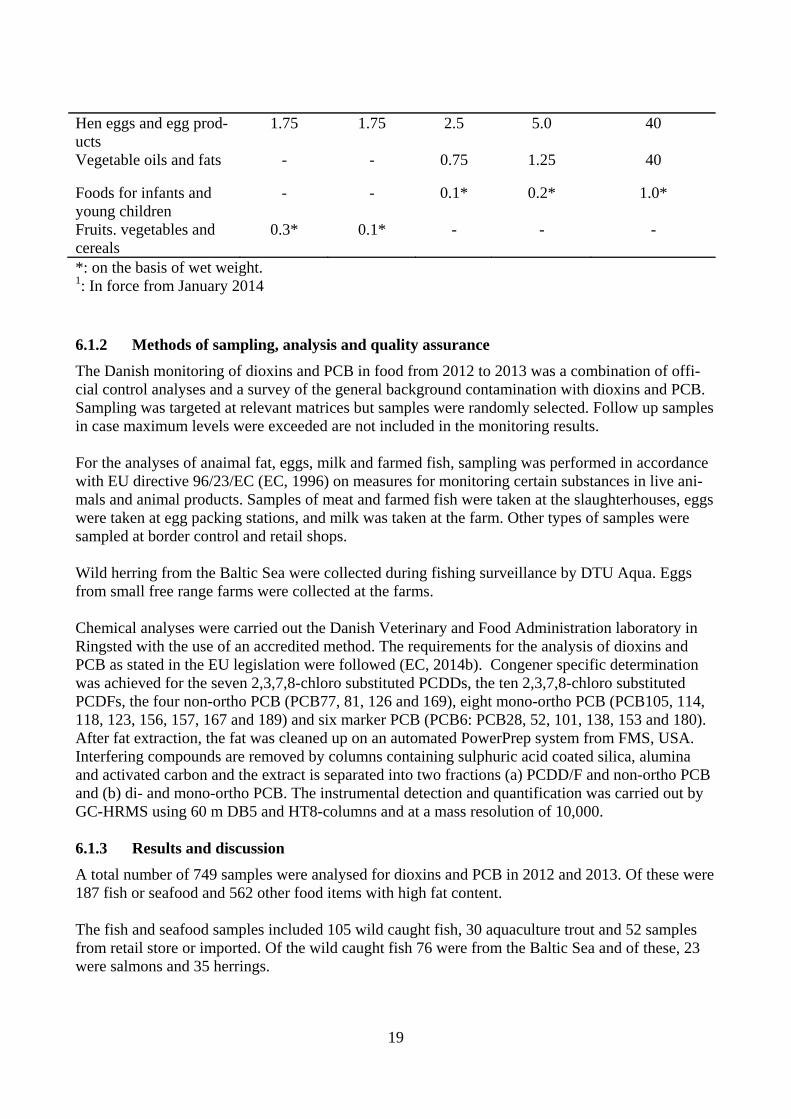
Hen eggs and egg prod-ucts
1.75 1.75 2.5 5.0 40
Vegetable oils and fats - - 0.75 1.25 40
Foods for infants and young children
- - 0.1* 0.2* 1.0*
Fruits. vegetables and cereals
0.3* 0.1* - - -
*: on the basis of wet weight. 1: In force from January 2014 6.1.2 Methods of sampling, analysis and quality assurance
The Danish monitoring of dioxins and PCB in food from 2012 to 2013 was a combination of offi-cial control analyses and a survey of the general background contamination with dioxins and PCB. Sampling was targeted at relevant matrices but samples were randomly selected. Follow up samples in case maximum levels were exceeded are not included in the monitoring results. For the analyses of anaimal fat, eggs, milk and farmed fish, sampling was performed in accordance with EU directive 96/23/EC (EC, 1996) on measures for monitoring certain substances in live ani-mals and animal products. Samples of meat and farmed fish were taken at the slaughterhouses, eggs were taken at egg packing stations, and milk was taken at the farm. Other types of samples were sampled at border control and retail shops. Wild herring from the Baltic Sea were collected during fishing surveillance by DTU Aqua. Eggs from small free range farms were collected at the farms. Chemical analyses were carried out the Danish Veterinary and Food Administration laboratory in Ringsted with the use of an accredited method. The requirements for the analysis of dioxins and PCB as stated in the EU legislation were followed (EC, 2014b). Congener specific determination was achieved for the seven 2,3,7,8-chloro substituted PCDDs, the ten 2,3,7,8-chloro substituted PCDFs, the four non-ortho PCB (PCB77, 81, 126 and 169), eight mono-ortho PCB (PCB105, 114, 118, 123, 156, 157, 167 and 189) and six marker PCB (PCB6: PCB28, 52, 101, 138, 153 and 180). After fat extraction, the fat was cleaned up on an automated PowerPrep system from FMS, USA. Interfering compounds are removed by columns containing sulphuric acid coated silica, alumina and activated carbon and the extract is separated into two fractions (a) PCDD/F and non-ortho PCB and (b) di- and mono-ortho PCB. The instrumental detection and quantification was carried out by GC-HRMS using 60 m DB5 and HT8-columns and at a mass resolution of 10,000. 6.1.3 Results and discussion
A total number of 749 samples were analysed for dioxins and PCB in 2012 and 2013. Of these were 187 fish or seafood and 562 other food items with high fat content. The fish and seafood samples included 105 wild caught fish, 30 aquaculture trout and 52 samples from retail store or imported. Of the wild caught fish 76 were from the Baltic Sea and of these, 23 were salmons and 35 herrings.

20
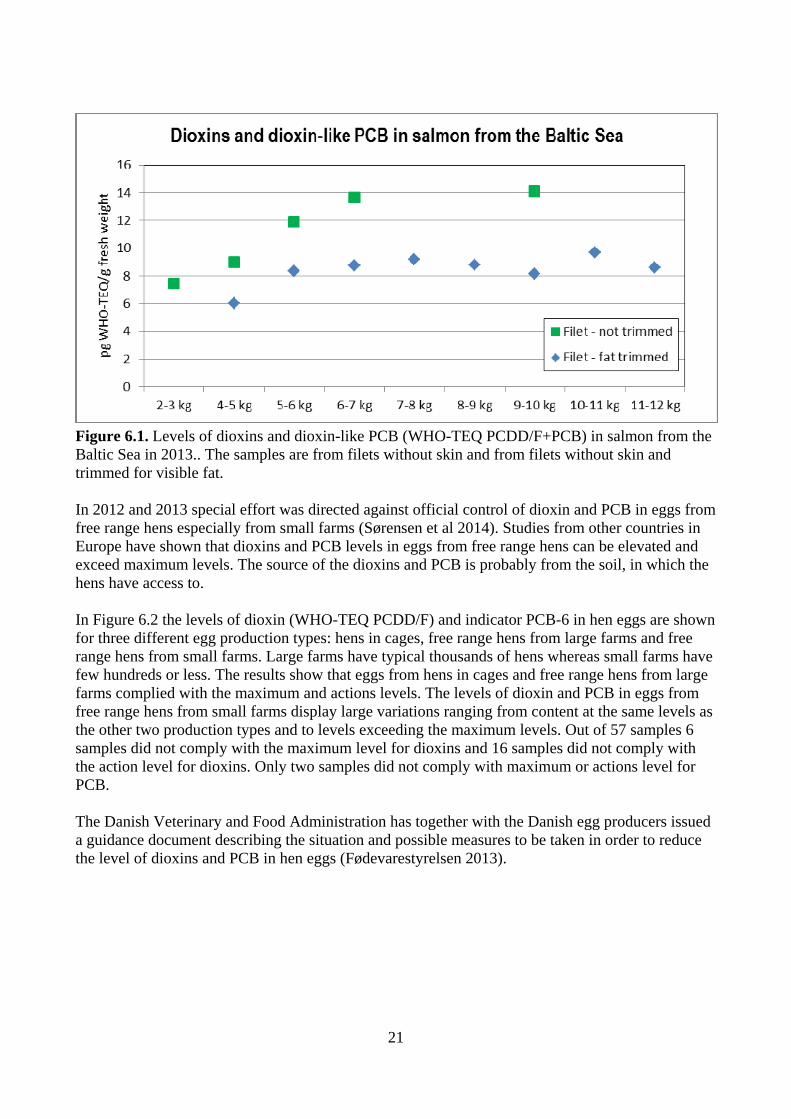
The samples from animal food production included fat from individual animals: 272 bovines, 274 pigs, 19 sheep, 4 horses, 5 buffalos and 15 chickens. 39 cow milks samples were analysed and 116 hens eggs samples. In additions to these commodities a number of processed food items were ana-lysed. This included 8 samples of chicken meat, 1 duck meat, 2 beef meat, 1 goat cheese, 2 meal for infants and 3 infant formulae powder. The results are shown in the appendices 11.4.1 Levels of WHO-TEQ2005 PCDD/F+PCB, 11.4.2 Levels of WHO-TEQ2005 PCDD/F, 11.4.3 Levels of WHO-TEQ2005 PCB and 11.4.4 Levels of PCB-6 (sum of PCB 28, 52, 101, 138, 153 and 180). The levels of dioxins and PCB determined in 2012 and 2013 are comparable to the levels found in the Danish food monitoring 2000 – 2011 (Cederberg et al, 2010a; Petersen et al., 2013) with a ten-dency to a decrease compared to the first part of the monitoring periods. In 2012 and 2013 only samples of eggs from free range hens from small farms as well as salmon and herring from the Bal-tic Sea exceeded the maximum and actions levels for dioxins and PCB (table 6.1 and table 6.2). In 2013 a follow up project on wild salmon from the Baltic Sea was conducted. The levels of diox-ins and PCB in Baltic salmon do not comply with the maximum levels but Danish studies in 2005 and 2006 showed that intensively trimming of fat from the salmon filet reduced the levels of dioxins and PCB (Cederberg et al 2010b; Cederberg and Heinrich 2007; Cederberg et al 2005). A Danish order originally from 2006 made it possible to sell filet of Baltic salmon provided that the filet is fat trimmed and originate from a salmon weighing up to a maximum of 5.5 kg (BEK 2011). The aim of the follow up project was to verify if the content of dioxins and PCB in the Baltic salmon has de-creased since 2006 so the limit of 5.5 kg could be changed or removed. In Figure 6.1 the results for the different weight classes of salmon are shown. The data points repre-sent the level of the sum of dioxins and dioxin-like PCB in filet of Baltic salmon, without fat trim-ming and fat trimmed, respectively. It can be seen that fat trimming reduce the levels of dioxins and PCB significantly, but trimmed filets from salmon with the weight of approximately 5.5 kg still exceed the maximum level of 6.5 pg WHO-TEQ PCDD/F+PCB/g fresh weight (taking into account the analytical uncertainty).
21
Figure 6.1. Levels of dioxins and dioxin-like PCB (WHO-TEQ PCDD/F+PCB) in salmon from the Baltic Sea in 2013.. The samples are from filets without skin and from filets without skin and trimmed for visible fat. In 2012 and 2013 special effort was directed against official control of dioxin and PCB in eggs from free range hens especially from small farms (Sørensen et al 2014). Studies from other countries in Europe have shown that dioxins and PCB levels in eggs from free range hens can be elevated and exceed maximum levels. The source of the dioxins and PCB is probably from the soil, in which the hens have access to. In Figure 6.2 the levels of dioxin (WHO-TEQ PCDD/F) and indicator PCB-6 in hen eggs are shown for three different egg production types: hens in cages, free range hens from large farms and free range hens from small farms. Large farms have typical thousands of hens whereas small farms have few hundreds or less. The results show that eggs from hens in cages and free range hens from large farms complied with the maximum and actions levels. The levels of dioxin and PCB in eggs from free range hens from small farms display large variations ranging from content at the same levels as the other two production types and to levels exceeding the maximum levels. Out of 57 samples 6 samples did not comply with the maximum level for dioxins and 16 samples did not comply with the action level for dioxins. Only two samples did not comply with maximum or actions level for PCB. The Danish Veterinary and Food Administration has together with the Danish egg producers issued a guidance document describing the situation and possible measures to be taken in order to reduce the level of dioxins and PCB in hen eggs (Fødevarestyrelsen 2013).

22
Figure 6.2. Levels of dioxins (WHO-TEQ PCDD/F) and indicator PCB-6 in hen eggs sampled from different productions types: hens in cages, free range hens from large farm and free range hens from small farms. Horizontal bar represent the average and the vertical line marks the mini-mum and maximum analytical results.

23
6.2 Organochlorine pesticides and level of indicator PCB
Contamination by organochlorine compounds may derive from pollution of the environment where the compounds, being fat-soluble and having apolar properties, accumulate through the food chain. In meat, eggs, and dairy products they may also derive from residual levels of the organochlorine pesticides in feedstuffs or from applications in the environment of the animals.
6.2.1 Methods of sampling, analysis and quality assurance
The environmental contaminants are unevenly distributed in the various foods. For example levels in fish depend on the type of fish, the area where the fish live and the age of the fish etc. Lean fish have appreciably lower levels of organochlorine pesticides and indicator PCB than fat fish such as herring. Samples of herring and liver from cod for monitoring the contamination levels of the vari-ous Danish waters were collected by the Danish Directorate of Fisheries from the Kattegat and the Belts. For the analyses of meat, eggs, milk and farmed fish, sampling was performed in accordance with EU directive 96/23/EC (EC, 1996) on measures for monitoring certain substances in live animals and animal products. Samples of meat and farmed fish were taken at the slaughterhouses, eggs were taken at egg packing stations, and milk was taken either at the dairy works or directly from the livestock. When possible, samples of organically produced products were included, however due to the very limited number of samples, results are not presented separately. The substances monitored for are mainly fat-soluble, and so they will be found in the lipid phase, i.e. the fat. For dairy products milk were ana-lysed and samples of eggs. Kidney fat or meat from cattle, pigs, horse, sheep and farmed deer and subcutaneous fat or meat from poultry were also analysed. Studies (Fries et al., 1978; Fries and Marrow, 1977; Lorber et at al., 1997; Rumsey et al., 1967) have shown that the levels of organo-chlorine pesticides and indicator PCB in such fatty tissues are representative of the levels in the market meat when measured on the basis of fat. Fillets of fish were analysed after removing the skin, because it is assumed that very few people eat the fish skin and that the migration of the sub-stances from the skin to the rest of the fish during preparation is minimal. The chemical analyses of organochlorine pesticides and indicator PCB were carried out at the Dan-ish Veterinary and Food Administration laboratories in Aarhus (2012) and Ringsted (2013) in ac-cordance with the quality assurance manual, including participation in international ring tests. The analytical procedure includes extraction using an organic solvent, after which the organochlorine contaminants are isolated and detected by gas chromatography with either EC or MS detection. Included in the program are a number of organochlorine pesticides, these are for the method used in Århus: p,p'-DDT with its metabolites p,p'-DDE, p,p'-DDD and o,p’-DDT (the values for these four substances are reported here as the sum of the four, referred to as the DDT), aldrin, isodrin, endrin, dieldrin, HCB (hexachlorobenzene), - and -HCH (hexachlorocyclohexane), lindane (-HCH), heptachlor and heptachlor epoxide, which is a metabolite of heptachlor, -chlordane, -chlordane, oxychlordane, trans-nonachlor, -endosulfan. Furthermore ten indicator PCB congeners are PCB28, PCB52, PCB101, PCB105, PCB118, PCB138, PCB153, PCB156, PCB170, and PCB180. Indicator PCB sum is calculated as the sum of the 10 congeners. For the method used in Ringsted the follow-
24
ing compounds are reported; Azinphos-ethyl, Bifenthrin, Chlorobenzilate, Chlorpyrifos, Chlorpyri-fos-methyl, Cyfluthrin (sum), Cypermethrin (sum), DDT (sum), Deltamethrin, Diazinon, Dieldrin, Endosulfan (sum), Endrin, RR- and SS-Fenvalerat esfenvalerat, RS- and SR- Fenvalerat, esfenvale-rat, alpha-HCH, beta-HCH, Heptachlor (sum), Lindane, Methidathion, Methoxychlor, Parathion, Parathion-methyl (sum), Permethrin (sum), Pirimiphos-methyl, Profenofos, Quintozene (sum), Tec-nazene. The results are calculated as ng/g fish/cod liver/meat (fresh weight), or as ng/g fat for fat from pigs, cattle, sheep, deer, horse, poultry and eggs and dairy products.
6.2.2 Results and discussion
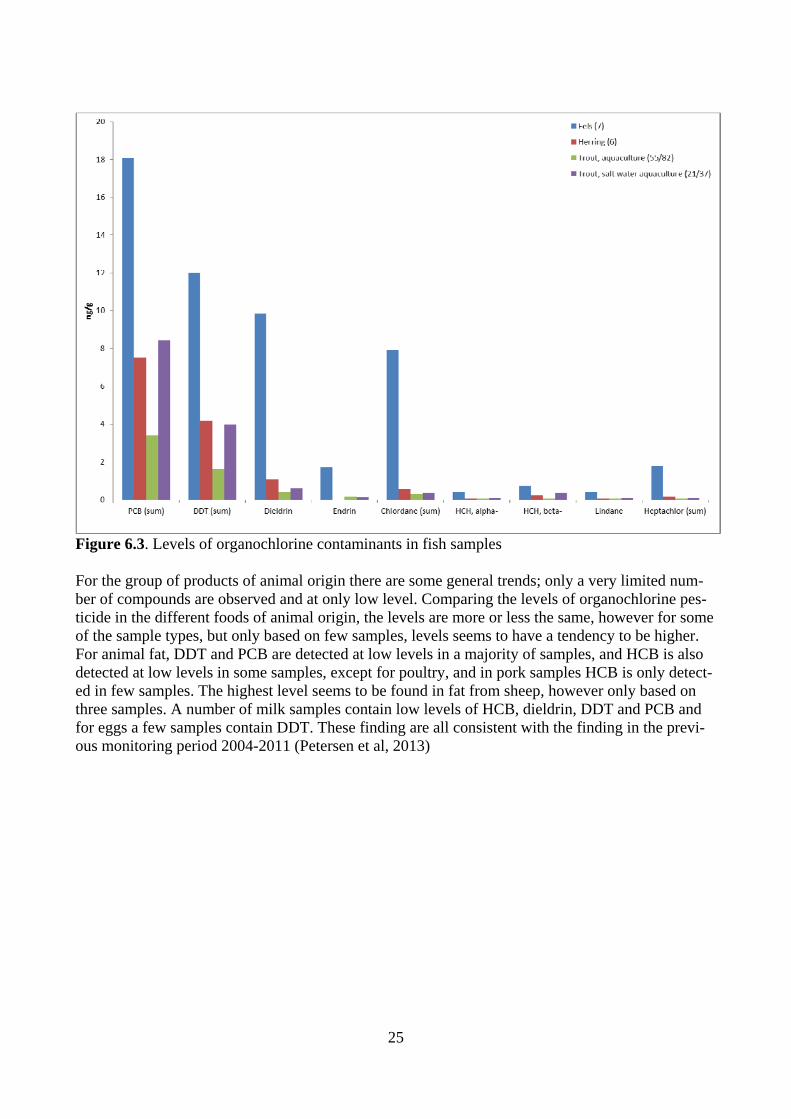
The average levels of the substances analysed in various foods are presented in appendixes 11.5.1 – 11.5.9. The tables show the total number of samples for each of the foodstuffs under study, the number of samples with levels above the detection limits; the average levels of the individual orga-nochlorine compounds, minimum, maximum and median values. The indicator PCB-sum has been calculated as the sum of the averages for the 10 indicator congeners. Calculations of the average levels of the various environmental contaminants in foods are briefly described below. For the environmental contaminants PCB and organochlorine pesticides, it may be assumed that they are present in varying quantities everywhere in the environment. In order to follow the lower levels and to better estimate the dietary intake of the population, all findings have been reported. When calculating the average levels of the various substances, level in samples without positive findings has to be estimated as the level may be zero or it may be just below the limit of detection. For the two previous monitoring periods all values below the limit of detection were set to one-third of the limit of detection in order to use the historical data as well as make it possible to compare the calculations. This calculation method has therefore been used for the data from 2012 as well, how-ever as there in 2013 has been a change of laboratory and analytical method, including other pesti-cides and with other limits of detection, results below the limit of detection were set to zero for 2013, assumed to be the best estimate for the majority of pesticides analysed. Fish samples are the food matrix where the organochlorine contaminants are commonly found. The levels of organochlorine pesticides and indicator PCB in fish depend among other things on the fish species as well as on the water where the fish was caught. The levels of these substances vary ac-cording to the fish species due to the fact that the fatty level of different fish species varies. Differ-ences in the organochlorine levels between the bodies of water may be explained by dif-ferences in the environmental pollution of the waters with organochlorine pesticides and indicator PCB. The present monitoring period does not include additional information on factors concerning the fish, such as their food basis, age and sex. In figure 6.3below the average levels of the organochlorine contaminants in fish samples are shown. The numbers of samples are for eels and herring 7 and 6, respectively. For aquaculture trout and salt water aquaculture trout the number of samples are 82 and 37, respectively, except for HCB and PCB were the number of samples are 55 and 21, respectively. The number of samples for eel and herring are low, however the highest levels are found in eel and the highest levels are found for PCB and DDT. Levels for all the compounds are comparable with the results found and reported in the previously monitoring report covering the period 2004-2011 (Petersen et al., 2013).
25
Figure 6.3. Levels of organochlorine contaminants in fish samples For the group of products of animal origin there are some general trends; only a very limited num-ber of compounds are observed and at only low level. Comparing the levels of organochlorine pes-ticide in the different foods of animal origin, the levels are more or less the same, however for some of the sample types, but only based on few samples, levels seems to have a tendency to be higher. For animal fat, DDT and PCB are detected at low levels in a majority of samples, and HCB is also detected at low levels in some samples, except for poultry, and in pork samples HCB is only detect-ed in few samples. The highest level seems to be found in fat from sheep, however only based on three samples. A number of milk samples contain low levels of HCB, dieldrin, DDT and PCB and for eggs a few samples contain DDT. These finding are all consistent with the finding in the previ-ous monitoring period 2004-2011 (Petersen et al, 2013)
26
7 Polycyclic Aromatic hydrocarbons (PAH) 7.1 Introduction
Polycyclic aromatic hydrocarbons (PAH) constitute a large class of organic chemicals that normally occur in complex mixtures of several hundred compounds. They are composed of two or more aro-matic rings, formed by incomplete combustion of e.g. organic material in industrial processes, waste incineration, and in motor vehicle exhaust. Food can be contaminated from environmental sources and during the processing of foods e.g. drying, smoking and barbecuing. During smoking, drying and barbequing PAH are found bound to particles in the smoke, formed either from the heat-ing source itself (e.g. wood or charcoal burning) or from lipids dripping on the heating source. For non-smokers, food is the main source of human exposure to PAH. 7.2 Methods of sampling, analysis and quality assurance
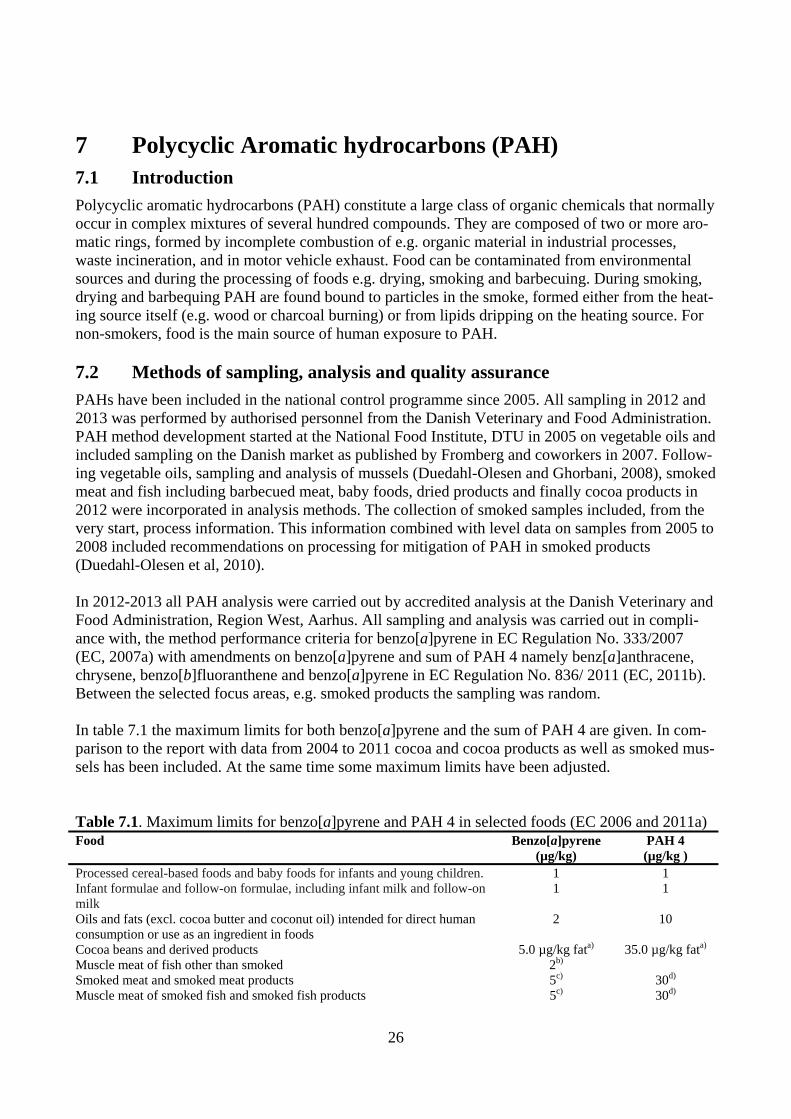
PAHs have been included in the national control programme since 2005. All sampling in 2012 and 2013 was performed by authorised personnel from the Danish Veterinary and Food Administration. PAH method development started at the National Food Institute, DTU in 2005 on vegetable oils and included sampling on the Danish market as published by Fromberg and coworkers in 2007. Follow-ing vegetable oils, sampling and analysis of mussels (Duedahl-Olesen and Ghorbani, 2008), smoked meat and fish including barbecued meat, baby foods, dried products and finally cocoa products in 2012 were incorporated in analysis methods. The collection of smoked samples included, from the very start, process information. This information combined with level data on samples from 2005 to 2008 included recommendations on processing for mitigation of PAH in smoked products (Duedahl-Olesen et al, 2010). In 2012-2013 all PAH analysis were carried out by accredited analysis at the Danish Veterinary and Food Administration, Region West, Aarhus. All sampling and analysis was carried out in compli-ance with, the method performance criteria for benzo[a]pyrene in EC Regulation No. 333/2007 (EC, 2007a) with amendments on benzo[a]pyrene and sum of PAH 4 namely benz[a]anthracene, chrysene, benzo[b]fluoranthene and benzo[a]pyrene in EC Regulation No. 836/ 2011 (EC, 2011b). Between the selected focus areas, e.g. smoked products the sampling was random. In table 7.1 the maximum limits for both benzo[a]pyrene and the sum of PAH 4 are given. In com-parison to the report with data from 2004 to 2011 cocoa and cocoa products as well as smoked mus-sels has been included. At the same time some maximum limits have been adjusted. Table 7.1. Maximum limits for benzo[a]pyrene and PAH 4 in selected foods (EC 2006 and 2011a) Food Benzo[a]pyrene
(µg/kg) PAH 4 (µg/kg )
Processed cereal-based foods and baby foods for infants and young children. 1 1 Infant formulae and follow-on formulae, including infant milk and follow-on milk
1 1
Oils and fats (excl. cocoa butter and coconut oil) intended for direct human consumption or use as an ingredient in foods
2 10
Cocoa beans and derived products 5.0 µg/kg fata) 35.0 µg/kg fata) Muscle meat of fish other than smoked 2b) Smoked meat and smoked meat products 5c) 30d) Muscle meat of smoked fish and smoked fish products 5c) 30d)
27
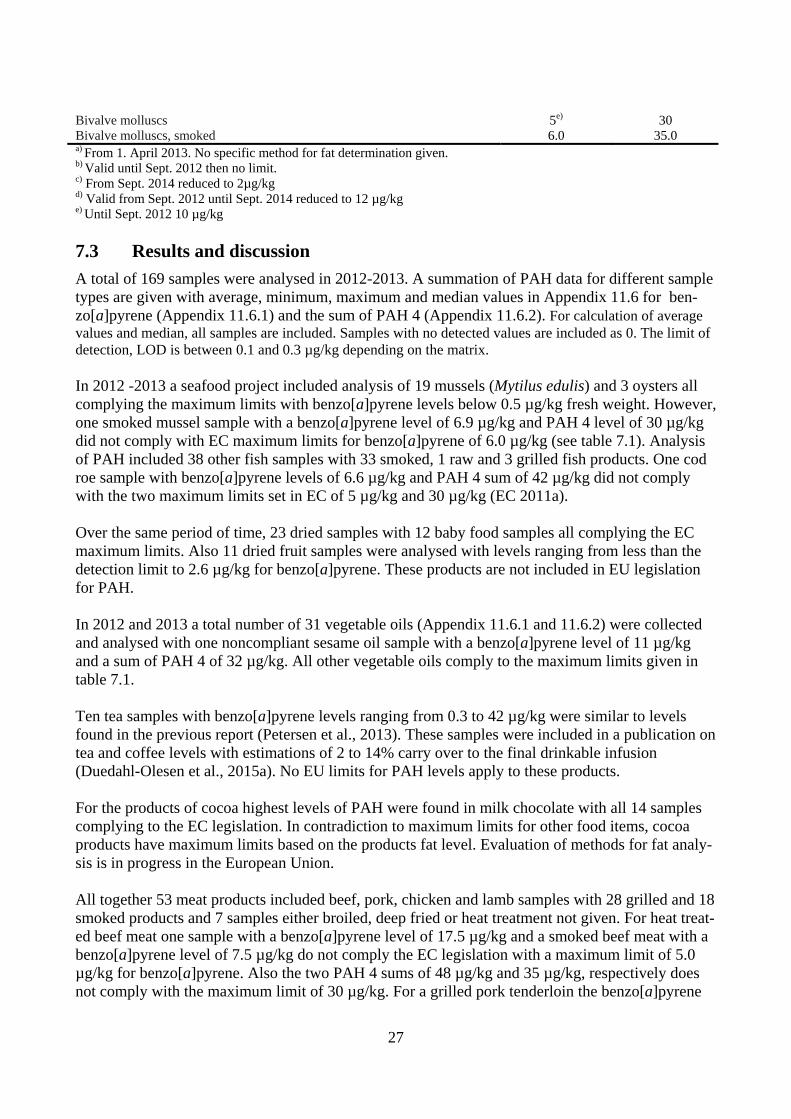
Bivalve molluscs 5e) 30 Bivalve molluscs, smoked 6.0 35.0 a) From 1. April 2013. No specific method for fat determination given. b) Valid until Sept. 2012 then no limit. c) From Sept. 2014 reduced to 2µg/kg d) Valid from Sept. 2012 until Sept. 2014 reduced to 12 µg/kg e) Until Sept. 2012 10 µg/kg 7.3 Results and discussion
A total of 169 samples were analysed in 2012-2013. A summation of PAH data for different sample types are given with average, minimum, maximum and median values in Appendix 11.6 for ben-zo[a]pyrene (Appendix 11.6.1) and the sum of PAH 4 (Appendix 11.6.2). For calculation of average values and median, all samples are included. Samples with no detected values are included as 0. The limit of detection, LOD is between 0.1 and 0.3 µg/kg depending on the matrix. In 2012 -2013 a seafood project included analysis of 19 mussels (Mytilus edulis) and 3 oysters all complying the maximum limits with benzo[a]pyrene levels below 0.5 µg/kg fresh weight. However, one smoked mussel sample with a benzo[a]pyrene level of 6.9 µg/kg and PAH 4 level of 30 µg/kg did not comply with EC maximum limits for benzo[a]pyrene of 6.0 µg/kg (see table 7.1). Analysis of PAH included 38 other fish samples with 33 smoked, 1 raw and 3 grilled fish products. One cod roe sample with benzo[a]pyrene levels of 6.6 µg/kg and PAH 4 sum of 42 µg/kg did not comply with the two maximum limits set in EC of 5 µg/kg and 30 µg/kg (EC 2011a). Over the same period of time, 23 dried samples with 12 baby food samples all complying the EC maximum limits. Also 11 dried fruit samples were analysed with levels ranging from less than the detection limit to 2.6 µg/kg for benzo[a]pyrene. These products are not included in EU legislation for PAH. In 2012 and 2013 a total number of 31 vegetable oils (Appendix 11.6.1 and 11.6.2) were collected and analysed with one noncompliant sesame oil sample with a benzo[a]pyrene level of 11 µg/kg and a sum of PAH 4 of 32 µg/kg. All other vegetable oils comply to the maximum limits given in table 7.1. Ten tea samples with benzo[a]pyrene levels ranging from 0.3 to 42 µg/kg were similar to levels found in the previous report (Petersen et al., 2013). These samples were included in a publication on tea and coffee levels with estimations of 2 to 14% carry over to the final drinkable infusion (Duedahl-Olesen et al., 2015a). No EU limits for PAH levels apply to these products. For the products of cocoa highest levels of PAH were found in milk chocolate with all 14 samples complying to the EC legislation. In contradiction to maximum limits for other food items, cocoa products have maximum limits based on the products fat level. Evaluation of methods for fat analy-sis is in progress in the European Union. All together 53 meat products included beef, pork, chicken and lamb samples with 28 grilled and 18 smoked products and 7 samples either broiled, deep fried or heat treatment not given. For heat treat-ed beef meat one sample with a benzo[a]pyrene level of 17.5 µg/kg and a smoked beef meat with a benzo[a]pyrene level of 7.5 µg/kg do not comply the EC legislation with a maximum limit of 5.0 µg/kg for benzo[a]pyrene. Also the two PAH 4 sums of 48 µg/kg and 35 µg/kg, respectively does not comply with the maximum limit of 30 µg/kg. For a grilled pork tenderloin the benzo[a]pyrene
28
level of 63 µg/kg and PAH 4 sum of 195 µg/kg is far above the EC maximum limits of 5.0 µg/kg and 30 µg/kg for heat treated meat products sold to the consumer (EC 2011a). A statistical differ-ence in PAH level between gas and electric barbecuing compared to flame and coal barbecuing has been reported including these results and results reported in the previous monitoring period 2004-2011 (Duedahl-Olesen et al., 2015b). All together 163 samples according to PAH level were compliant samples corresponding to more than 96 % of all samples.
29
8 Acrylamide 8.1 Introduction
Acrylamide is a genotoxic process contaminant which is formed as part of the Maillard reactions when carbohydrate rich food is heat treated. In 2002, its occurrence in food was identified by Swe-dish researchers who found acrylamide in a range of heat treated foods (Tareke et al., 2002). The original suspicion had arisen when measurements using blood of unexposed control persons con-tained acrylamide haemoglobin adducts; a biomarker for acrylamide exposure (Tareke et al. 2002). The main precursors of the acrylamide formation is the amino acid asparagine and reducing sugars which form Maillard reaction intermediates resulting in acrylamide formation during food heating processes such as frying, roasting, toasting, grilling, etc.. Even autoclaving of e.g. baby food cereals in glass generates acrylamide. 8.2 Methods of sampling, analysis and quality assurance
Since the identification of acrylamide as a food process contaminant it has been monitored and in-vestigated in Danish food products. In 2002 an analytical method based on LC-MS/MS was validat-ed and accredited at DTUFood. In 2009, the method was implemented at the Danish Veterinary and Food Administration in Århus . The method is used to survey and monitor acrylamide occurrence in relevant food products. In 2012-2013mainly coffee, breakfast cereals and potato products were sur-veyed. In 2012 and 2013 different foods (see below) were investigated to monitor the levels in relevant food and to investigate if mitigation measures have lowered the levels. Since 2007 the monitoring has included the food categories recommended by EC (EC 2007b, 2010, 2011f). For the surveys, the foods were sampled from manufacturing, wholesale and catering companies by food inspectors of the Danish Veterinary and Food Administration. 8.3 Results and discussion
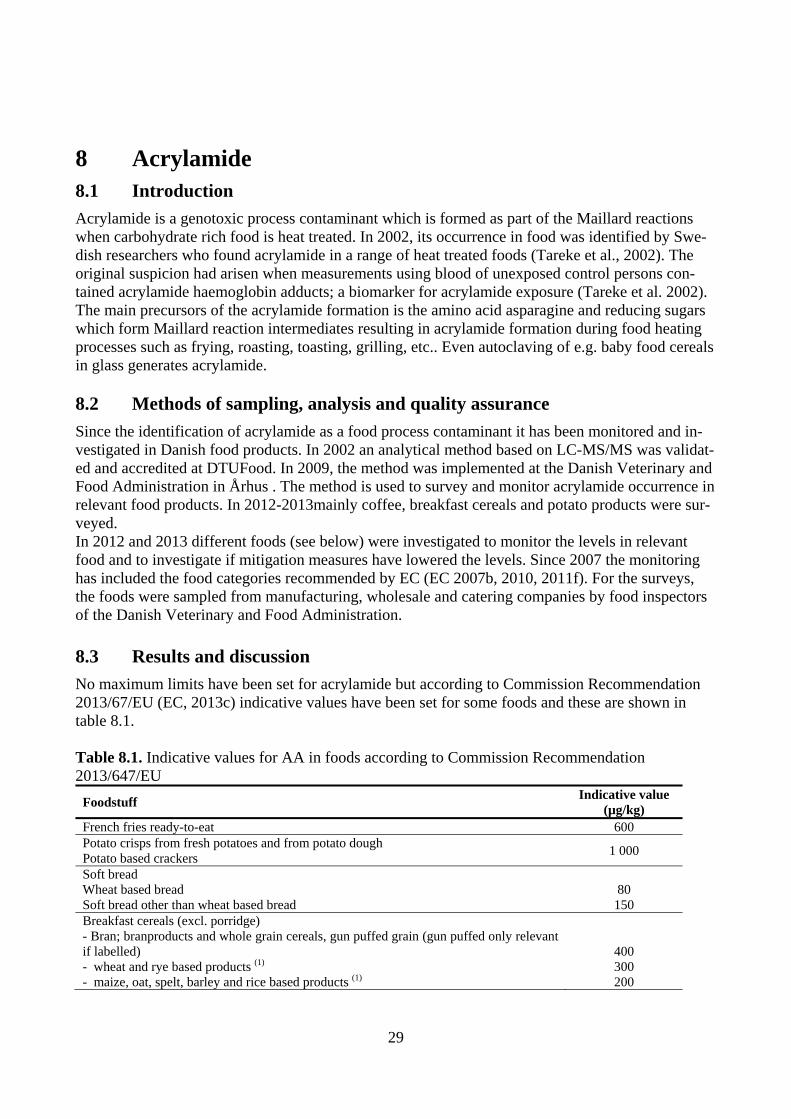
No maximum limits have been set for acrylamide but according to Commission Recommendation 2013/67/EU (EC, 2013c) indicative values have been set for some foods and these are shown in table 8.1. Table 8.1. Indicative values for AA in foods according to Commission Recommendation 2013/647/EU
Foodstuff Indicative value
(µg/kg) French fries ready-to-eat 600 Potato crisps from fresh potatoes and from potato dough Potato based crackers
1 000
Soft bread Wheat based bread Soft bread other than wheat based bread
80
150 Breakfast cereals (excl. porridge) - Bran; branproducts and whole grain cereals, gun puffed grain (gun puffed only relevant if labelled) - wheat and rye based products (1) - maize, oat, spelt, barley and rice based products (1)
400 300 200
30
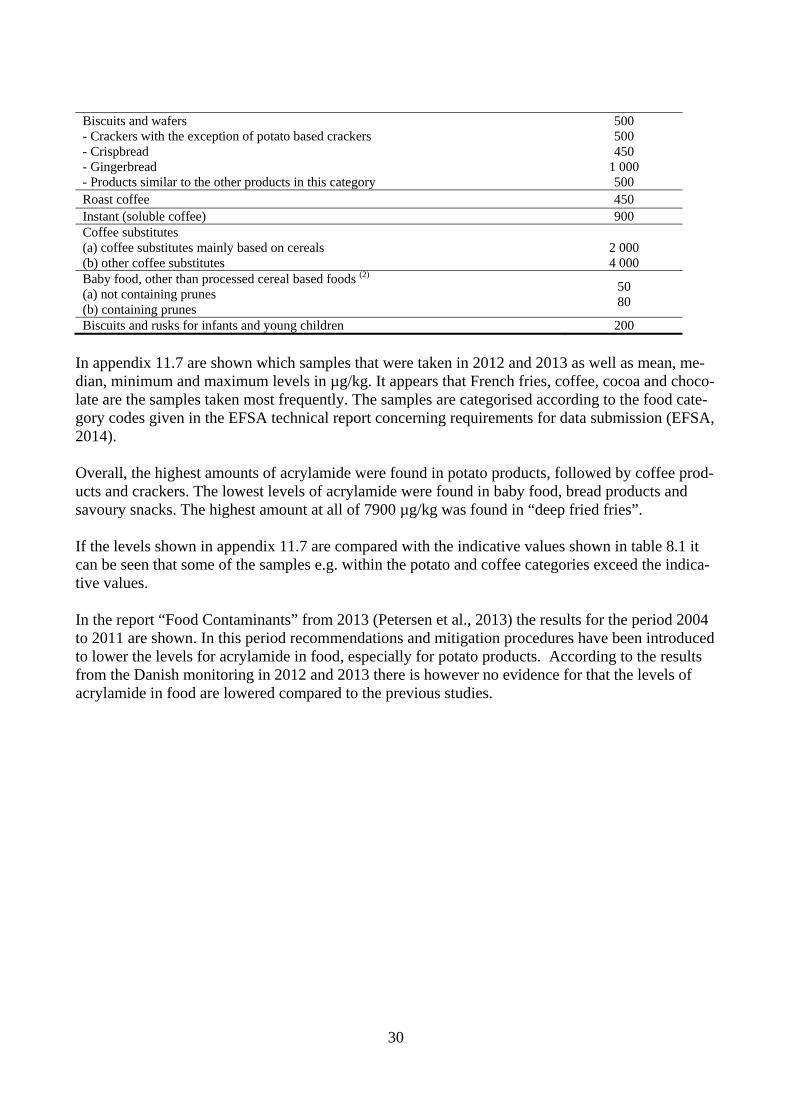
Biscuits and wafers - Crackers with the exception of potato based crackers - Crispbread - Gingerbread - Products similar to the other products in this category
500 500 450
1 000 500
Roast coffee 450 Instant (soluble coffee) 900 Coffee substitutes (a) coffee substitutes mainly based on cereals (b) other coffee substitutes
2 000 4 000
Baby food, other than processed cereal based foods (2) (a) not containing prunes (b) containing prunes
50 80
Biscuits and rusks for infants and young children 200
In appendix 11.7 are shown which samples that were taken in 2012 and 2013 as well as mean, me-dian, minimum and maximum levels in µg/kg. It appears that French fries, coffee, cocoa and choco-late are the samples taken most frequently. The samples are categorised according to the food cate-gory codes given in the EFSA technical report concerning requirements for data submission (EFSA, 2014). Overall, the highest amounts of acrylamide were found in potato products, followed by coffee prod-ucts and crackers. The lowest levels of acrylamide were found in baby food, bread products and savoury snacks. The highest amount at all of 7900 µg/kg was found in “deep fried fries”. If the levels shown in appendix 11.7 are compared with the indicative values shown in table 8.1 it can be seen that some of the samples e.g. within the potato and coffee categories exceed the indica-tive values. In the report “Food Contaminants” from 2013 (Petersen et al., 2013) the results for the period 2004 to 2011 are shown. In this period recommendations and mitigation procedures have been introduced to lower the levels for acrylamide in food, especially for potato products. According to the results from the Danish monitoring in 2012 and 2013 there is however no evidence for that the levels of acrylamide in food are lowered compared to the previous studies.
31
9 Furan 9.1 Introduction
Furan is a process contaminant and, like other process contaminants, such as acrylamide and PAHs, it is formed during the processing of food, either during manufacture or during the final preparation of the meal, including home-cooked meals. Furan is a volatile contaminant found in cooked or thermally processed foods and is formed during Maillard reactions (Maga, 1979). Furan contributes to the flavour properties of the food, but has been shown to be carcinogenic and possibly toxic to reproduction in animal experiments. High levels of furan have been found, especially in canned and jarred ready-to-eat food items, but also in coffee and fried foods (Fromberg et al., 2009). The results presented in this report are from the two food surveys in 2012 and 2013, respectively, which were planned in order to collect sam-ples as described in the EU recommendation on the monitoring of the presence of furan in food-stuffs (EC 2007c, EFSA 2011a, EC, 2011c). The number of results and the number of food items covered are limited, and furthermore it is diffi-cult to obtain appropriate consumption data for processed foods, therefore there is no basis for in-take calculations based on these results. Evaluations made by the Joint FAO/WHO Expert Commit-tee on Food Additives (JECFA) on furan led to estimates for MOEs of 960 for average and 480 for high dietary exposures (JECFA, 2011). 9.2 Methods of sampling, analysis and quality assurance
Samples for the projects are collected from wholesalers, and have been focused on samples of canned and heat treated products, ready-to-eat products, sauces, soups and coffee. 9.3 Results and discussion
Results for furan in food samples are presented in appendix 11.8 showing the number of samples, number of positive samples with detectable level of furan, the calculated average (ng/g), minimum (ng/g) and maximum (ng/g) values and the median (ng/g).
32
Results found in the two surveys are similar to results presented in the previously monitoring report, only ground coffee beans seems to have slightly lower average levels that found in the previously surveys, however still samples with high furan level are found. Furan is a known volatile flavour compound in coffee. The highest level of furan were found in ground coffee beans, probably due to the high temperatures used during the roasting of coffee beans to achieve the desired aroma profile. The levels of furan found in instant coffee were lower. Experiments have shown a transfer of around half (20-100%) of the theoretical furan amount from the coffee to the brewed coffee regard-less of the source (coffee beans or instant coffee). However, lower levels were found in the brewed instant coffee, where only few nano-gram furan per gram brewed instant coffee was observed com-pared to the about 50 ng/g found in brewed coffee when using coffee beans. So even though furan is volatile, a relatively high amount of furan is found in coffee brewed from coffee beans. About 20 ng/g of furan was found in crisps, canned and jarred foods, including infant meals, ready-to-eat meals and sauces.

33
10 References BEK nr. 1256 af 15/12/2011. Bekendtgørelse om forbud mod salg til humant konsum af visse laks og sild, der er fisket eller fanget i Østersøen.
Cederberg TL, Sørensen S, Lund KH, Friis-Wandall S. 2010a. Danish monitoring of dioxins and PCB in food and feed during the years 2000 to 2009 - levels, time trend and human exposure. In Organohalogen Compounds. pp. 952-955.
Cederberg TL, Timm-Heinrich M, Sørensen S, Lund KH. 2010b. Dioxins and PCB in salmon from the southern baltic sea and reduction in levels during processing. In Organohalogen Compounds. pp. 1430-1433.
Cederberg TL, Timm Heinrich M 2007. Trimningseffekt på dioxinindhold i laks II. Lyngby: Dan-marks Tekniske Universitet, Fødevareinstituttet. 28 p.
Cederberg TL, Timm Heinrich M, Willadsen P 2005. Trimningseffekt på dioxinindhold i laks. Sø-borg: Danmarks Fødevareforskning. 29 p.
DVFA, Danish Veterinary and Food Administration, 2005. Food Monitoring 1998-2003, Part 1, Chemical contaminants. Publication No. 2005:01.
DEPA, Danish Environmental Agency 2014. No. 26/63/2014.
Duedahl-Olesen, L., Christensen, J.H., Højgård, A.,Granby, K., and Timm-Heinrich, M. (2010). The influence of smoking parameters on the level of PAHs in Danish smoked fish. Food Additives and Contaminants. 27:1294-1305.
Duedahl-Olesen, L., Ghorbani, F (2008). Optimisation of large volume injection for improved de-tection of Polycyclic Aromatic Hydrocarbons (PAH) in mussels. Polycyclic Aromatic Compounds vol. 28 (4) 282-301.
Duedahl-Olesen, L., Navaratnam, M., Jewula, J., Jensen, A.H. (2015a). PAH in some brands of tea and coffee. Polycyclic Aromatic Compounds. 35: 74-90.
Duedahl-Olesen, L., Aaslyng, M., Meinert, L., Jensen, A.H., Binderup, M-L. (2015b). Polycyclic Aromatic Hydrocarbons (PAH) in Danish barbecued meat" Food Control 57: 169-176.
EC, 1996, Council directive 96/23/EC on measures to monitor certain substances and residues thereof in live animals and animal products repealing Directives 85/358/EEC and 86/469/EEC and Decisions 89/187/EEC and 91/664/EEC. Official Journal of the European Communities L125/10S.
EC, 2006. Commission Regulation No. 1881/2006/EC of 19 December 2006 setting maximum lev-els for certain contaminants in foodstuffs. Official Journal of the European Union L 364:5 – 24.
EC, 2007a. Commission Regulation No. 333/2007/EC of 28 March 2007 laying down the methods of sampling and analysis for the official control of the levels of lead, cadmium, mercury, inorganic tin, 3-MCPD and benzo(a)pyrene in foods. Official Journal of the European Union L 88: 29-38.
34
EC, 2007b. Commission recommendations of 3 May 2007 on the monitoring of Acrylamide levels in food. Official Journal of the European Union, L 123, 12.5.2007, pp.33-39.
EC, 2007c, Commission Regulation (EC) No 199/2006 of 3 February 2006 amending Regulation (EC) No 466/2001 setting maximum levels for certain contaminants in foods as regards dioxins and dioxin-like PCBs.
EC, 2010. Commission recommendations of 2 June 2010 on the monitoring of acrylamide levels in food. Official Journal of the European Union, L 137, 3.6.2010, pp.4-10.
EC, 2011a.Commission Regulation No. 835/2011 of 19 August 2011a amending Regulation (EC) No. 1881/2006 as regards maximum levels for polycyclic aromatic hydrocarbons in foods. Official Journal of the European Union L 215: 4 – 8.
EC, 2011b. Commission Regulation (EU) No.836/2011 of 19 August 2011b amending Regulation (EC) No. 333/2007 laying down the methods of sampling and analysis for the official control of the levels of lead, cadmium, mercury, inorganic tin, 3-MCPD, and benzo(a)pyrene in foods. Official Journal of the European Union L 215:9-16.
EC, 2011c, Commission Regulation (EU) No 1259/2011 of 2 December 2011 amending Regula-tion (EC) No 1881/2006 as regards maximum levels dioxins, dioxin-like PCBs and non dioxin-like PCBs in foodstuffs.
EC, 2011d, Commission Regulation (EU) No 1258/2011 of 2 December 2011 amending Regulation (EC) No 1881/2006 as regards maximum levels for nitrates in foods.
EFSA 2011e. Update on furan levels in food from monitoring years 2004-2010 and exposure as-sessment. EFSA Journal EFSA Journal 2011; 9(9):2347. [33 pp.]. Available online: http://www.efsa.europa.eu/en/efsajournal/pub/2347.htm
EC, 2011f. Commission Recommendation of 11 January 2011 on investigations into the levels of acrylamide in food, C (2010) 9681 final.
EC, 2013a. Commission Recommendation of 27 March 2013 on the presence of T-2 and HT-2 in cereals and cereal products.
EC, 2013b. Council Regulation (EU) No. 1067/2013 of 30 October 2013 amending Regulation (EC) No 1881/2006 as regards maximum levels of the contaminants dioxins, dioxin-like PCBs and non dioxin-like PCBs in liver of terrestrial animals.
EC, 2013c. Commission Recommendation of 8 November 2013 on investigations into the levels of acrylamide in food.
EC, 2014a. Commission Recommendation of 11 September 2014 amending the Annex to Recom-mendation 2013/711/EU on the reduction of the presence of dioxins, furans and PCBs in food and feed.
EC, 2014b. Commission Regulation (EU) No 589/2014 of 2 June 2014 laying down methods of sampling and analysis for the control of levels of dioxins, dioxin-like PCBs and non dioxin-like PCBs in certain foodstuffs and repealing Regulation (EC) No 252/2012.
35
EFSA 2011a,. Update on furan levels in food from monitoring years 2004-2010 and exposure as-sessment. EFSA Journal 2011; 9(9):2347. [33 pp.]. Available online: http://www.efsa.europa.eu/en/efsajournal/pub/2347.htm
EFSA, 2011b. Scientific Opinion on the risks for animal and public health related to the presence of T-2 and HT-2 in food and feed, EFSA Journal 2011; 9(12):2481.
EFSA, 2014, Technical Report, Specific requirements for chemical of contaminants’ data submis-sion, EFSA supporting publication 2014:EN-601
Fries, G.F., Cook, R.M., and Prewitt, L.R., 1978, Distribution of polybrominated biphenyl residues in the tissues of environmentally contaminated dairy cows, J. Dairy Sci. 61, 420-425.
Fries, G.F. and Marrow, G.S., 1977. Distribution of hexachlorobenzene residues in beef steers, J. Animal Sci. 45, 1160.
Fromberg, A., Højgård, A., Duedahl-Olesen, L. (2007). Analysis of polycyclic aromatic hydrocar-bons (PAH) in vegetable oils combining gel permeation chromatography (GPC) with solid phase extraction (SPE) cleanup. Food Additives and Contaminants 24: 758-767.Fromberg, A., Fagt, S. and Granby, K., 2009, SCIENTIFIC REPORT submitted to EFSA. Furan in heat processed food products including home cooked food products and ready-to-eat products. http://www.efsa.europa.eu/fr/scdocs/doc/1e.pdf visited 06-03-2013.
Fødevarestyrelsen 2013. Vejledning til producenter om forebyggelse og håndtering af dioxin/PCB i æg.
JECFA, 2011a.Evaluation of certain food additives and contaminants. Seventy-second report of the joint FAO/WHO expert committee on food additives. WHO technical report series 959.
Lorber, M., Feil, V., Winters, D., and Ferrario, J., 1997. Distribution of dioxins, furans, and copla-nar PCBs in different fat matrices in cattle, Organohalogen compounds, 32, 327
Maga, J.A. (1979). Furans in Foods. Critical Reviews in Food Science and Nutrition 4, 355-400.
11:355–400.
Petersen et al. 2013. Chemical Contaminants 2004-2011, DTU Food, National Food Institute, 3rd edition June 2015
Rumsey, T.S., Putnam, P.A., Davis, R.E., and Corley, C., 1967, Distribution of p,p’-DDT residues in adipose and muscle tissues of beef cattle, J. Agr. Food Chem., 15, 898.
Sørensen, S; Krüger, L.; Bossi, R.; Cederberg, T.L.; Lund, K.H. 2014. Dioxins and PCBs in hen eggs from conventional and free range farms from the Danish control program in 2012-13. 34th International Symposium on Halogenated Persistent Organic Pollutants, Madrid, August 31 to Sep-tember 5, 2014. Organohalogen Compounds vol 76.
Tareke, E., Rydberg, P., Karlsson, P., Eriksson, S. and Tornqvist, M., 2002. Analysis of Acryla-mide, a carcinogen formed in heated foods. Journal of Agricultural and Food Chemistry 50, 4998-

36
5006.
37
11 Appendices 11.1 Appendices to trace elements
11.1.1 Mercury (mg/kg)
Commodity No of samples
Positive Min Max Median Mean
FISH AND SHELL FISH
Cockle (Cardium edule) 2 2 0.011 0.0138 0.013 0.013 Cod (Gadus morhua) 8 8 0.014 0.101 0.040 0.052 Crab (Cancer spp.) 10 10 0.028 0.105 0.041 0.048 Greenland Halibut (Reinhardtius hip-poglossoides)
12 12 0.021 0.103 0.042 0.034
Herring (Clupea ha-rengus)
4 4 0.036 0.075 0.055 0.046
Lobster 2 2 0.061 0.085 0.073 0.073
Lumpsucker (Cyclop-terus lumpus),
4 0 <0.001 <0.001
Mackerel (Scomber scombrus)
1 1 0.074 0.074
Mussel (Mytilus edu-lis)
29 29 0.0044 0.041 0.011 0.019
Norway lobster (Nephrops norvegicus)
2 2 0.053 0.10 0.079 0.079
Oyster 1 1 0.012 0.012
Pangasius 5 4 <0.001 0.0055 0.003 0.003
Plaice (Pleuronectes platessa)
4 4 0.029 0.048 0.033 0.052
Redfish (Sebastes marinus)
2 2 0.062 0.064 0.063 0.063
Saithe (Pollachius virens)
1 1 0.14 0.14
Salmon (Salmo salar) 2 2 0.0105 0.036 0.023 0.023
Scallop 19 19 0.0034 0.023 0.016 0.016 Shrimps, cold water 44 44 0.0076 0.18 0.029 0.033 Shrimps, varm water 34 33 <0.001 0.021 0.008 0.009
Shrimps, warm water shrimps, breaded
1 1 0.0029 0.029
Sole (Solea solea) 1 1 0.072 0.072 Tilapia 10 10 0.0078 0.012 0.010 0.010
Trout (Oncorhynchus mykiss), aquaculture
10 10 0.0114 0.023 0.017 0.017
Tuna (Thunnus) 1 1 0.33 0.33
Tuna in oil, canned 5 5 0.043 0.9 0.16 0.41 Tuna in tomato, can-ned
1 1 0.018 0.018
Tuna in water, canned 6 6 0.044 0.80 0.20 0.46

38
Commodity No of samples
Positive Min Max Median Mean
MEAT AND MEAT PRODUCTS
Chicken meat 90 0 <0.0007 <0.0007 Deer meat, farmed 5 0 <0.0007 <0.0007 Deer meat, wild 2 0 <0.0007 <0.0007
Duck meat (wild duck) 12 10 <0.0007 0.042 0.0065
Horse meat 6 0 <0.0007 <0.0007
Ostrich meat (Struthio camelus)
4 0 <0.0007 <0.0007
Pheasant meat (Phasi-anus colchius)
1 0 <0.0007 <0.0007
Pig kidney 10 2 <0.0007 0.0028 <0.0007
Pig liver 13 0 <0.0007 <0.0007
Pig meat 94 0 <0.0007 <0.0007
Pigeon meat (Columba spp.)
5 0 <0.0007 <0.0007
Sheep meat 6 0 <0.0007 <0.0007 Veal liver 12 1 <0.0007 0.0059
Honey 39 0 <0.017 <0.017
Buttermilk 4 0 <0.0007 <0.0007
Cow milk, 1 - 2.9% fat (semi-skimmed milk)
2 0 <0.0007 <0.0007
Cow milk, < 1% fat (skimmed milk)
4 0 <0.0007 <0.0007
Cow milk, >3% fat (whole milk)
2 0 <0.0007 <0.0007
39
11.1.2 Lead (mg/kg, except for water, µg/L)
Commodity No of samples
Positive Min Max Median Mean
FISH AND SHELL FISH
Cockle (Cardium edu-le)
2 2 0.134 0.176 0.155 0.155
Cod (Gadus morhua) 8 0 0 <0.003 Crab (Cancer spp.) 10 4 <0.003 0.0226 <0.003 <0.003 Greenland Halibut (Reinhardtius hip-poglossoides)
12 0 <0.003 <0.003
Halibut (Hippoglossus hippoglossus)
1 0 <0.002 <0.002
Herring (Clupea ha-rengus)
4 0 <0.002 <0.002
Lobster 2 2 0.014 0.063 0.039 0.28
Lumpsucker (Cyclop-terus lumpus), roe
4 0 <0.003 <0.003 <0.003 <0.003
Mackerel (Scomber scombrus)
1 1 0.048 0.048
Mussel (Mytilus edu-lis)
29 29 0.048 0.23 0.152 0.143
Norway lobster (Nephrops norvegicus)
2 2 0.0103 0.0181 0.0142 0.0142
Oyster 1 1 0.061 0.061
Pangasius 5 0 <0.006 <0.006
Plaice (Pleuronectes platessa)
4 0 <0.002 <0.002
Redfish (Sebastes marinus)
2 0 <0.003 <0.003
Saithe (Pollachius virens)
1 0 <0.002 <0.002
Salmon (Salmo salar) 2 0 <0.003 <0.003 Scallop 19 14 <0.003 0.016 <0.003 0.010 Shrimps, cold water sh 44 1 <0.003 <0.003
Shrimps, varm water 34 8 <0.006 0.051 <0.006 <0.006
Shrimps, breaded 1 0 <0.0056 <0.0056 Sole (Solea solea) 1 1 0.0060 0.0060
Tilapia 10 0 <0.006 <0.006
Trout (Oncorhynchus mykiss), aquaculture
10 0 <0.003 <0.003
Tuna (Thunnus) 1 0 <0.003 <0.003 Tuna in oil, canned 5 0 <0.003 <0.003
Tuna in tomato, can-ned
1 0 <0.003 <0.003
Tuna in water, canned 6 0 <0.003 <0.003
MEAT AND MEAT PRODUCTS
Chicken meat 90 0 <0.003 <0.003
Deer meat, farmed 5 0 <0.003 <0.003
40
Commodity No of samples
Positive Min Max Median Mean
Deer meat, wild 3 0 <0.003 <0.003
Duck meat (wild duck) 15 7 <0.003 0.26 <0.003
Horse meat 6 0 <0.003 <0.003
Ostrich meat (Struthio camelus)
4 0 <0.003 <0.003
Pheasant meat (Phasi-anus colchius)
7 0 <0.003 <0.003
Pig kidney 10 0 <0.003 <0.003
Pig liver 13 0 <0.003 <0.003 Pork meat 94 5 <0.003 0.021 <0.003 Pigeon meat (Columba spp.)
8 3 <0.003 0.181 <0.003
Sheep meat 6 0 <0.003 <0.003 Veal liver 12 4 <0.003 0.037 0.0071
Honey 39 9 <0.001 1.1 <0.0004
Buttermilk 4 0 <0.003 <0.003
Cow milk, 1 - 2.9% fat (semi-skimmed milk)
2 0 <0.003 <0.003
Cow milk, < 1% fat (skimmed milk)
4 0 <0.003 <0.003
Cow milk, >3% fat (whole milk)
2 0 <0.003 <0.003
WATER (µg/L)
Tap water 43 31 <0.02 2.4 0.18
Tap water, iced 3 3 0.37 0.97 0.76
Water, production 6 5 <0.02 2.0 0.37
41
11.1.3 Cadmium (mg/kg except for water, µg/L)
Commodity No of samples
Positive Min Max Median Mean
FISH AND SHELL FISH Cockle (Cardium edule) 2 2 0.032 0.0351 0.034 0.034 Cod (Gadus morhua) 8 0 <0.001 <0.001 Crab (Cancer spp.) 10 10 0.0068 0.03 0.010 0.013 Greenland Halibut (Rein-hardtius hippoglossoides)
12 0 <0.001 <0.001
Halibut (Hippoglossus hip-poglossus)
1 0 <0.0007 <0.0007
Herring (Clupea harengus) 4 2 <0.0007 0.068 0.002 0.003
Lobster 2 2 0.017 0.023 0.020 0.020
Lumpsucker (Cyclopterus lumpus), roe
4 0 <0.001 <0.001
Mackerel (Scomber scom-brus)
1 0 <0.001 <0.001
Mussel (Mytilus edulis) 28 28 0.072 0.15 0.09 0.11
Norway lobster (Nephrops norvegicus)
2 2 0.0099 0.073 0.041 0.041
Oyster 1 1 0.42 0.42
Pangasius 5 0 <0.002 <0.002
Plaice (Pleuronectes platessa) 4 0 <0.0007 <0.0007
Redfish (Sebastes marinus) 2 2 <0.001 <0.001 <0.001 <0.001
Saithe (Pollachius virens) 1 0 <0.0007 <0.0007
Salmon (Salmo salar) 2 0 <0.002 <0.002 Scallop 19 19 0.12 0.47 0.32 0.30 Shrimps, cold water 44 44 0.004 0.128 0.016 0.028
Shrimps, varm water 34 0 <0.004 <0.004
Shrimps, breaded 1 0 <0.024 <0.024 Sole (Solea solea) 1 0 <0.0007 <0.0007
Tilapia 10 0 <0.004 <0.004
Trout (Oncorhynchus my-kiss), aquaculture
10 0 <0.001 <0.001
Tuna (Thunnus) 1 1 0.016 0.016 Tuna in oil, canned 5 5 0.011 0.031 0.021 0.020
Tuna in tomato, canned 1 1 0.017 0.017
Tuna in water, canned 6 5 <0.001 0.048 0.024 0.024
MEAT AND MEAT PRO-DUCTS
Chicken meat 90 0 <0.003 <0.003 Deer meat, farmed 5 0 <0.003 <0.003 Deer meat, wild 3 0 <0.003 <0.003
Duck meat (wild duck) 15 1 <0.003 0.014 <0.003 <0.003
Horse meat 6 6 <0.002 0.092 0.0188 0.031
Ostrich meat (Struthio came- 4 0 <0.003 <0.003

42
Commodity No of samples
Positive Min Max Median Mean
lus)
Pheasant meat (Phasianus colchius)
7 0 <0.003 <0.003
Pig kidney 10 9 0.093 0.19 0.16 0.152
Pig liver 13 13 0.020 0.058 0.03 0.032
Pig meat 94 0 <0.003 <0.09 0.034
Pigeon meat (Columba spp.) 8 3 <0.09 0.24 0.0016 0.032
Sheep meat 6 0 <0.003 <0.003 Veal liver 12 12 0.010 0.057 0.015 0.019
Honey 39 0 <0.003 <0.003
Buttermilk 4 0 <0.003 <0.003 Cow milk, 1 - 2.9% fat (semi-skimmed milk)
2 0 <0.003 <0.003
Cow milk, < 1% fat (skimmed milk)
4 0 <0.003 <0.003
Cow milk, >3% fat (whole milk)
2 0 <0.003 <0.003
WATER (µg/L) Tap water 43 4 <0.01 0.063 <0.01 <0.01
Tap water, iced 3 0 <0.01 <0.01 Water, production 6 0 <0.01 <0.01

43
11.1.4 Inorganic arsenic (mg/kg)
Commodity No of samples
Positive Min Max Median Mean
BREAKFAST CE-REALS Puffed, organic 3 2 <0.01 0.097 0.084 0.061 Puffed 6 5 <0.01 0.14 0.091 0.080 FISH AND SHELL FISH
Cockle (Cardium edule)
2 0 <0.03 <0.03
Cod (Gadus morhua) 3 0 <0.03 <0.03
Halibut (Hippoglos-sus hippoglossus)
1 0 <0.03 <0.03
Herring (Clupea harengus)
4 0 <0.03 <0.03
Lobster 2 0 <0.03 <0.03
Mussel (Mytilus edulis)
19 9 0.0012 0.058 0.022 0.023
Norway lobster (Nephrops norvegi-cus)
2 2 0.015 0.021 0.018 0.018
Oyster 3 1 0.021 <0.03 0.021 0.021
Plaice (Pleuronectes platessa)
4 0 <0.02 <0.02
Saithe (Pollachius virens)
1 0 <0.03 <0.03
Shrimps, cold water 2 0 <0.03 <0.03
Sole (Solea solea) 1 0 <0.02 <0.02
INFANT FOOD Infant food, cereal-based, powder
9 6 <0.01 0.22 0.034 0.063
Infant food, ready-to-eat, canned
9 0 <0.01 <0.01
RICE AND RICE PRODUCTS
Rice cake (puffed), organic
12 12 0.18 0.35 0.23 0.24
Rice cake (puffed) 12 11 <0.01 0.27 0.21 0.19
Rice cake (puffed), with quinoa, organic
3 3 0.18 0.34 0.31 0.28
Rice drink 5 1 <0.01 0.032 <0.01 <0.01 Rice flour 5 5 0.041 0.074 0.07 0.06
Rice flour, whole-meal, organic
2 2 0.17 0.30 0.24 0.24
Rice, brown, organic 11 10 <0.01 0.55 0.14 0.17
Rice, brown 10 9 <0.01 0.3 0.12 0.13
Rice, short grained, organic
4 4 0.083 0.093 0.090 0.090
Rice, short grained 6 6 0.085 0.11 0.10 0.10
44
Commodity No of samples
Positive Min Max Median Mean
Rice, white, organic 11 9 <0.01 0.14 0.08 0.07
Rice, white 57 45 <0.01 0.22 0.06 0.06
Noodles 7 5 <0.01 0.15 0.047 0.060
OTHER CEREALS
Crispbread, rye 4 1 <0.01 0.045 <0.01 0.029
Müsli 2 2 0.17 0.25 0.21 0.21
MISCELLANOUS FOOD
Dietary supplement 5 4 <0.01 0.093 0.068 0.058 Snacks 10 5 <0.01 0.063 <0.01 0.033

45
11.1.5 Total arsenic (mg/kg, except for water, µg/L)
Commodity No of samples
Positive Min Max Median Mean
BREAKFAST CE-REALS
Puffed, organic 3 3 <0.008 0.13 0.12 0.089 Puffed 6 6 0.069 0.18 0.11 0.11 FISH AND SHELL FISH
Cockle (Cardium edule)
2 2 0.83 0.96 0.90 0.90
Cod (Gadus morhua) 3 3 3.8 18 5.8 9.2
Halibut (Hippoglos-sus hippoglossus)
1 1 27 27
Herring (Clupea harengus)
4 4 1.2 1.8 1.5 1.5
Lobster 2 2 11 14 12 12
Mussel (Mytilus edulis)
19 19 0.72 1.5 1.1 1.1
Norway lobster (Nephrops norvegi-cus)
2 2 12 13.5 13 13
Oyster 1 1 0.87 0.87
Plaice (Pleuronectes platessa)
4 4 1.2 1.8 9.6 9.6
Saithe (Pollachius virens)
1 1 1.7 1.7
Shrimps, cold water 2 2 16 18 17 17
Sole (Solea solea) 1 1 6.5 6.5
INFANT FOOD Infant food, cereal-based, powder
9 8 <0.008 0.25 0.06 0.090
Infant food, ready-to-eat, canned
9 2 <0.008 0.064 <0.008 <0.008
RICE AND RICE PRODUCTS
Rice cake (puffed), organic
12 12 0.25 0.39 0.28 0.29
Rice cake (puffed) 12 12 0.030 0.33 0.26 0.24
Rice cake (puffed), with quinoa, organic
3 3 0.20 0.42 0.41 0.34
Rice drink 5 1 <0.008 0.037 <0.008 <0.008
Rice flour 5 5 0.072 0.20 0.087 0.11
Rice flour, whole-meal, organic
2 2 0.19 0.34 0.26 0.26
Rice, brown, organic 11 10 <0.008 0.7 0.18 0.24
Rice, brown 10 9 <0.008 0.32 0.18 0.18
Rice, short grained, organic
4 4 0.097 0.12 0.12 0.11

46
Commodity No of samples
Positive Min Max Median Mean
Rice, short grained 6 6 0.13 0.24 0.15 0.17
Rice, white, organic 11 11 <0.008 0.19 0.11 0.10
Rice, white 57 56 <0.008 0.27 0.095 0.10
Noodles, rice 7 7 0.035 0.37 0.090 0.12
OTHER CEREALS
Crispbread, rye 4 4 0.045 0.12 0.069 0.075
Müsli 2 2 0.19 0.32 0.26 0.26
MISCELLANOUS FOOD
Dietary supplement 5 5 0.049 0.23 0.16 0.15 Snacks 10 9 <0.008 0.12 <0.008 0.068
WATER (µg/L)
Tap water 43 34 <0.04 2.0 0.36 0.60
Tap water, iced 3 0 <0.04 <0.04 <0.04 <0.04
Water, production 6 6 0.31 1.2 0.37 0.62

47
11.1.6 Aluminium, copper, selenium,tin and zinc (mg/kg, except for water, µg/L)
Commodity No of samples
Positive Min Max Median Mean
Aluminium
Noodles 21 21 3.0 8.0 5.1 5.2
Selenium
Trout (Oncorhynchus mykiss), aquaculture
10 10 0.11 0.16 0.13 0.13
Tin
Tuna in oil, canned 1 0 <4 <4 Tuna in water, can-ned
7 0 <4 <4
Copper (µg/L)
Tap water 43 33 <0.3 150 9.4 2.4
Tap,water, iced 3 3 12 28 21 22
Water, production 6 5 <0.3 6.9 3.8 1.8
Zinc (µg/L)
Tap water 43 41 <0.4 750 21 142
Tap water, iced 3 3 24 126 80 234
Water, production 6 6 3.4 341 22 81

48
11.2 Nitrate (mg/kg)
Foods
No. of samples Min Max Mean Median
Spring onions 2 220 600 410 410
Beet root 3 2900 3800 3267 3100
Head lettuce 4 800 1300 1100 1200
Rucola, Danish 10 2100 6000 4210 4250
Rucola, foreign origin 26 2800 9600 6400 6300
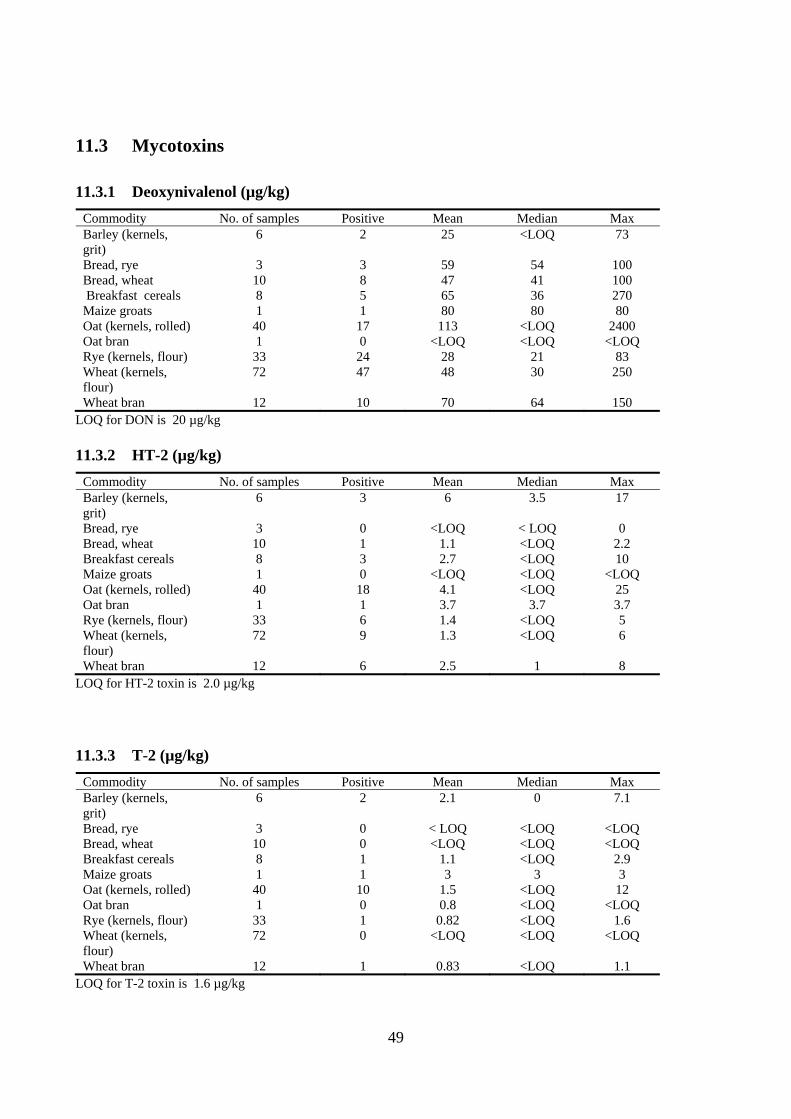
49
11.3 Mycotoxins
11.3.1 Deoxynivalenol (µg/kg)
Commodity No. of samples Positive Mean Median Max Barley (kernels, grit)
6 2 25 <LOQ 73
Bread, rye 3 3 59 54 100 Bread, wheat 10 8 47 41 100 Breakfast cereals 8 5 65 36 270 Maize groats 1 1 80 80 80 Oat (kernels, rolled) 40 17 113 <LOQ 2400 Oat bran 1 0 <LOQ <LOQ <LOQ Rye (kernels, flour) 33 24 28 21 83 Wheat (kernels, flour)
72 47 48 30 250
Wheat bran 12 10 70 64 150 LOQ for DON is 20 µg/kg 11.3.2 HT-2 (µg/kg)
Commodity No. of samples Positive Mean Median Max Barley (kernels, grit)
6 3 6 3.5 17
Bread, rye 3 0 <LOQ < LOQ 0 Bread, wheat 10 1 1.1 <LOQ 2.2 Breakfast cereals 8 3 2.7 <LOQ 10 Maize groats 1 0 <LOQ <LOQ <LOQ Oat (kernels, rolled) 40 18 4.1 <LOQ 25 Oat bran 1 1 3.7 3.7 3.7 Rye (kernels, flour) 33 6 1.4 <LOQ 5 Wheat (kernels, flour)
72 9 1.3 <LOQ 6
Wheat bran 12 6 2.5 1 8 LOQ for HT-2 toxin is 2.0 µg/kg 11.3.3 T-2 (µg/kg)
Commodity No. of samples Positive Mean Median Max Barley (kernels, grit)
6 2 2.1 0 7.1
Bread, rye 3 0 < LOQ <LOQ <LOQ Bread, wheat 10 0 <LOQ <LOQ <LOQ Breakfast cereals 8 1 1.1 <LOQ 2.9 Maize groats 1 1 3 3 3 Oat (kernels, rolled) 40 10 1.5 <LOQ 12 Oat bran 1 0 0.8 <LOQ <LOQ Rye (kernels, flour) 33 1 0.82 <LOQ 1.6 Wheat (kernels, flour)
72 0 <LOQ <LOQ <LOQ
Wheat bran 12 1 0.83 <LOQ 1.1 LOQ for T-2 toxin is 1.6 µg/kg
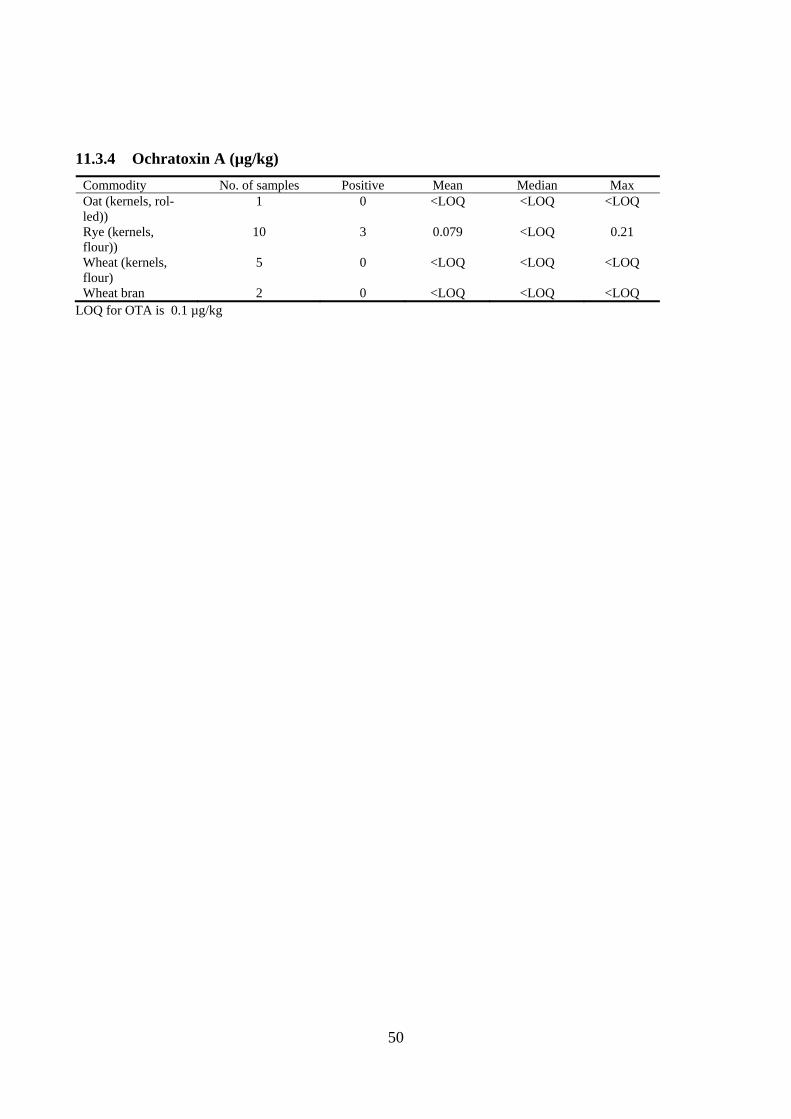
50
11.3.4 Ochratoxin A (µg/kg)
Commodity No. of samples Positive Mean Median Max Oat (kernels, rol-led))
1 0 <LOQ <LOQ <LOQ
Rye (kernels, flour))
10 3 0.079 <LOQ 0.21
Wheat (kernels, flour)
5 0 <LOQ <LOQ <LOQ
Wheat bran 2 0 <LOQ <LOQ <LOQ LOQ for OTA is 0.1 µg/kg
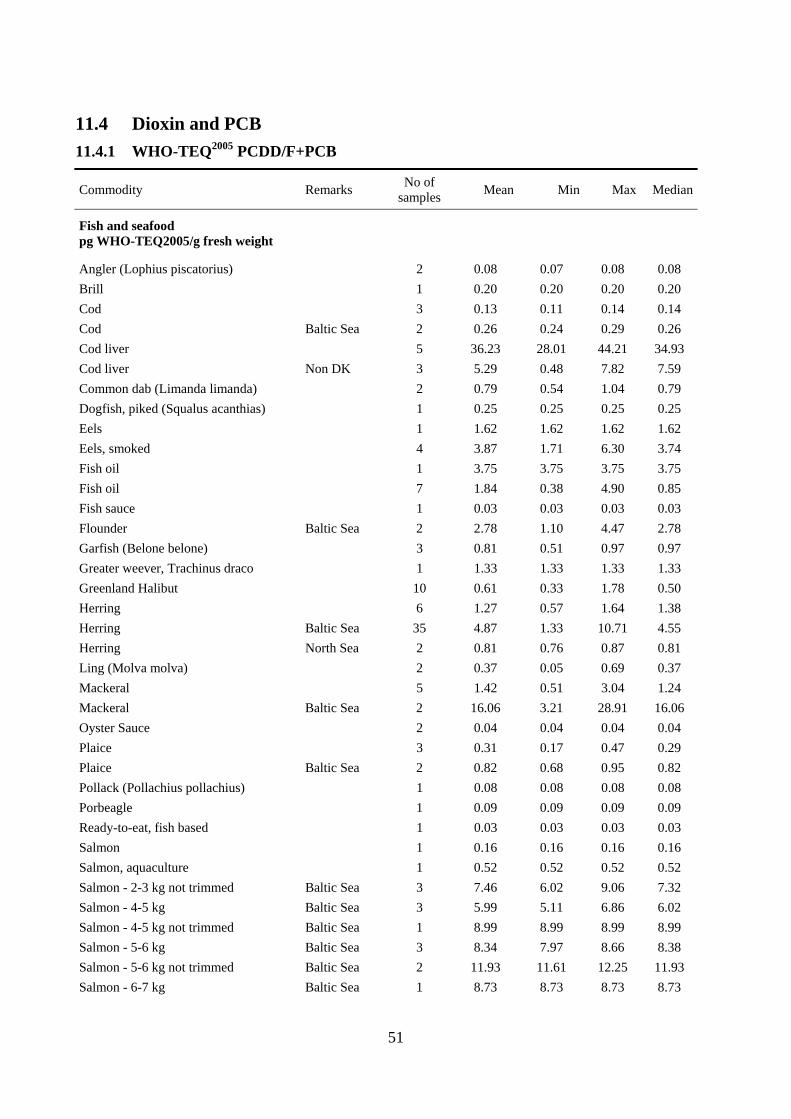
51
11.4 Dioxin and PCB
11.4.1 WHO-TEQ2005 PCDD/F+PCB
Commodity Remarks No of
samples Mean Min Max Median
Fish and seafood pg WHO-TEQ2005/g fresh weight
Angler (Lophius piscatorius) 2 0.08 0.07 0.08 0.08
Brill 1 0.20 0.20 0.20 0.20
Cod 3 0.13 0.11 0.14 0.14
Cod Baltic Sea 2 0.26 0.24 0.29 0.26
Cod liver 5 36.23 28.01 44.21 34.93
Cod liver Non DK 3 5.29 0.48 7.82 7.59
Common dab (Limanda limanda) 2 0.79 0.54 1.04 0.79
Dogfish, piked (Squalus acanthias) 1 0.25 0.25 0.25 0.25
Eels 1 1.62 1.62 1.62 1.62
Eels, smoked 4 3.87 1.71 6.30 3.74
Fish oil 1 3.75 3.75 3.75 3.75
Fish oil 7 1.84 0.38 4.90 0.85
Fish sauce 1 0.03 0.03 0.03 0.03
Flounder Baltic Sea 2 2.78 1.10 4.47 2.78
Garfish (Belone belone) 3 0.81 0.51 0.97 0.97
Greater weever, Trachinus draco 1 1.33 1.33 1.33 1.33
Greenland Halibut 10 0.61 0.33 1.78 0.50
Herring 6 1.27 0.57 1.64 1.38
Herring Baltic Sea 35 4.87 1.33 10.71 4.55
Herring North Sea 2 0.81 0.76 0.87 0.81
Ling (Molva molva) 2 0.37 0.05 0.69 0.37
Mackeral 5 1.42 0.51 3.04 1.24
Mackeral Baltic Sea 2 16.06 3.21 28.91 16.06
Oyster Sauce 2 0.04 0.04 0.04 0.04
Plaice 3 0.31 0.17 0.47 0.29
Plaice Baltic Sea 2 0.82 0.68 0.95 0.82
Pollack (Pollachius pollachius) 1 0.08 0.08 0.08 0.08
Porbeagle 1 0.09 0.09 0.09 0.09
Ready-to-eat, fish based 1 0.03 0.03 0.03 0.03
Salmon 1 0.16 0.16 0.16 0.16
Salmon, aquaculture 1 0.52 0.52 0.52 0.52
Salmon - 2-3 kg not trimmed Baltic Sea 3 7.46 6.02 9.06 7.32
Salmon - 4-5 kg Baltic Sea 3 5.99 5.11 6.86 6.02
Salmon - 4-5 kg not trimmed Baltic Sea 1 8.99 8.99 8.99 8.99
Salmon - 5-6 kg Baltic Sea 3 8.34 7.97 8.66 8.38
Salmon - 5-6 kg not trimmed Baltic Sea 2 11.93 11.61 12.25 11.93
Salmon - 6-7 kg Baltic Sea 1 8.73 8.73 8.73 8.73

52
Commodity Remarks No of
samples Mean Min Max Median
Salmon - 6-7 kg not trimmed Baltic Sea 1 13.65 13.65 13.65 13.65
Salmon - 7-8 kg Baltic Sea 2 9.20 9.04 9.36 9.20
Salmon - 8-9 kg Baltic Sea 2 8.80 8.67 8.93 8.80
Salmon - 9-10 kg Baltic Sea 2 8.16 7.96 8.36 8.16
Salmon - 9-10 kg not trimmed Baltic Sea 1 14.13 14.13 14.13 14.13
Salmon - 10-11 kg Baltic Sea 1 9.71 9.71 9.71 9.71
Salmon - 11-12 kg Baltic Sea 1 8.61 8.61 8.61 8.61
Sea catfish and wolf-fish (Anarhichas) 3 0.53 0.21 0.99 0.39
Sprat 4 1.67 1.37 2.15 1.59
Sprat Baltic Sea 8 4.94 2.30 7.19 4.70
Trout, aquaculture 30 0.31 0.15 0.67 0.29
Tuna, canned in oil 1 0.04 0.04 0.04 0.04
Tuna, canned in water 1 0.05 0.05 0.05 0.05
Turbot 4 0.99 0.08 3.13 0.37
Food other than fish pg WHO-TEQ2005/g fat
Beef meat 2 0.57 0.55 0.60 0.57
Cheese, goat, 45-55% fat in dry matter 1 0.66 0.66 0.66 0.66
Chicken meat 8 0.58 0.23 1.39 0.38
Cow milk, raw 5 0.59 0.41 0.95 0.51
Cow milk, raw on grass 16 0.50 0.33 0.70 0.50
Cow milk, raw kept inside 19 0.53 0.26 1.20 0.46
Duck meat, steak (air or oil) 1 0.29 0.29 0.29 0.29
Egg, whole, chicken 12 0.29 0.18 0.61 0.27
Egg, whole, chicken not caged 47 0.87 0.26 2.19 0.74
Egg, whole, chicken free range 57 2.65 0.24 12.09 1.86
Fat, beef (leaf fat) 104 0.63 0.14 3.74 0.40
Fat, beef (leaf fat) free range 68 0.84 0.23 4.17 0.66
Fat, buffalo (leaf fat) 5 1.46 0.97 1.93 1.43
Fat, chicken (belly fat) 10 0.28 0.10 0.70 0.26
Fat, chicken (belly fat) free range 5 0.52 0.22 1.21 0.38
Fat, horse (leaf fat) 4 5.18 1.69 9.81 4.61
Fat, lamb (leaf fat) 8 0.83 0.33 1.39 0.82
Fat, pork (leaf fat) 117 0.20 0.05 0.81 0.17
Fat, pork (leaf fat) free range 57 0.24 0.11 0.60 0.21
Fat, sheep (leaf fat) 11 0.85 0.39 1.29 0.86
Infant formulae, powder 3 0.08 0.06 0.09 0.09
Ready-to-eat meal for infants and young children, canned 2 0.02 0.02 0.03 0.02
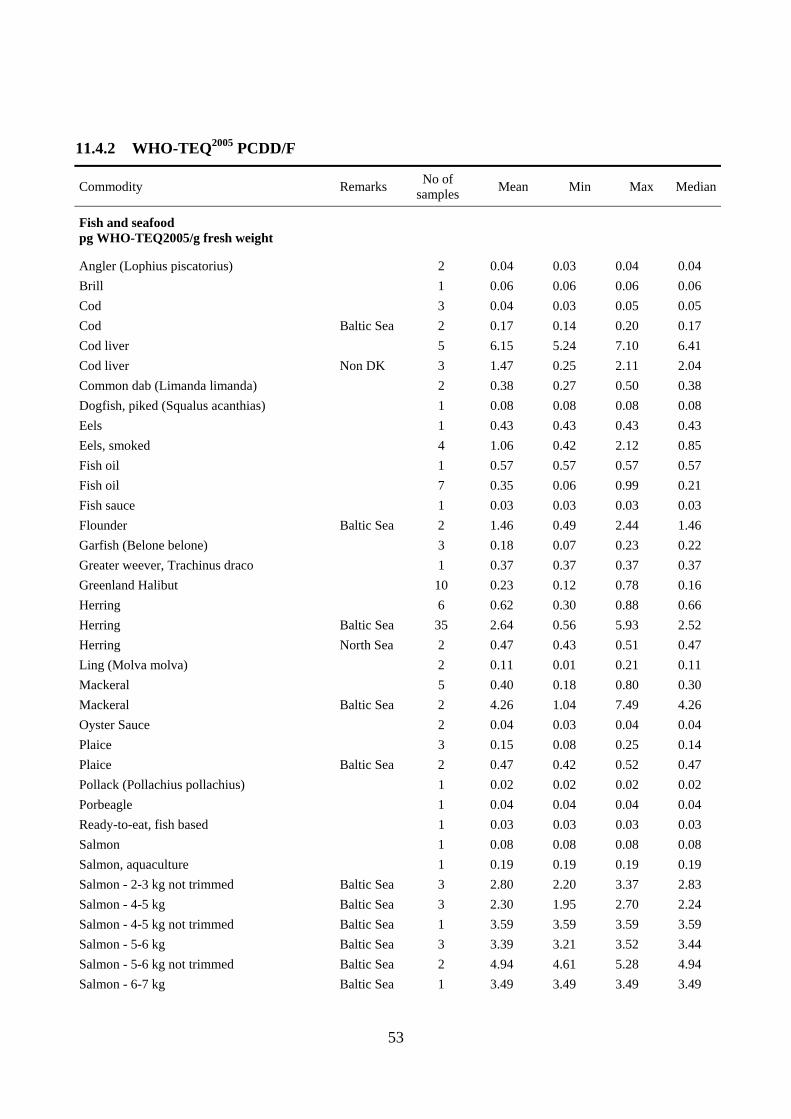
53
11.4.2 WHO-TEQ2005 PCDD/F
Commodity Remarks No of
samples Mean Min Max Median
Fish and seafood pg WHO-TEQ2005/g fresh weight
Angler (Lophius piscatorius) 2 0.04 0.03 0.04 0.04
Brill 1 0.06 0.06 0.06 0.06
Cod 3 0.04 0.03 0.05 0.05
Cod Baltic Sea 2 0.17 0.14 0.20 0.17
Cod liver 5 6.15 5.24 7.10 6.41
Cod liver Non DK 3 1.47 0.25 2.11 2.04
Common dab (Limanda limanda) 2 0.38 0.27 0.50 0.38
Dogfish, piked (Squalus acanthias) 1 0.08 0.08 0.08 0.08
Eels 1 0.43 0.43 0.43 0.43
Eels, smoked 4 1.06 0.42 2.12 0.85
Fish oil 1 0.57 0.57 0.57 0.57
Fish oil 7 0.35 0.06 0.99 0.21
Fish sauce 1 0.03 0.03 0.03 0.03
Flounder Baltic Sea 2 1.46 0.49 2.44 1.46
Garfish (Belone belone) 3 0.18 0.07 0.23 0.22
Greater weever, Trachinus draco 1 0.37 0.37 0.37 0.37
Greenland Halibut 10 0.23 0.12 0.78 0.16
Herring 6 0.62 0.30 0.88 0.66
Herring Baltic Sea 35 2.64 0.56 5.93 2.52
Herring North Sea 2 0.47 0.43 0.51 0.47
Ling (Molva molva) 2 0.11 0.01 0.21 0.11
Mackeral 5 0.40 0.18 0.80 0.30
Mackeral Baltic Sea 2 4.26 1.04 7.49 4.26
Oyster Sauce 2 0.04 0.03 0.04 0.04
Plaice 3 0.15 0.08 0.25 0.14
Plaice Baltic Sea 2 0.47 0.42 0.52 0.47
Pollack (Pollachius pollachius) 1 0.02 0.02 0.02 0.02
Porbeagle 1 0.04 0.04 0.04 0.04
Ready-to-eat, fish based 1 0.03 0.03 0.03 0.03
Salmon 1 0.08 0.08 0.08 0.08
Salmon, aquaculture 1 0.19 0.19 0.19 0.19
Salmon - 2-3 kg not trimmed Baltic Sea 3 2.80 2.20 3.37 2.83
Salmon - 4-5 kg Baltic Sea 3 2.30 1.95 2.70 2.24
Salmon - 4-5 kg not trimmed Baltic Sea 1 3.59 3.59 3.59 3.59
Salmon - 5-6 kg Baltic Sea 3 3.39 3.21 3.52 3.44
Salmon - 5-6 kg not trimmed Baltic Sea 2 4.94 4.61 5.28 4.94
Salmon - 6-7 kg Baltic Sea 1 3.49 3.49 3.49 3.49

54
Commodity Remarks No of
samples Mean Min Max Median
Salmon - 6-7 kg not trimmed Baltic Sea 1 5.90 5.90 5.90 5.90
Salmon - 7-8 kg Baltic Sea 2 3.88 3.79 3.96 3.88
Salmon - 8-9 kg Baltic Sea 2 3.59 3.32 3.86 3.59
Salmon - 9-10 kg Baltic Sea 2 3.24 3.03 3.45 3.24
Salmon - 9-10 kg not trimmed Baltic Sea 1 6.35 6.35 6.35 6.35
Salmon - 10-11 kg Baltic Sea 1 3.85 3.85 3.85 3.85
Salmon - 11-12 kg Baltic Sea 1 3.57 3.57 3.57 3.57
Sea catfish and wolf-fish (Anarhichas) 3 0.29 0.11 0.56 0.20
Sprat 4 0.69 0.57 0.89 0.66
Sprat Baltic Sea 8 2.44 1.00 3.82 2.30
Trout, aquaculture 30 0.12 0.05 0.27 0.11
Tuna, canned in oil 1 0.03 0.03 0.03 0.03
Tuna, canned in water 1 0.03 0.03 0.03 0.03
Turbot 4 0.29 0.03 0.92 0.11
Food other than fish pg WHO-TEQ2005/g fat
Beef meat 2 0.36 0.33 0.38 0.36
Cheese, goat, 45-55% fat in dry matter 1 0.33 0.33 0.33 0.33
Chicken meat 8 0.47 0.20 0.96 0.34
Cow milk, raw 5 0.41 0.22 0.70 0.36
Cow milk, raw 16 0.31 0.20 0.53 0.28
Cow milk, raw 19 0.37 0.14 1.05 0.27
Duck meat, steak (air or oil) 1 0.24 0.24 0.24 0.24
Egg, whole, chicken 12 0.23 0.14 0.41 0.23
Egg, whole, chicken 47 0.54 0.19 1.49 0.52
Egg, whole, chicken 57 1.87 0.19 11.68 1.41
Fat, beef (leaf fat) 104 0.32 0.05 1.82 0.22
Fat, beef (leaf fat) 68 0.38 0.09 2.41 0.30
Fat, buffalo (leaf fat) 5 0.64 0.48 0.91 0.59
Fat, chicken (belly fat) 10 0.22 0.09 0.30 0.24
Fat, chicken (belly fat) 5 0.33 0.14 0.61 0.28
Fat, horse (leaf fat) 4 2.86 0.56 5.53 2.67
Fat, lamb (leaf fat) 8 0.38 0.17 0.67 0.39
Fat, pork (leaf fat) 117 0.18 0.04 0.58 0.16
Fat, pork (leaf fat) 57 0.21 0.09 0.57 0.17
Fat, sheep (leaf fat) 11 0.49 0.19 0.86 0.54
Infant formulae, powder 3 0.07 0.06 0.08 0.08
Ready-to-eat meal for infants and young children, canned 2 0.02 0.01 0.02 0.02
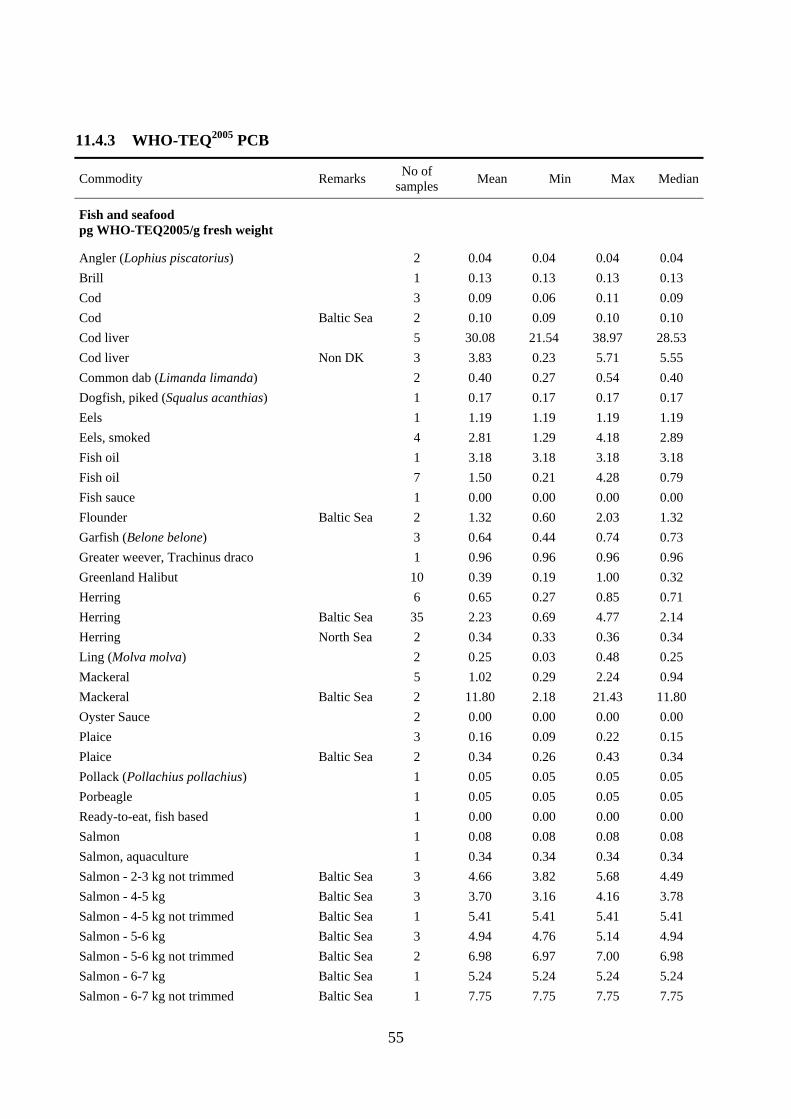
55
11.4.3 WHO-TEQ2005 PCB
Commodity Remarks No of
samples Mean Min Max Median
Fish and seafood pg WHO-TEQ2005/g fresh weight
Angler (Lophius piscatorius) 2 0.04 0.04 0.04 0.04
Brill 1 0.13 0.13 0.13 0.13
Cod 3 0.09 0.06 0.11 0.09
Cod Baltic Sea 2 0.10 0.09 0.10 0.10
Cod liver 5 30.08 21.54 38.97 28.53
Cod liver Non DK 3 3.83 0.23 5.71 5.55
Common dab (Limanda limanda) 2 0.40 0.27 0.54 0.40
Dogfish, piked (Squalus acanthias) 1 0.17 0.17 0.17 0.17
Eels 1 1.19 1.19 1.19 1.19
Eels, smoked 4 2.81 1.29 4.18 2.89
Fish oil 1 3.18 3.18 3.18 3.18
Fish oil 7 1.50 0.21 4.28 0.79
Fish sauce 1 0.00 0.00 0.00 0.00
Flounder Baltic Sea 2 1.32 0.60 2.03 1.32
Garfish (Belone belone) 3 0.64 0.44 0.74 0.73
Greater weever, Trachinus draco 1 0.96 0.96 0.96 0.96
Greenland Halibut 10 0.39 0.19 1.00 0.32
Herring 6 0.65 0.27 0.85 0.71
Herring Baltic Sea 35 2.23 0.69 4.77 2.14
Herring North Sea 2 0.34 0.33 0.36 0.34
Ling (Molva molva) 2 0.25 0.03 0.48 0.25
Mackeral 5 1.02 0.29 2.24 0.94
Mackeral Baltic Sea 2 11.80 2.18 21.43 11.80
Oyster Sauce 2 0.00 0.00 0.00 0.00
Plaice 3 0.16 0.09 0.22 0.15
Plaice Baltic Sea 2 0.34 0.26 0.43 0.34
Pollack (Pollachius pollachius) 1 0.05 0.05 0.05 0.05
Porbeagle 1 0.05 0.05 0.05 0.05
Ready-to-eat, fish based 1 0.00 0.00 0.00 0.00
Salmon 1 0.08 0.08 0.08 0.08
Salmon, aquaculture 1 0.34 0.34 0.34 0.34
Salmon - 2-3 kg not trimmed Baltic Sea 3 4.66 3.82 5.68 4.49
Salmon - 4-5 kg Baltic Sea 3 3.70 3.16 4.16 3.78
Salmon - 4-5 kg not trimmed Baltic Sea 1 5.41 5.41 5.41 5.41
Salmon - 5-6 kg Baltic Sea 3 4.94 4.76 5.14 4.94
Salmon - 5-6 kg not trimmed Baltic Sea 2 6.98 6.97 7.00 6.98
Salmon - 6-7 kg Baltic Sea 1 5.24 5.24 5.24 5.24
Salmon - 6-7 kg not trimmed Baltic Sea 1 7.75 7.75 7.75 7.75

56
Commodity Remarks No of
samples Mean Min Max Median
Salmon - 7-8 kg Baltic Sea 2 5.32 5.25 5.39 5.32
Salmon - 8-9 kg Baltic Sea 2 5.21 5.06 5.35 5.21
Salmon - 9-10 kg Baltic Sea 2 4.92 4.91 4.93 4.92
Salmon - 9-10 kg not trimmed Baltic Sea 1 7.78 7.78 7.78 7.78
Salmon - 10-11 kg Baltic Sea 1 5.86 5.86 5.86 5.86
Salmon - 11-12 kg Baltic Sea 1 5.04 5.04 5.04 5.04
Sea catfish and wolf-fish (Anarhichas) 3 0.24 0.10 0.43 0.18
Sprat 4 0.98 0.80 1.26 0.93
Sprat Baltic Sea 8 2.50 1.30 3.37 2.40
Trout, aquaculture 30 0.19 0.09 0.41 0.19
Tuna, canned in oil 1 0.01 0.01 0.01 0.01
Tuna, canned in water 1 0.02 0.02 0.02 0.02
Turbot 4 0.69 0.04 2.20 0.27
Food other than fish pg WHO-TEQ2005/g fat
Beef meat 2 0.22 0.17 0.27 0.22
Cheese, goat, 45-55% fat in dry matter 1 0.33 0.33 0.33 0.33
Chicken meat 8 0.11 0.02 0.43 0.04
Cow milk, raw 5 0.18 0.11 0.25 0.19
Cow milk, raw on grass 16 0.19 0.12 0.31 0.18
Cow milk, raw kept inside 19 0.17 0.11 0.25 0.16
Duck meat, steak (air or oil) 1 0.04 0.04 0.04 0.04
Egg, whole, chicken 12 0.06 0.03 0.19 0.04
Egg, whole, chicken not caged 47 0.33 0.04 0.89 0.28
Egg, whole, chicken free range 57 0.79 0.04 4.44 0.62
Fat, beef (leaf fat) 104 0.32 0.01 1.92 0.17
Fat, beef (leaf fat) free range 68 0.45 0.09 1.78 0.35
Fat, buffalo (leaf fat) 5 0.82 0.49 1.35 0.85
Fat, chicken (belly fat) 10 0.06 0.01 0.39 0.03
Fat, chicken (belly fat) free range 5 0.19 0.08 0.60 0.08
Fat, horse (leaf fat) 4 2.32 1.13 4.27 1.94
Fat, lamb (leaf fat) 8 0.45 0.13 0.85 0.42
Fat, pork (leaf fat) 117 0.03 0.00 0.32 0.01
Fat, pork (leaf fat) free range 57 0.02 0.01 0.09 0.02
Fat, sheep (leaf fat) 11 0.37 0.16 0.74 0.31
Infant formulae, powder 3 0.01 0.00 0.01 0.01
Ready-to-eat meal for infants and young children, canned 2 0.00 0.00 0.01 0.00

57
11.4.4 PCB-6 (sum of PCB 28, 52, 101, 138, 153 and 180)
Commodity Remarks No of sam-ples
Mean Min Max Median
Fish and seafood pg WHO-TEQ2005/g fresh weight
Angler (Lophius piscatorius) 2 0.25 0.24 0.25 0.25
Brill 1 1.77 1.77
Cod 3 1.00 0.62 1.54 0.85
Cod Baltic Sea 2 0.50 0.47 0.53 0.50
Cod liver 5 329.05 204.48 500.68 301.65
Cod liver Non DK 3 44.56 26.56 59.72 47.41
Common dab (Limanda limanda) 2 2.53 2.39 2.68 2.53
Dogfish, piked (Squalus acanthias) 1 5.93 5.93
Eels 1 11.76 11.76 11.76 11.76
Eels, smoked 4 38.97 23.62 68.03 32.11
Fish oil 7 27.14 1.12 136.40 4.07
Fish oil 1 139.85 139.85
Fish sauce 1 0.05 0.05
Flounder Baltic Sea 2 5.78 4.09 7.46 5.78
Garfish (Belone belone) 3 11.51 9.25 14.73 10.54
Greater weever, Trachinus draco 1 7.32 7.32
Greenland Halibut 10 3.76 2.13 8.60 3.40
Herring 6 6.92 3.27 9.15 7.21
Herring Baltic Sea 35 18.75 7.06 37.61 17.10
Herring North Sea 2 3.48 3.11 3.86 3.48
Ling (Molva molva) 2 2.51 0.19 4.84 2.51
Mackeral 5 10.15 2.84 19.88 9.90
Mackeral Baltic Sea 2 125.72 23.29 228.15 125.72
Oyster Sauce 2 0.10 0.10 0.10 0.10
Plaice 3 0.94 0.47 1.49 0.87
Plaice Baltic Sea 2 2.08 1.29 2.87 2.08
Pollack (Pollachius pollachius) 1 0.43 0.43
Porbeagle 1 2.23 2.23
Ready-to-eat, fish based 1 0.04 0.04
Salmon 1 0.82 0.82
Salmon, aquaculture 1 3.42 3.42
Salmon - 2-3 kg not trimmed Baltic Sea 3 35.00 29.97 40.63 34.41
Salmon - 4-5 kg Baltic Sea 3 29.70 27.21 34.62 27.28
Salmon - 4-5 kg not trimmed Baltic Sea 1 40.34 40.34
Salmon - 5-6 kg Baltic Sea 3 33.42 31.37 35.90 32.98
Salmon - 5-6 kg not trimmed Baltic Sea 2 56.87 55.59 58.14 56.87
Salmon - 6-7 kg Baltic Sea 1 35.04 35.04
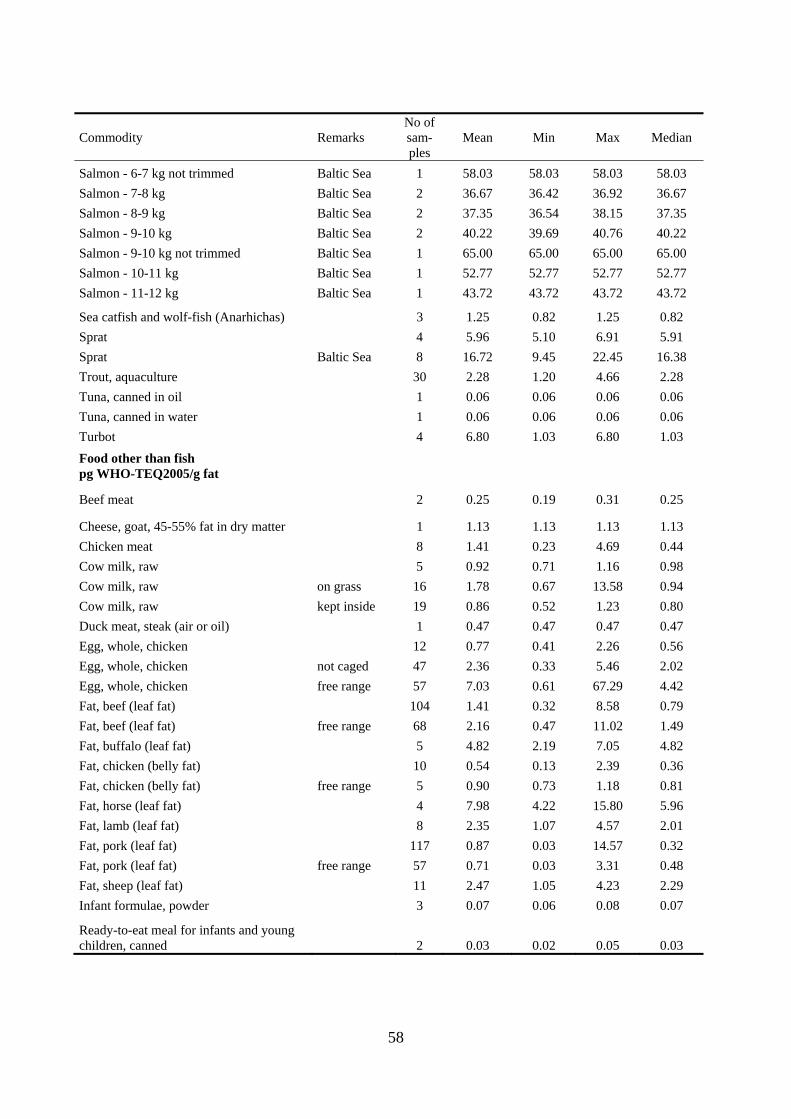
58
Commodity Remarks No of sam-ples
Mean Min Max Median
Salmon - 6-7 kg not trimmed Baltic Sea 1 58.03 58.03 58.03 58.03
Salmon - 7-8 kg Baltic Sea 2 36.67 36.42 36.92 36.67
Salmon - 8-9 kg Baltic Sea 2 37.35 36.54 38.15 37.35
Salmon - 9-10 kg Baltic Sea 2 40.22 39.69 40.76 40.22
Salmon - 9-10 kg not trimmed Baltic Sea 1 65.00 65.00 65.00 65.00
Salmon - 10-11 kg Baltic Sea 1 52.77 52.77 52.77 52.77
Salmon - 11-12 kg Baltic Sea 1 43.72 43.72 43.72 43.72
Sea catfish and wolf-fish (Anarhichas) 3 1.25 0.82 1.25 0.82
Sprat 4 5.96 5.10 6.91 5.91
Sprat Baltic Sea 8 16.72 9.45 22.45 16.38
Trout, aquaculture 30 2.28 1.20 4.66 2.28
Tuna, canned in oil 1 0.06 0.06 0.06 0.06
Tuna, canned in water 1 0.06 0.06 0.06 0.06
Turbot 4 6.80 1.03 6.80 1.03
Food other than fish pg WHO-TEQ2005/g fat
Beef meat 2 0.25 0.19 0.31 0.25
Cheese, goat, 45-55% fat in dry matter 1 1.13 1.13 1.13 1.13
Chicken meat 8 1.41 0.23 4.69 0.44
Cow milk, raw 5 0.92 0.71 1.16 0.98
Cow milk, raw on grass 16 1.78 0.67 13.58 0.94
Cow milk, raw kept inside 19 0.86 0.52 1.23 0.80
Duck meat, steak (air or oil) 1 0.47 0.47 0.47 0.47
Egg, whole, chicken 12 0.77 0.41 2.26 0.56
Egg, whole, chicken not caged 47 2.36 0.33 5.46 2.02
Egg, whole, chicken free range 57 7.03 0.61 67.29 4.42
Fat, beef (leaf fat) 104 1.41 0.32 8.58 0.79
Fat, beef (leaf fat) free range 68 2.16 0.47 11.02 1.49
Fat, buffalo (leaf fat) 5 4.82 2.19 7.05 4.82
Fat, chicken (belly fat) 10 0.54 0.13 2.39 0.36
Fat, chicken (belly fat) free range 5 0.90 0.73 1.18 0.81
Fat, horse (leaf fat) 4 7.98 4.22 15.80 5.96
Fat, lamb (leaf fat) 8 2.35 1.07 4.57 2.01
Fat, pork (leaf fat) 117 0.87 0.03 14.57 0.32
Fat, pork (leaf fat) free range 57 0.71 0.03 3.31 0.48
Fat, sheep (leaf fat) 11 2.47 1.05 4.23 2.29
Infant formulae, powder 3 0.07 0.06 0.08 0.07
Ready-to-eat meal for infants and young children, canned 2 0.03 0.02 0.05 0.03
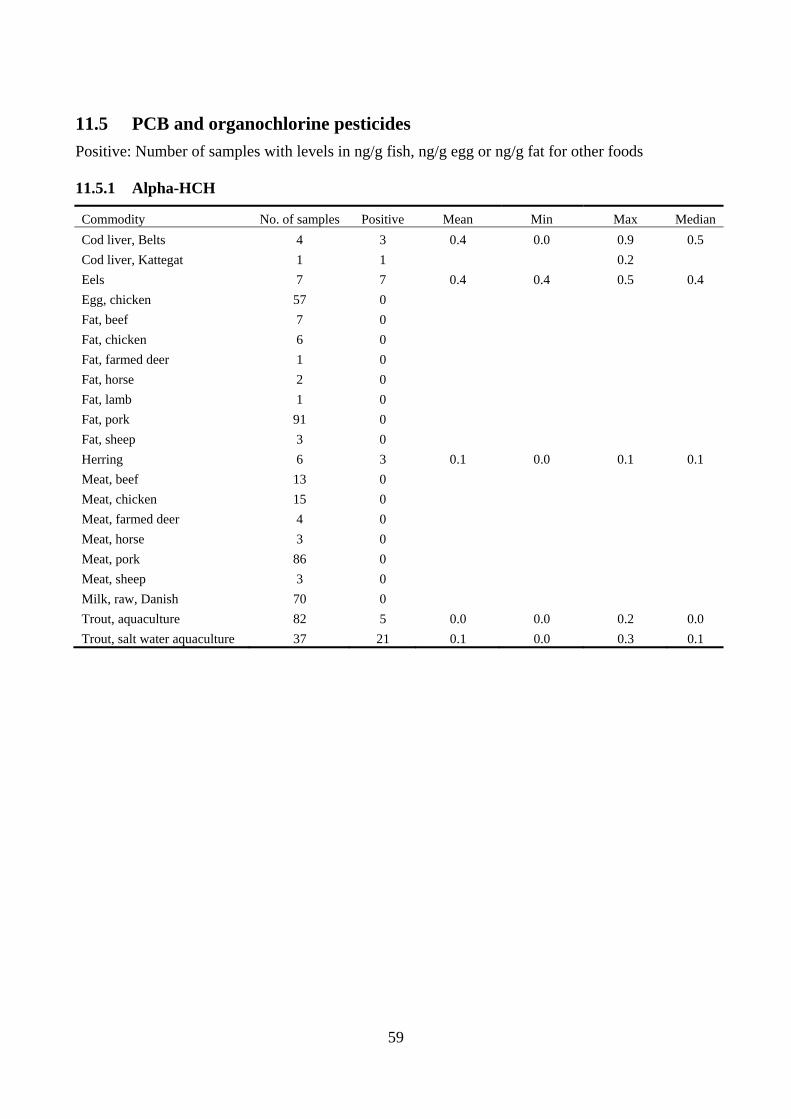
59
11.5 PCB and organochlorine pesticides
Positive: Number of samples with levels in ng/g fish, ng/g egg or ng/g fat for other foods 11.5.1 Alpha-HCH
Commodity No. of samples Positive Mean Min Max Median
Cod liver, Belts 4 3 0.4 0.0 0.9 0.5
Cod liver, Kattegat 1 1 0.2
Eels 7 7 0.4 0.4 0.5 0.4
Egg, chicken 57 0
Fat, beef 7 0
Fat, chicken 6 0
Fat, farmed deer 1 0
Fat, horse 2 0
Fat, lamb 1 0
Fat, pork 91 0
Fat, sheep 3 0
Herring 6 3 0.1 0.0 0.1 0.1
Meat, beef 13 0
Meat, chicken 15 0
Meat, farmed deer 4 0
Meat, horse 3 0
Meat, pork 86 0
Meat, sheep 3 0
Milk, raw, Danish 70 0
Trout, aquaculture 82 5 0.0 0.0 0.2 0.0
Trout, salt water aquaculture 37 21 0.1 0.0 0.3 0.1
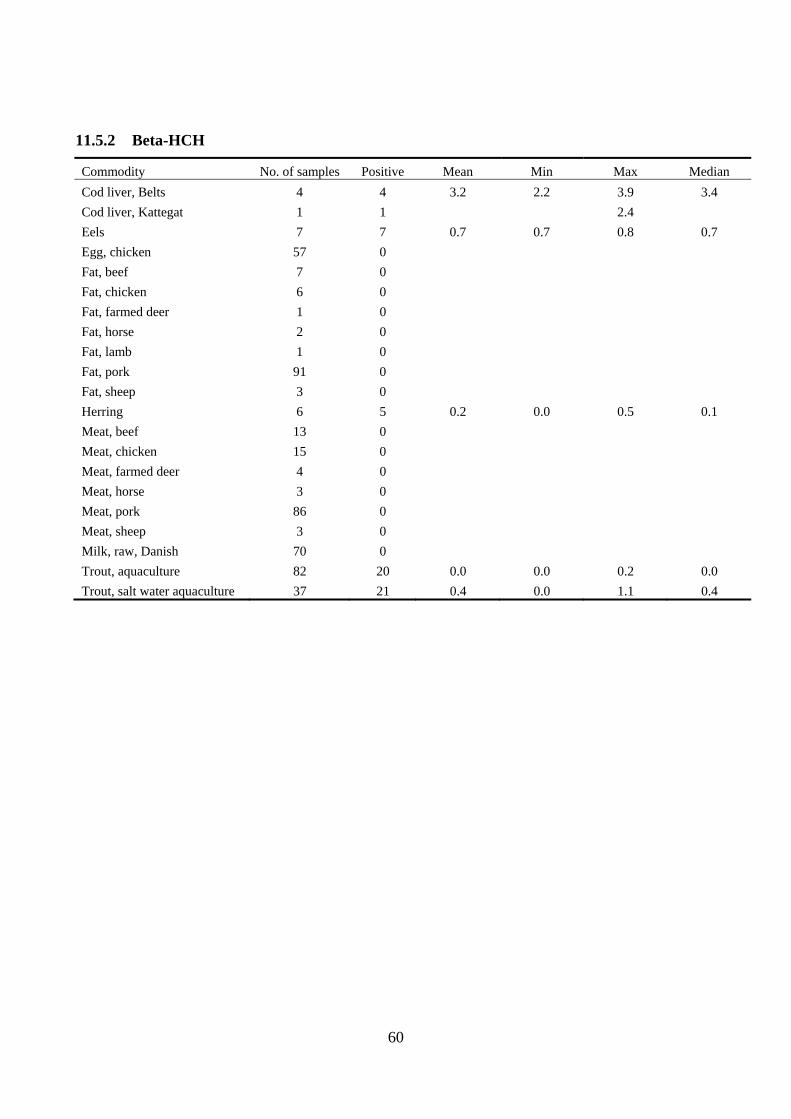
60
11.5.2 Beta-HCH
Commodity No. of samples Positive Mean Min Max Median
Cod liver, Belts 4 4 3.2 2.2 3.9 3.4
Cod liver, Kattegat 1 1 2.4
Eels 7 7 0.7 0.7 0.8 0.7
Egg, chicken 57 0
Fat, beef 7 0
Fat, chicken 6 0
Fat, farmed deer 1 0
Fat, horse 2 0
Fat, lamb 1 0
Fat, pork 91 0
Fat, sheep 3 0
Herring 6 5 0.2 0.0 0.5 0.1
Meat, beef 13 0
Meat, chicken 15 0
Meat, farmed deer 4 0
Meat, horse 3 0
Meat, pork 86 0
Meat, sheep 3 0
Milk, raw, Danish 70 0
Trout, aquaculture 82 20 0.0 0.0 0.2 0.0
Trout, salt water aquaculture 37 21 0.4 0.0 1.1 0.4
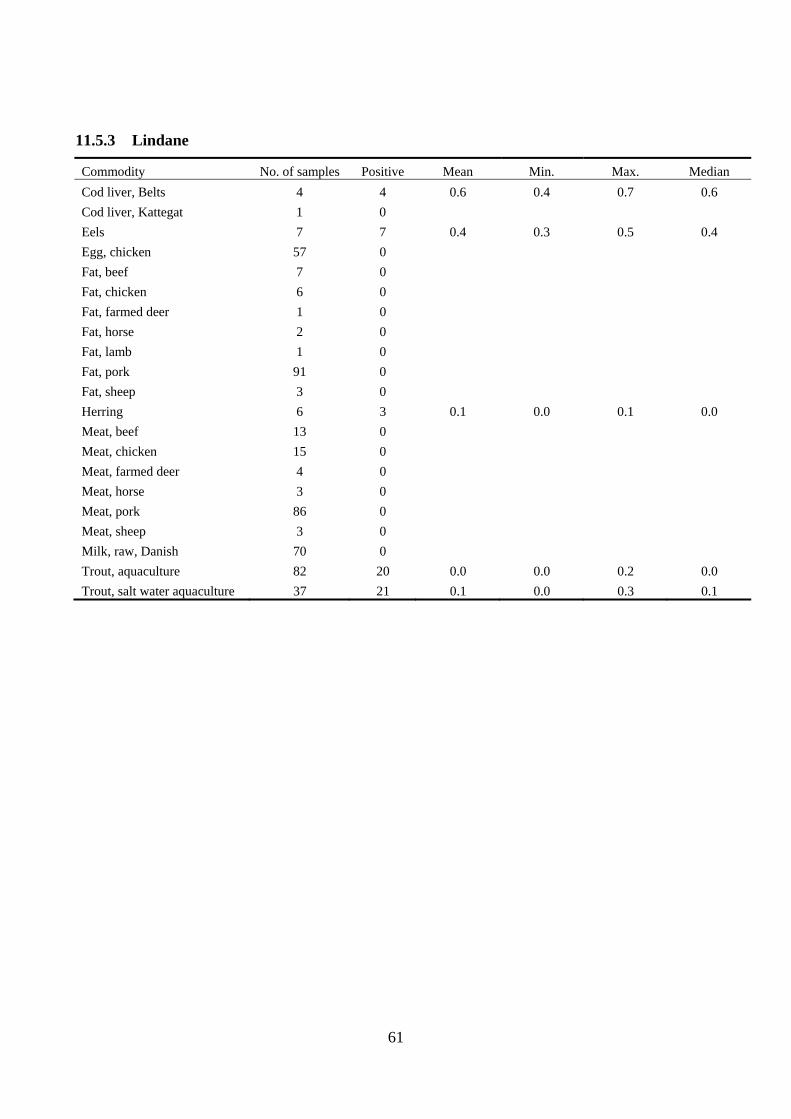
61
11.5.3 Lindane
Commodity No. of samples Positive Mean Min. Max. Median
Cod liver, Belts 4 4 0.6 0.4 0.7 0.6
Cod liver, Kattegat 1 0
Eels 7 7 0.4 0.3 0.5 0.4
Egg, chicken 57 0
Fat, beef 7 0
Fat, chicken 6 0
Fat, farmed deer 1 0
Fat, horse 2 0
Fat, lamb 1 0
Fat, pork 91 0
Fat, sheep 3 0
Herring 6 3 0.1 0.0 0.1 0.0
Meat, beef 13 0
Meat, chicken 15 0
Meat, farmed deer 4 0
Meat, horse 3 0
Meat, pork 86 0
Meat, sheep 3 0
Milk, raw, Danish 70 0
Trout, aquaculture 82 20 0.0 0.0 0.2 0.0
Trout, salt water aquaculture 37 21 0.1 0.0 0.3 0.1
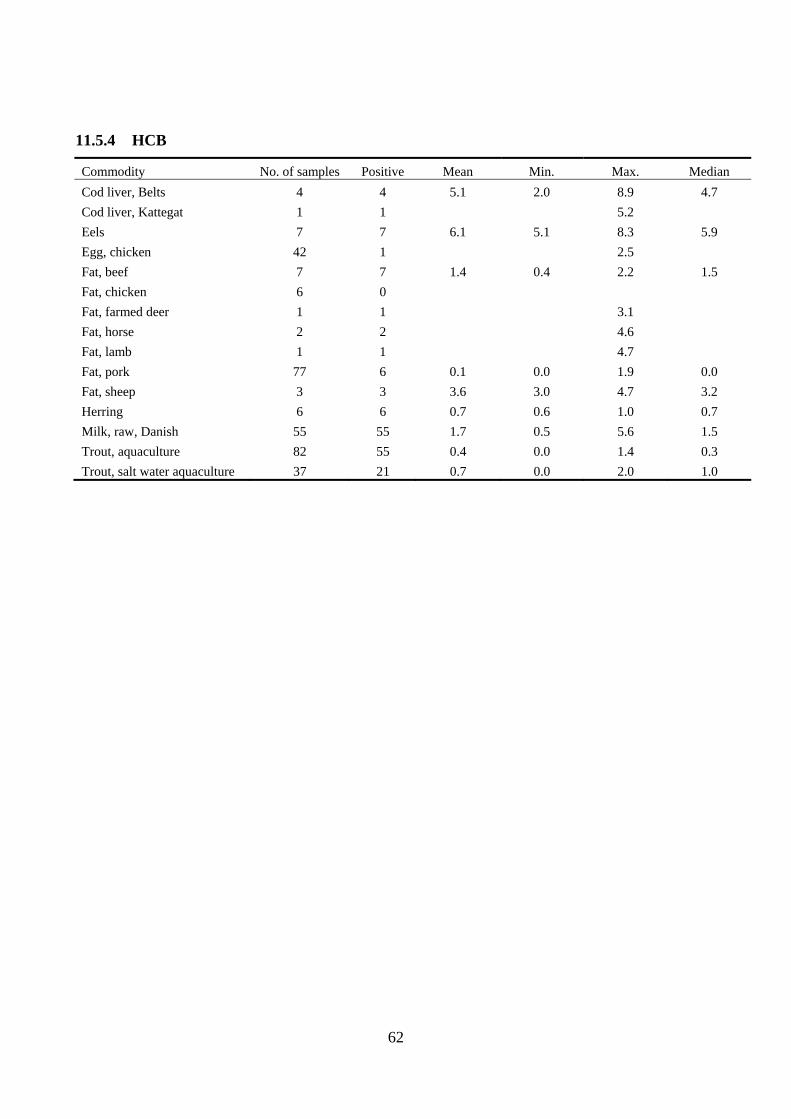
62
11.5.4 HCB
Commodity No. of samples Positive Mean Min. Max. Median
Cod liver, Belts 4 4 5.1 2.0 8.9 4.7
Cod liver, Kattegat 1 1 5.2
Eels 7 7 6.1 5.1 8.3 5.9
Egg, chicken 42 1 2.5
Fat, beef 7 7 1.4 0.4 2.2 1.5
Fat, chicken 6 0
Fat, farmed deer 1 1 3.1
Fat, horse 2 2 4.6
Fat, lamb 1 1 4.7
Fat, pork 77 6 0.1 0.0 1.9 0.0
Fat, sheep 3 3 3.6 3.0 4.7 3.2
Herring 6 6 0.7 0.6 1.0 0.7
Milk, raw, Danish 55 55 1.7 0.5 5.6 1.5
Trout, aquaculture 82 55 0.4 0.0 1.4 0.3
Trout, salt water aquaculture 37 21 0.7 0.0 2.0 1.0
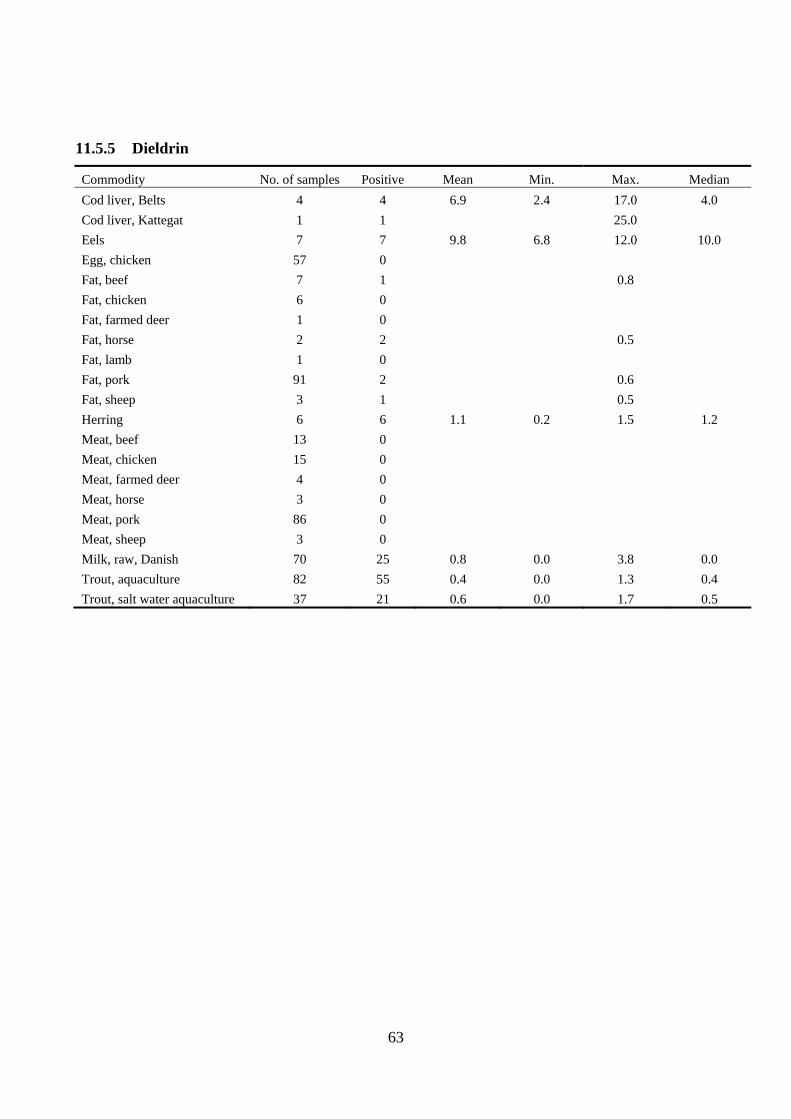
63
11.5.5 Dieldrin
Commodity No. of samples Positive Mean Min. Max. Median
Cod liver, Belts 4 4 6.9 2.4 17.0 4.0
Cod liver, Kattegat 1 1 25.0
Eels 7 7 9.8 6.8 12.0 10.0
Egg, chicken 57 0
Fat, beef 7 1 0.8
Fat, chicken 6 0
Fat, farmed deer 1 0
Fat, horse 2 2 0.5
Fat, lamb 1 0
Fat, pork 91 2 0.6
Fat, sheep 3 1 0.5
Herring 6 6 1.1 0.2 1.5 1.2
Meat, beef 13 0
Meat, chicken 15 0
Meat, farmed deer 4 0
Meat, horse 3 0
Meat, pork 86 0
Meat, sheep 3 0
Milk, raw, Danish 70 25 0.8 0.0 3.8 0.0
Trout, aquaculture 82 55 0.4 0.0 1.3 0.4
Trout, salt water aquaculture 37 21 0.6 0.0 1.7 0.5
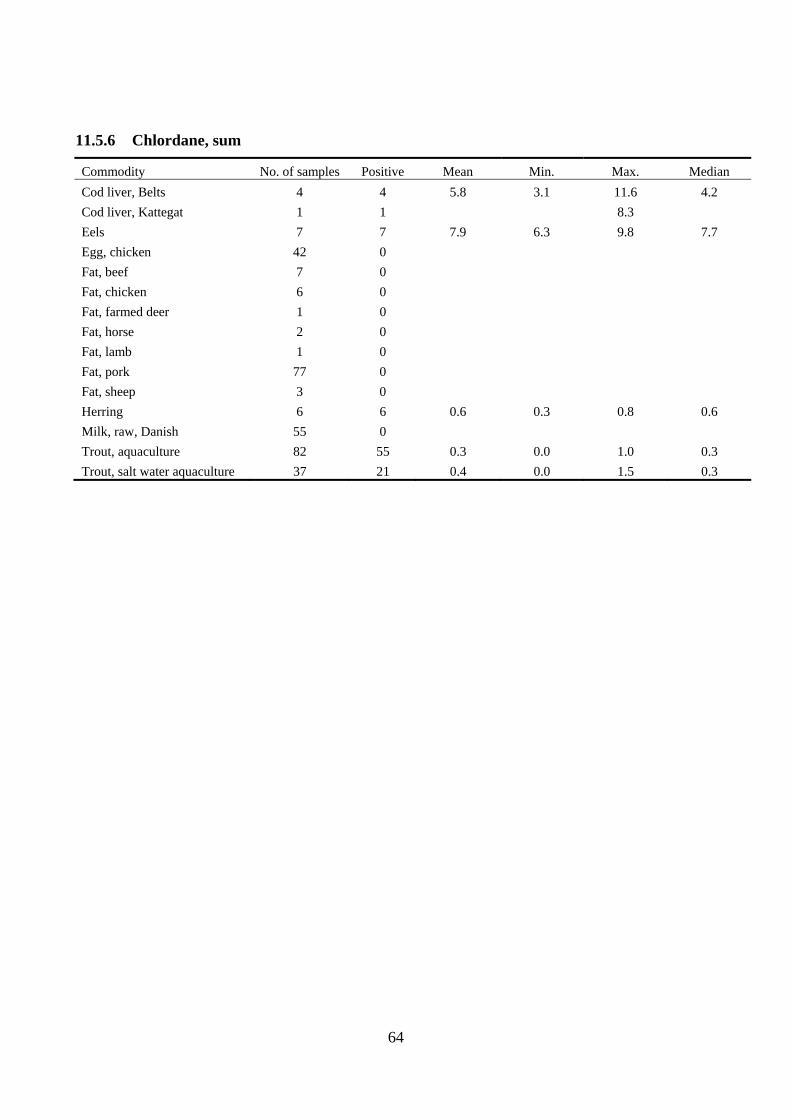
64
11.5.6 Chlordane, sum
Commodity No. of samples Positive Mean Min. Max. Median
Cod liver, Belts 4 4 5.8 3.1 11.6 4.2
Cod liver, Kattegat 1 1 8.3
Eels 7 7 7.9 6.3 9.8 7.7
Egg, chicken 42 0
Fat, beef 7 0
Fat, chicken 6 0
Fat, farmed deer 1 0
Fat, horse 2 0
Fat, lamb 1 0
Fat, pork 77 0
Fat, sheep 3 0
Herring 6 6 0.6 0.3 0.8 0.6
Milk, raw, Danish 55 0
Trout, aquaculture 82 55 0.3 0.0 1.0 0.3
Trout, salt water aquaculture 37 21 0.4 0.0 1.5 0.3
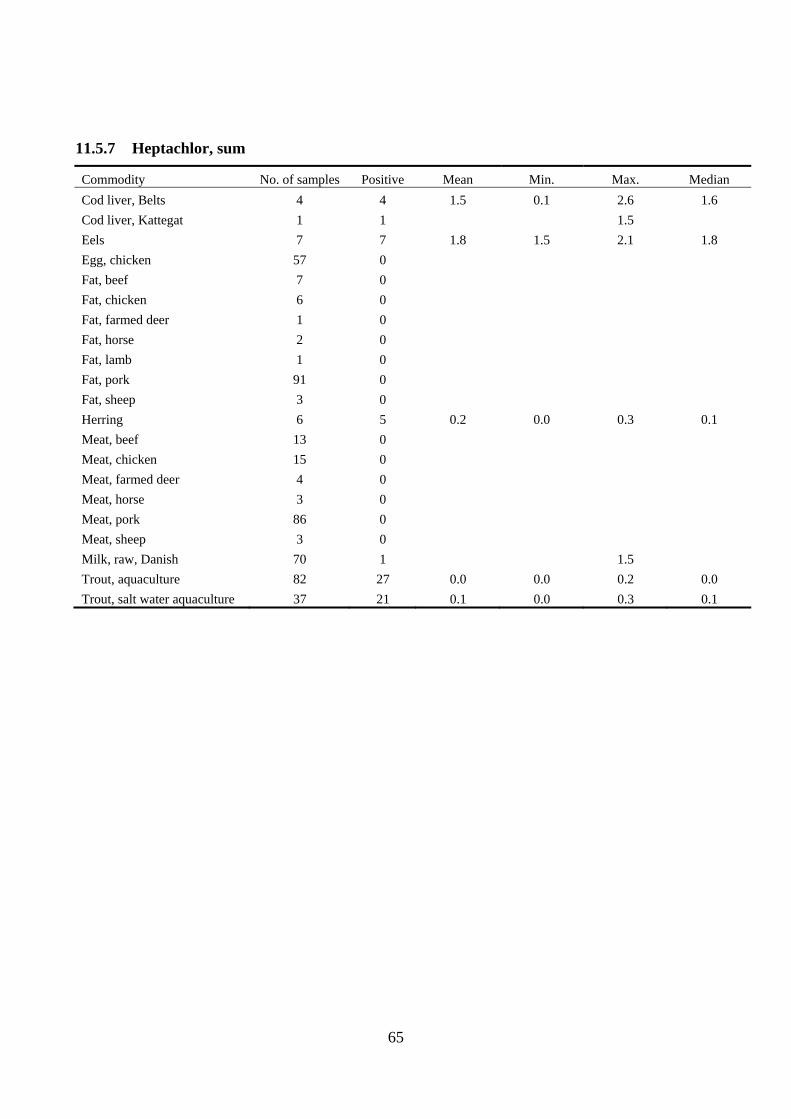
65
11.5.7 Heptachlor, sum
Commodity No. of samples Positive Mean Min. Max. Median
Cod liver, Belts 4 4 1.5 0.1 2.6 1.6
Cod liver, Kattegat 1 1 1.5
Eels 7 7 1.8 1.5 2.1 1.8
Egg, chicken 57 0
Fat, beef 7 0
Fat, chicken 6 0
Fat, farmed deer 1 0
Fat, horse 2 0
Fat, lamb 1 0
Fat, pork 91 0
Fat, sheep 3 0
Herring 6 5 0.2 0.0 0.3 0.1
Meat, beef 13 0
Meat, chicken 15 0
Meat, farmed deer 4 0
Meat, horse 3 0
Meat, pork 86 0
Meat, sheep 3 0
Milk, raw, Danish 70 1 1.5
Trout, aquaculture 82 27 0.0 0.0 0.2 0.0
Trout, salt water aquaculture 37 21 0.1 0.0 0.3 0.1
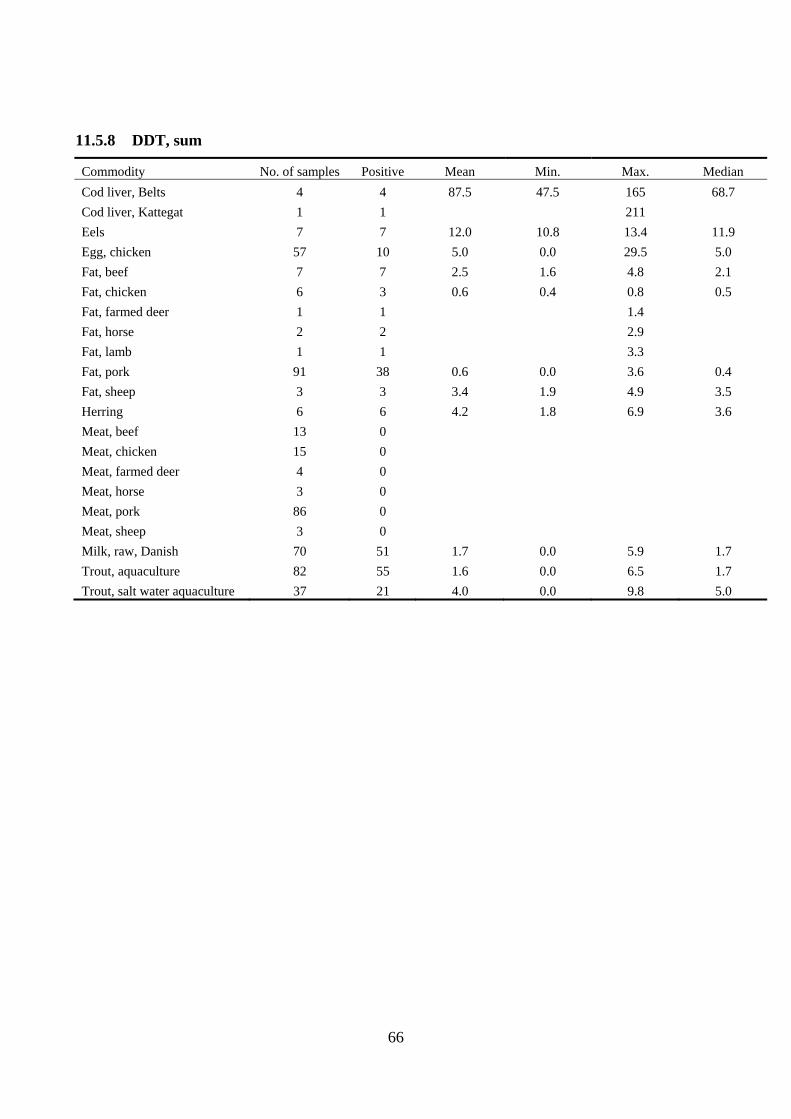
66
11.5.8 DDT, sum
Commodity No. of samples Positive Mean Min. Max. Median
Cod liver, Belts 4 4 87.5 47.5 165 68.7
Cod liver, Kattegat 1 1 211
Eels 7 7 12.0 10.8 13.4 11.9
Egg, chicken 57 10 5.0 0.0 29.5 5.0
Fat, beef 7 7 2.5 1.6 4.8 2.1
Fat, chicken 6 3 0.6 0.4 0.8 0.5
Fat, farmed deer 1 1 1.4
Fat, horse 2 2 2.9
Fat, lamb 1 1 3.3
Fat, pork 91 38 0.6 0.0 3.6 0.4
Fat, sheep 3 3 3.4 1.9 4.9 3.5
Herring 6 6 4.2 1.8 6.9 3.6
Meat, beef 13 0
Meat, chicken 15 0
Meat, farmed deer 4 0
Meat, horse 3 0
Meat, pork 86 0
Meat, sheep 3 0
Milk, raw, Danish 70 51 1.7 0.0 5.9 1.7
Trout, aquaculture 82 55 1.6 0.0 6.5 1.7
Trout, salt water aquaculture 37 21 4.0 0.0 9.8 5.0

67
11.5.9 PCB (sum of PCB 28, 52, 101, 105, 118, 138, 153, 156, 170 and 180)
Commodity No. of samples Positive Mean Min. Max. Median
Cod liver, Belts 4 4 299 209 487 251
Cod liver, Kattegat 1 1 454
Eels 7 7 18.1 16.0 20.4 18.4
Egg, chicken 42 2 109
Fat, beef 7 7 2.8 1.6 4.6 2.7
Fat, chicken 6 0
Fat, farmed deer 1 1 8.1
Fat, horse 2 2 13.7
Fat, lamb 1 1 5.5
Fat, pork 77 9 1.0 0.9 1.6 0.9
Fat, sheep 3 3 4.2 1.8 8.9 1.9
Herring 6 6 7.5 5.0 13.5 5.3
Milk, raw, Danish 55 38 4.2 3.7 7.6 4.0
Trout, aquaculture 55 55 3.4 1.5 7.1 3.1
Trout, salt water aquaculture 21 21 8.4 4.5 15.3 8.3
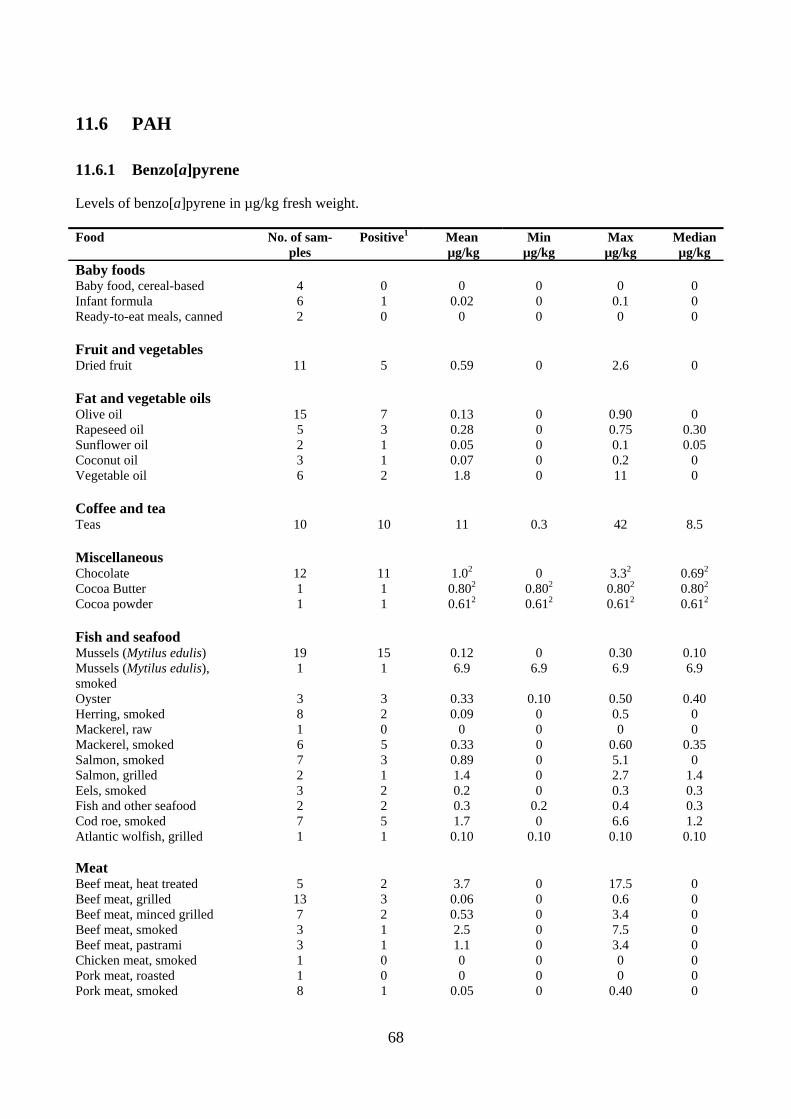
68
11.6 PAH
11.6.1 Benzo[a]pyrene
Levels of benzo[a]pyrene in µg/kg fresh weight.
Food No. of sam-ples
Positive1 Mean µg/kg
Min µg/kg
Max µg/kg
Median µg/kg
Baby foods Baby food, cereal-based 4 0 0 0 0 0 Infant formula 6 1 0.02 0 0.1 0 Ready-to-eat meals, canned 2 0 0 0 0 0 Fruit and vegetables
Dried fruit 11 5 0.59 0 2.6 0 Fat and vegetable oils
Olive oil 15 7 0.13 0 0.90 0 Rapeseed oil 5 3 0.28 0 0.75 0.30 Sunflower oil 2 1 0.05 0 0.1 0.05 Coconut oil 3 1 0.07 0 0.2 0 Vegetable oil 6 2 1.8 0 11 0 Coffee and tea
Teas 10 10 11 0.3 42 8.5 Miscellaneous
Chocolate 12 11 1.02 0 3.32 0.692 Cocoa Butter 1 1 0.802 0.802 0.802 0.802 Cocoa powder 1 1 0.612 0.612 0.612 0.612 Fish and seafood
Mussels (Mytilus edulis) 19 15 0.12 0 0.30 0.10 Mussels (Mytilus edulis), smoked
1 1 6.9 6.9 6.9 6.9
Oyster 3 3 0.33 0.10 0.50 0.40 Herring, smoked 8 2 0.09 0 0.5 0 Mackerel, raw 1 0 0 0 0 0 Mackerel, smoked 6 5 0.33 0 0.60 0.35 Salmon, smoked 7 3 0.89 0 5.1 0 Salmon, grilled 2 1 1.4 0 2.7 1.4 Eels, smoked 3 2 0.2 0 0.3 0.3 Fish and other seafood 2 2 0.3 0.2 0.4 0.3 Cod roe, smoked 7 5 1.7 0 6.6 1.2 Atlantic wolfish, grilled 1 1 0.10 0.10 0.10 0.10 Meat Beef meat, heat treated 5 2 3.7 0 17.5 0 Beef meat, grilled 13 3 0.06 0 0.6 0 Beef meat, minced grilled 7 2 0.53 0 3.4 0 Beef meat, smoked 3 1 2.5 0 7.5 0 Beef meat, pastrami 3 1 1.1 0 3.4 0 Chicken meat, smoked 1 0 0 0 0 0 Pork meat, roasted 1 0 0 0 0 0 Pork meat, smoked 8 1 0.05 0 0.40 0
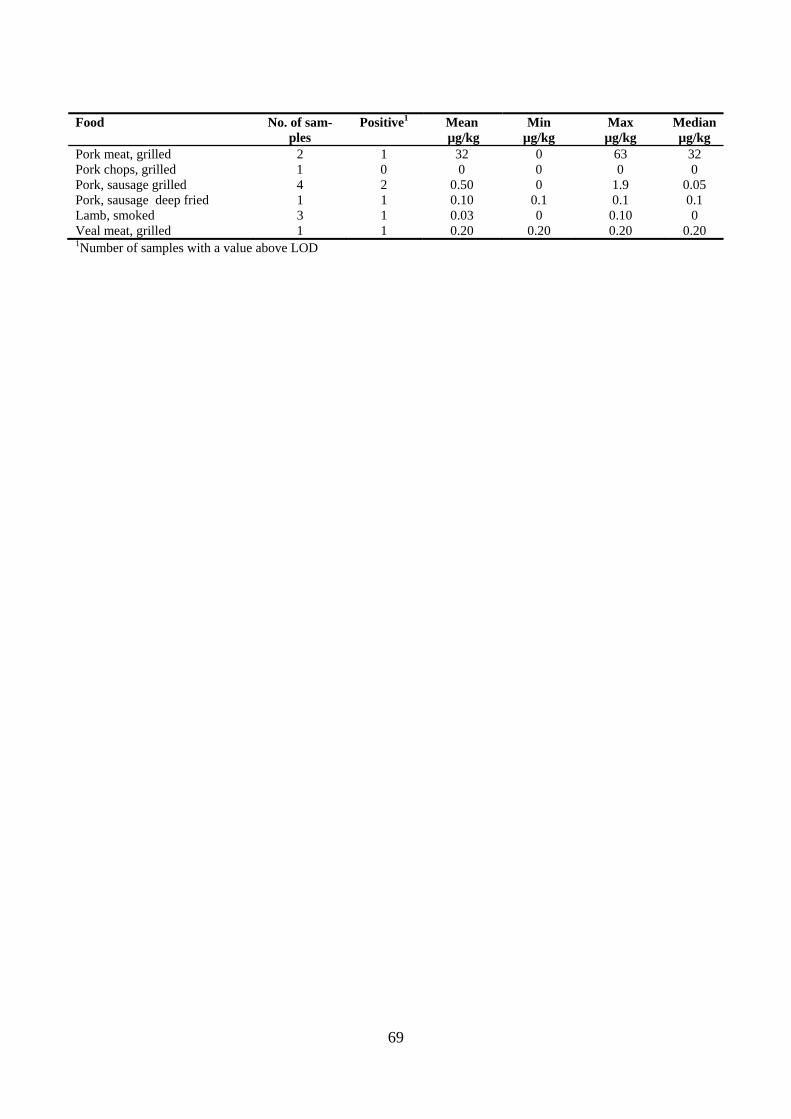
69
Food No. of sam-ples
Positive1 Mean µg/kg
Min µg/kg
Max µg/kg
Median µg/kg
Pork meat, grilled 2 1 32 0 63 32 Pork chops, grilled 1 0 0 0 0 0 Pork, sausage grilled 4 2 0.50 0 1.9 0.05 Pork, sausage deep fried 1 1 0.10 0.1 0.1 0.1 Lamb, smoked 3 1 0.03 0 0.10 0 Veal meat, grilled 1 1 0.20 0.20 0.20 0.20 1Number of samples with a value above LOD

70
11.6.2 PAH 4 (sum of benz[a]anthracene, chrysene, benzo[b]fluoranthene and ben-zo[a]pyrene)
Sum of PAH4 in µg/kg fresh weight. Food No of
samples Positive1 Mean
µg/kg Min
µg/kg Max µg/kg
Median µg/kg
Baby foods Baby food, cereal-based 4 1 0.03 0 0.10 0 Infant formula 6 1 0.02 0 0.10 0 Ready-to-eat meals, canned 2 0 0 0 0 0 Fruit and vegetables
Dried fruit 11 6 9.8 0 37 0.30 Fat and vegetable oils
Olive oil 15 15 2.2 0.5 6.6 1.8 Rapeseed oil 5 3 1.2 0 4.0 0.8 Sunflower oil 2 1 0.30 0 0.60 0.30 Coconut oil 3 3 0.73 0.4 1.4 0.40 Vegetable oil 6 5 5.9 0 32 0.60 Coffee and tea
Teas 10 10 56 3.4 173 44 Miscellaneous
Chocolate 12 12 6.42 0.772 192 5.12 Cocoa Butter 1 1 5.82 5.82 5.82 5.82 Cocoa powder 1 1 7.92 7.92 7.92 7.92 Fish and seafood
Mussels (Mytilus edulis) 19 19 1.1 0.60 2.4 1.1
Mussels (Mytilus edulis), smoked
1 1 30 30 30 30
Oyster 3 3 4.5 0.7 7.1 5.8 Herring, smoked 8 6 0.90 0 4.1 0.35 Mackerel, raw 1 1 0 0 0 0 Mackerel, smoked 6 6 2.2 0.20 4.3 2.2 Salmon, smoked 7 7 5.7 0.2 32 0.4 Salmon, grilled 2 1 4.0 0 8.0 4.0 Eels, smoked 3 3 1.3 0.60 1.9 1.5 Fish and other seafood 2 2 1.6 1.4 1.8 1.6 Cod roe, smoked 7 6 11 0 42 6.9 Atlantic wolfish, grilled 1 1 0.60 0.60 0.60 0.60 Meat Beef meat, heat treated 5 3 10 0 48 0.20 Beef meat, grilled 13 3 0.25 0 2.2 0 Beef meat, minced grilled 7 2 1.5 0 9.6 0 Beef meat, smoked 3 1 12 0 35 0 Beef meat, pastrami 3 1 5.9 0 18 0 Chicken meat, smoked 1 1 0.10 0.10 0.10 0.10 Pork meat, roasted 1 0 0 0 0 0 Pork meat, smoked 8 7 0.59 0 2.6 0.3 Pork meat, grilled 2 2 98 0.20 195 98

71
Food No of samples
Positive1 Mean µg/kg
Min µg/kg
Max µg/kg
Median µg/kg
Pork chops, grilled 1 0 0 0 0 0 Pork, sausage grilled 4 4 0.90 0.20 2.4 0.50 Pork, sausage deep fried 1 1 0.90 0.90 0.90 0.90 Lamb, smoked 3 2 0.63 0 1.6 0.3 Veal meat, grilled 1 1 1.0 1.0 1.0 1.0 1Number of samples with a value above LOD 2µg/kg fat

72
11.7 Acrylamide
All results are in µg/kg. “0” means the level was below LOQ. Food codes are based on EFSA, 2014 that is based on Commission Recommendation 2010/307/EU
2010/307-code
2010/307-categories No of samples
Positive Min Max Medi-an
Mean
1.1 French fries from fresh potatoes 2 2 170 1190 680 680
1.3 Unspecified French fries 24 24 20 1540 420 505
2.1 Potato crisp 18 18 200 1470 520 594
3.2 Deep fried fries 24 24 56 7900 595 883
3.3 Not specified pre-cooked French fries, potato products for home cooking
19 19 97 4900 590 916
4 Soft bread 18 15 0 68 12 18
4.1 Not specified bread 15 9 0 31 3.6 4.9
5 Breakfast cereals (excluding muesli and por-ridge)
7 5 0 350 11 64
5.3 Bran products and whole grain cereals, gun puffed grain
2 2 180 250 215 215
6.1 Crackers 7 7 77 800 210 328
6.2 Crisp bread 14 14 49 400 102 128
6.3 Biscuits and wafers 22 22 17 560 102 159
6.5 Not specified biscuits, crackers, crisp bread and similar (excluding pastry and cake)
1 1 13 13
7.1 Roasted coffee (dry) 20 20 75 510 236 181
7.2 Instant coffee (dry) 9 9 27 1090 760 736
8 Baby foods, other than processed cereal based foods
6 2 0 9.8 0 2.1
9 Processed cereal-based foods for infants and young children
3 2 0 19 11 10
10.1 Muesli and porridge 1 1 58 58
10.2 Cake and pastry 7 6 0 28 7.7 11
10.3 Savoury snacks 2 2 10 19 15 15
10,4 Other products based on cereals 4 4 69 220 95 120
10,6 Cocoa and cocoa products 12 12 7 350 70 88
10,7 Chocolate 9 9 39 182 133 110
11 Miscellaneous (dried fruit) 5 4 0 140 8.6 46

73
11.8 Furan
Levels of furan in selected processed foods (ng/g = µg/kg)
Foods No.
samples No.
positive Mean Min. Max. Median
Cereals 1 1 14 14 14 14
Coffee, ground beans 17 17 2475 63 5500 2350
Coffee, instant 19 19 290 28 785 260
Crisps 9 9 16 2.6 29 15
Infant meals 8 8 19 2.2 33 24
Ready-to-eat meals 47 44 21 <lod 90 14
Sauces 25 24 19 <lod 103 9.5
Soups 1 1 42 42 42 42
Vegetables, canned 4 4 10 0.5 32 2.8 <LOD: below limit of determination

National Food InstituteTechnical University of DenmarkMørkhøj Bygade 19DK - 2860 Søborg
T: 35 88 70 00F: 35 88 70 01www.food.dtu.dk
ISBN: 978-87-93109-61-2