china economic and market outlook jun ma, ph.d. chief economist for greater china head of china/hk...
TRANSCRIPT

China Economic and Market Outlook
Jun Ma, Ph.D.Chief Economist for Greater ChinaHead of China/HK Macro Strategy
Deutsche Bank AG
All prices are those current at the end of the previous trading session unless otherwise indicated. Prices are sourced from local exchanges via Reuters,
Bloomberg and other vendors. Data is sourced from Deutsche Bank and subject companies. Deutsche Bank does and seeks to do business with companies
covered in its research reports. Thus, investors should be aware that the firm may have a conflict of interest that could affect the objectivity of this report.
Investors should consider this report as only a single factor in making their investment decision. Independent, third-party research (IR) on certain companies
covered by DBSI's research is available to customers of DBSI in the United States at no cost. Customers can access IR at
http://gm.db.com/IndependentResearch or by calling 1-877-208-6300. DISCLOSURES AND ANALYST CERTIFICATIONS ARE LOCATED IN APPENDIX 1.
Jun Ma (852) 2203 8308, [email protected] September 2009

Deutsche Bank AG
Jun Ma · (852) 2203 8308, [email protected] August 2009 · page 2
Summary
Long-term outlook
2009-10 Economic outlook: a W shaped recovery
FAI growth will slow on fading stimulus
Export growth to recover strongly, and will be frontloaded
Real consumption growth to be sluggish, but nominal growth steady
2010 macro risks: overheating or stagflation?
When will the govt exit from expansionary macro policy?
Equity market outlook and strategy

Deutsche Bank AG
Jun Ma · (852) 2203 8308, [email protected] August 2009 · page 3
We forecast that China’s nominal GDP will overtake the US within 10 years, much faster than we expected 2 years ago
Nominal GDP comparison between China and US (in USD tn)
-
5
10
15
20
25
2007
2008
2009
F
2010
F
2011
F
2012
F
2013
F
2014
F
2015
F
2016
F
2017
F
2018
F
2019
F
2020
F
China US
Source: Deutsche Bank

Deutsche Bank AG
Jun Ma · (852) 2203 8308, [email protected] August 2009 · page 4
RMB to become a global reserve currency – imply that it needs to appreciate steadily over medium term
China announced the plan to build an international financial center in Shanghai by 2020 – implies that RMB needs to become convertible within 11 years
HKMA says the HKD may be pegged to the RMB when the latter becomes convertible
China has obviously signaled its desire to make the RMB a regional and eventually global reserve currency. Recent efforts include
– RMB settlement in trade between China and Hong Kong– Currency swaps arrangements with HK, Korea, Indonesia, Malaysia, Belarus,
and Argentina
An important condition for the RMB to become a reserve currency is that in the run up to that status, the RMB needs to be steadily appreciating.

Deutsche Bank AG
Jun Ma · (852) 2203 8308, [email protected] August 2009 · page 5
However, on a long-term basis, stronger productivity growth should justify 3-5% annual appreciation of RMB vs USD
Total productivity factor growth (annual average), China vs. US
0%
1%
2%
3%
4%
5%
6%
1973-1981 1981-1992 1994-2004
US China
Source: ECB, IJ PEC, UN
Correlation between GDP over USA and Currency Appreciation against US$
Singapore, 87-97
Taiwan, 86-92
Korea, 86-90China, 05-08
India, 03-07
Thailand, 02-07
Singapore, 99-04
Taiwan, 99-04
India, 96-00-8
-6
-4
-2
0
2
4
6
8
0 1 2 3 4 5 6 7 8 9 10
GDP yoy over USA, US$
App
reci
atio
n a
gai
nst
US
$, p
pt
Source: Deutsche Bank, CEIC
China’s total factor productivity growth is 5ppts higher than that in the US, which allows China to steady appreciate its currency without losing competitiveness.
International experience also supports this trend

Deutsche Bank AG
Jun Ma · (852) 2203 8308, [email protected] August 2009 · page 6
China-related investment opportunities over longer-term
Heath care: We estimate that China’s health care spending will grow at 1.3 times GDP growth in next ten years. This implies nearly 20% annual average growth in USD terms. Drug distribution is especially impressive in growth potential.
Equipment sector (power, medical, telco, shipbuilding, auto, auto parts): to gain 20% world market share from the current single digit levels.
Alternative energies
• Nuclear, Wind, Solar, Natural gas, Hybrid car batteries
Subways: China has 100 cities that need to build subways, and each of them is larger than Singapore.
Consumer
Diaper, packaging, funeral services, online travel, animation, etc.

Deutsche Bank AG
Jun Ma · (852) 2203 8308, [email protected] August 2009 · page 7
Medium-term growth outlook

Deutsche Bank AG
Jun Ma · (852) 2203 8308, [email protected] August 2009 · page 8
GD
P g
row
th Q
oQ
sa.
A double-dip scenario (or W shaped recovery) for GDP growth over next 1.5 years --- an illustrative example
Policy Stimulus
Source: Deutsche Bank.
FAI 1995-2002, corporate vs. government
Source: Deutsche Bank, CEIC
Real GDP growth, qoq %, saar.
0%
2%
4%
6%
8%
10%
12%
14%
1997Q4 1998Q1 1998Q2 1998Q3 1998Q4 1999Q1 1999Q2 1999Q3 1999Q4
Source: Deutsche Bank, CEIC
During crises, frontloaded policy stimulus tends to generate an invested V shape impact on economic growth. It occurred in 98-99 and will repeat in this round of economic recovery

Deutsche Bank AG
Jun Ma · (852) 2203 8308, [email protected] August 2009 · page 9
China economic growth forecast for 2009 and 2010 Following the first dip in Q4 08, we expect growth to tentatively recover in
H1 this year but will likely slide again until hitting the 2nd trough in H1 2010.
Need to focus on qoq growth this year, which captures economic turning points 2-3 quarters earlier than yoy data.
Yoy and qoq annualized GDP growth forecast
Annualised sa qoq% yoy%2008Q1 9.4% 10.6%2008Q2 10.6% 10.1%2008Q3 6.5% 9.0%2008Q4 1.4% 6.8%2009Q1 5.9% 6.1%2009Q2 18.3% 7.9%2009Q3F 10.4% 8.8%2009Q4F 8.3% 10.5%2010Q1F 7.6% 11.0%2010Q2F 6.5% 8.3%2010Q3F 6.0% 7.4%2010Q4F 8.3% 7.1%
Source: Deutsche Bank

Deutsche Bank AG
Recent version to our “W”: higher Q2 with a more prolonged second dip
• Q2 GDP growth reached 18% on qoq saar basis. The most recent change in our view is that the second dip of the economy may last a bit longer (5 quarters) than previous forecast (4 quarters). Main reason is that govt spending program has delayed many companies’ capex reduction process.
Jun Ma · (852) 2203 8308, [email protected] August 2009 · page 10
China annulized qoq GDP growth forecast, saar %
0.0%
2.0%
4.0%
6.0%
8.0%
10.0%
12.0%
14.0%
16.0%
18.0%
20.0%
Source: Deutsche Bank

Deutsche Bank AG
Sequential qoq deceleration in H2 is becoming consensus
Jun Ma · (852) 2203 8308, [email protected] August 2009 · page 11
Consensus forecast of annualized qoq GDP growth by ten economists (%)
(2.0)-
2.0 4.0 6.0 8.0
10.0 12.0 14.0 16.0 18.0 20.0
2008 1Q 2008 2Q 2008 3Q 2008 4Q 2009 1Q 2009 2Q 2009 3Q* 2009 4Q*
Median Low High
Source: Wall Street J ournal poll by Andrew Baston. * Forecasts. The ten economists/institutions surveyed include Albert Keidel, Barclays, CICC, Citigroup, Deutsche Bank, Goldman Sachs, J .P. Morgan, Merrill Lynch, UBS and two others who names are withheld.
Deutsche Bank AG
Jun Ma · (852) 2203 8308, [email protected] August 2009 · page 12
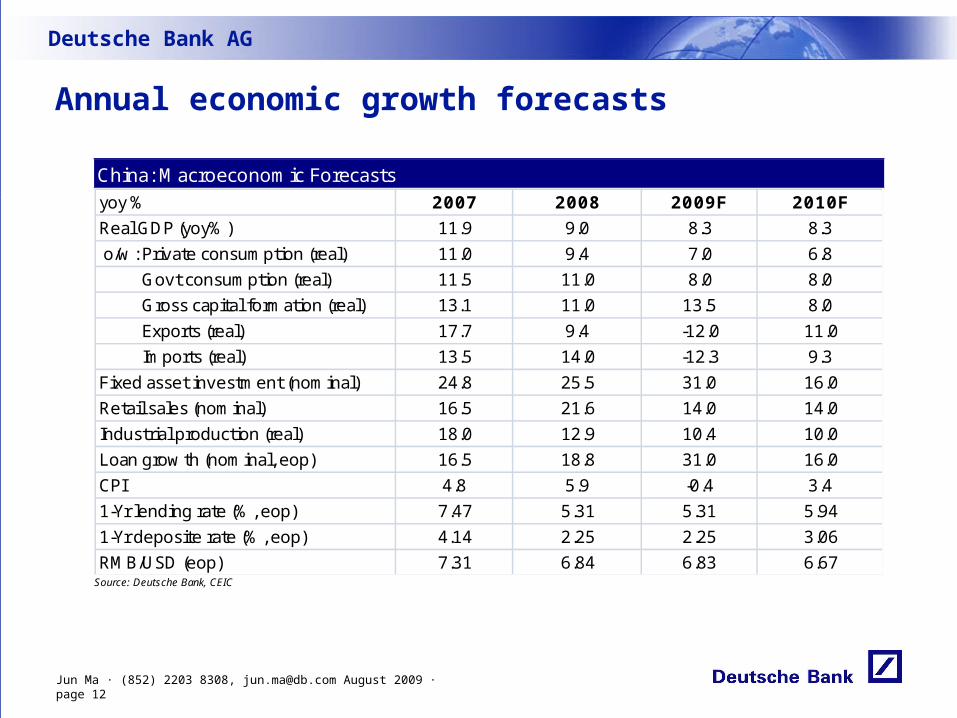
Annual economic growth forecasts
China: Macroeconomic Forecasts yoy % 2007 2008 2009F 2010F
Real GDP (yoy%) 11.9 9.0 8.3 8.3
o/w: Private consumption (real) 11.0 9.4 7.0 6.8
Govt consumption (real) 11.5 11.0 8.0 8.0
Gross capital formation (real) 13.1 11.0 13.5 8.0
Exports (real) 17.7 9.4 -12.0 11.0
Imports (real) 13.5 14.0 -12.3 9.3
Fixed asset investment (nominal) 24.8 25.5 31.0 16.0
Retail sales (nominal) 16.5 21.6 14.0 14.0
Industrial production (real) 18.0 12.9 10.4 10.0
Loan growth (nominal, eop) 16.5 18.8 31.0 16.0
CPI 4.8 5.9 -0.4 3.4
1-Yr lending rate (%, eop) 7.47 5.31 5.31 5.94
1-Yr deposite rate (%, eop) 4.14 2.25 2.25 3.06
RMB/USD (eop) 7.31 6.84 6.83 6.67 Source: Deutsche Bank, CEIC

Deutsche Bank AG
Jun Ma · (852) 2203 8308, [email protected] August 2009 · page 13
Project approvals, lending and project starts have peaked sequentially By design, most centrally-
sponsored stimulus projects should have started this year. New lending peaked in Q1 this year. We think project new starts have peaked in Q2 this year
New lending peaked in 1Q09
0
500
1,000
1,500
2,000
2,500
3,000
3,500
4,000
4,500
5,000
3Q08 4Q08 1Q09 2Q09 3Q09F 4Q09F
RMB bn
Source: CEIC, Deutsche Bank
Project starts peaked in 2Q09
-
1.0
2.0
3.0
4.0
5.0
6.0
1Q09A 2Q09F 3Q09F 4Q09F 1Q10F
RMB tn
Source: CEIC, Deutsche Bank
Govt capex growth
0
100
200
300
400
500
600
700
0%10%20%30%40%50%60%70%80%90%
2008 2009F 2010F
Govt capital spending growth (yoy %, lhs)
Disbursement for stimulus (RMB bn, rhs)
Source: Deutsche Bank

Deutsche Bank AG
Govt-led FAI will likely fall from 60% yoy now to 10% in H2 2010
Jun Ma · (852) 2203 8308, [email protected] August 2009 · page 14
Government-led investment this cycle vs. 1998-99
-10%0%10%20%30%40%50%60%70%80%
-10%0%
10%20%30%40%50%60%70%80%
Mar
-97
Dec
-07
Jun-
97 M
ar-0
8
Sep-
97 J
un-0
8
Dec-
97 S
ep-0
8
Mar
-98
Dec
-08
Jun-
98 M
ar-0
9
Sep-
98 J
un-0
9F
Dec-
98 S
ep-0
9F
Mar
-99
Dec
-09F
Jun-
99 M
ar-1
0F
Sep-
99 J
un-1
0F
Dec-
99 S
ep-1
0F
Mar
-00
Dec
-10F
Jun-
00 M
ar-1
1F
Sep-
00 J
un-1
1F
Dec-
00 S
ep-1
1F
Govt FAI (1997-2000)
Govt FAI (2007-2011F)
Source: Deutsche Bank, CEIC Note: Government FAI(1997-2000) comprise agriculture and transport sectors; Government FAI(2007-2011F) comprise agriculture, transport, scientific research, water conversancy & environment, healthcare, education and culture

Deutsche Bank AG
Jun Ma · (852) 2203 8308, [email protected] August 2009 · page 15
Corporate and real estate FAI
outlook

Deutsche Bank AG
Jun Ma · (852) 2203 8308, [email protected] August 2009 · page 16
FAI breakdown by sector
Breakdown of FAI, 2009 ytd
Govt-led, 25.1%
Property, 22.6%
Manufacturing/Mining, 43.1%
Other services, 9%
Source: Deutsche Bank, CEIC

Deutsche Bank AG
Jun Ma · (852) 2203 8308, [email protected] August 2009 · page 17
Manufacturing FAI should follow industrial revenue growth
Manufacturing / mining revenue vs. FAI growth
-20%
-10%
0%
10%
20%
30%
40%
50%
60%
19
86
19
87
19
88
19
89
19
90
19
91
19
92
19
93
19
94
19
95
19
96
19
97
19
98
19
99
20
00
20
01
20
02
20
03
20
04
20
05
20
06
20
07
20
08
20
09
F2
01
0F
FAI manufacturing & mining, yoy%Industrial revenue, yoy%
Source: Deutsche Bank, CEIC

Deutsche Bank AG
Overcapacity requires capex deceleration
Jun Ma · (852) 2203 8308, [email protected] August 2009 · page 18
A large part of overcapacity is structural in nature
Global overcapacity also requires Chinese capex cuts in tradable sectors
Stimulus induced more capex addition, which will worsen overcapacity later
FAI of selected stimulus beneficiaries, yoy%, 3mma
30%
35%
40%
45%
50%
Source: Deutsche Bank, CEIC Note: the sectors included in this FAI series are non-metal mining, cement product, plastics, and non-ferrous. For non-ferrous, in addition to the stimulus of govt-led FAI, another important factor was govt restocking of inventory which partly induced a major spike in prices.
G3 capacity utilization rate
60%
65%
70%
75%
80%
85%
90%
95%
100%
105%
110%
1Q03
2Q03
3Q03
4Q03
1Q04
2Q04
3Q04
4Q04
1Q05
2Q05
3Q05
4Q05
1Q06
2Q06
3Q06
4Q06
1Q07
2Q07
3Q07
4Q07
1Q08
2Q08
3Q08
4Q08
1Q09
2Q09
US
EU
JP
Source: Deutsche Bank, CEIIC, Bloomberg Note: US figures are manufacturing capacity utilization rate (season adjusted) reported on SIC-basis (Standard Industrial Classification); EU figures are capacity utilization rate (sa) of EU 27 countries; J apan figures are manufacturing capacity utilization (2005 average =100) reported by J apanese Ministry of Economy, Trade and Industry.
China manufacturing capacity utilization diffusion index
-25
-20
-15
-10
-5
0
Ma
r-05
Jun-
05
Sep-
05
Dec
-05
Ma
r-06
Jun-
06
Sep-
06
Dec
-06
Ma
r-07
Jun-
07
Sep-
07
Dec
-07
Ma
r-08
Jun-
08
Sep-
08
Dec
-08
Ma
r-09
Jun-
09
Source: CEIC

Deutsche Bank AG
Real estate investment: an upside risk but can only offset 1/2 of govt-led capex slowdown
Jun Ma · (852) 2203 8308, [email protected] August 2009 · page 19
Real estate FAI vs. Govt-led FAI, 3mma, yoy%
-20%
0%
20%
40%
60%
80%Ju
l-07
Sep-
07
No
v-07
Jan-
08
Ma
r-08
Ma
y-08
Jul-0
8Se
p-0
8N
ov-0
8Ja
n-0
9M
ar-0
9M
ay-0
9Ju
l-09
Sep-
09
FN
ov-0
9F
Jan-
10
FM
ar-1
0F
Ma
y-10
FJu
l-10
FSe
p-1
0F
No
v-10
F
GovtPptyGovt+Ppty
Source: Deutsche Bank, CEIC


Deutsche Bank AG
Export growth likely rise by 35ppts in next 12 months
Jun Ma · (852) 2203 8308, [email protected] August 2009 · page 21
China export vs. G3 GDP
-6%
-4%
-2%
0%
2%
4%
6%
-30%
-20%
-10%
0%
10%
20%
30%
40%
50%
No
v-99
Jul-0
0
Ma
r-01
No
v-01
Jul-0
2
Ma
r-03
No
v-03
Jul-0
4
Ma
r-05
No
v-05
Jul-0
6
Ma
r-07
No
v-07
Jul-0
8
Ma
r-09
No
v-09
Jul-1
0
China export growth, yoy % (lhs) China export forecast
G3 real GDP, yoy % (rhs) G3 GDP forecast
Source: Deutsche Bank, CEIC

Deutsche Bank AG
Stronger and front-loaded export growth recovery
Jun Ma · (852) 2203 8308, [email protected] August 2009 · page 22
Changes to China’s export forecast
-30%
-20%
-10%
0%
10%
20%
30%
Jul-0
8
Sep-
08
No
v-08
Jan-
09
Ma
r-09
Ma
y-09
Jul-0
9
Sep-
09
No
v-09
Jan-
10
Ma
r-10
Ma
y-10
Jul-1
0
Sep-
10
No
v-10
Export, yoy%, 3mma Previous forecast New forecast
Source: Deutsche Bank

Deutsche Bank AG
Why will export growth surprise to the upside?
Jun Ma · (852) 2203 8308, [email protected] August 2009 · page 23
For each 1ppt rise in G3 GDP, Chinese export growth recovers by 7ppts. We expect US GDP growth to recovery 6ppts within next 12 months. For next 3-4 quarters, US economy will likely experience a V shape recovery, due to:
normalization of inventory -- if every company increases inventory from 2 weeks back to 2 months, it would lead to 12% GDP growth!
normalization of auto sales -- as long as auto sales recover to replacement demand level (replacing broken cars only), auto sales will rise 25%;
if housing starts return to household formation level (# of new households per yr), it requires 20% increase in housing starts per yr in next 4 yrs.
We think China's export recovery will be much more front-loaded than market expectations. If China's monthly export recovery (mom increase) maintains at half of the pace seen over past two months (5% rise each in June and July), we should see 26ppt recovery from now to Dec. If the mom recovery maintains the pace in past two months, we should see 35ppt recovery in next 5 months.

Deutsche Bank AG
US new orders index now substantially higher than that in China
Jun Ma · (852) 2203 8308, [email protected] August 2009 · page 24
US ISM index
20
30
40
50
60
70
80
Au
g-00
Dec
-00
Ap
r-01
Au
g-01
Dec
-01
Ap
r-02
Au
g-02
Dec
-02
Ap
r-03
Au
g-03
Dec
-03
Ap
r-04
Au
g-04
Dec
-04
Ap
r-05
Au
g-05
Dec
-05
Ap
r-06
Au
g-06
Dec
-06
Ap
r-07
Au
g-07
Dec
-07
Ap
r-08
Au
g-08
Dec
-08
Ap
r-09
Au
g-09
Manufacturing PMI
New Orders Index
Source: Deutsche Bank, CEIC

Deutsche Bank AG
Jun Ma · (852) 2203 8308, [email protected] August 2009 · page 25
Exports > consumer > FAI

Deutsche Bank AG
Jun Ma · (852) 2203 8308, [email protected] August 2009 · page 26
Exports to significantly outperform FAI over next 12 months
We expect export growth to rally by 35ppts in next 12 months, while FAI growth to slow by about 20ppts. This suggests a pair trade between export-related sectors against construction materials.
This divergence is almost identical to 1999, when exports rallied together with a plunge in FAI growth, following the perk of stimulus.
1997-99 FAI vs. exports
-10%
-5%
0%
5%
10%
15%
20%
25%
30%
35%
0%
5%
10%
15%
20%
25%
Sep-
96
Dec
-96
Ma
r-97
Jun-
97
Sep-
97
Dec
-97
Ma
r-98
Jun-
98
Sep-
98
Dec
-98
Ma
r-99
Jun-
99
Sep-
99
Dec
-99
Ma
r-00
Jun-
00
FAI, yoy%, 3mma (lhs) Export, yoy%, 3mma (rhs)
Source: Deutsche Bank, CEIC
Export growth vs. FAI growth, yoy %
-30%
-20%
-10%
0%
10%
20%
30%
40%
0%5%
10%15%20%25%30%35%40%
Ma
r-06
Jul-0
6
No
v-06
Ma
r-07
Jul-0
7
No
v-07
Ma
r-08
Jul-0
8
No
v-08
Ma
r-09
Jul-0
9
No
v-09
Ma
r-10
Jul-1
0
No
v-10
FAI, yoy%, 3mma (lhs) FAI forecast
Export, yoy%, 3mma (rhs) Export forecast
Source: Deutsche Bank, CEIC

Deutsche Bank AG
Export-related companies vs investment goods producers
Jun Ma · (852) 2203 8308, [email protected] August 2009 · page 27
Updated list of export-related companies
Ticker Company Market cap (US$ bn) Sector DB rating
3988 HK BANK OF CHINA 140,735 Bank Buy
763 HK ZTE 8,842 Telco equipment Buy
144 HK CHINA MERCHANT 8,302 Port operator Hold
316 HK ORIENT OVERSEAS 3,358 Container shipping Buy
2038 HK FOXCONN INTL 4,646 Electronic Hold
551 HK YUE YUEN INDUS 4,488 Footwear NR
669 HK TECHTRONIC INDS 1,384 Electronic NR
285 HK BYD ELECTRONIC 1,154 Electronic Hold
321 HK TEXWINCA HLDG 1,031 Textile Buy Source: Deutsche Bank; Note: NR (none-rate) stocks are not covered by Deutsche Banks’ fundamental research and consequently we make no representations relation to the quality of the business, assets or management
Updated list of investment-related companies
Ticker Company Market cap (US$ bn) Sector DB rating
347 HK ANGANG STEEL 14,331 Steel Hold
358 HK J IANGXI COPPER 11,831 Copper Sell
1171 HK YANZHOU COAL 10,568 Coke NR
1138 HK CHINA SHIP DVLP 6,020 Dry bulk Sell
323 HK MAANSHAN IRON 5,501 Steel Sell
3993 HK CHINA MOLYBDENUM 4,038 Non-ferrous Sell
3808 HK SINOTRUCK 2,474 Truck Hold Source: Deutsche Bank; Note: NR (none-rate) stocks are not covered by Deutsche Banks’ fundamental research and consequently we make no representations relation to the quality of the business, assets or management
Deutsche Bank AG
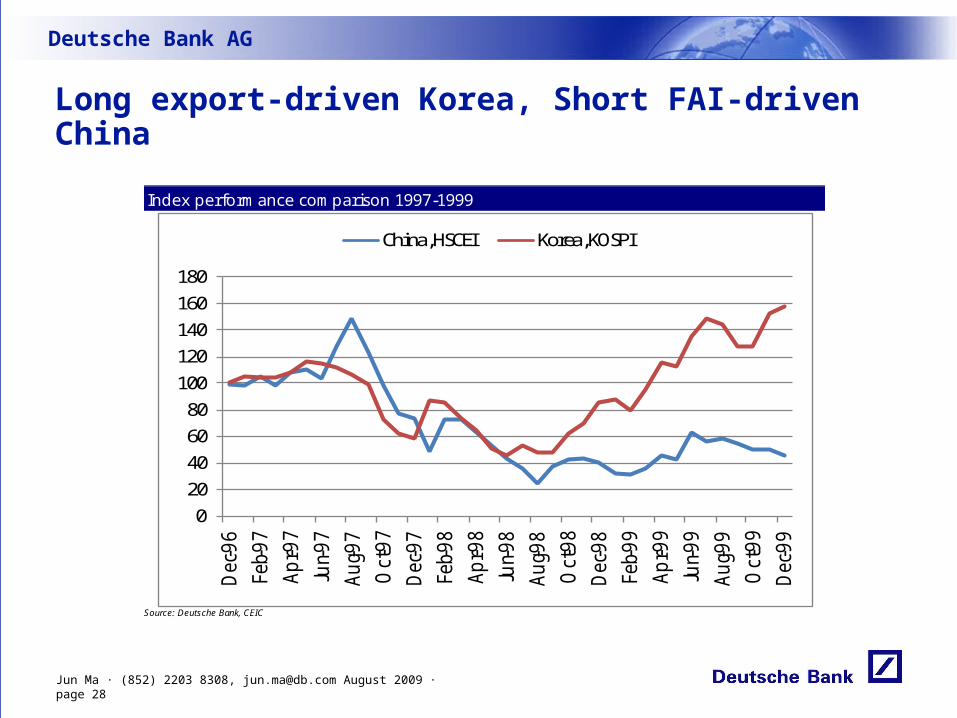
Long export-driven Korea, Short FAI-driven China
Jun Ma · (852) 2203 8308, [email protected] August 2009 · page 28
Index performance comparison 1997-1999
020406080
100120140160180
Dec
-96
Feb-
97
Ap
r-97
Jun-
97
Au
g-97
Oct
-97
Dec
-97
Feb-
98
Ap
r-98
Jun-
98
Au
g-98
Oct
-98
Dec
-98
Feb-
99
Ap
r-99
Jun-
99
Au
g-99
Oct
-99
Dec
-99
China, HSCEI Korea, KOSPI
Source: Deutsche Bank, CEIC

Deutsche Bank AG
Potential beneficiaries of new stimulus for consumer and technology
Jun Ma · (852) 2203 8308, [email protected] August 2009 · page 29
Potential beneficiaries from a second round of stimulus 28-Jun PB
Company Ticker Sector Rating Price local M. cap (US$m)
2008 2009 2009
CHSTE 0658.HK Capital Goods Buy 16.2 2,590 19.9 17.4 3.8 24%
China Dongxiang 3818.HK Consumer Durables & Apparel Buy 5.3 3,699 13.7 18.3 3.5 9%
China Foods 0506.HK Food, Beverage & Tobacco Buy 4.7 1,671 21.2 17.7 2.4 20%
Mengniu Dairy 2319.HK Food, Beverage & Tobacco Buy 18.1 3,474 NM 25.8 4.6 -207%
Golden Eagle Retail 3308.HK Retailing Buy 8.4 1,885 19.1 19.4 6.4 12%
Ports Design Limited 0589.HK Consumer Durables & Apparel Buy 18.7 1,249 23.0 20.3 6.1 8%
Gome 0493.HK Retailing Buy 1.9 3,144 24.1 18.3 2.3 -4%
Beijing Cap Int'L Airport 0694.HK Transportation Buy 5.4 3,001 302.2 67.1 1.6 99%
Yingli Green Energy YGE.N Capital Goods Hold 13.2 1,696 20.2 20.6 2.2 -15%
Ctrip CTRP.OQ Consumer Services Hold 44.8 2,966 47.9 39.3 8.7 16%
PEEPS CAGR
08-10
Source: Deutsche Bank

Deutsche Bank AG
Jun Ma · (852) 2203 8308, [email protected] August 2009 · page 30
Structural trends support sustainable growth in several consumer spending categories
Diaper
Packaging
Funeral services
Drug distribution
Online travel
Animation, etc.
Deutsche Bank AG
Jun Ma · (852) 2203 8308, [email protected] August 2009 · page 31
Inflation to surprise on upside
-- overheating or stagflation?

Deutsche Bank AG
We expect CPI inflation to rise from current -1.8% yoy to 4% by mid next year
Jun Ma · (852) 2203 8308, [email protected] August 2009 · page 32
CPI projection, yoy%
-4.0%
-2.0%
0.0%
2.0%
4.0%
6.0%
8.0%
10.0%Ja
n-08
Mar
-08
May
-08
Jul-0
8
Sep-
08
Nov
-08
Jan-
09
Mar
-09
May
-09
Jul-0
9
Sep-
09
Nov
-09
Jan-
10
Mar
-10
May
-10
Jul-1
0
Sep-
10
Nov
-10
Forecast
Source: Deutsche Bank, CEIC

Deutsche Bank AG
M2 growth, currently running at 29% yoy, will transmit to CPI with a 12-month lag
Jun Ma · (852) 2203 8308, [email protected] August 2009 · page 33
Differential between yoy M2 growth and nominal GDP growth, ppts
-20%
-15%
-10%
-5%
0%
5%
10%
15%
20%
25%
30%
Ma
r-93
Jan-
94
No
v-94
Sep-
95
Jul-9
6
Ma
y-97
Ma
r-98
Jan-
99
No
v-99
Sep-
00
Jul-0
1
Ma
y-02
Ma
r-03
Jan-
04
No
v-04
Sep-
05
Jul-0
6
Ma
y-07
Ma
r-08
Jan-
09
Source: Deutsche Bank, CEIC
Yoy M2 growth comparison – China vs. other countries, J une/J uly 2009
0%
5%
10%
15%
20%
25%
30%
35%
China India Korea Thailand UK USA Taiwan EU
Source: Deutsche Bank, CEIC
China’s M2 growth is 3 times that in the US and other major countries
M2 growth is now 24ppts higher than nominal GDP growth in China
CPI driven by M2 with 12-month lag
10%
15%
20%
25%
30%
35%
40%
45%
50%
-5%
0%
5%
10%
15%
20%
25%
30%
Jun-
91
Ma
r-92
Dec
-92
Sep-
93
Jun-
94
Ma
r-95
Dec
-95
Sep-
96
Jun-
97
Ma
r-98
Dec
-98
Sep-
99
Jun-
00
Ma
r-01
Dec
-01
Sep-
02
Jun-
03
Ma
r-04
Dec
-04
Sep-
05
Jun-
06
Ma
r-07
Dec
-07
Sep-
08
Jun-
09
CPI (lhs) M2 (rhs)
Source: Deutsche Bank, CEIC

Deutsche Bank AG
Why can inflation rise despite overcapacity?
Jun Ma · (852) 2203 8308, [email protected] August 2009 · page 34
China CPI component weights
Residence, 13%
Services, 26%
Manufactured goods, 29%
Food, 33%
Source: Deutsche Bank, CEIC
Overcapacity may restrain inflation of manufactured goods, but the majority of China’s CPI basket (71%) are non-manufacturing and are more subject to cost push inflation. The latter can be driven by speculative demand due to excess liquidity (e.g., oil, soft commodities, copper, property, etc)
Cost push inflation is perfectly possible even when capacity utilization is falling
The CPI can surge when capacity utilization falls: the US during 1973-74
70%72%74%76%78%80%82%84%86%88%90%
0.0%
2.0%
4.0%
6.0%
8.0%
10.0%
12.0%
14.0%
16.0%
Jan-
72
Ma
y-72
Sep-
72
Jan-
73
Ma
y-73
Sep-
73
Jan-
74
Ma
y-74
Sep-
74
Jan-
75
Ma
y-75
Sep-
75
Jan-
76
Ma
y-76
Sep-
76
Jan-
77
Ma
y-77
CPI, yoy % (lhs) Capacity utilization rate, % (rhs)
Source: Deutsche Bank, CEIC
Deutsche Bank AG
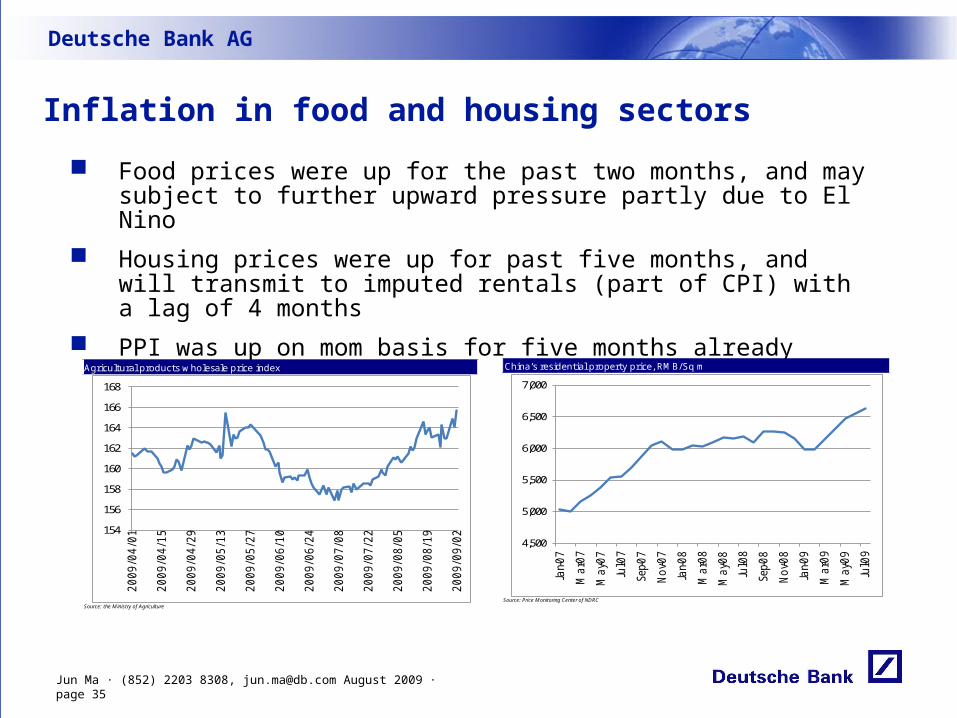
Inflation in food and housing sectors
Jun Ma · (852) 2203 8308, [email protected] August 2009 · page 35
Food prices were up for the past two months, and may subject to further upward pressure partly due to El Nino
Housing prices were up for past five months, and will transmit to imputed rentals (part of CPI) with a lag of 4 months
PPI was up on mom basis for five months already
Agricultural products wholesale price index
154
156
158
160
162
164
166
168
20
09
/04
/01
20
09
/04
/15
20
09
/04
/29
20
09
/05
/13
20
09
/05
/27
20
09
/06
/10
20
09
/06
/24
20
09
/07
/08
20
09
/07
/22
20
09
/08
/05
20
09
/08
/19
20
09
/09
/02
Source: the Ministry of Agriculture
China’s residential property price, RMB/Sq m
4,500
5,000
5,500
6,000
6,500
7,000
Jan-
07
Ma
r-07
Ma
y-07
Jul-0
7
Sep-
07
No
v-07
Jan-
08
Ma
r-08
Ma
y-08
Jul-0
8
Sep-
08
No
v-08
Jan-
09
Ma
r-09
Ma
y-09
Jul-0
9
Source: Price Monitoring Center of NDRC

Deutsche Bank AG
Medium-term (2Q10-2Q11) macro risk: overheating or stagflation?
1. Scenario I (base case: 40% probability): yoy GDP growth at around 8%, inflation at around 3%
loan and FAI growth has slowed significantly as new project starts decline and old projects are getting finished. Food and commodity prices are steady.
2. Scenario II (stagflation: 25% probability): GDP growth falling to 7%, inflation rising to 4% and uptrend continuing
inflation rising due to food price increases, speculative buying of commodities leading to PPI and then CPI increase. Very negative for equity market.
3. Scenario III (overheating: 25% probability) : GDP at 11-12%, inflation above 4% and rising
inflation due to continued strong FAI and lending growth. But eventually lead to massive policy tightening. Abrupt market reactions: from bubbles to bursting.
4. Scenario IV (high growth, no inflation, 10% probability). 10% GDP growth, CPI below 2%
monetary expansion does not transmit to inflation (historical transmission breaks down). Weather and commodities prices behave well. Best for equity.
Jun Ma · (852) 2203 8308, [email protected] August 2009 · page 36

Deutsche Bank AG
Jun Ma · (852) 2203 8308, [email protected] August 2009 · page 37
How and when to exit from stimulus?
Deutsche Bank AG
Likely roadmap for exit from expansionary policy
Jun Ma · (852) 2203 8308, [email protected] August 2009 · page 38
Q3-Q4 2009: “Fine tuning” of monetary and credit policy involving PBOC bills, window guidance, tighter policy on second home mortgages, tighter project approval for sectors with overcapacity
End-December 2009: possible change in policy tone from “loose” to “prudent” monetary policy. M2 growth target likely to be set at 15-17% for 2010, vs 27% for 2009. Fiscal policy tone may remain “proactive”.
March 2010: NPC to approve the new budget with much less increase in govt deficit. Govt capex growth will likely slow to 10-20% in 2009 from 80% in 2009.
March-June 2010: rate hikes likely, when inflation exceeds 3%
Q2 2010: RMB spot rate will likely resume appreciation, as export growth exceeds 10% and inflation rises to an uncomfortable level.

Deutsche Bank AG
Net lending deceleration is certain with or without monetary policy tightening; we forecast net lending to slow to RMB400bn per month in H2 from RMB1.2tn/m in H1Reasons for loan growth slowdown include:
• Project starts will decline in H2 by policy design.
• Two major banks have announced that they intend to slow net lending to RMB200bn in H2 from RMB800-900bn in H1.
• Many companies have over-borrowed and loan demand will slow in H2.
• PBOC and ICBC are adopting “fine-tuning” measures to slow loan growth, for fear that excess loan growth would lead to inflation, bad loans, and asset bubbles.
• Specific measures that regulators are taking right now include open market operations, window guidance, and targeted bill issuance. Next options will include an increase in the reserve requirement. CBRC will likely further tighten mortgage policies on second homes.
Jun Ma · (852) 2203 8308, [email protected] August 2009 · page 39

Deutsche Bank AG
Loan and FAI forecast, yoy %
0%5%
10%15%20%25%30%35%40%45%
Jan-
08
Ma
r-08
Ma
y-08
Jul-0
8
Sep-
08
No
v-08
Jan-
09
Ma
r-09
Ma
y-09
Jul-0
9
Sep-
09
No
v-09
Jan-
10
Ma
r-10
Ma
y-10
Jul-1
0
Sep-
10
No
v-10
Loan growth FAI single month growth
Source: Deutsche Bank, CEIC
Based on project starts profile, our projection is that yoy loan growth will peak in Q3 at 34% yoy, and decelerate towards 17% yoy at end-2010
Jun Ma · (852) 2203 8308, [email protected] August 2009 · page 40
Forecast
Deutsche Bank AG
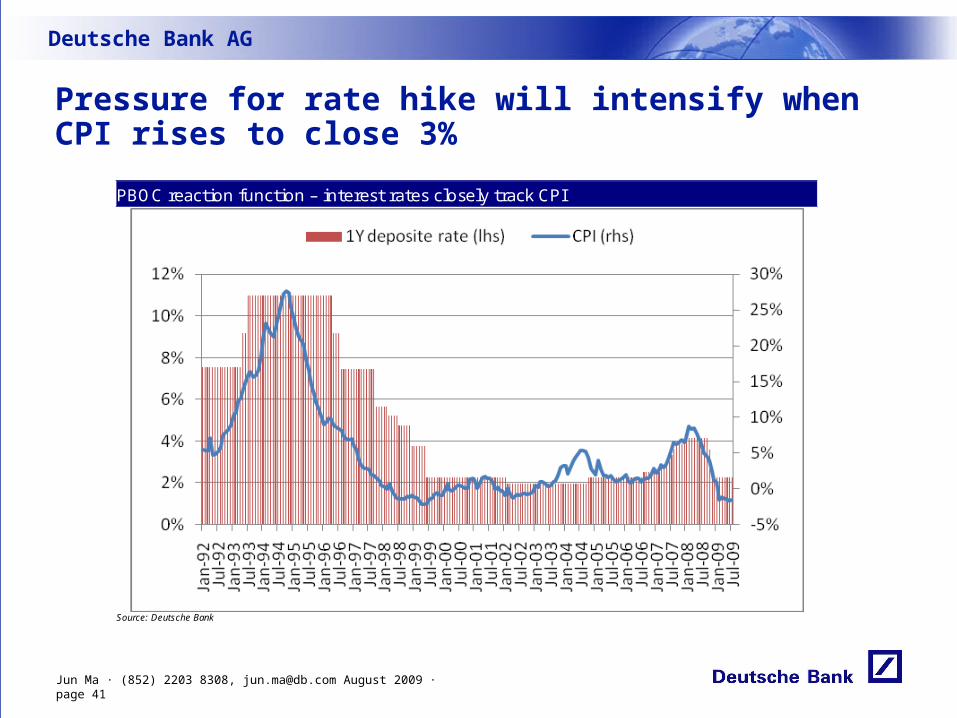
Pressure for rate hike will intensify when CPI rises to close 3%
Jun Ma · (852) 2203 8308, [email protected] August 2009 · page 41
PBOC reaction function – interest rates closely track CPI
Source: Deutsche Bank

Deutsche Bank AG
Mar-Jun 10 is good timing of rate hikes – justified by overheating concern but constrained by stagflation concern
Jun Ma · (852) 2203 8308, [email protected] August 2009 · page 42
Overheating and Stagflation? Look at what GDP and CPI say
-2%
-1%
0%
1%
2%
3%
4%
5%
6%
6%
7%
8%
9%
10%
11%
12%
GDP, yoy % CPI, yoy %
Source: Deutsche Bank
Stagflation concern
Overheating concern

Deutsche Bank AG
How to play inflation
Jun Ma · (852) 2203 8308, [email protected] August 2009 · page 43
Potential Victim #1: Property Mortgage demand is most sensitive to rate hikesProperty companies are highly leveraged
Potential Victim # 2: Oil reining, IPPs, and F&B processing
When CPI inflation rises to 4%, the government tends to exercise price intervention, which will depress margin
Banking? Impact on NIM depends on how asymmetric the rate
hikes will beMacro sentiment tends to suffer as there will be growing
fear of overheating or stagflationBeneficiaries
Insurance, soft commodities, retailers, and airlines
Deutsche Bank AG
Jun Ma · (852) 2203 8308, [email protected] August 2009 · page 44
This year’s fiscal stimulus unlikely to be repeated next year
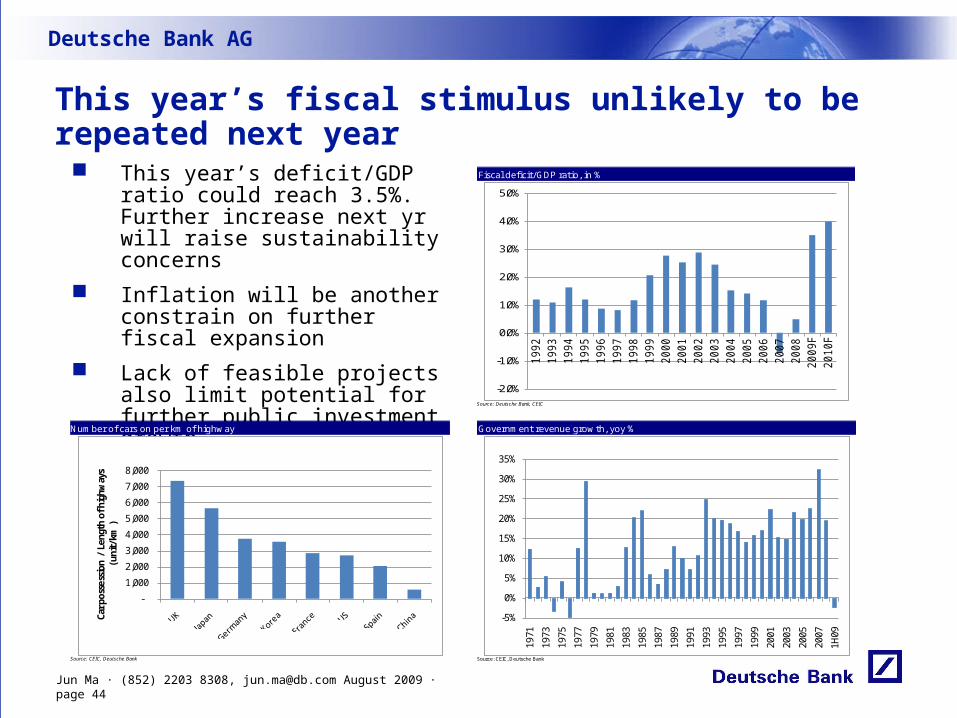
This year’s deficit/GDP ratio could reach 3.5%. Further increase next yr will raise sustainability concerns
Inflation will be another constrain on further fiscal expansion
Lack of feasible projects also limit potential for further public investment growth
Number of cars on per km of highway
-
1,000
2,000
3,000
4,000
5,000
6,000
7,000
8,000
Car p
osse
ssio
n /
Leng
th o
f hig
hway
s
( u
nit/
km )
Source: CEIC, Deutsche Bank
Government revenue growth, yoy %
-5%
0%
5%
10%
15%
20%
25%
30%
35%
1971
1973
1975
1977
1979
1981
1983
1985
1987
1989
1991
1993
1995
1997
1999
2001
2003
2005
2007
1H09
Source: CEIC, Deutsche Bank
Fiscal deficit/GDP ratio, in %
-2.0%
-1.0%
0.0%
1.0%
2.0%
3.0%
4.0%
5.0%
19
92
19
93
19
94
19
95
19
96
19
97
19
98
19
99
20
00
20
01
20
02
20
03
20
04
20
05
20
06
20
07
20
08
20
09
F
20
10
F
Source: Deutsche Bank, CEIC

Deutsche Bank AG
Shift of fiscal focus to supporting consumption and tech
• Size of 2010 stimulus will be smaller
• New stimulus will be much less investment focused • State Council said recently that [we] “should stimulate domestic demand especially
consumer demand, and keep investment growth steady”
• New stimulus will have to be more focused on social welfare and consumption, and technology• Proposals made include using tax policy, consumer coupons, and govt investments to
stimulate• Milk consumption• Wine consumption• Travel consumption• Sports and cultural activities• Credit card• Alternative energy• Incentives for R&D and upgrading
Jun Ma · (852) 2203 8308, [email protected] August 2009 · page 45
Deutsche Bank AG
RMB will likely resume appreciation from Q2
Jun Ma · (852) 2203 8308, [email protected] August 2009 · page 46
By Q2 2001, we expect export growth will be close to 10% yoy, and should eliminate the most important reason that led to the early decision to stop RMB appreciation
Inflation of 3-4% will provide another argument for using RMB appreciation to contain imported inflation
So we expect RMB spot rate to resume appreciation from Q2 next year
RMB NDR should start reflect the appreciation trend from end of this year or beginning of next year
Deutsche Bank AG
Jun Ma · (852) 2203 8308, [email protected] August 2009 · page 47
Market Outlook and Strategy

Deutsche Bank AG
Jun Ma · (852) 2203 8308, [email protected] August 2009 · page 48
DB EPS forecasts and market valuations
Valuation and EPS forecast
EPS growth (%) 2008A 2009F 2010F
HSI -11.6 1.2 11.0
HSCEI -13.8 18.3 18.5
MSCI HK -6.9 -11.2 14.4
MSCI CN -13.0 15.8 17.5
SHCOMP -16.4 27.1 22.4
P/E 2008A 2009F 2010F
HSI 11.4 16.4 14.7
HSCEI 12.0 15.6 13.2
MSCI HK 12.4 20.7 18.1
MSCI CN 12.6 16.1 13.7
SHCOMP 27.6 21.1 17.2 Note: Data as of September 9 2009 Source: Deutsche Bank

Deutsche Bank AG
Jun Ma · (852) 2203 8308, [email protected] August 2009 · page 49
We think China’s equity market will under perform markets in other
Asia economies (e.g. Korea) which are mainly driven by the US recovery. This is because China is beginning to experience qoq economic deceleration due to fading stimulus, while the US is just beginning its exceptionally strong sequential recovery.
On China market indices, we see upside in the remainder of this year, as in the initial stage of inflation corporates tend to be net beneficiaries. In H1 next year, the macro environment -- further inflation and mounting pressure for rate hikes/price control as well as stagflation fear– will become negative to the market.
Within H1 next year, market sentiment will likely be volatile, switching from the initial fear of overheating to mid year’s stagflation. Banks’ NIM and many corporates’ margin will swing.
On sectors, we are overweight on export-related sectors (til end of this year) followed by consumer, technology and insurance. We dislike investment-related sectors (in short term), property (from next year), oil refining and power (from next year).
Market outlook and strategy

Deutsche Bank AG
Jun Ma · (852) 2203 8308, [email protected] August 2009 · page 50
Our top Buys
Top 10 picks 9-Sep PB
Company Ticker Sector Rating Price
local
M. cap
(US$m)2009 2010 2009
China Life Insurance 2628.HK Insurance Buy 35.0 127,640 27.8 22.4 4.0 35%
Bank Of China 3988.HK Banks Buy 4.2 135,919 12.4 10.5 1.9 17%
OOIL 0316.HK Transportation Buy 44.3 3,573 NM 40.2 0.9 -43%
CHSTE 0658.HK Capital Goods Buy 18.0 2,885 21.6 16.4 4.4 37%
Golden Eagle Retail 3308.HK Retailing Buy 11.0 2,511 23.5 20.7 8.9 21%
Tencent 0700.HK Software & Services Buy 128.5 29,664 41.3 30.3 18.0 57%
China Comservice 0552.HK Telecommunication ServicesBuy 4.6 3,433 14.2 12.9 1.7 17%
Hengan Intl. 1044.HK Household & Personal ProductsBuy 44.7 7,012 26.8 22.0 6.7 36%
China Merchants 0144.HK Transportation Buy 27.4 8,568 23.7 20.4 2.1 3%
Foxconn Int'L Holdings 2038.HK Technology Hardware & EquipmentHold 4.9 4,400 43.2 15.7 1.3 53%
HSCEI 15.4 13.9 2.1 19%
PE EPS
CAGR 08-
10
Source: Deutsche Bank

Deutsche Bank AG
Jun Ma · (852) 2203 8308, [email protected] August 2009 · page 51
Appendix 1
Important DisclosuresAdditional Information Available upon Request
For disclosures pertaining to recommendations or estimates made on securities other than the primary subject of this research, please see the most recently published company report or visit our global disclosure look-up page on our website at http://gm.db.com.
Analyst Certification
The views expressed in this report accurately reflect the personal views of the undersigned lead analyst(s). In addition, the undersigned lead analyst(s) has not and will not receive any compensation for providing a specific recommendation or view in this report. Jun Ma

Deutsche Bank AG
Jun Ma · (852) 2203 8308, [email protected] August 2009 · page 52
Regulatory Disclosures
1. Important Additional Conflict Disclosures
Aside from within this report, important conflict disclosures can also be found at https://gm.db.com/equities under the “Disclosures Lookup” and “Legal” tabs. Investors are strongly encouraged to review this information before investing.
2. Short-Term Trade Ideas
Deutsche Bank equity research analysts sometimes have shorter-term trade ideas (known as SOLAR ideas) that are consistent or inconsistent with Deutsche Bank’s existing longer term ratings. These trade ideas can be found at the SOLAR link at http://gm.db.com.
3. Country-Specific Disclosures
Australia: This research, and any access to it, is intended only for “wholesale clients” within the meaning of the Australian Corporations Act.
EU countries: Disclosures relating to our obligations under MiFiD can be found at http://globalmarkets.db.com/riskdisclosures.
Japan: Disclosures under the Financial Instruments and Exchange Law: Company name – Deutsche Securities Inc. Registration number – Registered as a financial instruments dealer by the Head of the Kanto Local Finance Bureau (Kinsho) No. 117. Member of associations: JSDA, The Financial Futures Association of Japan. Commissions and risks involved in stock transactions – for stock transactions, we charge stock commissions and consumption tax by multiplying the transaction amount by the commission rate agreed with each customer. Stock transactions can lead to losses as a result of share price fluctuations and other factors. Transactions in foreign stocks can lead to additional losses stemming from foreign exchange fluctuations.
New Zealand: This research is not intended for, and should not be given to, “members of the public” within the meaning of the New Zealand Securities Market Act 1988.
Russia: This information, interpretation and opinions submitted herein are not in the context of, and do not constitute, any appraisal or evaluation activity requiring a license in the Russian Federation.