cise.luiss - european university institute - europe's ... · 2008 2013 variation var. ......
TRANSCRIPT

Cise.luiss.it

Total volatility, Chamber, 1948-2013
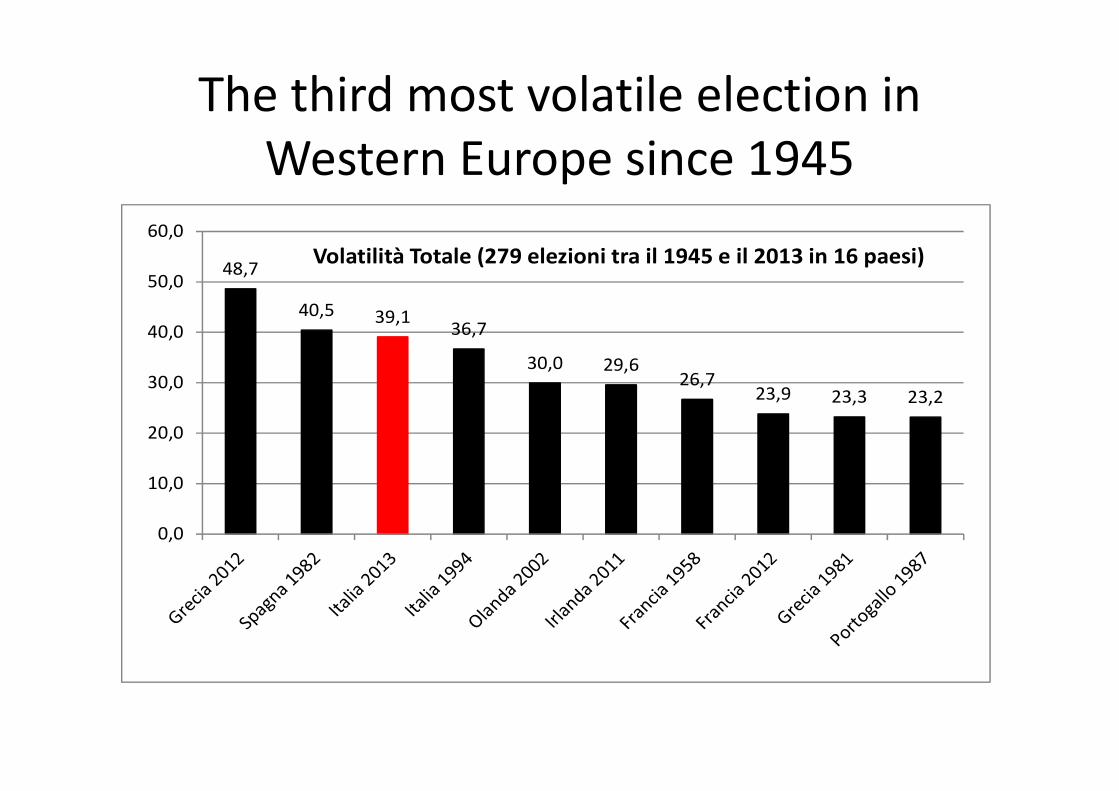
The third most volatile election in
Western Europe since 1945
48,7
40,5 39,136,7
30,0 29,626,7
23,9 23,3 23,2
0,0
10,0
20,0
30,0
40,0
50,0
60,0
Volatilità Totale (279 elezioni tra il 1945 e il 2013 in 16 paesi)

Losses (and gains…)
2008 2013 variation var. (alliance)
Il Popolo Della Liberta' 13,629,464 7,332,667 -46%
-42%Others (Berlusconi) 410,309 1,200,286 +193%
Lega Nord 3,024,543 1,390,156 -54%
Partito Democratico 12,095,306 8,644,187 -29%-27%
Others (Bersani) 1,591,154 1,403,416 -12%
Udc 2,050,229 608,199 -70%
+75%Scelta Civica Con Monti 2,824,001
Fli 159,332
Movimento 5 Stelle 8,689,168

Two-party index, Chamber, 1994-2013

Index of bipolarism (coalitions), Chamber, 1994-2013

Three parties in a four-point range
Party lists votes % votes %
Movimento 5 Stelle 8.689.168 25,6 7.285.648 23,8
Partito Democratico 8.644.187 25,4 8.399.991 27,4
Il Popolo Della Liberta' 7.332.667 21,6 6.829.135 22,3
Scelta Civica Con Monti 2.824.001 8,3 2.797.451 9,1
Lega Nord 1.390.156 4,1 1.328.555 4,3
Sinistra Ecologia Liberta' 1.089.442 3,2 912.347 3,0
Unione Di Centro 608.199 1,8
Others (Berlusconi) 1.200.286 3,5 1.248.096 4,0
Others (Bersani) 313.974 0,9 374.060 1,2
Others (Monti) 159.429 0,5
Others 1.751.014 5,1 1.442.262 4,8
Totale 34.002.523 30.617.545
House Senate

House – Senate, votes by lists , n. and %
N VOTI % VOTI N VOTI % VOTI
Coalizione Bersani 10.047.603 29,5 9.686.398 31,6
Coalizione Berlusconi 9.923.109 29,2 9.405.786 30,7
Movimento 5 Stelle 8.689.168 25,6 7.285.648 23,8
Coalizione Monti 3.591.629 10,6 2.797.451 9,1
Altri 1.751.014 5,1 1.442.262 4,8
Totale 34.002.523 30.617.545
CAMERA SENATO

Lega nord (1)
M5S (50)
Pd (40)
Pdl (17)
altri (2)
44
28
26
29
28
27
32
24
28
27
32
28
27
24
32
31
30
30
29
41
41
25
32
34
28
44
26
31
28
25
31
36
27
23
28
25
36
28
26
28
24
28
31
29
2225
39
32
35
30
29
30
34
26
29
37
24
36
30
40
41
2626
32
27
37
33
25
27
31
32
40
30
30
32
28
26
39
28
33
33
26
30
31
24
32
23
34 35
26 29
37
2726
27
23
32
30
27
30
38
31
32
33
26
27
30
25
37
38
29
Primo partito per provincia
c
Colors identify the largest party
in each province;Values are valid votes pcts [Source: Cataldi
and Emanuele 2013

Prima coalizione per Provincia
cdx (Berlusconi)
csx (Bersani)
M5S
altri
59
32
32
31
28
35
35
31
32
33
32
38
28
40
32
35
31
37
32
46
45
28
32
36
31
49
32
33
30
25
36
39
34
44
32
36
36
28
37
30
29
33
31
29
4133
42
38
38
30
32
30
34
33 29
32
41
31
38
33
40
44
3335
39
31
37
36
37
35
33
34
32
43
36
36
33
31
29
39
32
33
36
33
32
31
31
34
32
39
34
34
32
36
38
32
3036
41
32
43
32
35
33
35
36
34
35
40
43
29
Colors identify the largest
alliance in each province;Values are valid votes pcts [Source:
Cataldi and Emanuele 2013]

CSX,CDX e M5S votes by size of municipalities , Chamber, 2013, %

• 2005 electoral reform: proportional system with a majority premium
• In the Chamber: the list or coalition with the plurality of votes is guaranteed a minimum of 340 seats (54% of the Chamber). The remaining seats are proportionally distributed to the other lists (4% threshold) and coalitions (10% threshold). It’s a majority-assuring electoral system
• In the Senate: the distribution of seats takes place at the regional level (20 regions). In 17 regions the list or coalition with the plurality of votes is guaranteed 55% of the seats at stake in the region. The remaining seats are proportionally distributed to the other lists (8% threshold) and coalitions (20% threshold). It’s not a majority-assuring electoral system
THE CALDEROLI ELECTORAL LAW
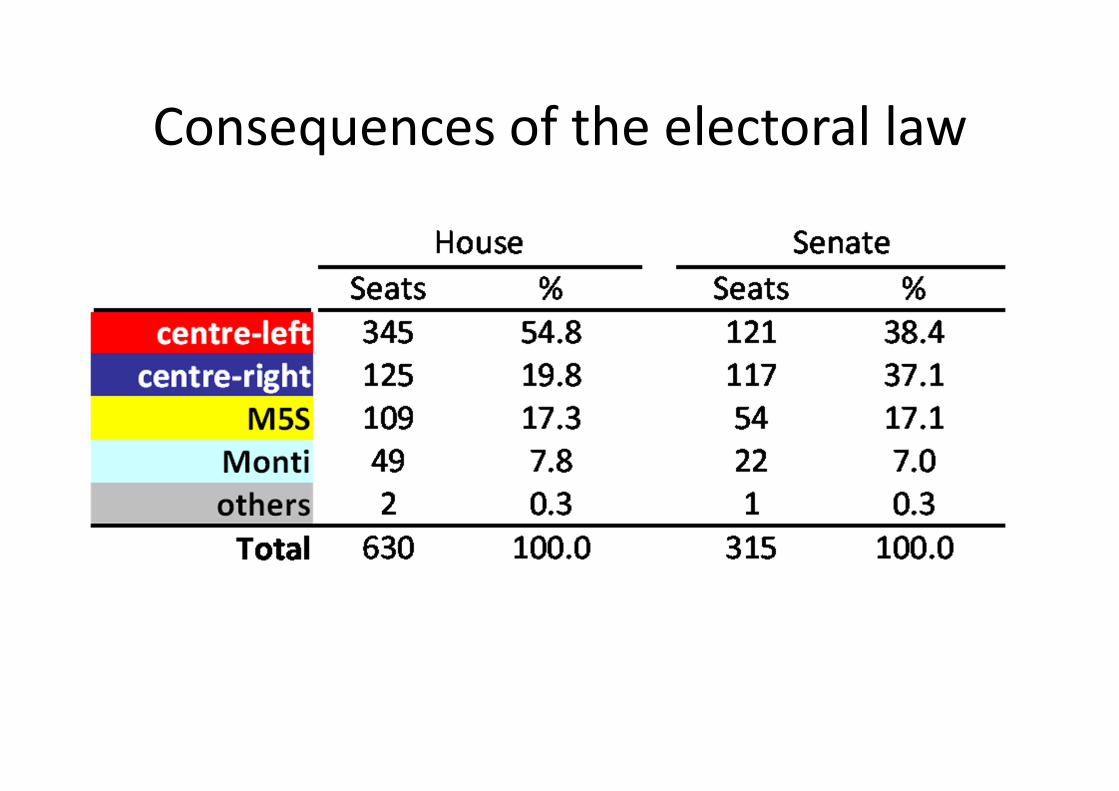
Consequences of the electoral law

The battle for the senate:
seats at stake in each region
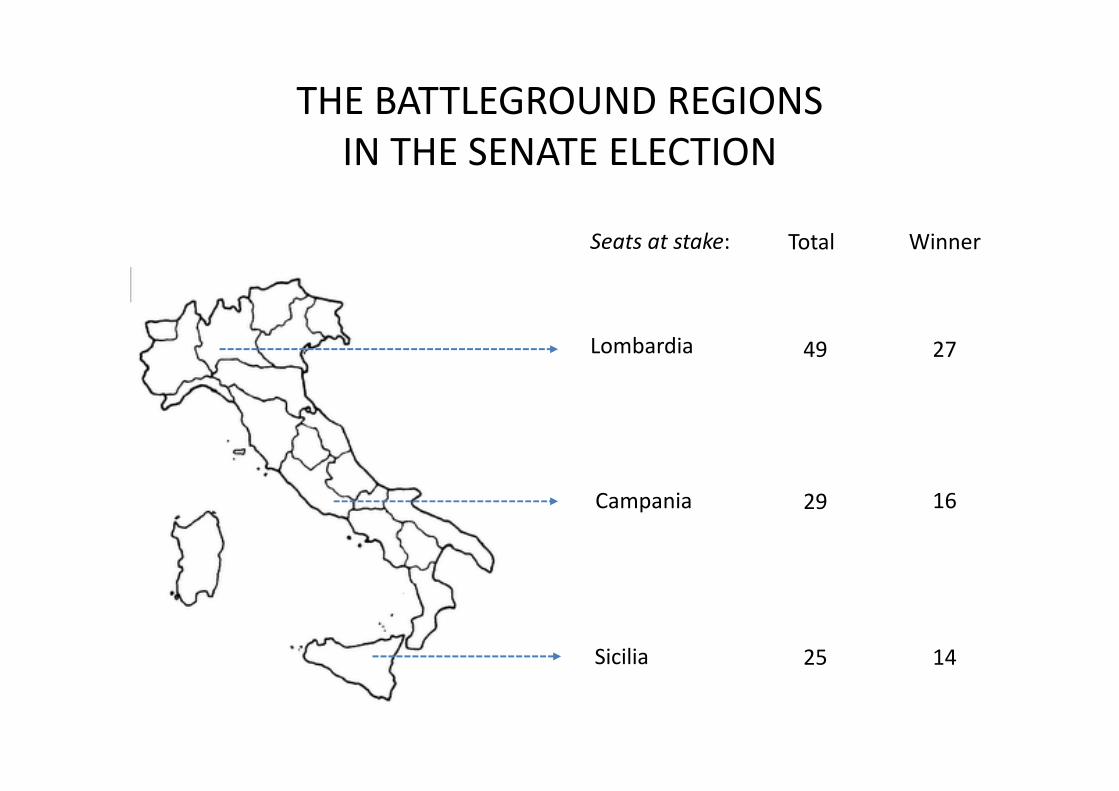
THE BATTLEGROUND REGIONS
IN THE SENATE ELECTION
Lombardia
Sicilia
Campania
Total
49
Winner
27
29 16
1425
Seats at stake:

Senate, % votes by regionCd Cs Mon M5S Altri
Piemonte 29,3 29,8 11,6 25,7 3,6Lombardia 37,6 29,7 10,7 17,4 4,6Veneto 32,8 25,0 11,0 24,6 6,6Friuli 28,8 29,3 12,3 25,4 4,2Liguria 24,1 33,0 9,3 30,3 3,3Emilia 21,3 42,1 8,9 23,0 4,7Toscana 21,3 43,4 8,1 22,7 4,5Umbria 25,3 37,6 8,3 25,3 3,5Marche 22,2 33,2 10,0 30,3 4,3Lazio 28,9 32,3 7,5 25,9 5,4Abruzzo 29,6 28,0 7,5 28,4 6,5Campania 37,4 29,0 8,2 20,7 4,7Puglia 34,4 28,4 9,1 24,1 4,0Basilicata 25,3 36,7 8,4 22,9 6,7Calabria 33,3 31,7 7,6 22,2 5,2Sicilia 33,4 27,3 5,9 29,5 3,9
Sardegna 25,5 31,7 6,5 28,7 7,6
Voti Italia 30,7 31,6 9,1 23,8 4,8
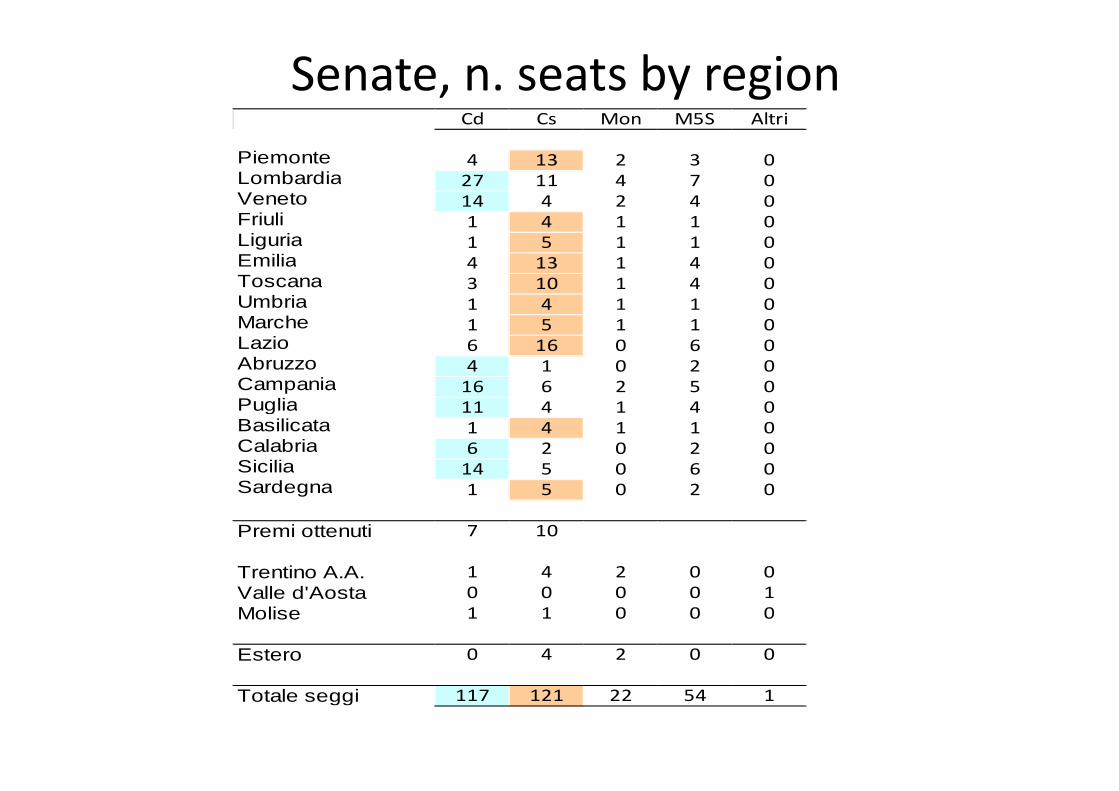
Senate, n. seats by regionCd Cs Mon M5S Altri
Piemonte 4 13 2 3 0Lombardia 27 11 4 7 0Veneto 14 4 2 4 0Friuli 1 4 1 1 0Liguria 1 5 1 1 0Emilia 4 13 1 4 0Toscana 3 10 1 4 0Umbria 1 4 1 1 0Marche 1 5 1 1 0Lazio 6 16 0 6 0Abruzzo 4 1 0 2 0Campania 16 6 2 5 0Puglia 11 4 1 4 0Basilicata 1 4 1 1 0Calabria 6 2 0 2 0Sicilia 14 5 0 6 0Sardegna 1 5 0 2 0
Premi ottenuti 7 10
Trentino A.A. 1 4 2 0 0
Valle d'Aosta 0 0 0 0 1
Molise 1 1 0 0 0
Estero 0 4 2 0 0
Totale seggi 117 121 22 54 1

The battleground regions:
POLLS in CAMPANIA
0
5
10
15
20
25
30
35
40
27-Dec 1-Jan 6-Jan 11-Jan 16-Jan 21-Jan 26-Jan 31-Jan
% o
f v
ote
s
Date of poll
LEFT RIGHT Linear (LEFT) Linear (RIGHT)
DATE SOC. LEFT RIGHT
28-Jan IPR 34 30
25-gen EUROMEDIA 33 30
21-Jan TECNE' 32 28
21-Jan QUORUM 34 32
21-Jan IPR 35 31
14-Jan IPR 35 32
11-Jan EUROMEDIA 34 32
2-Jan IPSOS 31 29

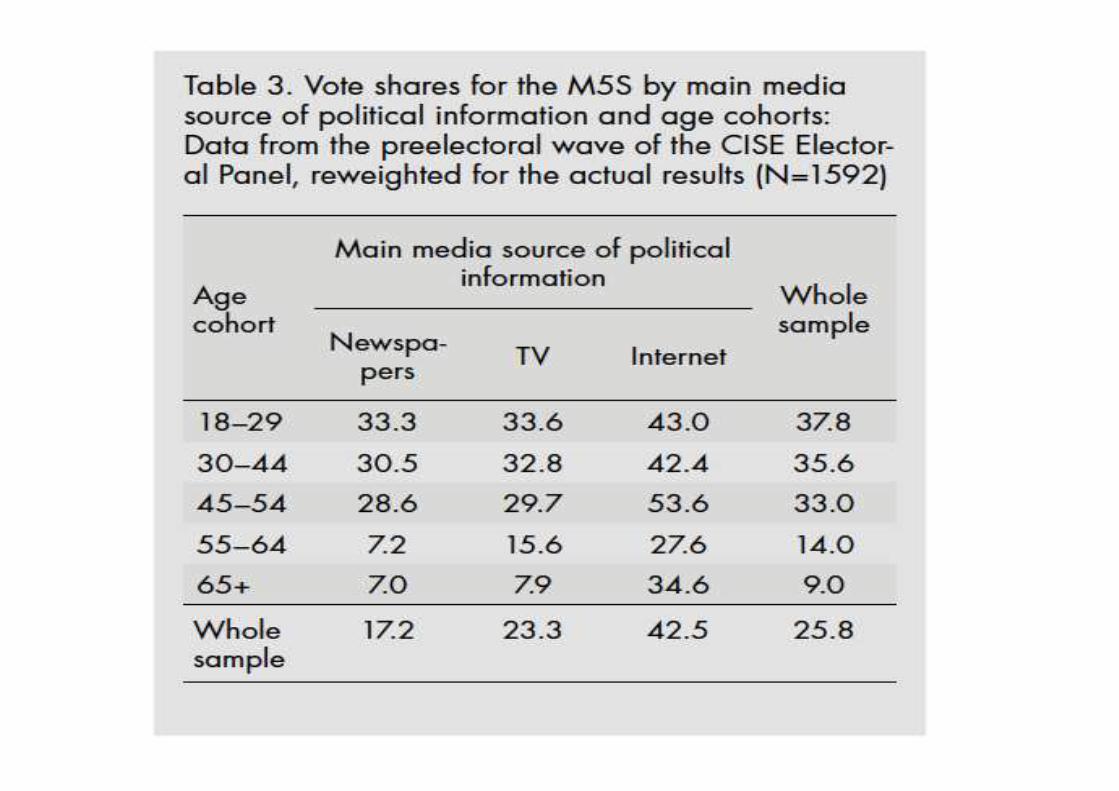
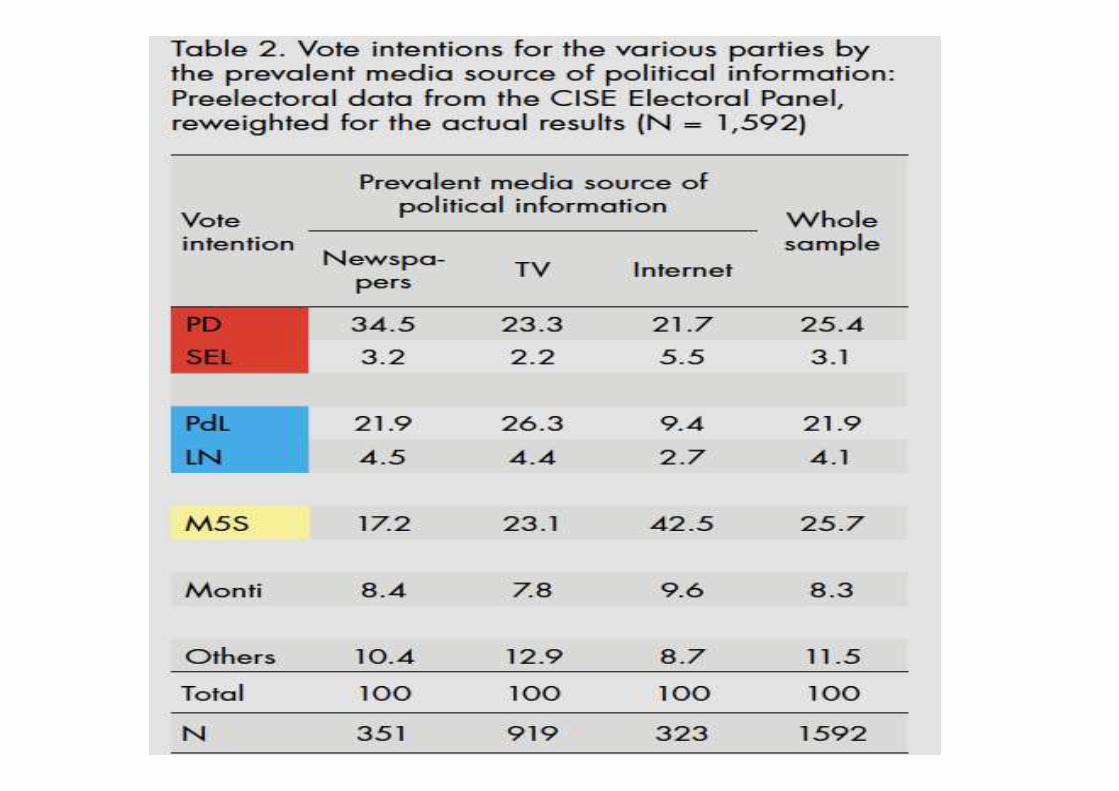
Younger and more educated reward M5S(source: IPSOS Public Affairs)
18-24 35% 19% 19% 8% 4%
25-34 29% 20% 22% 7% 5%
35-44 34% 20% 19% 9% 4%
45-54 32% 21% 20% 9% 4%
55-64 20% 32% 22% 8% 3%
65+ 10% 37% 27% 9% 4%
MoV. 5
StellePD PDL
Scelta
Civica /
Monti
Lega Nord
Whole sample 25,5% 25,4% 21,6% 8,3% 4,1%
by age group:
(N=11026 – pooled pre-election polls on 18-22 feb 2013)
University degree 29% 27% 15% 11% 2%
High school diploma 31% 25% 18% 8% 2%
Middle school 28% 23% 23% 8% 4%
Elementary 14% 29% 27% 8% 8%
by level of education:

MoV. 5
StellePD PDL
Scelta
Civica con
Monti
Lega Nord
Whole sample 25,5% 25,4% 21,6% 8,3% 4,1%
Entrepreneurs/professionals/managers 25% 23% 17% 13% 3%
Self-employed 39% 15% 20% 7% 3%
Clerks/teachers 31% 25% 15% 9% 5%
Manual workers 29% 20% 24% 7% 5%
Unemployed 33% 18% 25% 4% 4%
Students 37% 23% 11% 9% 1%
Housewives 21% 22% 29% 9% 5%
Retired 11% 37% 25% 9% 4%
Public sector 31% 29% 14% 9% 4%
Private sector 30% 21% 20% 9% 5%
by profession:
by sector:
Active professional sectors reward M5S(source: IPSOS Public Affairs)
(N=11026 – pooled pre-election polls on 18-22 feb 2013)

MoV. 5 Stelle
PD PDLScelta
Civica/ Monti
Lega
Nord
Whole sample: 25,5% 25,4% 21,6% 8,3% 4,1%
Media audience segmentation?(source: IPSOS Public Affairs)
(N=11026 – pooled pre-election polls on 18-22 feb 2013)
Only through TV 22% 25% 25% 10% 4%
Mostly through TV 24% 26% 23% 10% 4%
Mostly through newspapers 21% 30% 23% 7% 4%
Mostly through the Internet 45% 19% 11% 6% 3%
Mostly through radio 25% 19% 18% 10% 12%
by source of political information:

Women elected in Parliament, %
12.7
9.6 10.1
16.3
20.2
30.8
0
5
10
15
20
25
30
35
1994 1996 2001 2006 2008 2013
Stato %Svezia 44,7
Finlandia 42,5
Islanda 39,7
Norvegia 39,6
Danimarca 39,1
Belgio 38,9
Paesi Bassi 37,8
Spagna 35,2
Germania 32,4
Nuova Zelanda 32,2
Italia 30,8
Australia 29,2
Portogallo 28,7
Austria 28,7
Canada 28,0
Svizzera 27,2
Francia 25,1
Regno Unito 22,6
Polonia 21,8
Israele 21,7
Grecia 21,0
Irlanda 19,0
USA 18,2
Giappone 11,3