city of novi, michigan...trend data for novi represent important comparisons and should be examined...
TRANSCRIPT

2955 Valmont Road, Suite 300• Boulder, Colorado 80301
www.n-r-c.com • 303-444-7863
City of Novi, Michigan 2012
Full Report

CASOA™ Full Report | The City of Novi • • •
Co
mm
un
ity
Ass
essm
ent
Surv
ey f
or
Old
er A
du
lts™
© 2
00
7 N
atio
nal
Res
earc
h C
ente
r, In
c.
C o n t e n t s
Introduction .................................................................................................................................................. 1 About CASOA ............................................................................................................................................................. 2 City of Novi Methods ................................................................................................................................................. 3 Structure of the CASOA™ Report ............................................................................................................................... 4 Benchmark Comparison Data .................................................................................................................................... 4
Key Findings .................................................................................................................................................. 6 Novi Opportunities and Challenges ........................................................................................................................... 6 Older Resident Needs in Novi .................................................................................................................................... 8 Populations at High Risk .......................................................................................................................................... 11 Contributions of Older Adults to Novi ..................................................................................................................... 12
Age Wave in the City of Novi ...................................................................................................................... 14 Demographics .......................................................................................................................................................... 14 A Profile of Older Adults in Novi .............................................................................................................................. 15
Overall Quality of the Community .............................................................................................................. 16
A Closer Look at Older Adult Needs ............................................................................................................ 21 Health and Wellness ................................................................................................................................................ 21 Community Design and Land Use ............................................................................................................................ 30 Productive Activities ................................................................................................................................................ 35 Community Information .......................................................................................................................................... 52
Recommendations and Conclusions ........................................................................................................... 55
Appendix A: Older Adult Needs .................................................................................................................. 66
Appendix B: Complete Set of Survey Frequencies ...................................................................................... 68 Frequencies Excluding Don’t Know Responses ........................................................................................................ 68 Frequencies Including Don’t Know Responses ........................................................................................................ 78
Appendix C: Survey Methodology .............................................................................................................. 92 Data Collection Methods Used in the CASOA™ ....................................................................................................... 92 Estimates of the Contribution of Older Adults to the Economy .............................................................................. 96 Community Summary Scores ................................................................................................................................... 97 Needs Summary Scores ........................................................................................................................................... 98
Appendix D: References ............................................................................................................................ 101
Appendix E: Survey Materials ................................................................................................................... 104

CASOA™ Full Report | The City of Novi • • 1 • •
Co
mm
un
ity
Ass
essm
ent
Surv
ey f
or
Old
er A
du
lts™
© 2
01
2 N
atio
nal
Res
earc
h C
ente
r, In
c.
I n t r o d u c t i o n
With more than one-half of the Baby Boom generation now age 50 and older, the nation is increasingly becoming populated by older adults. One-third of the U.S. population reached this senior milestone by 2010. Aging not only occurs to nations and individuals, it happens to communities. Hoping for healthy older adults cannot transform the inevitable declines that most people face as they age. Even a healthier America will not avert the need to assist older adults who are frail. The Older Americans Act (OAA) currently supports a national aging services network that provides home and community-based services to over eight million older adults. Services provided by the network include home-delivered meals, nutrition education, transportation, adult day care, health promotion and the support of caregivers.1 But the OAA alone cannot ride to the rescue of those among the 75 million aging Baby Boomers who will press unprecedented demands on this country’s social services. And the OAA cannot keep all older adults well and independent. More must be done and done by more actors. The traditional model of government service to needy recipients is unsustainable.
Therefore, much of the planning for this demographic swell must be led not just by Congress and national organizations, but by city councilors, Area Agency on Aging advisory boards, county commissioners, faith communities, service club members, college presidents, hospital administrators, business owners and community members. An aging world need not be a place where human resources diminish and productivity flags. With proper planning, communities filled with older adults can become centers of high quality human scale living, anchored by the contributions of civically engaged older residents.
American communities can choose a future that both protects vulnerable older adults and challenges those who thrive. A well-conceived and updated community will provide care to older adults that need it at the same time empowering older adults with far greater opportunities than exist now to age successfully and contribute. But not every community faces the same future nor do all older residents seek the same services. Whatever the unique needs in each community, one common circumstance will prevail. Resources will have to be reallocated. As populations age there will be changes in taste that will affect local news, arts, politics and even groceries, but needs that require more planning will emerge and anticipation of those needs, rather than surprise confrontation, will lead to communities that prosper because they are comfortable for and attractive to older adults.
This report offers a picture of community need that creates a model of local challenges and priority solutions. This needs assessment will show the current age profile of the City. In its monograph, “Active Living for Older Adults,” the International City/County Management Association (ICMA) calls for involving “older residents early in the decision-making process,”2 and to do that with, among other tools, surveys and focus groups of older adults themselves. Older adult needs cannot be understood clearly without talking to older adults, so a statistically valid survey of older residents is essential to hear the voice of the people who are to be served.
CASOA™ Full Report | The City of Novi • • 2 • •
Co
mm
un
ity
Ass
essm
ent
Surv
ey f
or
Old
er A
du
lts™
© 2
01
2 N
atio
nal
Res
earc
h C
ente
r, In
c.
About CASOA
The Community Assessment Survey for Older Adults (CASOA™) provides a statistically valid survey of the strengths and needs of older adults as reported by older adults themselves in communities across America. This report is intended to enable local governments, community-based organizations, the private sector and other community members to understand more accurately and predict more carefully the services and resources required to serve an aging population. With this report, Novi stakeholders can shape public policy, educate the public and assist communities and organizations in their efforts to sustain a high quality of life for older adults. The objectives of the CASOA™ are to:
• Identify community strengths in serving older adults. • Articulate the specific needs of older adults in the community. • Estimate contributions made by older adults to the community. • Determine the connection of older adults to the community.
The results of this exploration will provide useful information for planning and resource development as well as strengthen advocacy efforts and stakeholder engagement. The ultimate goal of the assessment is to create empowered communities that support vibrant older adult populations.
The CASOA™ questionnaire contains many questions related to the life of older residents in the community. Survey participants were asked to rate their overall quality of life, as well as aspects of quality of life in Novi. They also evaluated characteristics of the community, and gave their perceptions of safety in Novi. The questionnaire assessed the individual needs of older residents and involvement by respondents in the civic and economic life of Novi.

CASOA™ Full Report | The City of Novi • • 3 • •
Co
mm
un
ity
Ass
essm
ent
Surv
ey f
or
Old
er A
du
lts™
© 2
01
2 N
atio
nal
Res
earc
h C
ente
r, In
c.
Figure 1: CASOA™ Methods and Goals
City of Novi Methods
The survey and its administration are standardized to assure high quality survey methods and comparable results across CASOA™ jurisdictions. Participating households with residents 55 years or older were selected at random and the household member who responded was selected without bias. Multiple mailings gave each household more than one prompt to participate with a self-addressed and postage-paid envelope to return the survey. Results were statistically weighted to reflect the proper demographic composition of older adults in the entire community.
The survey was mailed in January 2012 to a random selection of 1,000 older adult households in Novi. Older adult households were contacted three times about participation in the survey. A total of 349 completed surveys was obtained, providing an overall response rate of 36% and a margin of error of plus or minus 5% around any given percent and three points around any given average rating for the entire sample.
Since this was the second CASOA™ of Novi older adults, the 2012 results are presented along with the 2007 ratings, when available. Differences between 2007 and 2011 can be considered “statistically significant” if they are seven percentage points or greater. Trend data for Novi represent important comparisons and should be examined for improvements or declines.
For additional methodological information, refer to Appendix C: Survey Methodology.
Assessment Goals
Assessment Methods Assessment Objectives
Multi-contact mailed survey
Representative sample of 1,000 households of residents 55+
349 surveys returned; 5% margin of error
36% response rate
Data statistically weighted to reflect population
Immediate
Useful information for:
Planning
Resource allocation and development
Advocacy
Engagement
Identify community strengths and weaknesses
Articulate the specific needs of older adults in the community
Develop estimates and projections of resident need in the future
Intermediate
Improved program mix
Better quality programs
More effective policies
In time, a community of elders that is
More engaged
More supportive
More empowered
More independent
More vibrant

CASOA™ Full Report | The City of Novi • • 4 • •
Co
mm
un
ity
Ass
essm
ent
Surv
ey f
or
Old
er A
du
lts™
© 2
01
2 N
atio
nal
Res
earc
h C
ente
r, In
c.
Structure of the CASOA™ Report
This report is based around our categories of community: health and wellness, community land use and design, participation in productive activities and community resources for information and planning. Within each chapter of the report, data related to community readiness to serve older adults and specific strengths and needs of older adults are presented, along with comparisons to the 2007 survey, where available. Each chapter and section begins with older residents’ ratings of Novi and is followed by resident behaviors and needs. Preceding these areas of strength and need is a demographic profile of older adults in Novi and general ratings of Novi as a place for older residents.
It should be noted that when a table for a question that only permitted a single response does not total to exactly 100%, it is due to the common practice of percentages being rounded to the nearest whole number.
Figure 2: Older Adults Needs and Strengths Assessed through CASOA
Health and Wellness
Community Design and Land Use
Productive Activities
Community Information
Physical HealthOverall health status, nutrition,
fitness, falls, days institutionalized
Mental HealthOverall mental health, depression,
confusion or forgetfulness
Health CareMedications, affordable health
insurance
Independent LivingActivities of Daily Living (ADLs),
caregiver burden
Land UseEase of getting to activities
of daily need
MobilitySafe and affordable, ability to get
around
HousingSuitable housing, affordable housing, home maintenance
Civic EngagementVolunteerism, civic attentiveness,
voting
Social EngagementSocial activities, social support,
current supports
Employment & EducationWork in retirement, skill building,
income
RecreationParticipation in leisure activities
Caregiving Contribution
Economic Contribution
InformationServices for older adults, Social
Security and Medicaid, planning, legal, financial
Benchmark Comparison Data
NRC has developed a database that collates responses to CASOA™ and related surveys administered in other communities, which allows the results from Novi to be compared against a set of national benchmarks. This benchmarking database includes responses from more than 35,000 older adults (age 55 and over) in 175+ communities across the nation. The demographics of NRC’s database match the demographics in the nation, based on the U.S. Census estimates.
Ratings are compared when similar questions are included in NRC’s database, and there are at least five communities in which the question was asked. Where comparisons are available, three numbers are provided in the table. The first column is the portion of Novi’s population responding in a particular way (e.g., percent “likely” to recommend living in the community). The second column is the rank assigned to your community’s rating among communities where a
CASOA™ Full Report | The City of Novi • • 5 • •
Co
mm
un
ity
Ass
essm
ent
Surv
ey f
or
Old
er A
du
lts™
© 2
01
2 N
atio
nal
Res
earc
h C
ente
r, In
c.
similar question was asked. The third column is the number of communities that asked a similar question. The fourth column shows the comparison of Novi’s rating (column one) to the benchmark.
Where comparisons for ratings were available, Novi’s results were generally noted as being “higher” than the benchmark, “lower” than the benchmark or “similar” to the benchmark. In instances where ratings are considerably higher or lower than the benchmark, these ratings have been further demarcated by the attribute of “much,” (for example, “much higher” or “much lower”). These labels come from a statistical comparison of Novi’s rating to the benchmark where a rating is considered “similar” if it is within than the margin of error; “higher” or “lower” if the difference between your community’s rating and the benchmark is greater the margin of error; and “much higher” or “much lower” if the difference between your community’s rating and the benchmark is more than twice the margin of error.

CASOA™ Full Report | The City of Novi • • 6 • •
Co
mm
un
ity
Ass
essm
ent
Surv
ey f
or
Old
er A
du
lts™
© 2
01
2 N
atio
nal
Res
earc
h C
ente
r, In
c.
K e y F i n d i n g s
The report describes how older residents view Novi as a community that creates a thriving environment for its 12,480 older adults and then describes residents’ self-reported needs. The CASOA™ assessed Novi’s needs and strengths through a mailed survey of randomly sampled older adults in the community.
Novi Opportunities and Challenges
Older adults may not complain, but not every community leaves older adults raving about the quality of community life or the services available for active living and aging in place. Communities that assist older adults to remain or become active community participants provide the requisite opportunities for recreation, transportation, culture, education, communication, social connection, spiritual enrichment and health care. It is not a package mix, so each community must identify what its older adults seek and what the community provides. The judgments of the residents for whom community planning takes place, provide the elements of an equation that describes overall community quality in Novi.
Survey respondents were asked to rate 34 aspects of the community related to six community dimensions. Ratings for individual questions were converted to an average scale of 0 (the lowest rating, e.g., “poor”) to 100 (the highest rating, e.g., “excellent”) and then combined to provide one overall rating (index) for each of the six areas. (For more information on how the summary scores were calculated, see Appendix C: Survey Methodology.) These ratings are not to be understood like ratings from school tests. Because they are summaries of several questions that range from 0 as “poor”, 33 as “fair”, 66 as “good” and 100 as “excellent”, a score of 58,as one example, should be interpreted as closer to good than fair (with the midpoint of the scale, 50, representing equidistance between good and fair). Furthermore, comparisons offer the strongest opportunity to interpret the meaning of findings, so examining change over time demonstrates if intervening programs or policies have influenced older adult opinion to improve since the last administration of CASOA.
It was found, overall, that Novi was rated positively by its older residents, similar to 2007 results. Most rated the city as a “good” or “excellent” place to live and many rated the city as an “excellent” or “good” place to retire. Summary scores were calculated for categories of community quality to provide a broad picture of the perceived fit between what the community offered to older adults and what older residents needed. Summary ratings for Novi demonstrated that older residents felt the area of Overall Quality of Community was provided best. Opportunities for Community Information and Community and Belonging were rated less favorably and received the lowest average ratings. Ratings of Quality of Community, Community and Belonging and Community Information increased from 2007 to 2012, an uncommon finding worth celebrating, while the others remained similar over time. No index showed decline.

CASOA™ Full Report | The City of Novi • • 7 • •
Co
mm
un
ity
Ass
essm
ent
Surv
ey f
or
Old
er A
du
lts™
© 2
01
2 N
atio
nal
Res
earc
h C
ente
r, In
c.
Figure 3: Novi Community Readiness Chart
Figure 4: Readiness Summaries of Novi Compared by Year
50
51
55
61
64
65
58
54
63
64
67
74
0 25 50 75 100
Community Information Index
Community Design and Land Use Index
Community and Belonging Index
Health and Wellness Opportunities Index
Opportunities for Productive Activities Index
Quality of Community Index
Scale: 0=Lowest/most negative, 100=Highest/most positive
2012
2007
Community Information Older adult resources
Legal or financial planning
Health and Wellness Fitness & food
Physical, mental & preventative health care Long-term and day-time care options
Productive Activities Volunteerism & employment
Recreational activity Skill building & education
Social, religious & civic activity
Community Design and Land Use Travel by bus, car & foot
Getting to places of daily activity Variety and affordability of housing
Community and Belonging Sense of community
Openness & acceptance Valuing older residents
Neighborliness and safety
Scale: 0=Lowest/most negative, 100=Highest/most positive
Overall Quality of Community Place to live and retire
Quality of services to older adults Recommend and remain in community
74
67 58
54
64 63

CASOA™ Full Report | The City of Novi • • 8 • •
Co
mm
un
ity
Ass
essm
ent
Surv
ey f
or
Old
er A
du
lts™
© 2
01
2 N
atio
nal
Res
earc
h C
ente
r, In
c.
Older Resident Needs in Novi
Older adults, more than others, face difficulties with aspects of everyday life. For many older adults these difficulties vastly exceed the minor physical pains or small losses of function that characterize almost everyone’s circumstances after a certain age. When individual problems are added together, a group picture emerges that provides a useful description of the entire community of Novi. Nationally, areas where older adults face the largest share of life’s challenges include caregiving, health and mental health, in-home support, nutrition and food security and transportation. This study explores specific problems or stressors encountered by older adults in Novi, such as physical and emotional difficulties and injuries that have compromised their independence. Presented are the current individual areas of need and from those, the magnitude of broader categories of need.
Typically, it is understood that the self-reported needs of older adults represent a minimum level, a conservative estimate attenuated by respondents’ strong desire to feel and appear self-reliant and further reduced by the silent whisper of some older adults who, no matter how sensitive the attempt, are too frail to participate in any survey enterprise.
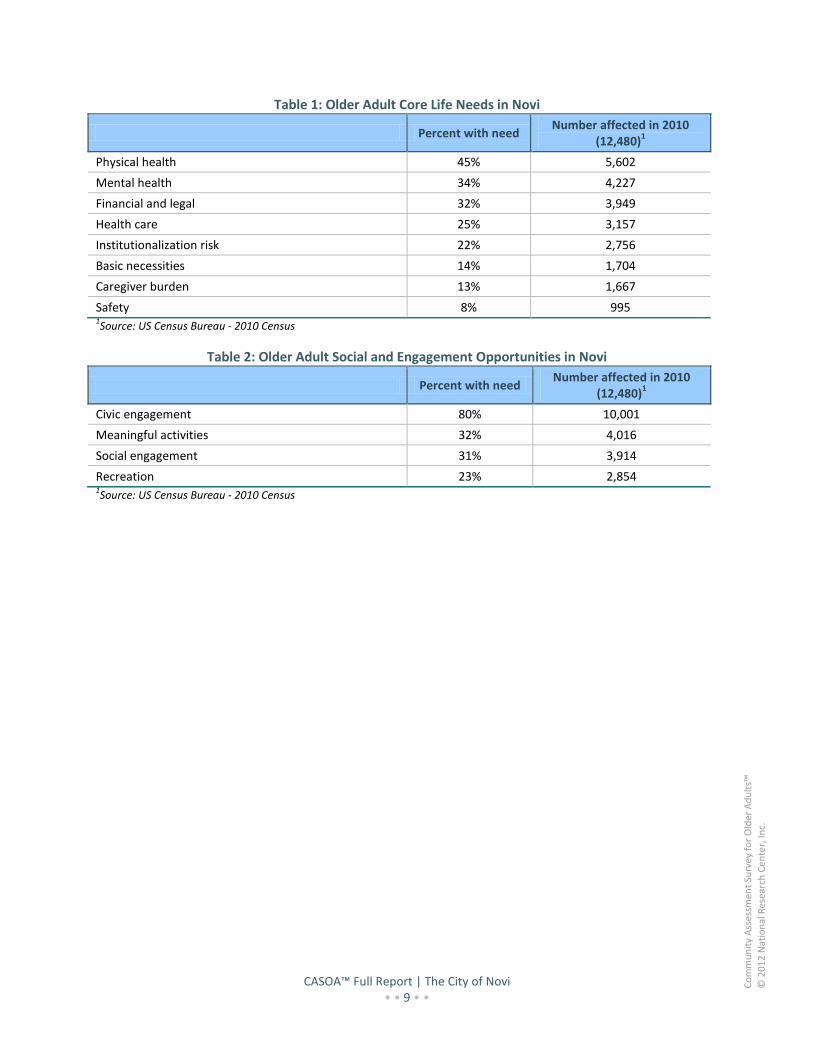
Nonetheless, clear patterns of needs and strengths emerged from this assessment. Forty-one individual survey questions about specific problems faced by older community members, as well as respondent sociodemographics, participation levels and community engagement were grouped into 16 larger areas to provide a broad picture of older residents in Novi. These 12 areas were split into Core Life Needs (eight areas) and Social and Engagement Opportunities (four areas). The overall summary score for each of the 12 categories is provided in the following two tables, along with the proportion and calculated number of residents who reported the need or opportunity.
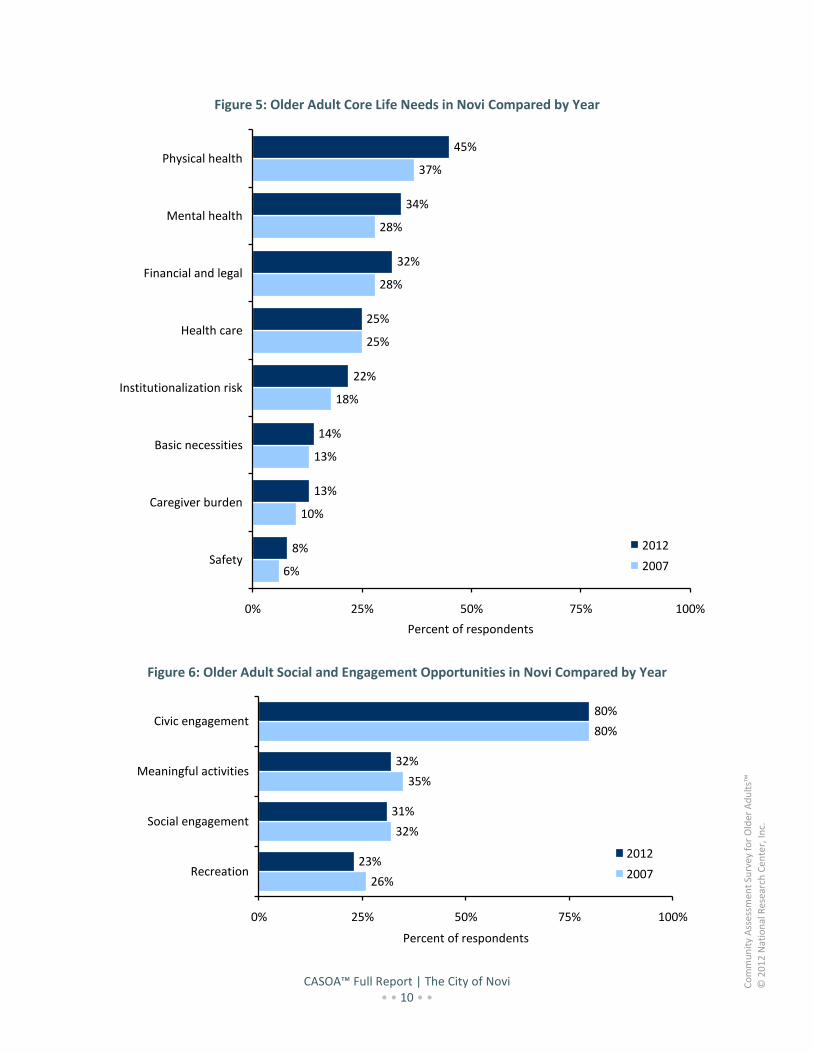
The greatest Core Life Need area was physical health (45% with need), followed by and mental health (34%) and financial and legal (32%). Among Social and Engagement Opportunities, civic engagement rose to the top, although the proportion reporting this need was lower in 2012 than in 2007. Across all 12 needs areas, older residents reported the lowest prevalence of need in the areas of caregiver burden and safety, although these needs can be quite serious for the 8% to 10% of seniors affected. Physical health needs increased since 2007 while other needs were stable over time.
It should be understood that the percent of the population that experiences a problem is not a measure of how difficult a problem is to endure for the people who share it. Some needs or opportunities, though rare as a percent of residents, have a particularly devastating impact on residents’ quality of life – for example, needing help transferring from bed to wheelchair or having a problem with safety, so it is important to consider both the prevalence of the need or opportunity and its centrality to residents’ sustained independence.
CASOA™ Full Report | The City of Novi • • 9 • •
Co
mm
un
ity
Ass
essm
ent
Surv
ey f
or
Old
er A
du
lts™
© 2
01
2 N
atio
nal
Res
earc
h C
ente
r, In
c.
Table 1: Older Adult Core Life Needs in Novi
Percent with need Number affected in 2010
(12,480)1
Physical health 45% 5,602
Mental health 34% 4,227
Financial and legal 32% 3,949
Health care 25% 3,157
Institutionalization risk 22% 2,756
Basic necessities 14% 1,704
Caregiver burden 13% 1,667
Safety 8% 995 1Source: US Census Bureau - 2010 Census
Table 2: Older Adult Social and Engagement Opportunities in Novi
Percent with need Number affected in 2010
(12,480)1
Civic engagement 80% 10,001
Meaningful activities 32% 4,016
Social engagement 31% 3,914
Recreation 23% 2,854 1Source: US Census Bureau - 2010 Census
CASOA™ Full Report | The City of Novi • • 10 • •
Co
mm
un
ity
Ass
essm
ent
Surv
ey f
or
Old
er A
du
lts™
© 2
01
2 N
atio
nal
Res
earc
h C
ente
r, In
c.
Figure 5: Older Adult Core Life Needs in Novi Compared by Year
6%
10%
13%
18%
25%
28%
28%
37%
8%
13%
14%
22%
25%
32%
34%
45%
0% 25% 50% 75% 100%
Safety
Caregiver burden
Basic necessities
Institutionalization risk
Health care
Financial and legal
Mental health
Physical health
Percent of respondents
2012
2007
Figure 6: Older Adult Social and Engagement Opportunities in Novi Compared by Year
26%
32%
35%
80%
23%
31%
32%
80%
0% 25% 50% 75% 100%
Recreation
Social engagement
Meaningful activities
Civic engagement
Percent of respondents
2012
2007

CASOA™ Full Report | The City of Novi • • 11 • •
Co
mm
un
ity
Ass
essm
ent
Surv
ey f
or
Old
er A
du
lts™
© 2
01
2 N
atio
nal
Res
earc
h C
ente
r, In
c.
Populations at High Risk
As people age, many learn to take better care of themselves, to plan for retirement and, generally, to move more deliberately. Aging builds wisdom but can sap resources — physical, emotional and financial. Even those blessed by good luck or those prescient enough to plan comprehensively for the best future may find themselves with unanticipated needs or with physical, emotional or financial strengths that could endure only with help. Some people age better than others and aging well requires certain strengths that are inherent and others that can be supported by assistance from the private sector and government. Numbers of needs and the groups with the most needs are shown in Figure 7 and Table 3. Although needs were spread across the board, residents reporting the largest percent of unresolved needs in Novi were more likely to be age 55 to 74, not white, Hispanic, report a lower income or rent their homes. Compared to 2007, a smaller proportion of older adults in 2012 reported having unresolved needs (see Table 4).
Figure 7: Risk Status of Older Population in Novi
Number of items (out of 41) rated as a "moderate" or
"major" problem
10 or more
problems
14%
1 to 9
problems
58%
No problems
28%
Table 3: Risk Status of Older Population by Sociodemographic Characteristics
Number of items (out of 41) rated as a “moderate” or
“major” problem
No problems
1 to 9 problems
10 or more problems
Total Average
number of problems
Number affected in
2010 (N=12,480)
1
Overall 29% 58% 14% 100% 6 8,932
Female 27% 57% 16% 100% 6 5,101
Male 31% 58% 11% 100% 5 3,724
55 to 59 years 28% 59% 12% 100% 6 2,373
60 to 74 years 26% 55% 19% 100% 6 3,903
75 to 84 years 32% 63% 5% 100% 4 1,519
85 or over 35% 55% 10% 100% 5 959
White 28% 58% 14% 100% 6 8,113

CASOA™ Full Report | The City of Novi • • 12 • •
Co
mm
un
ity
Ass
essm
ent
Surv
ey f
or
Old
er A
du
lts™
© 2
01
2 N
atio
nal
Res
earc
h C
ente
r, In
c.
Number of items (out of 41) rated as a “moderate” or
“major” problem
No problems
1 to 9 problems
10 or more problems
Total Average
number of problems
Number affected in
2010 (N=12,480)
1
Not white 32% 53% 16% 100% 8 708
Hispanic 0% 72% 28% 100% 12 146
Not Hispanic 29% 57% 14% 100% 6 8,373
Less than $25,000 17% 52% 31% 100% 8 1,566
$25,000 to $74,999 30% 57% 13% 100% 6 3,471
$75,000 or more 31% 62% 7% 100% 4 2,753
Rent 22% 55% 23% 100% 7 3,009
Own 29% 60% 11% 100% 5 5,709
Lives alone 25% 57% 18% 100% 6 3,383
Lives with others 30% 59% 12% 100% 5 5,385 1Source: U.S. Census Bureau - 2010 Census
Table 4: Risk Status of Older Population Compared by Year
Number of items (out of 41) rated as a “moderate” or “major” problem 2012 2007
No problems 28% 38%
1 to 9 problems 58% 52%
10 or more problems 14% 10%
Total 100% 100%
Contributions of Older Adults to Novi
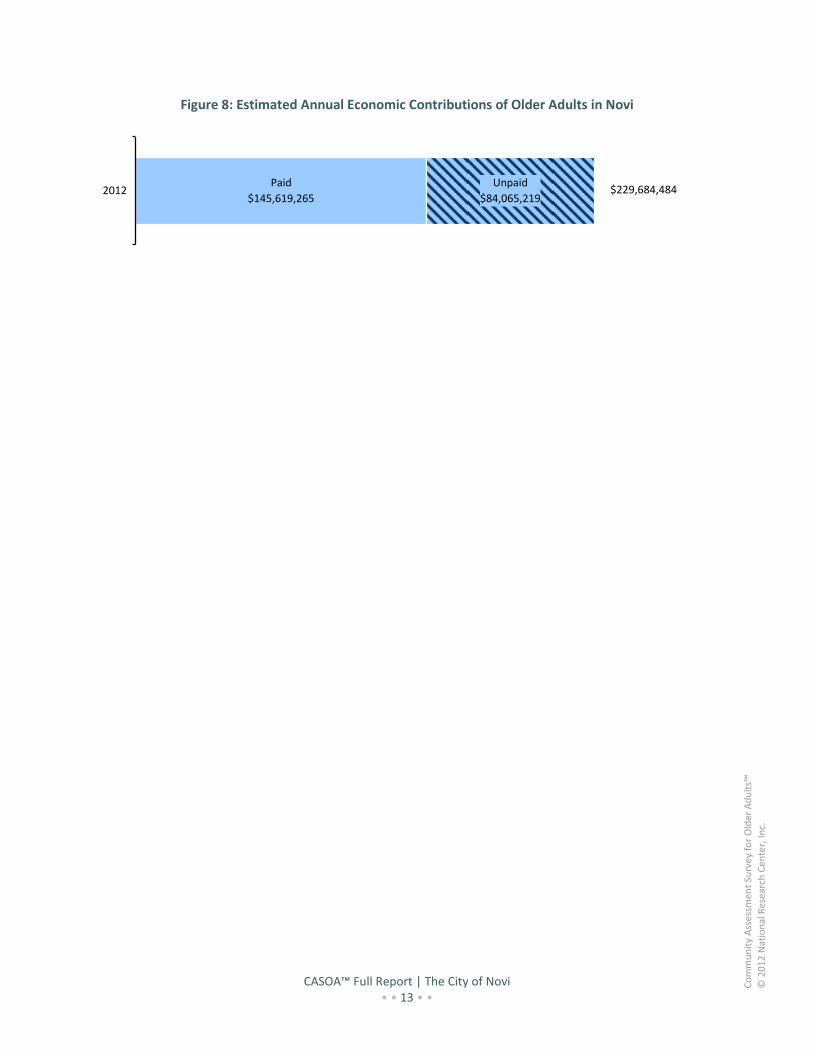
Advantages of a community with a significant number of older adults can be read in lower crime statistics and smaller costs for infrastructure that requires fewer schools, less road maintenance, less crime fighting and smaller landfills. But the advantages that older adults provide to Novi extend beyond the passive benefits of lower cost. Many older residents have time and inclination to offer productive work whether paid or not. In Novi, older adults provide significant paid and unpaid contributions. In addition to their paid work, older adults contributed to Novi through volunteering, providing informal help to family and friends, and offering more extensive caregiving. The value of these unpaid contributions by older adults in Novi in 2012 is estimated to be about $84 million in a 12-month period. Adding the value of their paid work, the total value of their contribution is close to $230 million in a 12-month period. (See Economic Contribution of Older Adults, page 51, for a detailed breakdown of the contributions by category and Appendix C: Survey Methodology for more information on the calculations.)
CASOA™ Full Report | The City of Novi • • 13 • •
Co
mm
un
ity
Ass
essm
ent
Surv
ey f
or
Old
er A
du
lts™
© 2
01
2 N
atio
nal
Res
earc
h C
ente
r, In
c.
Figure 8: Estimated Annual Economic Contributions of Older Adults in Novi
Paid
$145,619,265
Unpaid
$84,065,219 $229,684,4842012
CASOA™ Full Report | The City of Novi • • 14 • •
Co
mm
un
ity
Ass
essm
ent
Surv
ey f
or
Old
er A
du
lts™
© 2
01
2 N
atio
nal
Res
earc
h C
ente
r, In
c.
A g e W a v e i n t h e C i t y o f N o v i
Demographics
The graying of America can be understood in simple population counts. The number of people in the United States over the age of 65 is projected to more than double from 35 million in 2000, to 71 million in 2030. Additionally, a dramatic increase in the average age of the older population is expected. While 4.2 million persons were age 85 and older in 2000, further declines in mortality could lead to a five-fold increase in the number by 2040.45
This bubble in the demographic charts is largely the Baby Boom generation, the cohort of 75 million Americans born between 1946 and 1964, the largest generation ever, grown in no small part because of the optimism and prosperity that followed WWII. In the year 2006, the first wave of the Baby Boom generation reached the age of 60.
The Baby Boom generation is beginning to enter older adulthood, creating a new disruption in social institutions akin to what occurred when they were younger: crowding hospitals, schools and colleges, transforming markets, trends and the workplace.46 In their later years, Boomers likely will have a similar impact on retirement, health, housing, transportation, education, community and family life.47
The “demographic revolution” that began in 1946 is expected to result in a broad array of challenges and opportunities in the near future and will create a great shift in national priorities.46 Trends that are apparent include:
• Advances in medical and related sciences, coupled with trends in exercise and healthy lifestyles suggest that people will not only live longer but the number of Americans who live up to and beyond 85 years of age will continue to grow48
• Older adults will be wealthier and better educated than past generations48 • Baby Boom retirees will have a stronger desire to make contributions beyond traditional
retirement49 • People are likely to stay in the workforce longer than ever before50-52 • The older adult population will be more racially and ethnically diverse48 • The epicenter of economic and political power will shift from the young to the old48
How the increase in older Americans fully will affect society largely remains speculation. However, what is clear is that the current demographic trends are likely to change fundamentally the way older adult life is lived.

CASOA™ Full Report | The City of Novi • • 15 • •
Co
mm
un
ity
Ass
essm
ent
Surv
ey f
or
Old
er A
du
lts™
© 2
01
2 N
atio
nal
Res
earc
h C
ente
r, In
c.
A Profile of Older Adults in Novi
In the year 2010, there were estimated to be 12,480 older adults (persons 55 and over) living in Novi. The following charts display Novi’s older adult demographic profile.
Figure 9: Older Adult Portion of the Total Population of the City of Novi
42,744
12,480
0%
25%
50%
75%
100%
2010
Age 55 and older
Age 54 andyounger
Source: U.S. Census Bureau - 2010 Census
Figure 10: Male and Female Portions of the Older Adult Population of the City of Novi
5,565
6,915
0%
25%
50%
75%
100%
2010
Female
Male
Source: U.S. Census Bureau - 2010 Census
Figure 11: Race and Ethnicity of the Older Adult Population of the City of Novi
Not
white
12%
White
88%
Not
Hispanic
99%
Hispanic
1%
Source: U.S. Census Bureau - 2010 Census

CASOA™ Full Report | The City of Novi • • 16 • •
Co
mm
un
ity
Ass
essm
ent
Surv
ey f
or
Old
er A
du
lts™
© 2
01
2 N
atio
nal
Res
earc
h C
ente
r, In
c.
O v e r a l l Q u a l i t y o f t h e C o m m u n i t y
CASOA™ contained a number of questions related to the life of older residents in the community. Survey participants were asked to rate the overall quality of the community, as well as other aspects of community life in Novi. The questionnaire assessed use of the amenities of the community and involvement by respondents in the civic and economic life of Novi.
Most of Novi’s older residents gave high ratings to the community as a place to live and many rated Novi as a place to retire as “good” or “excellent.” Services offered to older adults were considered “excellent” or “good” by about three-quarters of older residents in Novi. Generally, where comparisons could be made overtime, older adults gave more positive ratings in 2012 than in 2007. Overall, residents in Novi were much more likely to rate these aspects of the community as “excellent” or “good” when compared to other older adults across the nation.
Figure 12: Novi as a Place for Older Residents Compared by Year
65%
65%
57%
65%
94%
72%
65%
71%
72%
66%
78%
96%
0% 25% 50% 75% 100%
How would you rate the overall services
provided to older adults in Novi?
Neighborliness of Novi
Valuing older residents in Novi
Openness and acceptance of the community
towards older residents of diverse backgrounds
Sense of community
How do you rate the City of Novi as a place to
retire?
How do you rate the City of Novi as a place to
live?
Percent "excellent" or "good"
2012
2007
Note: “Neighborliness of your community” and “Valuing older residents in your community” were added to CASOA™ since Novi’s first survey.
CASOA™ Full Report | The City of Novi • • 17 • •
Co
mm
un
ity
Ass
essm
ent
Surv
ey f
or
Old
er A
du
lts™
© 2
01
2 N
atio
nal
Res
earc
h C
ente
r, In
c.
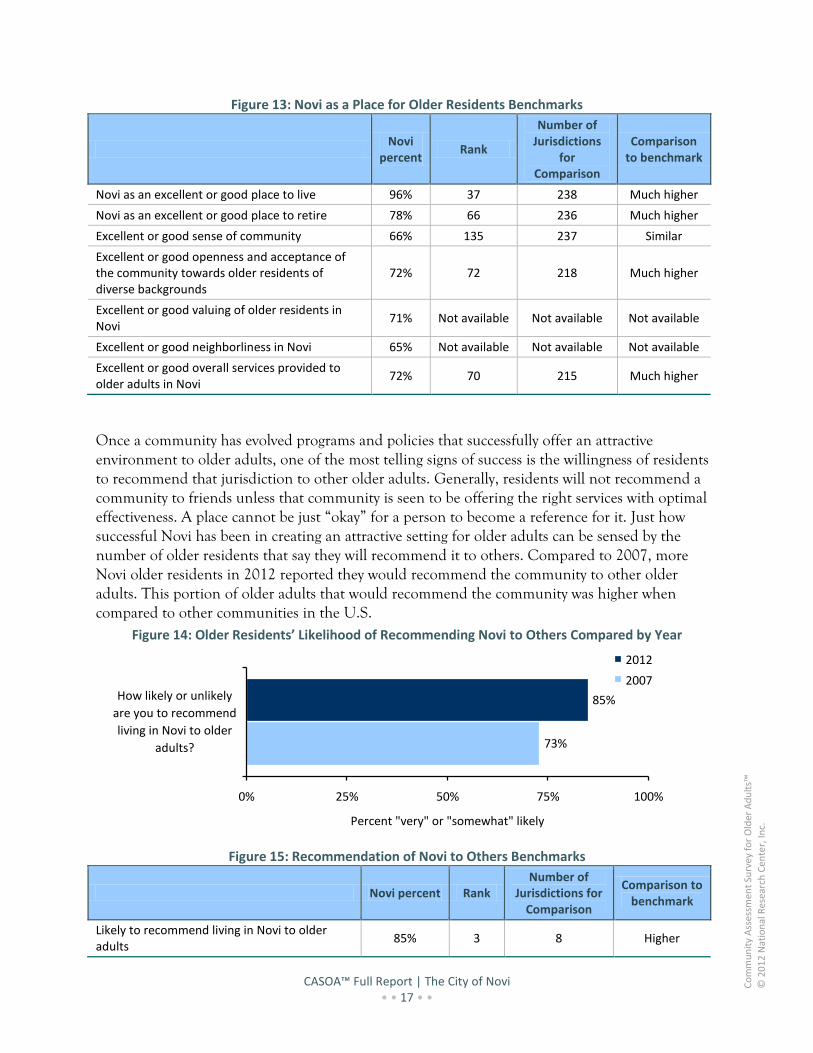
Figure 13: Novi as a Place for Older Residents Benchmarks
Novi
percent Rank
Number of Jurisdictions
for Comparison
Comparison to benchmark
Novi as an excellent or good place to live 96% 37 238 Much higher
Novi as an excellent or good place to retire 78% 66 236 Much higher
Excellent or good sense of community 66% 135 237 Similar
Excellent or good openness and acceptance of the community towards older residents of diverse backgrounds
72% 72 218 Much higher
Excellent or good valuing of older residents in Novi
71% Not available Not available Not available
Excellent or good neighborliness in Novi 65% Not available Not available Not available
Excellent or good overall services provided to older adults in Novi
72% 70 215 Much higher
Once a community has evolved programs and policies that successfully offer an attractive environment to older adults, one of the most telling signs of success is the willingness of residents to recommend that jurisdiction to other older adults. Generally, residents will not recommend a community to friends unless that community is seen to be offering the right services with optimal effectiveness. A place cannot be just “okay” for a person to become a reference for it. Just how successful Novi has been in creating an attractive setting for older adults can be sensed by the number of older residents that say they will recommend it to others. Compared to 2007, more Novi older residents in 2012 reported they would recommend the community to other older adults. This portion of older adults that would recommend the community was higher when compared to other communities in the U.S.
Figure 14: Older Residents’ Likelihood of Recommending Novi to Others Compared by Year
73%
85%
0% 25% 50% 75% 100%
How likely or unlikely
are you to recommend
living in Novi to older
adults?
Percent "very" or "somewhat" likely
2012
2007
Figure 15: Recommendation of Novi to Others Benchmarks
Novi percent Rank Number of
Jurisdictions for Comparison
Comparison to benchmark
Likely to recommend living in Novi to older adults
85% 3 8 Higher

CASOA™ Full Report | The City of Novi • • 18 • •
Co
mm
un
ity
Ass
essm
ent
Surv
ey f
or
Old
er A
du
lts™
© 2
01
2 N
atio
nal
Res
earc
h C
ente
r, In
c.
Residential Stability
According to a survey by AARP, more than 8 in 10 adults over age 45 want to live roughly where they live now “as long as possible.”53 That does not necessarily mean the exact same dwelling, but it does mean within only a few miles and in a state of self-sufficiency, if possible. To “age in place” implies both personal strength and provision of community assistance as needed. In different communities, older adults have different intentions, so it is essential to understand what older adults in Novi are anticipating in their retirement. By learning directly from older adults, planning can begin for the services required for them to remain independent and the community can attract other older adults who are likely to find those kinds of services appealing.
In fact, according to the Census Bureau, fewer than 5% of people 55 and older move in any given year, and the bulk of those do not go very far: 49% of movers stay within the same county and only 25% move to a different state. Of those who do cross state lines, the major lure is not weather, tax relief or a new adventure: people usually move to be closer to family.54 The largest proportion of Novi’s older residents had lived in the community for more than 20 years. Further, 81% of seniors planned to remain in Novi throughout their retirement, which was more than what was reported in 2007 (71%). When compared to ratings given by older residents in other communities across the nation, Novi residents were less likely to report that they would remain in the City throughout retirement.
Figure 16: Length of Residency in Novi
How many years have you lived in the community?
40%
23%16%17%
4%
0%
25%
50%
75%
100%
Less than 1 year 1-5 years 6-10 years 11-20 years More than 20 years
Figure 17: Likelihood of Remaining in Novi Throughout Retirement Compared by Year
71%
81%
0% 25% 50% 75% 100%
How likely or unlikelyare you to remain in
Novi throughout yourretirement?
Percent "very" or "somewhat" likely
2012
2007

CASOA™ Full Report | The City of Novi • • 19 • •
Co
mm
un
ity
Ass
essm
ent
Surv
ey f
or
Old
er A
du
lts™
© 2
01
2 N
atio
nal
Res
earc
h C
ente
r, In
c.
Figure 18: Remaining in Novi Throughout Retirement Benchmark
Novi percent Rank Number of
Jurisdictions for Comparison
Comparison to benchmark
Likely to remain in Novi throughout retirement 81% 7 8 Lower
Safety
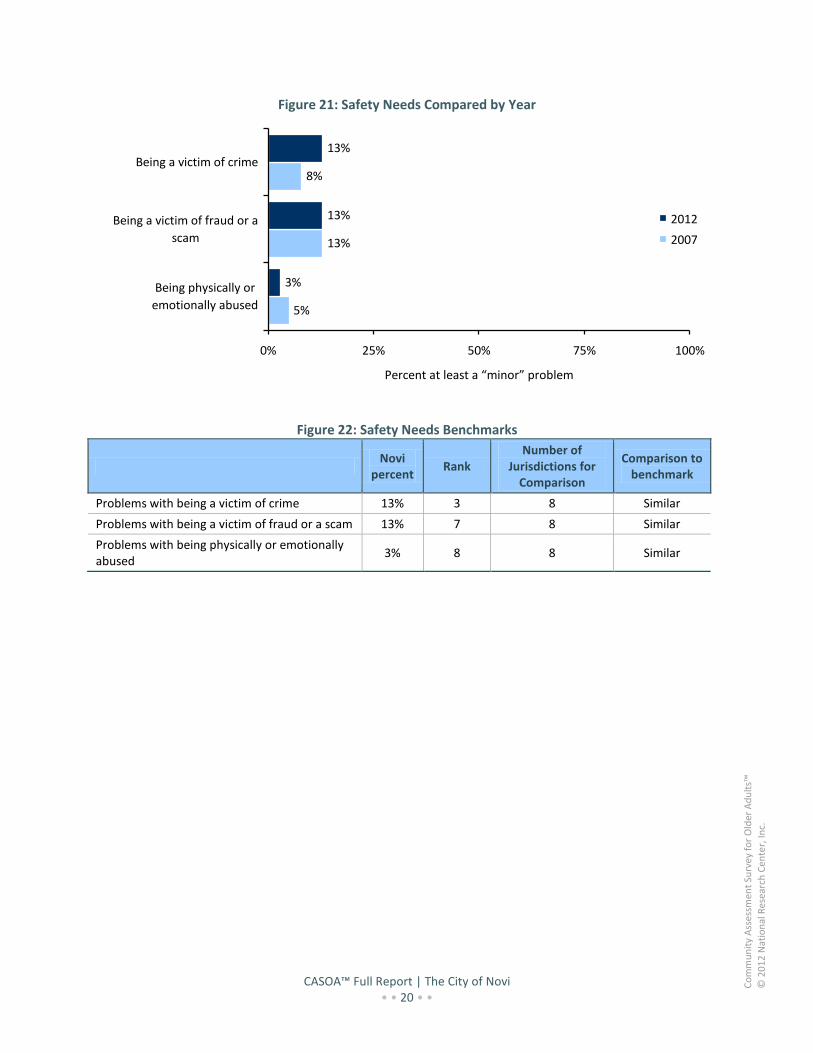
Even when older adults are exposed to the same community environment as younger people, older folks feel less safe. No doubt they are aware of their increasing vulnerability even when the ambient dangers of crossing the street or walking the dog are unchanged. For older adults to feel as safe as younger adults, a community must provide extraordinary services intended to enhance the personal feelings of safety of older adults. In this assessment, older residents reported their overall perceptions of safety in Novi, as well as any problems with being a victim of crime, frauds or scams or being abused.
Older residents reported feeling generally safe in Novi. This question was not asked on Novi’s first survey, so a comparison over time is not available. A relatively small proportion of seniors in Novi reported problems with crime or abuse in the 12 months prior to the survey. Nonetheless, these crimes can have serious consequences for older residents. Reports of crime or abuse were similar between the two survey years and to reports from other communities across the country.
Figure 19: Older Residents’ Ratings of Safety Overall in Novi Compared by Year
87%
0% 25% 50% 75% 100%
Overall feeling of
safety in your
community
Percent "excellent" or "good"
Note: “Overall feeling of safety” was added to CASOA™ since Novi’s first survey.
Figure 20: Safety Benchmarks
Novi
percent Rank
Number of Jurisdictions for
Comparison
Comparison to benchmark
Excellent or good overall feeling of safety in Novi
87% Not available Not available Not available
CASOA™ Full Report | The City of Novi • • 20 • •
Co
mm
un
ity
Ass
essm
ent
Surv
ey f
or
Old
er A
du
lts™
© 2
01
2 N
atio
nal
Res
earc
h C
ente
r, In
c.
Figure 21: Safety Needs Compared by Year
5%
13%
8%
3%
13%
13%
0% 25% 50% 75% 100%
Being physically or
emotionally abused
Being a victim of fraud or a
scam
Being a victim of crime
Percent at least a “minor” problem
2012
2007
Figure 22: Safety Needs Benchmarks
Novi
percent Rank
Number of Jurisdictions for
Comparison
Comparison to benchmark
Problems with being a victim of crime 13% 3 8 Similar
Problems with being a victim of fraud or a scam 13% 7 8 Similar
Problems with being physically or emotionally abused
3% 8 8 Similar
CASOA™ Full Report | The City of Novi • • 21 • •
Co
mm
un
ity
Ass
essm
ent
Surv
ey f
or
Old
er A
du
lts™
© 2
01
2 N
atio
nal
Res
earc
h C
ente
r, In
c.
A C l o s e r L o o k a t O l d e r A d u l t N e e d s
Community areas of health and wellness, community land use and design, productive activities and information and planning contribute significantly to the quality of community life for older residents. Each of these topics is covered in greater detail in the following sections. Within each chapter of the report, data related to specific strengths and needs of older adults are presented. Each chapter, and section within, begins with older residents’ ratings of Novi and is followed by resident self-reported behaviors and needs.
Health and Wellness
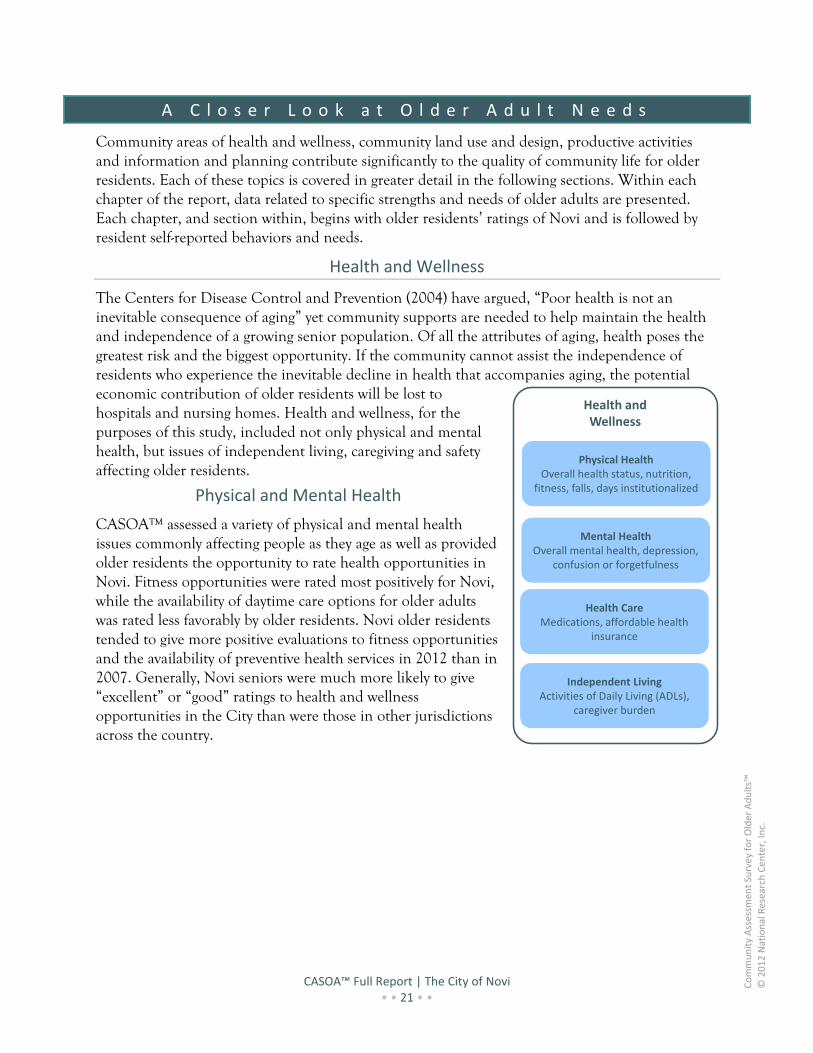
The Centers for Disease Control and Prevention (2004) have argued, “Poor health is not an inevitable consequence of aging” yet community supports are needed to help maintain the health and independence of a growing senior population. Of all the attributes of aging, health poses the greatest risk and the biggest opportunity. If the community cannot assist the independence of residents who experience the inevitable decline in health that accompanies aging, the potential economic contribution of older residents will be lost to hospitals and nursing homes. Health and wellness, for the purposes of this study, included not only physical and mental health, but issues of independent living, caregiving and safety affecting older residents.
Physical and Mental Health
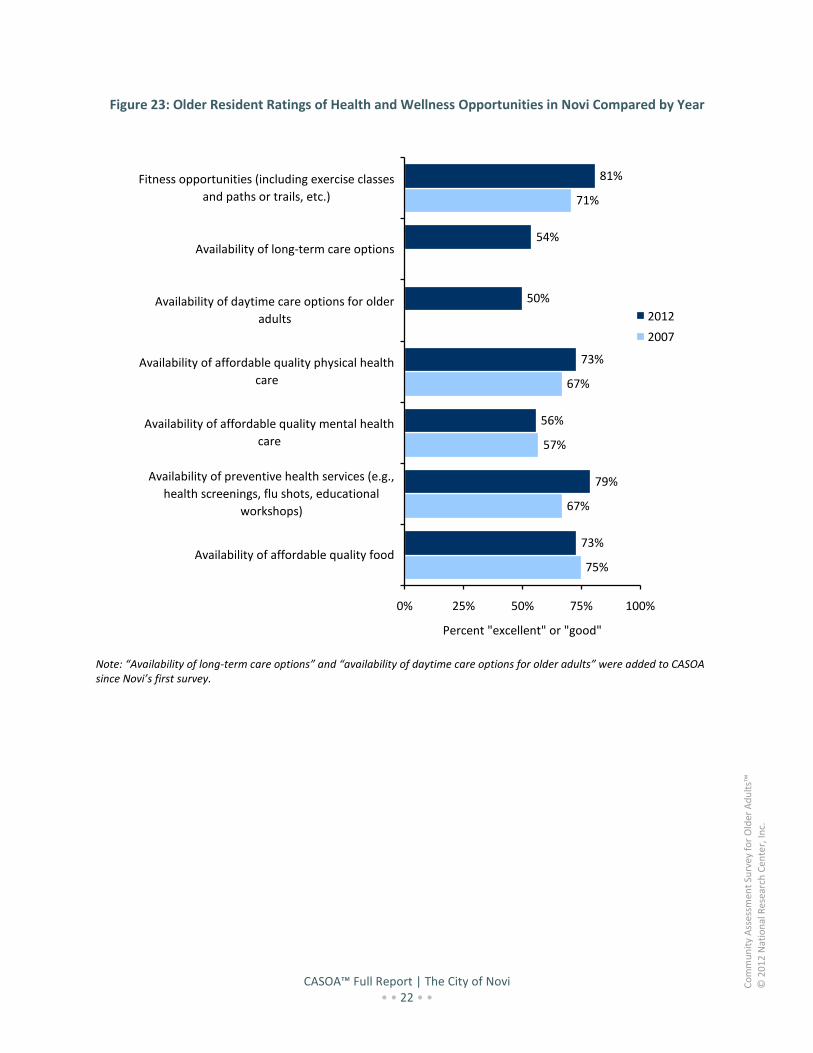
CASOA™ assessed a variety of physical and mental health issues commonly affecting people as they age as well as provided older residents the opportunity to rate health opportunities in Novi. Fitness opportunities were rated most positively for Novi, while the availability of daytime care options for older adults was rated less favorably by older residents. Novi older residents tended to give more positive evaluations to fitness opportunities and the availability of preventive health services in 2012 than in 2007. Generally, Novi seniors were much more likely to give “excellent” or “good” ratings to health and wellness opportunities in the City than were those in other jurisdictions across the country.
Health and Wellness
Physical HealthOverall health status, nutrition,
fitness, falls, days institutionalized
Mental HealthOverall mental health, depression,
confusion or forgetfulness
Health CareMedications, affordable health
insurance
Independent LivingActivities of Daily Living (ADLs),
caregiver burden
CASOA™ Full Report | The City of Novi • • 22 • •
Co
mm
un
ity
Ass
essm
ent
Surv
ey f
or
Old
er A
du
lts™
© 2
01
2 N
atio
nal
Res
earc
h C
ente
r, In
c.
Figure 23: Older Resident Ratings of Health and Wellness Opportunities in Novi Compared by Year
75%
67%
57%
67%
71%
73%
79%
56%
73%
50%
54%
81%
0% 25% 50% 75% 100%
Availability of affordable quality food
Availability of preventive health services (e.g.,
health screenings, flu shots, educational
workshops)
Availability of affordable quality mental health
care
Availability of affordable quality physical health
care
Availability of daytime care options for older
adults
Availability of long-term care options
Fitness opportunities (including exercise classes
and paths or trails, etc.)
Percent "excellent" or "good"
2012
2007
Note: “Availability of long-term care options” and “availability of daytime care options for older adults” were added to CASOA since Novi’s first survey.

CASOA™ Full Report | The City of Novi • • 23 • •
Co
mm
un
ity
Ass
essm
ent
Surv
ey f
or
Old
er A
du
lts™
© 2
01
2 N
atio
nal
Res
earc
h C
ente
r, In
c.
Figure 24: Health and Wellness Opportunities Benchmarks
Novi
percent
Rank
Number of Jurisdictions
for Comparison
Comparison to benchmark
Excellent or good fitness opportunities (including exercise classes and paths or trails, etc.)
81% 4 8 Much higher
Excellent or good availability of long-term care options
54% Not available Not available Not available
Excellent or good availability of daytime care options for older adults
50% Not available Not available Not available
Excellent or good availability of affordable quality physical health care
73% 27 197 Much higher
Excellent or good availability of affordable quality mental health care
56% 3 8 Much higher
Excellent or good availability of preventive health services (e.g., health screenings, flu shots, educational workshops)
79% 2 8 Much higher
Excellent or good availability of affordable quality food
73% 54 146 Higher
Older residents were asked to rate their overall health, mental health and quality of life as well as report on any sentinel events such as falls and institutionalization. Many older residents rated their overall physical and mental health and their overall quality of life positively, similar to 2007. These ratings were similar to or higher than ratings given by other older adults across the nation. About 23% reported injuring themselves from a fall and 24% reported having been institutionalized in the 12 months prior to the survey. The rates of falls or institutionalizations remained the same between 2007 and 2012. Older residents in Novi were less likely to have injured themselves in a fall or spent at least one day in the hospital than older adults in other communities across the nation.

CASOA™ Full Report | The City of Novi • • 24 • •
Co
mm
un
ity
Ass
essm
ent
Surv
ey f
or
Old
er A
du
lts™
© 2
01
2 N
atio
nal
Res
earc
h C
ente
r, In
c.
Figure 25: Health and Quality of Life of Older Residents in Novi Compared by Year
90%
93%
82%
88%
90%
77%
0% 25% 50% 75% 100%
How do you rate your overall quality of life?
How do you rate your overall mental
health/emotional well being?
How do you rate your overall physical health?
Percent "excellent" or "good"
2012
2007
Figure 26: Health and Quality of Life Benchmarks
Novi
percent Rank
Number of Jurisdictions for
Comparison
Comparison to benchmark
Excellent or good overall physical health 77% 3 8 Higher
Excellent or good overall mental health/emotional well being
90% 2 8 Similar
Excellent or good overall quality of life 88% 2 8 Higher

CASOA™ Full Report | The City of Novi • • 25 • •
Co
mm
un
ity
Ass
essm
ent
Surv
ey f
or
Old
er A
du
lts™
© 2
01
2 N
atio
nal
Res
earc
h C
ente
r, In
c.
Figure 27: Falls, Hospitalizations and Institutionalizations of Older Residents in Novi in Prior 12 Months Compared by Year
17%
1%
20%
21%
3%
23%
0% 25% 50% 75% 100%
Spent at least 1 day in a hospital
Spent at least 1 day in a long-term care facility
(including nursing home or in-patient rehabilitation)
Fallen and injured at least once in past 12 months
Percent of respondents
2012
2007
Note: “Spent at least 1 day in a long-term care facility (including nursing home or in-patient rehabilitation)” was “spent at least 1 day in a nursing home/rehabilitation” on Novi’s first survey.
Figure 28: Falls, Hospitalizations and Institutionalizations Benchmarks
Novi percent Rank
Number of Jurisdictions
for Comparison
Comparison to benchmark
Had at least 1 fall in the past 12 months 23% 7 7 Much lower
Spent at least 1 day in a long-term care facility (including nursing home or in-patient rehabilitation)
3% 2 7 Similar
Spent at least 1 day in a hospital in past 12 months
21% 7 7 Lower

CASOA™ Full Report | The City of Novi • • 26 • •
Co
mm
un
ity
Ass
essm
ent
Surv
ey f
or
Old
er A
du
lts™
© 2
01
2 N
atio
nal
Res
earc
h C
ente
r, In
c.
Finally, respondents reported the extent to which they had experienced problems with various health related issues in the 12 months prior to the survey. Physical health and staying physically fit were reported as the highest health needs in Novi while having figuring out which medications to take and when and having enough food to eat were reported by the fewest respondents. Results were consistent over time. Older adults in Novi tended to report health and wellness problems with less frequency than older adults in the rest of the nation.
Figure 5: Health and Wellness Needs Compared by Year
37%
30%
44%
27%
17%
29%
13%
20%
29%
7%
47%
38%
31%
47%
17%
15%
5%
25%
18%
29%
18%
24%
27%
7%
52%
0% 25% 50% 75% 100%
Feeling bored
Dealing with the loss of a close family member or
friend
Staying physically fit
Getting the vision care you need
Getting the oral health care you need
Figuring out which medications to take and when
Affording the medications you need
Getting the health care you need
Finding affordable health insurance
Falling or injuring yourself in your home
Experiencing confusion or forgetfulness
Feeling depressed
Having enough food to eat
Your physical health
Percent at least a “minor” problem
2012
2007
Note: “Getting the oral health care you need” was added to CASOA in 2010.” Figuring out which medications to take and when” and “getting the vision care you need” was added to CASOA in 2012.

CASOA™ Full Report | The City of Novi • • 27 • •
Co
mm
un
ity
Ass
essm
ent
Surv
ey f
or
Old
er A
du
lts™
© 2
01
2 N
atio
nal
Res
earc
h C
ente
r, In
c.
Figure 29: Health and Wellness Needs Benchmarks
Novi
percent Rank
Number of Jurisdictions
for Comparison
Comparison to benchmark
Problems with your physical health 52% 8 8 Lower
Problems with having enough food to eat 7% 7 8 Lower
Problems with feeling depressed 27% 8 8 Much lower
Problems with experiencing confusion or forgetfulness
24% 8 8 Much lower
Problems with falling or injuring yourself in your home
18% 8 8 Lower
Problems with finding affordable health insurance
29% 6 8 Much lower
Problems with getting the health care you need
18% 8 8 Much lower
Problems with affording the medications you need
25% 7 8 Much lower
Problems with figuring out which medications to take and when
5% Not available Not available Not available
Problems with getting the oral health care you need
15% Not available Not available Not available
Problems with getting the vision care you need
17% Not available Not available Not available
Problems with staying physically fit 47% 7 8 Much lower
Problems with maintaining a healthy diet 36% 5 8 Similar
Problems with dealing with the loss of a close family member or friend
31% 8 8 Lower
Problems with feeling bored 38% 5 8 Similar

CASOA™ Full Report | The City of Novi • • 28 • •
Co
mm
un
ity
Ass
essm
ent
Surv
ey f
or
Old
er A
du
lts™
© 2
01
2 N
atio
nal
Res
earc
h C
ente
r, In
c.
Independence and Caregiver Burden
Activities of daily living (ADL) usually include the basic activities of daily life, such as bathing, dressing and moving from bed to chair. Other activities of daily living, usually referred to as instrumental activities of daily living (IADL), include doing laundry, preparing meals, managing the household and so on. Inability to do one or more ADL or IADL means less independence. As the older adult population increases and those 85 years and older become the fastest growing segment, the demand for caregiving will increase dramatically. Survey results showed that approximately 24% of the respondents were at risk of institutionalization because they reported needing at least “minor” help performing activities of daily living such as walking, eating and preparing meals; similar to what was reported in 2007. This need was reported with much less frequency in Novi than in other communities across the U.S.
Figure 6: Independence Needs Compared by Year
13%
21%
16%
24%
0% 20% 40% 60% 80% 100%
Whether or not they live
with you, does someone
provide assistance to you
almost every day?**
Performing regular
activities, including
walking, eating and
preparing meals*
* Percent at least a “minor” problem
** Percent "yes"
2012
2007
Note: “Whether or not they live with you, does someone provide assistance to you almost every day?” was “whether or not they live with you, does someone with whom you have a significant personal relationship (such as a relative, partner, friend or neighbor) provide assistance to you almost every day?” on Novi’s first survey.
Figure 30: Independence Needs Benchmarks
Novi percent Rank
Number of Jurisdictions
for Comparison
Comparison to benchmark
Problems with performing regular activities, including walking, eating and preparing meals
24% 8 8 Much lower
Received assistance from someone almost every day
16% 7 8 Similar

CASOA™ Full Report | The City of Novi • • 29 • •
Co
mm
un
ity
Ass
essm
ent
Surv
ey f
or
Old
er A
du
lts™
© 2
01
2 N
atio
nal
Res
earc
h C
ente
r, In
c.
Caregiver Burden
Providing care to a loved one or friend offers an opportunity for contribution and deserved sense of personal worth. Although most caregivers report little physical strain, emotional stress or financial hardship as a result of being a caregiver, many of those who provide care suffer from depression, isolation and other forms of physical and emotional hardship.55 The “caregiving crunch” is predicted to be a potential problem and the average American will spend more years caring for parents than for their own children.46 Similar to 2007, in 2012 about 55% of Novi older respondents were caregivers and 30% reported bearing caregiving responsibilities which were problematic, up from 21% in 2007 and similar to the national benchmark.
Figure 31: Caregivers in Novi Compared by Year
54%
55%
0% 20% 40% 60% 80% 100%
Provides care for anyone
Percent of respondents
2012
2007
Note: A respondent was considered a caregiver if they reported providing one or more hours of care to one or more individuals.
Figure 32: Caregiver Burden Compared by Year
21%
30%
0% 25% 50% 75% 100%
Providing care for another
person
Percent at least a “minor” problem
2012
2007
Figure 33: Caregiver and Caregiver Burden Benchmarks
Novi
percent Rank
Number of Jurisdictions for
Comparison
Comparison to benchmark
Provided care to anyone for one hour or more per week
55% 5 8 Similar
Problems with providing care for another person
30% 2 8 Similar

CASOA™ Full Report | The City of Novi • • 30 • •
Co
mm
un
ity
Ass
essm
ent
Surv
ey f
or
Old
er A
du
lts™
© 2
01
2 N
atio
nal
Res
earc
h C
ente
r, In
c.
Community Design and Land Use
The movement in America towards designing more “livable” communities – those with mixed-use neighborhoods, higher-density development, increased connections, shared community spaces, and more human-scale design – will become a necessity for communities to age successfully. “Smart growth” is not only beneficial for the environment, but holds great promise for the mobility, independence and civic life of its older residents. This survey assessed resident needs and opinions of the community in the areas of land use, mobility options and housing.
Land Use
Generally, communities that have planned for older adults tend to emphasize access – a community design that facilitates movement and participation. For residents to remain independent contributors to community quality, local government programs or policies can ease their participation in social and civic activities. This ease of participation comes from land use and economic planning that locates services in or in the proximity of residences, provides convenient transportation alternatives when services are too far to reach by walking and makes walking routes attractive.
The ease of getting to typical places visited was rated by senior residents. Three-quarters of older adults gave a rating of “excellent” or “good.” This question was added in 2010, therefore a by year comparison is not available.
Figure 34: Older Resident Ratings of Getting to Typical Places Visited in Novi Compared by Year
77%
0% 25% 50% 75% 100%
Ease of getting to the
places you usually have
to visit
Percent "excellent" or "good"
Note: “Ease of getting to the places you usually have to visit” was added to CASOA™ since Novi’s first survey.
Figure 35: Getting to Typical Places Visited Benchmarks
Novi
percent Rank
Number of Jurisdictions for
Comparison
Comparison to benchmark
Excellent or good ease of getting to the places you usually have to visit
77% Not available Not available Not available
Health and Wellness
Community Land Use and Design
Productive Activities
Information and Planning
Physical healthOverall health status, nutrition,
fitness, falls, days institutionalized
Mental healthOverall mental health, depression,
confusion or forgetfulness
Health CareMedications, affordable health
insurance
Safety Violent crime, property crime, fraud or scam, environmental
hazards
Independent LivingADLs, caregiver burden
Land useEase of getting to activities
of daily need
MobilitySafe and affordable, ability to get
around
HousingSuitable housing, affordable housing, home maintenance
Civic EngagementVolunteerism, civic attentiveness,
voting
Social EngagementSocial activities, social support, proximity to friends and family,
current supports
Employment & EducationWork in retirement, skill building,
income
RecreationParticipation in leisure activities
Caregiving contribution
Economic contribution
InformationServices for older adults, Social
Security and Medicaid, planning, legal, financial

CASOA™ Full Report | The City of Novi • • 31 • •
Co
mm
un
ity
Ass
essm
ent
Surv
ey f
or
Old
er A
du
lts™
© 2
01
2 N
atio
nal
Res
earc
h C
ente
r, In
c.
Mobility
The last symbol of independence for many older adults is their automobile. Even after they should have given up driving, many older adults remain behind the wheel. Alternatives to the automobile, if attractive and pervasive, can help some relinquish their cars while still maintaining their mobility. This variety of mobility options is necessary for older residents to remain independent as they age. Understanding the varied mobility options that older adults in Novi find acceptable will help planners track their own success in providing the choices that will keep older adults independent longer.
Older residents rated the ease of travel for four modes in Novi: bus, rail or subway, car and walking. Of these, the ease of car travel and walking were rated the most favorably; ratings for ease of car travel increased from 2007 to 2012 and were much higher than the benchmark, while ratings for ease of walking remained stable over time and were much lower when compared to the benchmark. While a majority of older residents reported “never” using Novi Senior Transport, about 1 in 10 reported using it at least once in the 12 months prior to the survey, similar to the rate of use in 2007 and was much lower than use of senior transportation in other communities in the U.S.
Figure 36: Older Resident Ratings of Mobility Options in Novi Compared by Year
50%
60%
55%
70%
9%
23%
0% 25% 50% 75% 100%
Ease of walking in Novi
Ease of car travel in
Novi
Ease of rail or subway
travel in Novi
Ease of bus travel in
Novi
Percent "excellent" or "good"
2012
2007
Note: “Ease of bus travel in Novi” and “ease of rail or subway travel in Novi” were not asked on Novi’s first survey.
Figure 37: Mobility Options Benchmarks
Novi
percent Rank
Number of Jurisdictions for
Comparison
Comparison to benchmark
Excellent or good ease of bus travel in Novi 23% 144 164 Much lower
Excellent or good ease of rail or subway travel in Novi
9% 42 45 Much lower
Excellent or good ease of car travel in Novi 70% 59 218 Much higher
Excellent or good ease of walking in Novi 55% 146 221 Much lower
CASOA™ Full Report | The City of Novi • • 32 • •
Co
mm
un
ity
Ass
essm
ent
Surv
ey f
or
Old
er A
du
lts™
© 2
01
2 N
atio
nal
Res
earc
h C
ente
r, In
c.
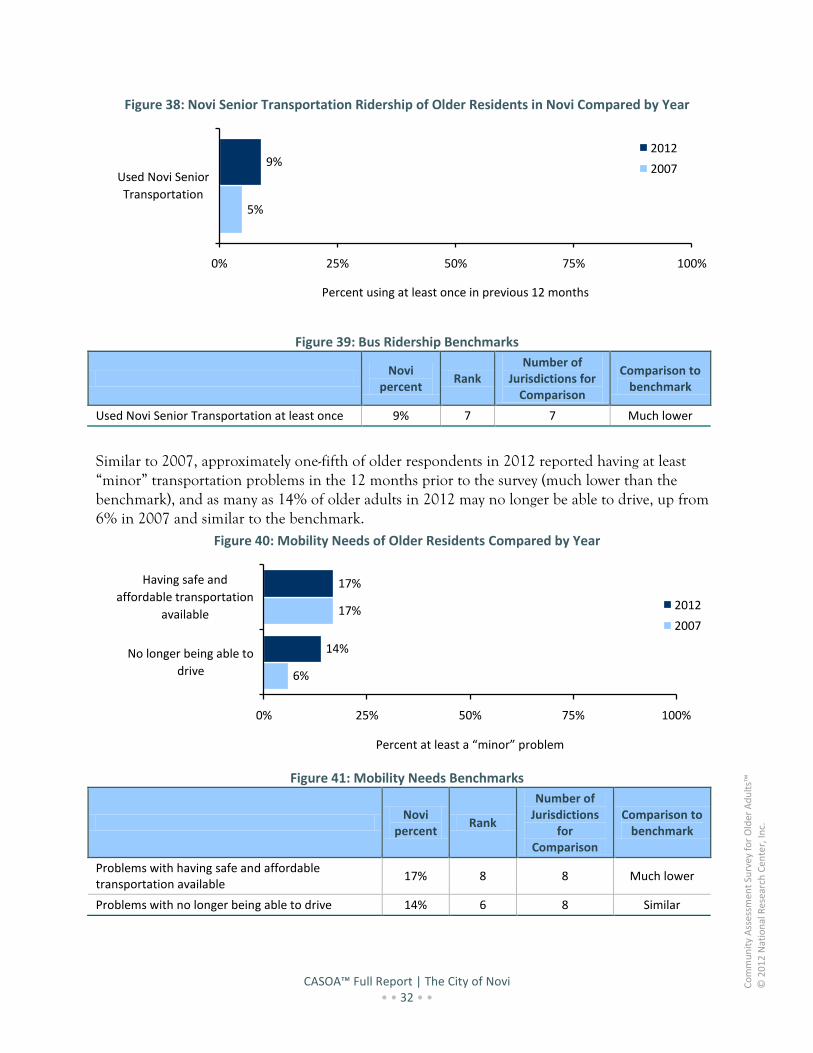
Figure 38: Novi Senior Transportation Ridership of Older Residents in Novi Compared by Year
5%
9%
0% 25% 50% 75% 100%
Used Novi Senior
Transportation
Percent using at least once in previous 12 months
2012
2007
Figure 39: Bus Ridership Benchmarks
Novi
percent Rank
Number of Jurisdictions for
Comparison
Comparison to benchmark
Used Novi Senior Transportation at least once 9% 7 7 Much lower
Similar to 2007, approximately one-fifth of older respondents in 2012 reported having at least “minor” transportation problems in the 12 months prior to the survey (much lower than the benchmark), and as many as 14% of older adults in 2012 may no longer be able to drive, up from 6% in 2007 and similar to the benchmark.
Figure 40: Mobility Needs of Older Residents Compared by Year
6%
17%
14%
17%
0% 25% 50% 75% 100%
No longer being able to
drive
Having safe and
affordable transportation
available
Percent at least a “minor” problem
2012
2007
Figure 41: Mobility Needs Benchmarks
Novi
percent Rank
Number of Jurisdictions
for Comparison
Comparison to benchmark
Problems with having safe and affordable transportation available
17% 8 8 Much lower
Problems with no longer being able to drive 14% 6 8 Similar

CASOA™ Full Report | The City of Novi • • 33 • •
Co
mm
un
ity
Ass
essm
ent
Surv
ey f
or
Old
er A
du
lts™
© 2
01
2 N
atio
nal
Res
earc
h C
ente
r, In
c.
Housing
Across the U.S., the vast majority of older adults have said clearly that they prefer to remain in their own home – not a group setting – as they age. It may be a different home than the one the kids grew up in, but older adults want to age in place. To foster this independence, communities must offer a variety of affordable housing opportunities as well as programs that modify homes to accommodate the diminution of strength and balance that accompanies aging. Four in 10 respondents rated the variety of housing in the Novi positively and about half rated the availability of affordable quality housing in Novi with positive marks, both similar to 2007 ratings. When compared to the benchmarks, these evaluations were similar or much higher, respectively. About 16% of older residents reported having issues finding housing suited to their needs. Additionally, based on Department of Housing and Urban Development (HUD)56 guidelines for affordable housing, 36% of older residents in Novi were found to spend too much of their monthly income on housing, which had increased from 27% in 2007.
A need no less important than housing itself was the need for housing maintenance. An affordable house of the right size and design is not a house that will sustain an older resident unless the house is properly maintained. A quarter to half of older residents reported problems with housework, maintaining their homes or maintaining their yards. Assessments were similar to the previous survey. Generally, housing needs in Novi were reported with similar or less frequency than in other jurisdictions across the nation.
Figure 42: Older Resident Ratings of Housing in Novi Compared by Year
59%
44%
62%
50%
0% 25% 50% 75% 100%
Variety of housing options
Availability of affordable
quality housing
Percent "excellent" or "good"
2012
2007
Figure 43: Housing Benchmarks
Novi
percent Rank
Number of Jurisdictions for
Comparison
Comparison to benchmark
Excellent or good availability of affordable quality housing
50% 72 225 Much higher
Excellent or good variety of housing options 62% 66 135 Similar

CASOA™ Full Report | The City of Novi • • 34 • •
Co
mm
un
ity
Ass
essm
ent
Surv
ey f
or
Old
er A
du
lts™
© 2
01
2 N
atio
nal
Res
earc
h C
ente
r, In
c.
Figure 44: Housing Needs of Older Residents Compared by Year
27%
26%
29%
29%
45%
15%
36%
22%
29%
25%
48%
16%
0% 25% 50% 75% 100%
Experiencing housing cost
stress (cost 30% OR MORE
of income)*
Having enough money to
pay your property taxes
Maintaining your yard
Maintaining your home
Doing heavy or intense
housework
Having housing to suit
your needs
Percent at least a “minor” problem
*Percent of respondents
2012
2007
Figure 45: Housing Needs Benchmarks
Novi
percent Rank
Number of Jurisdictions for
Comparison
Comparison to benchmark
Problems with having housing to suit your needs 16% 5 8 Similar
Problems with problems with Doing heavy or intense housework
48% 8 8 Much lower
Problems with maintaining your home 25% 8 8 Much lower
Problems with maintaining your yard 29% 8 8 Much lower
Problems with having enough money to pay your property taxes
22% 6 8 Lower
Experiencing housing cost stress (housing costs 30% or more of income)
36% 85 148 Similar
CASOA™ Full Report | The City of Novi • • 35 • •
Co
mm
un
ity
Ass
essm
ent
Surv
ey f
or
Old
er A
du
lts™
© 2
01
2 N
atio
nal
Res
earc
h C
ente
r, In
c.
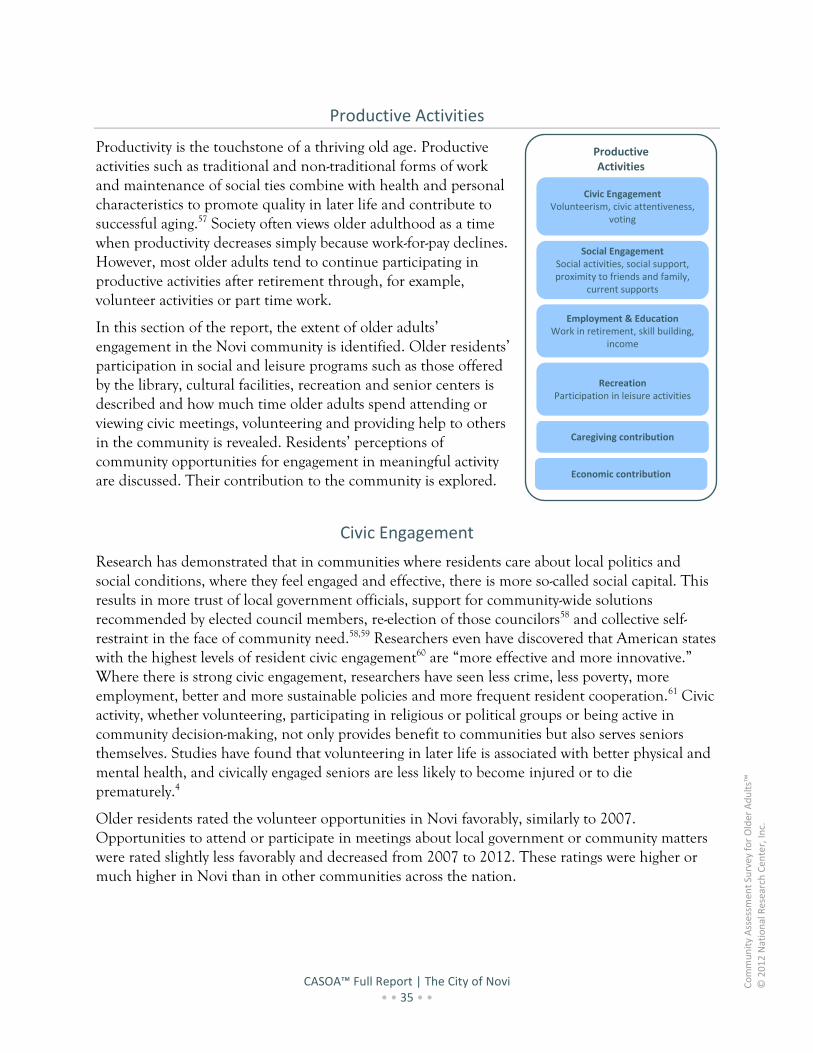
Productive Activities
Productivity is the touchstone of a thriving old age. Productive activities such as traditional and non-traditional forms of work and maintenance of social ties combine with health and personal characteristics to promote quality in later life and contribute to successful aging.57 Society often views older adulthood as a time when productivity decreases simply because work-for-pay declines. However, most older adults tend to continue participating in productive activities after retirement through, for example, volunteer activities or part time work.
In this section of the report, the extent of older adults’ engagement in the Novi community is identified. Older residents’ participation in social and leisure programs such as those offered by the library, cultural facilities, recreation and senior centers is described and how much time older adults spend attending or viewing civic meetings, volunteering and providing help to others in the community is revealed. Residents’ perceptions of community opportunities for engagement in meaningful activity are discussed. Their contribution to the community is explored.
Civic Engagement
Research has demonstrated that in communities where residents care about local politics and social conditions, where they feel engaged and effective, there is more so-called social capital. This results in more trust of local government officials, support for community-wide solutions recommended by elected council members, re-election of those councilors58 and collective self-restraint in the face of community need.58,59 Researchers even have discovered that American states with the highest levels of resident civic engagement60 are “more effective and more innovative.” Where there is strong civic engagement, researchers have seen less crime, less poverty, more employment, better and more sustainable policies and more frequent resident cooperation.61 Civic activity, whether volunteering, participating in religious or political groups or being active in community decision-making, not only provides benefit to communities but also serves seniors themselves. Studies have found that volunteering in later life is associated with better physical and mental health, and civically engaged seniors are less likely to become injured or to die prematurely.4
Older residents rated the volunteer opportunities in Novi favorably, similarly to 2007. Opportunities to attend or participate in meetings about local government or community matters were rated slightly less favorably and decreased from 2007 to 2012. These ratings were higher or much higher in Novi than in other communities across the nation.
Health and Wellness
Community Design and Land Use
Productive Activities
Information and Planning
Physical healthOverall health status, nutrition,
fitness, falls, days institutionalized
Mental healthOverall mental health, depression,
confusion or forgetfulness
Health CareMedications, affordable health
insurance
Safety Violent crime, property crime, fraud or scam, environmental
hazards
Independent LivingADLs, caregiver burden
Land useEase of getting to activities
of daily need
MobilitySafe and affordable, ability to get
around
HousingSuitable housing, affordable housing, home maintenance
Civic EngagementVolunteerism, civic attentiveness,
voting
Social EngagementSocial activities, social support, proximity to friends and family,
current supports
Employment & EducationWork in retirement, skill building,
income
RecreationParticipation in leisure activities
Caregiving contribution
Economic contribution
InformationServices for older adults, Social
Security and Medicaid, planning, legal, financial

CASOA™ Full Report | The City of Novi • • 36 • •
Co
mm
un
ity
Ass
essm
ent
Surv
ey f
or
Old
er A
du
lts™
© 2
01
2 N
atio
nal
Res
earc
h C
ente
r, In
c.
Figure 46: Older Resident Ratings of Civic Engagement Opportunities in Novi Compared by Year
81%
82%
74%
83%
0% 25% 50% 75% 100%
Opportunities to attend
or participate in meetings
about local government
or community matters
Opportunities to
volunteer
Percent "excellent" or "good"
2012
2007
Figure 47: Civic Engagement Opportunities Benchmarks
Novi
percent Rank
Number of Jurisdictions for
Comparison
Comparison to benchmark
Excellent or good opportunities to volunteer 83% 56 139 Higher
Excellent or good opportunities to attend or participate in meetings about local government or community matters
74% 4 8 Much higher
Novi seniors showed the largest amount of civic engagement in the area of electoral participation. Approximately 94% reported they were registered to vote and 89% indicated they had voted in the last general election. These ratings remained stable from 2007 to 2012 and were higher than reports from other communities across the nation.
Figure 48: Electoral Participation of Older Adults in Novi Compared by Year
90%
94%
89%
94%
0% 25% 50% 75% 100%
Voted in last general
election
Registered to vote
Percent of respondents
2012
2007

CASOA™ Full Report | The City of Novi • • 37 • •
Co
mm
un
ity
Ass
essm
ent
Surv
ey f
or
Old
er A
du
lts™
© 2
01
2 N
atio
nal
Res
earc
h C
ente
r, In
c.
Figure 49: Electoral Participation Benchmarks
Novi
percent Rank
Number of Jurisdictions for
Comparison
Comparison to benchmark
Registered to vote in your jurisdiction 94% 59 237 Higher
Voted in the last general election 89% 75 236 Higher
In terms of civic attentiveness, 24% reported attending a public meeting of local elected officials or other local public meeting in Novi and another 42% reported watching such a meeting on television in the past year. Older residents in Novi participated in civic life through volunteerism and participation in civic groups. About 25% participated in some kind of volunteer work, a volunteer rate lower than other communities in the U.S.; the average number of hours per week volunteered was 4 hours. Volunteerism increased between 2007 and 2012. About 6% participated in a civic club, down from 13% in 2007 and a rate much lower than what is reported in other communities across the country.
Figure 50: Civic Engagement of Older Adults in Novi Compared by Year
13%
49%
26%
16%
6%
42%
24%
25%
0% 25% 50% 75% 100%
Participating in a civic group (including, Elks, Kiwanis,
Masons, etc.)
Watched a meeting of local elected officials or other
City-sponsored public meeting on cable television, the
Internet or other media
Attended a meeting of local elected officials or other
local public meeting in Novi
Volunteering your time to some group/activity in Novi
Percent at least once in the previous 12 months
2012
2007
Note: This chart combines the results of questions 11 and 12, which use different response scales. Complete response frequencies for these questions can be found in Appendix B: Compete Set of Survey Frequencies.

CASOA™ Full Report | The City of Novi • • 38 • •
Co
mm
un
ity
Ass
essm
ent
Surv
ey f
or
Old
er A
du
lts™
© 2
01
2 N
atio
nal
Res
earc
h C
ente
r, In
c.
Figure 51: Civic Engagement Benchmarks
Novi
percent Rank
Number of Jurisdictions for
Comparison
Comparison to benchmark
Volunteering your time to some group/activity in Novi for one hour or more per week
25% 7 8 Lower
Attended a meeting of local elected officials or other local public meeting in Novi at least once in past 12 months
24% 200 235 Much lower
Watched a local or other public meeting on cable television, the Internet or other media at least once in past 12 months
42% 147 188 Much lower
Participating in a civic group (including Elks, Kiwanis, Masons, etc.) for one hour or more per week
6% 8 8 Much lower
Figure 52: Hours Spent in Volunteerism Compared by Year
During a typical week, how many hours do you spend volunteering your
time to some group/activity in the community?
75%
14%7%
2% 2%
10%4%
1% 1%
84%
0%
25%
50%
75%
100%
Never (no
hours)
1 to 3 hours 4 to 5 hours 6 to 10 hours 11 or more
hours
2012 2007
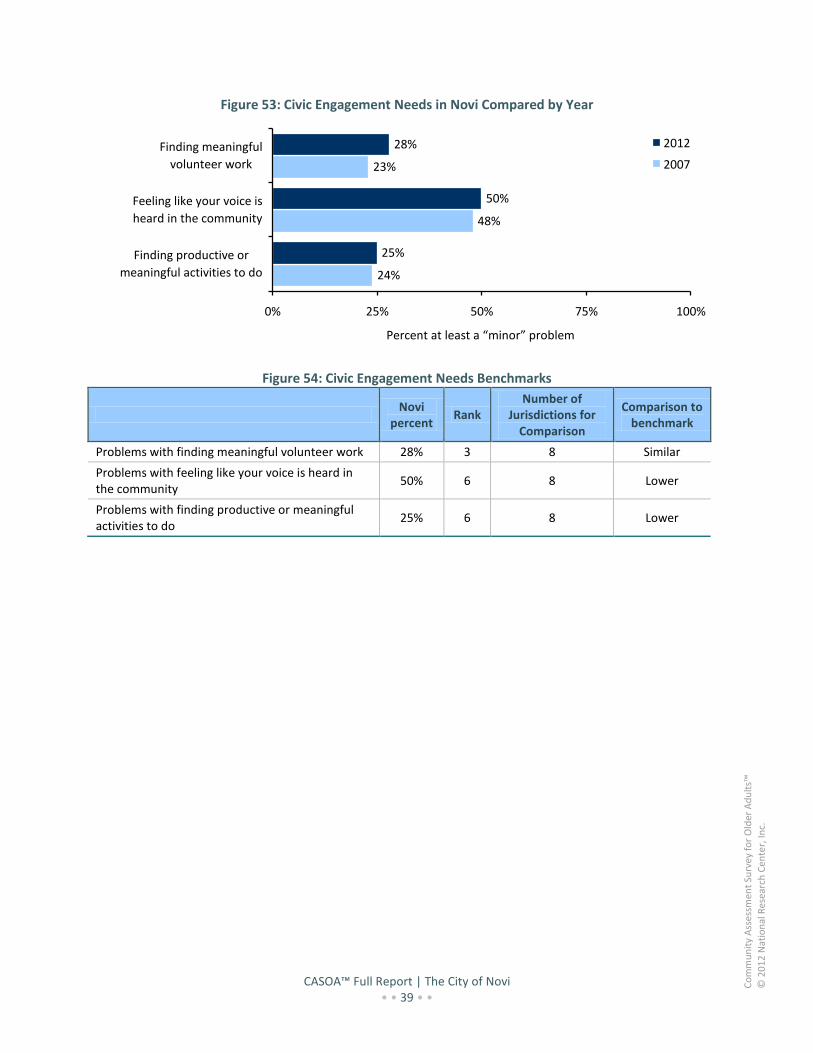
CASOA™ Full Report | The City of Novi • • 39 • •
Co
mm
un
ity
Ass
essm
ent
Surv
ey f
or
Old
er A
du
lts™
© 2
01
2 N
atio
nal
Res
earc
h C
ente
r, In
c.
Figure 53: Civic Engagement Needs in Novi Compared by Year
24%
48%
23%
25%
50%
28%
0% 25% 50% 75% 100%
Finding productive or
meaningful activities to do
Feeling like your voice is
heard in the community
Finding meaningful
volunteer work
Percent at least a “minor” problem
2012
2007
Figure 54: Civic Engagement Needs Benchmarks
Novi
percent Rank
Number of Jurisdictions for
Comparison
Comparison to benchmark
Problems with finding meaningful volunteer work 28% 3 8 Similar
Problems with feeling like your voice is heard in the community
50% 6 8 Lower
Problems with finding productive or meaningful activities to do
25% 6 8 Lower

CASOA™ Full Report | The City of Novi • • 40 • •
Co
mm
un
ity
Ass
essm
ent
Surv
ey f
or
Old
er A
du
lts™
© 2
01
2 N
atio
nal
Res
earc
h C
ente
r, In
c.
Social Engagement and Support
Communities are the foundation for social life. They are, as sociologist Eric Klinenberg writes, “the soil out of which social networks grow and develop or, alternatively, wither and devolve.”62,63 Novi has a great potential to foster increased social engagement of its older residents. A majority of Novi older residents rated the opportunities to attend social activities in Novi as “excellent” or “good” (up from 2007 and much above the benchmark) and reported frequent participation in social activities such as communicating/visiting with friends and family and providing help to friends or relatives (similar to the benchmark). Nine in 10 gave positive ratings for opportunities to attend religious or spiritual activities in Novi, which was higher than the benchmark.
Figure 55: Older Resident Ratings of Social Engagement Opportunities in Novi Compared by Year
89%
63%
90%
78%
0% 25% 50% 75% 100%
Opportunities to attend
religious or spiritual
activities
Opportunities to attend
social events or activities
Percent "excellent" or "good"
2012
2007
Figure 56: Social Engagement Opportunities Benchmarks
Novi
percent Rank
Number of Jurisdictions for
Comparison
Comparison to benchmark
Excellent or good opportunities to attend social events or activities
78% 26 138 Much higher
Excellent or good opportunities to attend religious or spiritual activities
90% 21 120 Much higher

CASOA™ Full Report | The City of Novi • • 41 • •
Co
mm
un
ity
Ass
essm
ent
Surv
ey f
or
Old
er A
du
lts™
© 2
01
2 N
atio
nal
Res
earc
h C
ente
r, In
c.
Figure 57: Social Engagement of Older Residents in Novi Compared by Year
86%
67%
94%
32%
82%
66%
95%
39%
0% 25% 50% 75% 100%
Providing help to
friends or relatives
Participating in
religious or spiritual
activities with others
Communicating/visiting
with friends and/or
family
Participating in a club
(including book, dance,
game and other social)
Percent at least once per week
2012
2007
Figure 58: Social Engagement Benchmarks
Novi
percent Rank
Number of Jurisdictions for
Comparison
Comparison to benchmark
Participating in a club (including book, dance, game and other social) for one hour or more per week
39% 2 8 Higher
Communicating/ visiting with friends and/or family for one hour or more per week
95% 6 8 Similar
Participating in religious or spiritual activities with others for one hour or more per week
66% 3 8 Higher
Providing help to friends or relatives for one hour or more per week
82% 6 8 Similar

CASOA™ Full Report | The City of Novi • • 42 • •
Co
mm
un
ity
Ass
essm
ent
Surv
ey f
or
Old
er A
du
lts™
© 2
01
2 N
atio
nal
Res
earc
h C
ente
r, In
c.
About one-third of older residents in Novi reported living alone and 43% said they lived with one other person. Twenty-three percent reported having at least “minor” problems “feely lonely or isolated” and 20% said they had at least “minor” problems with “having friends or family you can rely on” in the 12 months prior to the survey. These needs were less of a problem for Novi residents than for older adults in other communities across the nation. About one-third of Novi seniors said that they had at least “minor” problems “having interesting social events or activities to attend.” Results were similar between 2007 and 2012. (For more information on calculation of social support, see Appendix C: Survey Methodology).
Table 7: Household Composition for Older Residents in Novi
How many people, including yourself, live in your household? 2012 2007
1 person (live alone) 37% 33%
2 people 43% 47%
3 people 16% 13%
4 or more people 4% 7%
Total 100% 100%
Average household size 1.9 2.3
Figure 59: Older Resident Social Engagement Needs in Novi Compared by Year
23%
34%
19%
23%
34%
20%
0% 25% 50% 75% 100%
Feeling lonely or isolated
Having interesting social
events or activities to
attend
Having friends or family
you can rely on
Percent at least a “minor” problem
2012
2007
Figure 60: Social Engagement Needs Benchmarks
Novi
percent Rank
Number of Jurisdictions for
Comparison
Comparison to benchmark
Problems with having friends or family you can rely on
20% 7 8 Lower
Problems with having interesting social events or activities to attend
34% 6 8 Much lower
Problems with feeling lonely or isolated 23% 8 8 Lower

CASOA™ Full Report | The City of Novi • • 43 • •
Co
mm
un
ity
Ass
essm
ent
Surv
ey f
or
Old
er A
du
lts™
© 2
01
2 N
atio
nal
Res
earc
h C
ente
r, In
c.
Caregiving Contributions of Older Residents
More than 10 million people nationwide have disabling conditions that affect their ability to live independently64 and almost 80% of these residents are seniors. While care is most often provided by family members and is unpaid, its value has been estimated at $350 billion annually.65
As in 2007, within each category of potential caregiving recipients in 2012, 25% or more of older residents in Novi said they were providing care for others. The proportion of Novi older residents spending at least one hour a week providing care to each category of caregiving recipients was similar when compared to other communities across the country.
Table 8: Caregiving Contributions of Older Residents in Novi
During a typical week, how many hours do you spend providing care for one or more individuals with whom you have a significant personal relationship (such as spouse, other relative, partner, friend, neighbor or child), whether or not they live with you? N
eve
r (n
o h
ou
rs)
1 t
o 3
ho
urs
4 t
o 5
ho
urs
6 t
o 1
0 h
ou
rs
11
to
19
ho
urs
20
or
mo
re h
ou
rs
Tota
l
Ave
rage
nu
mb
er
of
ho
urs
of
tho
se w
ho
pro
vid
e c
are
*
One or more individuals age 55 or older 59% 18% 8% 4% 6% 6% 100% 9
One or more individuals age 18 to 54 75% 10% 7% 3% 2% 4% 100% 9
One or more individuals under age 18 74% 7% 5% 3% 5% 7% 100% 13
* Average number calculated from the mid-point of the ranges.
Figure 61: Caregiving Contributions of Older Resident in Novi Compared by Year
28%
21%
41%
26%
25%
41%
0% 25% 50% 75% 100%
One or more individuals
under age 18
One or more individuals
age 18 to 59
One or more individuals
age 60 or older
Percent spending at least one hour providing care
2012
2007
Figure 62: Caregiver Benchmarks
Novi
percent Rank
Number of Jurisdictions
for Comparison
Comparison to benchmark
Provided care to older adult for one hour or more per week
41% 7 8 Similar
Provided care to adult for one hour or more per week 25% 6 8 Similar
Provided care to child for one hour or more per week 26% 6 8 Similar

CASOA™ Full Report | The City of Novi • • 44 • •
Co
mm
un
ity
Ass
essm
ent
Surv
ey f
or
Old
er A
du
lts™
© 2
01
2 N
atio
nal
Res
earc
h C
ente
r, In
c.
Employment and Education
Recent studies have estimated that 70-80% of those 45 and older plan to continue working in their “retirement” years.50 Financial stability is not the only reason; one study notes that pure enjoyment of work (35% of those questioned) or just a desire to try something new (5%) also will keep people on the job.50 Opportunities to enroll in skill-building or personal enrichment classes in Novi were rated positively, similar to 2007. Employment opportunities were rated as “good” or “excellent” by 36% of respondents and remained steady from 2007 to 2012. These ratings were higher or much higher in Novi than in other communities across the U.S.
Figure 63: Older Resident Ratings of Employment and Education Opportunities in Novi Compared by Year
75%
40%
79%
36%
0% 25% 50% 75% 100%
Opportunities to enroll in
skill-building or personal
enrichment classes
Employment
opportunities
Percent "excellent" or "good"
2012
2007
Figure 64: Employment and Education Opportunities Benchmarks
Novi
percent Rank
Number of Jurisdictions for
Comparison
Comparison to benchmark
Excellent or good employment opportunities 36% 75 222 Higher
Excellent or good opportunities to enroll in skill-building or personal enrichment classes
79% 3 8 Much higher

CASOA™ Full Report | The City of Novi • • 45 • •
Co
mm
un
ity
Ass
essm
ent
Surv
ey f
or
Old
er A
du
lts™
© 2
01
2 N
atio
nal
Res
earc
h C
ente
r, In
c.
Survey results showed that 47% of older residents were still working for pay and about 6% said they would like to find a job.
Figure 65: Employment Status of Older Residents in Novi Compared by Year
What is your employment status?
57%
27%
11%6%
2%
15%
32%
50%
0%
25%
50%
75%
100%
Fully retired Working full time
for pay
Working part time
for pay
Unemployed,
looking for paid
work
2007 2012
Figure 9: Expected Retirement Age of Older Residents in Novi Compared by Year
[If not yet fully retired] At what age do you expect to retire completely
and not work for pay at all?
1%
24%
37%
23%
15%12%
18%
42%
24%
3%
0%
25%
50%
75%
100%
Before age 60 60 to 64 65 to 69 70 to 74 75 or older
2007 2012

CASOA™ Full Report | The City of Novi • • 46 • •
Co
mm
un
ity
Ass
essm
ent
Surv
ey f
or
Old
er A
du
lts™
© 2
01
2 N
atio
nal
Res
earc
h C
ente
r, In
c.
Household Finances
Household income reported on the survey was used to estimate the proportion of older residents with low incomes (30% of median income or lower). Based on income data from the U.S. Department of Housing and Urban Development (HUD),56 respondents’ reported annual income and household size, 7% of seniors in Novi have incomes that are at or below 30% of the area’s median income. Further, 31% of older residents reported having problems meeting daily expenses (less of a need when compared to the benchmark) and 38% reported problems finding work in retirement (a greater need when compared to the benchmark). More older residents in 2012 than in 2007 experienced at least “minor” problems with having enough money to meet daily expenses.
Figure 66: Low Income Older Resident Households in Novi Compared by Year
3%
7%
0% 25% 50% 75% 100%
Portion of older adult
households whose income
was at or below the
income limits set by HUD
for Section 8 programs
Percent of respondents
2012
2007
Figure 67: Older Resident Financial Needs in Novi Compared by Year
27%
32%
24%
28%
38%
31%
0% 25% 50% 75% 100%
Building skills for paid or
unpaid work
Finding work in
retirement
Having enough money to
meet daily expenses
Percent at least a “minor” problem
2012
2007

CASOA™ Full Report | The City of Novi • • 47 • •
Co
mm
un
ity
Ass
essm
ent
Surv
ey f
or
Old
er A
du
lts™
© 2
01
2 N
atio
nal
Res
earc
h C
ente
r, In
c.
Figure 68: Financial Needs Benchmarks
Novi
percent Rank
Number of Jurisdictions for
Comparison
Comparison to benchmark
Problems with having enough money to meet daily expenses
31% 6 8 Lower
Problems with finding work in retirement 38% 2 8 Higher
Problems with building skills for paid or unpaid work
28% 5 8 Similar

CASOA™ Full Report | The City of Novi • • 48 • •
Co
mm
un
ity
Ass
essm
ent
Surv
ey f
or
Old
er A
du
lts™
© 2
01
2 N
atio
nal
Res
earc
h C
ente
r, In
c.
Recreation, Culture and Arts
Once work becomes a part time endeavor or thing of the past, residents have the time for and require the health benefits from regular leisure activities, including the invigoration derived from regular exposure to the arts. Recreation, culture and the arts often replace work as the primary activity that brings older residents in contact with the outside world. And extensive opportunities for recreation and the arts make a community more attractive. The older residents of communities where varied and attractive recreation and arts opportunities can be found will be likely to report more participation in these health supporting activities. Recreation opportunities in Novi were viewed favorably by 2012 CASOA respondents, similar to 2007 and much higher when compared to ratings given in other communities across the country.
Figure 69: Older Residents’ Rating of Recreation Opportunities in Novi Compared by Year
80%
83%
0% 25% 50% 75% 100%
Recreation
opportunities (including
games, arts, and library
services, etc.)
Percent "excellent" or "good"
2012
2007
Figure 70: Recreation Opportunities Benchmarks
Novi
percent Rank
Number of Jurisdictions for
Comparison
Comparison to benchmark
Excellent or good recreation opportunities (including games, arts and library services, etc.)
83% 31 233 Much higher
In Novi, just over half routinely visited a neighborhood park, similar to 2007. A higher proportion of older residents in Novi used a senior center or participated in a recreation program or group activity in 2012 than in 2007. For 2012, 33% of older adults were estimated to have problems finding interesting recreation or cultural activities to attend. When compared to other seniors across the nation, seniors in Novi generally participated in recreation activities at higher rates and had much less of a problem having interesting recreational or cultural activities to attend.

CASOA™ Full Report | The City of Novi • • 49 • •
Co
mm
un
ity
Ass
essm
ent
Surv
ey f
or
Old
er A
du
lts™
© 2
01
2 N
atio
nal
Res
earc
h C
ente
r, In
c.
Figure 71: Recreation Participation of Older Residents in Novi Compared by Year
42%
61%
16%
67%
52%
57%
26%
66%
0% 25% 50% 75% 100%
Participating in a
recreation program or
group activity
Visited a neighborhood
park
Used the Novi senior
center
Used the Novi public
library
Percent of respondents who have ever participated in activity
2012
2007
Note: This table combines the results of questions 11 and 12, which use different response scales. Complete response frequencies for these questions can be found in Appendix B: Compete Set of Survey Frequencies.
Figure 72: Recreation Participation Benchmarks
Novi
percent Rank
Number of Jurisdictions for
Comparison
Comparison to benchmark
Used a public library in Novi at least once in past 12 months
66% 4 8 Higher
Used a senior center in Novi at least once in past 12 months
26% 2 8 Much higher
Visited a neighborhood park at least once in past 12 months
57% 233 236 Much lower
Participating in a recreation program or group activity for one hour or more per week
52% 2 8 Much higher

CASOA™ Full Report | The City of Novi • • 50 • •
Co
mm
un
ity
Ass
essm
ent
Surv
ey f
or
Old
er A
du
lts™
© 2
01
2 N
atio
nal
Res
earc
h C
ente
r, In
c.
Figure 73: Older Resident Recreation, Culture and Arts Needs in Novi Compared by Year
35%
33%
0% 25% 50% 75% 100%
Having interesting
recreational or cultural
activities to attend
Percent at least a “minor” problem
2012
2007
Figure 74: Recreation, Culture and Arts Needs Benchmarks
Novi
percent Rank
Number of Jurisdictions for
Comparison
Comparison to benchmark
Problems with having interesting recreational or cultural activities to attend
33% 6 8 Much lower

CASOA™ Full Report | The City of Novi • • 51 • •
Co
mm
un
ity
Ass
essm
ent
Surv
ey f
or
Old
er A
du
lts™
© 2
01
2 N
atio
nal
Res
earc
h C
ente
r, In
c.
Economic Contribution of Older Adults
Productive behavior is defined by Rowe and Kahn as “any activity, paid or unpaid, that generates goods or services of economic value.”57 Productive activities include both paid and unpaid work of many kinds as well as services to friends, family or neighbors. Older adults provide significant paid and unpaid contributions to the communities in which they live. In addition to their paid work, older adults contributed to Novi through volunteering, providing informal help to family and friends and caregiving. The value of these paid and unpaid contributions by older adults in Novi was nearly $230 million in a 12-month period.
Table 10: Economic Contribution of Older Adults in Novi
Percent of
older adults
Number of older adults (N=12,480)
1
Average number of
hours*
Average hourly rate**
Annual total
Providing care to older adult(s)
41% 5,178 9.2 $9.69 $22,645,974
Providing care to adult(s) 25% 3,132 8.9 $9.69 $12,199,683
Providing care to child(ren)
26% 3,306 12.7 $10.32 $20,062,145
Providing help to family and friends
82% 10,203 4.4 $9.26 $20,915,428
Volunteering 25% 3,127 4.0 $13.19 $8,241,989
Subtotal unpaid -- -- -- -- $84,065,219
Working part time 11% 1,350 15.0 $22.64 $23,153,481
Working full time 27% 3,348 32.0 $22.64 $122,465,784
Subtotal paid -- -- -- -- $145,619,265
Total contribution -- -- -- -- $229,684,484 1Source: U.S. Census Bureau - 2010 Census
* Respondents were asked to select a range of hours. The average number of hours was calculated from the mid-point of the response scale. For example, a response of “1 to 3 hours” equated to 2 hours and a response of “never” was assumed to be zero hours. In cases where the respondent chose a response that indicated “11 or more hours” or “20 or more hours”, the number of hours was calculated as 125% of 11 and 125% of 20 (i.e., 13.75 and 25 respectively). Working full time was assumed to be 32 hours per week and working part time was assumed to be 15 hours per week. **The economic value of an hour worked was assumed to be the same as the average hourly wage as calculated by the Bureau of Labor statistics for similar types of work in the Detroit-Warren-Livonia, MI MSA. Providing care for older adults and adults was assumed to be the equivalent of “Personal and Home Care Aides.” Providing care for children was assumed to be the equivalent of “Child Care Workers.” Providing help to family and friends was assumed to be the equivalent of “Personal Care and Service Workers, All Other.” Volunteering was assumed to be the equivalent of “Office Clerks, General.” Working full time and part time was assumed to be the equivalent of “All Occupations.”
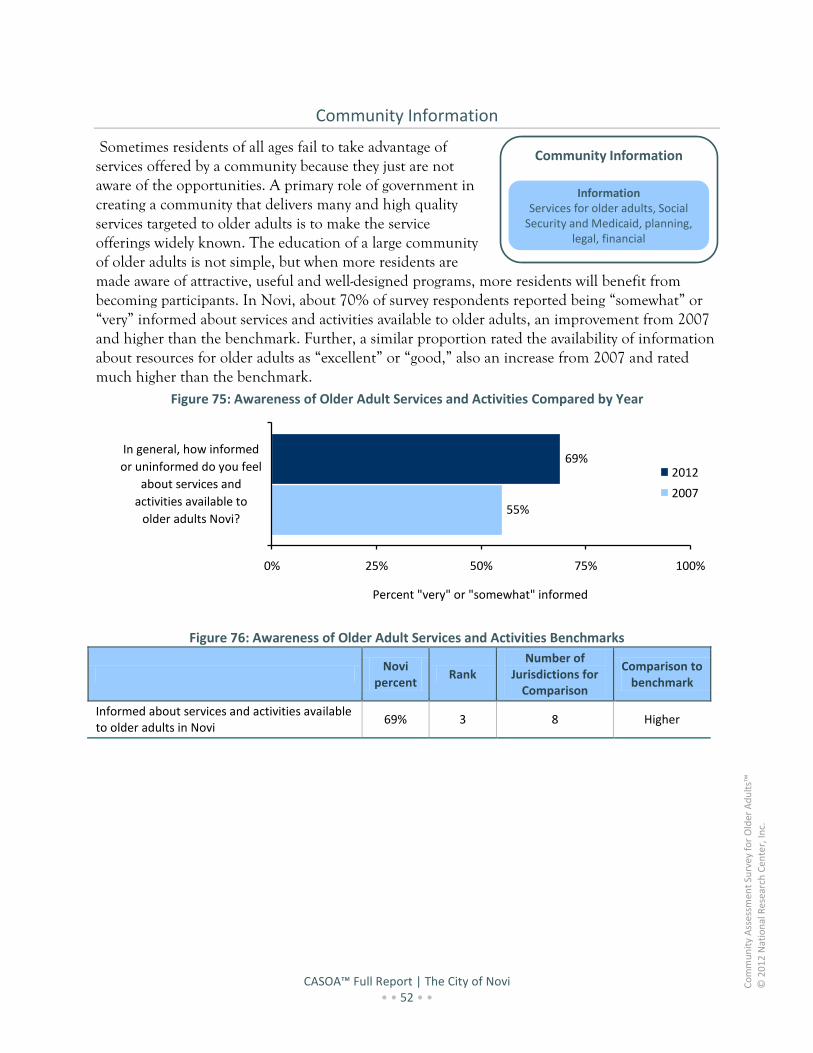
CASOA™ Full Report | The City of Novi • • 52 • •
Co
mm
un
ity
Ass
essm
ent
Surv
ey f
or
Old
er A
du
lts™
© 2
01
2 N
atio
nal
Res
earc
h C
ente
r, In
c.
Community Information
Sometimes residents of all ages fail to take advantage of services offered by a community because they just are not aware of the opportunities. A primary role of government in creating a community that delivers many and high quality services targeted to older adults is to make the service offerings widely known. The education of a large community of older adults is not simple, but when more residents are made aware of attractive, useful and well-designed programs, more residents will benefit from becoming participants. In Novi, about 70% of survey respondents reported being “somewhat” or “very” informed about services and activities available to older adults, an improvement from 2007 and higher than the benchmark. Further, a similar proportion rated the availability of information about resources for older adults as “excellent” or “good,” also an increase from 2007 and rated much higher than the benchmark.
Figure 75: Awareness of Older Adult Services and Activities Compared by Year
55%
69%
0% 25% 50% 75% 100%
In general, how informed
or uninformed do you feel
about services and
activities available to
older adults Novi?
Percent "very" or "somewhat" informed
2012
2007
Figure 76: Awareness of Older Adult Services and Activities Benchmarks
Novi
percent Rank
Number of Jurisdictions for
Comparison
Comparison to benchmark
Informed about services and activities available to older adults in Novi
69% 3 8 Higher
Community Information
InformationServices for older adults, Social
Security and Medicaid, planning, legal, financial

CASOA™ Full Report | The City of Novi • • 53 • •
Co
mm
un
ity
Ass
essm
ent
Surv
ey f
or
Old
er A
du
lts™
© 2
01
2 N
atio
nal
Res
earc
h C
ente
r, In
c.
Figure 77: Availability of Information on About Older Adult Resources in Novi Compared by Year
60%
69%
71%
0% 25% 50% 75% 100%
Availability of financial or
legal planning services
Availability of information
about resources for older
adults
Percent of respondents
2012
2007
Note: “Availability of financial and legal planning services” was added to CASOA™ since Novi’s first survey.
Figure 78: Availability of Information About Older Adult Resources Benchmarks
Novi
percent Rank
Number of Jurisdictions for
Comparison
Comparison to benchmark
Excellent or good availability of information about resources for older adults
71% 2 8 Much higher
Excellent or good availability of financial and legal planning services
69% Not available Not available Not available
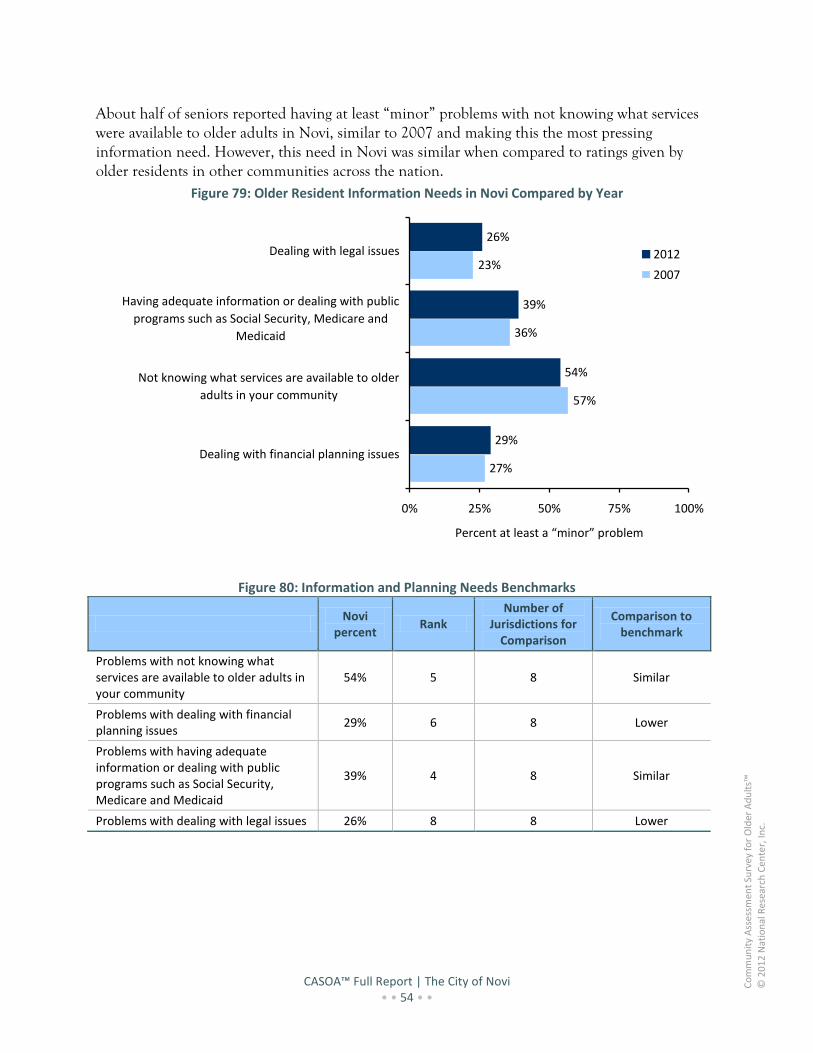
CASOA™ Full Report | The City of Novi • • 54 • •
Co
mm
un
ity
Ass
essm
ent
Surv
ey f
or
Old
er A
du
lts™
© 2
01
2 N
atio
nal
Res
earc
h C
ente
r, In
c.
About half of seniors reported having at least “minor” problems with not knowing what services were available to older adults in Novi, similar to 2007 and making this the most pressing information need. However, this need in Novi was similar when compared to ratings given by older residents in other communities across the nation.
Figure 79: Older Resident Information Needs in Novi Compared by Year
27%
57%
36%
23%
29%
54%
39%
26%
0% 25% 50% 75% 100%
Dealing with financial planning issues
Not knowing what services are available to older
adults in your community
Having adequate information or dealing with public
programs such as Social Security, Medicare and
Medicaid
Dealing with legal issues
Percent at least a “minor” problem
2012
2007
Figure 80: Information and Planning Needs Benchmarks
Novi
percent Rank
Number of Jurisdictions for
Comparison
Comparison to benchmark
Problems with not knowing what services are available to older adults in your community
54% 5 8 Similar
Problems with dealing with financial planning issues
29% 6 8 Lower
Problems with having adequate information or dealing with public programs such as Social Security, Medicare and Medicaid
39% 4 8 Similar
Problems with dealing with legal issues 26% 8 8 Lower

CASOA™ Full Report | The City of Novi • • 55 • •
Co
mm
un
ity
Ass
essm
ent
Surv
ey f
or
Old
er A
du
lts™
© 2
01
2 N
atio
nal
Res
earc
h C
ente
r, In
c.
R e c o m m e n d a t i o n s a n d C o n c l u s i o n s
The CASOA™ assessment provides a wealth of data about the strengths and needs of Novi’s older adult population. Most seniors are flourishing in Novi. By and large, they are mobile, healthy and engaged in a variety of productive activities. Older residents experience a good quality of life in Novi and most plan to stay in the community.
Nonetheless, there are needs evident in Novi’s older adult population which are likely to increase dramatically as the population ages over the next decades. Areas where Novi older residents demonstrated the highest need included civic engagement; physical and mental health and community design and land use.
Strengthening the Community with an Older Adult Coalition
Results that matter get acted upon, so an important first step to help ensure that the results of this assessment are used is to establish or empower an existing older adult coalition that can decide which of these results matter. Given the upcoming significant growth in the number of seniors in Novi, the need for collaboration is great among government, community-based organizations and the private sector. Whether large or small, well-endowed or under-funded, coalitions help strengthen communities through developing planning capacity, increasing collaborative problem solving, promoting cooperation, developing advocacy capacity and increasing information access.3 A model of how an older adult coalition might proceed with CASOA™ data is presented in the figure below.
Figure 81: A Model of Older Adult Coalition Functioning
Resource Integration
Structures
Operations and processes
Older Adult Assessment
CASOA™
Strategy Implementation
Policy advocacy Pilot projects
Public awareness/ education campaigns Community Enhancement
Allow residents to age in place
Promote independence of
older adults
Improve quality of life for older adults
Adapted from the Community Coalition Action Theory logic model developed by Butterrfoss and Keglar (2003).
Coalition Initiation
MembersStructure and
process
Action Planning
Action plansTechnical assistance
Evaluation
Engaged members
Pooled resources
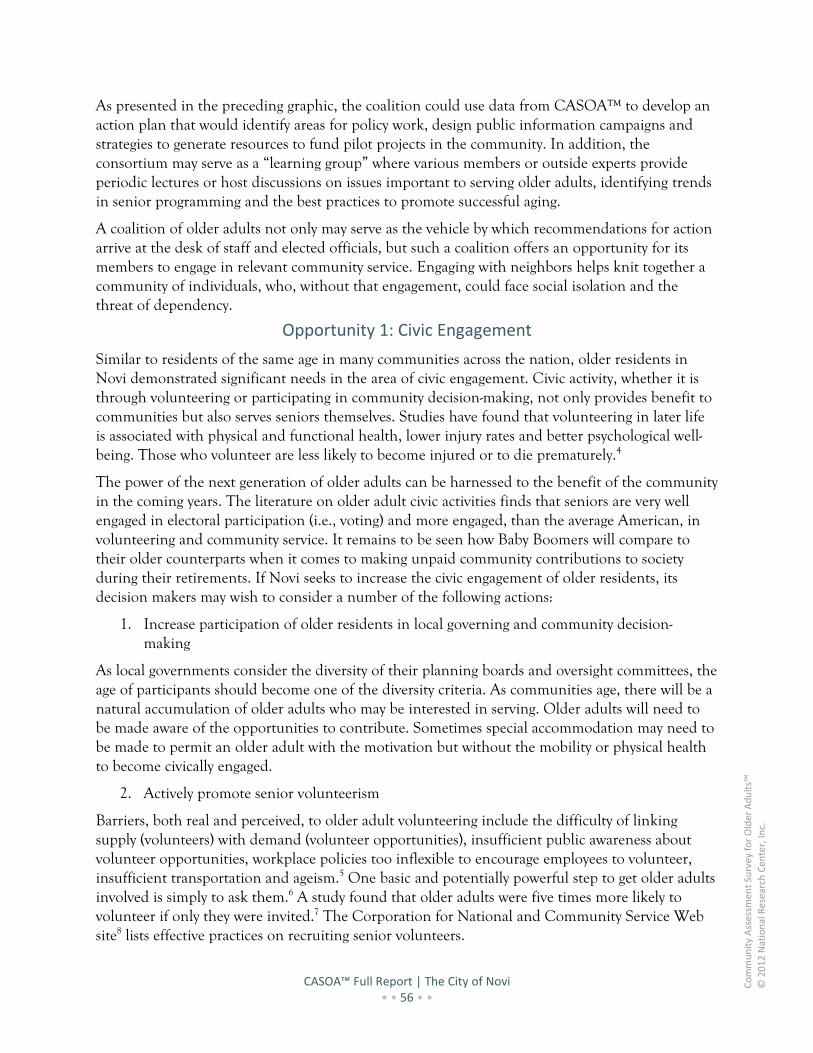
CASOA™ Full Report | The City of Novi • • 56 • •
Co
mm
un
ity
Ass
essm
ent
Surv
ey f
or
Old
er A
du
lts™
© 2
01
2 N
atio
nal
Res
earc
h C
ente
r, In
c.
As presented in the preceding graphic, the coalition could use data from CASOA™ to develop an action plan that would identify areas for policy work, design public information campaigns and strategies to generate resources to fund pilot projects in the community. In addition, the consortium may serve as a “learning group” where various members or outside experts provide periodic lectures or host discussions on issues important to serving older adults, identifying trends in senior programming and the best practices to promote successful aging.
A coalition of older adults not only may serve as the vehicle by which recommendations for action arrive at the desk of staff and elected officials, but such a coalition offers an opportunity for its members to engage in relevant community service. Engaging with neighbors helps knit together a community of individuals, who, without that engagement, could face social isolation and the threat of dependency.
Opportunity 1: Civic Engagement
Similar to residents of the same age in many communities across the nation, older residents in Novi demonstrated significant needs in the area of civic engagement. Civic activity, whether it is through volunteering or participating in community decision-making, not only provides benefit to communities but also serves seniors themselves. Studies have found that volunteering in later life is associated with physical and functional health, lower injury rates and better psychological well-being. Those who volunteer are less likely to become injured or to die prematurely.4
The power of the next generation of older adults can be harnessed to the benefit of the community in the coming years. The literature on older adult civic activities finds that seniors are very well engaged in electoral participation (i.e., voting) and more engaged, than the average American, in volunteering and community service. It remains to be seen how Baby Boomers will compare to their older counterparts when it comes to making unpaid community contributions to society during their retirements. If Novi seeks to increase the civic engagement of older residents, its decision makers may wish to consider a number of the following actions:
1. Increase participation of older residents in local governing and community decision-making
As local governments consider the diversity of their planning boards and oversight committees, the age of participants should become one of the diversity criteria. As communities age, there will be a natural accumulation of older adults who may be interested in serving. Older adults will need to be made aware of the opportunities to contribute. Sometimes special accommodation may need to be made to permit an older adult with the motivation but without the mobility or physical health to become civically engaged.
2. Actively promote senior volunteerism
Barriers, both real and perceived, to older adult volunteering include the difficulty of linking supply (volunteers) with demand (volunteer opportunities), insufficient public awareness about volunteer opportunities, workplace policies too inflexible to encourage employees to volunteer, insufficient transportation and ageism.5 One basic and potentially powerful step to get older adults involved is simply to ask them.6 A study found that older adults were five times more likely to volunteer if only they were invited.7 The Corporation for National and Community Service Web site8 lists effective practices on recruiting senior volunteers.
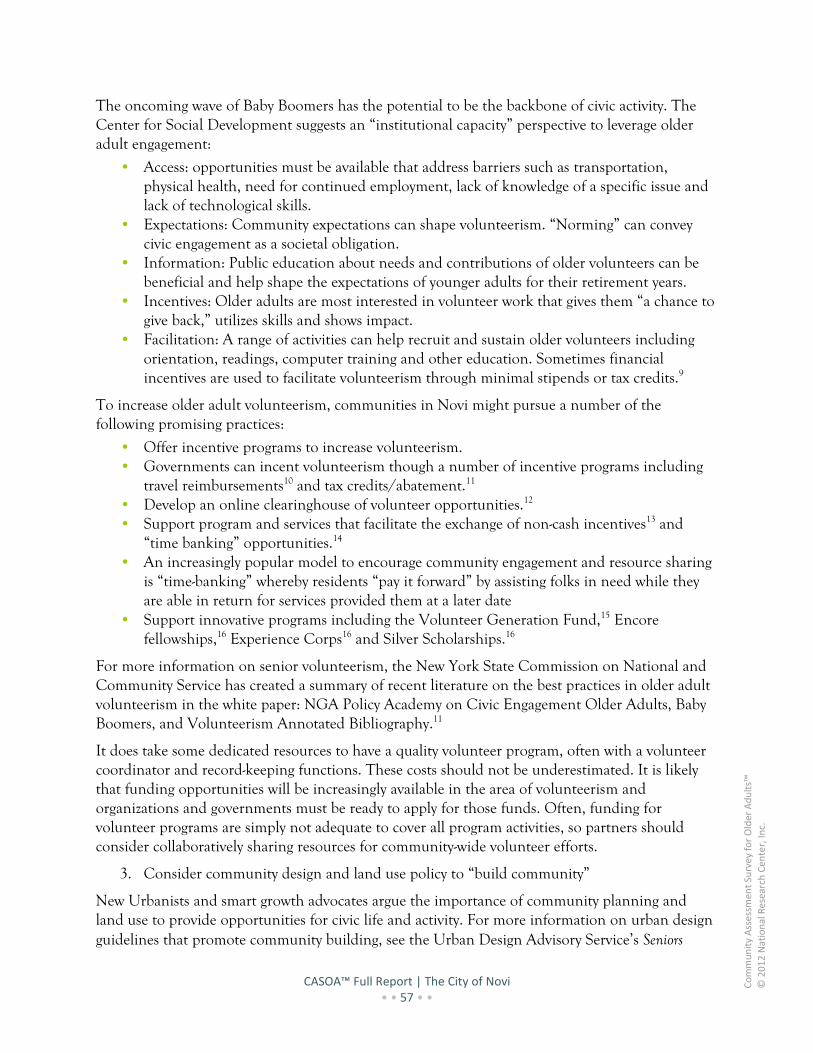
CASOA™ Full Report | The City of Novi • • 57 • •
Co
mm
un
ity
Ass
essm
ent
Surv
ey f
or
Old
er A
du
lts™
© 2
01
2 N
atio
nal
Res
earc
h C
ente
r, In
c.
The oncoming wave of Baby Boomers has the potential to be the backbone of civic activity. The Center for Social Development suggests an “institutional capacity” perspective to leverage older adult engagement:
• Access: opportunities must be available that address barriers such as transportation, physical health, need for continued employment, lack of knowledge of a specific issue and lack of technological skills.
• Expectations: Community expectations can shape volunteerism. “Norming” can convey civic engagement as a societal obligation.
• Information: Public education about needs and contributions of older volunteers can be beneficial and help shape the expectations of younger adults for their retirement years.
• Incentives: Older adults are most interested in volunteer work that gives them “a chance to give back,” utilizes skills and shows impact.
• Facilitation: A range of activities can help recruit and sustain older volunteers including orientation, readings, computer training and other education. Sometimes financial incentives are used to facilitate volunteerism through minimal stipends or tax credits.9
To increase older adult volunteerism, communities in Novi might pursue a number of the following promising practices:
• Offer incentive programs to increase volunteerism. • Governments can incent volunteerism though a number of incentive programs including
travel reimbursements10 and tax credits/abatement.11 • Develop an online clearinghouse of volunteer opportunities.12 • Support program and services that facilitate the exchange of non-cash incentives13 and
“time banking” opportunities.14 • An increasingly popular model to encourage community engagement and resource sharing
is “time-banking” whereby residents “pay it forward” by assisting folks in need while they are able in return for services provided them at a later date
• Support innovative programs including the Volunteer Generation Fund,15 Encore fellowships,16 Experience Corps16 and Silver Scholarships.16
For more information on senior volunteerism, the New York State Commission on National and Community Service has created a summary of recent literature on the best practices in older adult volunteerism in the white paper: NGA Policy Academy on Civic Engagement Older Adults, Baby Boomers, and Volunteerism Annotated Bibliography.11
It does take some dedicated resources to have a quality volunteer program, often with a volunteer coordinator and record-keeping functions. These costs should not be underestimated. It is likely that funding opportunities will be increasingly available in the area of volunteerism and organizations and governments must be ready to apply for those funds. Often, funding for volunteer programs are simply not adequate to cover all program activities, so partners should consider collaboratively sharing resources for community-wide volunteer efforts.
3. Consider community design and land use policy to “build community”
New Urbanists and smart growth advocates argue the importance of community planning and land use to provide opportunities for civic life and activity. For more information on urban design guidelines that promote community building, see the Urban Design Advisory Service’s Seniors

CASOA™ Full Report | The City of Novi • • 58 • •
Co
mm
un
ity
Ass
essm
ent
Surv
ey f
or
Old
er A
du
lts™
© 2
01
2 N
atio
nal
Res
earc
h C
ente
r, In
c.
Living Policy: Urban Design Guidelines for Infill Development,17 Livable Communities for Older People,18 and the Beyond 50.50 Survey.18
Opportunity 2. Community Design and Land Use
The health and well-being of older adults cannot rest only on the shoulders of older adults themselves. Older adult at the center of several collaborative opportunities can improve the environment for seniors. Many authors identify community land use design as a central mechanism by which the quality of life of older adults can be sustained and improved. In the absence of thoughtful strategies and intentional plans, American communities have tended to be built in sprawling pieces like shattered mirrors that reflect little attention to efficiency of movement, diversity of housing choice or interconnectedness of neighbors. Most suburbs have been developed by the draw of inexpensive land and for the competencies of automobiles. Better community designs create what authors call “livable” communities, which offer smaller street widths to encourage healthy outdoor activities such as walking and bicycling, more abundant and more affordable housing options to maximize diversity and better connection with neighbors to foster safety and build social capital.
New Urbanists and smart growth advocates argue the importance of community planning and land use to provide opportunities for civic life and activity. For more information on urban design guidelines that promote community building, see the Urban Design Advisory Service’s Seniors Living Policy: Urban Design Guidelines for Infill Development,17 Livable Communities for Older People,18 and the Beyond 50.50 Survey18 and “How Age Friendly is Your Community?”.19
Availability and costs of appropriate housing can be a significant barrier to older adults trying to age in place. Affordable housing was found to be a significant issue for seniors living in Novi. Half of residents rated the availability of affordable quality housing as “fair” or “poor” and over one-third of older residents were found to pay housing costs which were greater than 30% of their income. Although housing costs are largely determined by supply and demand, communities seeking reductions to housing cost burden for older residents might want to consider the following practices:
1. Consider zoning regulations that encourage affordable housing options
Zoning regulation and development fees often can discourage the production of affordable housing. Modifying these policies to incent mixed-use, high-density and/or infill developments can help create housing stock with lower cost burden to seniors. The Urban Land Institute has produced a 2005 guide “Best Practices in the Production of Affordable Housing” which discusses issues with predevelopment, financing and sustainability and growth20 and a 2002 report from the Commission on Affordable Housing and Health Facilities Needs for Seniors in the 21st Century provides a list of best practices in affordable senior housing.21
2. Develop programs that reduce housing costs
Popular senior housing programs that reduce the cost of housing include real estate tax relief or deferral, home energy assistance and senior homeowner exemptions.
3. Partner with developers and builders to provide affordable senior housing projects

CASOA™ Full Report | The City of Novi • • 59 • •
Co
mm
un
ity
Ass
essm
ent
Surv
ey f
or
Old
er A
du
lts™
© 2
01
2 N
atio
nal
Res
earc
h C
ente
r, In
c.
Local governments have partnered with developers to provide fee waivers and other development cost reductions for new housing projects that are more affordable for older adults. Standard requirements for street widths, schools, water mains and maximum densities have been modified to account for the different footprint that older adults leave on a community. Revised development policies can enhance new development opportunities to accommodate older adults.
4. Provide education and technical assistance around home financing (including reverse mortgages) and financial planning.
Older adult preference to live out their retirement years in their own homes challenges communities to provide services to help seniors maintain and modify their homes so they can “age in place.” A need for home maintenance – both interior and exterior – was found for Novi’s older residents. Strategies pursued by communities to help older residents remain independent in their private residences include:
5. Promote senior home assessments
Identifying the safety and fall hazards of older residents’ homes not only educates the homeowners but helps target high-risk individuals for interventions. A number of assessment tools are provided at the National Center for Supportive Housing and Home Modification Web site: www.Homemods.org. Energy audits can identify savings that also enhance the likelihood that older adults will be able to remain in their homes.
6. Support home modification and repair services
Most of America’s existing housing stock was built before “universal design” was considered desirable or profitable. (Universal housing design requires builders to consider the needs of residents as they age. This results in no-step entries, wider corridors and interior doorways and level handles for easy door opening.) Thus, services that retrofit senior homes with safety features such as grab-bars, handrails and ramps can be funded by local governments or approached as organized volunteer activities to help compensate for housing stock that is less “senior-friendly.” “Handy worker” programs to provide routine maintenance to homes is also popular among communities. The University of Southern California provides a National Resource Center on Supportive Housing and Home Modification which lists resources and programs by state22. Additionally, the National Center for Supportive Housing and Home Modification sponsors a website which provides online education to builders, planners, non-profit staff and policymakers on universal design, home modification assessment tools, adaptive technology, funding sources for home modification and more.23
The success of the “Adopt-a-highway” programs has spurred the adoption of all types of public goods (e.g., rainforests, schools, beaches, libraries) as well as population groups or public areas in need (high-risk youth, soldiers, low-income families, minefields). Organizations can be enlisted to support “adopt-a-senior” projects to help keep older residents independent. Local governments can encourage the community and particularly community organizations such as employers, faith-based groups and youth to provide needed services such as yard work, painting and snow shoveling.
7. Pursue policies encouraging universal design and senior housing options that require less maintenance burden

CASOA™ Full Report | The City of Novi • • 60 • •
Co
mm
un
ity
Ass
essm
ent
Surv
ey f
or
Old
er A
du
lts™
© 2
01
2 N
atio
nal
Res
earc
h C
ente
r, In
c.
As with many of the other need areas for older residents, creating or modifying zoning and building codes to promote universal design features and allow for more flexible housing choices will reduce the amount of services needed to modify and maintain senior homes for future generations of older residents.
8. Promote housekeeping services
Although housekeeping services are offered by the private sector and some government organizations, those services generally are offered only to residents with the financial wherewithal to afford them or to those with serious health problems and often are limited to specific rooms in the home (e.g., just the kitchen or bedroom) and for specific activities (e.g., sheet changing, cleaning of bathrooms used by frail seniors). When an older resident becomes too frail even to vacuum or do laundry, others need to provide the service to permit the senior to remain in the home. In the absence of regular housekeeping services, not only will older adults face consequences to their health, but they will be more likely to remain isolated, determined not to let neighbors or even relatives enter an unkempt home.
Transportation and mobility issues afflict most areas where adults are growing old; many studies have been undertaken and many recommendations made regarding the need for more public transportation and increased mobility options. Older adults too often ignore physical impairments that should sideline them from their role as driver, so as the population ages, roads will become more dangerous without attractive alternatives to the car. Solutions to these complex problems can include, as examples, programs that mitigate the need for older adults to travel – such as delivery services, online shopping and virtual in-home health care; programs that offer inexpensive on-call or frequent shuttle service and more. Promising practices the City of Novi might want to consider include:
9. Work with elected officials and community planners to consider community designs that obviate the need for a car.
New Urbanist and Smart Growth community design principles that promote community walkability, affordable housing and multi-use development provide settings where older residents are not automobile reliant. For more information on urban design guidelines that promote community building, see the Urban Design Advisory Service’s Seniors Living Policy: Urban Design Guidelines for Infill Development,17 Livable Communities for Older People,18 and the Beyond 50.50 Survey.18
10. Develop “time bank” or other volunteer programs to support senior transportation.
In rural and suburban areas, the most cost-efficient way to provide rides is through the use of other residents (family, friends, neighbor and volunteers). Programs encouraging ride sharing and matching can provide to seniors lacking adequate transportation options.
Opportunity 3: Physical Health and Mental Health
Good health rarely comes without effort. The public health literature clearly shows the benefits that come from physical activity, nutrition, cognitive exercise and preventive healthcare but the lifestyles that support these choices must be encouraged and nurtured. Opportunities to promote healthy lifestyles can come from anywhere on the socio-ecologic model – from public policies that
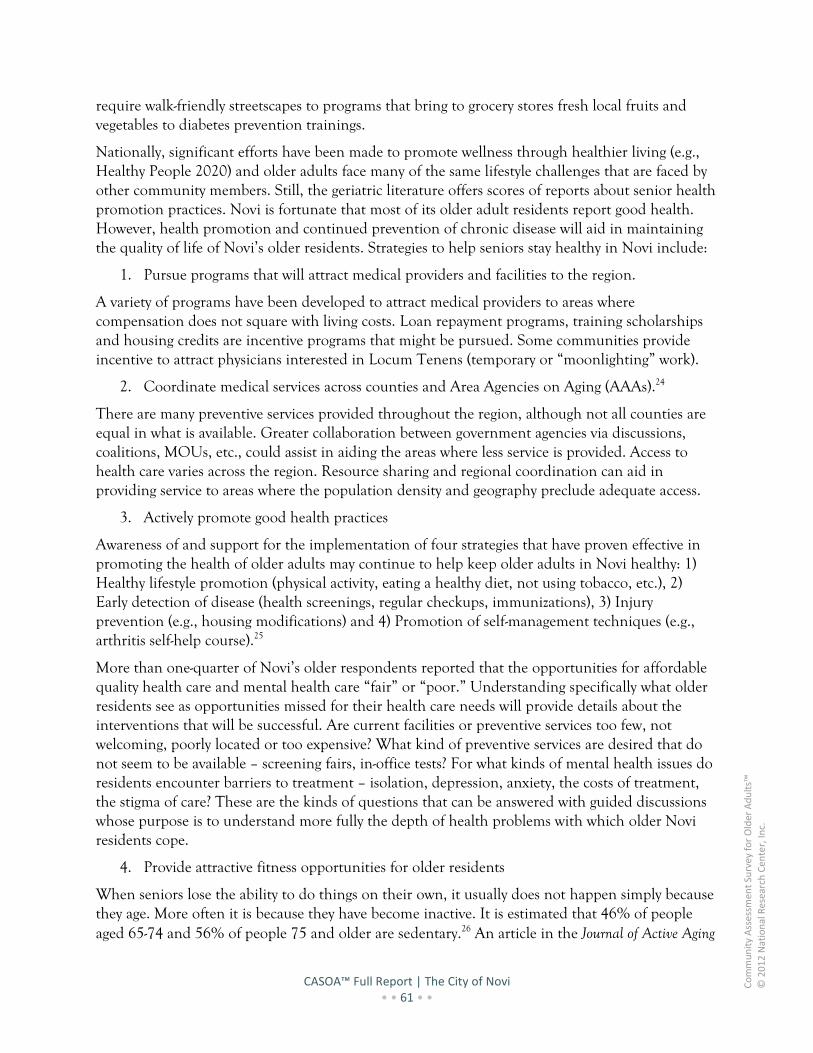
CASOA™ Full Report | The City of Novi • • 61 • •
Co
mm
un
ity
Ass
essm
ent
Surv
ey f
or
Old
er A
du
lts™
© 2
01
2 N
atio
nal
Res
earc
h C
ente
r, In
c.
require walk-friendly streetscapes to programs that bring to grocery stores fresh local fruits and vegetables to diabetes prevention trainings.
Nationally, significant efforts have been made to promote wellness through healthier living (e.g., Healthy People 2020) and older adults face many of the same lifestyle challenges that are faced by other community members. Still, the geriatric literature offers scores of reports about senior health promotion practices. Novi is fortunate that most of its older adult residents report good health. However, health promotion and continued prevention of chronic disease will aid in maintaining the quality of life of Novi’s older residents. Strategies to help seniors stay healthy in Novi include:
1. Pursue programs that will attract medical providers and facilities to the region.
A variety of programs have been developed to attract medical providers to areas where compensation does not square with living costs. Loan repayment programs, training scholarships and housing credits are incentive programs that might be pursued. Some communities provide incentive to attract physicians interested in Locum Tenens (temporary or “moonlighting” work).
2. Coordinate medical services across counties and Area Agencies on Aging (AAAs).24
There are many preventive services provided throughout the region, although not all counties are equal in what is available. Greater collaboration between government agencies via discussions, coalitions, MOUs, etc., could assist in aiding the areas where less service is provided. Access to health care varies across the region. Resource sharing and regional coordination can aid in providing service to areas where the population density and geography preclude adequate access.
3. Actively promote good health practices
Awareness of and support for the implementation of four strategies that have proven effective in promoting the health of older adults may continue to help keep older adults in Novi healthy: 1) Healthy lifestyle promotion (physical activity, eating a healthy diet, not using tobacco, etc.), 2) Early detection of disease (health screenings, regular checkups, immunizations), 3) Injury prevention (e.g., housing modifications) and 4) Promotion of self-management techniques (e.g., arthritis self-help course).25
More than one-quarter of Novi’s older respondents reported that the opportunities for affordable quality health care and mental health care “fair” or “poor.” Understanding specifically what older residents see as opportunities missed for their health care needs will provide details about the interventions that will be successful. Are current facilities or preventive services too few, not welcoming, poorly located or too expensive? What kind of preventive services are desired that do not seem to be available – screening fairs, in-office tests? For what kinds of mental health issues do residents encounter barriers to treatment – isolation, depression, anxiety, the costs of treatment, the stigma of care? These are the kinds of questions that can be answered with guided discussions whose purpose is to understand more fully the depth of health problems with which older Novi residents cope.
4. Provide attractive fitness opportunities for older residents
When seniors lose the ability to do things on their own, it usually does not happen simply because they age. More often it is because they have become inactive. It is estimated that 46% of people aged 65-74 and 56% of people 75 and older are sedentary.26 An article in the Journal of Active Aging

CASOA™ Full Report | The City of Novi • • 62 • •
Co
mm
un
ity
Ass
essm
ent
Surv
ey f
or
Old
er A
du
lts™
© 2
01
2 N
atio
nal
Res
earc
h C
ente
r, In
c.
reports: “The biggest message to bring across is that with every increasing decade of age, people become less and less active; but the evidence shows that with every increasing decade, exercise becomes more important in terms of quality of life, independence and having a full life. So as of now, Americans are not on the right path.” 14 Research fuels new physical activity recommendations for older adults.27
Some promising programs to get older residents moving include: pedometer or walking programs; outdoor recreation opportunities such as hiking, biking, bird watching, mind-body exercises such as Pilates and yoga, and organized events such as races and triathlons uniquely for seniors. Other fitness programs for seniors are provided in the American Society on Aging’s Live Well, Live Long: Steps to Better Health Series.28 Not only should these programs be promoted actively through recreation and senior centers but also through employers, schools, faith communities and other community-based organizations. Programs aimed not only at seniors will help to establish good habits among young people, too, and may diminish obesity and sedentary behavior across all ages.
5. Consider community design features to promote active-living communities
Much is published about the importance of the built environment and its role in promoting physical activity. A recent review of literature on environmental factors that affect physical activity has found many significant associations between health and the accessibility of facilities, opportunities for physical activity, pedestrian-friendly street plans29 and safety.30 Focusing on community planning and design features that emphasize concepts of New Urbanism and Smart Growth may have strong impacts not only on older adult physical activity but also on traffic, environmental quality, community safety and opportunities for building social capital.31-34 For more information on planning communities that promote active aging, see the Partnerships for Prevention’s guide: Creating Communities for Active Aging,35 the Active Living Leadership’s Primer on Active Living for Government Officials36 and Robert Wood Johnson Foundation’s Leadership for Healthy Communities.37
6. Promote access to fruits, vegetables and healthy eating choices
Food security refers to the ability to access, at all times, enough food for an active, healthy life.38 Nationally, more than 1.6 million households with seniors are estimated to be “food insecure” and the rate of food insecurity triples for elders in poverty.38 Nationally, food insecure seniors were 2.3 times more likely to report fair/poor health status and had higher nutritional risk than their younger counterparts.39 However, communities can make a difference. In a recent study of 17 community-led health programs, communities that provided greater access to fresh produce showed greater increases in resident fruit and vegetable consumption.29 Innovative programs to promote healthful eating for older residents include: 1) Senior Community-supported Agriculture (CSA) projects (a strategy that allows senior consumers to purchase shares of a local farmers harvest), 2) “farm to institution” programs where local farmers deliver produce for cafeterias of hospitals, nursing homes and assisted living facilities, and 3) the USDA funded Senior Farmers’ Market Nutrition Program.40 Information on projects aimed at increasing the food security of seniors appears at www.foodsecurity.org and more information on food security issues and older adults is on America’s Second Harvest Fact sheet on Senior Hunger.39 In addition to these resources, the USDA has produced a food security toolkit that provides a series of tools to help communities assess their food security and target areas and populations in need.41

CASOA™ Full Report | The City of Novi • • 63 • •
Co
mm
un
ity
Ass
essm
ent
Surv
ey f
or
Old
er A
du
lts™
© 2
01
2 N
atio
nal
Res
earc
h C
ente
r, In
c.
7. Improve access to screenings and programs for depression, anxiety and Alzheimer’s/dementia
Programs for mental health can be provided not only by mental health centers. Recreation centers, faith-based organizations and the offices of medical doctors offer opportunities to test older adults’ cognitive abilities and symptoms of depression, anxiety, Alzheimer’s/dementia and substance abuse. Health fairs can include written screening tests for signs of dementia and for symptoms of other mental health problems.42 In brochures, on Web sites or in media broadcasts, candid communication from local government and Area Agencies on Aging about the prevalence of mental health problems associated with aging will reduce the stigma associated with admitting problems or reporting them when suspected by friends and family. Where such reporting should occur and the likely steps that follow self report or reporting by others must be widely disseminated to older residents and other adults in the area.43
Conclusions
The Older Americans Act (OAA) currently supports a national aging services network that provides home and community-based services to over 8 million older adults. Services provided by the network include home-delivered meals, nutrition education, transportation, adult day care, health promotion and the support of caregivers.1 Riding to the rescue of those among the 76 million aging Baby Boomers who will press unprecedented demands on this country’s “already strained social services, appropriate housing and transportation problems” will require a new way of thinking about services for older Americans. This assessment captured the perspective of Novi’s older residents, demonstrating widespread agreement that seniors are generally satisfied with the current quality of life in the community. Attendant to the older adult residents in Novi is widespread (albeit not uniform) good health, engagement in social and physical activities and a positive outlook on conditions here. The City of Novi is doing a good job of providing opportunities for older residents, but there are limitations to continued success that need to be addressed before the full force of the growth in the number of older adults hits.
More present work must be done and done by more actors. The model of service to needy older adults, built primarily on the policies and funding of the federal government, is unsustainable. Figure 82: Service Opportunities by Community Sector presents many of the actions that might be taken by the various community sectors in the City of Novi. Therefore, much of the planning for this demographic swell must be led not just by Congress and national organizations, but by city councilors, Area Agency on Aging advisory boards, county commissioners, faith communities, service club members, college presidents, hospital administrators, business owners and community members. An aging world need not be a place where human resources diminish and productivity flags. With proper planning, communities filled with older adults can become centers of high quality human scale living, anchored by the contributions of civically engaged older residents. Imagine communities filled with older adults who have the wherewithal to purchase consumer goods and services, participate in local politics, learn new skills, live at home, harm no one, share their accumulated wisdom, help their neighbors, broker their talents – in short, imagine a healthy group of civically engaged adults who take little or only what they truly need and give a lot.

CASOA™ Full Report | The City of Novi • • 64 • •
Co
mm
un
ity
Ass
essm
ent
Surv
ey f
or
Old
er A
du
lts™
© 2
01
2 N
atio
nal
Res
earc
h C
ente
r, In
c.
Figure 82: Service Opportunities by Community Sector
• Continue to serve vulnerable populations through meals, transportation, caregiving assistance, etc.
• Serve as information clearinghouse
• Provide resource and referral activities
• Provide technical assistance to private and community sectors
• Organize or provide volunteer/time banking matching services
• Work with other government entities on shared community issues such as transportation, affordable housing, health care and community design
• Grant-writing to fund innovative programs related to prevention – fitness, preventive health strategies, fall prevention, etc.
• Organization of collaboratives/older adult councils
Gov
ernm
ent
Comm
unity-based
Organizations
Private Sector
Aging in Place
• Employers implement policies and programs to facilitate civic engagement, senior jobs, and caregiver support
• New business starts in areas of home health care, companion services, homemaking and maintenance, home modifications
• Development of more senior-friendly homes and communities (including assisted living options)
• Development of additional medical facilities and services
Faith-based Communities and Other Membership Groups
• Provide education around areas of caregiving, public health insurance, financial and legal planning
• Encourage and organize volunteer activities to support older residents
• Provide caregiver respite and support
• Organize senior fitness and recreational groups
• Provide mental health counseling/or peer counseling
Organizations Serving Seniors• Collaborate with government,
private sector and other CBOs to identify shared interests
• Participate in activities aimed at systems change (policy advocacy, public education, networking)
• Harness power of baby boomers to volunteer and contribute in meaningful ways
• Grant-writing

CASOA™ Full Report | The City of Novi • • 65 • •
Co
mm
un
ity
Ass
essm
ent
Surv
ey f
or
Old
er A
du
lts™
© 2
01
2 N
atio
nal
Res
earc
h C
ente
r, In
c.
American communities can choose a future that both protects vulnerable older adults and challenges those who thrive. A well-conceived and updated community will provide care to older adults that need it at the same time empowering older adults with far greater opportunities than exist now to age successfully and contribute. But not every community faces the same future nor do all older residents seek the same services. Older adults in Novi face many of the same issues as seniors across the nation – housing, transportation and health care.
Whatever the unique needs in each community, one common circumstance will prevail. Resources will have to be reallocated. As populations age there will be changes in taste that will affect local news, arts, politics and even groceries, but needs that require more planning will emerge and anticipation of those needs, rather than surprise confrontation, will lead to communities that prosper because they are comfortable for and attractive to older adults. As with the rest of the nation, the City of Novi will need to plan strategically for the aging of its residents. This report provides the foundation for beginning this ongoing strategic planning.
A periodic sounding of Novi’s older adults will provide ongoing assessment of the progress the City makes as the spring of older adults bubbles into the community. Conducting the CASOA™ puts Novi vastly ahead of most communities in the U.S. because planning for the coming wave of older adults most often is accomplished by the assertions of hard working service providers, who, despite their commitment to the well-being of older adults, cannot speak as articulately for older adults as older adults can speak for themselves.
An AARP executive noted about America’s aging: “It would be hard to overstate the significance of these shifts… But from here on, every planning decision made in every community must take into account the impact on older residents, who can no longer be an afterthought. The ability of our institutions to adapt to an aging nation will be one of the great American challenges of the 21st century.”44 As the Baby Boomers are just beginning to reach beyond age 65, their communities are struggling with the best next steps to prepare for that generation when it hits 70, then 80 and older. This is the right time for developing solid strategies that become the platforms on which to build societal change because soon, planning will have to be joined with action. How America treats its older adults will define our nation. This is our challenge as we reach toward the twenty-second Century.
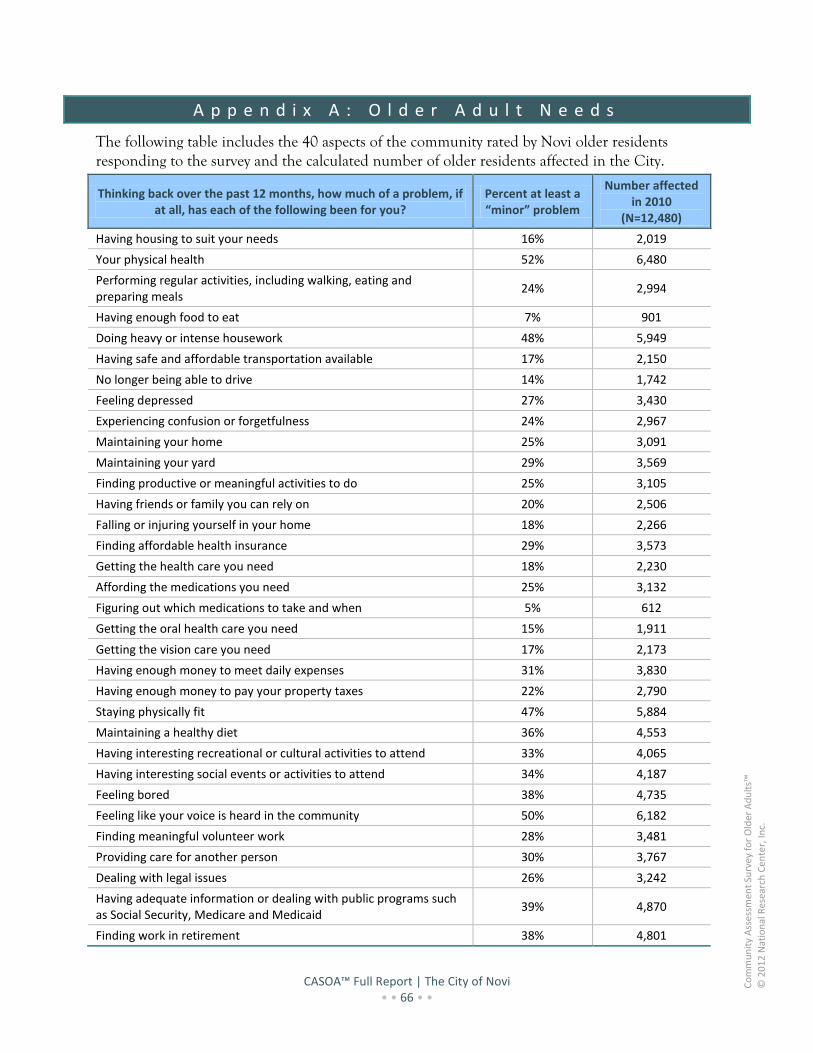
CASOA™ Full Report | The City of Novi • • 66 • •
Co
mm
un
ity
Ass
essm
ent
Surv
ey f
or
Old
er A
du
lts™
© 2
01
2 N
atio
nal
Res
earc
h C
ente
r, In
c.
A p p e n d i x A : O l d e r A d u l t N e e d s
The following table includes the 40 aspects of the community rated by Novi older residents responding to the survey and the calculated number of older residents affected in the City.
Thinking back over the past 12 months, how much of a problem, if at all, has each of the following been for you?
Percent at least a “minor” problem
Number affected in 2010
(N=12,480)
Having housing to suit your needs 16% 2,019
Your physical health 52% 6,480
Performing regular activities, including walking, eating and preparing meals
24% 2,994
Having enough food to eat 7% 901
Doing heavy or intense housework 48% 5,949
Having safe and affordable transportation available 17% 2,150
No longer being able to drive 14% 1,742
Feeling depressed 27% 3,430
Experiencing confusion or forgetfulness 24% 2,967
Maintaining your home 25% 3,091
Maintaining your yard 29% 3,569
Finding productive or meaningful activities to do 25% 3,105
Having friends or family you can rely on 20% 2,506
Falling or injuring yourself in your home 18% 2,266
Finding affordable health insurance 29% 3,573
Getting the health care you need 18% 2,230
Affording the medications you need 25% 3,132
Figuring out which medications to take and when 5% 612
Getting the oral health care you need 15% 1,911
Getting the vision care you need 17% 2,173
Having enough money to meet daily expenses 31% 3,830
Having enough money to pay your property taxes 22% 2,790
Staying physically fit 47% 5,884
Maintaining a healthy diet 36% 4,553
Having interesting recreational or cultural activities to attend 33% 4,065
Having interesting social events or activities to attend 34% 4,187
Feeling bored 38% 4,735
Feeling like your voice is heard in the community 50% 6,182
Finding meaningful volunteer work 28% 3,481
Providing care for another person 30% 3,767
Dealing with legal issues 26% 3,242
Having adequate information or dealing with public programs such as Social Security, Medicare and Medicaid
39% 4,870
Finding work in retirement 38% 4,801

CASOA™ Full Report | The City of Novi • • 67 • •
Co
mm
un
ity
Ass
essm
ent
Surv
ey f
or
Old
er A
du
lts™
© 2
01
2 N
atio
nal
Res
earc
h C
ente
r, In
c.
Thinking back over the past 12 months, how much of a problem, if at all, has each of the following been for you?
Percent at least a “minor” problem
Number affected in 2010
(N=12,480)
Building skills for paid or unpaid work 28% 3,511
Not knowing what services are available to older adults in your community
54% 6,748
Feeling lonely or isolated 23% 2,855
Dealing with the loss of a close family member or friend 31% 3,911
Being a victim of crime 13% 1,621
Being a victim of fraud or a scam 13% 1,663
Being physically or emotionally abused 3% 385
Dealing with financial planning issues 29% 3,605

CASOA™ Full Report | The City of Novi • • 68 • •
Co
mm
un
ity
Ass
essm
ent
Surv
ey f
or
Old
er A
du
lts™
© 2
01
2 N
atio
nal
Res
earc
h C
ente
r, In
c.
A p p e n d i x B : C o m p l e t e S e t o f S u r v e y F r e q u e n c i e s
Frequencies Excluding Don’t Know Responses
This appendix displays all response categories for all questions. The first set of frequencies excludes the “don’t know” option and the second set includes “don’t know” responses.
Question 1: Quality of Community
Please circle the number that comes closest to your opinion for each of the following questions.
Excellent Good Fair Poor Total
How do you rate the City of Novi as a place to live? 51% 45% 3% 1% 100%
How do you rate the City of Novi as a place to retire? 36% 42% 16% 5% 100%
Question 2: Community Characteristics
Please rate each of the following characteristics as they relate to City of Novi adults age 55 or over:
Excellent Good Fair Poor Total
Opportunities to volunteer 28% 54% 15% 2% 100%
Employment opportunities 7% 29% 48% 16% 100%
Opportunities to enroll in skill-building or personal enrichment classes
31% 48% 18% 3% 100%
Recreation opportunities (including games, arts, and library services, etc.)
36% 47% 14% 3% 100%
Fitness opportunities (including exercise classes and paths or trails, etc.)
35% 46% 16% 3% 100%
Opportunities to attend social events or activities 25% 53% 19% 4% 100%
Opportunities to attend religious or spiritual activities 43% 48% 8% 2% 100%
Opportunities to attend or participate in meetings about local government or community matters
27% 47% 24% 3% 100%
Availability of affordable quality housing 17% 33% 33% 17% 100%
Variety of housing options 23% 40% 26% 11% 100%
Availability of long-term care options 15% 40% 32% 14% 100%
Availability of daytime care options for older adults 12% 38% 31% 19% 100%
Availability of information about resources for older adults 21% 50% 22% 7% 100%
Availability of financial or legal planning services 20% 49% 23% 8% 100%
Availability of affordable quality physical health care 32% 40% 20% 7% 100%
Availability of affordable quality mental health care 17% 40% 30% 14% 100%
Availability of preventive health services (e.g., health screenings, flu shots, educational workshops)
30% 49% 17% 4% 100%
Availability of affordable quality food 31% 43% 20% 7% 100%
Sense of community 22% 44% 26% 8% 100%
Openness and acceptance of the community towards older residents of diverse backgrounds
18% 54% 21% 7% 100%

CASOA™ Full Report | The City of Novi • • 69 • •
Co
mm
un
ity
Ass
essm
ent
Surv
ey f
or
Old
er A
du
lts™
© 2
01
2 N
atio
nal
Res
earc
h C
ente
r, In
c.
Please rate each of the following characteristics as they relate to City of Novi adults age 55 or over:
Excellent Good Fair Poor Total
Ease of bus travel in Novi 6% 17% 23% 54% 100%
Ease of rail or subway travel in Novi 1% 7% 9% 82% 100%
Ease of car travel in Novi 24% 46% 24% 6% 100%
Ease of walking in Novi 18% 36% 34% 12% 100%
Ease of getting to the places you usually have to visit 24% 52% 20% 4% 100%
Overall feeling of safety in Novi 34% 53% 12% 1% 100%
Valuing older residents in Novi 24% 47% 24% 5% 100%
Neighborliness of Novi 18% 46% 27% 8% 100%
Question 3: Overall Service to Older Adults
Excellent Good Fair Poor Total
How would you rate the overall services provided to older adults in Novi?
23% 49% 24% 4% 100%
Question 4: Level of Informedness about Services and Activities for Older Adults
In general, how informed or uninformed do you feel about services and activities available to older adults Novi?
Percent of respondents
Very informed 19%
Somewhat informed 50%
Somewhat uninformed 22%
Very uninformed 9%
Total 100%
Question 5: Quality of Life and Health
Please circle the number that comes closest to your opinion for each of the following questions.
Excellent Good Fair Poor Total
How do you rate your overall physical health? 22% 55% 20% 3% 100%
How do you rate your overall mental health/emotional well being? 38% 51% 10% 0% 100%
How do you rate your overall quality of life? 32% 56% 11% 1% 100%

CASOA™ Full Report | The City of Novi • • 70 • •
Co
mm
un
ity
Ass
essm
ent
Surv
ey f
or
Old
er A
du
lts™
© 2
01
2 N
atio
nal
Res
earc
h C
ente
r, In
c.
Question 6: Problems Faced by Older Adults
The following questions list a number of problems that older adults may or may not face.
Thinking back over the last 12 months, how much of a problem, if at all, has each of the following
been for you?
Not a problem
Minor problem
Moderate problem
Major problem
Total
Having housing to suit your needs 84% 7% 5% 4% 100%
Your physical health 48% 31% 16% 5% 100%
Performing regular activities, including walking, eating and preparing meals
76% 13% 9% 2% 100%
Having enough food to eat 93% 4% 2% 1% 100%
Doing heavy or intense housework 52% 24% 15% 9% 100%
Having safe and affordable transportation available
83% 9% 6% 3% 100%
No longer being able to drive 86% 5% 3% 5% 100%
Feeling depressed 73% 18% 8% 2% 100%
Experiencing confusion or forgetfulness 76% 20% 2% 1% 100%
Maintaining your home 75% 16% 8% 2% 100%
Maintaining your yard 71% 19% 7% 2% 100%
Finding productive or meaningful activities to do 75% 16% 7% 2% 100%
Having friends or family you can rely on 80% 13% 5% 2% 100%
Falling or injuring yourself in your home 82% 12% 5% 1% 100%
Finding affordable health insurance 71% 15% 4% 9% 100%
Getting the health care you need 82% 13% 2% 2% 100%
Affording the medications you need 75% 16% 5% 4% 100%
Figuring out which medications to take and when 95% 3% 1% 1% 100%
Getting the oral health care you need 85% 9% 3% 3% 100%
Getting the vision care you need 83% 9% 5% 3% 100%
Having enough money to meet daily expenses 69% 18% 9% 4% 100%
Having enough money to pay your property taxes 78% 10% 8% 4% 100%
Staying physically fit 53% 27% 14% 5% 100%
Maintaining a healthy diet 64% 24% 9% 3% 100%
Having interesting recreational or cultural activities to attend
67% 16% 13% 3% 100%
Having interesting social events or activities to attend
66% 18% 12% 4% 100%
Feeling bored 62% 25% 10% 3% 100%
Feeling like your voice is heard in the community 50% 25% 16% 9% 100%
Finding meaningful volunteer work 72% 15% 9% 4% 100%
Providing care for another person 70% 16% 11% 3% 100%
Dealing with legal issues 74% 16% 7% 3% 100%
Having adequate information or dealing with 61% 23% 10% 6% 100%

CASOA™ Full Report | The City of Novi • • 71 • •
Co
mm
un
ity
Ass
essm
ent
Surv
ey f
or
Old
er A
du
lts™
© 2
01
2 N
atio
nal
Res
earc
h C
ente
r, In
c.
The following questions list a number of problems that older adults may or may not face.
Thinking back over the last 12 months, how much of a problem, if at all, has each of the following
been for you?
Not a problem
Minor problem
Moderate problem
Major problem
Total
public programs such as Social Security, Medicare and Medicaid
Finding work in retirement 62% 10% 17% 12% 100%
Building skills for paid or unpaid work 72% 13% 12% 2% 100%
Not knowing what services are available to older adults in your community
46% 28% 18% 7% 100%
Feeling lonely or isolated 77% 15% 7% 1% 100%
Dealing with the loss of a close family member or friend
69% 16% 10% 5% 100%
Being a victim of crime 87% 9% 3% 1% 100%
Being a victim of fraud or a scam 87% 7% 4% 2% 100%
Being physically or emotionally abused 97% 2% 1% 0% 100%
Dealing with financial planning issues 71% 17% 10% 2% 100%
Question 7: Days Spent in Facilities
Thinking back over the past 12 months, how many days did you spend in...
No days (zero)
One to two days
Three to five days
Six or more days
Total
As a patient in a hospital? 79% 5% 8% 8% 100%
In a long-term care facility (including nursing home or in-patient rehabilitation)?
97% 0% 0% 3% 100%
Question 8: Falls in Last 12 Months
Thinking back over the past 12 months, how many times have you fallen and injured yourself? Was it…
Percent of respondents
Never 77%
Once or twice 21%
3-5 times 1%
More than 5 times 1%
Total 100%
Question 9: Recommend Living in Community
How likely or unlikely are you to recommend living in Novi to older adults? Percent of respondents
Very likely 52%
Somewhat likely 32%
Somewhat unlikely 11%
Very unlikely 4%
Total 100%

CASOA™ Full Report | The City of Novi • • 72 • •
Co
mm
un
ity
Ass
essm
ent
Surv
ey f
or
Old
er A
du
lts™
© 2
01
2 N
atio
nal
Res
earc
h C
ente
r, In
c.
Question 10: Likelihood of Remaining in Community Throughout Retirement
How likely or unlikely are you to remain in Novi throughout your retirement? Percent of respondents
Very likely 56%
Somewhat likely 25%
Somewhat unlikely 9%
Very unlikely 10%
Total 100%
Question 11: Participation in Activities
In the last 12 month, about how many times, if ever, have you participated in or done each of the following?
Never Once or
twice 3 to 12 times
13 to 26 times
Total
Used the Novi senior center 76% 17% 7% 1% 100%
Used the Novi public library 37% 28% 24% 11% 100%
Attended a meeting of local elected officials or other local public meeting in Novi
76% 18% 6% 0% 100%
Watched a meeting of local elected officials or other City-sponsored public meeting on cable television, the Internet or other media
59% 27% 12% 3% 100%
Used Novi Senior Transportation 93% 4% 3% 1% 100%
Visited a neighborhood park 45% 30% 20% 5% 100%
Question 12: Hours Spent Doing Activities
During a typical week, how many hours, if any, do you spend doing the following?
Never (no hours)
1 to 3 hours
4 to 5 hours
6 to 10 hours
11 or more hours
Total
Participating in a club (including book, dance, game and other social)
61% 21% 7% 6% 4% 100%
Participating in a civic group (including, Elks, Kiwanis, Masons, etc.)
94% 4% 1% 0% 0% 100%
Communicating/visiting with friends and/or family
5% 27% 27% 15% 26% 100%
Participating in religious or spiritual activities with others
34% 44% 10% 5% 7% 100%
Participating in a recreation program or group activity
48% 30% 12% 5% 6% 100%
Providing help to friends or relatives 18% 48% 17% 6% 10% 100%
Volunteering your time to some group/activity in Novi
75% 14% 7% 2% 2% 100%

CASOA™ Full Report | The City of Novi • • 73 • •
Co
mm
un
ity
Ass
essm
ent
Surv
ey f
or
Old
er A
du
lts™
© 2
01
2 N
atio
nal
Res
earc
h C
ente
r, In
c.
Question 13: Hours Spent Providing Care
During a typical week, how many hours do you spend providing care for one or more
individuals with whom you have a significant relationship (such as spouse,
other relative, partner, friend, neighbor or child), whether or not they live with you?
Never (no
hours)
1 to 3 hours
4 to 5 hours
6 to 10
hours
11 to 19
hours
20 or more hours
Total
One or more individuals age 55 or older 59% 18% 8% 4% 6% 6% 100%
One or more individuals age 18 to 54 75% 10% 7% 3% 2% 4% 100%
One or more individuals under age 18 74% 7% 5% 3% 5% 7% 100%
Question 14: Receives Care
Whether or not they live with you, does someone provide assistance to you almost every day?
Percent of respondents
Yes 16%
No 84%
Total 100%
Question D1: Length of Residency
How many years have you lived in Novi? Percent of respondents
Less than 1 year 4%
1-5 years 17%
6-10 years 16%
11-20 years 23%
More than 20 years 40%
Total 100%
Question D2: Housing Unit Type
Which best describes the building you live in? Percent of respondents
Single family home 53%
Townhouse, condominium, duplex or apartment 32%
Mobile home 4%
Assisted living residence 5%
Nursing home 0%
Other 5%
Total 100%

CASOA™ Full Report | The City of Novi • • 74 • •
Co
mm
un
ity
Ass
essm
ent
Surv
ey f
or
Old
er A
du
lts™
© 2
01
2 N
atio
nal
Res
earc
h C
ente
r, In
c.
Question D3: Tenure (Rent or Own)
Do you currently rent or own your home? Percent of respondents
Rent 32%
Own (with a mortgage payment) 37%
Own (free and clear; no mortgage) 31%
Total 100%
Question D4: Monthly Housing Costs
About how much is your monthly housing cost for the place you live (including rent, mortgage payment, property tax, property insurance and
homeowners' association (HOA) fees)? Percent of respondents
Less than $300 per month 2%
$300 to $599 per month 17%
$600 to $999 per month 26%
$1,000 to $1,499 per month 23%
$1,500 to $2,499 per month 18%
$2,500 or more per month 13%
Total 100%
Question D5: Total Number of Household Members
How many people, including yourself, live in your household? Percent of respondents
1 person (live alone) 37%
2 people 43%
3 people 16%
4 or more people 4%
Total 100%
Question D6: Number of Older Adult Household Members
How many of these people, including yourself, are 55 or older? Percent of respondents
1 person 53%
2 people 47%
3 people 1%
4 or more people 0%
Total 100%
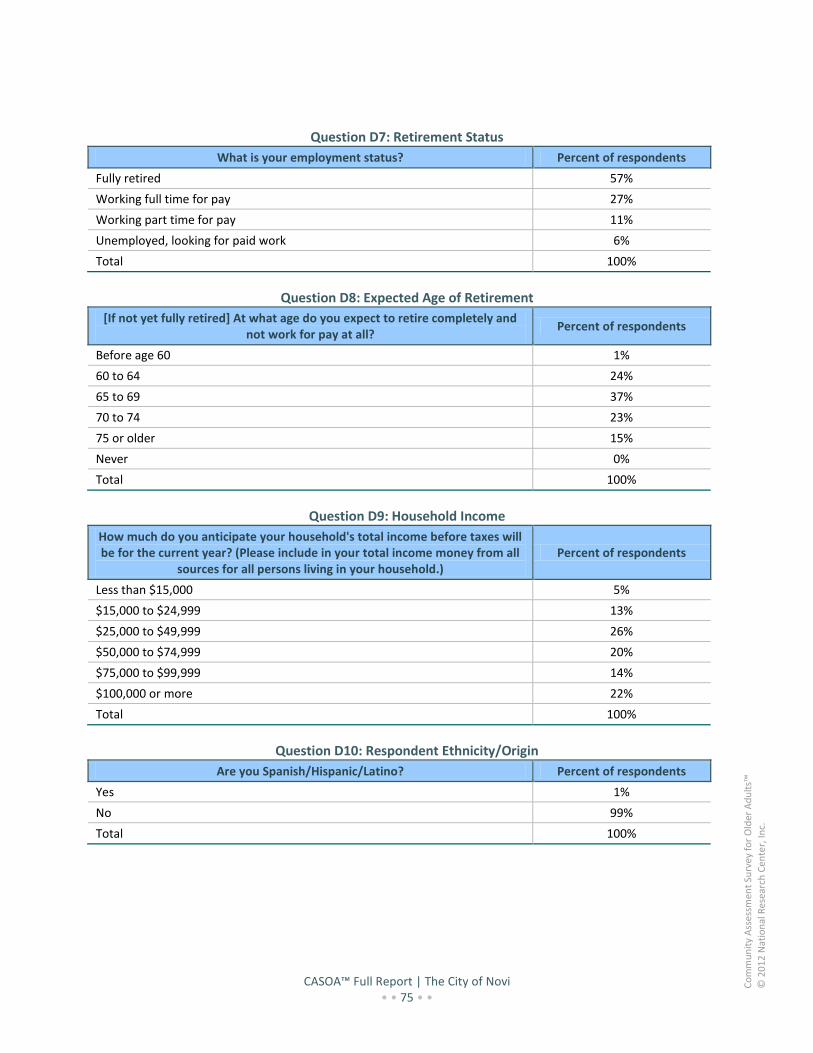
CASOA™ Full Report | The City of Novi • • 75 • •
Co
mm
un
ity
Ass
essm
ent
Surv
ey f
or
Old
er A
du
lts™
© 2
01
2 N
atio
nal
Res
earc
h C
ente
r, In
c.
Question D7: Retirement Status
What is your employment status? Percent of respondents
Fully retired 57%
Working full time for pay 27%
Working part time for pay 11%
Unemployed, looking for paid work 6%
Total 100%
Question D8: Expected Age of Retirement
[If not yet fully retired] At what age do you expect to retire completely and not work for pay at all?
Percent of respondents
Before age 60 1%
60 to 64 24%
65 to 69 37%
70 to 74 23%
75 or older 15%
Never 0%
Total 100%
Question D9: Household Income
How much do you anticipate your household's total income before taxes will be for the current year? (Please include in your total income money from all
sources for all persons living in your household.) Percent of respondents
Less than $15,000 5%
$15,000 to $24,999 13%
$25,000 to $49,999 26%
$50,000 to $74,999 20%
$75,000 to $99,999 14%
$100,000 or more 22%
Total 100%
Question D10: Respondent Ethnicity/Origin
Are you Spanish/Hispanic/Latino? Percent of respondents
Yes 1%
No 99%
Total 100%

CASOA™ Full Report | The City of Novi • • 76 • •
Co
mm
un
ity
Ass
essm
ent
Surv
ey f
or
Old
er A
du
lts™
© 2
01
2 N
atio
nal
Res
earc
h C
ente
r, In
c.
Question D11: Respondent Race
What is your race? Percent of respondents
American Indian or Alaskan Native 1%
Asian or Pacific Islander 3%
Black, African American 4%
White/Caucasian 92%
Other 1%
Total may exceed 100% as respondents could select more than one option.
Question D12: Respondent Age
In which category is your age? Percent of respondents
55-59 years 27%
60-64 years 17%
65-69 years 13%
70-74 years 14%
75-79 years 7%
80-84 years 11%
85-89 years 9%
90-94 years 2%
Total 100%
Question D13: Respondent Gender
What is your sex? Percent of respondents
Female 57%
Male 43%
Total 100%
Question D14: Respondent Sexual Orientation
What is your sexual orientation? Percent of respondents
Heterosexual 98%
Lesbian 0%
Gay 0%
Bi-sexual 1%
Total 100%

CASOA™ Full Report | The City of Novi • • 77 • •
Co
mm
un
ity
Ass
essm
ent
Surv
ey f
or
Old
er A
du
lts™
© 2
01
2 N
atio
nal
Res
earc
h C
ente
r, In
c.
Question D15: Voter Registration Status
Are you registered to vote in your jurisdiction? Percent of respondents
Yes 94%
No 5%
Ineligible to vote 1%
Total 100%
Question D16: Voted in Last General Election
Many people don't have time to vote in elections. Did you vote in the last general election?
Percent of respondents
Yes 89%
No 9%
Ineligible to vote 3%
Total 100%
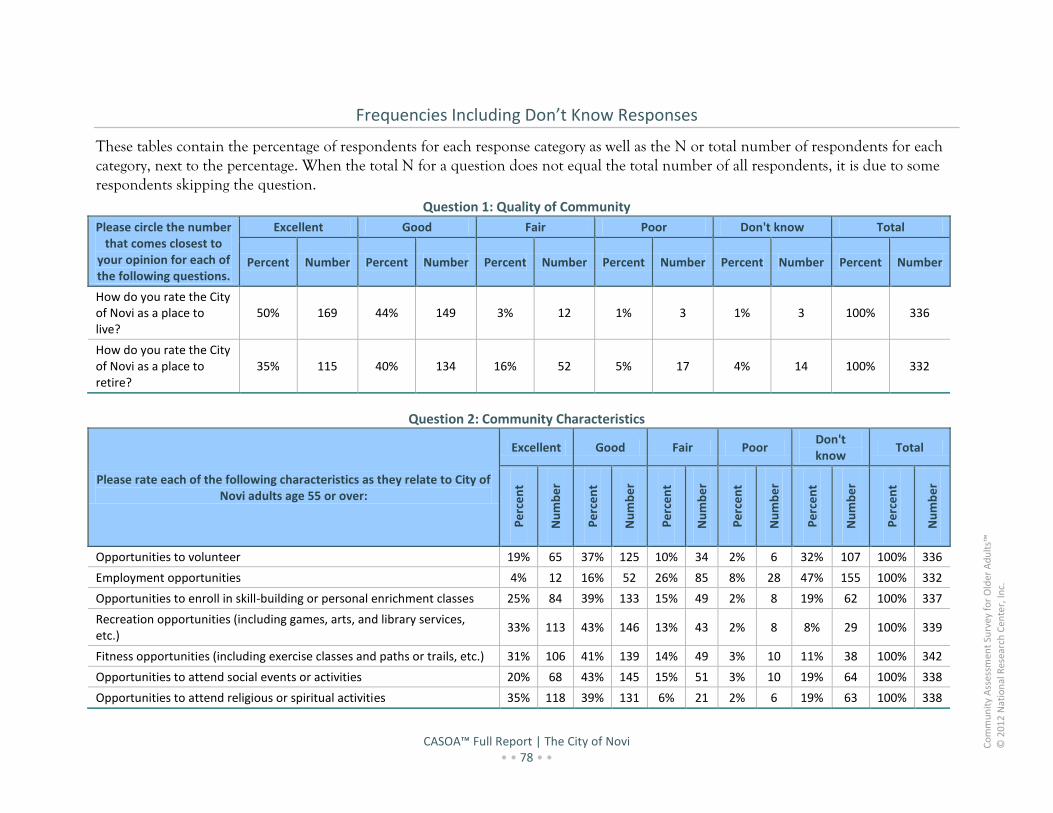
CASOA™ Full Report | The City of Novi • • 78 • •
Co
mm
un
ity
Ass
essm
ent
Surv
ey f
or
Old
er A
du
lts™
© 2
01
2 N
atio
nal
Res
earc
h C
ente
r, In
c.
Frequencies Including Don’t Know Responses
These tables contain the percentage of respondents for each response category as well as the N or total number of respondents for each category, next to the percentage. When the total N for a question does not equal the total number of all respondents, it is due to some respondents skipping the question.
Question 1: Quality of Community
Please circle the number that comes closest to
your opinion for each of the following questions.
Excellent Good Fair Poor Don't know Total
Percent Number Percent Number Percent Number Percent Number Percent Number Percent Number
How do you rate the City of Novi as a place to live?
50% 169 44% 149 3% 12 1% 3 1% 3 100% 336
How do you rate the City of Novi as a place to retire?
35% 115 40% 134 16% 52 5% 17 4% 14 100% 332
Question 2: Community Characteristics
Please rate each of the following characteristics as they relate to City of Novi adults age 55 or over:
Excellent Good Fair Poor Don't know
Total
Pe
rce
nt
Nu
mb
er
Pe
rce
nt
Nu
mb
er
Pe
rce
nt
Nu
mb
er
Pe
rce
nt
Nu
mb
er
Pe
rce
nt
Nu
mb
er
Pe
rce
nt
Nu
mb
er
Opportunities to volunteer 19% 65 37% 125 10% 34 2% 6 32% 107 100% 336
Employment opportunities 4% 12 16% 52 26% 85 8% 28 47% 155 100% 332
Opportunities to enroll in skill-building or personal enrichment classes 25% 84 39% 133 15% 49 2% 8 19% 62 100% 337
Recreation opportunities (including games, arts, and library services, etc.)
33% 113 43% 146 13% 43 2% 8 8% 29 100% 339
Fitness opportunities (including exercise classes and paths or trails, etc.) 31% 106 41% 139 14% 49 3% 10 11% 38 100% 342
Opportunities to attend social events or activities 20% 68 43% 145 15% 51 3% 10 19% 64 100% 338
Opportunities to attend religious or spiritual activities 35% 118 39% 131 6% 21 2% 6 19% 63 100% 338

CASOA™ Full Report | The City of Novi • • 79 • •
Co
mm
un
ity
Ass
essm
ent
Surv
ey f
or
Old
er A
du
lts™
© 2
01
2 N
atio
nal
Res
earc
h C
ente
r, In
c.
Please rate each of the following characteristics as they relate to City of Novi adults age 55 or over:
Excellent Good Fair Poor Don't know
Total
Pe
rce
nt
Nu
mb
er
Pe
rce
nt
Nu
mb
er
Pe
rce
nt
Nu
mb
er
Pe
rce
nt
Nu
mb
er
Pe
rce
nt
Nu
mb
er
Pe
rce
nt
Nu
mb
er
Opportunities to attend or participate in meetings about local government or community matters
21% 72 37% 124 19% 63 2% 8 22% 73 100% 340
Availability of affordable quality housing 14% 45 26% 87 26% 87 13% 44 21% 71 100% 335
Variety of housing options 17% 57 30% 100 20% 67 9% 29 24% 82 100% 335
Availability of long-term care options 8% 26 20% 69 17% 56 7% 24 48% 164 100% 339
Availability of daytime care options for older adults 5% 16 15% 49 12% 40 7% 25 61% 205 100% 335
Availability of information about resources for older adults 15% 49 35% 117 15% 50 5% 17 31% 104 100% 338
Availability of financial or legal planning services 11% 36 26% 89 13% 42 4% 15 46% 156 100% 336
Availability of affordable quality physical health care 23% 79 29% 98 15% 50 5% 17 28% 97 100% 341
Availability of affordable quality mental health care 7% 23 16% 55 12% 41 6% 19 59% 198 100% 335
Availability of preventive health services (e.g., health screenings, flu shots, educational workshops)
24% 81 39% 131 14% 46 4% 12 19% 63 100% 334
Availability of affordable quality food 28% 94 39% 131 18% 61 6% 20 9% 31 100% 337
Sense of community 20% 64 39% 127 23% 74 7% 22 12% 40 100% 327
Openness and acceptance of the community towards older residents of diverse backgrounds
13% 45 40% 134 15% 52 5% 18 26% 88 100% 338
Ease of bus travel in Novi 3% 10 8% 27 11% 36 26% 85 53% 175 100% 334
Ease of rail or subway travel in Novi 1% 2 3% 11 4% 14 39% 127 53% 173 100% 328

CASOA™ Full Report | The City of Novi • • 80 • •
Co
mm
un
ity
Ass
essm
ent
Surv
ey f
or
Old
er A
du
lts™
© 2
01
2 N
atio
nal
Res
earc
h C
ente
r, In
c.
Question 3: Overall Service to Older Adults
How would you rate the overall services provided to older adults in Novi? Percent of respondents Number
Excellent 17% 58
Good 36% 123
Fair 17% 60
Poor 3% 9
Don't know 27% 91
Total 100% 341
Question 4: Level of Informedness about Services and Activities for Older Adults
In general, how informed or uninformed do you feel about services and activities available to older adults Novi?
Percent of respondents Number
Very informed 19% 63
Somewhat informed 50% 170
Somewhat uninformed 22% 74
Very uninformed 9% 32
Total 100% 339
Question 5: Quality of Life and Health
Please circle the number that comes closest to
your opinion for each of the following questions.
Excellent Good Fair Poor Don't know Total
Percent Number Percent Number Percent Number Percent Number Percent Number Percent Number
How do you rate your overall physical health?
22% 76 55% 187 20% 70 3% 11 0% 0 100% 343
How do you rate your overall mental health/emotional well being?
38% 131 51% 174 10% 34 0% 1 0% 1 100% 341
How do you rate your overall quality of life?
32% 109 56% 193 11% 37 1% 5 0% 0 100% 343
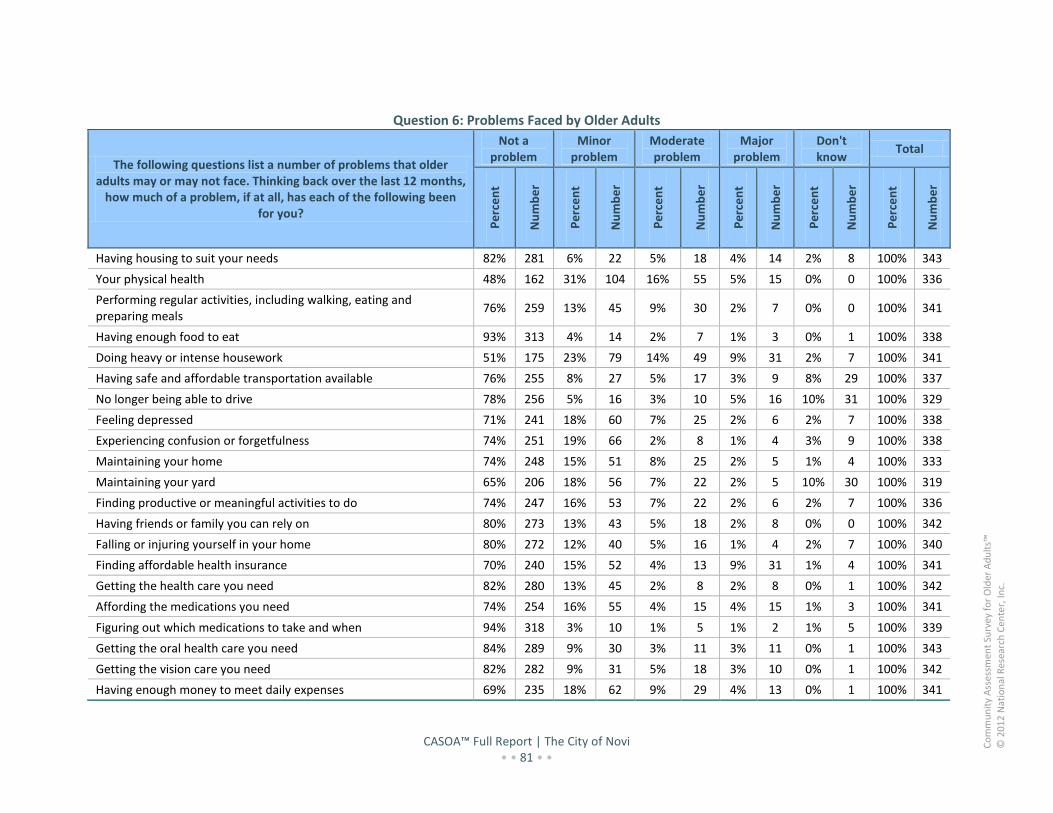
CASOA™ Full Report | The City of Novi • • 81 • •
Co
mm
un
ity
Ass
essm
ent
Surv
ey f
or
Old
er A
du
lts™
© 2
01
2 N
atio
nal
Res
earc
h C
ente
r, In
c.
Question 6: Problems Faced by Older Adults
The following questions list a number of problems that older adults may or may not face. Thinking back over the last 12 months,
how much of a problem, if at all, has each of the following been for you?
Not a problem
Minor problem
Moderate problem
Major problem
Don't know
Total
Pe
rce
nt
Nu
mb
er
Pe
rce
nt
Nu
mb
er
Pe
rce
nt
Nu
mb
er
Pe
rce
nt
Nu
mb
er
Pe
rce
nt
Nu
mb
er
Pe
rce
nt
Nu
mb
er
Having housing to suit your needs 82% 281 6% 22 5% 18 4% 14 2% 8 100% 343
Your physical health 48% 162 31% 104 16% 55 5% 15 0% 0 100% 336
Performing regular activities, including walking, eating and preparing meals
76% 259 13% 45 9% 30 2% 7 0% 0 100% 341
Having enough food to eat 93% 313 4% 14 2% 7 1% 3 0% 1 100% 338
Doing heavy or intense housework 51% 175 23% 79 14% 49 9% 31 2% 7 100% 341
Having safe and affordable transportation available 76% 255 8% 27 5% 17 3% 9 8% 29 100% 337
No longer being able to drive 78% 256 5% 16 3% 10 5% 16 10% 31 100% 329
Feeling depressed 71% 241 18% 60 7% 25 2% 6 2% 7 100% 338
Experiencing confusion or forgetfulness 74% 251 19% 66 2% 8 1% 4 3% 9 100% 338
Maintaining your home 74% 248 15% 51 8% 25 2% 5 1% 4 100% 333
Maintaining your yard 65% 206 18% 56 7% 22 2% 5 10% 30 100% 319
Finding productive or meaningful activities to do 74% 247 16% 53 7% 22 2% 6 2% 7 100% 336
Having friends or family you can rely on 80% 273 13% 43 5% 18 2% 8 0% 0 100% 342
Falling or injuring yourself in your home 80% 272 12% 40 5% 16 1% 4 2% 7 100% 340
Finding affordable health insurance 70% 240 15% 52 4% 13 9% 31 1% 4 100% 341
Getting the health care you need 82% 280 13% 45 2% 8 2% 8 0% 1 100% 342
Affording the medications you need 74% 254 16% 55 4% 15 4% 15 1% 3 100% 341
Figuring out which medications to take and when 94% 318 3% 10 1% 5 1% 2 1% 5 100% 339
Getting the oral health care you need 84% 289 9% 30 3% 11 3% 11 0% 1 100% 343
Getting the vision care you need 82% 282 9% 31 5% 18 3% 10 0% 1 100% 342
Having enough money to meet daily expenses 69% 235 18% 62 9% 29 4% 13 0% 1 100% 341

CASOA™ Full Report | The City of Novi • • 82 • •
Co
mm
un
ity
Ass
essm
ent
Surv
ey f
or
Old
er A
du
lts™
© 2
01
2 N
atio
nal
Res
earc
h C
ente
r, In
c.
The following questions list a number of problems that older adults may or may not face. Thinking back over the last 12 months,
how much of a problem, if at all, has each of the following been for you?
Not a problem
Minor problem
Moderate problem
Major problem
Don't know
Total
Pe
rce
nt
Nu
mb
er
Pe
rce
nt
Nu
mb
er
Pe
rce
nt
Nu
mb
er
Pe
rce
nt
Nu
mb
er
Pe
rce
nt
Nu
mb
er
Pe
rce
nt
Nu
mb
er
Having enough money to pay your property taxes 74% 234 9% 30 8% 26 4% 12 5% 17 100% 319
Staying physically fit 53% 182 27% 94 14% 49 5% 19 0% 1 100% 344
Maintaining a healthy diet 63% 218 24% 83 9% 32 3% 10 0% 1 100% 344
Having interesting recreational or cultural activities to attend 63% 213 15% 52 12% 42 3% 9 7% 22 100% 338
Having interesting social events or activities to attend 62% 209 17% 57 11% 36 4% 12 7% 24 100% 338
Feeling bored 61% 206 24% 82 10% 34 3% 10 2% 8 100% 341
Feeling like your voice is heard in the community 32% 106 16% 53 10% 33 5% 18 37% 124 100% 334
Finding meaningful volunteer work 49% 161 10% 34 6% 20 2% 8 32% 108 100% 332
Providing care for another person 51% 168 12% 38 8% 28 2% 7 27% 91 100% 332
Dealing with legal issues 63% 211 14% 46 6% 21 2% 7 15% 49 100% 335
Having adequate information or dealing with public programs such as Social Security, Medicare and Medicaid
54% 183 20% 68 9% 30 6% 19 12% 40 100% 341
Finding work in retirement 35% 113 6% 18 9% 31 7% 22 43% 139 100% 322
Building skills for paid or unpaid work 41% 133 8% 25 7% 23 1% 5 43% 141 100% 326
Not knowing what services are available to older adults in your community
38% 127 24% 79 15% 50 6% 21 17% 58 100% 335
Feeling lonely or isolated 75% 255 14% 49 7% 23 1% 5 2% 8 100% 339
Dealing with the loss of a close family member or friend 65% 220 15% 52 10% 34 4% 15 5% 18 100% 339
Being a victim of crime 78% 263 8% 26 3% 9 1% 4 10% 35 100% 337
Being a victim of fraud or a scam 78% 264 7% 22 4% 12 2% 6 10% 34 100% 338
Being physically or emotionally abused 89% 301 2% 5 1% 3 0% 1 8% 26 100% 337

CASOA™ Full Report | The City of Novi • • 83 • •
Co
mm
un
ity
Ass
essm
ent
Surv
ey f
or
Old
er A
du
lts™
© 2
01
2 N
atio
nal
Res
earc
h C
ente
r, In
c.
Question 7: Days Spent in Facilities
Thinking back over the past 12 months, how
many days did you spend in...
No days (zero) One to two days Three to five days Six or more days Don't know Total
Percent Number Percent Number Percent Number Percent Number Percent Number Percent Number
As a patient in a hospital?
79% 262 5% 17 8% 25 8% 26 0% 0 100% 329
In a long-term care facility (including nursing home or in-patient rehabilitation)?
97% 304 0% 0 0% 1 3% 10 0% 0 100% 314
Question 8: Falls in Last 12 Months
Thinking back over the past 12 months, how many times have you fallen and injured yourself? Was it… Percent of respondents Number
Never 77% 265
Once or twice 21% 72
3-5 times 1% 5
More than 5 times 1% 2
Don't know 0% 0
Total 100% 345
Question 9: Recommend Living in Community
How likely or unlikely are you to recommend living in Novi to older adults? Percent of respondents Number
Very likely 48% 167
Somewhat likely 30% 103
Somewhat unlikely 10% 35
Very unlikely 4% 14
Don't know 8% 26
Total 100% 344
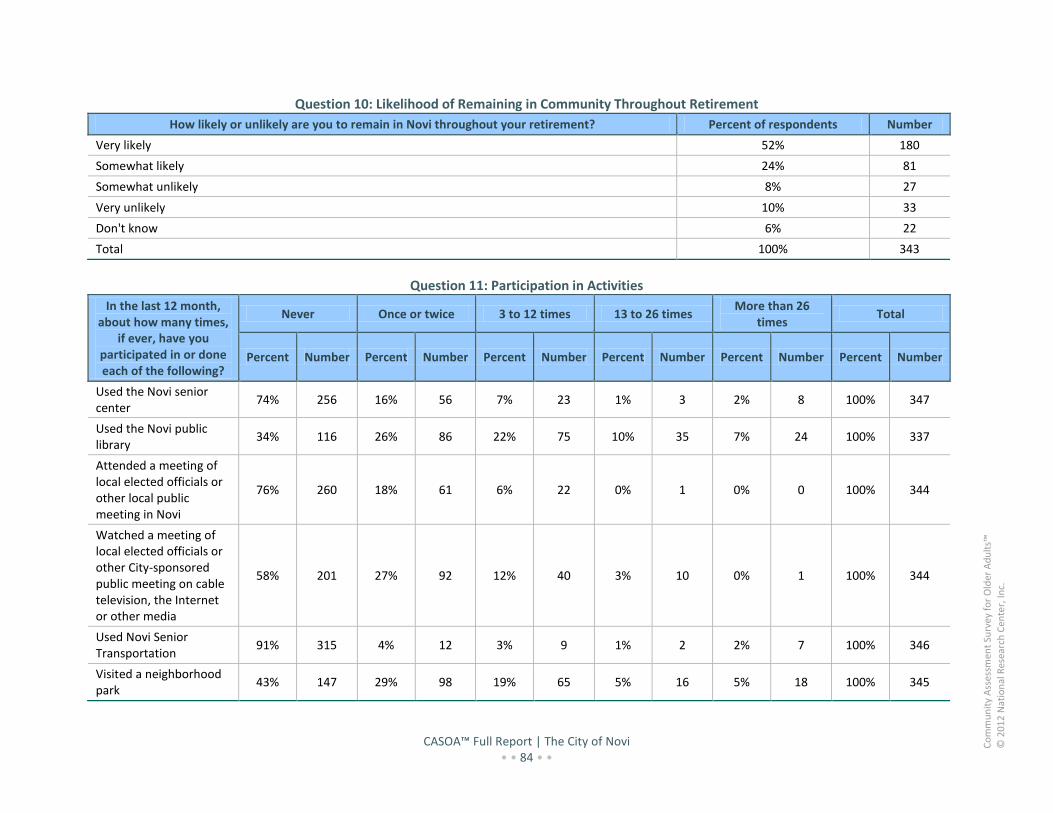
CASOA™ Full Report | The City of Novi • • 84 • •
Co
mm
un
ity
Ass
essm
ent
Surv
ey f
or
Old
er A
du
lts™
© 2
01
2 N
atio
nal
Res
earc
h C
ente
r, In
c.
Question 10: Likelihood of Remaining in Community Throughout Retirement
How likely or unlikely are you to remain in Novi throughout your retirement? Percent of respondents Number
Very likely 52% 180
Somewhat likely 24% 81
Somewhat unlikely 8% 27
Very unlikely 10% 33
Don't know 6% 22
Total 100% 343
Question 11: Participation in Activities
In the last 12 month, about how many times,
if ever, have you participated in or done each of the following?
Never Once or twice 3 to 12 times 13 to 26 times More than 26
times Total
Percent Number Percent Number Percent Number Percent Number Percent Number Percent Number
Used the Novi senior center
74% 256 16% 56 7% 23 1% 3 2% 8 100% 347
Used the Novi public library
34% 116 26% 86 22% 75 10% 35 7% 24 100% 337
Attended a meeting of local elected officials or other local public meeting in Novi
76% 260 18% 61 6% 22 0% 1 0% 0 100% 344
Watched a meeting of local elected officials or other City-sponsored public meeting on cable television, the Internet or other media
58% 201 27% 92 12% 40 3% 10 0% 1 100% 344
Used Novi Senior Transportation
91% 315 4% 12 3% 9 1% 2 2% 7 100% 346
Visited a neighborhood park
43% 147 29% 98 19% 65 5% 16 5% 18 100% 345
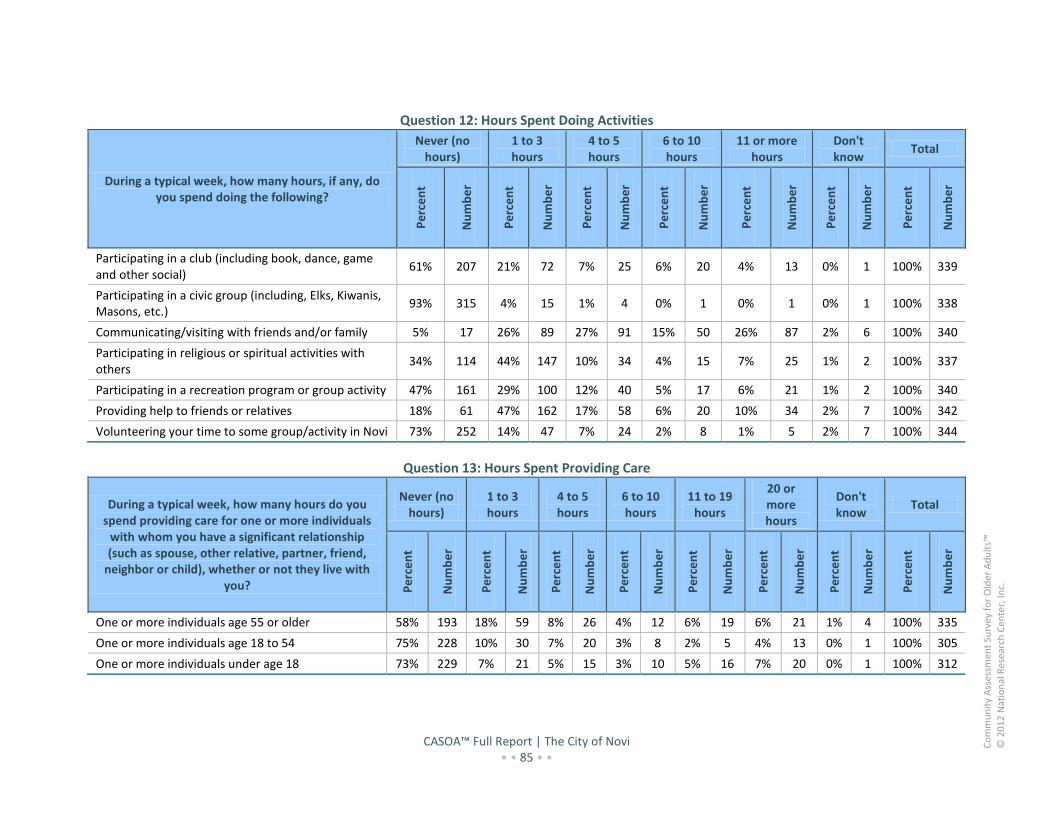
CASOA™ Full Report | The City of Novi • • 85 • •
Co
mm
un
ity
Ass
essm
ent
Surv
ey f
or
Old
er A
du
lts™
© 2
01
2 N
atio
nal
Res
earc
h C
ente
r, In
c.
Question 12: Hours Spent Doing Activities
During a typical week, how many hours, if any, do you spend doing the following?
Never (no hours)
1 to 3 hours
4 to 5 hours
6 to 10 hours
11 or more hours
Don't know
Total
Pe
rce
nt
Nu
mb
er
Pe
rce
nt
Nu
mb
er
Pe
rce
nt
Nu
mb
er
Pe
rce
nt
Nu
mb
er
Pe
rce
nt
Nu
mb
er
Pe
rce
nt
Nu
mb
er
Pe
rce
nt
Nu
mb
er
Participating in a club (including book, dance, game and other social)
61% 207 21% 72 7% 25 6% 20 4% 13 0% 1 100% 339
Participating in a civic group (including, Elks, Kiwanis, Masons, etc.)
93% 315 4% 15 1% 4 0% 1 0% 1 0% 1 100% 338
Communicating/visiting with friends and/or family 5% 17 26% 89 27% 91 15% 50 26% 87 2% 6 100% 340
Participating in religious or spiritual activities with others
34% 114 44% 147 10% 34 4% 15 7% 25 1% 2 100% 337
Participating in a recreation program or group activity 47% 161 29% 100 12% 40 5% 17 6% 21 1% 2 100% 340
Providing help to friends or relatives 18% 61 47% 162 17% 58 6% 20 10% 34 2% 7 100% 342
Volunteering your time to some group/activity in Novi 73% 252 14% 47 7% 24 2% 8 1% 5 2% 7 100% 344
Question 13: Hours Spent Providing Care
During a typical week, how many hours do you spend providing care for one or more individuals
with whom you have a significant relationship (such as spouse, other relative, partner, friend,
neighbor or child), whether or not they live with you?
Never (no hours)
1 to 3 hours
4 to 5 hours
6 to 10 hours
11 to 19 hours
20 or more hours
Don't know
Total
Pe
rce
nt
Nu
mb
er
Pe
rce
nt
Nu
mb
er
Pe
rce
nt
Nu
mb
er
Pe
rce
nt
Nu
mb
er
Pe
rce
nt
Nu
mb
er
Pe
rce
nt
Nu
mb
er
Pe
rce
nt
Nu
mb
er
Pe
rce
nt
Nu
mb
er
One or more individuals age 55 or older 58% 193 18% 59 8% 26 4% 12 6% 19 6% 21 1% 4 100% 335
One or more individuals age 18 to 54 75% 228 10% 30 7% 20 3% 8 2% 5 4% 13 0% 1 100% 305
One or more individuals under age 18 73% 229 7% 21 5% 15 3% 10 5% 16 7% 20 0% 1 100% 312
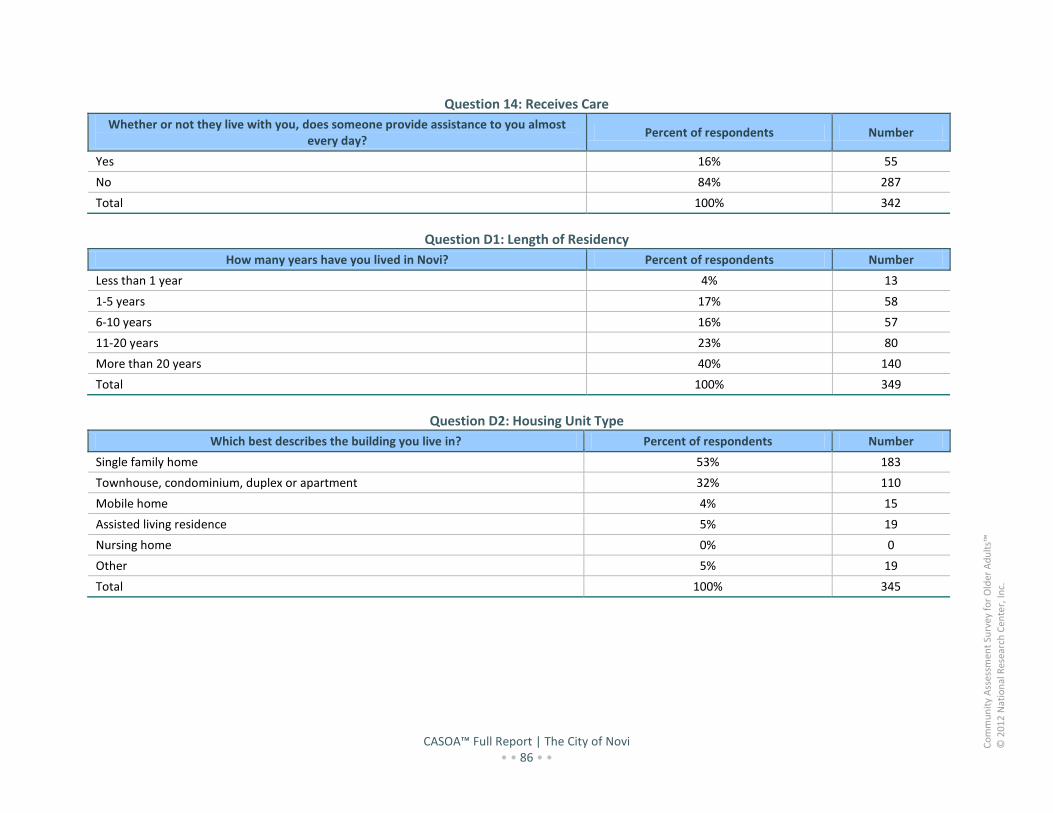
CASOA™ Full Report | The City of Novi • • 86 • •
Co
mm
un
ity
Ass
essm
ent
Surv
ey f
or
Old
er A
du
lts™
© 2
01
2 N
atio
nal
Res
earc
h C
ente
r, In
c.
Question 14: Receives Care
Whether or not they live with you, does someone provide assistance to you almost every day?
Percent of respondents Number
Yes 16% 55
No 84% 287
Total 100% 342
Question D1: Length of Residency
How many years have you lived in Novi? Percent of respondents Number
Less than 1 year 4% 13
1-5 years 17% 58
6-10 years 16% 57
11-20 years 23% 80
More than 20 years 40% 140
Total 100% 349
Question D2: Housing Unit Type
Which best describes the building you live in? Percent of respondents Number
Single family home 53% 183
Townhouse, condominium, duplex or apartment 32% 110
Mobile home 4% 15
Assisted living residence 5% 19
Nursing home 0% 0
Other 5% 19
Total 100% 345

CASOA™ Full Report | The City of Novi • • 87 • •
Co
mm
un
ity
Ass
essm
ent
Surv
ey f
or
Old
er A
du
lts™
© 2
01
2 N
atio
nal
Res
earc
h C
ente
r, In
c.
Question D3: Tenure (Rent or Own)
Do you currently rent or own your home? Percent of respondents Number
Rent 32% 108
Own (with a mortgage payment) 37% 122
Own (free and clear; no mortgage) 31% 103
Total 100% 333
Question D4: Monthly Housing Costs
About how much is your monthly housing cost for the place you live (including rent, mortgage payment, property tax, property insurance and homeowners' association
(HOA) fees)? Percent of respondents Number
Less than $300 per month 2% 8
$300 to $599 per month 17% 53
$600 to $999 per month 26% 84
$1,000 to $1,499 per month 23% 72
$1,500 to $2,499 per month 18% 58
$2,500 or more per month 13% 42
Total 100% 317
Question D5: Total Number of Household Members
How many people, including yourself, live in your household? Percent of respondents Number
1 person (live alone) 37% 127
2 people 43% 147
3 people 16% 54
4 or more people 4% 13
Don't know 0% 0
Total 100% 341
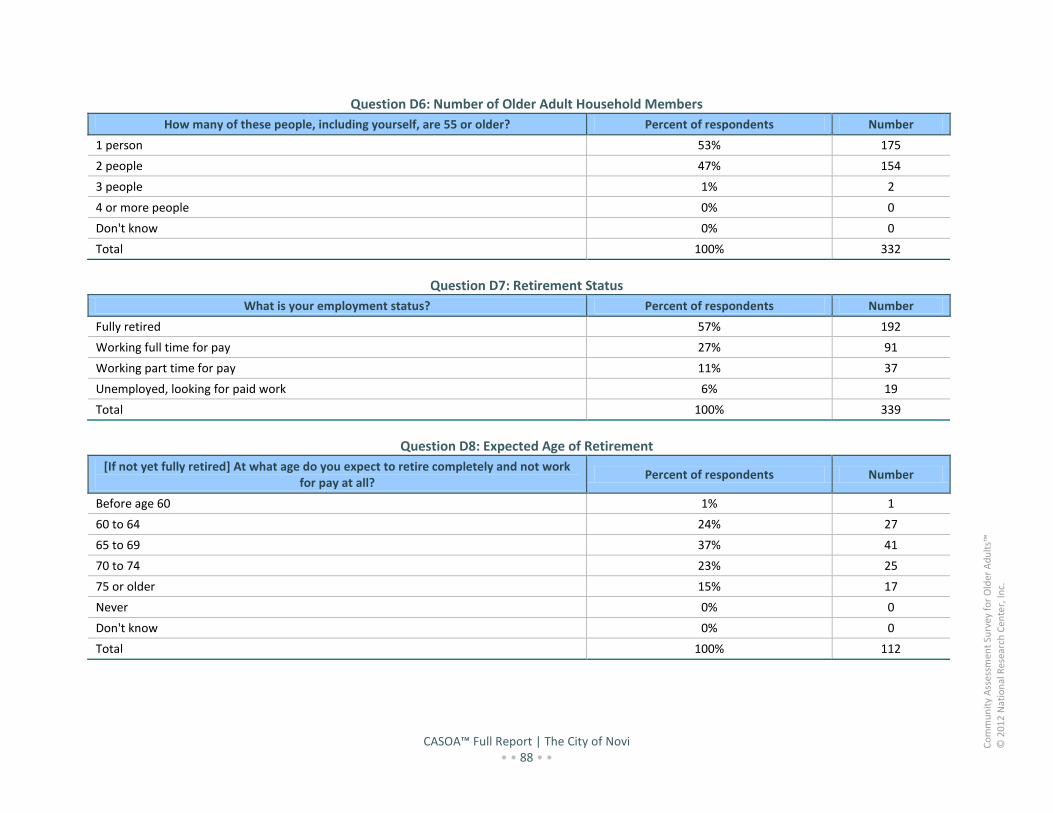
CASOA™ Full Report | The City of Novi • • 88 • •
Co
mm
un
ity
Ass
essm
ent
Surv
ey f
or
Old
er A
du
lts™
© 2
01
2 N
atio
nal
Res
earc
h C
ente
r, In
c.
Question D6: Number of Older Adult Household Members
How many of these people, including yourself, are 55 or older? Percent of respondents Number
1 person 53% 175
2 people 47% 154
3 people 1% 2
4 or more people 0% 0
Don't know 0% 0
Total 100% 332
Question D7: Retirement Status
What is your employment status? Percent of respondents Number
Fully retired 57% 192
Working full time for pay 27% 91
Working part time for pay 11% 37
Unemployed, looking for paid work 6% 19
Total 100% 339
Question D8: Expected Age of Retirement
[If not yet fully retired] At what age do you expect to retire completely and not work for pay at all?
Percent of respondents Number
Before age 60 1% 1
60 to 64 24% 27
65 to 69 37% 41
70 to 74 23% 25
75 or older 15% 17
Never 0% 0
Don't know 0% 0
Total 100% 112

CASOA™ Full Report | The City of Novi • • 89 • •
Co
mm
un
ity
Ass
essm
ent
Surv
ey f
or
Old
er A
du
lts™
© 2
01
2 N
atio
nal
Res
earc
h C
ente
r, In
c.
Question D9: Household Income
How much do you anticipate your household's total income before taxes will be for the current year? (Please include in your total income money from all sources for all
persons living in your household.) Percent of respondents Number
Less than $15,000 5% 15
$15,000 to $24,999 13% 38
$25,000 to $49,999 26% 78
$50,000 to $74,999 20% 60
$75,000 to $99,999 14% 44
$100,000 or more 22% 68
Total 100% 303
Question D10: Respondent Ethnicity/Origin
Are you Spanish/Hispanic/Latino? Percent of respondents Number
Yes 1% 4
No 99% 331
Total 100% 335
Question D11: Respondent Race
What is your race? Percent of respondents Number
American Indian or Alaskan Native 1% 3
Asian or Pacific Islander 3% 10
Black, African American 4% 13
White/Caucasian 92% 317
Other 1% 3
Total may exceed 100% as respondents could select more than one option.

CASOA™ Full Report | The City of Novi • • 90 • •
Co
mm
un
ity
Ass
essm
ent
Surv
ey f
or
Old
er A
du
lts™
© 2
01
2 N
atio
nal
Res
earc
h C
ente
r, In
c.
Question D12: Respondent Age
In which category is your age? Percent of respondents Number
55-59 years 27% 92
60-64 years 17% 57
65-69 years 13% 45
70-74 years 13% 46
75-79 years 7% 25
80-84 years 11% 38
85-89 years 9% 30
90-94 years 2% 8
95 years or older 1% 3
Total 100% 343
Question D13: Respondent Gender
What is your sex? Percent of respondents Number
Female 57% 196
Male 43% 150
Total 100% 346
Question D14: Respondent Sexual Orientation
What is your sexual orientation? Percent of respondents Number
Heterosexual 98% 313
Lesbian 0% 0
Gay 0% 1
Bi-sexual 1% 4
Total 100% 317

CASOA™ Full Report | The City of Novi • • 91 • •
Co
mm
un
ity
Ass
essm
ent
Surv
ey f
or
Old
er A
du
lts™
© 2
01
2 N
atio
nal
Res
earc
h C
ente
r, In
c.
Question D15: Voter Registration Status
Are you registered to vote in your jurisdiction? Percent of respondents Number
Yes 93% 323
No 5% 18
Ineligible to vote 1% 2
Don't know 1% 4
Total 100% 348
Question D16: Voted in Last General Election
Many people don't have time to vote in elections. Did you vote in the last general election?
Percent of respondents Number
Yes 88% 305
No 9% 30
Ineligible to vote 3% 9
Don't know 1% 3
Total 100% 348
CASOA™ Full Report | The City of Novi • • 92 • •
Co
mm
un
ity
Ass
essm
ent
Surv
ey f
or
Old
er A
du
lts™
© 2
01
2 N
atio
nal
Res
earc
h C
ente
r, In
c.
A p p e n d i x C : S u r v e y M e t h o d o l o g y
Data Collection Methods Used in the CASOA™
The CASOATM instrument and its administration are standardized to assure high quality survey methods and comparable results across CASOATM communities. The CASOATM was customized for Novi to reflect the correct local age definition of older adults and so that the mailing materials used official Novi graphics, contact information and signatures.
Survey Development
The CASOATM questionnaire contains many questions related to the life of older residents in the community. The instrument includes questions related to overall quality of life, characteristics of the community, perceptions of safety in the community and of 40 different needs common to older adults.
The questionnaire grew from a synthesis of a number of data collection processes including a national search of needs assessments conducted by communities across the United States, a review of the literature on aging and the conduct of numerous surveys and large scale needs assessments by NRC. A blue-ribbon panel of national experts contributed to the concept and content of the CASOATM.
The items in the questionnaire were pilot tested on senior residents using a “think-aloud” method in which older adults were asked to complete the survey and describe their thought processes related to specific questions and question sets. The results of the pilot test were used to alter the questionnaire for better understanding by senior participants. The final questionnaire was tested in a set of diverse U.S. communities and modifications again were made as necessary.
Survey Sampling
“Sampling” refers to the method by which survey recipients are chosen. The “sample” refers to all those who were given a chance to participate in the survey. A sample of residents in the area 60 years of age and older was used. Although the purchased list of known senior households contained names of the residents 55 years and older, no name was printed on the survey envelope; instead, the survey was addressed to “Resident.” The list of households was compiled from a variety of public sources.
In order to select a random individual 55 years of age and older within the household, the cover letter requested that the questionnaire be given to the person 55 years of age and older who most recently celebrated their birthday (regardless of year of birth) to complete. This “birthday method” is a respondent selection method which helps to randomly select an individual within a household. It is similar to other more complex methodologies (e.g., “Kisch” or “Trodahl”), but easier to implement.
Survey Administration
Each sampled household received three mailings beginning in January 2012. Completed surveys were collected over the following six weeks. The first mailing was a prenotification postcard announcing the upcoming survey. A week after the prenotification postcard mailed the first wave of the survey was sent. The second wave was mailed one week after the first. The survey mailings
CASOA™ Full Report | The City of Novi • • 93 • •
Co
mm
un
ity
Ass
essm
ent
Surv
ey f
or
Old
er A
du
lts™
© 2
01
2 N
atio
nal
Res
earc
h C
ente
r, In
c.
contained a letter from Mayor Gatt inviting the household to participate in the CASOA, a questionnaire and postage-paid envelope in which to return the questionnaire.
Survey Response Rate and Confidence Intervals
Thirty-seven of the 1,000 postcards were returned as undeliverable because they either had addresses that were undeliverable as addressed or were received by vacant housing units. Of the 963 households receiving the survey mailings, 349 completed the survey, providing a response rate of 36%.
It is customary to describe the precision of estimates made from surveys by a “level of confidence” and accompanying “confidence interval” (or margin of error). A traditional level of confidence, and the one used here, is 95%. The 95% confidence interval can be any size and quantifies the sampling error or imprecision of the survey results because some residents’ opinions are relied on to estimate all residents’ opinions.
A 95% confidence interval indicates that for every 100 random samples of this many residents, 95 of the confidence intervals created will include the “true” population response. This theory is applied in practice to mean that the “true” perspective of the target population lies within the confidence interval created for a single survey. For example, if 75% of residents rate a service as “excellent” or “good,” then a 4% margin of error (for the 95% confidence interval) indicates that the range of likely responses for the entire community is between 71% and 79%. This source of error is called sampling error. In addition to sampling error, other sources of error may affect any survey, including the non-response of residents with opinions different from survey responders.
For subgroups of responses, the margin of error increases because the sample size for the subgroup is smaller. For subgroups of approximately 100 respondents, the margin of error is plus or minus 10 percentage points.
The practical difficulties of conducting any resident survey may introduce other sources of error in addition to sampling error. Despite our best efforts to boost participation and ensure potential inclusion of all older adults, some selected households will decline participation in the survey (potentially introducing non-response error) and some eligible households may be unintentionally excluded from the listed sources for the sample (referred to as coverage error).
Survey Processing (Data Entry)
Completed surveys received were assigned a unique identification number. Additionally, each survey was reviewed and “cleaned” as necessary. For example, a question may have asked a respondent to pick one response, but the respondent checked two; the cleaning process would involve randomly selecting one of the two selected responses to be recorded in the dataset.
Once all surveys were assigned a unique identification number, they were entered into an electronic dataset. This dataset was subject to a data entry protocol of “key and verify,” in which survey data were entered twice into an electronic dataset and then compared. Discrepancies were evaluated against the original survey form and corrected. “Range checks” (examination of the data for invalid values) as well as other forms of quality control were also performed.

CASOA™ Full Report | The City of Novi • • 94 • •
Co
mm
un
ity
Ass
essm
ent
Surv
ey f
or
Old
er A
du
lts™
© 2
01
2 N
atio
nal
Res
earc
h C
ente
r, In
c.
Survey Data Weighting
The demographic characteristics of those completing the survey were compared to those found in the 2010 Census estimates for residents age 55 and older living in Novi. Sample results were weighted using the population norms to reflect the appropriate percent of those residents. Other discrepancies between the whole population and the sample also were aided by the weighting due to the intercorrelation of many socioeconomic characteristics.
The variables used for weighting were sex, age, housing tenure (rent/own) and housing unit type. This decision was based on the disparity between the survey respondent characteristics, the population norms for these variables and the saliency of these variables in detecting differences of opinion among subgroups.
The primary objective of weighting survey data is to make the survey sample reflective of the larger older adult population of the community. This is done by: 1) reviewing the sample demographics and comparing them to the population norms from the most recent Census or other sources and 2) comparing the responses to different questions for demographic subgroups. The demographic characteristics that are least similar to the Census and yield the most different results are the best candidates for data weighting.
A special software program using mathematical algorithms is used to calculate the appropriate weights. Data weighting can adjust multiple demographic variables. Several different weighting “schemes” may be tested to ensure the best fit for the data.
The results of the weighting schemes for the City of Novi are presented in the following table.

CASOA™ Full Report | The City of Novi • • 95 • •
Co
mm
un
ity
Ass
essm
ent
Surv
ey f
or
Old
er A
du
lts™
© 2
01
2 N
atio
nal
Res
earc
h C
ente
r, In
c.
Figure 83: Weighting Scheme for the 2012 City of Novi CASOA™
U.S. Census Norm Unweighted Weighted
Sex and Age
55-59 28% 16% 27%
60-74 45% 41% 43%
75-84 17% 24% 18%
85+ 10% 19% 12%
Female 55% 64% 57%
Male 45% 36% 43%
Female 55-59 14% 10% 14%
Female 60-74 24% 24% 23%
Female 75-84 11% 17% 12%
Female 85+ 7% 14% 9%
Male 55-59 14% 6% 13%
Male 60-74 21% 17% 20%
Male 75-84 6% 7% 6%
Male 85+ 3% 6% 3%
Housing Characteristics
Rent 32% 34% 32%
Own 68% 66% 68%
Detached 60% 41% 57%
Attached 40% 59% 43% 1Source: U.S. Census Bureau - Census 2010

CASOA™ Full Report | The City of Novi • • 96 • •
Co
mm
un
ity
Ass
essm
ent
Surv
ey f
or
Old
er A
du
lts™
© 2
01
2 N
atio
nal
Res
earc
h C
ente
r, In
c.
Survey Data Analysis and Reporting
The survey dataset was analyzed using the Statistical Package for the Social Sciences (SPSS). For the most part, frequency distributions and mean ratings are presented in the body of the report. A complete set of frequencies for each survey question is presented in Appendix B: Complete Set of Survey Frequencies.
A variety of analyses were presented in the body of the report. The following sections summarize how these analyses were conducted or scores calculated.
Estimates of the Contribution of Older Adults to the Economy
The calculations of the economic contributions of older adults in Novi were rough estimates using data from the U.S. Department of Labor Bureau of Labor Statistics (Metropolitan and Nonmetropolitan Area Occupational Employment and Wage Estimates).
The proportion of older adults who work was estimated by examining the responses to question D7 from the survey (“What is your employment status?”). Those working full-time were assumed to work 32 hours per week and those working part-time were assumed to work 15 hours per week. The proportion of survey respondents was multiplied by the number of adults 60 and over in the community to ascertain the number of employed older adults. To determine the average paid wage, information from the Bureau of Labor Statistics for the Detroit-Warren-Livonia, MI MSA was examined. Working full-time and part-time was assumed to be the equivalent of “All Occupations” (occupation code 00-0000).
The proportion of older adults doing volunteer work and providing help to friends and neighbors was determined by looking at the responses to question 14 (“During a typical week, how many hours, if any, do you spend doing the following?”), items f (“providing help to family and friends”) and g (“volunteering your time to some group/activity”). Those responding “1 to 3 hours” were assumed to spend two hours, “4 to 5 hours” were assumed to spend 4.5 hours, those responding “6 to 10 hours” were assumed to spend eight hours, and those responding “11 or more hours” were assumed to spend 13.75 hours (125% of 11). To determine the average hourly wage, “providing help to family and friends” was assumed to be the equivalent of “Personal Care and Service Workers, All Other” (occupation code 39-9099) and volunteering was assumed to be the equivalent of “Office Clerks, General” (occupation code 43-9061).
The proportion of older adults providing care to family and friends was determined by examining the responses to question 16. Those responding “1 to 3 hours” were assumed to spend two hours, “4 to 5 hours” were assumed to spend 4.5 hours, those responding “6 to 10 hours” were assumed to spend eight hours, and those responding “11 to 19 hours” were assumed to spend 15 hours, and those responding “20 or more hours” were assumed to spend 25 hours (125% of 20). To determine the average hourly wage, “providing care for older adults and adults” (items a and b) were assumed to be the equivalent of “Personal and Home Care Aides” (occupation code 39-9021) and “providing care for children” (item c) was assumed to be the equivalent of “Child Care Workers” (occupation code 39-9011).
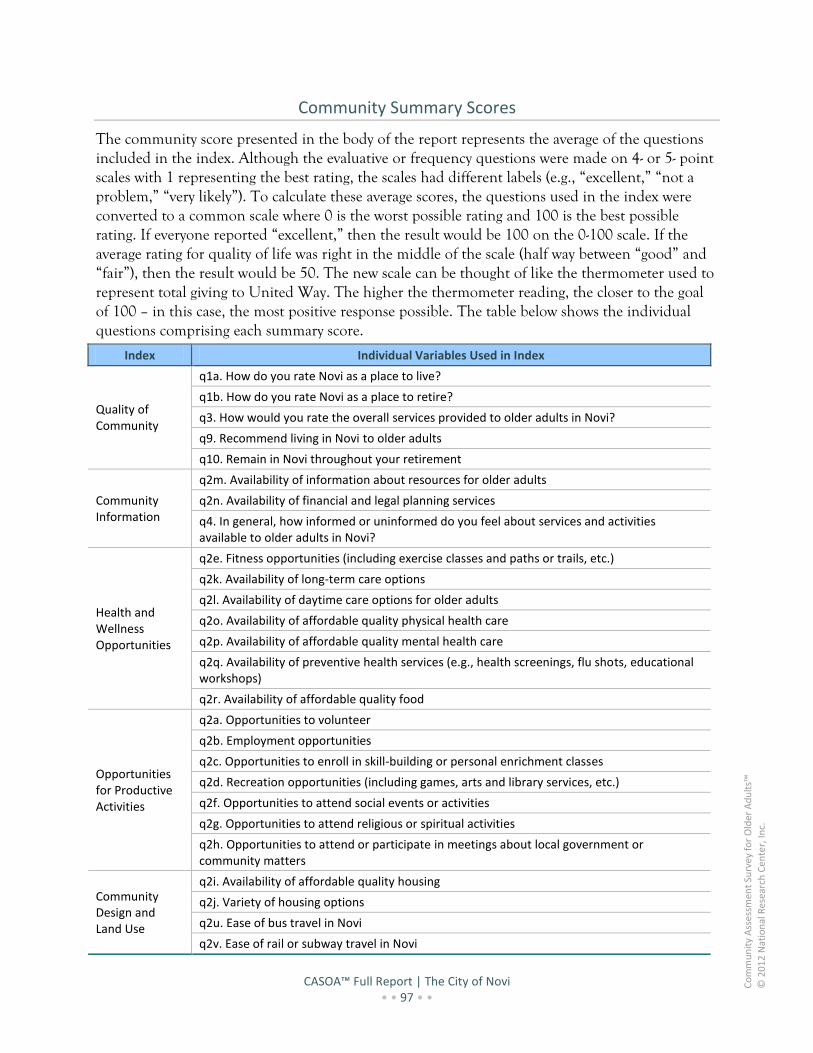
CASOA™ Full Report | The City of Novi • • 97 • •
Co
mm
un
ity
Ass
essm
ent
Surv
ey f
or
Old
er A
du
lts™
© 2
01
2 N
atio
nal
Res
earc
h C
ente
r, In
c.
Community Summary Scores
The community score presented in the body of the report represents the average of the questions included in the index. Although the evaluative or frequency questions were made on 4- or 5- point scales with 1 representing the best rating, the scales had different labels (e.g., “excellent,” “not a problem,” “very likely”). To calculate these average scores, the questions used in the index were converted to a common scale where 0 is the worst possible rating and 100 is the best possible rating. If everyone reported “excellent,” then the result would be 100 on the 0-100 scale. If the average rating for quality of life was right in the middle of the scale (half way between “good” and “fair”), then the result would be 50. The new scale can be thought of like the thermometer used to represent total giving to United Way. The higher the thermometer reading, the closer to the goal of 100 – in this case, the most positive response possible. The table below shows the individual questions comprising each summary score.
Index Individual Variables Used in Index
Quality of Community
q1a. How do you rate Novi as a place to live?
q1b. How do you rate Novi as a place to retire?
q3. How would you rate the overall services provided to older adults in Novi?
q9. Recommend living in Novi to older adults
q10. Remain in Novi throughout your retirement
Community Information
q2m. Availability of information about resources for older adults
q2n. Availability of financial and legal planning services
q4. In general, how informed or uninformed do you feel about services and activities available to older adults in Novi?
Health and Wellness Opportunities
q2e. Fitness opportunities (including exercise classes and paths or trails, etc.)
q2k. Availability of long-term care options
q2l. Availability of daytime care options for older adults
q2o. Availability of affordable quality physical health care
q2p. Availability of affordable quality mental health care
q2q. Availability of preventive health services (e.g., health screenings, flu shots, educational workshops)
q2r. Availability of affordable quality food
Opportunities for Productive Activities
q2a. Opportunities to volunteer
q2b. Employment opportunities
q2c. Opportunities to enroll in skill-building or personal enrichment classes
q2d. Recreation opportunities (including games, arts and library services, etc.)
q2f. Opportunities to attend social events or activities
q2g. Opportunities to attend religious or spiritual activities
q2h. Opportunities to attend or participate in meetings about local government or community matters
Community Design and Land Use
q2i. Availability of affordable quality housing
q2j. Variety of housing options
q2u. Ease of bus travel in Novi
q2v. Ease of rail or subway travel in Novi
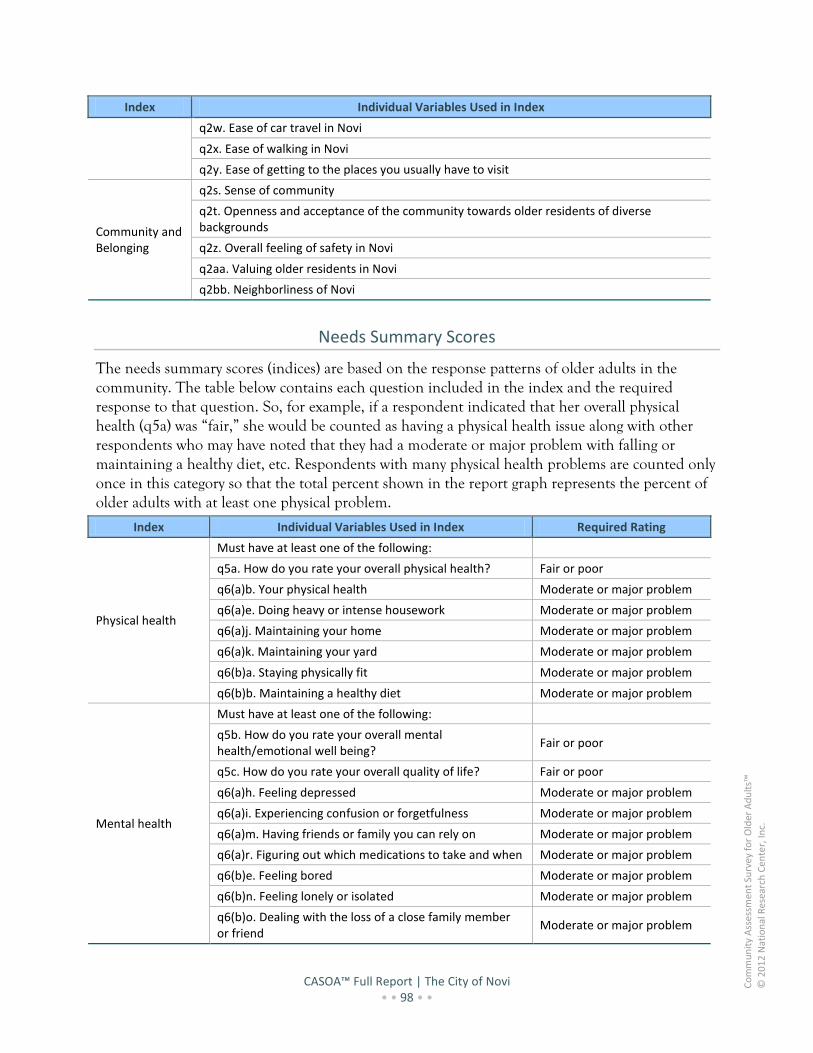
CASOA™ Full Report | The City of Novi • • 98 • •
Co
mm
un
ity
Ass
essm
ent
Surv
ey f
or
Old
er A
du
lts™
© 2
01
2 N
atio
nal
Res
earc
h C
ente
r, In
c.
Index Individual Variables Used in Index
q2w. Ease of car travel in Novi
q2x. Ease of walking in Novi
q2y. Ease of getting to the places you usually have to visit
Community and Belonging
q2s. Sense of community
q2t. Openness and acceptance of the community towards older residents of diverse backgrounds
q2z. Overall feeling of safety in Novi
q2aa. Valuing older residents in Novi
q2bb. Neighborliness of Novi
Needs Summary Scores
The needs summary scores (indices) are based on the response patterns of older adults in the community. The table below contains each question included in the index and the required response to that question. So, for example, if a respondent indicated that her overall physical health (q5a) was “fair,” she would be counted as having a physical health issue along with other respondents who may have noted that they had a moderate or major problem with falling or maintaining a healthy diet, etc. Respondents with many physical health problems are counted only once in this category so that the total percent shown in the report graph represents the percent of older adults with at least one physical problem.
Index Individual Variables Used in Index Required Rating
Physical health
Must have at least one of the following:
q5a. How do you rate your overall physical health? Fair or poor
q6(a)b. Your physical health Moderate or major problem
q6(a)e. Doing heavy or intense housework Moderate or major problem
q6(a)j. Maintaining your home Moderate or major problem
q6(a)k. Maintaining your yard Moderate or major problem
q6(b)a. Staying physically fit Moderate or major problem
q6(b)b. Maintaining a healthy diet Moderate or major problem
Mental health
Must have at least one of the following:
q5b. How do you rate your overall mental health/emotional well being?
Fair or poor
q5c. How do you rate your overall quality of life? Fair or poor
q6(a)h. Feeling depressed Moderate or major problem
q6(a)i. Experiencing confusion or forgetfulness Moderate or major problem
q6(a)m. Having friends or family you can rely on Moderate or major problem
q6(a)r. Figuring out which medications to take and when Moderate or major problem
q6(b)e. Feeling bored Moderate or major problem
q6(b)n. Feeling lonely or isolated Moderate or major problem
q6(b)o. Dealing with the loss of a close family member or friend
Moderate or major problem
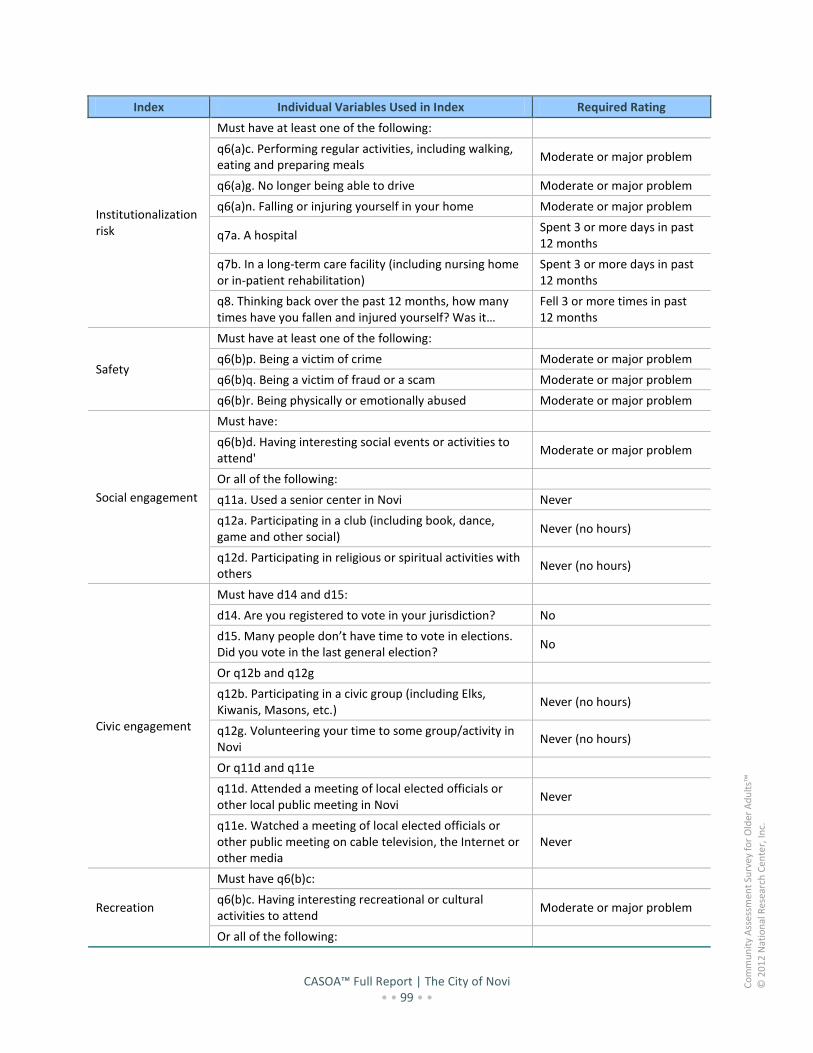
CASOA™ Full Report | The City of Novi • • 99 • •
Co
mm
un
ity
Ass
essm
ent
Surv
ey f
or
Old
er A
du
lts™
© 2
01
2 N
atio
nal
Res
earc
h C
ente
r, In
c.
Index Individual Variables Used in Index Required Rating
Institutionalization risk
Must have at least one of the following:
q6(a)c. Performing regular activities, including walking, eating and preparing meals
Moderate or major problem
q6(a)g. No longer being able to drive Moderate or major problem
q6(a)n. Falling or injuring yourself in your home Moderate or major problem
q7a. A hospital Spent 3 or more days in past 12 months
q7b. In a long-term care facility (including nursing home or in-patient rehabilitation)
Spent 3 or more days in past 12 months
q8. Thinking back over the past 12 months, how many times have you fallen and injured yourself? Was it…
Fell 3 or more times in past 12 months
Safety
Must have at least one of the following:
q6(b)p. Being a victim of crime Moderate or major problem
q6(b)q. Being a victim of fraud or a scam Moderate or major problem
q6(b)r. Being physically or emotionally abused Moderate or major problem
Social engagement
Must have:
q6(b)d. Having interesting social events or activities to attend'
Moderate or major problem
Or all of the following:
q11a. Used a senior center in Novi Never
q12a. Participating in a club (including book, dance, game and other social)
Never (no hours)
q12d. Participating in religious or spiritual activities with others
Never (no hours)
Civic engagement
Must have d14 and d15:
d14. Are you registered to vote in your jurisdiction? No
d15. Many people don’t have time to vote in elections. Did you vote in the last general election?
No
Or q12b and q12g
q12b. Participating in a civic group (including Elks, Kiwanis, Masons, etc.)
Never (no hours)
q12g. Volunteering your time to some group/activity in Novi
Never (no hours)
Or q11d and q11e
q11d. Attended a meeting of local elected officials or other local public meeting in Novi
Never
q11e. Watched a meeting of local elected officials or other public meeting on cable television, the Internet or other media
Never
Recreation
Must have q6(b)c:
q6(b)c. Having interesting recreational or cultural activities to attend
Moderate or major problem
Or all of the following:

CASOA™ Full Report | The City of Novi • • 100 • •
Co
mm
un
ity
Ass
essm
ent
Surv
ey f
or
Old
er A
du
lts™
© 2
01
2 N
atio
nal
Res
earc
h C
ente
r, In
c.
Index Individual Variables Used in Index Required Rating
q11c. Used a public library in Novi Never
q11g. Visited a neighborhood park Never
q12e. Participating in a recreation program or group activity
Never (no hours)
Financial and legal
Must have at least one of the following:
d9. How much do you anticipate your household’s total income before taxes will be for the current year? (Please include in your total income money from all sources for all persons living in your household.)/ d5. How many people, including yourself, live in your household?
Income was at or below the income limits set by HUD for Section 8 programs
q6(a)u. Having enough money to meet daily expenses Moderate or major problem
q6(a)v. Having enough money to pay your property taxes'
Moderate or major problem
q6(b)i. Dealing with legal issues Moderate or major problem
q6(b)k. Finding work in retirement Moderate or major problem
q6(b)l. Building skills for paid or unpaid work Moderate or major problem
q6(b)s. Dealing with financial planning issues Moderate or major problem
Caregiver burden Must have:
q6(b)cc. Providing care for another person Moderate or major problem
Basic necessities
Must have at least one of the following:
q6(a)a. Having housing to suit your needs Moderate or major problem
q6(a)d. Having enough food to eat Moderate or major problem
q6(a)f. Having safe and affordable transportation available
Moderate or major problem
Health care
Must have at least one of the following:
q6(a)o. Finding affordable health insurance Moderate or major problem
q6(a)p. Getting the health care you need Moderate or major problem
q6(a)q. Affording the medications you need Moderate or major problem
q6(a)s. Getting the oral health care you need Moderate or major problem
q6(a)t. Getting the vision care you need Moderate or major problem
q6(b)j. Having adequate information or dealing with public programs such as Social Security, Medicare and Medicaid
Moderate or major problem
Meaningful activities
Must have at least one of the following:
q6(a)l. Finding productive or meaningful activities to do Moderate or major problem
q6(b)f. Feeling like your voice is heard in the community Moderate or major problem
q6(b)g. Finding meaningful volunteer work Moderate or major problem
q6(b)m. Not knowing what services are available to older adults in your community
Moderate or major problem

CASOA™ Full Report | The City of Novi • • 101 • •
Co
mm
un
ity
Ass
essm
ent
Surv
ey f
or
Old
er A
du
lts™
© 2
01
2 N
atio
nal
Res
earc
h C
ente
r, In
c.
A p p e n d i x D : R e f e r e n c e s 1. U.S. Department of Health and Human Services. Choices for Independence: Modernizing the Older Americans Act: U.S.
Administration on Aging; March 9 2006. 2. Feldman E, Mishkovsky N, Kohler C. Active Living for Older Adults: Management Strategies for Healthy and Livable
Communities: International City/County Management Association; September 2003. 3. Wolff T. A practical approach to evaluation coalitions. In: Backer T, ed. Evaluation community collaborations. New
York, NY: Springer Publishing; 2002:95-165. 4. Namkee GC, Burr A, Mutchler JE, Caro FG. Formal and informal volunteer activity and spousal caregiving
among older adults. Research on Aging. 2007;29:99-124. 5. National Governor's Association. Fast facts: Civic engagement and older Americans - volunteerism.
http://www.nga.org/Files/pdf/0607FASTFACTS.pdf. 6. Adler RP, Goggin J. What do we mean by "civic engagement"? . Journal of Transformative Education. 2005;3:236-
253. 7. Saxon-Harrold S, McCormack M, Hume K. America's Senior Volunteers. Washington, DC: Independent Sector;
2000:12. 8. Service CfNaC. Tools and training for volunteer and service programs. 2008;
http://www.nationalserviceresources.org/initiatives/boomers/boomers.php. 9. Morrow-Howell N, Hinterlong, J., Sherraden, M., Tang, F., Thirupathy, P., & Nagchoudhuri, M. Institutional
capacity for elder service (CSD Working Paper 03-14). Social Development Issues. 2003;25:189-204. 10. Thompson E, Wilson, L. The Potential Of Older Volunteers In Long-Term Care. The American Society on Aging.
2003;25(1):58-63. 11. Bridgeland JM, Putnam, R.D. and Wofford, H.L. More To Give. Tapping The Talents Of The Baby Boomer,
Silent And Greatest Generations. AARP. 2008:3-35. 12. Hoffman L. Increasing Volunteerism Among Older Adults: Benefits And Strategies For States. NGA Center for
Best Practices. 2008:1-13. 13. Kaskie B, Imhof, S., Cavanaugh, J. & Culp, K. Civic Engagement As A Retirement Role For Aging Americans.
The Gerontologist. 2008;48(3):368-377. 14. Lindblom D. Baby Boomers and The New Age of Volunteerism. . Corporation for National Service. 2001;Senior
Service:ii-30. 15. Service CfNaC. Engaging Persons with Disabilities in National and Community Service Grants. 2010. 16. Careers E. Encore Fellowships. 2010; http://www.encore.org/fellowships. 17. Spencer A, Hancock L. Seniors Living Policy: Urban Design Guidelines for Infill Development. Sydney, Australia:
Urban Design Advisory Services, Department of Infrastructure, Planning and Natural Resources; 2004:1-20. 18. LeGates R, Potepan, M., Blash, L., Gilbert, N. LITERATURE REVIEW ON URBAN AND COMMUNITY
DEVELOPMENT: San Francisco State University Public Research Institute;1996. 19. Moeller P. How Age Friendly is Your Community? 2010; http://money.usnews.com/money/blogs/the-best-
life/2010/08/20/how-age-friendly-is-your-community. Accessed January 4, 2011. 20. The Urban Land Institute. ULI Community Catalyst Report Number 3: Best Practices in the Production of Affordable
Housing. Washington, DC: ULI - the Urban Land Institute;2005. 21. Commission on Affordable Housing and Health Facility Needs for Seniors in the 21st Century. A quiet crisis in
America: A report to Congress by the Commission on Affordable Housing and Health Facility Needs for Seniors in the 21st Century. Washington, DC: Commission on Affordable Housing and Health Facility Needs for Seniors in the 21st Century; 2002:1-127.
22. National Resource Center on Supportive Housing and Home Modification - Gerontology. http://www.homemods.org/. Accessed November, 2007.
23. National Directory of Home Modification Resources. http://www.usc.edu/dept/gero/nrcshhm/directory/. Accessed November, 2007.
24. Region RR. Topic 2009 Seniors in Our Mountain Communities: Health Care2009. 25. Centers for Disease Control and Prevention. Healthy aging: Preserving function and improving quality of life
among older Americans at a glance: National Center for Health Statistics, Department of Health and Human Services; 2007.

CASOA™ Full Report | The City of Novi • • 102 • •
Co
mm
un
ity
Ass
essm
ent
Surv
ey f
or
Old
er A
du
lts™
© 2
01
2 N
atio
nal
Res
earc
h C
ente
r, In
c.
26. Centers for Disease Control and Prevention. National health interview survey: National Center for Health Statistics, Department of Health and Human Services; 2005.
27. Larkin M. Active aging professionals urged to implement evidence-based programs that include strength training, aerobics, balance, and flexibility for all populations Journal on Active Aging. 2007;6(5):29-34.
28. Live well, live long: Steps to better health: American Society on Aging; 2005. 29. National Research Center Inc. Colorado Healthy People 2010: Obesity Prevention; Final Evaluation Summary Report:
The Colorado Trust;2007. 30. Humpel N, Owen N, Leslie E. Environmental factors associated with adults' participation in physical activity: A
review. American Journal of Preventive Medicine. 2002;22(3):188-199. 31. Barclay L. Obesity and the built environment: A newsmaker interview with James O. Hill, PhD. Medscape Medical
News. May 19 2004. 32. Ewing R, Cervero R. Travel and the built environment: A synthesis Journal of Transportation Research Board 1780.
2001:87-114. 33. Greenwald M, Boarnet M. Built environment as determinant of walking behavior: Analyzing nonwork pedestrian
travel in Portland, Oregon. Journal of Transportation Research Board 1780. 2001:33-42. 34. Handy S, Boarnet M, Eqing R, Killingsworth R. How the built environment affects physical activity: Views from
urban planning. American Journal of Preventive Medicine. 2002;23(2S):64-72. 35. Partnership for Prevention. Creating Communities for Active Aging. Washington, D.C.2001. 36. Active Living Leadership. A Primer on Active Living for Government Officials. Princeton, NJ: Robert Wood Johnson
Foundation;2005. 37. Robert Wood Johnson Foundation. Leadership for Healthy Communities. Policies for Active Living and Community
Design www.activelivingleadership.org/ResoComm-3903.html. Accessed November 29, 2007. 38. Nord M, Andrews M, Carlson S. Household food security in the United States: Department of
Agriculture/Economic Research Service; 2005. 39. America's second harvest fact sheet on senior hunger.
www.secondharvest.org/learn_about_hunger/fact_sheet/senior_hunger.html. 40. USDA. Elderly Assitance Programs. 2010;
http://www.nutrition.gov/nal_display/index.php?info_center=11&tax_level=2&tax_subject=394&topic_id=1772&placement_default=0.
41. Economic Research Service. Community food assessment toolkit. Washington, D.C.: U.S. Department of Agriculture; 2002.
42. Mark I. Weinberger AJR, Christian J. Nelson. Untangling the Complexities of Depression Diagnosis in Older Cancer Patients. The Oncologist. January 14, 2009 2009;14(1):60-66.
43. Centers for Disease Control and Prevention. Effective Programs to Treat Depression in Older Adults: Implementation Strategies for Community Agencies. PRC-HAN Conference. Atlanta, GA: Prevention Research Centers-Healthy Aging Research Network and Rosalynn Carter Georgia Mental Health Forum; 2008.
44. LeaMond N. Public Policy Challenges to Creating Livable Communities. Paper presented at: Universal village: Livable communities in the 21st century; June 15, 2005; Washington, D.C.
45. White House Conference on Aging. Report of the 2005 White House Conference on Aging: The Booming Dynamics of Aging: From Awareness to Action. Washington, DC2005.
46. Dychtwald KPD. Age Power: How the 21st Century Will Be Ruled By The New Old. New York: Jeremy P. Tarcher/Penguin Putnam, Inc.; 1999.
47. Generations Policy Initiative and the Harvard Institute for Learning in Retirement. The Age Explosion: Baby Boomers and Beyond. Harvard Generations Policy Journal. Winter 2004;1:33.
48. He W, Sengupta M, Velkoff VA, DeBarros KA. 65+ in the United States: 2005. Washington, DC: U.S. Census Bureau;2005.
49. The Booming Dynamics of Aging: From Awareness to Action. 2005 White House Conference on Aging Final Report Washington, DC: 2005 White House Conference on Aging: Report to the President and the Congress; 2005.
50. Roper ASW & AARP. Baby Boomers Envision Retirement II: Survey of Baby Boomers' Expectations for Retirement: AARP; May 2004.
51. Rix SE. Aging and Work -- A View From the United States: AARP; 2004:63. 52. Manteghi L. International Retirement Security Survey: AARP; 2005:27.
CASOA™ Full Report | The City of Novi • • 103 • •
Co
mm
un
ity
Ass
essm
ent
Surv
ey f
or
Old
er A
du
lts™
© 2
01
2 N
atio
nal
Res
earc
h C
ente
r, In
c.
53. Harper L. Fixing to Stay: A National Survey of Housing and Home Modification Issues: American Association for Retired Persons (AARP); May 2000.
54. Kochera A, Straight A, Guterbock T. Beyond 50.05: A Report to the Nation on Livable Communities: Creating Environments for Successful Aging. Washington, DC: AARP Public Policy Institute; May 2005.
55. Campbell J, Leaver J. Report from NTAC’s National Experts Meeting on Emerging New Practices in Organized Peer Support. Alexandria, VA: Substance Abuse and Mental Health Services Administration, Association of State Mental Health Program Directors, National Technical Assistance Center for State Mental Health Planning; March 17-18 2003.
56. FY 2007 Income Limits for Section 8 Programs Washington, D.C.: U.S. Department of Housing and Urban Development, Office of Policy Development and Research; 2007.
57. Rowe JW, Kahn RL. Successful Aging. New York: Pantheon Books; 1998. 58. Rahn WM, Randolph TJ. A Tale of Political Trust in American Cities. Public Opinion Quarterly. Winter
2005;69(4):530-560. 59. Tyler TR, Degoey P. Collective Restraint in Social Dilemmas: Procedural Justice and Social Identification Effects
on Support for Authorities. Journal of Personality and Social Psychology. September 1995;69(3):482-497. 60. The American Democracy Project: Civic Engagement, Higher Education, and the 21st Century. 2003;
http://www.wku.edu/aa/civic%20engagement/adpcompleteproposal.pdf. 61. Putnam RD. Bowling alone: The collapse and revival of American community. New York, NY: Simon and Schuster;
2000. 62. Klinenberg E. Heat Wave: A Social Autopsy of Disaster in Chicago: University of Chicago Press; 2003. 63. Walker J, Herbitter C. Aging in the Shadows: Social Isolation Among Seniors in New York City. New York: United
Neighborhood Houses of New York;2005. 64. Greene LV. New Directions in Work and Family Policy. APA Briefing Paper on Work and Family Policy 2004;
http://www.apa.org/ppo/issues/workandfam.html. Accessed Feburary 5, 2008. 65. Gibson MJ, Houser AN. Valuing the Invaluable: A New Look at the Economic Value of Family Caregiving. Washington,
DC: AARP Public Policy Institute; June 2007.

CASOA™ Full Report | The City of Novi • • 104 • •
Co
mm
un
ity
Ass
essm
ent
Surv
ey f
or
Old
er A
du
lts™
© 2
01
2 N
atio
nal
Res
earc
h C
ente
r, In
c.
A p p e n d i x E : S u r v e y M a t e r i a l s
The following pages contain copies of the survey materials sent to randomly selected older adult households within Novi.

PresortedFirst Class Mail
US PostagePAID
Boulder, COPermit NO. 94
Novi Senior Center25075 Meadowbrook RoadNovi, Michigan 48375
PresortedFirst Class Mail
US PostagePAID
Boulder, COPermit NO. 94
Novi Senior Center25075 Meadowbrook RoadNovi, Michigan 48375
PresortedFirst Class Mail
US PostagePAID
Boulder, COPermit NO. 94
Novi Senior Center25075 Meadowbrook RoadNovi, Michigan 48375
PresortedFirst Class Mail
US PostagePAID
Boulder, COPermit NO. 94
Novi Senior Center25075 Meadowbrook RoadNovi, Michigan 48375

Important Survey on the Way!
Dear Resident,
Your household has been selected at random to participate in ananonymous survey about the needs of older adults residing withinNovi.
You will receive a copy of the survey next week in the mail withinstructions for completing and returning it. Thank you in advance for helpingus with this important study!
Thank you for your cooperation. It is deeply appreciated.
Respectfully,
Bob GattMayorCity of Novi

January 2012
Dear Resident:
The City of Novi is conducting a Community Assessment Survey of OlderAdults to learn about the current and future needs of older adults living inNovi. Your household is one of a small number of households in the City ofNovi that we chose randomly to participate in this survey.
Please take a few minutes to complete the following survey. Your answerswill help the City of Novi to better understand and plan for the needs ofolder adults in our community. You should find the questions thought-provoking and we will definitely find your answers useful. Please participate!
To get a representative sample of residents living in Novi, the adult age 55years or older in your household who most recently had a birthday(regardless of the year of birth) should complete this survey. Please have theappropriate member of the household spend a few minutes to answer all thequestions and return the survey in the enclosed postage-paid envelope. Yourresponses will remain completely anonymous.
Since only a small number of households are being surveyed, yourparticipation is very important. If you have any questions or need assistancewith this survey, please call Novi’s Senior Services Manager, Rachel Zagaroli,at 248-347-0403.
You can help us shape the future for older adults in Novi. Thank you for yourtime and participation.
Respectfully,
Bob GattMayorCity of Novi
CITY COUNCIL
MayorBob Gatt
Mayor Pro TemDave Staudt
Terry K. Margolis
Andrew Mutch
Justin Fischer
Wayne Wrobel
Laura Marie Casey
City ManagerClay J. Pearson
Parks, Recreation &Cultural Services DirectorJason Mangum
Senior Services ManagerRachel Zagaroli
Novi Senior Center25075 Meadowbrook RoadNovi, Michigan 48375248.347.0414248.347.0490 fax
cityofnovi.org

January 2012
Dear Resident:
About one week ago we sent you this survey requesting your opinion aboutthe needs of older adults living in Novi. If you have already completed thesurvey and returned it, we thank you and ask you to disregard this letter. Donot complete the survey a second time. If you haven’t had a chancecomplete and mail the survey, we are hopeful you could please do so now. Weare very interested in obtaining your input.
Your answers will help the City of Novi to better understand and plan for theneeds of older adults in our community. You should find the questionsthought-provoking and we will definitely find your answers useful. Pleaseparticipate!
To get a representative sample of residents living in Novi, the adult 55 yearsor older in your household who most recently had a birthday (regardless ofthe year of birth) should complete this survey. Please have the appropriatemember of the household spend a few minutes to answer all the questionsand return the survey in the enclosed postage-paid envelope. Your responseswill remain completely anonymous.
Since only a small number of households are being surveyed, yourparticipation is very important. If you have any questions or need assistancewith this survey, please call Novi’s Senior Services Manager, Rachel Zagaroli,at 248-347-0403.
You can help us shape the future for older adults in Novi. Thank you for yourtime and participation.
Respectfully,
Bob GattMayorCity of Novi
CITY COUNCIL
MayorBob Gatt
Mayor Pro TemDave Staudt
Terry K. Margolis
Andrew Mutch
Justin Fischer
Wayne Wrobel
Laura Marie Casey
City ManagerClay J. Pearson
Parks, Recreation &Cultural Services DirectorJason Mangum
Senior Services ManagerRachel Zagaroli
Novi Senior Center25075 Meadowbrook RoadNovi, Michigan 48375248.347.0414248.347.0490 fax
cityofnovi.org
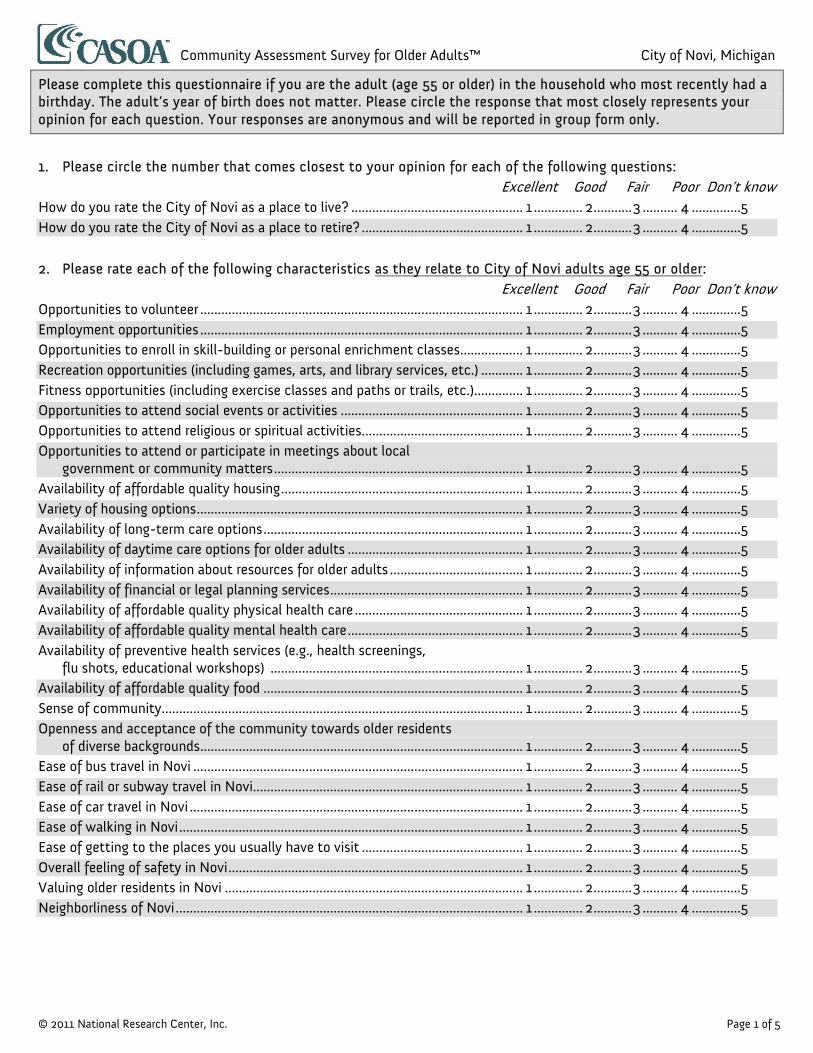
Community Assessment Survey for Older Adults™ City of Novi, Michigan
© 2011 National Research Center, Inc. Page 1 of 5
Please complete this questionnaire if you are the adult (age 55 or older) in the household who most recently had abirthday. The adult’s year of birth does not matter. Please circle the response that most closely represents youropinion for each question. Your responses are anonymous and will be reported in group form only.
1. Please circle the number that comes closest to your opinion for each of the following questions:Excellent Good Fair Poor Don’t know
How do you rate the City of Novi as a place to live? ................................................. 1 .............. 2...........3 .......... 4 ..............5How do you rate the City of Novi as a place to retire? .............................................. 1 .............. 2...........3 .......... 4 ..............5
2. Please rate each of the following characteristics as they relate to City of Novi adults age 55 or older:Excellent Good Fair Poor Don’t know
Opportunities to volunteer ............................................................................................ 1 .............. 2...........3 .......... 4 ..............5Employment opportunities ............................................................................................ 1 .............. 2...........3 .......... 4 ..............5Opportunities to enroll in skill-building or personal enrichment classes.................. 1 .............. 2...........3 .......... 4 ..............5Recreation opportunities (including games, arts, and library services, etc.) ............ 1 .............. 2...........3 .......... 4 ..............5Fitness opportunities (including exercise classes and paths or trails, etc.).............. 1 .............. 2...........3 .......... 4 ..............5Opportunities to attend social events or activities .................................................... 1 .............. 2...........3 .......... 4 ..............5Opportunities to attend religious or spiritual activities.............................................. 1 .............. 2...........3 .......... 4 ..............5Opportunities to attend or participate in meetings about local
government or community matters....................................................................... 1 .............. 2...........3 .......... 4 ..............5Availability of affordable quality housing..................................................................... 1 .............. 2...........3 .......... 4 ..............5Variety of housing options............................................................................................. 1 .............. 2...........3 .......... 4 ..............5Availability of long-term care options.......................................................................... 1 .............. 2...........3 .......... 4 ..............5Availability of daytime care options for older adults .................................................. 1 .............. 2...........3 .......... 4 ..............5Availability of information about resources for older adults ...................................... 1 .............. 2...........3 .......... 4 ..............5Availability of financial or legal planning services....................................................... 1 .............. 2...........3 .......... 4 ..............5Availability of affordable quality physical health care ................................................ 1 .............. 2...........3 .......... 4 ..............5Availability of affordable quality mental health care.................................................. 1 .............. 2...........3 .......... 4 ..............5Availability of preventive health services (e.g., health screenings,
flu shots, educational workshops) ........................................................................ 1 .............. 2...........3 .......... 4 ..............5Availability of affordable quality food .......................................................................... 1 .............. 2...........3 .......... 4 ..............5Sense of community....................................................................................................... 1 .............. 2...........3 .......... 4 ..............5Openness and acceptance of the community towards older residents
of diverse backgrounds............................................................................................ 1 .............. 2...........3 .......... 4 ..............5Ease of bus travel in Novi .............................................................................................. 1 .............. 2...........3 .......... 4 ..............5Ease of rail or subway travel in Novi............................................................................. 1 .............. 2...........3 .......... 4 ..............5Ease of car travel in Novi ............................................................................................... 1 .............. 2...........3 .......... 4 ..............5Ease of walking in Novi.................................................................................................. 1 .............. 2...........3 .......... 4 ..............5Ease of getting to the places you usually have to visit .............................................. 1 .............. 2...........3 .......... 4 ..............5Overall feeling of safety in Novi.................................................................................... 1 .............. 2...........3 .......... 4 ..............5Valuing older residents in Novi ..................................................................................... 1 .............. 2...........3 .......... 4 ..............5Neighborliness of Novi................................................................................................... 1 .............. 2...........3 .......... 4 ..............5

Community Assessment Survey for Older Adults™ City of Novi, Michigan
© 2011 National Research Center, Inc. Page 2 of 5
3. How would you rate the overall services provided to older adults in Novi? Excellent Good Fair Poor Don’t know
4. In general, how informed or uninformed do you feel about services and activities available to older adults Novi? Very informed Somewhat informed Somewhat uninformed Very uninformed
5. Please circle the number that comes closest to your opinion for each of the following questions:Excellent Good Fair Poor Don’t know
How do you rate your overall physical health? .......................................................... 1 .............. 2...........3 .......... 4 ..............5How do you rate your overall mental health/emotional well being? ....................... 1 .............. 2...........3 .......... 4 ..............5How do you rate your overall quality of life? .............................................................. 1 .............. 2...........3 .......... 4 ..............5
6a. The following questions list a number of problems that older adults may or may not face. Thinking back overthe last 12 months, how much of a problem, if at all, has each of the following been for you?
Not a Minor Moderate Major Don’tproblem problem problem problem know
Having housing to suit your needs .............................................................. 1 ..................2 ................. 3................. 4 ..............5Your physical health ...................................................................................... 1 ..................2 ................. 3................. 4 ..............5Performing regular activities, including walking,
eating and preparing meals.................................................................... 1 ..................2 ................. 3................. 4 ..............5Having enough food to eat........................................................................... 1 ..................2 ................. 3................. 4 ..............5Doing heavy or intense housework.............................................................. 1 ..................2 ................. 3................. 4 ..............5Having safe and affordable transportation available ................................. 1 ..................2 ................. 3................. 4 ..............5No longer being able to drive ....................................................................... 1 ..................2 ................. 3................. 4 ..............5Feeling depressed .......................................................................................... 1 ..................2 ................. 3................. 4 ..............5Experiencing confusion or forgetfulness..................................................... 1 ..................2 ................. 3................. 4 ..............5Maintaining your home ................................................................................. 1 ..................2 ................. 3................. 4 ..............5Maintaining your yard ................................................................................... 1 ..................2 ................. 3................. 4 ..............5Finding productive or meaningful activities to do...................................... 1 ..................2 ................. 3................. 4 ..............5Having friends or family you can rely on..................................................... 1 ..................2 ................. 3................. 4 ..............5Falling or injuring yourself in your home ..................................................... 1 ..................2 ................. 3................. 4 ..............5Finding affordable health insurance ............................................................ 1 ..................2 ................. 3................. 4 ..............5Getting the health care you need ................................................................ 1 ..................2 ................. 3................. 4 ..............5Affording the medications you need............................................................ 1 ..................2 ................. 3................. 4 ..............5Figuring out which medications to take and when.................................... 1 ..................2 ................. 3................. 4 ..............5Getting the oral health care you need......................................................... 1 ..................2 ................. 3................. 4 ..............5Getting the vision care you need ................................................................. 1 ..................2 ................. 3................. 4 ..............5Having enough money to meet daily expenses.......................................... 1 ..................2 ................. 3................. 4 ..............5Having enough money to pay your property taxes .................................... 1 ..................2 ................. 3................. 4 ..............5

Community Assessment Survey for Older Adults™ City of Novi, Michigan
© 2011 National Research Center, Inc. Page 3 of 5
6b. The following questions list a number of other problems that older adults may or may not face. Thinking backover the last 12 months, how much of a problem, if at all, has each of the following been for you?
Not a Minor Moderate Major Don’tproblem problem problem problem know
Staying physically fit ..................................................................................... 1 ..................2 ................. 3................. 4 ..............5Maintaining a healthy diet............................................................................ 1 ..................2 ................. 3................. 4 ..............5Having interesting recreational or cultural activities to attend ............... 1 ..................2 ................. 3................. 4 ..............5Having interesting social events or activities to attend ........................... 1 ..................2 ................. 3................. 4 ..............5Feeling bored.................................................................................................. 1 ..................2 ................. 3................. 4 ..............5Feeling like your voice is heard in the community ..................................... 1 ..................2 ................. 3................. 4 ..............5Finding meaningful volunteer work ............................................................. 1 ..................2 ................. 3................. 4 ..............5Providing care for another person................................................................ 1 ..................2 ................. 3................. 4 ..............5Dealing with legal issues .............................................................................. 1 ..................2 ................. 3................. 4 ..............5Having adequate information or dealing with public programs
such as Social Security, Medicare and Medicaid ................................. 1 ..................2 ................. 3................. 4 ..............5Finding work in retirement ........................................................................... 1 ..................2 ................. 3................. 4 ..............5Building skills for paid or unpaid work......................................................... 1 ..................2 ................. 3................. 4 ..............5Not knowing what services are available to older adults
in your community.................................................................................. 1 ..................2 ................. 3................. 4 ..............5Feeling lonely or isolated .............................................................................. 1 ..................2 ................. 3................. 4 ..............5Dealing with the loss of a close family member or friend ......................... 1 ..................2 ................. 3................. 4 ..............5Being a victim of crime ................................................................................. 1 ..................2 ................. 3................. 4 ..............5Being a victim of fraud or a scam ................................................................ 1 ..................2 ................. 3................. 4 ..............5Being physically or emotionally abused ...................................................... 1 ..................2 ................. 3................. 4 ..............5Dealing with financial planning issues ........................................................ 1 ..................2 ................. 3................. 4 ..............5
7. Thinking back over the past 12 months, howmany days did you spend…
As a patient in a hospital?....________ number of days
In a long-term care facility (includingnursing home or in-patientrehabilitation)?................ ________ number of days
8. Thinking back over the past 12 months, howmany times have you fallen and injured yourself?Was it… Never Once or twice 3-5 times More than 5 times Don’t know
9. How likely or unlikely are you to recommendliving in Novi to older adults? Very likely Somewhat likely Somewhat unlikely Very unlikely Don’t know
10. How likely or unlikely are you to remain in Novithroughout your retirement? Very likely Somewhat likely Somewhat unlikely Very unlikely Don’t know

Community Assessment Survey for Older Adults™ City of Novi, Michigan
© 2011 National Research Center, Inc. Page 4 of 5
11. In the last 12 months, about how many times, if ever, have you participated in or done each of the following?Once or 3 to 12 13 to 26 More than
Never twice times times 26 timesUsed the Novi senior center.................................................................. 1..................2 ................. 3..................4 ................. 5Used the Novi public library .................................................................. 1..................2 ................. 3..................4 ................. 5Attended a meeting of local elected officials or
other local public meeting in Novi ................................................. 1..................2 ................. 3..................4 ................. 5Watched a meeting of local elected officials or other City-
sponsored public meeting on cable television, theInternet or other media................................................................... 1..................2 ................. 3..................4 ................. 5
Used Novi Senior Transportation .......................................................... 1..................2 ................. 3..................4 ................. 5Visited a neighborhood park .................................................................. 1..................2 ................. 3..................4 ................. 5
12. During a typical week, how many hours, if any, do you spend doing the following?Never 1 to 3 4 to 5 6 to 10 11 or more Don’t
(no hours) hours hours hours hours knowParticipating in a club (including book, dance, game
and other social) .............................................................................. 1.............. 2.............. 3.............. 4 ..............5 ............. 6Participating in a civic group (including, Elks, Kiwanis,
Masons, etc.).................................................................................... 1.............. 2.............. 3.............. 4 ..............5 ............. 6Communicating/visiting with friends and/or family ........................... 1.............. 2.............. 3.............. 4 ..............5 ............. 6Participating in religious or spiritual activities with others ............... 1.............. 2.............. 3.............. 4 ..............5 ............. 6Participating in a recreation program or group activity ...................... 1.............. 2.............. 3.............. 4 ..............5 ............. 6Providing help to friends or relatives .................................................... 1.............. 2.............. 3.............. 4 ..............5 ............. 6Volunteering your time to some group/activity in Novi ..................... 1.............. 2.............. 3.............. 4 ..............5 ............. 6
13. During a typical week, how many hours do you spend providing care for one or more individuals with whom youhave a significant personal relationship (such as a spouse, other relative, partner, friend, neighbor or child),whether or not they live with you?
Never 1 to 3 4 to 5 6 to 10 11 to 19 20 or more Don’t(no hours) hours hours hours hours hours know
One or more individuals age 55 or older ............. 1..................2 ..............3 ................. 4..................5 .................6..................7One or more individuals age 18 to 54 ................. 1..................2 ..............3 ................. 4..................5 .................6..................7One or more individuals under age 18 ................ 1..................2 ..............3 ................. 4..................5 .................6..................7
14. Whether or not they live with you, does someone provide assistance to you almost every day? Yes No

Community Assessment Survey for Older Adults™ City of Novi, Michigan
© 2011 National Research Center, Inc. Page 5 of 5
Our last questions are about you and your household. Again, all of your responses to this survey are completelyanonymous and will be reported in group form only.
D1. How many years have you lived in Novi? Less than 1 year 1-5 years 6-10 years 11-20 years More than 20 years
D2. Which best describes the building you live in? Single family home Townhouse, condominium, duplex or apartment Mobile home Assisted living residence Nursing home Other
D3. Do you currently rent or own your home? Rent Own (with a mortgage payment) Own (free and clear; no mortgage)
D4. About how much is your monthly housing cost forthe place you live (including rent, mortgagepayment, property tax, property insurance andhomeowners’ association (HOA) fees)? Less than $300 per month $300 to $599 per month $600 to $999 per month $1,000 to $1,499 per month $1,500 to $2,499 per month $2,500 or more per month
D5. How many people, includingyourself, live in yourhousehold? ...................................... ________ members
D6. How many of these people,including yourself, are 55or older? ........................................... ________ members
D7. What is your employment status? Fully retired Go to Question D9Working full time for payWorking part time for pay Unemployed, looking for paid work
D8. [IF NOT YET FULLY RETIRED]At what age do you expect toretire completely and notwork for pay at all?.........................________ years old
D9. How much do you anticipate your household’s totalincome before taxes will be for the current year?(Please include in your total income money from allsources for all persons living in your household.) Less than $15,000 $15,000 to $24,999 $25,000 to $49,999 $50,000 to $74,999 $75,000 to $99,999 $100,000 or more
D10. Are you Spanish/Hispanic/Latino? Yes No
D11. What is your race? (Mark one or more races toindicate what race you consider yourself to be.) American Indian or Alaskan native Asian or Pacific Islander Black, African AmericanWhite/Caucasian Other
D12. In which category is your age? 55-59 years 80-84 years 60-64 years 85-89 years 65-69 years 90-94 years 70-74 years 95 years or older 75-79 years
D13. What is your sex? Female Male
D14. What is your sexual orientation? Heterosexual Gay Lesbian Bi-sexual
D15. Are you registered to vote in your jurisdiction? Yes Ineligible to vote No Don’t know
D16. Many people don’t have time to vote in elections.Did you vote in the last general election? Yes Ineligible to vote No Don’t know
Thank you for completing this survey. Pleasereturn the completed survey in the postage-paid
envelope to:National Research Center, Inc. Data EntryP.O. Box 549, Belle Mead NJ 08502-9922