city of waterloo
TRANSCRIPT

1
Prepared For:
City of Waterloo
136 N Monroe St
Waterloo, WI
Market Analysis
City of Waterloo
Prepared By:
999 Fourier Drive, Suite 201
Madison, Wisconsin 53717

2
3
Vierbicher Associates, Inc.
999 Fourier Drive, Suite 201
Madison, Wisconsin 53717
(608) 826-0532
www.vierbicher.com
© 2016 Vierbicher Associates
Contents
Executive Summary 1
Economic Position 3
Location & Access 6
Methodology 7
Trade Area 8
Laborshed 10
Market Analysis 12
Socioeconomic Market Segmentation 13
Residential Growth & Housing Analysis 16
Retail Market Analysis 20
Commercial, Office, & Industrial Market 26
Workforce Profile 30
Tax & Utility Rates 34

4
1
Executive Summary
Waterloo is a community of roughly 3300
residents, located on the Maunesha River
in southeast Wisconsin, east of the state
capital Madison. Waterloo is home to the
headquarters of Trek Bicycle Corporation,
a leading bicycle manufacturer, McKay
Nursery Company, a wholesaler of plant
and landscape supplies, and Van Holten
Pickles, the largest producer of individually
packaged pickles in the world. More than
120 businesses make their home in
Waterloo. This document is part of a
project designed to move Waterloo’s
economic development effort forward. It
provides an overview of the current and
emerging demographic and real estate
trends associated with Waterloo’s retail,
housing, and commercial markets.
Opportunities for growth within each of
these markets are also identified to help
focus future initiatives to align with
anticipated market demand.
In addition to market information, a
steering committee representing a variety
of local businesses and community
organizations and real estate and
economic development professionals with
knowledge of the community contributed
to the analysis. These individuals provided
feedback on local business issues,
potential market opportunities, and
perceptions of the City in the marketplace.
There was a general consensus that,
because there has not been a long-term
sustained strategy over the past several
years, economic development progress
has been minimal. Moreover, efforts to
galvanize and coordinate members of the
community have been generally
unsuccessful. It was agreed that once an
economic development strategy has been
created it will be essential for members of
the public as well as business and real
estate owners to commit to the actions
that will yield the desired results for the City
of Waterloo.
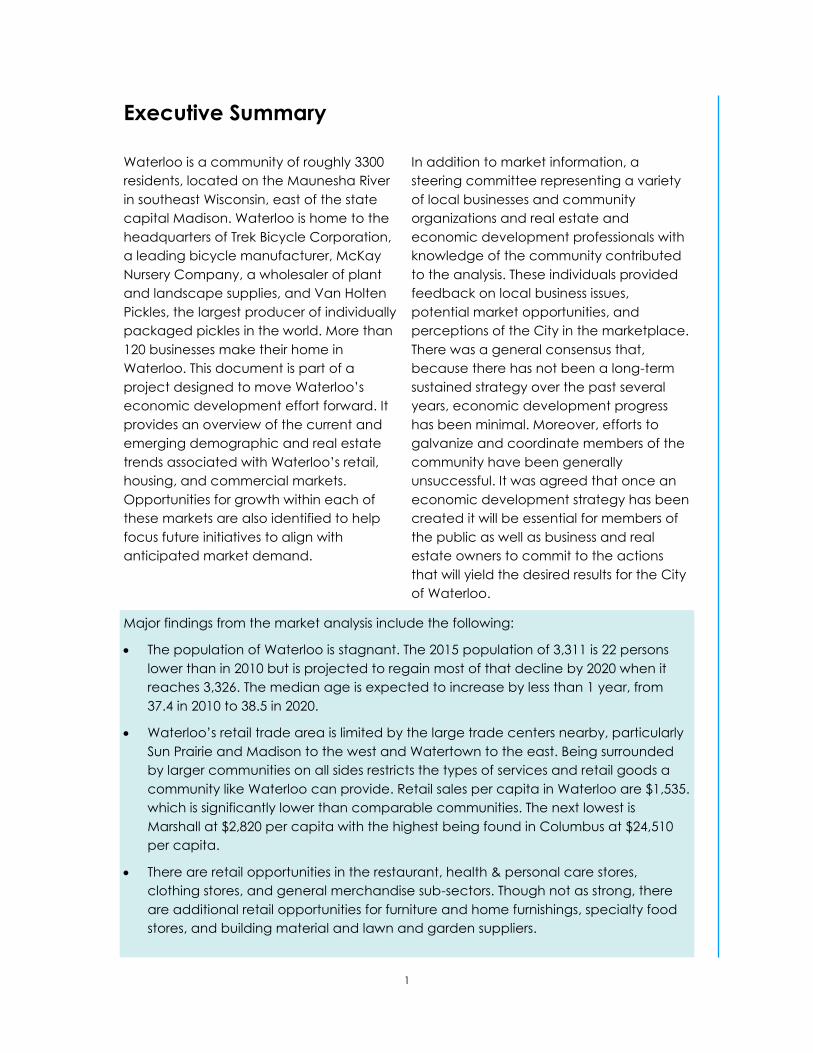
Major findings from the market analysis include the following:
The population of Waterloo is stagnant. The 2015 population of 3,311 is 22 persons
lower than in 2010 but is projected to regain most of that decline by 2020 when it
reaches 3,326. The median age is expected to increase by less than 1 year, from
37.4 in 2010 to 38.5 in 2020.
Waterloo’s retail trade area is limited by the large trade centers nearby, particularly
Sun Prairie and Madison to the west and Watertown to the east. Being surrounded
by larger communities on all sides restricts the types of services and retail goods a
community like Waterloo can provide. Retail sales per capita in Waterloo are $1,535.
which is significantly lower than comparable communities. The next lowest is
Marshall at $2,820 per capita with the highest being found in Columbus at $24,510
per capita.
There are retail opportunities in the restaurant, health & personal care stores,
clothing stores, and general merchandise sub-sectors. Though not as strong, there
are additional retail opportunities for furniture and home furnishings, specialty food
stores, and building material and lawn and garden suppliers.
2
Executive Summary
Revitalizing Waterloo’s downtown retail will require more people choosing to locate
in the community. The population needs to increase. This can be accomplished by
enhancing the perception of Waterloo as a desirable lifestyle community and
having a range of housing choices for a variety of residents to select from.
The recent addition of affordable and market rate housing improves the choices
available to residents and increases downtown residential density. More higher-end
housing could help to entice residents with higher disposable incomes.
Waterloo's median household income, at $61,768, is higher than comparison
communities. This is due to many residents being employed in relatively well-paying
jobs, but most have to commute out of Waterloo for these employment
opportunities.
The City of Waterloo is a net importer of labor, primarily due to the high number of
employees who work at Trek and commute into Waterloo each day.
Because of the long-term retail vacancy in the downtown, there is ample retail and
commercial space available in Waterloo. The presence of high-speed fiber optics
infrastructure should be a valuable amenity for the right type of business.
Waterloo has several site options for industrial and commercial development. Some
are more shovel-ready than others. The City is willing to use incentives to enable
developers and entrepreneurs bring appropriate development to the City.
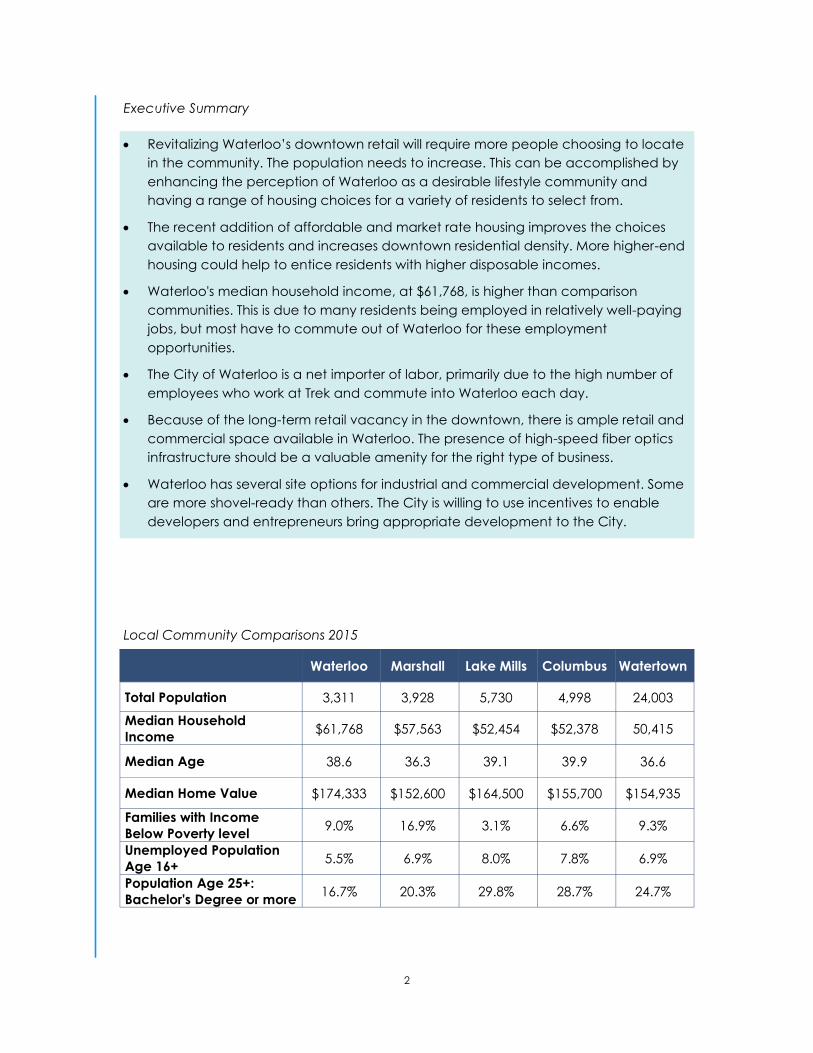
Waterloo Marshall Lake Mills Columbus Watertown
Total Population 3,311 3,928 5,730 4,998 24,003
Median Household
Income $61,768 $57,563 $52,454 $52,378 50,415
Median Age 38.6 36.3 39.1 39.9 36.6
Median Home Value $174,333 $152,600 $164,500 $155,700 $154,935
Families with Income
Below Poverty level 9.0% 16.9% 3.1% 6.6% 9.3%
Unemployed Population
Age 16+ 5.5% 6.9% 8.0% 7.8% 6.9%
Population Age 25+:
Bachelor's Degree or more 16.7% 20.3% 29.8% 28.7% 24.7%
Local Community Comparisons 2015
3
Economic Position
Waterloo occupies an interesting
economic position. On the one hand, it
has a strong base of employable residents,
it is home to some large, successful
businesses, including Trek Bicycles, McKay
Nursery and Van Holten Pickles, as well as
an array of other good manufacturing and
agricultural employers. On the other hand,
it has seen its retail sector businesses leave
the City over an extended period of
decades, resulting in a visibly vacant and
downtrodden downtown center.
The gradual decline of downtown retail
businesses, combined with a significant
number of Waterloo’s residents having to
travel outside of the City for employment,
has contributed to a slight decrease in
population over the last 5 years. Arguably
this has caused a vicious cycle of fewer
retail businesses willing to locate in
Waterloo which, in turn, makes the City less
appealing to potential new residents who
are looking for a full range of amenities
when making decisions about lifestyle and
location. This trend can be difficult to
reverse.
This market analysis identifies market issues
and opportunities associated with the
residential, retail, and real estate market
sectors, as well as the City’s workforce.
Comparisons with similar communities are
provided across a variety of metrics
throughout the assessment. These
opportunities represent business
recruitment, business expansion and new
development potential, and also include
marketing and programming opportunities
which can help existing businesses and
property owners capitalize on Waterloo’s
market position and draw. A summary of
findings within each sector are highlighted
on the following pages.
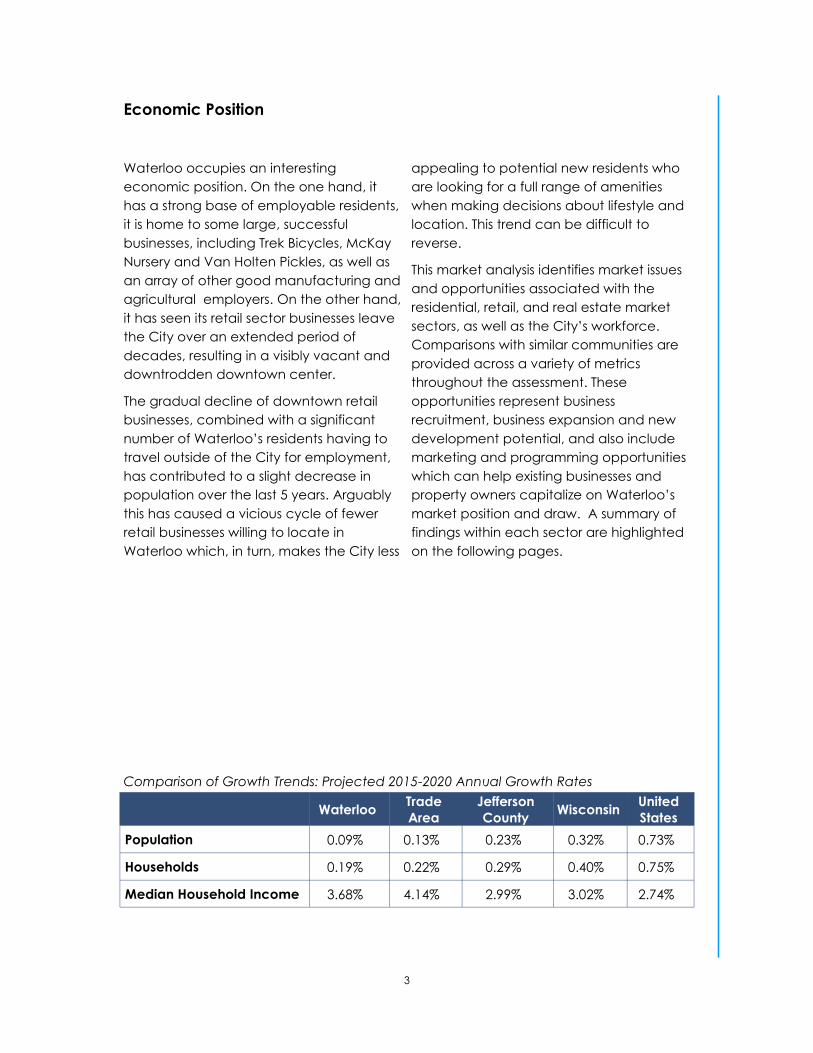
Waterloo Trade
Area
Jefferson
County Wisconsin
United
States
Population 0.09% 0.13% 0.23% 0.32% 0.73%
Households 0.19% 0.22% 0.29% 0.40% 0.75%
Median Household Income 3.68% 4.14% 2.99% 3.02% 2.74%
Comparison of Growth Trends: Projected 2015-2020 Annual Growth Rates
4
Executive Summary-Economic Position
Residential & Housing
Residential population growth is the
simplest and often a main factor in
contributing to economic development.
An increase in population, either from
migration into a community or natural
increase from births creates the need for
additional housing and expanded retail
trade. New jobs are created to provide
these needs for the growing community.
Waterloo’s population is expected to grow
very slightly in the next 5 years. The
Wisconsin DOA predicts Waterloo will
exceed 3,665 residents by 2030.
One of the biggest demographic and
residential trends facing many
communities is an aging population. The
median age in Waterloo is expected to
increase modestly. It was 37.4 years in 2010
is expected to be 38.5 in 2020, compared
to 38.5 and 39.7, respectively for Wisconsin
as a whole. Assuming a steady population,
the projected number of individuals in
Waterloo under the age of 35 is expected
to fall by 1% by 2020. During the same time,
households and families are expected to
decrease modestly in size in Waterloo,
which is consistent with the larger trends
seen in both Wisconsin and the nation
toward smaller households and families.
The number of total households was 1,331
in 2010 and 1,339 in 2015. It is expected to
increase to 1,352 by 2020.
Waterloo has a smaller range of housing
values when compared to Jefferson
County. This suggests that additional units
of both affordable housing and higher
value housing could be absorbed within
the community. It should be noted that the
recently completed Monroe Street
Apartments development, which brought
24 units to the market at the end of 2015,
will not have been included in the data
used for this study. Notably, another 16
market rate apartments and a 28-unit
assisted living facility are planned for the
former RR Donnelley property on W.
Madison Street. Future phases of this
Hawthorne & Stone development will
include another 64 units.
Retail & Opportunity Sectors
Waterloo is a local trade center that meets
some of the everyday retail needs of its
residents and workers. The nearest
community larger than Waterloo is 14 miles
away, but there are 3 communities larger
than Waterloo within 20 miles. The proximity
and size of the neighboring trade centers
restricts Waterloo’s ability to expand the
geographic boundaries of the area in
which it provides daily or regular shopping
and services. Trade centers like Columbus,
Lake Mills, and Watertown have larger
retail trade areas that absorb many of the
regular shopping and service needs of
Waterloo. Likewise, larger-ticket purchases
are often done in even larger trade areas
like Sun Prairie, Madison or Milwaukee that
provide more higher-order goods.
Consumer spending in Waterloo has not
been evenly distributed among retail
sectors, and there are retail sectors which
demonstrate sufficient surplus demand to
support additional businesses. Significant
retail gaps exist in almost every analyzed
industry group, except for grocery stores,
gas stations and used merchandise stores.
The decline in the retail downtown of
Waterloo has left the community with few
options in the City. While some of the retail
sectors analyzed show potential
opportunity, first the City needs to offer
appealing amenities and options in order
to attract more visitors and new residents.
5
This will give new business owners and
entrepreneurs more confidence to invest in
retail options for the City. A priority retail
opportunity exists with a restaurant (full- or
limited-service.) For example, a brew pub
could be a popular addition to the existing
downtown alternatives for both day and
night-time patronage. See the extended
discussion beginning on page 20 to see a
list of more retail opportunities.
Workforce & Employment
There is a significant labor pool available in
many sectors in Waterloo. There are
several sectors in which employment in
Waterloo is more concentrated than in the
County, State, or both. Waterloo is over-
represented, when compared to the State
of Wisconsin, in the sectors of agriculture/
mining, wholesale trade, transportation/
utilities and finance/insurance/real estate.
Waterloo is underrepresented in the
sectors of public administration and
services.
More than 125 businesses employing over
2,000 total workers are located in
Waterloo. Although more than 2,000 jobs
are available in the City, fewer than 1,700
workers across all industries reside in the
City, and only about 200 people living in
the City work there as well. This difference
is fulfilled by workers commuting in to
Waterloo from nearby communities. The
Waterloo area has a worker deficit in
wholesale trade and retail trade (which,
due to the classification scheme used,
includes Trek employees) businesses which
attracts employees from outside the area
to fill those positions. The entire Waterloo
area has a surplus of workers in all other
sectors. Workers in these sectors must
commute to other communities for jobs.
Commercial Real Estate
The availability of suitable land and real
estate has a significant impact on the
ability of businesses to grow and expand in
a community. There is currently an excess
supply of retail and commercial office
space in Waterloo due to changing trends
in space needs, with some vacant
industrial space available as well. Waterloo
may benefit from efforts to assist tenants or
property owners to upgrade existing office
or retail spaces, and should continue to
support development of commercial and
industrial spaces to retain and attract
businesses. Additionally, there are several
planned future development options in the
City, although these will likely not come to
fruition without a stabilization of the
population and a clear improvement in
the number of viable downtown
businesses.
Many businesses opt for a location in
smaller communities due to better
affordability of space. However, there is
only one commercial property and there
are no industrial properties listed for sale on
commercial listing sites including LoopNet
and Locate In Wisconsin. The only lease
space listed on these sites is Class A office
space found in the Waterloo Tech Center,
at $4.50-$6.00 per square foot. While other
surrounding communities are likely to have
rent discounts similar to what Waterloo
may have, the excess supply of retail and
office space, combined with the City’s
willingness to attract new businesses should
place Waterloo in a good position in
comparison with these markets.
Unfortunately, this rent benefit does not
offset the limited local customer pool and
travel time to supplier or customer
destinations for many businesses.
Executive Summary-Economic Position
6
Source: Google Maps
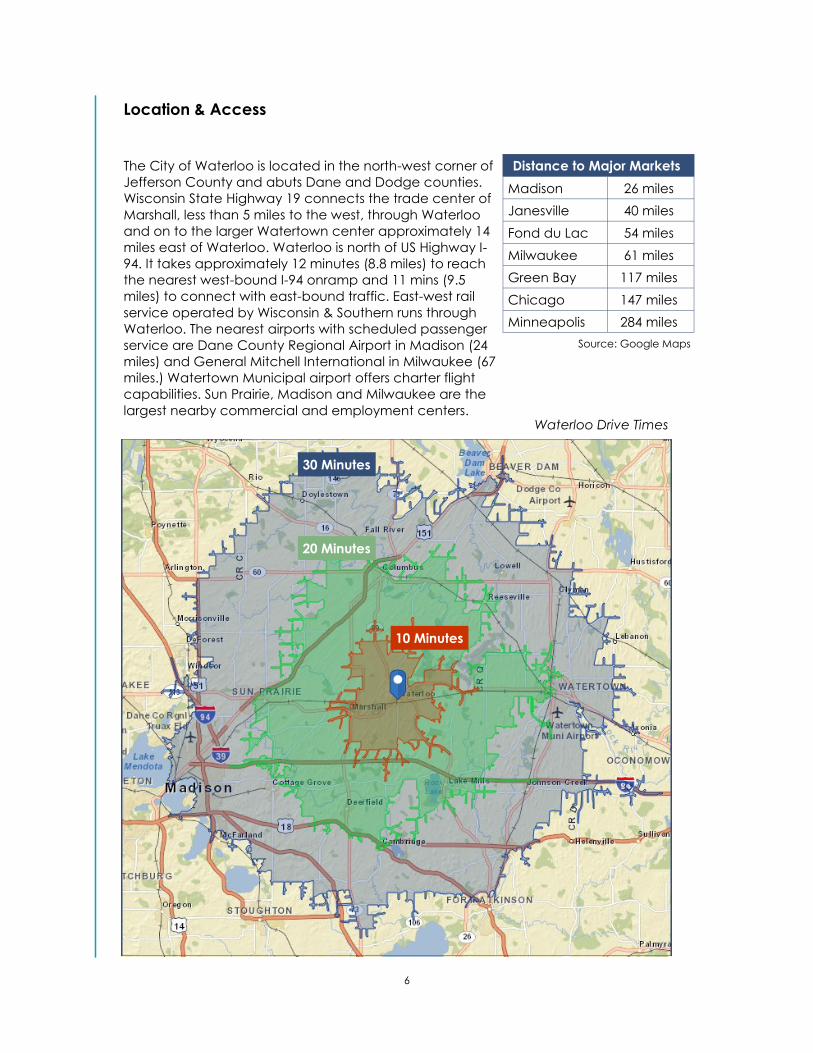
Location & Access
The City of Waterloo is located in the north-west corner of
Jefferson County and abuts Dane and Dodge counties.
Wisconsin State Highway 19 connects the trade center of
Marshall, less than 5 miles to the west, through Waterloo
and on to the larger Watertown center approximately 14
miles east of Waterloo. Waterloo is north of US Highway I-
94. It takes approximately 12 minutes (8.8 miles) to reach
the nearest west-bound I-94 onramp and 11 mins (9.5
miles) to connect with east-bound traffic. East-west rail
service operated by Wisconsin & Southern runs through
Waterloo. The nearest airports with scheduled passenger
service are Dane County Regional Airport in Madison (24
miles) and General Mitchell International in Milwaukee (67
miles.) Watertown Municipal airport offers charter flight
capabilities. Sun Prairie, Madison and Milwaukee are the
largest nearby commercial and employment centers. Waterloo Drive Times
Distance to Major Markets
Madison 26 miles
Janesville 40 miles
Fond du Lac 54 miles
Milwaukee 61 miles
Green Bay 117 miles
Chicago 147 miles
Minneapolis 284 miles
10 Minutes
30 Minutes
20 Minutes
7
Methodology
In order to appropriately define local
market opportunities, projections of key
economic and demographic variables are
included in this analysis. These projections
form the basis for decision with respect to
future demand and supply within each of
the analysis areas. Specific variables which
utilize projected data include population,
households and median family income.
These projections are developed based on
census data, historic trend data, data and
projections provided by Esri, one of the
leading demographic information firms.
Other data sources include the U.S.
Economic Census, the Census' American
Community Survey, 2015 Applied
Geographic Solutions estimates, and the
UW Extension Center for Community and
Economic Development. These data and
projections are based on nationwide
demographic trends for similar
environments, and calculations made by
Vierbicher and informed by local
observations. These assumptions and
calculations are used to project demand
for the City and for the larger Trade Area,
which is defined in the following chapter.
Projections associated with sales are based
on the existing commercial mix and trade
area capture, and can be significantly
influenced by the addition of new retail or
consumers to the City, as well as by the
departure of existing merchants, or
increased competition from nearby trade
centers.

8
Trade Area
The demand for local housing, goods,
services and employment are derived from
an area larger than the City of Waterloo. A
trade area is defined as the region from
which a majority of this demand is
generated. The Primary Trade Area
represents the area from which the bulk of
consumer demand is generated, or from
which at least 50 percent of all consumers
within the boundary are most likely to
travel to Waterloo to shop. The Primary
Trade Area is only intended to represent
the area in which residents will shop in
Waterloo for their regular retail needs;
larger or specialty items will usually be
purchased in larger or more specialized
trade centers with trade areas that overlap
Waterloo for those types of goods or
services.
The Waterloo Trade Area is heavily
influenced by the market forces of the
Madison, Sun Prairie and Watertown trade
centers, which are within 15 miles to west
and east respectively. The trade area is
also influenced by other nearby
competing communities, including,
Marshall, Lake mills and Columbus.
The estimated 2015 population for the
Waterloo trade area is 4,282, down from
Waterloo Primary Trade Area
9
Trade Area
the 2010 Census count of 4,305. The rate of
change since 2010 has been -0.11%
annually. The five-year projection for the
population in the trade area is 4,309
representing a change of -0.13% annually
from 2015 to 2020.
The household count in the Waterloo trade
area has changed from 1,705 in 2010 to
1,719 in 2015, a change of 0.16% annually.
The five-year projection of households is
1,738, an annual change of 0.22%.
Average household size is currently 2.48
and projected to be 2.47 in 2020,
compared to 2.51 in the year 2010. There
are currently 1,159 families in the trade
area.
The trade area’s 2015 median household
income is $54,241, compared to $52,076 for
all U.S. households. Median household
income is projected to be $65,479 in five
years, compared to $59,599 for all U.S.
households. The 2015 per capita income
was $26,905 in the trade area, compared
to the U.S. per capita income of $27,871.
The trade area per capita income is
projected to be $31,746 in five years,
compared to a U.S. average of $32,168.
Currently, 68.8% of the 1,815 housing units
in the trade area are owner occupied;
25.9% are renter occupied; and 5.3% are
vacant. This compares with 56.0% of the
housing units in the U.S. being owner
occupied; 32.4% renter occupied; and
11.6% vacant. The number of housing units
was 1,801 in 2010 and is expected to be
about 1,836 by 2020. Median home value
in the trade area is $176,579, compared to
a median home value of $190,791 for the
U.S.

10
Waterloo Laborshed
Laborshed
A second relevant regional boundary
referenced in this document is the distance
from which Waterloo companies draw
employees. Commonly referred to as the
laborshed, the size, demographics,
education and occupation of individuals
within this area are important factors in
company decisions to locate or expand in
a region based on the perceived ability to
recruit qualified workers at competitive
wages. Information from the 2013
Economic Census, 2015 Esri estimates, 2015
Applied Geographic Solutions estimates,
and the UW Extension Center for
Community and Economic Development is
used to determine worker characteristics
and flows within the region.
Employees working at jobs within the City
come from a comparable, though slightly
smaller, region than the consumer
population of the community. The area
and population of the Waterloo laborshed
are larger than the trade area, likely due to
the presence of several large employers,
specifically Trek, that are able to draw a
labor force from an extended distance.
The map below illustrates the geographic
reach of this laborshed.

11
Laborshed
The size and composition of an area’s
laborshed significantly influences the type
of employers which may be attracted to
Waterloo based on a need for skilled labor.
However, these daily commuters also
represent a significant pool of potential
customers for local retailers. On average,
workers in rural communities spend
approximately $100 per week on trips
associated with the work day (excluding
online purchases and gas), including
commuting, lunch hour dining and
shopping and errands run en route to their
place of employment. Of course, the
availability of retail significantly influences
these habits, with employees in downtowns
with nearby retail spending more than
employees with less access to retail
amenities. Especially impacted is spending
on dining, which drops significantly if
restaurant options are not available as
workers substitute lunch from home.
Restaurants in areas with daytime
populations typically depend on daytime
spending for a large portion of total sales.
The type of employment also changes the
nature of spending, with shift workers less
able to take advantage of lunch hour for
spending, but with greater pre- or post-
work timeframes to complete purchases.
The radial graphs below show the
geographic commuting patterns for
people commuting into and out of
Waterloo for work. The first graph shows the
directions and distances for which workers
in Waterloo commute to the city for work.
The second graph shows the directions
and distances residents of Waterloo who
work outside the city travel for work.
Waterloo Residents: Place of Work Waterloo Workers: Place of Residence
< 10 Miles 10 - 24 Miles 25 - 49 Miles 50 + Miles

12
Market Analysis
The remainder of this document will go into
a more in-depth analysis of the sections
covered in the executive summary. It will
first discuss trends in the City and trade
area’s demographic and income data. It
will then analyze the market profile of the
households residing within the City and the
trade area, using this information to
extrapolate the potential market spending
in the area over a number of business
sectors.
After identifying the market potential and
current sales, we are able to identify those
sectors in which Waterloo area businesses
are not meeting the needs of the market
trade area: areas in which the City can
work to establish, attract, or grow firms
taking advantage of those market supply
gaps. The market analysis will then
continue on to investigate the trends of the
area housing market and the resultant
needs of the future, as well as the trends
and space needs for commercial office,
retail, and industrial real estate.
An analysis of the characteristics of the
area workforce has also been undertaken.
Finally, the document analyzes Waterloo’s
competitive position amongst nearby
communities in the context of taxes and
utilities.

13
Socioeconomic Market Segmentation
Demographics firm Esri's Tapestry
Segmentation system divides geographic
areas into 67 distinctive segments based
on their socioeconomic and demographic
composition, detailing the diversity of the
American population and provide an
accurate, detailed description of
America's communities and
neighborhoods. The populations within
segments exhibit certain socioeconomic
traits and similar demographic, education,
and housing choice characteristics. By
grouping and segmenting populations
based on these characteristics, these
segments can provide guidance for
marketing, planning, and economic
development by summarizing markets that
share similar traits.
Primary Tapestry Segments
Waterloo Trade Area
Middleburg 40.7% of households
Parks and Rec 38.3% of households
Green Acres 15.4% of households
Soccer Moms 5.6% of households
Middleburg
Middleburg neighborhoods transformed
from the easy pace of country living to
semirural subdivisions in the last decade,
when the housing boom reached out.
Residents are conservative, family-oriented
consumers. Still more country than rock
and roll, they are thrifty but willing to carry
some debt and are already investing in
their futures. They rely on their mobile
devices to stay in touch and pride
themselves on their expertise. They prefer
to buy American and travel in the US.
Semirural locales within metropolitan
areas.
Neighborhoods have changed with the
addition of new single-family homes.
Also include a number of mobile
homes.
Affordable housing, median value of
$158,000 with a low vacancy rate.
Young couples, many with children;
average household size is 2.73.
66% have a high school diploma or some
college education.
Unemployment rate lower at 7.4%. Labor
force participation typical of a younger
population at 66.7%.
Prefer to buy American and for a good
price.
Comfortable with the latest in
technology, for convenience and
entertainment.
Residents are partial to trucks, SUVs, and
occasionally, convertibles, or
motorcycles.
Entertainment is primarily family-oriented,
TV and movie rentals or theme parks
and family restaurants.
Spending priorities also focus on family
(children’s toys and apparel) or home
DIY projects.
Sports include hunting, target shooting,
14
bowling, and baseball.
TV and magazines provide entertainment
and information.
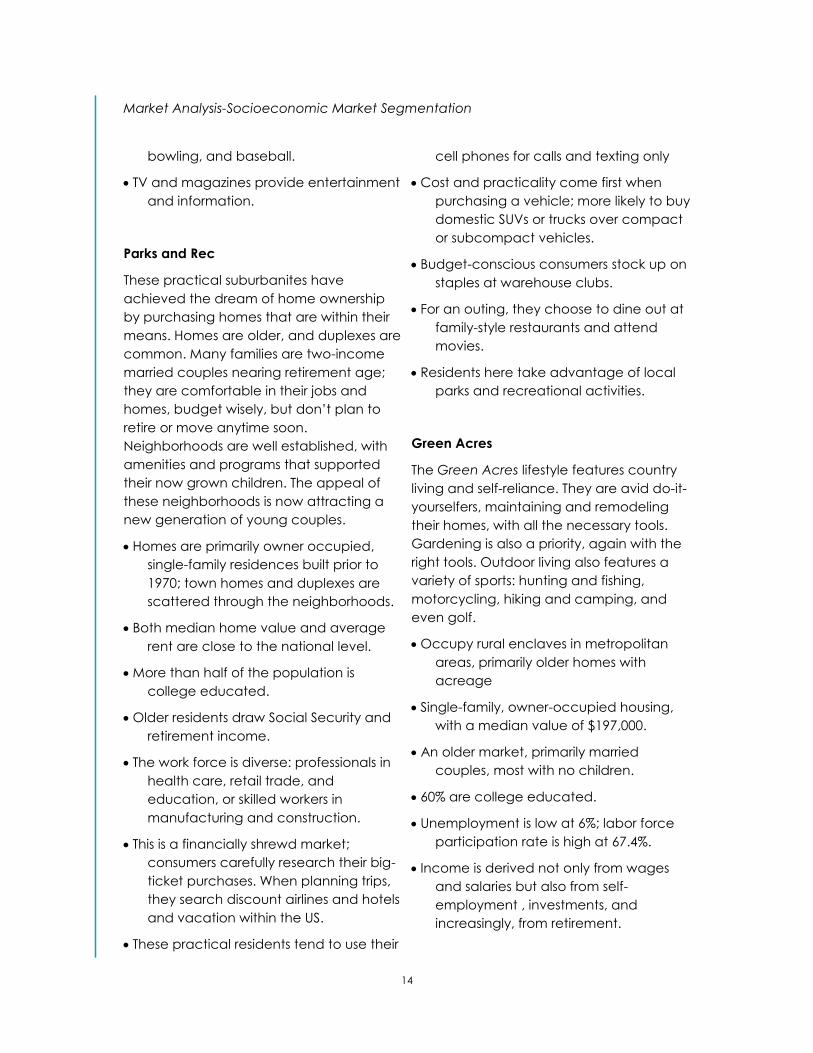
Parks and Rec
These practical suburbanites have
achieved the dream of home ownership
by purchasing homes that are within their
means. Homes are older, and duplexes are
common. Many families are two-income
married couples nearing retirement age;
they are comfortable in their jobs and
homes, budget wisely, but don’t plan to
retire or move anytime soon.
Neighborhoods are well established, with
amenities and programs that supported
their now grown children. The appeal of
these neighborhoods is now attracting a
new generation of young couples.
Homes are primarily owner occupied,
single-family residences built prior to
1970; town homes and duplexes are
scattered through the neighborhoods.
Both median home value and average
rent are close to the national level.
More than half of the population is
college educated.
Older residents draw Social Security and
retirement income.
The work force is diverse: professionals in
health care, retail trade, and
education, or skilled workers in
manufacturing and construction.
This is a financially shrewd market;
consumers carefully research their big-
ticket purchases. When planning trips,
they search discount airlines and hotels
and vacation within the US.
These practical residents tend to use their
cell phones for calls and texting only
Cost and practicality come first when
purchasing a vehicle; more likely to buy
domestic SUVs or trucks over compact
or subcompact vehicles.
Budget-conscious consumers stock up on
staples at warehouse clubs.
For an outing, they choose to dine out at
family-style restaurants and attend
movies.
Residents here take advantage of local
parks and recreational activities.
Green Acres
The Green Acres lifestyle features country
living and self-reliance. They are avid do-it-
yourselfers, maintaining and remodeling
their homes, with all the necessary tools.
Gardening is also a priority, again with the
right tools. Outdoor living also features a
variety of sports: hunting and fishing,
motorcycling, hiking and camping, and
even golf.
Occupy rural enclaves in metropolitan
areas, primarily older homes with
acreage
Single-family, owner-occupied housing,
with a median value of $197,000.
An older market, primarily married
couples, most with no children.
60% are college educated.
Unemployment is low at 6%; labor force
participation rate is high at 67.4%.
Income is derived not only from wages
and salaries but also from self-
employment , investments, and
increasingly, from retirement.
Market Analysis-Socioeconomic Market Segmentation
15
They are cautious consumers with a focus
on quality and durability.
Comfortable with technology, but more
as a tool than a trend.
Economic outlook is professed as
pessimistic, but consumers are
comfortable with debt, primarily as
home and auto loans, and
investments.
Purchasing choices reflect residents
country life, including a variety of
vehicles from trucks and SUVs to ATVs
and motorcycles
Homeowners favor DIY home
improvement projects and gardening.
Media of choice are provided by satellite
service, radio, and television, also with
an emphasis on country and home
and garden.
Green Acres residents pursue physical
fitness vigorously, from working out on
home exercise equipment to playing a
variety of sports.
Residents are active in their communities
and a variety of social organizations.
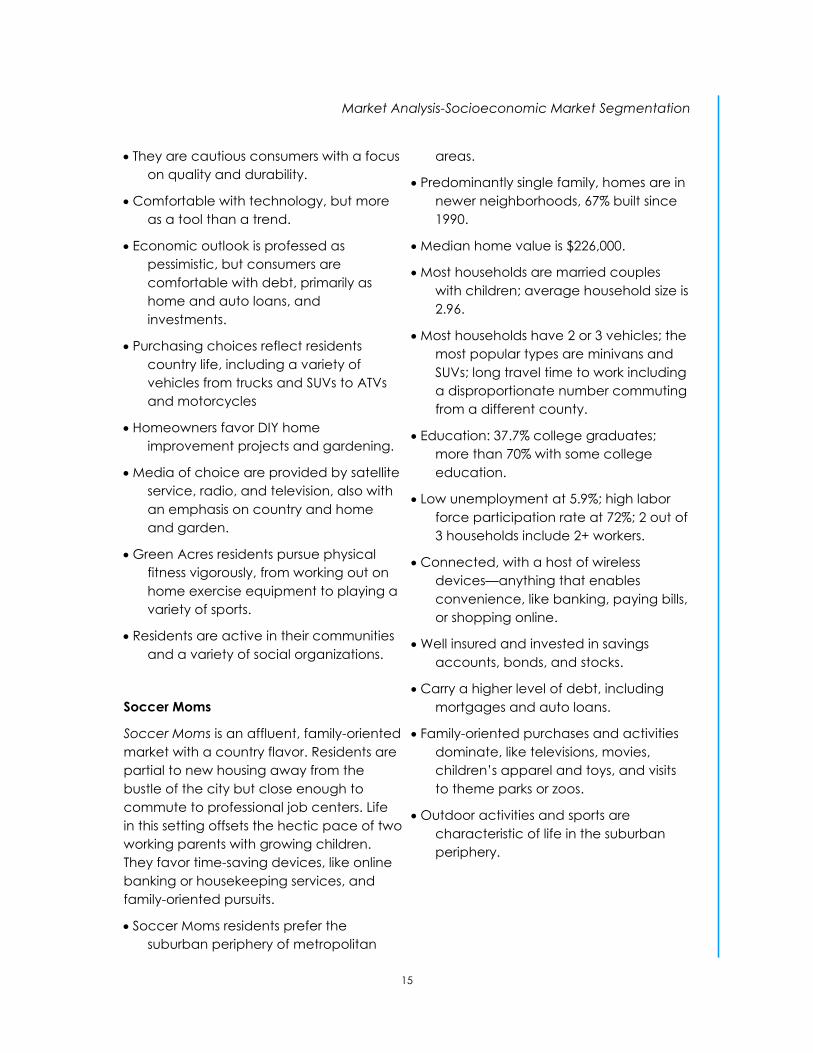
Soccer Moms
Soccer Moms is an affluent, family-oriented
market with a country flavor. Residents are
partial to new housing away from the
bustle of the city but close enough to
commute to professional job centers. Life
in this setting offsets the hectic pace of two
working parents with growing children.
They favor time-saving devices, like online
banking or housekeeping services, and
family-oriented pursuits.
Soccer Moms residents prefer the
suburban periphery of metropolitan
areas.
Predominantly single family, homes are in
newer neighborhoods, 67% built since
1990.
Median home value is $226,000.
Most households are married couples
with children; average household size is
2.96.
Most households have 2 or 3 vehicles; the
most popular types are minivans and
SUVs; long travel time to work including
a disproportionate number commuting
from a different county.
Education: 37.7% college graduates;
more than 70% with some college
education.
Low unemployment at 5.9%; high labor
force participation rate at 72%; 2 out of
3 households include 2+ workers.
Connected, with a host of wireless
devices—anything that enables
convenience, like banking, paying bills,
or shopping online.
Well insured and invested in savings
accounts, bonds, and stocks.
Carry a higher level of debt, including
mortgages and auto loans.
Family-oriented purchases and activities
dominate, like televisions, movies,
children’s apparel and toys, and visits
to theme parks or zoos.
Outdoor activities and sports are
characteristic of life in the suburban
periphery.
Market Analysis-Socioeconomic Market Segmentation
16
Source: Esri
Residential Growth and Housing Analysis
As noted earlier, residential
population growth is the simplest
and often a main factor in
contributing to economic
development. An increase in
population, either from migration
into a community or natural
increase from births creates the
need for additional housing and
expanded retail trade. New jobs
are created to provide these
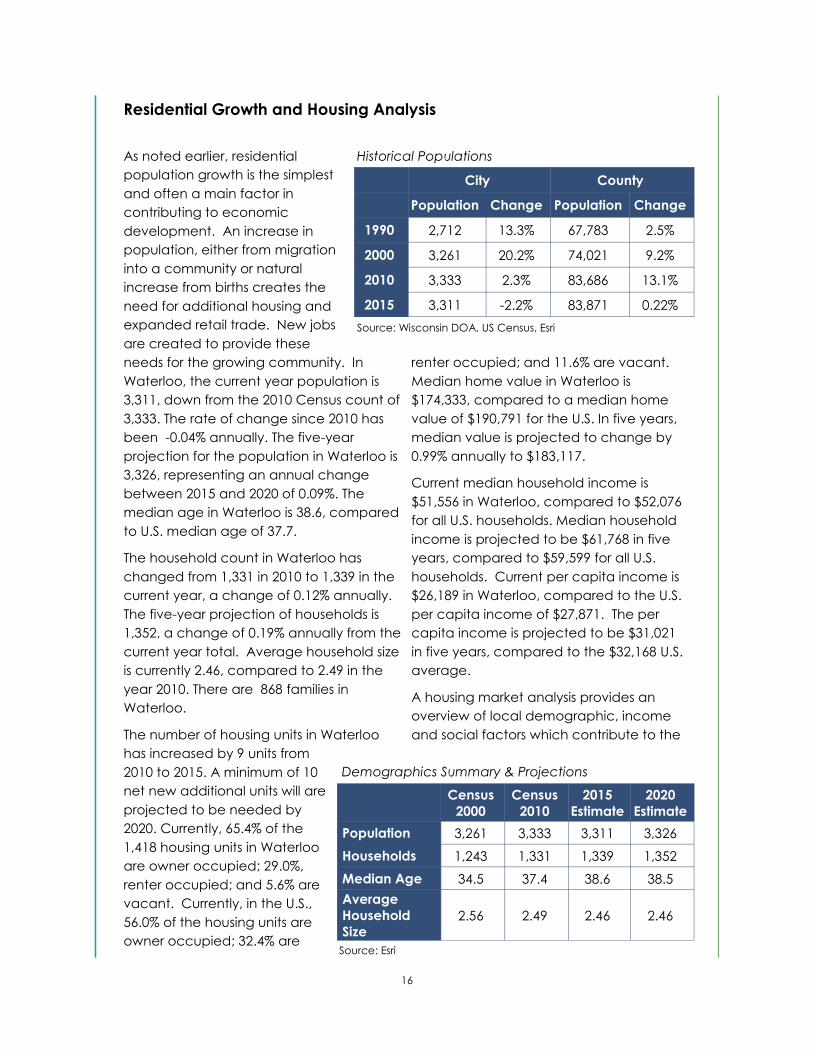
needs for the growing community. In
Waterloo, the current year population is
3,311, down from the 2010 Census count of
3,333. The rate of change since 2010 has
been -0.04% annually. The five-year
projection for the population in Waterloo is
3,326, representing an annual change
between 2015 and 2020 of 0.09%. The
median age in Waterloo is 38.6, compared
to U.S. median age of 37.7.
The household count in Waterloo has
changed from 1,331 in 2010 to 1,339 in the
current year, a change of 0.12% annually.
The five-year projection of households is
1,352, a change of 0.19% annually from the
current year total. Average household size
is currently 2.46, compared to 2.49 in the
year 2010. There are 868 families in
Waterloo.
The number of housing units in Waterloo
has increased by 9 units from
2010 to 2015. A minimum of 10
net new additional units will are
projected to be needed by
2020. Currently, 65.4% of the
1,418 housing units in Waterloo
are owner occupied; 29.0%,
renter occupied; and 5.6% are
vacant. Currently, in the U.S.,
56.0% of the housing units are
owner occupied; 32.4% are
renter occupied; and 11.6% are vacant.
Median home value in Waterloo is
$174,333, compared to a median home
value of $190,791 for the U.S. In five years,
median value is projected to change by
0.99% annually to $183,117.
Current median household income is
$51,556 in Waterloo, compared to $52,076
for all U.S. households. Median household
income is projected to be $61,768 in five
years, compared to $59,599 for all U.S.
households. Current per capita income is
$26,189 in Waterloo, compared to the U.S.
per capita income of $27,871. The per
capita income is projected to be $31,021
in five years, compared to the $32,168 U.S.
average.
A housing market analysis provides an
overview of local demographic, income
and social factors which contribute to the
Demographics Summary & Projections
Census
2000
Census
2010
2015
Estimate
2020
Estimate
Population 3,261 3,333 3,311 3,326
Households 1,243 1,331 1,339 1,352
Median Age 34.5 37.4 38.6 38.5
Average
Household
Size
2.56 2.49 2.46 2.46
Historical Populations
Source: Wisconsin DOA, US Census, Esri
City County
Population Change Population Change
1990 2,712 13.3% 67,783 2.5%
2000 3,261 20.2% 74,021 9.2%
2010 3,333 2.3% 83,686 13.1%
2015 3,311 -2.2% 83,871 0.22%

17
demand for housing in the City of
Waterloo. The analysis examines
the impact of household size,
income, age and ownership
status of Waterloo’s population.
By studying the relationship and
changes in these factors over
time, we can identify current and
future gaps in supply based on
household need. Categories
which are projected to have
potential needs are divided
based upon the type of housing
which is most commonly
demanded by these groups. For
instance, the need for rental
housing and affordable housing,
as well as active senior and
retirement communities are
frequently areas of future need in
our aging society. As with the
retail trade area, housing
demand comes from a broader
geographic area than just the
City. This larger pool includes
employees who currently work in
or near the City and would prefer
to live closer to their place of
employment, newly forming
households as a result of children
exiting their parents’ household,
and senior migration from rural
areas to be closer to accessible
services and medical care.
The charts on this page show that
Waterloo has a larger
concentration of housing units
around its median value relative
to the county distribution of
housing values. This also translates
into a relatively low number of
affordable housing units and
Market Analysis-Residential Growth & Housing
Waterloo Housing Values
Jefferson County Housing Values
Housing Cost Distribution
(thousands) Source for all charts on this page: Esri
18
Market Analysis-Residential Growth & Housing
housing units at the higher end of the value
range. Adding more housing options on
the more expensive end would attract
more high-income households to the
community, along with their considerable
spending power. Adding more housing
units on the less-expensive end of the
spectrum would help to drive employment
growth in the city.
Household income is a critical factor
impacting housing demand. The ability of
local households to afford existing housing
stock influences the decision to purchase
or rent, and indicates the price point at
which future units will be absorbed.
Housing is generally deemed to be
affordable when households spend less
than 30 percent of their income on
housing.
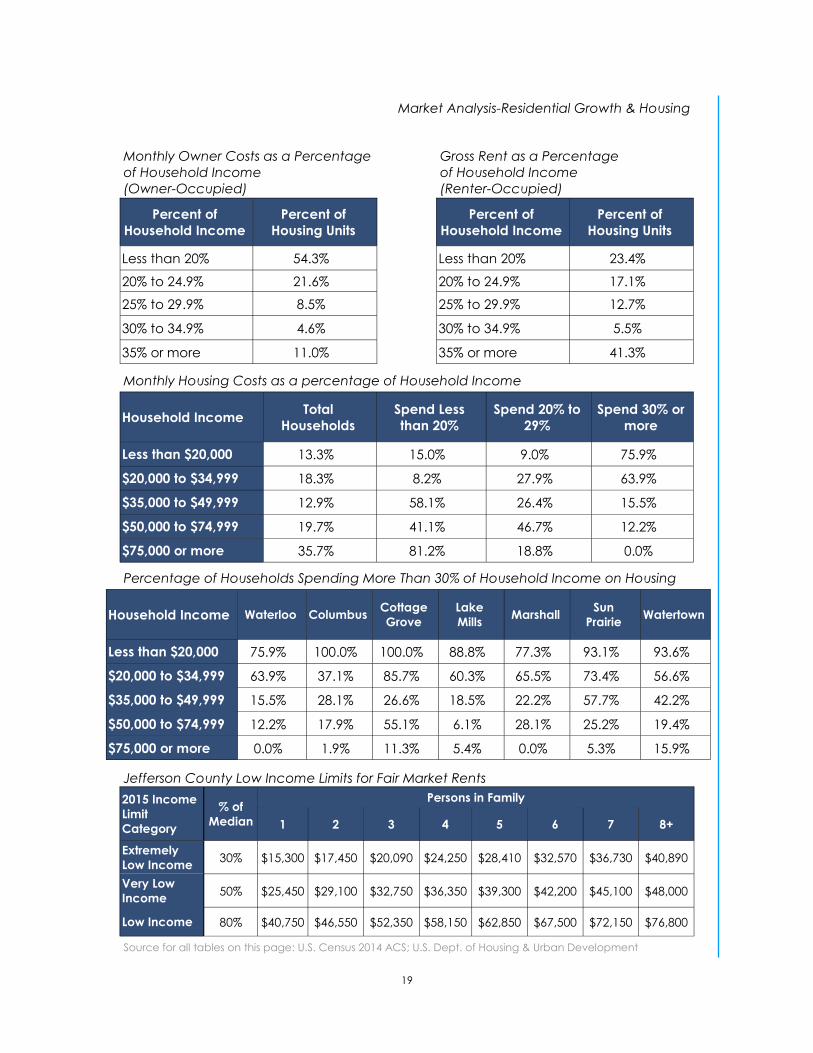
While more than 15% of Waterloo
households spend at least 30% of their
income on housing, Waterloo’s lower-
income residents do appear to have more
lower-cost housing options than residents in
peer communities.
Age and family status are the most
influential factors for households
considering renting versus owning. More
than three-quarters of all households
headed by individuals under 30 now opt to
rent, and nearly half of households headed
by individuals 30-44 now rent. Adults aged
75 and over have seen steady increases in
the percentage of households renting. In
contrast to home owners, renters have
greater choice in housing types. Within the
renter pool, there are differences in the
type of units preferred. A majority of
younger renters (under 30) live in larger
apartment buildings of five or more units,
while middle-aged renters prefer single-
family homes or buildings with less than 4
units. Older renters are split between
smaller buildings and larger senior housing
apartment buildings. Larger properties
typically offer a combination of amenities,
limited upkeep and social opportunities
which are attractive to both younger and
older age groups.
However, there is significant potential for
Waterloo to attract additional older
households moving to apartments and
senior housing facilities. These households
are most likely to rent and to make
changes in living arrangements based on
life changes (i.e., death of spouse, injury,
physical ability). However, it is necessary
that Waterloo ensure that a suitable supply
of dwelling units for these households, as
larger nearby communities will likely be
able to outcompete Waterloo in terms of
the number of units offered. The current
trend in senior housing is to create
continuum of care projects located near
existing commercial environments to
provide access to amenities. This is
consistent with the Hawthorne & Stone
assisted living and apartment
development that is currently underway
with Phase 1 on the old RR Donnelley
printing site.
Desirable nearby amenities include
pharmacy, medical, restaurants and park
space. These elements are frequently
present in downtown, making senior
housing a redevelopment strategy in
downtown or the surrounding established
neighborhoods and built-up areas.
Facilities providing a continuum of care,
including independent living
arrangements, also provide a larger
consumer base for downtown businesses,
including residents and their visitors.
19
Percentage of Households Spending More Than 30% of Household Income on Housing
Jefferson County Low Income Limits for Fair Market Rents
2015 Income
Limit
Category
Persons in Family % of
Median 1 2 3 4 5 6 7 8+
Extremely
Low Income 30% $15,300 $17,450 $20,090 $24,250 $28,410 $32,570 $36,730 $40,890
Very Low
Income 50% $25,450 $29,100 $32,750 $36,350 $39,300 $42,200 $45,100 $48,000
Low Income 80% $40,750 $46,550 $52,350 $58,150 $62,850 $67,500 $72,150 $76,800
Market Analysis-Residential Growth & Housing
Gross Rent as a Percentage
of Household Income
(Renter-Occupied)
Monthly Owner Costs as a Percentage
of Household Income
(Owner-Occupied)
Percent of
Household Income
Percent of
Housing Units
Less than 20% 54.3%
20% to 24.9% 21.6%
25% to 29.9% 8.5%
30% to 34.9% 4.6%
35% or more 11.0%
Household Income Total
Households
Spend Less
than 20%
Spend 20% to
29%
Spend 30% or
more
Less than $20,000 13.3% 15.0% 9.0% 75.9%
$20,000 to $34,999 18.3% 8.2% 27.9% 63.9%
$35,000 to $49,999 12.9% 58.1% 26.4% 15.5%
$50,000 to $74,999 19.7% 41.1% 46.7% 12.2%
$75,000 or more 35.7% 81.2% 18.8% 0.0%
Monthly Housing Costs as a percentage of Household Income
Household Income Waterloo Columbus Cottage
Grove
Lake
Mills Marshall
Sun
Prairie Watertown
Less than $20,000 75.9% 100.0% 100.0% 88.8% 77.3% 93.1% 93.6%
$20,000 to $34,999 63.9% 37.1% 85.7% 60.3% 65.5% 73.4% 56.6%
$35,000 to $49,999 15.5% 28.1% 26.6% 18.5% 22.2% 57.7% 42.2%
$50,000 to $74,999 12.2% 17.9% 55.1% 6.1% 28.1% 25.2% 19.4%
$75,000 or more 0.0% 1.9% 11.3% 5.4% 0.0% 5.3% 15.9%
Source for all tables on this page: U.S. Census 2014 ACS; U.S. Dept. of Housing & Urban Development
Percent of
Household Income
Percent of
Housing Units
Less than 20% 23.4%
20% to 24.9% 17.1%
25% to 29.9% 12.7%
30% to 34.9% 5.5%
35% or more 41.3%

20
Retail Market Analysis
No business will be able to capture 100
percent of the dollars being spent on a
particular category of goods within any
population group. Primary convenience
retailers with little competition (i.e., local
grocer) may be able to retain as much as
75 percent of local spending, although
smaller retailers, especially those in more
competitive market sectors, should base
projections on capturing 20 percent or less
of local demand. Customers within each of
these areas have numerous choices when
it comes to retail offerings, and they make
decisions based on proximity, price and
quality of goods, customer experience and
convenience. Retailers in a downtown,
with a limited immediate residential trade
area, must especially rely on their ability to
provide a unique product, service or
experience which will allow them to recruit
some customers from a broader trade
area, as well as daytime employee
populations. Finding ways to assist local
retailers in identifying and collectively
marketing to these broader groups who
are already traveling to the City for other
purposes will help boost spending
throughout the community.
The demand for, and supply of, retail and
service amenities has a significant role in
shaping consumer patterns in a
community. In contrast to residential and
business location decisions, retail and
service businesses rely on the availability of
customers in the surrounding area, and
typically only move into a community
once a sufficient level of local demand
has been reached. This local area from
which a business can expect to recruit
customers is the trade area. Businesses in
Waterloo must provide a unique good or
service to attract customers to drive further
to Waterloo versus traveling to more
convenient options in larger communities.
As described earlier, Waterloo’s retail and
service trade area is determined based on
the size, distance, and economic activities
of Waterloo and the surrounding trade
centers, specifically Marshall, Lake Mills,
Columbus, Sun Prairie, Cottage Grove and
Watertown, all of which have larger
populations and undertake more retail
trade. Due to the effects of the Madison
metro area and because Waterloo is
smaller in both population and retail trade
activity than these nearby communities, its
trade area is slightly
smaller than the typical
15-minute drive time
which represents the
primary trade area for
smaller communities
throughout Wisconsin,
as it may if there was
less nearby
competition.
Waterloo’s retail sales
per capita is $1,535,
which is notably lower
than all of its
Comparison of Local Trade Centers
Retail Sales Population Retail Sales
per Capita
Waterloo $5,110,269 3,330 $1,535
Marshall $10,896,000 3,864 $2,820
Cottage Grove $18,552,000 6512 $2,849
Lake Mills $53,797,000 5,840 $9,212
Sun Prairie $293,264,000 31,810 $9,219
Watertown $303,860,000 23,864 $12,733
Columbus $123,582,000 5,042 $24,510
Wisconsin $72,283,321,000 5,672,297 $12,743
Source: U.S. Census; Differences from Esri data due to differences in
methodologies and classification of businesses
21
Market Analysis-Retail
comparative trade centers. Per capita
retail trade in Marshall, at $2,820, is the next
lowest trade area. Yet both are
significantly lower than Columbus, which,
at $24,510, has the highest per capita retail
trade of the seven trade areas we
compared. All local trade centers
compared to Waterloo for this study have
larger populations, and more importantly,
larger trade area populations. Further, all
comparison communities are on or closer
to main commuter routes, meaning they
pick up more commuter spending,
including spending by commuters going to
or from Waterloo. Even Marshall, which is
only slightly larger than Waterloo, is on the
fastest routes to/from Sun Praire and
Madison. Likewise, Watertown and Lake
Mills are on the fastest routes to/from
Milwaukee.
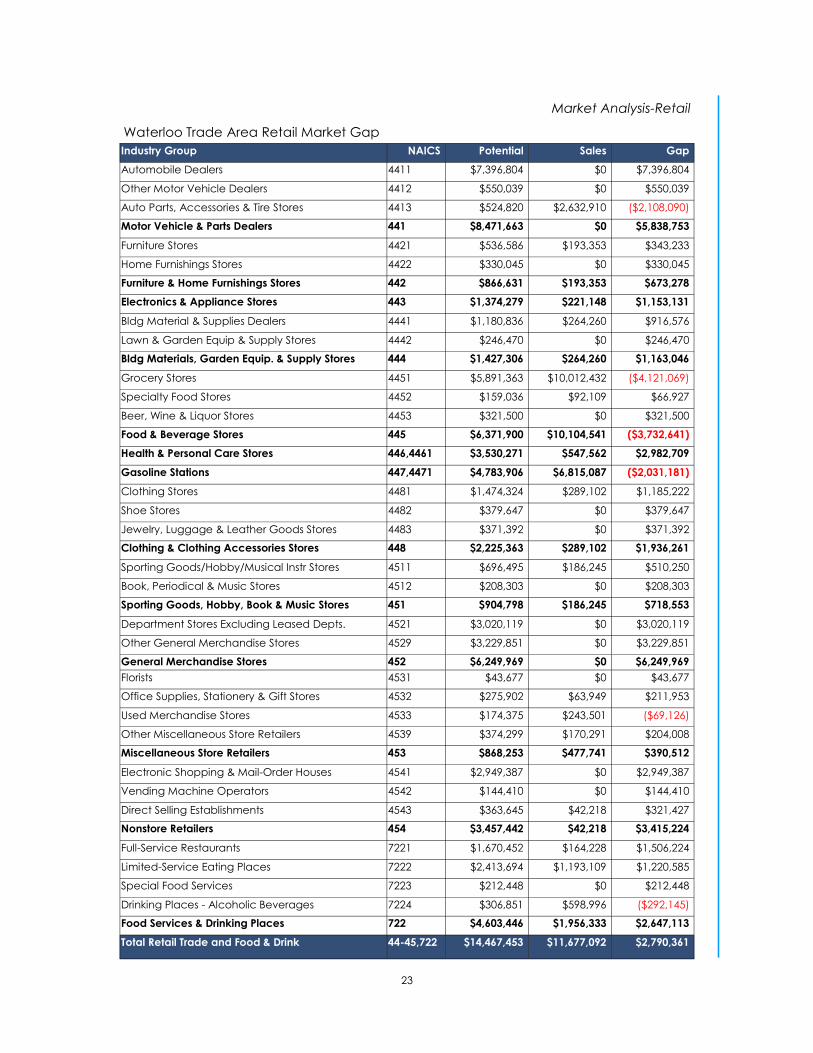
The table on page 23 highlights the City’s
ability to support retail establishments
based on local demand alone. The
presence of a supply gap is a potential
indicator that additional retailers could be
supported in the area. These calculations
were based on information from the
demographic firm Esri. The columns in the
table indicate the existing retail demand,
supply (current sales), and the surplus
demand available within each category .
Based on current spending patterns, it
appears that retail business recruitment or
expansion opportunities exist for health &
personal care stores, building material and
supply dealers, clothing stores, sporting
goods and hobby stores, electronics &
appliance stores, general merchandise
stores, department stores, electronic
shopping & mail order houses, and full–
service and limited-service eating places.
Realistically, many of these categories are
going to be served by the larger nearby
trade centers.
Additional opportunities, albeit with smaller
leakage factors (a measure of the portion
of potential sales being met outside the
community), include furniture and home
furnishings stores, lawn and garden
equipment stores, shoe and jewelry stores,
book and music stores, vending machine
operators, and other specialty food
services. Retailers in several of these sectors
are often locally owned and operated in
small and medium-sized communities,
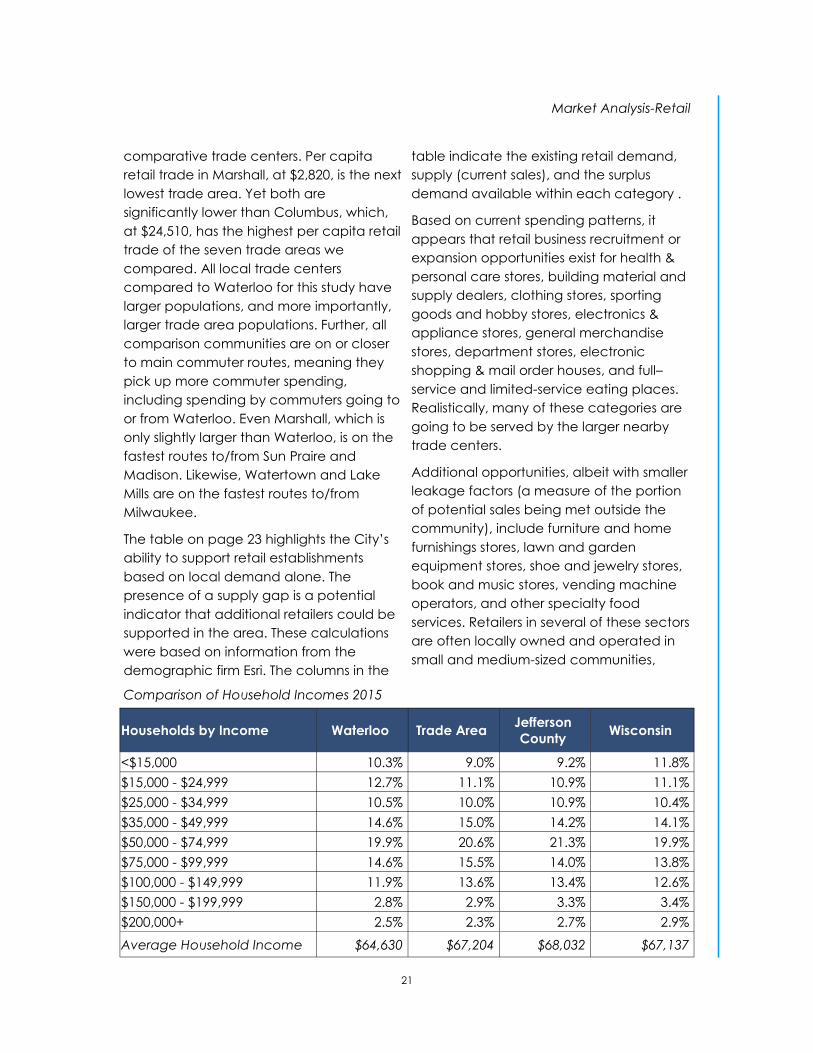
Comparison of Household Incomes 2015
Households by Income Waterloo Trade Area Jefferson
County Wisconsin
<$15,000 10.3% 9.0% 9.2% 11.8%
$15,000 - $24,999 12.7% 11.1% 10.9% 11.1%
$25,000 - $34,999 10.5% 10.0% 10.9% 10.4%
$35,000 - $49,999 14.6% 15.0% 14.2% 14.1%
$50,000 - $74,999 19.9% 20.6% 21.3% 19.9%
$75,000 - $99,999 14.6% 15.5% 14.0% 13.8%
$100,000 - $149,999 11.9% 13.6% 13.4% 12.6%
$150,000 - $199,999 2.8% 2.9% 3.3% 3.4%
$200,000+ 2.5% 2.3% 2.7% 2.9%
Average Household Income $64,630 $67,204 $68,032 $67,137

22
Market Analysis-Retail
although in some cases, regional or
national brands will locate in such
communities, depending on traffic counts
and population base.
Opportunities may exist
for other sectors if these
establishments are able
to target a specific
underserved niche
market or strategic
location. This could be
especially important
given Waterloo’s outdoor activity and
lifestyle advantages, particularly within the
bicycling industry.
Waterloo will be challenged to attract new
retail businesses in many of the
aforementioned specialties due to the slow
decline in population. Although the data
suggests that there is a retail gap in several
areas, it must be a priority of the City to
attract additional residents to Waterloo
before new retail business owners are likely
to be comfortable with taking a risk to
locate in Waterloo.
Other smaller surplus categories present
opportunities for existing retailers to
expand their product line to
accommodate specific needs. For
instance, existing sporting goods stores
may be able to provide a more diversified
product mix to attract customers seeking
bicycles or canoes, or existing building
supply retailers may be able to add
gardening products to capture currently
unmet demand in the home and garden
sector. Other sectors are less likely to be
competitive locally – for instance,
electronics purchases will primarily still be
made in big box stores in larger
communities where greater opportunities
for comparison shopping are available.
Drawing on existing community strengths
and its position as a regional government
hub, there is an
opportunity to capture
additional sales by
providing goods and
services that address
currently unmet retail
demand within the trade
area. The table on the
preceding page
highlights sectors in the retail trade area
that exhibit either substantial unmet retail
demand or a high portion of local demand
is being met elsewhere, indicating an
ability to support retail establishments
based on local demand alone. The first
column indicates the sectors with unmet
demand. The second column is the
demonstrated retail demand gap, the
difference between the demand of the
area and the sales in those sectors. The
gap column shows the value of potential
sales being met outside the community. It
should be noted that the establishment or
attraction of entirely new businesses is not
the only way to meet unmet demand;
existing businesses in those segments
exhibiting surplus demand may be
encouraged to expand to meet that
demand.
One business expansion and recruitment
strategy is to focus on complementary
products or services in sectors where
Waterloo is already drawing an amount of
secondary spending, although a significant
gap may not exist locally. Based on
spending patterns, Waterloo attracts the
largest external spending in the categories
of grocery stores, gas stations, used
merchandise stores, and drinking places.
Preference for a craft brew pub
and restaurant has been
mentioned repeatedly by local
residents. The retail analysis data
supports this, with a large gap
identified in the full-service
restaurants category.
23
Market Analysis-Retail
Waterloo Trade Area Retail Market Gap
Industry Group NAICS Potential Sales Gap
Automobile Dealers 4411 $7,396,804 $0 $7,396,804
Other Motor Vehicle Dealers 4412 $550,039 $0 $550,039
Auto Parts, Accessories & Tire Stores 4413 $524,820 $2,632,910 ($2,108,090)
Motor Vehicle & Parts Dealers 441 $8,471,663 $0 $5,838,753
Furniture Stores 4421 $536,586 $193,353 $343,233
Home Furnishings Stores 4422 $330,045 $0 $330,045
Furniture & Home Furnishings Stores 442 $866,631 $193,353 $673,278
Electronics & Appliance Stores 443 $1,374,279 $221,148 $1,153,131
Bldg Material & Supplies Dealers 4441 $1,180,836 $264,260 $916,576
Lawn & Garden Equip & Supply Stores 4442 $246,470 $0 $246,470
Bldg Materials, Garden Equip. & Supply Stores 444 $1,427,306 $264,260 $1,163,046
Grocery Stores 4451 $5,891,363 $10,012,432 ($4,121,069)
Specialty Food Stores 4452 $159,036 $92,109 $66,927
Beer, Wine & Liquor Stores 4453 $321,500 $0 $321,500
Food & Beverage Stores 445 $6,371,900 $10,104,541 ($3,732,641)
Health & Personal Care Stores 446,4461 $3,530,271 $547,562 $2,982,709
Gasoline Stations 447,4471 $4,783,906 $6,815,087 ($2,031,181)
Clothing Stores 4481 $1,474,324 $289,102 $1,185,222
Shoe Stores 4482 $379,647 $0 $379,647
Jewelry, Luggage & Leather Goods Stores 4483 $371,392 $0 $371,392
Clothing & Clothing Accessories Stores 448 $2,225,363 $289,102 $1,936,261
Sporting Goods/Hobby/Musical Instr Stores 4511 $696,495 $186,245 $510,250
Book, Periodical & Music Stores 4512 $208,303 $0 $208,303
Sporting Goods, Hobby, Book & Music Stores 451 $904,798 $186,245 $718,553
Department Stores Excluding Leased Depts. 4521 $3,020,119 $0 $3,020,119
Other General Merchandise Stores 4529 $3,229,851 $0 $3,229,851
General Merchandise Stores 452 $6,249,969 $0 $6,249,969
Florists 4531 $43,677 $0 $43,677
Office Supplies, Stationery & Gift Stores 4532 $275,902 $63,949 $211,953
Used Merchandise Stores 4533 $174,375 $243,501 ($69,126)
Other Miscellaneous Store Retailers 4539 $374,299 $170,291 $204,008
Miscellaneous Store Retailers 453 $868,253 $477,741 $390,512
Electronic Shopping & Mail-Order Houses 4541 $2,949,387 $0 $2,949,387
Vending Machine Operators 4542 $144,410 $0 $144,410
Direct Selling Establishments 4543 $363,645 $42,218 $321,427
Nonstore Retailers 454 $3,457,442 $42,218 $3,415,224
Full-Service Restaurants 7221 $1,670,452 $164,228 $1,506,224
Limited-Service Eating Places 7222 $2,413,694 $1,193,109 $1,220,585
Special Food Services 7223 $212,448 $0 $212,448
Drinking Places - Alcoholic Beverages 7224 $306,851 $598,996 ($292,145)
Food Services & Drinking Places 722 $4,603,446 $1,956,333 $2,647,113
Total Retail Trade and Food & Drink 44-45,722 $14,467,453 $11,677,092 $2,790,361
24
Some degree of clustering in these and
complementary sectors may be pursued in
Waterloo, with a specific focus on better
drinking and restaurant options being of
particular appeal to the community,
based on citizen input and feedback.
Businesses like automotive dealers and
electronics retailers will remain
concentrated in areas closer to Madison or
Milwaukee which can offer comparison
shopping for large ticket purchases.
Opportunities may exist for other sectors if
these establishments are able to target a
specific underserved niche market or
strategic location. (eg. a restaurant with a
patio on the river or a bicycle store near
the bicycle path). Another smaller surplus
category, used merchandise stores,
presents an opportunity for existing retailers
to expand their product line to
accommodate specific needs.
Additionally, many retail store types will
incorporate various line items in the store,
which minimizes the amount of capture
needed for a specific item (i.e., book stores
which also have a coffee bar, etc).
In many communities, the local workforce
plays a significant role in supporting local
business through daytime or business
spending. Because of the limited ability for
workers to travel during lunch, this primary
workforce market is generally limited to
employees working outside the home
within 2 miles. Commuters also represent a
potential source of revenue pre- and post-
work. This population includes an
estimated 1,611 individuals. Studies have
found that, on average, rural professional
workers spend about $145 week including
almost $45 on commuting (gas and
maintenance), and about $100 on lunch,
personal errands (pharmacy, shopping),
and convenience purchases (grocery,
coffee). Manufacturing and retail/
hospitality workers spend 10-15 percent less
as a result of non-traditional work hours
and more limited workplace flexibility.
Combined, these markets represent
approximately $7,200,000 in consumer
demand. While this market is beneficial to
local businesses, especially gas stations,
and to a lesser extend restaurants, the
added customer volume is not sufficient to
offset the limited market potential
indicated because many of the categories
of worker demand do not correspond
either to existing businesses in Waterloo, or
to retail opportunities from the existing
residents.
There are several factors Waterloo could
consider in order to capture the maximum
amount of commuter expenditures. The
agglomeration of comparison shopping
stores can create a critical mass of retail
activity. Location on key commuting routes
and clear visibility of the businesses create
top of mind awareness for commuters. As
noted before, many commuters are routed
through Marshall and Lake Mills. Awareness
of the opportunities in Waterloo is
important to keep sales from leaking to
these other communities. Business hours
during primary commuting hours and
conveniences like drive-through windows
and well-placed parking make patronizing
businesses very easy for commuters. And
again, the critical mass of other businesses
will make a stop more convenient for the
commuter. Because of competition from
communities in or near Waterloo’s trade
area is considerable, finding ways to pool
resources and share the cost of marketing
among multiple retailers may make
Waterloo businesses more competitive.
Market Analysis-Retail
25
Market Analysis-Retail
Examples might include a joint ad buy,
shared radio purchase with wraparound
tagline, or joint billboard purchase.
There is potential for increased consumer
spending capture in the City as a result of
extra-regional traffic. This may require
adjusting operating or event hours to
coordinate with seasonal patterns. For
example, with its perceived connection to
Trek Bicycle Corporation, the City could
work with retailers and business owners to
promote the lifestyle and recreational
advantages that can be found in
Waterloo.
26
Commercial, Office, Industrial Market Analysis
This section of the market analysis includes
an assessment of the local commercial
and professional office sectors for
Waterloo. The availability of suitable land
and real estate has a significant impact on
the ability of businesses to grow and
expand in a community.
The Eastside Business Park is a light industrial
park development along Hwy 19 heading
northeast from the City. Phase 1 was
completed in the mid-1990s and is now
fully absorbed. Phase 2 of the
development will extend the business park
to the north of Phase 1. This property is in
TID#3 and will be developed once there is
sufficient interest to warrant the investment
in infrastructure. The City is willing to work
with businesses to provide an incentive to
locate in this industrial park.
In 2013, TID#4 was created as a mixed use
commercial and residential district to the
north of the high school at the intersection
of N. Monroe Street and W. Clarkson Road.
It comprises roughly 40 acres of
developable land on the west side of N.
Monroe Street. To date, there has not been
any development of this property.
Commercial development is unlikely to
begin without the addition of several
residential units within the TID. On the east
side of N. Monroe Street a Dollar General
store was recently developed, which did
not require TIF assistance. It has added a
direct increment to the district.
In Waterloo, much of the existing industrial
space is located along STH 19 on the west
and east entrances of the City and along
the rail corridor, while retail is clustered
downtown or along the major
throughways. Several vacant commercial
and industrial buildings and parcels (listed
in the exhibit on this page) can be
redeveloped.
It had been previously noted that there is a
significant amount of excess unused retail
space in downtown Waterloo. Because of
larger trends toward superstores and online
shopping, the amount of space required
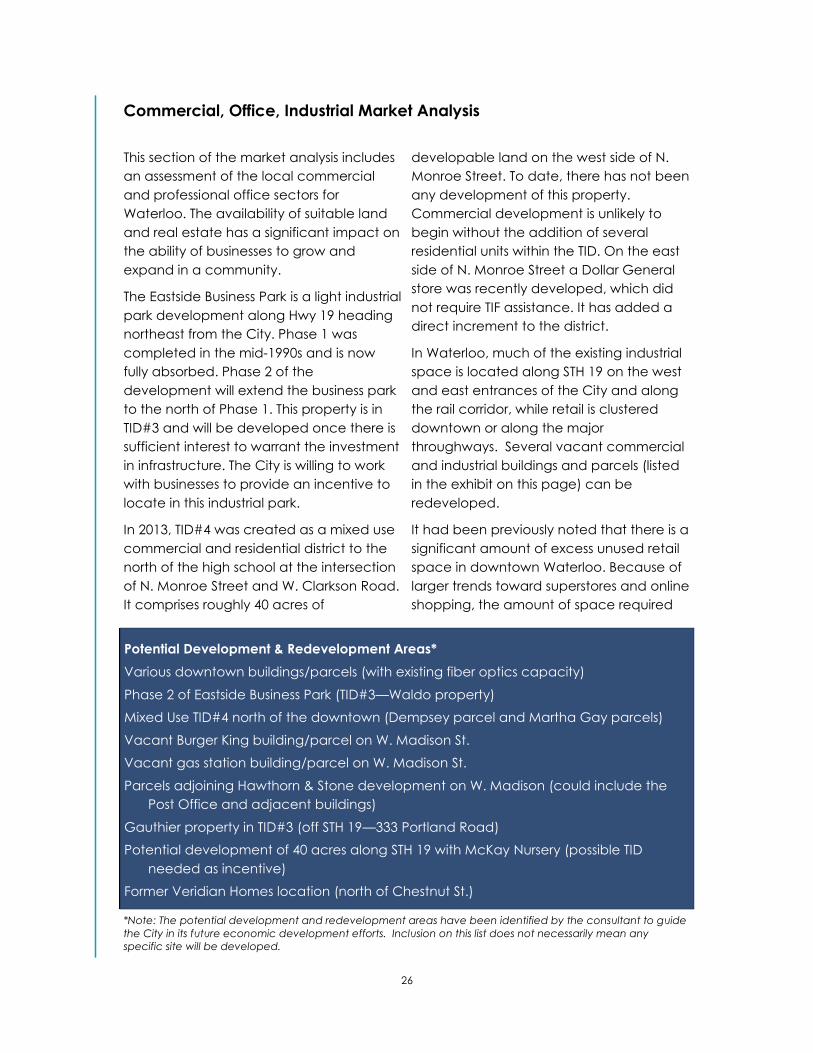
Potential Development & Redevelopment Areas*
Various downtown buildings/parcels (with existing fiber optics capacity)
Phase 2 of Eastside Business Park (TID#3—Waldo property)
Mixed Use TID#4 north of the downtown (Dempsey parcel and Martha Gay parcels)
Vacant Burger King building/parcel on W. Madison St.
Vacant gas station building/parcel on W. Madison St.
Parcels adjoining Hawthorn & Stone development on W. Madison (could include the
Post Office and adjacent buildings)
Gauthier property in TID#3 (off STH 19—333 Portland Road)
Potential development of 40 acres along STH 19 with McKay Nursery (possible TID
needed as incentive)
Former Veridian Homes location (north of Chestnut St.)
*Note: The potential development and redevelopment areas have been identified by the consultant to guide
the City in its future economic development efforts. Inclusion on this list does not necessarily mean any
specific site will be developed.

27
by retail businesses has been steadily
declining. More sales per square foot are
now expected and required for a business
to thrive, so retail businesses have been
trending toward smaller footprints with
more intense use.
In contrast to the industrial and retail
sectors, there are no specific industry
classifications which correspond to the
need for professional office space, but
rather a number of classifications which
may hint at potential needs for office
space. Commercial office uses have
historically been associated with upper
floor commercial spaces and/or non-
storefront first floor space, and
continue to occupy such spaces.
However, as consumer needs have
shifted from a downtown-centered
model to a more regional trade area,
downtown storefront use has shifted.
Notably, professional service tenants
have found that first floor storefront
spaces provide greater visibility,
marketing and customer
convenience. The availability of
former retail space in downtown
Waterloo makes this new trend a
possibility for the City. It should be
noted also that office spaces are
following the same trend toward
smaller footprints that are occurring in
the retail sector.
The Waterloo Tech Center (the former
headquarters of Perry Printing) on W.
Madison Street, currently has 30,000
SF of office and R&D space available
for lease.
The charts shown on this page
enumerate the number of businesses
and employees in 2015 in the City of
Waterloo in those business sectors typically
requiring commercial office space. Data is
provided using two separate industry
classification systems to best capture the
total commercial office space needs, as
the ways businesses are counted and
reported vary from system to system.
However, using both classification systems
allows us to determine with some certainty
that there are approximately 70 businesses
employing between 390 and 480
employees in Waterloo that require
commercial office space.
Sector (NAICS) Businesses Employees
Information 1 5
Central Bank/Credit Intermediation
& Related Activities 13 14
Securities, Commodity Contracts &
Other Financial Investments 1 40
Insurance Carriers & Related
Activities; Funds, Trusts 4 8
Real Estate, Rental & Leasing 6 13
Professional, Scientific & Tech
Services
7 27
Management of Companies &
Enterprises 2 2
Administrative & Support 5 90
Health Care & Social Assistance 13 110
Other Services (except Public
Administration) 17 27
Public Administration 7 152
Total 76 488
Commercial Sectors Requiring Office Space
Sector (SIC) Businesses Employees
Banks, Savings & Lending Institutions 13 14
Securities Brokers 1 40
Insurance Carriers & Agents 4 8
Real Estate, Holding, Other
Investment Offices 7 17
Health Services 9 52
Legal Services 2 5
Other Services 23 163
Government 6 87
Total 65 386
Market Analysis-Commercial, Office, Industrial
28
Market Analysis-Shift-Share Analysis
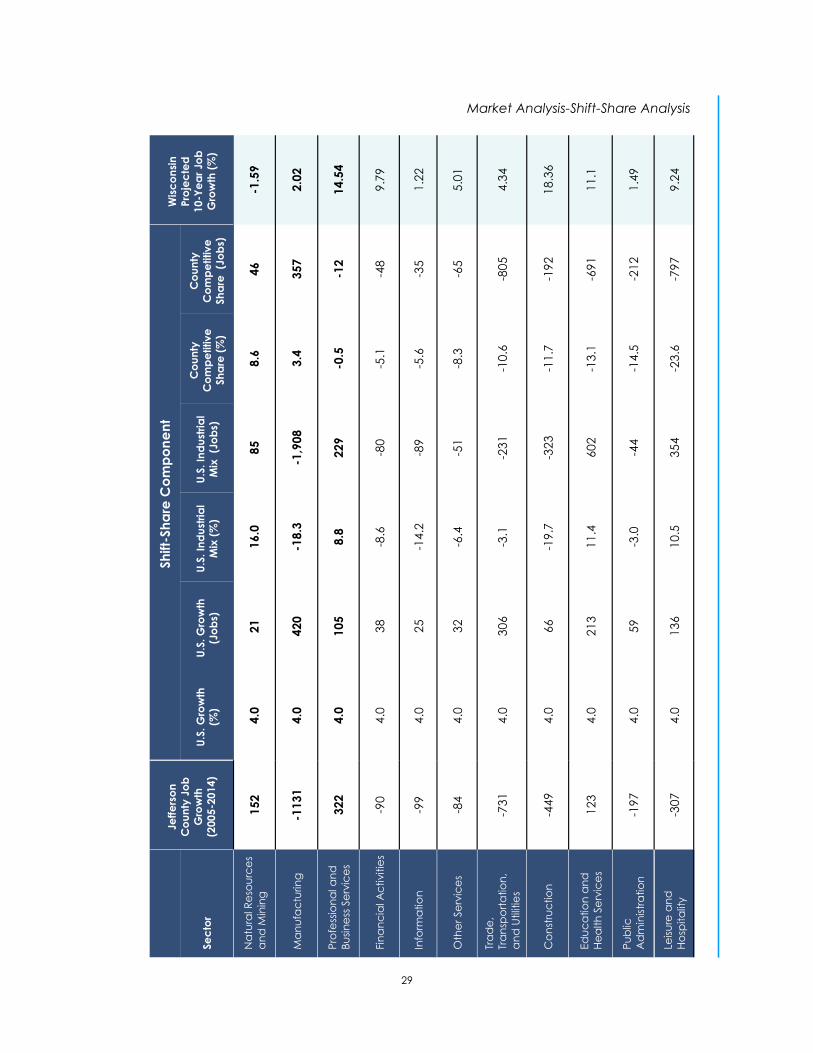
Shift-Share Analysis
Shift share is a standard regional analysis
method that attempts to determine how
much of regional job growth can be
attributed to national trends and how
much is due to unique regional factors.
National Growth—During the time period
2005 to 2014, the nation's employment
grew by 4 percent, which equates to 152
jobs in the Natural Resources and Mining
sector in Jefferson County.
Industrial Mix—Measures how well an
industry has grown, net of effects from the
business cycle. During this same period, the
Natural Resources and Mining industry has
grown 16 percent nationally.
Competitive Share—Is the remaining
employment change that is left over after
accounting for the national and industrial
mix components. If a sector's competitive
share is positive, then the sector has a local
advantage in promoting employment
growth. Jefferson County had a relative
advantage in Natural Resources and
Mining jobs from 2005-2014.
Using national and county data we can
make some assumptions and projections
for sector opportunities in Waterloo.
The table on the following page
summarizes the change in jobs for
Jefferson County between 2005-2014. It
then decomposes the change in
employment in Jefferson County into three
components that caused the change, US
growth, growth or decline in the industry at
a national level and then the comparative
advantage the county has in that industry.
Projections for job growth in Wisconsin can
then be used to identify which industries
hold the greatest potential as a whole.
Jefferson County’s historical advantage in
manufacturing suggests that the local
economy has bucked the national trend of
significant decline. Waterloo has likely
experienced similar success to the County
in manufacturing and, although the
projected growth is limited in Wisconsin,
the local advantage could continue to
work in Waterloo’s favor. Similarly,
agriculture (found in the natural resources
and mining category) has been a key
contributor in the local region. Even
though Wisconsin’s job growth is projected
to decline in the next few years, the
national and industry trends have shown
strong growth. The third category that
could offer opportunity for Waterloo is
professional and business services. The
strong projected job growth coupled with
the flexibility to serve clients of this industry
from a variety a locations, such as
Waterloo, could offer a niche marketing
option for the City. Particularly when
combined with the readily available retail/
office space with fiber optic capacity and
the desirable lifestyle found in Waterloo.
29
Sh
ift-
Sh
are
Co
mp
on
en
t
Wis
co
nsi
n
Pro
jec
ted
10
-Ye
ar
Job
Gro
wth
(%
)
Je
ffe
rso
n
Co
un
ty J
ob
Gro
wth
(200
5-2
014
) Se
cto
r U
.S. G
row
th
(%)
U.S
. G
row
th
(Jo
bs)
U.S
. In
du
stria
l
Mix
(%
)
U.S
. In
du
stria
l
Mix
(J
ob
s)
Co
un
ty
Co
mp
etitiv
e
Sh
are
(%
)
Co
un
ty
Co
mp
etitiv
e
Sh
are
(J
ob
s)
Na
tura
l Re
sou
rce
s
an
d M
inin
g
152
4.0
2
1
16
.0
85
8.6
46
-1
.59
Ma
nu
fac
turin
g
-1131
4.0
4
20
-18
.3
-1,9
08
3.4
357
2.0
2
Pro
fess
ion
al a
nd
Bu
sin
ess
Se
rvic
es
322
4.0
1
05
8.8
2
29
-0
.5
-12
14.5
4
Fin
an
cia
l A
ctivitie
s -9
0
4.0
3
8
-8.6
-8
0
-5.1
-4
8
9.7
9
Info
rma
tio
n
-99
4.0
2
5
-14
.2
-89
-5.6
-3
5
1.2
2
Oth
er
Se
rvic
es
-84
4.0
3
2
-6.4
-5
1
-8.3
-6
5
5.0
1
Tra
de
,
Tra
nsp
ort
atio
n,
an
d U
tilit
ies
-73
1
4.0
3
06
-3.1
-2
31
-10
.6
-80
5
4.3
4
Co
nst
ruc
tio
n
-44
9
4.0
6
6
-19
.7
-32
3
-11
.7
-19
2
18
.36
Ed
uc
atio
n a
nd
He
alth
Se
rvic
es
12
3
4.0
2
13
11
.4
60
2
-13
.1
-69
1
11
.1
Pu
blic
Ad
min
istr
atio
n
-19
7
4.0
5
9
-3.0
-4
4
-14
.5
-21
2
1.4
9
Leis
ure
an
d
Ho
spita
lity
-30
7
4.0
1
36
10
.5
35
4
-23
.6
-79
7
9.2
4
Market Analysis-Shift-Share Analysis

30
Waterloo’s industry mix includes a
significant concentration of construction,
manufacturing, retail trade. The pie charts
on this and the following page show the
proportion of jobs in ten top-level NAICS
sectors in the City and the laborshed.
Some industries are not likely to locate in
the community because of a need for
proximity to other businesses or customer
populations. However, other clusters, or
specific industries within those clusters
represented by the local workforce may
represent recruitment targets. In all cases,
suitable real estate would need to be
available locally to accommodate these
industries, and recruitment of other target
sectors may require additional amenities or
infrastructure (i.e. high speed internet,
shared work space to accommodate
satellite offices, etc). Unemployment within
Waterloo, 5.5%, is higher than 3.9% in
Jefferson County and 4.4%in Wisconsin.
Waterloo is over-represented, when
compared to the state of Wisconsin, in the
sectors of agriculture/mining, wholesale
trade, transportation/utilities and finance/
insurance/real estate. In all of these
sectors, Waterloo hosts at least 25% more
jobs than would be expected according
to the average distribution of
jobs across these sectors for the
State as a whole.
Many communities strive to
match local commercial
opportunities to the skills of the
available workforce. Residents
benefit from more convenient
employment opportunities and
as a result spend more time and
money in the community.
Simultaneously, employers
benefit from locating in
proximity to an existing trained
workforce. Employers in
Waterloo will need to be
competitive not just with the
Marshall, Lake Mills, and
Watertown markets for wages,
but also with the Madison and
Milwaukee metro areas.
However, the time and cost
savings from reduced
commuting may entice some
workers even at a slight
reduction in pay. For example,
the cost of commuting daily to
Employment by Industry—City
Employment by Industry—Laborshed
Workforce Profile
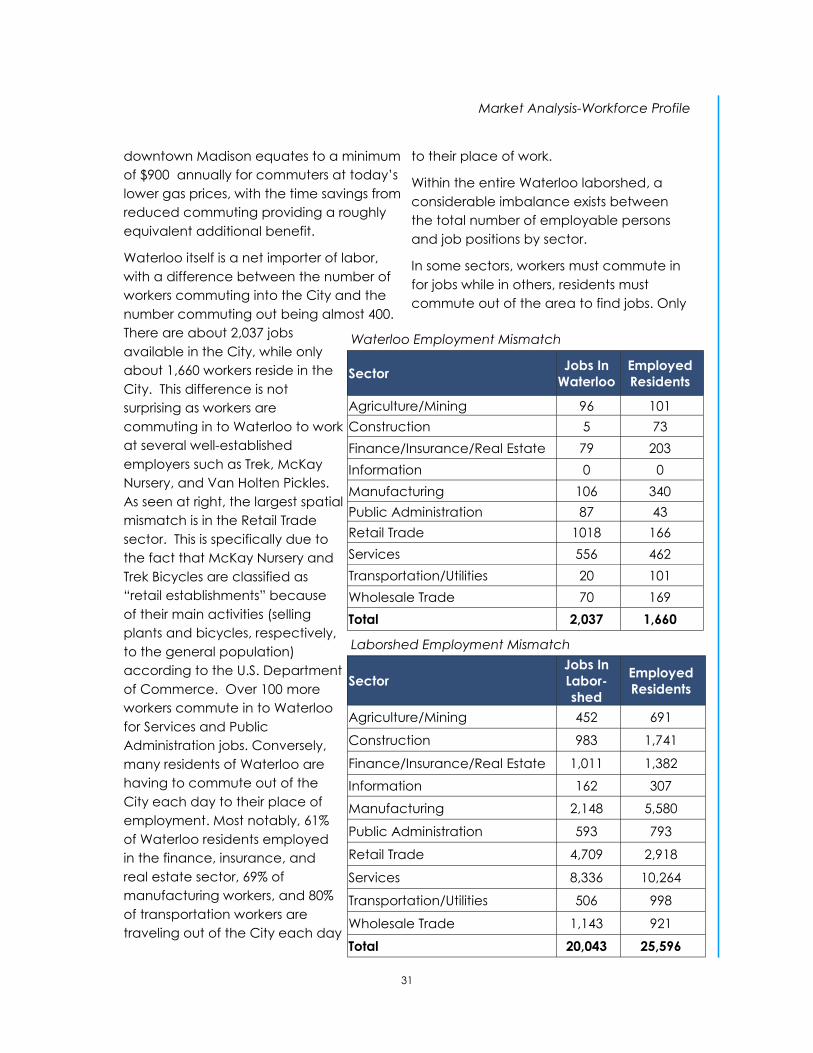
31
Market Analysis-Workforce Profile
downtown Madison equates to a minimum
of $900 annually for commuters at today’s
lower gas prices, with the time savings from
reduced commuting providing a roughly
equivalent additional benefit.
Waterloo itself is a net importer of labor,
with a difference between the number of
workers commuting into the City and the
number commuting out being almost 400.
There are about 2,037 jobs
available in the City, while only
about 1,660 workers reside in the
City. This difference is not
surprising as workers are
commuting in to Waterloo to work
at several well-established
employers such as Trek, McKay
Nursery, and Van Holten Pickles.
As seen at right, the largest spatial
mismatch is in the Retail Trade
sector. This is specifically due to
the fact that McKay Nursery and
Trek Bicycles are classified as
“retail establishments” because
of their main activities (selling
plants and bicycles, respectively,
to the general population)
according to the U.S. Department
of Commerce. Over 100 more
workers commute in to Waterloo
for Services and Public
Administration jobs. Conversely,
many residents of Waterloo are
having to commute out of the
City each day to their place of
employment. Most notably, 61%
of Waterloo residents employed
in the finance, insurance, and
real estate sector, 69% of
manufacturing workers, and 80%
of transportation workers are
traveling out of the City each day
to their place of work.
Within the entire Waterloo laborshed, a
considerable imbalance exists between
the total number of employable persons
and job positions by sector.
In some sectors, workers must commute in
for jobs while in others, residents must
commute out of the area to find jobs. Only
Sector
Jobs In
Labor-
shed
Employed
Residents
Agriculture/Mining 452 691
Construction 983 1,741
Finance/Insurance/Real Estate 1,011 1,382
Information 162 307
Manufacturing 2,148 5,580
Public Administration 593 793
Retail Trade 4,709 2,918
Services 8,336 10,264
Transportation/Utilities 506 998
Wholesale Trade 1,143 921
Total 20,043 25,596
Laborshed Employment Mismatch
Waterloo Employment Mismatch
Sector Jobs In
Waterloo
Employed
Residents
Agriculture/Mining 96 101
Construction 5 73
Finance/Insurance/Real Estate 79 203
Information 0 0
Manufacturing 106 340
Public Administration 87 43
Retail Trade 1018 166
Services 556 462
Transportation/Utilities 20 101
Wholesale Trade 70 169
Total 2,037 1,660
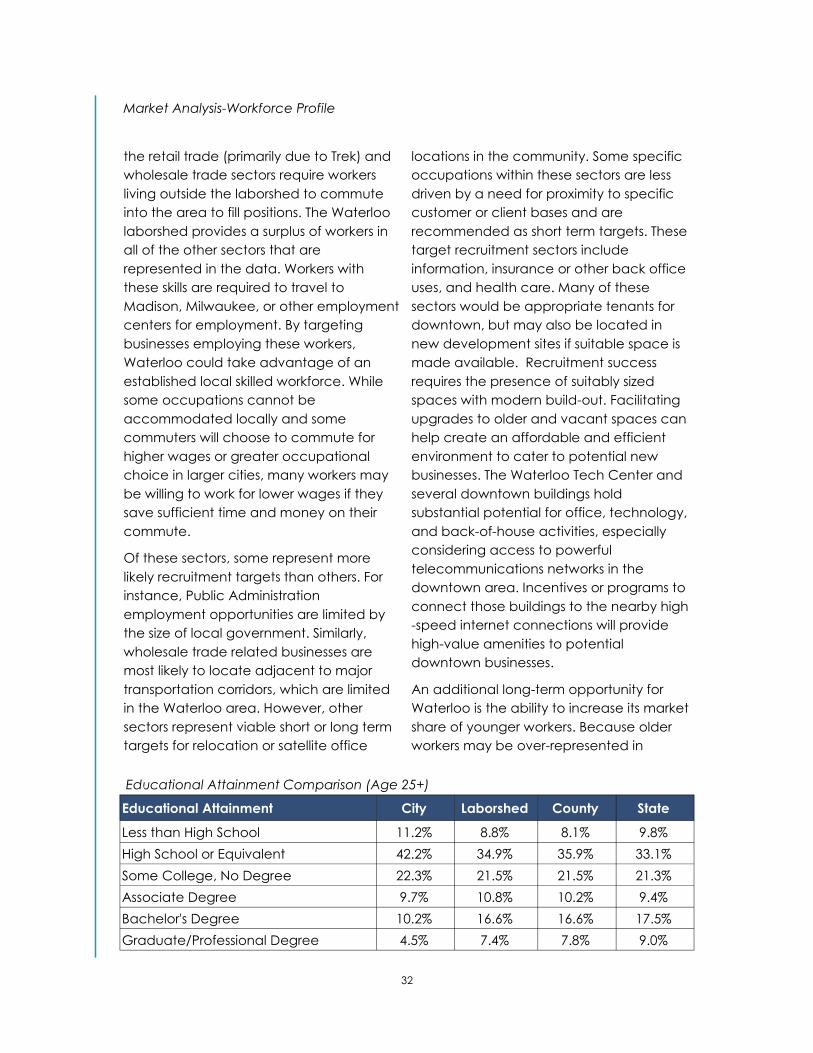
32
the retail trade (primarily due to Trek) and
wholesale trade sectors require workers
living outside the laborshed to commute
into the area to fill positions. The Waterloo
laborshed provides a surplus of workers in
all of the other sectors that are
represented in the data. Workers with
these skills are required to travel to
Madison, Milwaukee, or other employment
centers for employment. By targeting
businesses employing these workers,
Waterloo could take advantage of an
established local skilled workforce. While
some occupations cannot be
accommodated locally and some
commuters will choose to commute for
higher wages or greater occupational
choice in larger cities, many workers may
be willing to work for lower wages if they
save sufficient time and money on their
commute.
Of these sectors, some represent more
likely recruitment targets than others. For
instance, Public Administration
employment opportunities are limited by
the size of local government. Similarly,
wholesale trade related businesses are
most likely to locate adjacent to major
transportation corridors, which are limited
in the Waterloo area. However, other
sectors represent viable short or long term
targets for relocation or satellite office
locations in the community. Some specific
occupations within these sectors are less
driven by a need for proximity to specific
customer or client bases and are
recommended as short term targets. These
target recruitment sectors include
information, insurance or other back office
uses, and health care. Many of these
sectors would be appropriate tenants for
downtown, but may also be located in
new development sites if suitable space is
made available. Recruitment success
requires the presence of suitably sized
spaces with modern build-out. Facilitating
upgrades to older and vacant spaces can
help create an affordable and efficient
environment to cater to potential new
businesses. The Waterloo Tech Center and
several downtown buildings hold
substantial potential for office, technology,
and back-of-house activities, especially
considering access to powerful
telecommunications networks in the
downtown area. Incentives or programs to
connect those buildings to the nearby high
-speed internet connections will provide
high-value amenities to potential
downtown businesses.
An additional long-term opportunity for
Waterloo is the ability to increase its market
share of younger workers. Because older
workers may be over-represented in
Educational Attainment Comparison (Age 25+)
Educational Attainment City Laborshed County State
Less than High School 11.2% 8.8% 8.1% 9.8%
High School or Equivalent 42.2% 34.9% 35.9% 33.1%
Some College, No Degree 22.3% 21.5% 21.5% 21.3%
Associate Degree 9.7% 10.8% 10.2% 9.4%
Bachelor's Degree 10.2% 16.6% 16.6% 17.5%
Graduate/Professional Degree 4.5% 7.4% 7.8% 9.0%
Market Analysis-Workforce Profile

33
certain sectors, issues of retirements,
closings, and business succession planning
should be factored into any retention and
expansion strategy. Facilitating the
transition of ownership in these businesses
to the next generation of entrepreneurs will
help retain these local services and create
additional employment opportunities
which appeal to entrepreneurial-minded
individuals. The ability to work with
businesses to facilitate this transition and
retain these locally owned and operated
establishments can help foster a local
culture of entrepreneurialism and create
opportunities for local partnerships.
Market Analysis-Workforce Profile
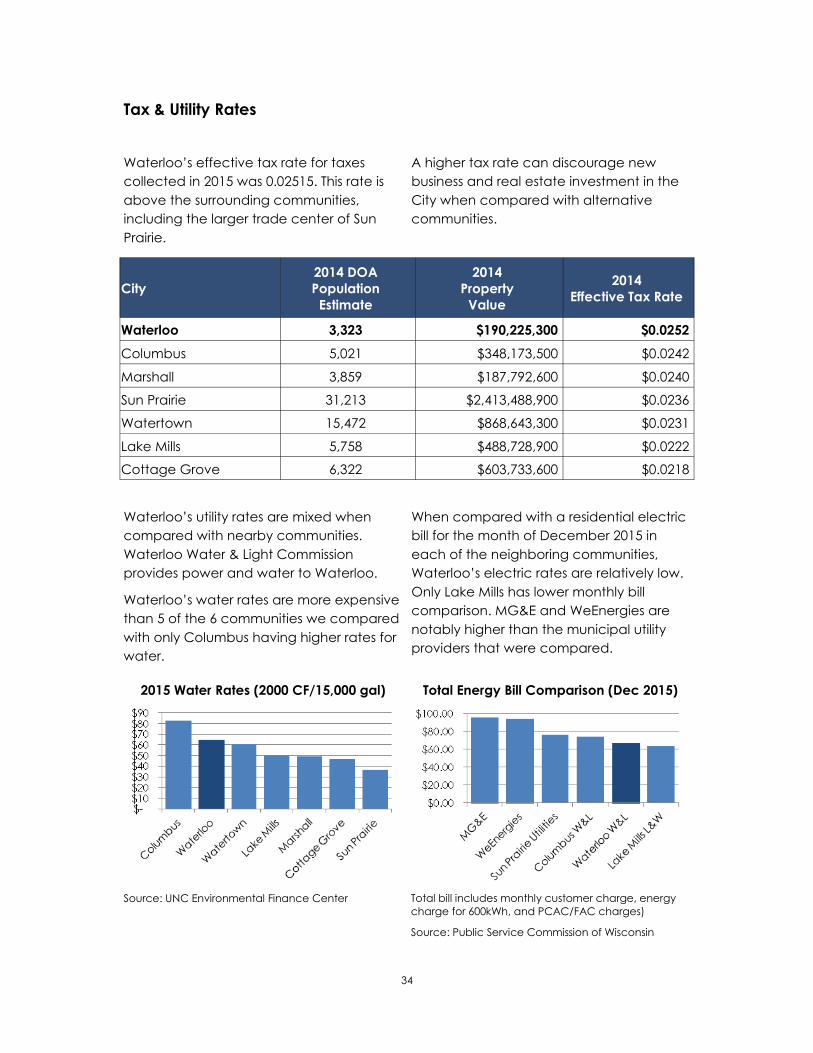
34
Tax & Utility Rates
Waterloo’s effective tax rate for taxes
collected in 2015 was 0.02515. This rate is
above the surrounding communities,
including the larger trade center of Sun
Prairie.
A higher tax rate can discourage new
business and real estate investment in the
City when compared with alternative
communities.
Waterloo’s utility rates are mixed when
compared with nearby communities.
Waterloo Water & Light Commission
provides power and water to Waterloo.
Waterloo’s water rates are more expensive
than 5 of the 6 communities we compared
with only Columbus having higher rates for
water.
When compared with a residential electric
bill for the month of December 2015 in
each of the neighboring communities,
Waterloo’s electric rates are relatively low.
Only Lake Mills has lower monthly bill
comparison. MG&E and WeEnergies are
notably higher than the municipal utility
providers that were compared.
Total Energy Bill Comparison (Dec 2015)
Total bill includes monthly customer charge, energy
charge for 600kWh, and PCAC/FAC charges)
Source: Public Service Commission of Wisconsin
2015 Water Rates (2000 CF/15,000 gal)
Source: UNC Environmental Finance Center
City
2014 DOA
Population
Estimate
2014
Property
Value
2014
Effective Tax Rate
Waterloo 3,323 $190,225,300 $0.0252
Columbus 5,021 $348,173,500 $0.0242
Marshall 3,859 $187,792,600 $0.0240
Sun Prairie 31,213 $2,413,488,900 $0.0236
Watertown 15,472 $868,643,300 $0.0231
Lake Mills 5,758 $488,728,900 $0.0222
Cottage Grove 6,322 $603,733,600 $0.0218

35