classification of texture
TRANSCRIPT

1
TEXTURE CLASSIFICATION
BASED ON BIOTAC FINGER
COLLOQUIUM REPORT
(BEC450)
Submitted By:
RAHUL KUMAR (2012BB50034)

2
SUMMER INTERNSHIP
ORGANISATION:
MENTORS:
Sliman Bensmaia, PhD Principal Investigator
Benoit Delhaye, PhD Postdoc Scholar

3
Content
Page 1. Abstract ……………………………………………………………………… 4
2. Introduction ……………………………………………………………….. 4
3. Material and Method…………………………………………………... 7
4. Data Analysis ………………………………………………………………. 10
5. Results and Discussion ………………………………………………… 15
6. Conclusion …………………………………………………………………… 22
7. Reference ……………………………………………………………………. 22

4
1. Abstract
Our ability to discriminate and perceive textures depends upon the signal transduction
and processing that are elicited while scanning the texture. These signals are very
complex and high-frequency vibrations that are generated on the fingertips. The signal
processing inside our brain is not known exactly. Biological human finger is a fantastic
tactile sensor which having ability to differentiate between wide range of textures varying
in different physical properties. But how close is the best artificial finger available to the
human finger? I have compared the textures based on signal generated from the artificial
fingertip, BioTac finger, and then examined how close the result is to the actual perceived
features. The effect of fingerprint using artificial finger has been studied in detail. From
the study, I conclude that some textures are sensitive to the presence of fingerprint while
others are insensitive and the sensitivity depends on various physical properties of the
texture.
2. Introduction
Please pause for few minutes and look at the different clothes (say jeans and t-shirt) you
are wearing or if not at different objects having different textured surface. Now close your
eyes and run your finger (index finger is best choice!) over the clothes/objects or in other
words, scan the different textures. Do you feel the difference while running on different
clothes/objects? How you are able to tell the difference between qualities/types of
clothes? How you get the message that your t-shirt is made of cotton (say) while jeans of
denim (say)? Think for a moment or go on if you don’t want to think!

5
So, when we scan our finger across a textured surface, vibration is elicited on the fingertip
that is used for scanning, which is often complex and have high frequency. These
vibrations generate signal carrying the information about the textured surface that we
have scanned. The signal is made up of many different frequencies and the frequency
content of the vibration can be unique depending on the scanned texture, scanning speed
and different many parameters. Our ability to distinguish the surface micro- geometry
and related features depends on the transduction and processing of these vibrations [1].
The frequency content can be easily revealed by taking the Fourier transform of the time
domain signal. The vibration elicited depends on different parameters, some of which are:
a. Geometry of texture: Geometry of the texture on macro level (coarse structure) and micro level (fine structure).
b. Scanning speed: The speed at you are scanning the texture. Typical scanning speed
varies from 40 mm/s to 120 mm/s.
c. Scanning force: The contact force you apply on texture while scanning.
d. Texture hardness: How hard a texture is in different directions. Consider the following textures:
(A) (B) Fig.1. Surface microstructure (profilometry) of two different textures, (A) Snowflake Fleece (B)
Chiffon

6
It is clear from the profilometry that the microstructure (geometry) is different for both
the textures. Texture A has approx. parallel geometry due to threads running in parallel
while texture B has sort of cross-linked geometry. So when you are scanning texture A,
the vibration elicited will be significantly different from vibration elicited by B due to
significant difference in geometry, assuming other parameters same. Similarly, when you
are scanning the same texture, let say texture B, at 40 mm/s and 80 mm/s, then also
vibration elicited will be significantly different for different speeds.
2.1 Biotac Finger
The Biotac finger is an artificial finger that mimics the features of human fingertip. It has
similar physical properties and sensory capabilities of human fingertip. It has advance
human-like tactile sensing, touch and capable of sensing force, vibration and
temperature. More details of Biotac can be find at its company’s website
http://www.syntouchllc.com/Products/BioTac.
Fig. 2. Biotac in action. It is analogous to distal part of a human finger containing fingertip area.
Fingertip is the part of finger which is mostly for tactile sensing in our everyday life.
From the details of Biotac, we can see that it is very close to the biological human finger
in terms of physical property and sensory capability, so it was appropriate to study the
natural scenes in tactile texture.

7
3. Material and Method
3.1 Texture Sample A sample of thirty eight different textures was taken that we encounter in our everyday life, like cotton, chiffon, etc. Also, those textures were avoided that are very abrasive in nature (like sandpaper) to protect the Biotac skin from extensive damage (the Biotac skin comes quite expensive). Following textures were included in the experimental sample:
1. Satin 14. Crinkled Silk 27. Snowflake Fleece (Knit Side)
2. Denim 15. 20 Gauge Vinyl 28.Career wear Flannel
3. Faux Leather 16. Micro suede 29.Leather (Smooth Side)
4. Hucktowel 17. Premier Velvet 30.Leather (Suede Side)
5. Empire Velveteen 18. Designer Wool 31.20% Wool Felt
6. Wool Blend 19. Stretch Denim 32.Upholstery 1
7. Corduroy - Thick Ridges 20. Velour 33.Corduroy (Thin Ridges)
8. Chiffon 21. Wool Crepe 34.Corrugated Paper
9. Corduroy – Blue 22. Silk Jacquard 35.Stretch Velvet
10. Taffeta 23. Swimwear Lining 36.Drapery Tape(Foam Side)
11. Wool Gabardine 24. Metallic Silk 37.Sueded Cuddle(Suede Side)
12. FlagBanner 25. Velvet 38.SnowflakeFleece(Fuzzy Side)
13. Blizzard Fleece 26.Sparkle Vinyl(Backing)
Some textures were periodic while some non-periodic in the direction of scanning, some
textures were hard in the direction normal to plane of scanning, while some soft. So the
sample covered a wide range of variability in different properties of texture. While
periodicity can be revealed by profilometry (Fig. 3), hardness can be revealed by different
method.

8
(A) (B) Fig. 3. Some texture were periodic and some were not. Profilometry reveals the minute details
of the geometry. (A) Periodic Texture (B) Non-periodic Texture
3.2 Rotating Drum Simulator A rotating drum simulator was custom designed and built for the experiment for scanning the sample textures across the fingerprint. The drum was a cylinder made from acryl and all the sample texture in form of rectangular strip were mounted around it on circumference, side by side (Fig .4). Each turn contained five different textures. In other words, in one full rotation, there were five different textures. Each strip had dimension of 96 X 40 (mm) and height varied from texture to texture. Texture strips were fixed adjacent to one another along axial and tangential direction (Fig.4).
Fig. 4. Texture Drum with sample textures wrapped around the circumference.

9
3.3 Experimental Setup The simulator drum (the drum) was fixed on motor that controlled the speed of rotation.
The force exerted by the drum on finger was controlled by another motor that drove
drum/rotation motor assembly linearly in vertical direction. This whole assembly was
then suspended a motor that allowed the translation along the length of the drum to
freely scan any texture. The whole setup was fixed on heavy metal structure to avoid any
vibration during experiment and to ensure robustness. The finger was mounted in fixed
on another custom built metal structure to ensure proper orientation during whole
experiment.
(A) (B)
Fig. 5. (A) Experimental setup with the simulator drum (B) Finger and the rotating drum
3.4 Data Collection
Experimental setup was installed in an isolated room free from any kind of vibrational
noise (any vibration can contribute to the noise in Biotac data). But some vibrational noise
was very difficult to get rid of like vibration from the experimental setup itself (motor
vibration).

10
The experimental setup was controlled using fully automated computer program and also
the data collection was done by fully automated computer program that was developed
earlier. MATLAB was used for storing the data generated by the finger. Software provided
by Biotac finger company (SynTouch) was used for monitoring the signal from sensors of
Biotac finger.
Ten trials were taken for each sample texture at each three different speed (tangential
speed at circumference) i.e. 40 mm/s, 80mm/s and 120mm/s. During whole experiment
height of drum relative to finger was kept constant to keep the normal force nearly same
on the finger during scanning. Since the length of texture strip was constant, duration of
a trial depended on the speed. So for speed 40mm/s, 80 mm/s and 120 mm/s, the
duration was 2.4s, 1.2s and 0.8s, respectively. Sampling frequency of finger was 2200 Hz.
The fingerprint on the skin of finger was not so robust and wear off was observed during
the trials by the textures. So to maximize the use of the finger, each set of trial was taken
for all the samples, then next set of trial and so on (instead of taking all trials set on a
sample and then moving to next sample for all trials). This method eliminated the decided
disadvantage for some texture in terms of wear off capability.
4. Data Analysis
4.1 Signal Preprocessing
Before investing the collected data, some preprocessing of the data was required. The
signal from the finger was a time varying pressure signal. Since I was interested in the
frequency makeup of the signal, it was first transformed into frequency domain from time
domain using the Fast Fourier Transform (FFT) tool in MATLAB, which is basically the
Fourier Transform with improved time complexity.
Now the signal obtained was in frequency domain but some frequencies were from noise
because it was present in signal at all speed and in all texture. For e.g. a noise frequency
was observed at 28Hz and it was noise because it was present irrespective of any texture,
any scanning speed and any trial, which means it didn’t represent a textural feature

11
(because if it were a texture related signal, it should not be present at same frequency for
significantly different texture and it should vary with speed also i.e. if speed changed from
40mm/s to 80mm/s, it should shift from 28Hz to 56Hz, similarly for other noise
frequency). These were the noise from different source (a significant source of noise was
vibration of the drum itself during scanning). So noise filtering was required and it was
done using Butter Worth filter. The noise was observed to be present at particular
frequencies, around 28Hz, 60Hz and 120Hz but though noise was observed at higher
frequencies but they were not significant. So filter at these frequencies with bandwidth
of +/- 2 Hz was used.
The disadvantage of using the filter was that the signal from texture present at these
frequencies (that was not a noise) also got filtered out which means losing some textural
information for these frequencies.
(A) (B)
(C) (D)
Fig. 6. (A) and (C) are power spectra of Satin (a texture from sample) at speed 40 and 80 (mm/s)
respectively. Similarly (B) and (D) are power spectra of Chiffon at speed 40 and 80 (mm/s)
respectively. We can see the presence of a peak at around 28Hz in each of the spectra which is
noise (indicated by arrow).

12
After the noise filtering, smoothing of signal was done to some extent using Gaussian
window convolution. Smoothing was done because the power spectra was changing
abruptly at consecutive frequency which was difficult to study. After all these
preprocessing, a nice signal was obtained which was free from any noise any easy to
analyze.
(A) (B)
Fig. 7. Signal Preprocessing. (A) Raw signal, time varying pressure signal. (B) Processed signal,
signal in frequency domain.
4.2 Texture Classification
After the preprocessing done, my job was to classify the given textures based on the data
using various parameters. Following parameters were studied:
1. Fingerprint Sensitivity
2. Perceived Roughness
4.2.1 Fingerprint Sensitivity
Fingerprint sensitivity can be defined as the effect of presence of fingerprint in the signal
elicited while scanning a textured surface. So a texture can be called sensitive to
fingerprint (fingerprint sensitive) if there is significant difference in the elicited vibration
FFT, Noise Filtering, Smoothing

13
-during scanning. For e.g. Chiffon was observed to have a significant effect of fingerprint,
figure 8, so it can be called fingerprint sensitive texture.
(A) (B)
Fig. 8. (A) Biotac skin with fingerprint wear off after the experiment (in circle). (B) Significant
difference in power spectra of the Chiffon scanned at 40 mm/s in the presence (solid pink, first
trial) and absence (dash brown, last trial) of fingerprint.
Biotac skin that was used had fingerprint with regular pattern having periodicity 0.4mm,
unlike actual human fingerprints. So the fingerprint frequency, i.e. the frequency
generated by fingerprint, at speed 40, 80 and 120 (mm/s) will be 100, 200 and 300 Hz
respectively, (speed=frequency*wavelength, where wavelength corresponds to the
spatial periodicity of the fingerprint and speed corresponds to scanning speed, so 40
(mm/s) =100 (Hz) *0.4 (mm) and similarly).
During the experiment, fingerprint of Biotac skin was observed to wear off which can be
attributed to abrasive nature of a texture (depending on texture). So the fingerprint was
wearing off on each trial but significant wear off was observed after trail eight (after trial
eight, there was almost no fingerprint). So during the whole experiment, all the
parameter was same except the fingerprint. So it was safe to study the effect of
fingerprint using this data which is not possible to study in human subject. Also, the effect
of fingerprint on the power spectra was not observed at all frequencies but at fingerprint
frequency. Also the effect varied from texture to texture, which will be explained later on.

14
Fig. 9. (A) Power spectra (speed 120 mm/s), with fingerprint sensitive frequencies highlighted
(inbox). (B) Fingerprint sensitive region of power spectra for each trial (from 1 to 10). (C) Error
bar of ratio of power spectra for each trial.
To study the extent of fingerprint effect, the following definition was used for
quantification:
Sensitivity (S) = ((a0–a)/a0)avg.
Where,
a0= power spectra with fingerprint,
a= power spectra without fingerprint
-i.e. I defined the sensitivity as average of ratio of difference of power spectra of signal in
presence of fingerprint (first trial) and absence of fingerprint (last trial) to power spectra
of signal in presence of fingerprint (first trial) . The ratio of power spectra was not taken
on whole power spectra but in the vicinity of fingerprint frequency.
The sensitivity parameter was calculated for all the texture at all the speed. A classifier
MATLAB program was designed and run over all the texture at different speed and trial
to classify the textures into sensitive and non-sensitive texture using a threshold value.
The results are presented in result and discussion section of this report.

15
4.2.2 Perceived Roughness
Perceived Roughness (or simply roughness in layman terms) is measure of magnitude of
roughness that we feel (perceive) while scanning a texture. Some texture feels rougher
than other, so texture that feels more rough has high perceived roughness magnitude.
For example, sandpaper has high perceived roughness than velvet. Quantifying the
perceived roughness is a difficult task because lots of factor contribute to the roughness
and it is also slightly subjective i.e. perceived roughness of a texture varies from person
to person. Some of the factors contributing to roughness are texture hardness, micro
geometry of texture and fingertip, biomechanical properties fingertip, etc.
Psychophysics For data collection, eight different subjects participated in the study and
textures were presented to them for giving a number to texture based on perceived
roughness, where 0 is least rough and 2 is most rough. Then the rating were normalized.
Roughness is known to be related with amplitude of vibration and follows power law [2].
So, an analysis program was run over the Biotac data to investigate the relation between
the perceived roughness and amplitude of vibration.
5. Result and Discussion
5.1 Fingerprint Sensitivity
Based on sensitivity definition, many texture scored as low as 0.001, which means less
sensitive and high as 0.6, means highly sensitive. Some of the most sensitive texture, with
its sensitivity in parenthesis are:
A. Chiffon ( 0.6442 )
B. Denim ( 0.6238)
C. Sparkle Vinyl (Backing) (0.5929)
D. Silk Jacquard (0.5824)

16
And least sensitive texture:
A. 20 Gauge Vinyl (0.0144)
B. Snowflake Fleece (Fuzzy Side) (0.1492)
C. Blizzard Fleece (0.1651)
D. Drapery Tape (Foam side) (0.1671)
The relative order texture based on sensitivity was consistent at all the speeds i.e. most
sensitive texture at 40 mm/s was also the most sensitive at 80 and 120 mm/s and similarly
for least sensitive textures. Although there was quite change in order of texture with close
sensitivity factor.
(A) (B) (C)
(D) (E) (F)
Fig. 10. (A), (B) and (C) Power spectra of a sensitive texture (Denim), first and last trial, near
fingerprint frequency at 40, 80 and 120 mm/s. Similarly (D), (E) and (F) for less sensitive texture
(20 Gauge Vinyl).

17
The sensitivity was observed to be depend on the following factor:
1. Spatial Periodicity
2. Hardness
5.1.1 Spatial Periodicity and Fingerprint Sensitivity
Spatial Periodicity refers to the period of periodic structure of the texture (in direction of
scanning, texture might not be periodic in any other direction), having some finite
periodicity that can interact with the fingerprint while scanning i.e. the periodic structure
with dimension comparable to fingerprint. Texture might have periodic structure at micro
level but if it is too small to interact with fingerprint, that doesn’t count in our case.
Surface profilometry easily reveals the periodic structure if present in the texture (Fig.
11). The profilometry data was acquired before this experiment.
(A) (B) (C)
Fig. 11. Periodic textures with some periodicity in direction of scanning (shown by arrow).
(A) Snowflake Fleece, (B) Denim, (C) Chiffon.
When the sensitivity was plotted against spatial periodicity, most of the sensitive textures
were observed to cluster around spatial period of 0.4-0.6 mm, which is around the
fingerprint periodicity. Also, non-periodic textures were assumed to have zero periodicity
and they all had low sensitivity value (Fig. 12)

18
Fig. 12. Spatial periodicity and sensitivity. Periodic texture with spatial period close to fingerprint
period were more sensitive while non-periodic texture were relatively low.
This observation can be attributed to the fact that fingerprint interacts strongly with
texture having periodicity close to it. As the periodicity shifts farther from fingerprint
sensitivity in either direction, the interaction with fingerprint become less strong. So,
when there was no fingerprint during the last trial of experiment, the vibration elicited
from the scanning contained almost no frequency contribution near fingerprint frequency
and thus had high sensitive value. On the other hand, this was not true for other textures.
But all periodic texture with periodicity close to fingerprint was not equally sensitive.
Some texture was observed to have very low sensitivity in spite of the fact that they had
periodicity close to fingerprint. That meant there were some other factors contributing
to sensitivity, one of which was found to be hardness, which has been discussed later.
5.1.2 Hardness and Fingerprint Sensitivity
Hardness is the ability of the texture to withstand a force without any shape deformation.
A texture can be more hard on one direction less hard in other but in our concern, the
hardness was counted only in the direction of force by fingertip during the scanning i.e.
perpendicular to the plane of scanning. Based on psychophysics, some of the hard texture

19
were corrugated paper, vinyl gauge, chiffon and some soft were velvet, drapery tape, and
snowflake fleece.
For studying the relation between hardness and sensitivity, a plot of sensitivity vs
hardness of all textures, regardless of periodic or non-periodic, was plotted. Hardness was
observed to positively contribute to the sensitivity i.e. harder texture were observed to
be more sensitive than less hard textures (Fig. 13)
Fig. 13. Hardness and sensitivity. Harder texture were observed to be more sensitive.
This observation can be explained using the fact that the harder texture were able to
withstand the force applied by the finger and thus retaining the shape during scanning.
So retention of shape contributed to strong interaction of fingerprint with the texture.
But all the texture having nearly same hardness were not equally sensitivity and some
texture had very low sensitivity. So like periodicity, hardness was one of the parameter
along with others contributing in sensitivity of the texture. One parameter we already
know i.e. spatial periodicity.
20
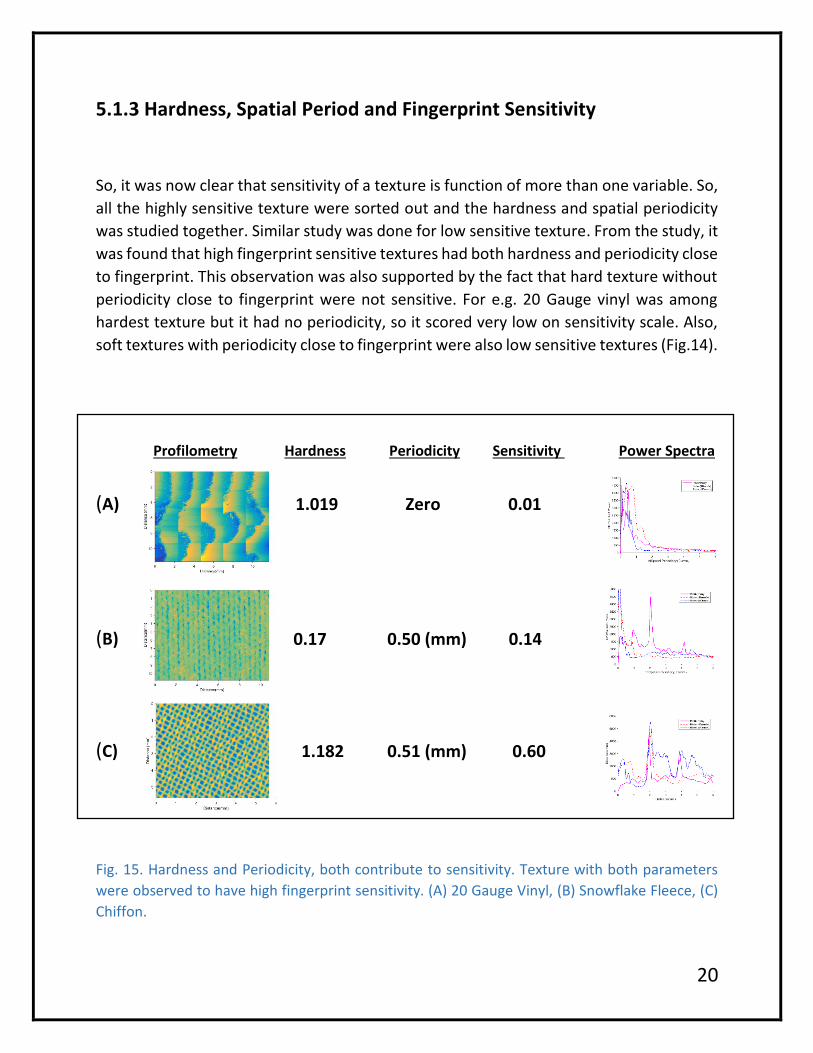
5.1.3 Hardness, Spatial Period and Fingerprint Sensitivity
So, it was now clear that sensitivity of a texture is function of more than one variable. So,
all the highly sensitive texture were sorted out and the hardness and spatial periodicity
was studied together. Similar study was done for low sensitive texture. From the study, it
was found that high fingerprint sensitive textures had both hardness and periodicity close
to fingerprint. This observation was also supported by the fact that hard texture without
periodicity close to fingerprint were not sensitive. For e.g. 20 Gauge vinyl was among
hardest texture but it had no periodicity, so it scored very low on sensitivity scale. Also,
soft textures with periodicity close to fingerprint were also low sensitive textures (Fig.14).
Profilometry Hardness Periodicity Sensitivity Power Spectra
(A) 1.019 Zero 0.01
(B) 0.17 0.50 (mm) 0.14
(C) 1.182 0.51 (mm) 0.60
Fig. 15. Hardness and Periodicity, both contribute to sensitivity. Texture with both parameters
were observed to have high fingerprint sensitivity. (A) 20 Gauge Vinyl, (B) Snowflake Fleece, (C)
Chiffon.

21
5.2 Perceived Roughness
Texture with high amplitude of vibration was found to have high perceived roughness
which is consistent with the finding before i.e. rough surface have high vibration
amplitude while scanning. But some texture with low vibrational amplitude also had high
perceived roughness. So after the classifier was run over the data, it was found that
textures that had more sensitivity were high in perceived roughness value i.e. apart from
vibrational amplitude, interaction with fingerprint also contributed to perceived
roughness. This leads to the conclusion that if a texture elicit high vibrational amplitude
and is sensitive to fingerprint will have more perceived roughness. While vibration is
mainly contributed by macro geometry that has dimension comparable to fingertip,
sensitivity is contributed by micro geometry that has dimension comparable to
fingerprint. Also , vibrational amplitude contribute more to perceived roughness than
fingerprint sensitivity because it was found that texture eliciting higher vibrational
amplitude were perceived more rough than texture with significantly lower vibrational
amplitude even with high sensitivity but textures with comparable vibrational amplitude
and having high sensitivity were perceived more rougher. For example Wood Blend
elicited less vibrational amplitude but was perceived rougher than Corduroy-Thick Ridges
because former one was more sensitive than later (Fig.16). The perceived roughness from
psychophysics data for Corduroy-Thick Ridges and Wood Blend was 0.92 and 1.18.
(A) (B) (C)
Fig. 16. Sensitivity and Vibrational Amplitude both contribute to perceived roughness.
Profilometry-(A) Corduroy-Thick Ridges (B) Wool Blend. (C) Elicited Vibrational Amplitude during
scanning (red- Corduroy-Thick Ridges and black- Wool Blend).

22
6. Conclusion
Fingerprint play significant role in the vibration elicited during scanning a texture, but its
influence depend on texture being scanned. While some texture are more sensitive to
fingerprint, some textures are not affected by the presence or absence of fingerprint at
all (non-sensitive texture). Sensitivity towards fingerprint is strong for the periodic
textures with periodicity close to fingerprint. But the periodicity close to fingerprint alone
does not make a texture sensitive to fingerprint but hardness also play important role.
The sensitivity is strongly observed for texture having significant hardness because
hardness helps a texture to retain its shape during scanning and thus strong interaction
with fingerprint. In conclusion, for a texture to be fingerprint sensitive, the texture should
have both hardness and periodicity close to fingerprint period and if without either of
them, the texture will not be sensitive to fingerprint.
Fingerprint also seem to play role in perceived roughness. Due to presence of fingerprint,
there is relatively strong interaction of texture with our finger and that make the texture
feel rougher i.e. more perceived roughness but that is not true for all textures. This effect
is strongly observed in fingerprint sensitive texture. Sensitivity has less influence on
perceived roughness than vibrational amplitude which means that sensitivity will play role
only when the vibrational amplitude are almost same for two different textures and the
more sensitive texture will have high perceived roughness. In conclusion, apart from
vibrational amplitude, sensitivity also contribute to perceived roughness but sensitivity is
secondary factor and vibrational amplitude is primary.
7. Reference
1. Delhaye B, Hayward V, Lefevre P, Thonnard JL. Texture-induced vibrations in the
forearm during tactile exploration
2. Natural scenes in tactile texture. Louise R. Manfredi, Hannes P. Saal, KylerBrown,
Mark C. Zielinski, John F. Dammann III, Vicky S. Polashock and Sliman J. Bensmaia,