climatic benefits of black carbon emission reduction … benefits of black carbon emission reduction...
TRANSCRIPT

TECHNICAL ARTICLE Open Access
Climatic benefits of black carbon emissionreduction when India adopts the US on-road emission levelAshish Sharma1 and Chul E. Chung2*
Abstract
India is known to emit large amounts of black carbon (BC) particles, and the existing estimates of the BC emissionfrom the transport sector in the country widely range from 72 ~ 456 Gg/year (for the 2000’s). First, we reduce theuncertainty range by constraining the existing estimates by credible isotope analysis results. The revised estimate isfrom 74 ~ 254 Gg/year. Second, we derive our own BC estimate of the transport section in order to gain a newinsight into the mitigation strategy and value. Our estimate shows that the transport section BC emission would bereduced by about 69 % by adopting the US standards. The highest emission reduction comes from the vehicles inthe 5–10 year old age group. The minimum emission reduction would be achieved from the vehicles in the 15–20year old age category since their population is comparatively small in comparison to other age categories. The 69 % of74 ~ 254 Gg/year is 51 ~ 175 Gg/year, which is the estimated BC emission reduction by switching to the US on-roademission standard. Assuming that global BC radiative forcing is 0.88 Wm−2 for 17.8 Tg/year of BC emission, we find thatthe reduced BC emission translates into −0.0025 ~ −0.0087 W m−2 in global forcing. In addition, we find that 51 ~ 175Gg of BC emission reduction amounts to 0.046 – 0.159 B carbon credits which are valued at 0.56 – 1.92 B US dollars(using today’s carbon credit price). In a nutshell, India could potentially earn billions of dollars per year by switchingfrom the current on-road emission levels to the US levels.
Keywords: Indian road transport, Diesel emissions, Gasoline emissions, Black carbon, BC forcing, Climatic benefits
IntroductionBlack carbon (BC) is a product that results from incom-plete combustion. Black carbon (BC) is also known as“soot” or “soot carbon" [1]. BC aerosols are emitted as pri-mary aerosols from fossil fuel combustion, biomass burn-ing and biofuel burning, and thus largely anthropogenic.Specifically, the combustion of diesel and coal, the burn-ing of wood and cow dung, savanna burning, forest fireand crop residue burning are the common sources for BC.In order to improve air quality, developed countries havereduced ambient aerosol concentration by a variety ofmeasures in the last few decades. For instance, wood asthe fuel for cooking was replaced by natural gas or electri-city. This kind of clean-air act not only reduced the overallaerosol concentration (including BC concentration) butalso reduced the relative amount of BC to other
anthropogenic aerosols such as sulfate, as evident fromthe state-of-the-art emission estimate dataset by [2]. De-veloping countries, conversely, have high levels of aerosolconcentration and also a relatively large amount of BC [2].India too, as a developing nation, exhibits these character-istics. The BC emission in India has steadily increased [3].BC has many unique aspects. First, while most aero-
sols scatter solar radiation and thus act to cool the earth,BC strongly absorbs sunlight and contributes to the glo-bal warming [4]. Second, while CO2 itself is not an airpollutant, BC is both an air pollutant and climatewarmer. Thus, reducing BC concentration is more easilyjustified than reducing CO2 concentration. Third, BCemission is generally much easier to mitigate than CO2
emission, since the former originates largely from poorlife styles in developing countries. For example, it ismuch easier and cheaper to replace a cow-dung burningfacility by a modern natural-gas stove in a kitchen thaninstalling a solar panel. Fourth, since aerosols stay in the
* Correspondence: [email protected] Research Institute, Reno, NV 89512, USAFull list of author information is available at the end of the article
© 2015 Sharma and Chung. Open Access This article is distributed under the terms of the Creative Commons Attribution 4.0International License (http://creativecommons.org/licenses/by/4.0/), which permits unrestricted use, distribution, andreproduction in any medium, provided you give appropriate credit to the original author(s) and the source, provide a link tothe Creative Commons license, and indicate if changes were made.
Sharma and Chung Future Cities and Environment (2015) 1:13 DOI 10.1186/s40984-015-0013-8

atmosphere for less than a few weeks, reducing BCemission results in an immediate reduction in BC con-centration, whereas reducing CO2 emission leads to a re-duction in CO2 concentration many decades later. Inview of this fourth aspect, Ramanathan and Xu [5] andShindell et al. [6] demonstrated using climate modelsthat reducing BC emission is among the most effectivetools to slow down the warming immediately.In the current study, we aim to quantify the BC emis-
sion from the transport sector in India and how much thisBC emission can be reduced by adopting the US on-roademission rates immediately. We do this because vehiclesin India emit far more particulate matter (i.e., far moreaerosols) per vehicle than in the West. The aerosols emit-ted from vehicles consist largely of black carbon [7]. Incomparison, biofuel combustion emits a relatively moreorganic carbon and less black carbon [7]. While BC is def-initely a climate warmer, organic carbon may be a cooler[8, 9]. Thus, BC emission decrease in the transport sectorseems more appealing in combating the global warmingthan that in biofuel or biomass burning. Accordingly, [10],for instance, suggested that diesel engine is one of a fewgood examples for reducing BC emission and fighting theglobal warming. Diesel engines are the main contributorto aerosol emission from the transport sector [11–13].Furthermore, mitigating diesel engine emissions would re-duce BC concentration with a relatively small reduction insulfate (a cooling agent), whereas mitigating emissionsfrom coal combustion in power plants would reduce bothBC and sulfate substantially [14]. Thus, quantifying theBC emission in the transport section is very valuable inthe global warming mitigation study.Studies exist that estimated the BC emission from the
road sector in India [7, 15–18]. These estimations give awidely-varying range of 71.76 ~ 456 Gg in the annualemission, and also a wide range of 6.5 % ~ 34 % in the per-centage of the total BC emissions by the road transportsector. This large uncertainty in estimated BC emission orits contribution to total BC emission makes it difficult forpolicy makers to make decisions. Thus, one of the objec-tives in the present study is to reduce this uncertainty.The novelty of our study is also that it quantifies the po-
tential climatic benefits of mitigating the road transportsector BC emissions in India via implementation of the USon-road emission levels, which are more stringent than theIndian levels. Previous studies in this regard [19–21] quan-tified the percentage reduction by applying EU standardsand our study is the first study to quantify the percentagereduction by applying the US standard. Applying the USstandard has advantages because US standards have similaremission requirements for both diesel and gasoline vehicles.Europe emission regulations, relative to the counterpartU.S. program, tolerate higher PM emissions from dieselvehicles. Applying the US emission standards in India is
particularly more important in order to target BC emissionsfrom the heavy duty diesel vehicles (buses and trucks) inIndia. Not only do we quantify the BC emission reductionin switching to the US standard, we also translate thisreduction into the climatic benefit by applyingobservationally-constrained (thus accurate) BC climate for-cing estimation studies and today’s carbon emission price.Lastly, in the present study, we will also attempt to
quantify the contribution of different categories of vehiclestowards the transport sector BC emissions in India for theyear 2010 according to vehicle age. We do this, becausethis further information would be very valuable to envir-onmental policy makers. We organize the paper in 4 sec-tions. In Section 1, we provided a general overview of howthis study was conducted and we highlighted the presentstate of transport sector emissions in India. Here, we alsoclarified some of the key findings from the similar studiesconducted in the past and the shortcomings of theexisting studies. In section 2, we discuss the methods weadopted for revising the existing estimates of thetransport-sector BC emission in India and what approachwe adopted for providing our own estimate the transport-sector BC emission in India. In Section 3, we discusses re-sults. Here, we provided our own estimate of transportsection BC emission and BC emission reduction by imple-menting higher emission standards. Section 3 also pertainsto the BC forcing reduction and its monetary value andSection 4 is dedicated for discussions and conclusions.
MethodologyRevising the existing estimates of the transport-sector BCemission in IndiaAs stated earlier, the previous estimates of the BC emis-sion from the road sector in India give a widely-varyingrange of 71.76 ~ 456 Gg in the annual emission, and also awide range of 6.5 % ~ 34 % in the percentage of the totalBC emissions by the road transport sector [7, 15–18]. Theaforementioned estimates are based on a bottom-up ap-proach, and there is a wide range in the estimates due touncertainty in (a) fleet average emission factors and (ii)modelling of the on-road vehicle stock. Additionally, emis-sion inventories without calibrating the national fuel bal-ance would have much higher uncertainties [22].The aforementioned previous BC emission estimates
did not utilize the isotope analysis results by Gustafsson etal. [23]. Most of carbon in the earth is carbon-12 (12C).14C, also referred to as radiocarbon, is a radioactive iso-tope of carbon, and decays into nitrogen-14 over thou-sands of years. Live plants and animals maintain a highratio of 14C to 12C by photosynthesis, vegetable eating andcarnivores eating herbivores, as the source for 14C is cos-mic rays in the atmosphere. Thus, biomass contains a highratio of 14C to 12C. On the other hand, fossil fuel arosefrom vegetation and animals that died a long time ago,
Sharma and Chung Future Cities and Environment (2015) 1:13 Page 2 of 13

and therefore contains no 14C. The ratio of 14C to 12C isthus proportional to the ratio of biomass to fossil fuel.Gustafsson et al. [23] analyzed 14C mass and 12C massdata in collected aerosols, and apportioned the carbon be-tween fossil fuel combustion and biomass/biofuel burningsources. Unlike in the previous BC emission estimates, theapportionment based on carbon isotope data should beconsidered non-controversial and credible. Furthermore,the aerosols collected for the analysis were in the SouthAsian outflow instead of near emission sources, whichmeans that the results by Gustafsson et al. [23] representthe overall conditions in India. In view of this, in thepresent study we apply the results of Gustafsson et al. [23]to existing BC estimates.Here is how we use Gustafsson et al.’s [23] results. Ac-
cording to Gustafsson et al. [23], the corresponding shareof fossil fuel combustion and biomass/biofuel burning tototal BC emissions is 32 ± 5 and 68 ± 6 % respectively inSouth Asia. Existing BC emission estimates for the trans-port sector in India also give the BC emission estimatesfor other sectors. We adjust the ratio of estimated BCemission from fossil fuel combustion (including transpor-tation) to estimated BC emission from biomass and bio-fuel burning in each past estimation study so that theadjusted ratio would be 32 ± 5 : 68 ± 6 in all the BC esti-mates, as consistent with that from Gustafsson et al. [23].During the adjustment, we do not adjust the magnitude oftotal BC emission from all the sectors. The adjusted ratioleads to adjusted BC estimates for the transport sector,and the adjusted estimates must be more accurate. Theoriginal and adjusted estimates of the percentage share ofroad transport BC emissions to the total BC emissions inIndia are shown in Table 1. We propose that the commu-nity uses the adjusted estimates shown in Table 1.Figure 1 compares the two (i.e., original and adjusted)
estimates in the magnitude of BC emission. In this figure,we removed the estimate for the 90’s and only retainedthose for the 2000’s. As clearly shown in Fig. 1, the originalestimates varied from 72 ~ 456 Gg/year (with the arith-metic average of 264 Gg/year), while the adjustedestimates now vary from 74 ~ 254 Gg/year (with the arith-metic average of 164 Gg/year). We computed the averageestimate to develop the consensus, and do not intend theaverage estimate to be the best estimate. The average wasobtained by assigning the same weight to each estimate.
To summarize the results, the mean BC estimate is re-duced by 38 % after adjustments with Gustafsson et al.’s[23] results. More importantly, we have sharply reducedthe uncertainty in the transport sector BC emission (from72 ~ 456 Gg/year to 74 ~ 254 Gg/year) by employingGustafsson et al.’s [23] results.
Our own estimate of the transport-sector BC emission inIndiaIn the present study, we develop our own estimate of theBC emission from the transport section in India becauseour own data would facilitate the quantification of BCemission reduction in the implementation of other emis-sion standards. In addition, we provide BC emission ac-cording to the age categorization of the vehicles – afeature not represented in the previous studies and yet im-portant for policy makers. In our estimation, we adopt anemission factor (EF) based approach with an aim to esti-mate the emissions for the year 2010. Emission factors(EFs) are relations between a specific emission and theconcerned activity leading to that emission, and normallydetermined in an empirical manner. Road vehicle EFs rep-resent a quantity of pollutants emitted given a unit dis-tance driven, amount of fuel used or energy consumed[24]. In addition to an EF-based technique, many othertechniques are being used in the community for quantify-ing emissions from a large number of real world vehicles.These techniques include remote sensing of tailpipeexhaust, chassis dynamometer tests, random roadsidepullover tampering studies, tunnel studies, and ambientspeciated hydrocarbon measurements [25]. Employingsome of these techniques for determining actual vehicleemissions in our study would be very costly as it requiresdedicated human resource. Thus, we use an emission fac-tor based approach here.As for the emission factors for Indian vehicles, we use
the data from Baidya et al. [22]. We use the emissionfactors from Baidya et al. [22] for the following main rea-sons. (a) Most importantly, they utilized the data in SouthAsia and South East Asia. (b) They constrained thecategorization of vehicles by the data availability and dataauthenticity, thus accounting for the characteristics of datain South Asia. (c) In particular, the following key factorswere considered within each vehicle category: Fuel vs. en-gine, and kinds of engine (e.g., two or four strokes). Thus
Table 1 Percentage share of road transport BC emissions to total BC emissions in India. (Adjustment in accordance with Gustafssonet al.’s isotope analysis)
Reference Emission year Original estimate Adjusted estimate
Lu et al., 2011 [15] (Emission year 2010) 2010 11.00 % 4.00 – 5.00 %
Klimont et al., 2009 [16] (Emission year 2010) 2010 6.50 % 17.00 – 23.00 %
Bond et al., 2004 [7] (Emission year 2009) 2009 30.00 % 21.00 – 29.00 %
Sahu et al., [17] (Emission year 2001) 2001 34.00 % 10.67 – 14.62 %
Sharma and Chung Future Cities and Environment (2015) 1:13 Page 3 of 13

their EF’s are well representative of local conditions inIndia and useful for the present study. Please note thatBaidya et al. [22] provided the emission factors for par-ticulate matter (PM) instead of BC, and they also gave theestimates of PM emission instead of BC emission. Here,we give BC emission estimates using known PM/BC ratiosand these data for various categories.We differentiated vehicles at different levels and obtained
the emission factor for each category. First, on the basis ofvehicles type such as heavy duty trucks, buses, cars and mo-torbikes. Motor bikes are further disaggregated as 2-strokemotorbikes and 4-stroke motor bikes. Second, the vehiclesare differentiated on the basis of fuel type used – diesel orgasoline. Third, vehicles are further differentiated accordingto four age groups as: 0–5 year old, 5–10 year old, 10–15year old and 15–20 year old. These age groups correspondto the 5-years brackets of the Indian exhaust emission regu-lations: Until 1990; 1991–1995; 1996–2000 and 2001–2005.For further classifying the vehicles according to age differ-entiation, we assumed the percentage of vehicle belongingto a specific age group such as 0 ~ 5 years old; 5 ~ 10 yearsold; 10 ~ 15 years old and 15 ~ 20 years old. Then we fur-ther assume the percentage distribution of trucks and busesfor specific fuel types such as diesel and petrol. This disag-gregation of vehicles into specific age groups is importantfor the purpose of this study because India has a significantpercentage of the old vehicle fleets which have not yet re-tired and such old vehicles have considerably higher emis-sion rates as the emission relevant parts deteriorate [25].The calculation of PM emissions using age specific emis-sion factors is crucial for identifying the vehicles responsible
for higher PM emissions and thus this could be used to de-sign vehicular emission mitigation strategies.The scientific justification for the chosen EFs is not only
explained in Baidya et al.[22] but is also supported in inde-pendent reports [19, 26]. All the EFs are defined in g/km.The EFs used in the present work are tabulated in Table 2.We are aware that EFs vary from region to region, and thegiven EFs in Table 2 are meant to be for the country-average values of various vehicle types.In the next step, we multiply the total vehicle activity
(vehicle kilometers traveled) and the fuel specific emissionfactors (Eq. 1) to estimate PM emission in Gigagram. Thismultiplication method is a common approach of emissioncalculation and it has been widely used in similar studiesconducted in the past [17, 22, 27–29]. Please note that theunit of emission factors used in this equation is g/km. Theannual emissions of pollutants are estimated for each indi-vidual vehicle type a, fuel type b, and emission standard caccording to the following standard equation –
ET a;b;cð Þ ¼X
Popa;b;cx EFa;b;cx VKTa� � ð1Þ
where,ET(a,b,c) = Total EmissionsPopa,b,c = vehicle populationVKTa = annual vehicle kilometers traveled by vehicles
of type aEFa,b,c = Emission factor for vehicle per driven kilometer
for vehicle type a, fuel type b, and emission standard cWe obtained the statistics of registered motor vehicles
in India from various agencies in India, including the
Fig. 1 Original vs. adjusted estimates of BC emissions in India (adjusted according to [23])
Sharma and Chung Future Cities and Environment (2015) 1:13 Page 4 of 13

Ministry of Shipping, Road Transport & Highway. Thedata collection was extremely tedious due to an inferiorinformation storage system in India. Data were obtainedby combining internet search, peer-reviewed literatureand reports, and personal communication with multipleresearch groups and agencies (both private and govern-ment agencies) in India and abroad via e-mails and phonecalls. The annual average distance in kilometers travelledby various Indian vehicles was obtained from the RoadTransport Yearbook [30] published by the Government ofIndia. Upon analyzing the data, we found that older vehi-cles travelled lesser distance compared to the newer vehi-cles. The data are sorted out in terms of vehicle category,fuel type (diesel or gasoline), type of engine (two or fourstrokes), operation (e.g. taxi and private use for passengercars and the emission control standard compliance. Driv-ing conditions are defined as either urban or rural condi-tions. We categorized vehicles broadly into the followingfour categories: trucks (diesel), buses (diesel), passengercars (including taxis and private cars powered by dieseland gasoline) and motor bikes (2-stroke and 4-strokemotor bikes powered by gasoline). The percentage shareof each categoriy of vehicles on the basis of fuel type hasbeen obtained from The Automotive Research Associ-ation of India (ARAI). Motorized two wheelers are differ-entiated by two stroke and four stroke engine.For compliance with the latest emission regulation (i.e.,
emission regulation for 2010), we assumed that vehiclesmanufactured in a specific emission year are in compli-ance with the emission legislation enforced by Indian gov-ernment in that model year and the vehicles were notimproved (in terms of emission factor) afterwards. So, thecompliance with the latest emission legislation is factoredin this fashion. For example, let us say, a vehicle is manu-factured in the model year 1998. Then we can say that thisvehicle can be assigned an age group of 10–15 year oldfrom the year 2010 standpoint. This will correspond tothe Indian exhaust emission regulation during the 5-yearbracket of 1996–2000. The emission factor for this specificvehicle is calculated from the emission standards duringthe 5-year bracket of 1996–2000. Please note that there is
a lack of Inspection and Maintenance (I & M) data forIndian vehicles. If such data were available, we did notneed to make the aforementioned assumptions.In our own estimate, the total PM emission from the
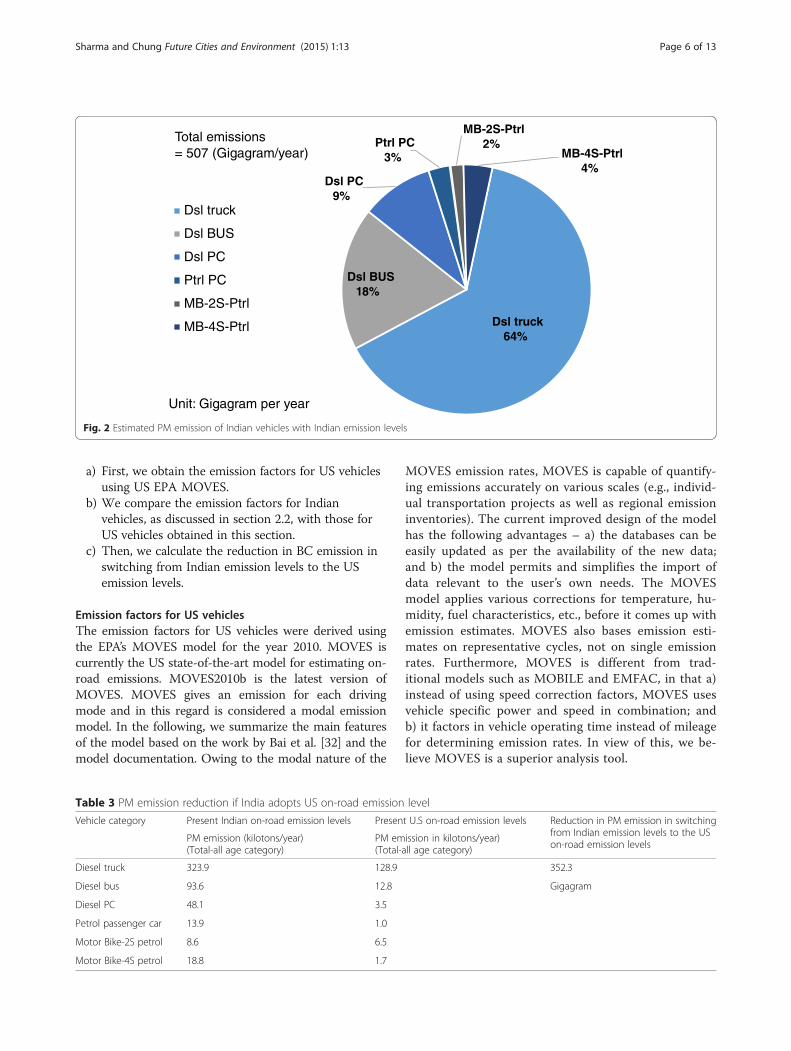
road transportation in India is 507 Gigagram for the year2010 at the present Indian on-road emission levels (shownin Fig. 2). The total PM emission for a specific vehicle cat-egory is shown in Table 3. In the last step, we convert thisPM emission into BC emission by applying the ratio ofBC/PM2.5. We obtain this ratio for on-road mobilesources from the EPA’s report on black carbon [31], as-suming that this ratio is primarily controlled by whetherfuel and engine are either gasoline or diesel based. TheBC/PM2.5 ratio is 0.74 and 0.19 for diesel and gasolinemobile sources respectively. We obtain the total BC emis-sion separately for diesel and gasoline vehicles. The detailsof conversion calculation are illustrated in Table 4. Thetotal BC emission following Indian emission levels is esti-mated to be 344.5 Gg/year and 7.84358 Gg/year for on-road diesel and gasoline vehicles respectively. From Fig. 2,it is quite evident that heavy duty diesel trucks are themain culprits with the largest contribution of 64 % to-wards total PM emissions in India following the presentIndian on-road emission levels. The 2nd largest source ofon-road PM emissions are diesel buses. For the heavycommercial vehicles including buses and trucks we as-sumed that there is 100 % diesel penetration. The 3rd lar-gest contribution to total PM emission comes from dieselpassenger cars which are used as personal as well as multiutility passenger vehicles as a taxi, etc. The 4th largestemission sources are 4 stroke gasoline motor bikesfollowed by diesel passenger cars and 2 stroke gasolinemotor bikes.
BC emission reduction when India adopts the US on-roademission levelsIn section 2.1, we revised the estimates for on-road BCemission in India from existing studies to be 74 ~ 254Gg/year using adjustment with isotope analysis results.This section pertains to calculating the reduction in BCemission. This is accomplished in the following steps:
Table 2 PM emission factor by vehicle category and age group in India (from Baidya et al. 2009)
Gram/km Vehicles manufactured
2001- 2005 1996–2000 1991–1995 Before 1991
Heavy duty truck (diesel) 0.49 1.22 2.03 2.7
Bus (diesel) 0.59 1.49 2.48 3.3
Diesel car (diesel) 0.19 0.46 0.77 1.03
Diesel car (gasoline) 0.06 0.07 0.09 0.1
Motorbike (2 stroke, gasoline) 0.18 0.26 0.32 0.46
Motorbike (4 stroke, gasoline) 0.06 0.08 0.1 0.14
Sharma and Chung Future Cities and Environment (2015) 1:13 Page 5 of 13
a) First, we obtain the emission factors for US vehiclesusing US EPA MOVES.
b) We compare the emission factors for Indianvehicles, as discussed in section 2.2, with those forUS vehicles obtained in this section.
c) Then, we calculate the reduction in BC emission inswitching from Indian emission levels to the USemission levels.
Emission factors for US vehiclesThe emission factors for US vehicles were derived usingthe EPA’s MOVES model for the year 2010. MOVES iscurrently the US state-of-the-art model for estimating on-road emissions. MOVES2010b is the latest version ofMOVES. MOVES gives an emission for each drivingmode and in this regard is considered a modal emissionmodel. In the following, we summarize the main featuresof the model based on the work by Bai et al. [32] and themodel documentation. Owing to the modal nature of the
MOVES emission rates, MOVES is capable of quantify-ing emissions accurately on various scales (e.g., individ-ual transportation projects as well as regional emissioninventories). The current improved design of the modelhas the following advantages – a) the databases can beeasily updated as per the availability of the new data;and b) the model permits and simplifies the import ofdata relevant to the user’s own needs. The MOVESmodel applies various corrections for temperature, hu-midity, fuel characteristics, etc., before it comes up withemission estimates. MOVES also bases emission esti-mates on representative cycles, not on single emissionrates. Furthermore, MOVES is different from trad-itional models such as MOBILE and EMFAC, in that a)instead of using speed correction factors, MOVES usesvehicle specific power and speed in combination; andb) it factors in vehicle operating time instead of mileagefor determining emission rates. In view of this, we be-lieve MOVES is a superior analysis tool.
Fig. 2 Estimated PM emission of Indian vehicles with Indian emission levels
Table 3 PM emission reduction if India adopts US on-road emission level
Vehicle category Present Indian on-road emission levels Present U.S on-road emission levels Reduction in PM emission in switchingfrom Indian emission levels to the USon-road emission levels
PM emission (kilotons/year)(Total-all age category)
PM emission in kilotons/year)(Total-all age category)
Diesel truck 323.9 128.9 352.3
Diesel bus 93.6 12.8 Gigagram
Diesel PC 48.1 3.5
Petrol passenger car 13.9 1.0
Motor Bike-2S petrol 8.6 6.5
Motor Bike-4S petrol 18.8 1.7
Sharma and Chung Future Cities and Environment (2015) 1:13 Page 6 of 13

In this study, we specified the following parameters asthe input parameters while running the MOVES model: a)geographic bound, we chose the national level; b) timespan, the year 2010; c) road type, we specified urban roadwith unrestricted access; and d) in the emission source, weselected all the exhaust processes (consisting of running ex-haust; start exhaust; crankcase running exhaust; crankcasestart exhaust ; crankcase extended idle exhaust ; extendedidle exhaust) but did not include the emissions from fuelingor evaporation since our BC emission estimate in section 3did not include the latter source either.The model output we used is the total travelled distance
and annual PM2.5 emission. This output data was selectedagainst specific vehicle types from the MySql output data-base of MOVES. Then, we compute emission factors bydividing total emission by total distance traveled and thisgave us emission factors in gram/km for corresponding ve-hicle types. The emission factors were further sorted basedon vehicle age. The vehicle age is calculated as a differenceof reference year (year 2010) and the manufacturing yearand finally, we inserted these emission factors in equation 1discussed in chapter 3, to obtain total PM emission accord-ing to the US emission levels.
ResultsComparison of emission factors: Indian vehicles vs. USvehiclesAs we compare the PM emission factors from the Indiamotor vehicles with those from US vehicles, we clearly seethat the Indian vehicles have significantly higher emissionfactors than those in the US (see Fig. 3). Moreover, this dif-ference becomes even larger for older vehicles. Higheremission factors associated with older vehicles can be at-tributed to the deterioration of the vehicle engines uponaging and accumulation of the mileage. The vehicle engineseemingly deteriorates on aging due to poor maintenanceof the vehicles. The vehicles in India are often poorly main-tained and have higher average age relative to those in theUS. We believe that this faster deteriorating also stems dueto lack of effective inspection and maintenance systems tobe enforced by the combination of government policies.Figure 3 also shows that the difference in the emission
factors is highest for the heavy commercial vehicles (dieselbuses and diesel trucks). In addition, considering the caseof motor bikes, we can see that the emission factors for themotor bikes in US seems to be constant with the aging be-cause the MOVES model does not incorporate age deteri-oration factor for motor bikes, however, the emissionfactors for motor bikes in India shows an increasing trendwith an increasing age. In India, there is a significant shareof on-road 2-stroke motor bikes as they are an attractiveoption to the middle and lower middle classes in India [33].This is contrary to the motor bike ownership scenario inUS where 2-stroke motor bikes are completely out of useand are superseded by 4-stroke motorbikes. Thus, almostall of the on-road motorcycles in MOVES at this point are4-stroke.Here, we summarize the merits of four stroke engines
over two stroke engines and vice-versa from the study byKojima et al. [34] published with the World Bank. Theirstudy primarily focused on reducing emissions from two-stroke engines in South Asia. The key advantages of 4-stroke engines over 2-stroke gasoline engine vehicles are:lower particulate and hydrocarbon emissions, better fueleconomy, and moderate noise levels while in operation.However, the only relative advantages of 2-stroke enginesare: lower purchase prices; mechanical simplicity leadingto low maintenance costs; and lower NO2 emissions. Ourcomparative analysis of the emission factors from 2-strokeand 4-stroke engine technologies clearly points out theneed for encouraging 4-stroke two wheelers over 2-stroketwo wheelers in India. This implies that the pollutionlevels can be brought down to safer levels in spite of therising two-wheeler population if the 4-stroke technologyfor the two-wheeler segment is promoted in India.
Reduction in BC emission in switching to the US emissionlevelsWe combine the US emission factors with the driving activ-ities in India to estimate total on-road PM emission in Indiaif India hypothetically adopts the US emission levels (usingEq. 1). The result is the 155 Gigagram for the year 2010, asshown in Fig. 4. This PM emission is further converted toequivalent BC emission by applying the ratio of BC/PM2.5
Table 4 Estimated BC emission from on-road mobile sources in India
Vehicle technology BC/PM2.5 PM emission (Gigagram/year) BC emission = (BC/PM) ratio PM emission (Gigagram/year)
Indian on-road emission level
On-road diesel vehicles 0.74 465.5 344.5
On-road gasoline vehicles 0.19 41.3 7.8
US on-road emission level
On-road diesel vehicles 0.74 145.2 107.5
On-road gasoline vehicles 0.19 9.3 1.8
BC emission reduction in switching from Indian emission levels to US emission levels = 243 Gigagram
Sharma and Chung Future Cities and Environment (2015) 1:13 Page 7 of 13

(discussed in section 2.2) and details of calculation are pre-sented in Table 4.The reduction in BC emission in switching to the US
emissions levels is expressed in terms of reduction in PMemission (Table 3 and Fig. 5) and reduction in BC emission(Table 4). The total BC emission reduction following theUS emission levels is estimated to be 243 Gg (equaling69 % reduction), and this number is split into 236.7 Gg and6 Gg for on-road diesel and gasoline vehicles respectively.Please note that this reduction is in BC emission. In Fig. 5,we analyze the emission reduction in terms of age categoryof the vehicles. We find that the highest emission reductionin switching to US on-road emission levels would resultfrom the vehicles in the age group of 5–10 years oldfollowed by the vehicles in the age group of 0–5 years oldand vehicles in the age group of 10–15 years old. The leastemission reduction will result from the vehicles which arein the age group of 15–20 years old. This estimate incorp-orating vehicle age categorization is one of the novelties ofthe present study.
Our estimate of BC emission in section 3 is not necessar-ily a better estimate than previous ones. Thus, we restrictour BC emission estimate to the use of the ratio of theemission factors in India to those in US. This ratio is com-bined with the adjusted previous estimates (according toGustafsson et al. [23], as discussed in section 2) to yield thereduction of BC emission. For the total BC emission reduc-tion from all the vehicles in India, we apply the 69 % BCemission reduction to the adjusted previous estimates. The69 % of 74 ~ 254 Gg/year is 51 ~ 175 Gg/year. This is theestimated BC emission reduction by switching to the USon-road emission standard.
BC radiative forcing reduction and its valueWe calculated earlier that 51 ~ 175 Gg/year of BC emissionreduction is possible in India (year 2000’s) from the roadtransport sector if India adopts the US on-road emissionslevels. Based on the study by Cohen and Wang [35] andBond et al. [10], 17.8 Tg/year (i.e. 17800 Gigagram/year) ofglobal BC emission makes 0.88 W/m2 of global BC forcing.
Fig. 3 Comparison of PM emission factors of Indian vehicles and US vehicles
Sharma and Chung Future Cities and Environment (2015) 1:13 Page 8 of 13

We estimate that 51 ~ 175 Gg/year of BC emission reduc-tion contributes to a reduction of −0.0025 ~ −0.0087 W m−2 in global BC forcing. Thus, we conclude that a reductionin BC forcing of −0.0025 ~ −0.0087 W m−2 is possible ifIndia adopts the US on-road emissions levels.
Quantifying climatic benefits of a reduction in BC forcing(in USD)Both CO2 emission and BC emission contribute to the glo-bal warming. The Kyoto Protocol introduced a conceptcalled “carbon credit”. 1 carbon credit is a permit to emit 1
Fig. 4 Estimated PM emission of Indian vehicles with US on-road emission levels
Fig. 5 PM emission reduction from Indian vehicles according to their age (US on-road emission levels)
Sharma and Chung Future Cities and Environment (2015) 1:13 Page 9 of 13

tonne of CO2. Such permits can be sold and bought in amarket, and Fig. 6 shows the market price moves of 1 car-bon credit in the last 12 months. The Kyoto Protocol alsoallows for other climate warmers (such as methane) thanCO2 to be traded in carbon credit markets. For non-CO2
warming matters, 1 carbon credit is a permit to emit anamount of the matter equivalent to 1 tonne of CO2 in theglobal warming. Each warming agent (such as methane)has its own atmospheric-residence time scale, spatial distri-bution, etc., and so comparing a particular warming agentto CO2 is not always straightforward. For BC, 100 year (or20 year) global-warming-potential (GWP) is commonlyused in this regard. According to Bond et al. [10], the100 year GWP value for BC is 910. This means 1 tonne ofBC emission adds as much energy to the earth over thenext 100 years as 910 tonnes of CO2. Please note that themass of BC refers to that of the carbon component whilethe CO2 mass refers to the combined mass of carbon andoxygen.Applying Bond et al.’s [10] estimate for the BC GWP, we
find that 51 ~ 175 Gg/year of BC emission reductionamounts to 0.046 billion - 0.159 billion carbon credits.Using $12.104 (US dollars) as the average price of 1
carbon credit, as shown in Fig. 6, 0.046 billion - 0.159 bil-lion credits are valued at $ 0.56 B – $ 1.92 B (US dollars).In short, India could earn $ 0.56 B – $ 1.92 B (US dollars)every year by switching from the current on-road emis-sion levels to the US levels. Please note that the KyotoProtocol did not address BC but the next climate treatywill likely include BC.We furthermore note that the 5th IPCC report [36] en-
dorsed Bond et al.’s [10] study as a credible estimate of BCGWP. Bond et al.’s [10] estimate can be considered crediblefor many reasons. First, observationally-constrained esti-mates of BC forcing were used, and thus these estimatesare similar to that of Cohen and Wang [35]. Second, therapid adjustment due to the atmospheric heating by BC(i.e., semi-direct forcing) was included as well, and in thisaspect the best semi-direct forcing estimate was used.
Conclusion and discussionsThe existing estimates of the BC emission from the trans-port sector in India have a wide range of values, givinghuge uncertainties in this regard. In the present study, wehave substantially reduced the uncertainty by constrainingthe existing estimates with credible isotope analysis
Fig. 6 Average Carbon Price in US Dollar per tonne of CO2 emission or its equivalent (July 2013 – July 2014)
Sharma and Chung Future Cities and Environment (2015) 1:13 Page 10 of 13

results. Next, we have derived our own BC estimate of thetransport section, and then we have provided the estimateof anticipated BC emission reduction possible in India asa result of switching to the more stringent US on-roademission levels. This emission reduction is found to beabout 69 %, and coupled with the adjusted previous BCemission estimates the emission reduction is expected tobe in the range of 51 ~ 175 Gg of BC per annum. What ismore, we have expressed the proposed BC emission re-duction in terms of global BC radiative forcing, which isestimated to range from −0.0025 ~ −0.0087 W m−2, i.e., areduction of global BC forcing by 0.0025 ~ 0.0087 W m−2
due to a reduction of BC emission in India. We have alsoquantified the climate benefits of the BC emission reduc-tion in USD. The BC reduction of 58.2 ~ 151.3 Gg isequivalent to 0.046 billion - 0.159 billion carbon creditswhich are valued at $ 0.56 B US dollars – $ 1.92 B USdollars (using today’s carbon credit price).Although we fully accounted for uncertainties in esti-
mating the BC emission from the transport section inIndia, we did not address the uncertainties in the 69 % re-duction estimate, nor did we assess the uncertainties inlocal BC forcing or BC GWP. In our view, addressingthese uncertainties is beyond the scope of the currentpaper and deserves a separate study. To elaborate, BCGWP is not globally uniform. BC emission in some areascan contribute to the global warming more than the emis-sion of the same amount in other areas, since BC forcingdepends on sunlight, low cloud fraction, etc. Even if weconsider the uncertainty in global BC GWP, we also needto evaluate local BC GWP and address its uncertainty. Tosimplify the computation, we used the best estimate ofglobal BC forcing and BC GWP and scaled these numbersto estimate the climatic benefit of reducing the BC emis-sion in India. Nevertheless, we believe the ranges of all theestimates in our study are sufficiently large to cover mostuncertainties, because we maximized the uncertainties inestimating the BC emission from the transport sector (bypicking possibly the most extreme values to represent therange), and the other estimates are based on the BC emis-sion estimates.Overall, our study provides another reason that vehicles
should be cleaner in India. Why the vehicles in India emitmore aerosols than those in the US needs additional discus-sions, as there are many factors behind this. There are stud-ies [21, 22, 29] and government reports [19, 37] whichhighlight key reasons accountable for excessive particulatesemission from Indian vehicles. One of the key reasons re-lates to the Indian emission controls, as they have beentraditionally based on Euro style emission standards. Suchemission standards allow higher particulate emissions fromdiesel vehicles compared to the gasoline vehicles. In com-parison, the US has been setting and reinforcing the samestandards without considering any specific type. In another
reason, emission standards in India are lax compared tointernational best practices. The lax standards in India re-flect that Indian schedules for adopting emission and fuelquality standards lag those in the West. Other reasons in-clude a weak enforcement of emission standards; and a sig-nificant percentage of older vehicles in India which arepoorly maintained and have poor fuel economy.An additional and important cause of excessive emission
from Indian vehicles might be that transport fuels in Indiahave high sulfur content which results in higher sulfateemissions. During combustion, sulfur in diesel fuel isemitted in the form of sulfur dioxide (SO2) gas which latercondenses and becomes sulfate aerosols in the atmos-phere. SO2 emission is not part of PM emission in typicalPM estimation studies (since gas is not aerosol) but SO2
gas (at least some of it) ultimately becomes aerosols. Sincethe present study is about BC aerosols, we refrain fromdiscussing high sulfur content extensively here.In the end, vehicles in India emit excessive aerosols be-
cause such dirty vehicles are cheap to buy and operate.Such dirty vehicles are common among poor countriesand so this is not limited to India. Clean technologicalsolutions are available but unfortunately at additionalcosts. We discuss some technology examples in the next.Compared to gasoline engines, diesel engines have lowerCO and HC gas emissions but higher NOx and PM emis-sions [38]. In gasoline engines tailpipe emissions can besignificantly reduced by an efficient use of three-way cata-lytic converters, but at the expense of fuel economy [39].In general, the emission control technologies for dieseland gasoline engines can be broadly divided into twogroups: in-cylinder control and after-treatment control[40]. Posada et al. [41] give a good review of these emis-sion control technologies. For instance, for diesel emissioncontrols, PM filters are an example of after-treatmenttools. Minjares et al. [13] and EPA [31] report that theseparticle filter devices reduce diesel PM emissions by asmuch as 85 to 90 % and BC emissions by up to 99 %.Despite all these costs, the benefits could be substantial.
Here, we have discussed the benefits by adopting the USon-road aerosol emission levels immediately. The idea ofswitching the on-road emission to the US levels immedi-ately is unrealistic. Thus, our results can be taken as theupper limit of the benefit and such results are still usefulto policymakers. On the other hand, while we only dis-cussed the climate benefits, the benefits are not limited tothe climate, and more importantly pertain to health bene-fits. A number of studies [31, 39, 42–45] substantiated thehealth benefits of BC emission reduction. It has been wellestablished that fine particulates emitted from dieselmotor vehicles contain toxic substances and the exposureto these fine particles can prompt lung tumor, serious re-spiratory grimness and mortality including wellbeing re-sults, for example, worsening of asthma, interminable
Sharma and Chung Future Cities and Environment (2015) 1:13 Page 11 of 13

bronchitis, respiratory tract contaminations, coronary ill-ness and stroke.Besides the issues of outdated vehicle technology in
India, there are other issues (behavioral and psychologicalissues) such as a lack of environmental conviction in theIndian car consumers that leads to higher traffic emissions[46–48]. They often dump old tires, battery or even scrapcar. Irrespective of a large number of consumers who areconscious about the environment, very few people are ac-tually willing to adapt their lifestyle in order to solve theissues such as deteriorating air quality. There is a verynegligible percentage of people who actually push them-selves out of their comfort zone by acting at their personalexpenses, such as paying premiums for environmentallyfriendly products and making a sacrifice in their presentlifestyles. Therefore, there is a need of behavioral changesat personal level which includes - (i) raising public aware-ness to prefer public transportation to using personalvehicles; (ii) living near the workplace rather than com-muting a long distance to workplace every day; (iii) carpool; and (iv) commuting to workplace with bicycles. Theincreasing use of public transportation would mean fewervehicles on the road, which means less emission and lessnegative effects on climate and health [49]. Hence, there isnot a single effective tool to mitigate transport sectoremissions. Taken together, we propose that in order to as-sure effective environmental protection, psychological aswell as technological measures need to be in place.
Competing interestsThe authors declare that they have no competing interests.
Authors’ contributionsCEC conceptualized the work, and interpreted the results. AS carried out thework. All the authors worked together for writing.
AcknowledgementThe authors are thankful to Dr. George Scora of University of CaliforniaRiverside University of California, Riverside), Dr. Sarath Guttikunda of UrbanEmissions, India, Mr. Michael P. Walsh, Mr. Gaurav Bansal, Mr. John German ofICCT (Washington, DC), Mr. Stevens Plotkins of Argonne National Laboratory,and Mr. Narayan Iyer of Bajaj Auto-India for their expertise. We are alsothankful to the government and semi-government agencies such as US EPA,CARB, CSE (Delhi), SIAM (India) and ARAI (India) for their prompt responsesto our data requests and doubts in using emission models. This research wasfunded by the Korea Meteorological Administration Research and DevelopmentProgram under Grant Weather Information Service Engine (WISE) project(#: KMA-2012-0001).
Author details1Department Civil Engineering, University of Toledo, Toledo, OH 43606, USA.2Desert Research Institute, Reno, NV 89512, USA.
Received: 13 July 2015 Accepted: 20 December 2015
References1. Andreae M, Gelencsér A (2006) Black carbon or brown carbon? The nature of
light-absorbing carbonaceous aerosols. Atmos Chem Phys 6(10):3131–31482. Lamarque J-F, Bond TC, Eyring V, Granier C, Heil A, Klimont Z, Lee D, Liousse C,
Mieville A, Owen B (2010) Historical (1850–2000) gridded anthropogenic and
biomass burning emissions of reactive gases and aerosols: methodology andapplication. Atmos Chem Phys 10(15):7017–7039
3. Novakov T, Ramanathan V, Hansen J, Kirchstetter T, Sato M, Sinton J, Sathaye J:Large historical changes of fossil‐fuel black carbon aerosols. Geophysical ResLetters 2003, 30(6). doi:10.1029/2002GL016345.
4. Chung CE, Ramanathan V, Decremer D (2012) Observationally constrainedestimates of carbonaceous aerosol radiative forcing. Proc Natl Acad Sci 109(29):11624–11629
5. Ramanathan V, Xu Y (2010) The Copenhagen accord for limiting globalwarming: criteria, constraints, and available avenues. Proc Natl Acad Sci107(18):8055–8062
6. Shindell D, Kuylenstierna JC, Vignati E, van Dingenen R, Amann M, Klimont Z,Anenberg SC, Muller N, Janssens-Maenhout G, Raes F (2012) Simultaneouslymitigating near-term climate change and improving human health and foodsecurity. Science 335(6065):183–189
7. Bond TC, Streets DG, Yarber KF, Nelson SM, Woo JH, Klimont Z: A technology‐based global inventory of black and organic carbon emissions fromcombustion. J Geophysical Res Atmospheres (1984–2012) 2004, 109(D14). doi:10.1029/2003JD003697.
8. Myhre G, Bellouin N, Berglen TF, Berntsen TK, Boucher O, Grini A, Isaksen IS,Johnsrud M, Mishchenko MI, Stordal F (2007) Comparison of the radiativeproperties and direct radiative effect of aerosols from a global aerosol modeland remote sensing data over ocean. Tellus B 59(1):115–129
9. Stier P, Seinfeld JH, Kinne S, Boucher O (2007) Aerosol absorption and radiativeforcing. Atmos Chem Phys 7(19):5237–5261
10. Bond TC, Doherty SJ, Fahey D, Forster P, Berntsen T, DeAngelo B, Flanner M,Ghan S, Kärcher B, Koch D (2013) Bounding the role of black carbon in theclimate system: A scientific assessment. J Geophysical Res Atmospheres118(11):5380–5552
11. Kroeger T: Black Carbon Emissions in Asia: Sources, Impacts and AbatementOpportunities. Contractor Report Prepared by International Resources Groupfor USAID, ECO-Asia Clean Development and Climate Program USAID RegionalDevelopment Mission for Asia. USAID: Bangkok, Thailand 2010.
12. Liggio J, Gordon M, Smallwood G, Li S-M, Stroud C, Staebler R, Lu G, Lee P,Taylor B, Brook JR (2012) Are emissions of black carbon from gasoline vehiclesunderestimated? Insights from near and on-road measurements. Environ sciTechnol 46(9):4819–4828
13. Minjares R, Wagner D, Baral A, Chambliss S, Galarza S, Posada F, SHARPE B, Wu G,Blumberg K, Kamakate F (2014) Reducing black carbon emissions from dieselvehicles: impacts, control strategies, and cost-benefit analysis. The World Bank
14. Garg A, Shukla P, Bhattacharya S, Dadhwal V (2001) Sub-region (district) andsector level SO< sub > 2</sub > and NO< sub > x</sub > emissions for India:assessment of inventories and mitigation flexibility. Atmos Environ 35(4):703–713
15. LU J (2011) Environmental Effects of Vehicle Exhausts, Global and LocalEffects:A Comparison between Gasoline and Diesel. Thesis, Halmstad University
16. Klimont Z, Cofala J, Xing J, Wei W, Zhang C, Wang S, Kejun J, Bhandari P,Mathur R, Purohit P (2009) Projections of SO2, NOx and carbonaceous aerosolsemissions in Asia. Tellus B 61(4):602–617
17. Sahu S, Beig G, Sharma C: Decadal growth of black carbon emissions in India.Geophysical Research Letters 2008, 35(2). DOI:10.1029/2007GL032333.
18. Reddy MS, Venkataraman C (2002) Inventory of aerosol and sulphur dioxideemissions from India. Part II—biomass combustion. Atmos Environ36(4):699–712
19. ARAI.: The Automotive Research Association of India, 2007. Emission FactorDevelopment for Indian Vehicles, As a Part of Ambient Air Quality Monitoringand Emission Source Apportionment Studies. AFL/2006‐07/IOCL/EmissionFactor Project/2007.
20. Baidya S (2008) Trace Gas and particulate matter emissions from roadtransportation in India: quantification of current and future levels. Reports inUniversity of Stuttgart, Stuttgart
21. Bansal G, Bandivadekar A (2013) OVERVIEW OF INDIA’S VEHICLE EMISSIONSCONTROL PROGRAM. ICCT, Beijing, Berlin, Brussels, San Francisco, Washington
22. Baidya S, Borken-Kleefeld J (2009) Atmospheric emissions from roadtransportation in India. Energy Policy 37(10):3812–3822
23. Gustafsson Ö, Kruså M, Zencak Z, Sheesley RJ, Granat L, Engström E, Praveen P,Rao P, Leck C, Rodhe H (2009) Brown clouds over South Asia: biomass or fossilfuel combustion? Science 323(5913):495–498
24. Franco V, Kousoulidou M, Muntean M, Ntziachristos L, Hausberger S, Dilara P(2013) Road vehicle emission factors development: A review. Atmos Environ70:84–97
Sharma and Chung Future Cities and Environment (2015) 1:13 Page 12 of 13

25. Sawyer RF, Harley RA, Cadle S, Norbeck J, Slott R, Bravo H (2000) Mobile sourcescritical review: 1998 NARSTO assessment. Atmos Environ 34(12):2161–2181
26. Central Pollution Control Board MoEF (2011) Air Quality Monitoring,Emission Inventory and Source Apportionment Study for Indian Cities.Ministry of Environment & Forests: India
27. Ramachandra T (2009) Emissions from India’s transport sector: Statewisesynthesis. Atmos Environ 43(34):5510–5517
28. Nagpure AS, Sharma K, Gurjar BR (2013) Traffic induced emission estimatesand trends (2000–2005) in megacity Delhi. Urban Climate 4:61–73
29. Sahu SK, Beig G, Parkhi N (2014) Critical emissions from the largest on-roadtransport network in south Asia. Aerosol Air Qual Res 14(1):135–144
30. Ministry of Road Transport and Highways I (2012) India road transport year book2009–2011. Ministry of Road Transport and Highways (India), New Delhi, India
31. EPA U: Report to Congress on black carbon. US Environmental ProtectionAgency, Washington, DC. 2012, EPA-450/R-12-001 388pp.
32. Bai S, Eisinger D, Niemeier D: MOVES vs. EMFAC (2009) A Comparison ofGreenhouse Gas Emissions Using Los Angeles County. In: TransportationResearch Board 88th Annual Meeting, Paper: Washington DC. 09–0692.
33. Das S, Schmoyer R, Harrison G, Hausker K (2001) Prospects of inspectionand maintenance of two-wheelers in India. J Air Waste Manage Assoc51(10):1391–1400
34. Kojima M, Brandon C, Shah JJ: Improving urban air quality in South Asia byreducing emissions from two-stroke engine vehicles. In.: World Bank; 2000
35. Cohen JB, Wang C: Estimating global black carbon emissions using a top‐downKalman Filter approach. J Geophysical Res Atmospheres 2014 199;307-323
36. Randall, D.A., R.A. Wood, S. Bony, R. Colman, T. Fichefet, J. Fyfe, V. Kattsov, A.Pitman, J. Shukla, J. Srinivasan, R.J. Stouffer, A. Sumi, K.E. Taylor, 2007:Cilmate Models and Their Evaluation. In: Climate Change 2007: The PhysicalScience Basis. Contribution of Working Group I to the Fourth AssessmentReport of the Intergovernmental Panel on Climate Change [Solomon, S., D.Qin, M. Manning, Z. Chen, M. Marquis, K.B. Averyt, M.Tignor, H.L. Miller (eds.)]. Cambridge University Press, Cambridge, United Kingdom and New York,NY, USA.
37. Ministry of Shipping RTH, Government of India; ARAI.: 2007.38. Mondt JR (2000) Cleaner Cars: The history and technology of emission
control since the 1960s; Society of Automotive Engineers, Inc.39. Zelenka P, Cartellieri W, Herzog P (1996) Worldwide diesel emission standards,
current experiences and future needs. Appl Catal B Environ 10(1):3–2840. Faiz A, Weaver CS, Walsh MP (1996) Air pollution from motor vehicles
standards and technologies for controlling emissions. World Bank,Washington, D.C
41. Minjares R, Blumberg K, Posada Sanchez F (2013) Alignment of policies tomaximize the climate benefits of diesel vehicles through control ofparticulate matter and black carbon emissions. Energy Policy 54:54–61
42. Lim SS, Vos T, Flaxman AD, Danaei G, Shibuya K, Adair-Rohani H, AlMazroaMA, Amann M, Anderson HR, Andrews KG (2013) A comparative riskassessment of burden of disease and injury attributable to 67 risk factorsand risk factor clusters in 21 regions, 1990–2010: a systematic analysis forthe Global Burden of Disease Study 2010. Lancet 380(9859):2224–2260
43. Ghose MK, Paul R, Banerjee S (2004) Assessment of the impacts of vehicularemissions on urban air quality and its management in Indian context: thecase of Kolkata (Calcutta). Environ Sci Pol 7(4):345–351
44. Sydbom A, Blomberg A, Parnia S, Stenfors N, Sandström T, Dahlen S (2001)Health effects of diesel exhaust emissions. Eur Respir J 17(4):733–746
45. Morgan W, Reger R, Tucker D (1997) Health effects of diesel emissions. AnnOccup Hyg 41(6):643–658
46. Klocke U (2000) Conditions of environmental mobility decisions:environmental protection through government action, at the individual. In:Scholl W, Sydow H (eds) Association for European transport andcontributors 2009 16 modal choice and when buying a car. Mobility inadolescence and adulthood, Waxmann, Münster
47. Kruger N, Pareigis J: Influencing Car Buying Decisions from anEnvironmental Perspective-A Conceptual Framework Based on Real OptionAnalysis. In: European Transport Conference, 2009: Netherlands 2009
48. Joshi N, Rao P: Environment Friendly Car: Challenges ahead in India. GlobalJ Manage Business Res 2013, 13(4):11-19.
49. Laffel N (2006) Promoting Public Transportation for Sustainable Development.Thesis, Princeton University
Submit your manuscript to a journal and benefi t from:
7 Convenient online submission
7 Rigorous peer review
7 Immediate publication on acceptance
7 Open access: articles freely available online
7 High visibility within the fi eld
7 Retaining the copyright to your article
Submit your next manuscript at 7 springeropen.com
Sharma and Chung Future Cities and Environment (2015) 1:13 Page 13 of 13