cloud-based meta-analysis to bridge science and practice
TRANSCRIPT

Personnel Assessment and Personnel Assessment and
Decisions Decisions
Volume 1 Issue 1 Article 2
2015
Cloud-based Meta-analysis to Bridge Science and Practice: Cloud-based Meta-analysis to Bridge Science and Practice:
Welcome to metaBUS Welcome to metaBUS
Frank A. Bosco Virginia Commonwealth University
Piers Steel University of Calgary
Frederick L. Oswald Rice University
Krista Uggerslev Northern Alberta Institute of Technology
James G. Field Virginia Commonwealth University
Follow this and additional works at: https://scholarworks.bgsu.edu/pad
Part of the Human Resources Management Commons, Industrial and Organizational Psychology
Commons, and the Other Psychology Commons
Recommended Citation Recommended Citation Bosco, Frank A.; Steel, Piers; Oswald, Frederick L.; Uggerslev, Krista; and Field, James G. (2015) "Cloud-based Meta-analysis to Bridge Science and Practice: Welcome to metaBUS," Personnel Assessment and Decisions: Number 1 : Iss. 1 , Article 2. DOI: https://doi.org/10.25035/pad.2015.002 Available at: https://scholarworks.bgsu.edu/pad/vol1/iss1/2
This Invited Article is brought to you for free and open access by the Journals at ScholarWorks@BGSU. It has been accepted for inclusion in Personnel Assessment and Decisions by an authorized editor of ScholarWorks@BGSU.

Personnel Assessment And decisions
32015 • Issue 1 • 3-17 http://scholarworks.bgsu.edu/pad/
InvIted ArtIcle
Cloud-Based Meta-analysis to Bridge sCienCe and PraCtiCe: WelCoMe to MetaBus
Frank A. Bosco1, Piers Steel2, Frederick L. Oswald3, Krista Uggerslev4, and James G. Field1
1. Virginia Commonwealth University2. University of Calgary3. Rice University4. Northern Alberta Institute of Technology
Multiple sources report findings that managerial deci-sions are better when based on the “best available scientific evidence” (Cohen, 2007, p. 1013; Rousseau & McCarthy, 2007). Consequently, groups like the Society of Human Re-source Management (SHRM) have partnered with the So-ciety for Industrial and Organizational Psychology (SIOP) to create programs that promote evidence-based human resource management (i.e., SHRM-SIOP Science of HR Se-ries). Similarly, academic outlets have emerged that seek to bridge the science–practice gap (e.g., Academy of Manage-ment Executive). Despite these efforts, our overall ability to merge evidence with management practice is uneven and weak at best—and absent at worst.
The recognition of a sizeable science–practice gap in business has a long and uninterrupted history, having been featured in the first article published in Harvard Business Review (Donham, 1922). Articles directly discussing the gap in terms of applied psychology started to appear in the late 1950s and early 1960s (e.g., Tyron, 1963). As Kieser, Nicolai, and Seidl (2015) review, the gap has been acknowl-edged widely across many articles, journal special issues, conferences, and edited books (e.g., Rynes, Bartunek, & Daft, 2001). It has also been the subject of three Academy of Management presidential addresses by Donald Ham-
brick, Anne Huff, and Andrew Van De Ven, who all shared concern over the relevance of management research (Kieser & Leiner, 2009).
In these discussions, one seemingly insurmountable barrier to progress has been in making large bodies of re-search findings easily available, because this is required to inform and enhance evidence-based practice. In the present paper, we present metaBUS: a web-based approach that builds upon prior concerns and suggestions regarding the need to translate constructs (or similar jargon) and sum-marize evidence (and similar findings across disciplines). The approach is distinguishable from systematic review and from web-based searches of the literature, owing to its focus on a cloud-based Internet platform that facilitates the search, identification, and accumulation of empirical research findings at the level of reported effect sizes (e.g., correlation coefficients). The metaBUS platform—named as
ABSTRACT
KEYWORDS
Although volumes have been written on spanning the science–practice gap in applied psychology, surprisingly few tangible components of that bridge have actually been constructed. We describe the metaBUS platform that addresses 3 challenges of one gap contributor: information overload. In particular, we describe challenges stemming from: (a) lack of access to research findings, (b) lack of an organizing map of topics studied, and (c) lack of interpretation guidelines for research findings. For each challenge, we show how metaBUS, which provides an advanced search and synthesis engine of currently more than 780,000 findings from 9,000 studies, can provide the building blocks needed to move beyond engineering design phase and toward construction, generating rapid, first-pass meta-analyses on virtually any topic to inform both research and practice. We provide an Internet link to access a preliminary version of the metaBUS interface and provide 2 brief demonstrations illustrating its functionality.
big data, science mapping, meta-analysis
Parts of this work were supported by the Canadian Centre for Advanced Leadership in Business, National Science Foun-dation, SHRM Foundation, Social Sciences and Humanities Research Council, and the Virginia Commonwealth University Presidential Research Quest Fund.Corresponding author: Frank A. BoscoDepartment of Management, School of Business, Virginia Com-monwealth University, PO Box 844000, Richmond, VA 23284Email: [email protected]

42015 • Issue 1 • 3-17Published By ScholarWorks@BGSU, 2015
Personnel Assessment And decisions Welcome to metaBUS
a portmanteau of meta-analysis and omnibus—is a scientif-ic search engine that aims to do nothing less than curate and make accessible all effect sizes from every applied psychol-ogy research journal. The database of findings is augmented by a variety of related classifications (e.g., sample size; reli-ability estimate; sample type; country of origin) to facilitate large-scale deductive or inductive research across studies (meta-analysis or otherwise). In addition, to enhance the flexibility and use of searching, metaBUS database contents are linked to a visual map (i.e., hierarchical taxonomy) that allows the user to search through a tree of approximately 5,000 variables and constructs studied in applied psycholo-gy research. At the time of this article, the platform contains approximately 780,000 individual findings extracted from 9,000 original articles.
We organize the remainder of this article as follows. First, we describe an engineering-based approach to nar-rowing the science–practice gap. Second, we justify the need for an organized, standards-based, and large-scale research curation effort that addresses three critical sci-ence–practice gap challenges. Third, we provide access to a preliminary cloud-based graphical user interface (GUI; see metaBUS.org/portal) and illustrate its functionality with two detailed demonstrations using text- or taxonomy-based search modes. We raise possible limitations, future direc-tions, and how metaBUS might address challenges that, we argue, have stymied evidence-based management (EBM) efforts.
AN ENGINEERING-BASED SOLUTION TO INFOR-MATION OVERLOAD
Applied psychology, like many fields (e.g., medicine), is beginning to drown in “an ever-expanding sea of sci-entific data” (Ip et al., 2012, p. 1). Not only is our past re-search becoming particularly weighty, with over a century of scientific publications behind us, but scientific output across disciplines is roughly doubling in volume every 9 years (Bornmann & Mutz, 2015). To manage and leverage our growing database of scientific findings for the purpose of EBM, the applied psychology field has an increasingly critical need to store, organize, curate, and summarize our research knowledge using more intelligent and efficient approaches (cf. Hanson, Sugden, & Alberts, 2011). Without such curation, attempts at EBM are yoked to the idiosyn-cratic storage methods of journals and the slow accumu-lation of existing information by traditional systematic review methods; thus, EBM remains threatened by a state of information overload. In addition, before EBM can be implemented broadly, there must be an improved culture that is receptive to EBM, where managers must be “exposed to, and embrace, scientific evidence” (Rynes, Gulik, & Brown, 2007, p. 987). We argue that improved methods for access to research information will contribute to a stronger
culture of EBM; we cannot wait for EBM to demand such methods. In short, we have to get our own house in order before inviting guests.
Aside from a lamented science–practice gap, informa-tion overload relates to what might be called a “science–science” gap – a chasm between the massive heap of scientific findings that has been produced collectively and the information that individual researchers would like to access. Pointing to this gap, despite the tens of thousands of research articles containing literally millions of individual results, academics have no search engine that operates at this fine level. Library research engines can identify articles by topic, but they do not efficiently index the articles’ actual empirical findings let alone provide mechanisms to facili-tate empirical summaries of them. With this inherent inef-ficiency, the current process of gathering research findings needed for an empirical summary on a popular topic can take years, taxing the patience of all but the most tenacious.
What can be done about these gaps? According to the literature, there appear to have been no real solutions, easy or otherwise (Kieser et al., 2015). As Rynes et al. (2007) noted, “the gap between science and practice is so persistent and pervasive that some have despaired of its ever being narrowed” (p. 987). Also, as Cohen (2007) prescribed, “we can’t keep nibbling at the corners of the problem or lament-ing that transfer is not taking place and pointing to one small contributing factor” (p. 1018). We contend that bridg-ing the science–practice gap will require genuine engineer-ing, defined by Merriam-Webster’s dictionary as “the work of designing and creating large structures (such as roads and bridges) or new products or systems by using scientific methods” (emphasis added). Importantly, note the two parts to engineering. Although design is crucial, no car rides on blueprints to cross a river. Bridging a gap requires actual creation based on design. We have volumes of insightful design work amassed over the past decades, but surprising-ly little effort has been allocated to actual creation. As one culprit, academic reward structures seem to reward concep-tual insights about the science–practitioner gap with much less reward for creation or application that might address that gap. More generally, Hambrick (1994) levied concern that the goals of our discipline should extend beyond the relatively narrow realm of journal publishing and expand into applications and actions based on our research that lead to wider impact by more directly informing societally im-portant issues.
Ultimately, however, one must ask, “what would a science–practice bridge actually look like?” We propose that one such bridge would include at least three key tan-gible elements: an organizing taxonomy or “map” of the constructs in our field, a search engine that can manage a large database of empirical findings tied to that taxonomy, and a user-friendly interface that facilitates the location and summarization of findings. Note that the taxonomy not only

Personnel Assessment And decisions
52015 • Issue 1 • 3-17 http://scholarworks.bgsu.edu/pad/
InvIted ArtIcle
allows concepts to be organized and understood by aca-demics, it also can serve as a foundation for translating our constructs into accessible nonacademic language in a more consistent manner. The search engine and database would allow empirical findings to be located with minimal effort according to a variety of modes and filters (in stark contrast with today’s methods). Furthermore, an interface flexible in terms of how findings are summarized and presented should allow results to be expressed at a level (or levels) of so-phistication well suited for multiple audiences. We propose that these tangible elements will at least partially resolve, or act as a catalyst for resolving, three central challenges that seem to have stymied EBM. We delineate each central challenge below, describing how metaBUS might assist in tackling them.
Challenge #1: Lack of Access to Research
As one central challenge faced by academics and prac-titioners, the process of locating the empirical results from academic research is presently a monument of inefficiency; research is “difficult to locate and understand” (Shapiro, Kirkman, & Courtney, 2007, p. 250). Consider the primary outlet for applied psychology research, the journal article. A joint project between the SIOP Foundation and the data analytic company Innovacer mapped the citation and refer-ence networks for articles across 20 journals (Allen, 2015). Over the last decade, the majority of citations have been from the fields of management, psychology, and business, comprising a hefty total of some 700 journals, but citations also arise in hundreds of journals representing engineering, computer science, economics, and environment studies, to name a few. Although many journals will contain some rel-evant findings, conservatively assume that only 50 journals frequently contain relevant original findings (e.g., correla-tion coefficients) and that the average journal publishes 30 articles per year that contain original findings. Over 30 years, the number of articles would be 45,000—a massive number, and the emergence of new journal titles over time further raises this number and exacerbates the challenge of locating research findings on a given topic. The metaBUS platform provides a starting point for drastically simplifying literature search processes by curating and making acces-sible a large corpus of empirical findings (i.e., correlation coefficients).
Presently, research teams who set out to conduct sys-tematic reviews are effectively signing up for a multiyear process that often involves hundreds or thousands of hours of work. Existing institutionally accessed search engines (e.g., EBSCO, ProQuest) will produce an incomplete subset of research on a topic (leading to potential errors of omis-sion) when based on keywords, and it will require a mas-sive hand culling of findings as well, when based on full text searches (leading to potential errors of commission).
Consider Judge, Thoresen, Bono, and Patton (2001), who “manually searched 21 journals …from 1983 to [1999]” (p. 383). If each of the 21 journals dated back to 1983, the total number of volumes is 357 (i.e., 21 journals × 17 years). As a conservative estimate of the number of articles hand searched, multiply that figure (i.e., 357) by the number of issues per volume (assume five) and then the number of ar-ticles per issue (assume six). The resulting total number of articles was, conservatively, 10,710. Fortunately, in the case of Judge et al., their efforts facilitate later updates, because they provided a list of the studies and effect sizes used as input to their meta-analysis as supplemental data. However, historically, this has not been the case, meaning that future meta-analytic teams must start the literature search process from scratch. In short, the methods used by researchers to locate, summarize, and communicate scientific findings are far from efficient, even today. For non-academics, the location of relevant findings comes with additional entry barriers such as institutional paywalls.
The shortcomings of data inaccessibility were noticed long ago by medical researchers, who are already taking steps toward improvement. Indeed, large databases of re-search findings backed by standards-based protocols for extracting and classifying findings from journal articles and other sources are currently being amassed. When com-prehensive, such databases make the process of locating relevant research findings substantially less cumbersome (Lefebvre, Glanville, Wieland, Coles, & Weightman, 2013). The Systematic Review Data Repository (SRDR; Ip et al., 2012), as an example, provides a corpus of classified findings for use as input to meta-analysis. Drawing on such efforts, “living” systematic reviews are making possible the continual updating of meta-analytic inputs, a process cham-pioned as a vehicle for narrowing the evidence–practice gap (Elliott et al., 2014, p. 1). Similarly, psychologists are constructing platforms for improved research curation and communication, such as that seen in the recent communi-ty-augmented meta-analysis protocol (CAMA; Tsuji, Berg-mann, & Cristia, 2014). However, this latter approach has been met with limited adoption. Indeed, as of the authoring of this article, only three CAMAs are available, each on the topic of infant speech.
Thus, as a field, we must ask ourselves a serious ques-tion: Should we react with surprise that consumers of sci-ence are cynical regarding the difficulty in locating, access-ing, and understanding research, given that it typically takes researchers themselves years to accomplish such goals at any reasonable comprehensive level? We submit that their cynicism is inevitable. Yet, we contend that many coordi-nated efforts are currently underway, such as those noted, to drastically modernize and improve this dissatisfying state of affairs. However, we put the inaccessibility of research findings in a broader perspective: To our knowledge, no scientific area has curated its findings with the same level

62015 • Issue 1 • 3-17Published By ScholarWorks@BGSU, 2015
Personnel Assessment And decisions Welcome to metaBUS
of information-searching sophistication afforded everyday products in the online retail arena, where major profits drive the incentive to do so in this latter case. Importantly, tech-nology is no longer the bottleneck in improving the accessi-bility of our research findings.
Solution for Challenge #1: A Large-Scale Search Engine of Research Findings
Imagine that all available published findings (i.e., ef-fect sizes) pertaining to applied psychology were loaded into one massive cloud-based database to which a user could submit queries and instantaneously view results. For example, a user could search for and retrieve all reported correlations between job satisfaction and employee perfor-mance. Imagine further that the search engine would return an interactive spreadsheet of all relevant results, on which the user could apply specific filters (e.g., publication year range; country of origin; sample type; level of analysis) and manually select individual rows of data for exclusion. Finally, imagine that the selected results were then ported to cloud-based meta-analytic software that returns summary estimates in mere seconds. As will be demonstrated in a later section, the present beta version of the metaBUS plat-form already provides some of this functionality, and devel-opments are currently underway to expand its functionality.
The metaBUS project will unfold in stages to reach the eventual goal of a database containing all findings relevant to applied psychology and beyond. Fortunately, applied psychology is an ideal area for a large-scale curation effort, owing to the field’s routine provision of correlation matri-ces. Publications in economics, by comparison, tend to re-port only tables of regression weights (i.e., elasticities) that are less conducive to meta-analytic summary in general, especially when measures and models vary across studies (Stanley & Doucouliagos, 2012). Note that correlation ma-trices typically contain each variable analyzed in a given study and, thus, with p variables, there are p(p – 1)/2 unique correlations, often a large number. Indeed, early versions of the metaBUS database indicate a mean of 86 correlations per article (Bosco, Aguinis, Singh, Field, & Pierce, 2015).
In the first phase of the metaBUS project, correlations reported between 1980 and 2010 in two premier organiza-tional research journals, Journal of Applied Psychology and Personnel Psychology, were extracted and then manually augmented with variable-level information (see Bosco et al., 2015). The current version of the Bosco et al. database is freely available at http://www.frankbosco.com/data, and its most recent version contains 172,492 findings from 1,999 articles arrayed in a Microsoft Excel spreadsheet. It is this database version that serves as the basis for the beta interface described further in the present article (see http://www.metaBUS.org/portal). Notably, the metaBUS database now contains approximately 780,000 correlational effect
sizes from approximately 9,000 journal articles. To our knowledge, this represents the largest collection of curated research findings—in any scientific field—and the flexibil-ity with which users may query the database is currently unmatched. However, correlational effect sizes beyond the Bosco et al. (2015) database are currently undergoing incor-poration into a release version with additional functionality, to be available in the near future.
Challenge #2: The Tower of Babel
Academics and practitioners tend to have different goals and speak different languages, one contributing rea-son for the science–practice gap. Scientists tend to speak in terms of constructs, models, validity, and statistics. Prac-titioners, on the other hand, often speak in terms of gains, losses, and return on investment, and they understand and appreciate the necessary “quick fix and the ephemeral na-ture of… consultant interventions” (Gill & Whittle, 1993, p. 292). Although scientist speak and practitioner speak are highly adaptive for the important goals that each party pur-sues, these differing languages have also been said to yield a “language game… with differing forms of discourse” (Astley & Zammuto, 1992, p. 444) that often presents as a barrier to direct and mutually beneficial communication between the two groups. Unfortunately, no Esperanto or lingua franca exists that allows for an easy translation and understanding of the characteristic language and goals held by researchers and practitioners. As an example of the language gap, consider the term “engagement,” which the Society for Human Resource Management now includes in a database of key concepts. Although the concept is known widely among practitioners, its definition is less than clear. Indeed, whether engagement should be considered a psy-chological state, a psychological trait, or a behavior reflect-ed the first topic in the first issue of Industrial and Organi-zational Psychology: Perspectives on Science and Practice. In their focal article, Macey and Schneider (2008) wrote, “the notion of employee engagement is a relatively new one, one that has been heavily marketed by [HR] consulting firms… Academic researchers are now slowly joining the fray” (p. 3). From their perspective, buttressed by commen-taries, engagement is a consultant-driven construct that has migrated to practitioners and then sometimes to academics, with the latter uncertain as to what the term refers (Wefald & Downey, 2009).
There are concerns that marketing and fads, rather than solid evidence, may often be driving the adoption of constructs by researchers and practitioners alike. Some view this tendency as “fad surfing… riding the crest of the latest management panacea and then paddling out again just in time to ride the next one…absorbing for managers and lucrative for consultants; frequently disastrous for or-ganizations” (Shapiro, 1995, p. xiii). Likewise, others have

Personnel Assessment And decisions
72015 • Issue 1 • 3-17 http://scholarworks.bgsu.edu/pad/
InvIted ArtIcle
noted the “transitory nature of much managerial activity which seems to proceed from deep disillusionment with one panacea that has run its course to high enthusiasm for the next” (Gill & Whittle, 1993, p. 282). However, as Dunnette (1962) pointed out, academics are not guiltless of similar poor “marketing” practices that include construct prolifera-tion in the interest of self-promotion. Rebranding a product with a patina of new terminology can give the appearance of innovation; thus, it can be very effective marketing prac-tice for organizations, consultants, and academics alike. For example, as Wefald and Downey (2009) described it, the consultant’s term “job engagement” is often “synonymous” (p. 144) with the scientific term of “job satisfaction.”
It is hard to disabuse rebranding behavior when the cur-rent academic incentive structure offers something to gain and little to lose. Although the argument for scientific parsi-mony is compelling in the abstract, many view the flow of information from consultants to practice, or from research-ers to science, as more Darwinian, with successful efforts being more enduring and, in fact, less of a fad. Indeed, although it may seem that management by objectives (MBO) was a fad that has come and gone, elements of MBO, such as participatory goal setting as a departure from top-down control, remain widely used in organizations even if the terminology has shifted (Gibson & Tesone, 2001). Thus, as one possible interpretation, the waves of nonacademically derived ideas leave behind bits and pieces of effective prac-tice-related information. Over time, as effective elements are collected, the field progresses in spite of rebranding—and perhaps because of it in some cases.
Even with the benefits derived from advances in prac-tice and science, however, the scientist–practitioner gap remains. Kiesler et al. (2015) provided recommended solutions to several causes of the gap (e.g., terminology dif-ferences). As one recommended solution, academics could write nonfiction, practitioner-targeted books on their topics to help improve communication, but such activities are considered low-prestige by universities. Still, practitioners often turn to popular-press management books, yet they tend to be too practice oriented (i.e., not evidence based). Academic textbooks are often perceived as too research or theory oriented, and even students assigned these books will rarely complete them (Weisberg, 2011). Cohen (2007) captured this dilemma when he wrote that “if neither ‘side’ will publish the other’s articles and neither side fully under-stands the other’s perspective, how can we move forward with greater academic–practitioner interface that will ad-vance both practice and science?” (p. 1017). So, how can the information about what we study be communicated ef-fectively? Is it possible for the field of applied psychology to efficiently describe its universe of things?
Solution to Challenge #2: A Science Map for Applied Psychology
Maps are representations of complex spaces; they are useful to the extent that they summarize a large body of information in a manner that quickly and usefully facili-tates navigation and understanding (Börner et al., 2012). The usefulness of science maps (variously referred to as taxonomies and ontologies) is eloquently described by Börner, Chen, and Boyack (2003), who remind us of the Indian fable wherein blind men have trouble identifying an elephant because they are each feeling different parts of it. Identifying the shape and nature of a scientific discipline is even more challenging. Indeed, as described by Börner et al. (2003),
Science does not stand still; the steady stream of new scientific literature creates a continuously changing structure. The resulting disappearance, fusion, and emergence of research areas adds another twist to the tale—it is as if the elephant is running and dynamically changing its shape. (p. 180) Science mapping is highly valuable because it is able
to provide “big picture” views of a large corpus of informa-tion and, thereby, foster a better understanding of its overall nature (Novak & Cañas, 2008; Rada, Mili, Bicknell, & Blettner, 1989).
Approaches to science mapping vary in terms of their scope and content (Boyack, Klavans, & Börner, 2005). Global science maps attempt to represent all scientific disci-plines, providing a large-scale view of interrelationships be-tween fields, whereas local science maps provide a detailed view of a particular discipline or subdiscipline (e.g., Zupic & Čater, 2015). Science maps can extract meaning-based relations by analyzing the co-occurrence of references or keywords. The approach has been applied in related busi-ness literatures wherein article network visualizations rely on frequencies of reference, author, or keyword overlap (e.g., Leone, Robinson, Bragge, & Somervuori, 2012; Ma, Liang, Yu, & Le, 2012; Shafique, 2013).
The proliferation of construct labels is one serious barrier to mapping applied psychology at the level of con-structs and variables, even for academic audiences (Leavitt, Mitchell, & Peterson, 2010). Indeed, the theoretical land-scape of applied psychology has been overcomplicated by a stream of uniquely named constructs that might not be empirically distinguishable from one another, part of what Block (1996) labeled the “jingle-jangle” problem. As an example of lack of distinguishability, Le, Schmidt, Harter, & Lauver (2010) observed a near-unity relation (ρ = .91) between job satisfaction and organizational commitment, concluding that such empirical redundancies serve to inhibit scientific understanding by reducing parsimony. Similarly, the area of self-control and motivation is rife with concept confusion and redundancy (e.g., Duckworth & Kern, 2011; Vancouver & Day, 2005), and one recent large-scale inves-tigation has revealed that the overlap in semantic similarity

82015 • Issue 1 • 3-17Published By ScholarWorks@BGSU, 2015
Personnel Assessment And decisions Welcome to metaBUS
of scale items across constructs is surprisingly high, leading to what is termed a “construct identity fallacy” (Larsen & Bong, in press, p. 1). Analytic strategies for reducing construct proliferation in the leadership domain have been recently offered (e.g., Shaffer, DeGeest, & Li, in press), and these strategies are certainly generalizable to other domains.
We submit that one key engineering hurdle toward narrowing the scientist–practitioner divide lies in the need for developing a science map of applied psychology, which is akin to the decades-old notion of a nomological network that addresses conceptual relationships between constructs and variables to determine their alignment (or misalign-ment) with observed empirical relationships (Cronbach & Meehl, 1955). Such a science map would offer a foundation for empirical recommendations for pruning redundant con-structs or, at least, readily indicate a comprehensive suite of related terms and an understanding of the field at various levels of refinement. In a broad attempt to generate a field map of applied psychology content, Bosco et al. (2015) described their approach as arranging approximately 5,000 taxonomic nodes (i.e., constructs and variables) nested within categories of increasing specification. For instance, at the broadest level are categories such as attitudes, inten-tions, and behaviors. Expanding the behaviors node reveals categories representing major types of behaviors, such as performance (e.g., role performance, extra-role perfor-mance, training performance), counterproductive behaviors (e.g., self-defeating behaviors, deviance), and so on, to the narrowest degree of specificity appearing in academic liter-ature in the field, in some cases down to the specific mea-sure used. The metaBUS platform relies on the Bosco et al. (2015) taxonomy, which is currently undergoing a series of validation studies, an effort supported financially by the SHRM Foundation.
To summarize, metaBUS addresses the information overload found in varying parlances by arranging constructs and variables studied in an organized conceptual space. The resultant arrangement, as well as disagreements regarding arrangement, have clear implications for the advancement of science that, in turn, could offer increased parsimony and practitioner understanding.
Challenge #3: Interpreting Effect Size and Practical Sig-nificance
As a third challenge to narrowing the scientist–practi-tioner gap, practitioners are often not equipped to interpret research findings reported in applied psychology journals. Indeed, even our simplest statistics are, in practice, not of-ten translated into actionable terms. Consider the following example:
[A]ssume that a preemployment test is correlated with job performance at r = .30. How can a practitioner un-derstand the practical significance of a preemployment
test that explains .3 × .3 = 9% of the variance in future performance scores? Is this result practically signifi-cant? Should this practitioner recommend the use of the new preemployment test to prescreen job applicants in the future? Will using this preemployment test lead to better hiring decisions? How much better? (Aguinis et al., 2010, p. 529)From the quote, it is apparent that practical signifi-
cance can be expressed in many different ways to a vari-ety of stakeholders, and thus it is a multifaceted concept. Choosing the best expression for a finding is critical to any applied field, applied psychology and otherwise. Scientists who fail at communicating the main findings of research to practitioners in an accessible and useful manner are not meeting one of the most fundamental goals of an applied science.
In nearly all cases where scientific research is translat-ed into practice, the estimate of practical significance relies on an estimate of effect size (Ferguson, 2009) along with contextualizing information of some sort. For decades, the most frequently used contextualizing information has been Cohen’s (1988) benchmarks (e.g., about |r| = .1, .3, and .5 as small, medium, and large effects, respectively). Revised benchmarks, tailored for major bivariate relation types in applied psychology (e.g., attitude–intention vs. attitude–behavior) were recently made available (Bosco et al., 2015; Paterson, Harms, Steel, & Credé, in press). However, it is unlikely that any single set of empirical effect size bench-marks will handle all effect size interpretation needs; the interpretation of effect sizes is ultimately an evolving enter-prise, with refinements as the corpus of existing findings is expanded upon. The interpretation of everyday events, such as weather patterns, have similar contextualizing require-ments. Indeed, a daytime high of 106 degrees Fahrenheit would be an average July day for residents of Phoenix, Ar-izona, who are likely accustomed to such heat and consider the condition typical (however unpleasant it may be). How-ever, a July reading of 106 degrees Fahrenheit would be a newsworthy, all-time high for residents of Helsinki, Fin-land. Thus, interpretation routinely relies on consideration of factors known to impact outcomes of interest (in the case of temperature, one factor is latitude). If we aim to achieve efficient interpretation and communication of research find-ings (i.e., effect sizes), we must also identify these factors and interpret findings within such a framework.
Fern and Monroe (1996) urged researchers to take into consideration a variety of factors before interpreting the importance of findings in consumer research. The authors provided a veritable laundry list of such contextualizing factors, including measure reliability, range restriction, re-search design (i.e., experimental vs. nonexperimental), and the intended purpose of the study (i.e., application vs. the-ory testing). This strongly suggests that multiple types and/or benchmarks for practical significance might be necessary
Personnel Assessment And decisions
92015 • Issue 1 • 3-17 http://scholarworks.bgsu.edu/pad/
InvIted ArtIcle
to interpret the importance of findings in a compelling man-ner to different stakeholders. For example, if effect sizes in lab settings happened to be twice as large as those found in field settings (e.g., owing to rigorous control over sampling and the environment), then caveats would be required upon interpreting and generalizing the magnitude of effects from the lab to the field. The efficacy of multiple simultaneous effect size benchmarks has been explored in education research (Hill, Bloom, Black, & Lipsey, 2008; Plonsky & Oswald, 2014), revealing that interventions vary across student grade level and topic taught, for example. But the question remains: Regardless of the benchmarks used or the context applied, how can scientists translate findings into language that is easily understood by nonacademics? Ulti-mately, scientists need to devise ways to translate findings into digestible terms, such as percentages and estimates of return on investment. What might this component of the bridge actually look like?
Solution for Challenge #3: Provide a Common Lan-guage Effect Size Indicator
Critical to communicating effect sizes to inform prac-tice involves a mindset or perspective in which researchers are often not engaged. Simply put, when presented with evidence, researchers and practitioners alike need to ask a simple question, among others: “How much?” Indeed, not unlike the concerns brought by overreliance on p values and null hypothesis significance testing (Meehl, 1978), practitioners often rely on consultants’ statements indicat-ing that they “have established a conclusive, compelling relationship between engagement and profitability through higher productivity, sales, customer satisfaction, and em-ployee retention” (Macey & Schneider, 2008, p. 3). Howev-er, without information pertaining to the “how much” of the relationship, we know only the direction of the effect and, thus, little information overall.
To communicate practical significance to researchers and educated stakeholders alike, many have suggested that nontechnical representations of effect size be provided in publications alongside the traditional effect size estimate for pertinent findings (e.g., Fritz, Morris, & Richler, 2012). Essentially, the goal is to present an effect size “that is so readily understood by nonstatisticians that [it is called] the common language effect size indicator” (CLES; McGraw & Wong, 1992, p. 361, italics original). There are many ways to approach practical significance in the form of CLES. As an example provided by McGraw and Wong (1992), for a randomly selected male–female pair from the population, there is a 92% chance that the male is taller than the female (assuming a normal distribution of the data within groups). In this case, the CLES (92%) corresponds to a standard-ized mean difference of d = 2.00. The CLES has also been tailored to the correlation coefficient (Dunlap, 1994). As
a correlational example related to applied psychology, an uncorrected correlation of a given predictor with employ-ee performance of r = .28 corresponds to a CLES of 59%, meaning that 59% of individuals with a predictor score above the sample mean will also score above the mean on the job performance assessment. Thus, one may view this form of the CLES in terms of hits and misses or a specific cutoff on the receiver operator curve (ROC) from signal detection theory. Several other options for the effect size of choice exist (Kuncel & Rigdon, 2012), such as Cohen’s U3, which is the probability of a person from one group scoring higher than another group given a mean difference between the two groups (Cohen, 1977). Brooks, Dalal, and Nolan (2014) reported that such nontraditional effect sizes are more readily understood by consumers of science. Although promising, however, the choice of which common language effect size is best suited for use in applied settings remains an important topic for further investigation.
In the next section, we demonstrate the metaBUS plat-form. Importantly, metaBUS is not currently—nor might it ever be—a panacea for addressing the science–practice gap. Rather, the usefulness of the metaBUS platform relies on the assumptions that (a) scientific findings are applicable to applied situations and (b) increasing access to scientific findings will facilitate eventual application.
USING METABUS
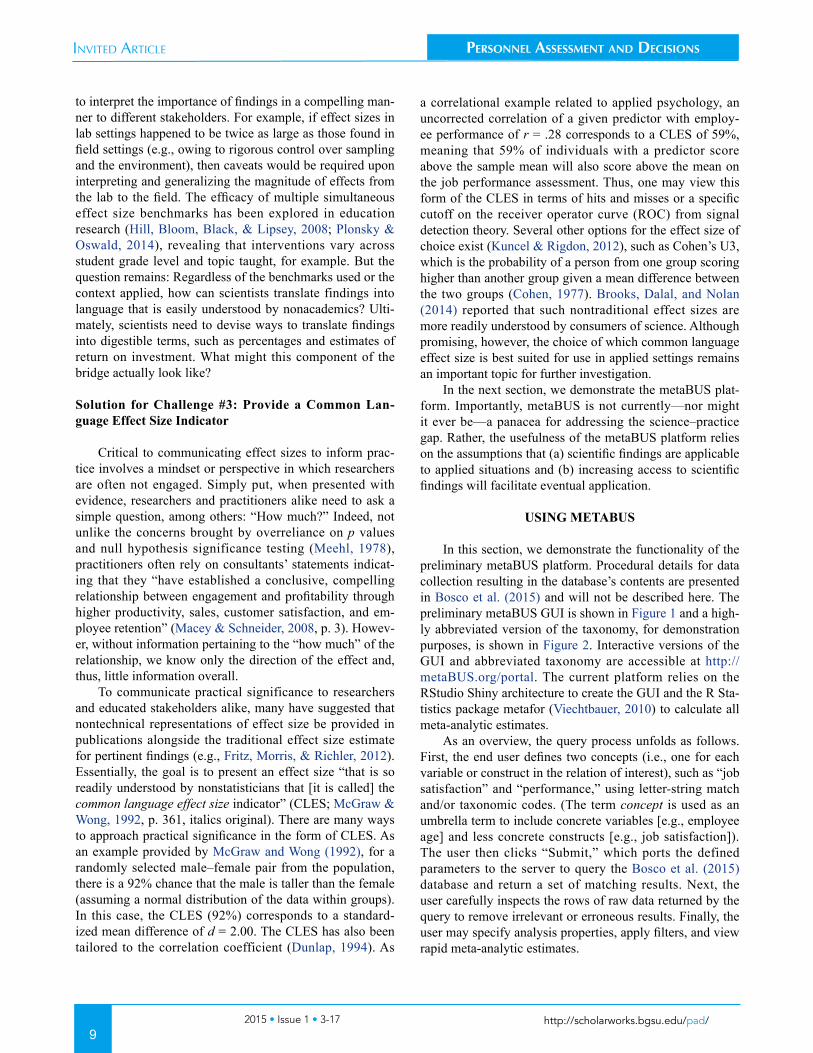
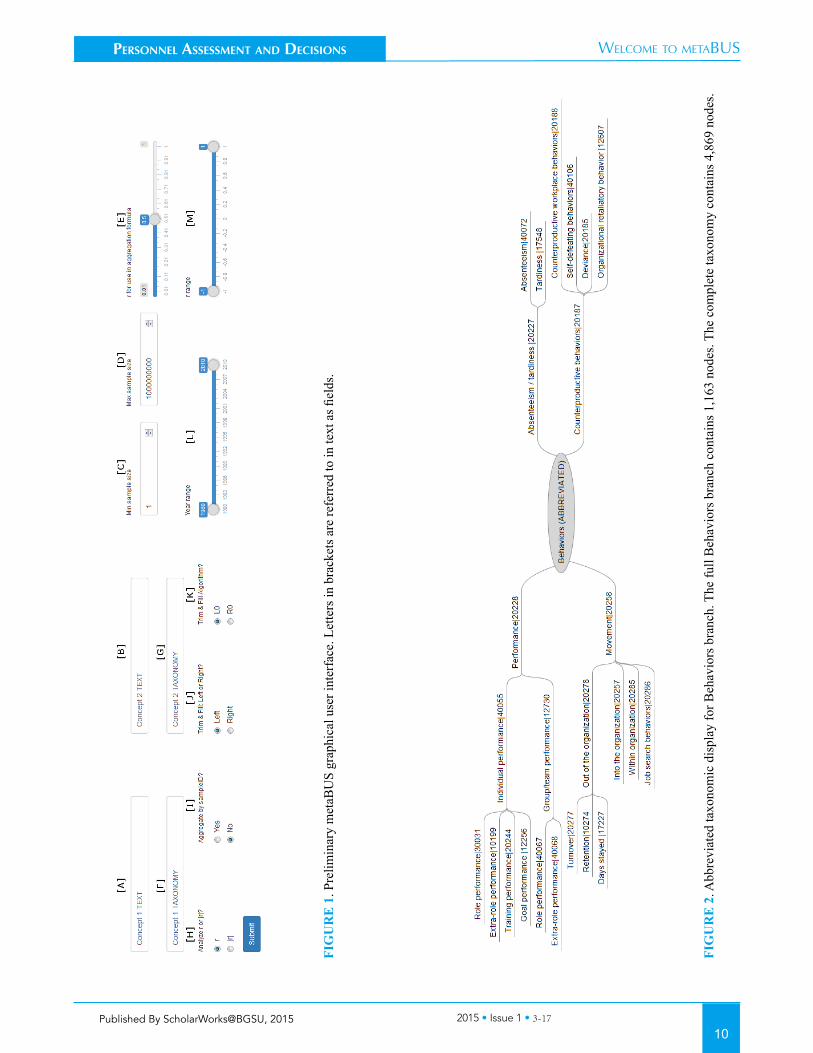
In this section, we demonstrate the functionality of the preliminary metaBUS platform. Procedural details for data collection resulting in the database’s contents are presented in Bosco et al. (2015) and will not be described here. The preliminary metaBUS GUI is shown in Figure 1 and a high-ly abbreviated version of the taxonomy, for demonstration purposes, is shown in Figure 2. Interactive versions of the GUI and abbreviated taxonomy are accessible at http://metaBUS.org/portal. The current platform relies on the RStudio Shiny architecture to create the GUI and the R Sta-tistics package metafor (Viechtbauer, 2010) to calculate all meta-analytic estimates.
As an overview, the query process unfolds as follows. First, the end user defines two concepts (i.e., one for each variable or construct in the relation of interest), such as “job satisfaction” and “performance,” using letter-string match and/or taxonomic codes. (The term concept is used as an umbrella term to include concrete variables [e.g., employee age] and less concrete constructs [e.g., job satisfaction]). The user then clicks “Submit,” which ports the defined parameters to the server to query the Bosco et al. (2015) database and return a set of matching results. Next, the user carefully inspects the rows of raw data returned by the query to remove irrelevant or erroneous results. Finally, the user may specify analysis properties, apply filters, and view rapid meta-analytic estimates.
102015 • Issue 1 • 3-17Published By ScholarWorks@BGSU, 2015
Personnel Assessment And decisions Welcome to metaBUS
FIG
UR
E 1
. Pre
limin
ary
met
aBU
S gr
aphi
cal u
ser i
nter
face
. Let
ters
in b
rack
ets a
re re
ferr
ed to
in te
xt a
s fiel
ds.
FIG
UR
E 2
. Abb
revi
ated
taxo
nom
ic d
ispl
ay fo
r Beh
avio
rs b
ranc
h. T
he fu
ll B
ehav
iors
bra
nch
cont
ains
1,1
63 n
odes
. The
com
plet
e ta
xono
my
cont
ains
4,8
69 n
odes
.

Personnel Assessment And decisions
112015 • Issue 1 • 3-17 http://scholarworks.bgsu.edu/pad/
InvIted ArtIcle
Importantly, note that the functionality demonstrated here represents an initial version of the metaBUS platform with a limited database (approximately one-fifth of the present database) and limited functionality (e.g., only a very limited set of the taxonomy and filter set). A more complete version, with a refined interface and user options, is under active development.
Navigating the GUI
The preliminary GUI is shown in Figure 1. Through the interface, the user may define to-be-searched text strings (fields A and B), which correspond to the reported variable name text appearing in the original article. The user may also define to-be-searched taxonomic nodes (fields F and G), representing the metaBUS classification for each variable during the coding process (see Figure 2 for an abbreviated view of the taxonomy). In addition, referring to Figure 1, the user may specify:
• whether to analyze r or |r| (field H)• whether to analyze independent or nonindependent effects (field I) and, if independent effects is chosen, the value representing dependence (field E)• parameters for the trim-and-fill analysis (fields J and K)• sample size minimum and maximum (fields C and D)• publication year range (field L), and• correlation range (field M)
Meta-Analytic Estimation
All meta-analytic calculations are carried out by a cloud-based server running R (www.r-project.org) and the R package metafor (version 1.9-8; Viechtbauer, 2010). Meta-analytic estimation for independent samples occurs as follows. First, if specified (see Figure 1, field I), raw correlations appearing in the lower panel are aggregated by sample into composite correlations using the MAc package (version 1.1; Del Re & Hoyt, 2015). The user may modify the correlation used for aggregation of dependent effect siz-es (default dependence is set at r = .50; see Figure 1, field E). Next, effects are converted from r to Fisher’s z and then submitted to random-effects, REML-based meta-analysis with weights as inverse variance of z’ (Viechtbauer, 2010). In addition, the GUI provides functionality for conducting trim-and-fill analyses (Duval & Tweedie, 2000) using the “trimfill” function in metafor with user options for whether to apply the R0 or L0 algorithm (Figure 1, field K) or to trim from the left or right of the distribution (Figure 1, field J). Alternative approaches for detecting publication bias ex-ist and are currently being incorporated into the metaBUS platform. Finally, summary estimates and individual effects are back transformed into r and displayed as tabular data and funnel plots (see Figure 3). The meta-analytic output
includes the number of samples, mean weighted effect esti-mate, standard error, 95% confidence interval, and I2.
After running a query, users may apply a variety of fil-ters to explore impact on resulting meta-analytic estimates. For example, one may explore temporal trends in effect size by adjusting the “Year range” slider (see Figure 1, field L). Similarly, one may explore robustness by applying filters for sample size (see Figure 1, fields C and D) or raw cor-relation value (Figure 1, field M).
Thus, the metaBUS platform provides a search engine of research findings and is able to rapidly meta-analyze search engine results. What is crucial, however, is that the search be carried out as completely as possible and with appropriate caution. Indeed, as described earlier, even the best search engines on the planet omit relevant results and include irrelevant results. Thus, queries on this initial, lim-ited version of the metaBUS platform should be treated as an exploratory starting point for arriving at summary es-timates. At a minimum, the metaBUS platform provides a tool with which meta-analysts may locate findings that were overlooked during the literature search process.
We turn now to demonstrating two examples of queries carried out using the metaBUS platform’s GUI.
Demonstration 1: Conducting Text-Based Queries
Using the online interface accessible at http://metaBUS.org/portal, conduct a rudimentary test string-based query by entering “satisfaction” in Field A and “performance” in Field B (see Figure 1). Then, click “Submit.” Assuming that no other parameters were selected, the query should return 395 nonindependent effects with mean r = .173. A table of meta-analytic estimates appears along with two funnel plots, one for raw data and one for trimmed-and-filled data; and the database contents appear in the lower portion of the interface (see Figure 3).
An inspection of the returned database contents (Figure 3, lower panel) reveals the variety of results that match the search strings specified. It is crucial that this set of results be inspected for irrelevant concepts. In fact, to be relatively certain, users should check the values against the original articles to address erroneous entries or entries irrelevant for other reasons (e.g., team-level data). In this example, as-suming that the present query was conducted with “overall job satisfaction” and “employee role performance” in mind, several returned entries are irrelevant (e.g., life satisfaction, firm performance). Indeed, the search conducted in this ex-ample matches letter strings. To eliminate these concepts, one may use negation terms in the text search fields. Ad-justing the text search areas to “satisfaction,-life,-need” and “performance,-firm,-HR” eliminates seven effect sizes for a total of 388 remaining effect sizes. Although the present es-timate (r = .17) reveals an estimate similar to Judge et al.’s (2001) r = .18, it is clear that many irrelevant results re-

122015 • Issue 1 • 3-17Published By ScholarWorks@BGSU, 2015
Personnel Assessment And decisions Welcome to metaBUS
FIG
UR
E 3
. Pre
limin
ary
met
aBU
S gr
aphi
cal u
ser i
nter
face
with
que
ry p
aram
eter
s and
resu
lts sh
own.

Personnel Assessment And decisions
132015 • Issue 1 • 3-17 http://scholarworks.bgsu.edu/pad/
InvIted ArtIcle
main in the analyzed set. One may continue to exclude text strings from each search (e.g., satisfaction,-life,-need,-au-tonomy,-career,-growth,-dissatisfaction). Or, as a compro-mise, one may string together increasingly narrow inclusion terms (e.g., “job performance,performance appraisal,overall performance,in-role performance” with “job satisfaction”).
Clearly, text string-based searches come with benefits and drawbacks. As one benefit, the text search reveals the variety of terms that include a particular text string. As a drawback, text string-based searches vary in effectiveness across topic. As an example, the construct of leader–mem-ber exchange is relatively easy to locate with the search string “exchange,LMX” which returns, perhaps, only a few irrelevant results. Note that text-based searches are exact and thus, a space following a comma is interpreted as “¬¬ LMX” rather than “LMX.” However, other constructs, such as employee performance, can go by literally hundreds of names. Thus, searching for the string “performance” will return false positives (e.g., firm performance) as well as omit true positives going by different names (e.g., sales vol-ume). As a remedy to this inevitable problem with construct labels, metaBUS includes a taxonomic classification-based search, which we demonstrate next.
Demonstration 2: Conducting Taxonomy-Based Queries
Let us now run the same query as in the previous demonstration (i.e., the relation between satisfaction and performance), but this time we will rely on taxonomic clas-sification identifiers rather than on letter strings. To this end, the user must specify node identifiers from the taxonomic map that correspond to the relationship of interest. The map contains unique identifiers in the form of five-digit strings that have no inherent meaning. The process of taxonomy development and classification is described in Bosco et al. (2015). A collapsed version of the taxonomy segment con-taining behaviors is shown in Figure 2, and the interactive, abbreviated segment is available at http://metaBUS.org/por-tal. Importantly, taxonomic queries function hierarchically. For example, considering the taxonomy segment shown in Figure 2, the specification of “40055” (i.e., individual per-formance) will include all variables classified by coders as “40055” as well as all variables classified as descendants of 40055 (i.e., 30031, 10199, 20244, and 12256). Note that, just as with the text search described in Demonstration 1, the user may input strings of taxonomy nodes delimited by commas without spaces (e.g., 30031,10199,20244) and also specify exclusions by using the “-” symbol (e.g., 40055,-12256,-20244).
To conduct the taxonomy-based search, first refresh the GUI (i.e., clear all existing input). Next, enter “20072,” the node corresponding to job satisfaction, in Field F (see Fig-ure 1). Enter “30031,” the node corresponding to individual role performance, in Field G. Finally, click “Submit.” This
time, the query returns 212 nonindependent effect sizes with mean r = .166 (or 84 independent effect sizes with mean r = .183).
Just as is the case with text-based searches, users must take care to inspect each row of data to ensure that the anal-ysis is actually analyzing relevant input. Erroneous entries by metaBUS coders, or differing mindsets with regard to how the taxonomy should be classified, can result in errors of inclusion or exclusion and, thus, biased or otherwise contaminated meta-analytic estimates. As pointed out earli-er, it is essential that users acknowledge that the metaBUS platform is primarily a search engine. The platform is not designed for the use case of arriving at an instant meta-ana-lytic estimate whose comprehensiveness and certainty is on par with that of a thorough systematic review. Put different-ly, the platform does not currently deliver a meta-analytic utopia. Indeed, given the variety of potential moderators, the vast “grey literature” containing potential meta-analytic inclusion candidates, such a meta-analytic utopia might be impossible to deliver. However, we hope that metaBUS be-comes an essential tool for better understanding the science we already have produced and to do so more quickly in the era of the Internet.
DISCUSSION
The common academic pedagogy of lecturing has been criticized as being a needless adherence to a centuries-old style of teaching. Lecturing made perfect sense during the 15th century when there was only a single textbook acces-sible to many, and to disseminate its contents, a lecturer would read it to the students, often verbatim. For decades, critics of this method have argued that lecture methods have remained largely unchanged; they are passive and uni-directional. The student has little control over the content, and they must rely on whatever updates that textbooks and instructors might sporadically provide. Lecturing is humor-ously described by Edward Slosson as “that mysterious process by means of which the contents of the note-book of the professor are transferred through the instrument of the fountain pen to the note-book of the student without passing through the mind of either” (Miller, 1927).
These same criticisms can be levelled at the process of meta-analysis and the dissemination of its knowledge. Indeed, the consumer often receives this information pas-sively, only in the way the meta-analyst presents the in-formation, being unable to change or refine the foci of the content. The same could be said for articles in the bound journal article, where technology combined with open ac-cess principles could better allow readers to understand and even interact with the data and findings of articles. A pub-lished meta-analysis contains results that are frozen until it is updated, usually some 5, 10, or more years later, and the more meta-analyses that are published, the more jour-

142015 • Issue 1 • 3-17Published By ScholarWorks@BGSU, 2015
Personnel Assessment And decisions Welcome to metaBUS
nal space might be dedicated to incremental updates. This updating mechanism appears less than ideal in the field of medicine, wherein meta-analyses contain conclusions with a median survival time of 5.5 years (95% CI = 4.6, 7.6) and an approximate survival of only 25% by after 8.5 years (Shojania et al., 2007).
Currently, applied psychology finds itself in a state of information overload. Indeed, Internet retailers apply far more sophisticated organization and consumer access to information about inflatable mattresses and CrockPots®. We recommend architectures that provide access to scien-tific research findings and associated study characteristics that are as useful to researchers, practitioners, and other stakeholders. Highly adept and usable interfaces can help us quickly navigate and explore the array of available con-structs and options, including the provision of predictive input that is intelligently based on past searches. Perhaps users can eventually customize the search interface and the output to their liking. Similarly, the statistical basis for sum-marizing research findings can be customized to a user’s preference and also updated as refinements in meta-analysis and other analytic techniques are brought forth. Indeed, fu-ture research papers might be incredibly interactive, where the main text is relatively fixed in place, and the findings and conclusions are free to vary to accommodate newly accumulated evidence. Generalizability and theoretical refinements can then be addressed almost as quickly as the studies themselves are published.
Critically, as is worth repeating, it is important that users acknowledge that the metaBUS platform is primar-ily a search engine—a supplement and not a replacement for conducting a thorough systematic review. Indeed, until every single relevant research finding for any intended query is curated accurately (unlikely to occur, especially given that some findings are not obtainable), the set of returned results will always be a subsample of the popula-tion of studies, calling for the application of elbow grease to extend and refine the data yielded from the metaBUS platform. Even experts can disagree on whether any set of empirical results reflect an accurate depiction of the entire population or a target population of interest. This is a fun-damental challenge for investigators and for science itself, often discussed as the problem of induction (Steel, Kam-meyer-Mueller, & Paterson, 2015). In other words, the pur-pose of a search engine is to conduct queries on a corpus of information to return a narrowed set of potentially relevant results that inspire additional reflection, refinement, and searching. Indeed, even the best search engines on earth (e.g., Google) return irrelevant results and omit relevant ones. The search output will always be limited by the scope and quality of the input, and the care taken by users to run appropriate search queries.
Future Research Directions
At present, we have three challenges before us, and these are the same three we have already addressed here. To enable a search engine of science, we first need to continue improving the field-level taxonomy, which will necessarily shift as the metaBUS project explores adjacent scientific fields. For instance, the marketing and strategic manage-ment fields have their own terminology and inevitably suffer from the same jingle-jangle problem as we find in I-O psychology. Although adjacent fields will benefit from overlapping content, coding the content to discover and define this overlap in a systematic manner is hardly a small endeavor.
Second, articles from adjacent fields need to be curated through an intensive effort of coding the massive backlog of studies. Ideally, the relevant effect sizes and associated data for coding would be curated back to each journal’s first article, perhaps as far back as the first article of the Philo-sophical Journal of the Royal Society, or to articles follow-ing Galton’s or Pearson’s genesis of the correlation coeffi-cient. A decision point might be to first go “wide,” back 20 years across most journals; then to go “siloed” in capturing effects comprehensively within specific domains of impor-tance; then to go “deep” into all years across journals of importance. This effort could further incorporate the “grey literature” of unpublished theses and conference papers, articles from every written language, and hard-to-code re-sults, such as those needing transformation to a correlation metric (e.g., t statistics) or psychometric adjustments (e.g., for direct or incidental range restriction). Further, content could be coded in greater depth, considering possible mod-erators that extend beyond easiest-to-code ones, such as the exact version of an assessment or test used, of which there are often minor adjustments or slight refinements to note as well (e.g., length of scale, anchor points), or whether the research received grant funding (e.g., Field et al., 2015). After all of this, redundant coding to eliminate coding er-rors would be extremely beneficial, whether through double coding, crowdsourcing, or some other means.
Third, the current metaBUS effort is solely focused on correlational effect size as the target effect size. One might eventually intend to expand to include effects more natural-ly expressed as d values (e.g., from experimental designs) or other common standardized effect sizes, allowing the creation of benchmarks and baselines as we have done for correlations (Bosco et al., 2015). It will be possible then to create rough norms on demand within a domain, which could be refined by demographics, time span, and other characteristics to determine whether or not these charac-teristics make an empirical difference. The expansion to experimental effect sizes will be somewhat daunting given the need to develop coding guides and templates for the dif-ferent ranges of interventions and treatments, field by field (Wilson, 2009). However, the benefit from coding experi-

Personnel Assessment And decisions
152015 • Issue 1 • 3-17 http://scholarworks.bgsu.edu/pad/
InvIted ArtIcle
ments would be similar to that from correlational studies: an immense yield of knowledge created from being able to compare instantly across multiple different conditions or treatments that have already been examined. Also, the inclusion of regression analyses, which economics almost exclusively adopts, can also be accommodated (Stanley & Doucouliagos, 2012) but would require exceedingly expert coders and an incredibly large database. Note that there seems to be far less consistency across economic journals regarding how basic information, including sample size or degrees of freedom, is reported, let alone in the ability to locate studies that involve the same regression models.
Still, none of these future challenges are insur-mountable. As metaBUS expands into adjacent fields, its taxonomic development will benefit from theoretical frameworks commonly adopted across studies (e.g., per-sonality models of individual differences); yet as mentioned previously, the metaBUS taxonomy can also help reduce unnecessary redundancies in its development. The coding of articles is primarily hindered by the immense backlog of uncoded work. Looking to the future, once coding has caught up with the present, it would be immensely helpful if journal editors were to consider the requirement that to-be-published findings be included in the metaBUS database as a standardized part of the publishing process; standard-ized journal reporting might even lead to automatically populating the database.
CONCLUSION
Within approximately 5 years, the metaBUS team has developed protocols for curating applied psychology and related fields. The database has grown to become, to our knowledge, the largest collection of curated scientific find-ings (i.e., effect sizes, not raw data) in any scientific field. The end user of metaBUS, whether practitioner or academ-ic, can obtain instant, up-to-date, and customized access to effect size information to meet any specific interest. For instance, one may compare their own situation, empirically and/or conceptually, to the past body of research located through metaBUS to gain rich insights that enhance under-standing, decision making, and prediction. Perhaps most in-triguing, metaBUS facilitates the science of science. It will be especially intriguing to see how others use the database, particularly in the realm of investigating the shape of our overall nomological network.
Put simply, organizational researchers are still using the scientific equivalent of the Farmer’s Almanac during the Internet age. It is time we caught up.
REFERENCES
Aguinis, H., Werner, S., Lanza Abbott, J., Angert, C., Park, J. H., & Kohlhausen, D. (2010). Customer-
centric science: Reporting significant research results with rigor, relevance, and practical impact in mind. Organizational Research Methods, 13, 515-539. doi: 10.1177/1094428109333339
Allen, T. D. (2015). Connections past and present: Bringing our scientific influence into focus. The Industrial-Organizational Psychologist, 52(3), 123-133.
Astley, W. G., & Zammuto, R. F. (1992). Organization science, managers, and language games. Organization Science, 3, 443-460. doi: doi:10.1287/orsc.3.4.443
Block, J. (1996). Some jangly remarks on Baumeister and Heatherton. Psychological Inquiry, 7, 28-32. doi: 10.1207/s15327965pli0701_5
Börner, K., Chen, C., & Boyack, K. W. (2003). Visualizing knowledge domains. Annual Review of Information Science and Technology, 37, 179-255. doi: 10.1002/aris.1440370106
Börner, K., Klavans, R., Patek, M., Zoss, A. M., Biberstine, J. R., Light, R. P., Larivière, V., & Boyack, K. W. (2012). Design and update of a classification system: The UCSD map of science. PLoS ONE, 7, e39464. doi: 10.1371/journal.pone.0039464
Bornmann, L., & Mutz, R. (2015). Growth rates of modern science: A bibliometric analysis based on the number of publications and cited references. Journal of the Association for Information Science and Technology, 66, 2215-2222. doi: 10.1002/asi.23329
Bosco, F. A., Aguinis, H., Singh, K., Field, J. G., & Pierce, C. A. (2015). Correlational effect size benchmarks. Journal of Applied Psychology, 100, 431-449. doi: 10.1037/a0038047
Boyack, K. W., Klavans, R., & Börner, K. (2005). Mapping the backbone of science. Scientometrics, 64, 351-374. doi: 10.1007/s11192-005-0255-6
Brooks, M. E., Dalal, D. K., & Nolan, K. P. (2014). Are common language effect sizes easier to understand than traditional effect sizes?. Journal of Applied Psychology, 99, 332-340.
Cohen, D. J. (2007). The very separate worlds of academic and practitioner publications in human resource management: Reasons for the divide and concrete solutions for bridging the gap. Academy of Management Journal, 50, 1013-1019. doi: 10.5465/amj.2007.27151946
Cohen, J. (1977). Statistical power analysis for the behavioral sciences. New York, NY: Academic Press.
Cohen, J. (1988). Statistical power analysis for the behavioral sciences (2nd ed.). Hillsdale, NJ: Erlbaum.
Cronbach, L. J., & Meehl, P. E. (1955). Construct validity in psychological tests. Psychological Bulletin, 52, 281-302. doi: 10.1037/h0040957
Del Re, A. C., & Hoyt, W. T. (2015). MAc: Meta-analysis with correlations (R package version 1.1). Retrieved from https://cran.r-project.org/web/packages/MAc/MAc.pdf
Donham, W. B. (1922). Essential groundwork for a broad executive theory. Harvard Business Review, 1, 1-10.
Duckworth, A. L., & Kern, M. L. (2011). A meta-analysis of the convergent validity of self-control measures. Journal of Research in Personality, 45, 259-268. doi: 10.1016/

162015 • Issue 1 • 3-17Published By ScholarWorks@BGSU, 2015
Personnel Assessment And decisions Welcome to metaBUS
j.jrp.2011.02.004Dunlap, W. P. (1994) . Genera l i z ing the common
language effect size indicator to bivariate normal correlations. Psychological Bulletin, 116, 509-511. doi: 10.1037/0033-2909.116.3.509
Dunnette, M. D. (1962). Personnel management. Annual Review of Psychology, 13, 285-314.
Duval, S., & Tweedie, R. (2000). Trim and fill: A simple funnel-plot–based method of testing and adjusting for publication bias in meta-analysis. Biometrics, 56, 455-463. doi: 10.1111/j.0006-341X.2000.00455.x
Elliott, J. H., Turner, T., Clavisi, O., Thomas, J., Higgins, J. P. T., Mavergames, C., & Gruen, R. L. (2014). Living systematic reviews: An emerging opportunity to narrow the evidence-practice gap. PLoS Med, 11, e1001603. doi: 10.1371/journal.pmed.1001603
Ferguson, C. J. (2009). An effect size primer: A guide for clinicians and researchers. Professional Psychology: Research and Practice, 40, 532-538. doi: 10.1037/a0015808
Fern, E. F., & Monroe, K. B. (1996). Effect-size estimates: Issues and problems in interpretation. Journal of Consumer Research, 23, 89-105.
Field, J. G., Mihm, D., O’Boyle, E. H., Bosco, F. A., Uggerslev, K., & Steel, P. (2015). An examination of the funding-finding relation in the field of management. Academy of Management Proceedings, 2015, 17463. doi: 10.5465/AMBPP.2015.17463abstract
Fritz, C. O., Morris, P. E., & Richler, J. J. (2012). Effect size estimates: Current use, calculations, and interpretation. Journal of Experimental Psychology: General, 141, 2-18. doi: 10.1037/a0024338
Gibson, J. W., & Tesone, D. V. (2001). Management fads: Emergence, evolution, and implications for managers. The Academy of Management Executive, 15, 122-133. doi: 10.5465/ame.2001.5898744
Gill, J., & Whittle, S. (1993). Management by panacea: Accounting for transience. Journal of Management Studies, 30, 281-295. doi: 10.1111/j.1467-6486.1993.tb00305.x
Hambrick, D. C. (1994). What if the Academy actually mattered? Academy of Management Review, 19, 11-16. doi: 10.5465/amr.1994.9410122006
Hanson, B., Sugden, A., & Alberts, B. (2011). Making data maximally available. Science, 331, 649. doi: 10.1126/science.1203354
Hill, C. J., Bloom, H. S., Black, A. R., & Lipsey, M. W. (2008). Empirical benchmarks for interpreting effect sizes in research. Child Development Perspectives, 2, 172-177. doi: 10.1111/j.1750-8606.2008.00061.x
Ip, S., Hadar, N., Keefe, S., Parkin, C., Iovin, R., Balk, E. M., & Lau, J. (2012). A web-based archive of systematic review data. Systematic Reviews, 1, 15-22. doi: 10.1186/2046-4053-1-15
Judge, T. A., Thoresen, C. J., Bono, J. E., & Patton, G. K. (2001). The job satisfaction–job performance re la t ionsh ip : A qua l i t a t i ve and quant i t a t i ve review. Psychological Bulletin, 127, 376-407. doi: 10.1037/0033-2909.127.3.376
Kieser, A., & Leiner, L. (2009). Why the rigour–relevance gap in management research is unbridgeable. Journal of Management Studies, 46, 516-533. doi: 10.1111/j.1467-6486.2009.00831.x
Kieser, A., Nicolai, A., & Seidl, D. (2015). The practical relevance of management research: Turning the debate on relevance into a rigorous scientific research program. The Academy of Management Annals, 9, 143-233. doi: 10.1080/19416520.2015.1011853
Kuncel, N. R., & Rigdon, J. (2012). Communicating research findings. In N. Schmitt & S. Highhouse (Eds.), Handbook of psychology, 12: Industrial and organizational psychology (pp. 43-58.). New York, NY: Wiley.
Larsen, K., & Bong, C. H. (in press). A tool for addressing construct identity in literature reviews and meta-analyses. MIS Quarterly.
Le, H., Schmidt, F. L., Harter, J. K., & Lauver, K. J. (2010). The problem of empirical redundancy of constructs in organizational research: An empirical investigation. Organizational Behavior and Human Decision Processes, 112, 112-125. doi: 10.1016/j.obhdp.2010.02.003
Leavitt, K., Mitchell, T. R., & Peterson, J. (2010). Theory pruning: Strategies to reduce our dense theoretical landscape. Organizational Research Methods, 13, 644-667. doi: 10.1177/1094428109345156
Lefebvre, C., Glanville, J., Wieland, L., Coles, B., & Weightman, A. (2013). Methodological developments in searching for studies for systematic reviews: Past, present and future? Systematic Reviews, 2, 78-87. doi: 10.1186/2046-4053-2-78
Leone, R. P., Robinson, L. M., Bragge, J., & Somervuori, O. (2012). A citat ion and profi l ing analysis of pricing research from 1980 to 2010. Journal of Business Research, 65, 1010-1024. doi: 10.1016/j.jbusres.2011.04.007
Ma, Z., Liang, D., Yu, K.-H., & Lee, Y. (2012). Most cited business ethics publications: Mapping the intellectual structure of business ethics studies in 2001–2008. Business Ethics: A European Review, 21, 286-297. doi: 10.1111/j.1467-8608.2012.01652.x
Macey, W. H., & Schneider, B. (2008). The meaning of employee engagement. Industrial and Organizational P s y c h o l o g y, 1 , 3 - 3 0 . d o i : 1 0 . 1 1 1 1 / j . 1 7 5 4 -9434.2007.0002.x
McGraw, K. O., & Wong, S. P. (1992). A common language effect size statistic. Psychological Bulletin, 111, 361-365. doi: 10.1037/0033-2909.111.2.361
Meehl, P. E. (1978). Theoretical risks and tabular asterisks: Sir Karl, Sir Ronald, and the slow progress of soft psychology. Journal of Consulting and Clinical Psychology, 46 , 806-834. doi : 10.1037/0022-006x.46.4.806
Miller, H. L. (1927). Creative learning and teaching. New York, NY: C. Scribner’s Sons.
Novak, J. D., & Cañas, A. J. (2008). The theory underlying concept maps and how to construct and use them. Technical report IHMC CmapTools, Florida Institute for

Personnel Assessment And decisions
172015 • Issue 1 • 3-17 http://scholarworks.bgsu.edu/pad/
InvIted ArtIcle
Human and Machine Cognition, Pensacola, FL.Paterson, T. A., Harms, P. D., Steel, P., & Credé, M. (in
press). An assessment of the magnitude of effect sizes: Evidence from 30 years of meta-analysis in management. Journal of Leadership & Organizational Studies. doi: 10.1177/1548051815614321
Plonsky, L., & Oswald, F. L. (2014). How big is “big”? Interpreting effect sizes in L2 research. Language Learning, 64, 878-912. doi: 10.1111/lang.12079
Rada, R., Mili, H., Bicknell, E., & Blettner, M. (1989). Development and application of a metric on semantic nets. IEEE Transact ions on Systems, Man and Cybernetics, 19, 17-30. doi: 10.1109/21.24528
Rousseau, D. M., & McCarthy, S. (2007). Educating managers from an evidence-based perspective. Academy of Management Learning & Education, 6, 84-101. doi: 10.5465/amle.2007.24401705
Rynes, S. L., Bartunek, J. M., & Daft, R. L. (2001). Across the great divide: Knowledge creation and transfer between practitioners and academics. Academy of Management Journal, 44, 340-355. doi: 10.2307/3069460
Rynes, S. L., Giluk, T. L., & Brown, K. G. (2007). The very separate worlds of academic and practitioner per iodica ls in human resource management : Implications for evidence-based management. Academy of Management Journal, 50, 987-1008. doi: 10.5465/amj.2007.27151939
Shaffer, J. A., DeGeest, D., & Li, A. (in press). Tackling the problem of construct proliferation: A guide to assessing the discriminant validity of conceptually related constructs. Organizational Research Methods. doi: 10.1177/1094428115598239
Shafique, M. (2013). Thinking inside the box? Intellectual structure of the knowledge base of innovation research (1988–2008). Strategic Management Journal, 34, 62-93. doi: 10.1002/smj.2002
Shapiro, D. L., Kirkman, B. L., & Courtney, H. G. (2007). Perceived causes and solutions of the translation problem in management research. Academy of Management Journal, 50, 249-266. doi: 10.5465/amj.2007.24634433
Shapiro, E. C. (1995). Fad surfing in the boardroom: Reclaiming the courage to manage in the age of instant answers. Cambridge, MA: Perseus Publishing.
Shojania, K. G., Sampson, M., Ansari, M. T., Ji, J., Doucette, S., & Moher, D. (2007). How quickly do systematic reviews go out of date? A survival analysis. Annals of Internal Medicine, 147, 224-233. doi: 10.7326/0003-4819-147-4-200708210-00179
Stanley, T. D., & Doucouliagos, H. (2012). Meta-regression analysis in economics and business (Vol. 5). New York, NY: Routledge.
Steel, P., Kammeyer-Mueller, J., & Paterson, T. A. (2015). Improving the meta-analytic assessment of effect size variance with an informed Bayesian prior. Journal of Management, 41, 718-743. doi: 10.1177/0149206314551964
Tsuji, S., Bergmann, C., & Cristia, A. (2014). Community-augmented meta-analyses: Toward cumulative data
assessment. Perspectives on Psychological Science, 9, 661-665. doi: 10.1177/1745691614552498
Tyron, R. C. (1963). Psychology in flux: The academic-professional bipolarity. American Psychologist, 18, 134-143. doi: 10.1037/h0046989
Vancouver, J. B., & Day, D. V. (2005). Industrial and organisation research on self-regulation: From constructs to applications. Applied Psychology, 54, 155-185. doi: 10.1111/j.1464-0597.2005.00202.x
Viechtbauer, W. (2010). Conducting meta-analyses in R with the metafor package. Journal of Statistical Software, 36, 1-48. doi: 10.18637/jss.v036.i03
Wefald, A. J., & Downey, R. G. (2009). Job engagement in organizations: Fad, fashion, or folderol? Journal of Organizational Behavior, 30, 141-145. doi: 10.1002/job.560
Weisberg, M. (2011). Student attitudes and behaviors towards digital textbooks. Publishing Research Quarterly, 27, 188-196. doi: 10.1007/s12109-011-9217-4
Wilson, D. B. (2009). Systematic coding. In H. Cooper, L. V. Hedges & J. C. Valentine (Eds.), The handbook of research synthesis and meta-analysis (2nd ed., pp. 159-176). New York, NY: Russell Sage Foundation.
Zupic, I., & Čater, T. (2015). Bibliometric methods in management and organization. Organizational Research Methods, 18, 429-472.
RECEIVED 11/18/15 ACCEPTED 11/19/15